the Creative Commons Attribution 4.0 License.
the Creative Commons Attribution 4.0 License.
 | 17 Nov 2026
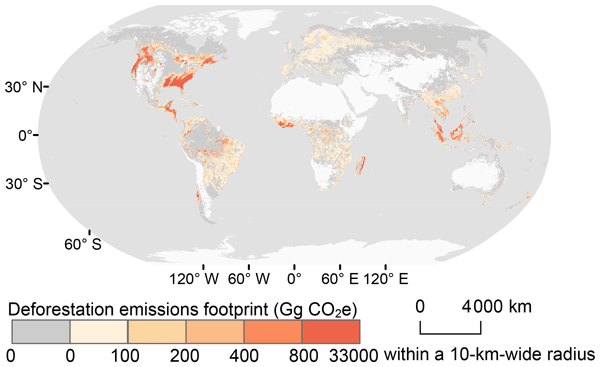
Global consumption-based deforestation carbon emissions and regional hotspots: 2001–2020
Dongmei Tang

Rui Li
The consumption-based carbon emissions dataset for deforestation provides an important perspective for developing effective emission mitigation policies. However, existing datasets are largely limited to national-scale and lack spatially explicit, high-resolution data at the global level. Here, we present a global, gridded dataset of consumption-based deforestation carbon emissions at 1 km resolution for 2001–2020. The dataset integrates spatial information on road networks, deforestation, and forest carbon fluxes with country-level global trade statistics. Our dataset shows that trade-related deforestation emissions amount to 39.6 Gt CO2e, constituting 31.8 % of global deforestation emissions. This new dataset fills a critical gap in spatially explicit consumption-based deforestation emissions data, and supports the development of targeted mitigation strategies from the consumer perspective. It also provides a valuable input for climate and carbon cycle models to assess the contribution of consumption-driven deforestation to global warming. Datasets are available at https://doi.org/10.6084/m9.figshare.28091879 (Tang et al., 2024).
- Article
(7062 KB) - Full-text XML
- BibTeX
- EndNote


Forests represent one of the most important terrestrial carbon sinks and play a critical role in global climate change mitigation due to their high carbon sequestration potential (Cook-Patton et al., 2020). Although the annual rate of net forest loss declined from 10.7 million ha in 1990–2000 to 4.12 million ha in 2015–2025, deforestation remains a major environmental concern, with an estimated annual deforestation rate of 10.9 million ha during 2015–2025 (Fao, 2025). Deforestation contributes substantially to global carbon emissions, which remained at approximately 1.9 Gt C yr−1 during the period from 2013–2022, accounting for about 17 % of total anthropogenic emissions (Friedlingstein et al., 2023). A recent FAO assessment also estimated emissions associated with net forest loss at 2.8–3.8 Gt CO2 yr−1 during 2015–2025 (Tubiello et al., 2026). Therefore, effectively managing deforestation holds significant potential for mitigating global carbon emissions.
International trade remains a primary driver of deforestation, particularly through the expansion of commercial agriculture (Pendrill et al., 2019b, a). Large-scale production of commercial agricultural commodities, including livestock, oil palm, rubber, and cash crops, accounts for approximately 40 % of tropical deforestation (Wang et al., 2023; Souza Jr., 2023). Previous studies have indicated that 29 %–39 % of deforestation-related emissions are embodied in international trade (Pendrill et al., 2019b). Although trade promotes global prosperity, it also creates a spatial disconnection between locations of production and final consumption (Wiedmann and Lenzen, 2018). This disconnection complicates accountability and has led to increasing recognition that mitigating deforestation emissions requires a consumption-based perspective and policy interventions targeting international supply chains (Pendrill et al., 2019b; Lambin et al., 2018). The concept of consumption-based deforestation emissions, often referred to as the deforestation emissions footprint, captures the carbon emissions from deforestation that are attributable to the final consumption of specific countries.
Despite its importance, mapping consumption-based deforestation emissions at sub-national or fine spatial scales remains technically challenging. Most existing studies quantify deforestation footprints at the national level or focus on a limited number of countries, thereby neglecting substantial spatial heterogeneity within producing regions (Pendrill et al., 2019b, a). This hampers the accurate calculation of trade and consumption footprints, masking and distorting the causal links between consumers' choices and their environmental impacts, especially in countries with significant spatial variability in carbon storage conditions (Moran et al., 2020). To address this limitation, some studies have proposed spatially explicit input-output models (SMRIO) that use geospatial data for finer-resolution footprint mapping (Hoang and Kanemoto, 2021; Kanemoto et al., 2016). However, existing SMRIO applications typically assume proportional relationships between production and consumption within countries and do not explicitly account for the possibility that exports originate from specific sub-national regions. As a result, these approaches remain limited in their ability to capture spatial heterogeneity in consumption-driven deforestation emissions and to support geographically targeted mitigation strategies.
To address these gaps, we developed a global, high-resolution dataset of consumption-based deforestation carbon emissions by improving existing SMRIO method through pixel-level analysis. By utilizing satellite-based deforestation observations with economic input-output data, we generate annual global maps of deforestation emissions footprints at a spatial resolution of approximately 1 km for the period 2001–2020. The dataset enables the identification of spatial hotspots of consumption-driven deforestation and provides a consistent framework for attributing deforestation emissions to final consumers while retaining the original locations of deforestation. To our knowledge, this is the first global consumption-based deforestation emissions at the pixel-level. The dataset is intended to support improved accountability for deforestation emissions, inform supply-chain governance, and facilitate the development of more spatially targeted policies to reduce emissions from deforestation.
In this study, we developed a global, annual, gridded dataset of consumption-based deforestation carbon emissions at a spatial resolution of approximately 1 km for the period 2001–2020, covering 187 countries and regions (Tang et al., 2024). The SMRIO framework consists of three major steps: (1) national-level consumption-based deforestation emissions accounting based on MRIO analysis; (2) spatial disaggregation of these footprints to grid cells using export-priority criteria; and (3) spatial plausibility assessment of the resulting gridded dataset using accessibility-based criteria and comparisons with conventional allocation approaches. The key innovation lies in incorporating export-priority zones into the spatial disaggregation procedure, using deforestation patch size and road density to identify locations where deforestation is more likely to be associated with export-oriented production. The resulting gridded dataset represents the amount of deforestation emissions in each grid cell driven by the final consumption of a specific country. An overview of the data processing workflow is shown in Fig. 1.
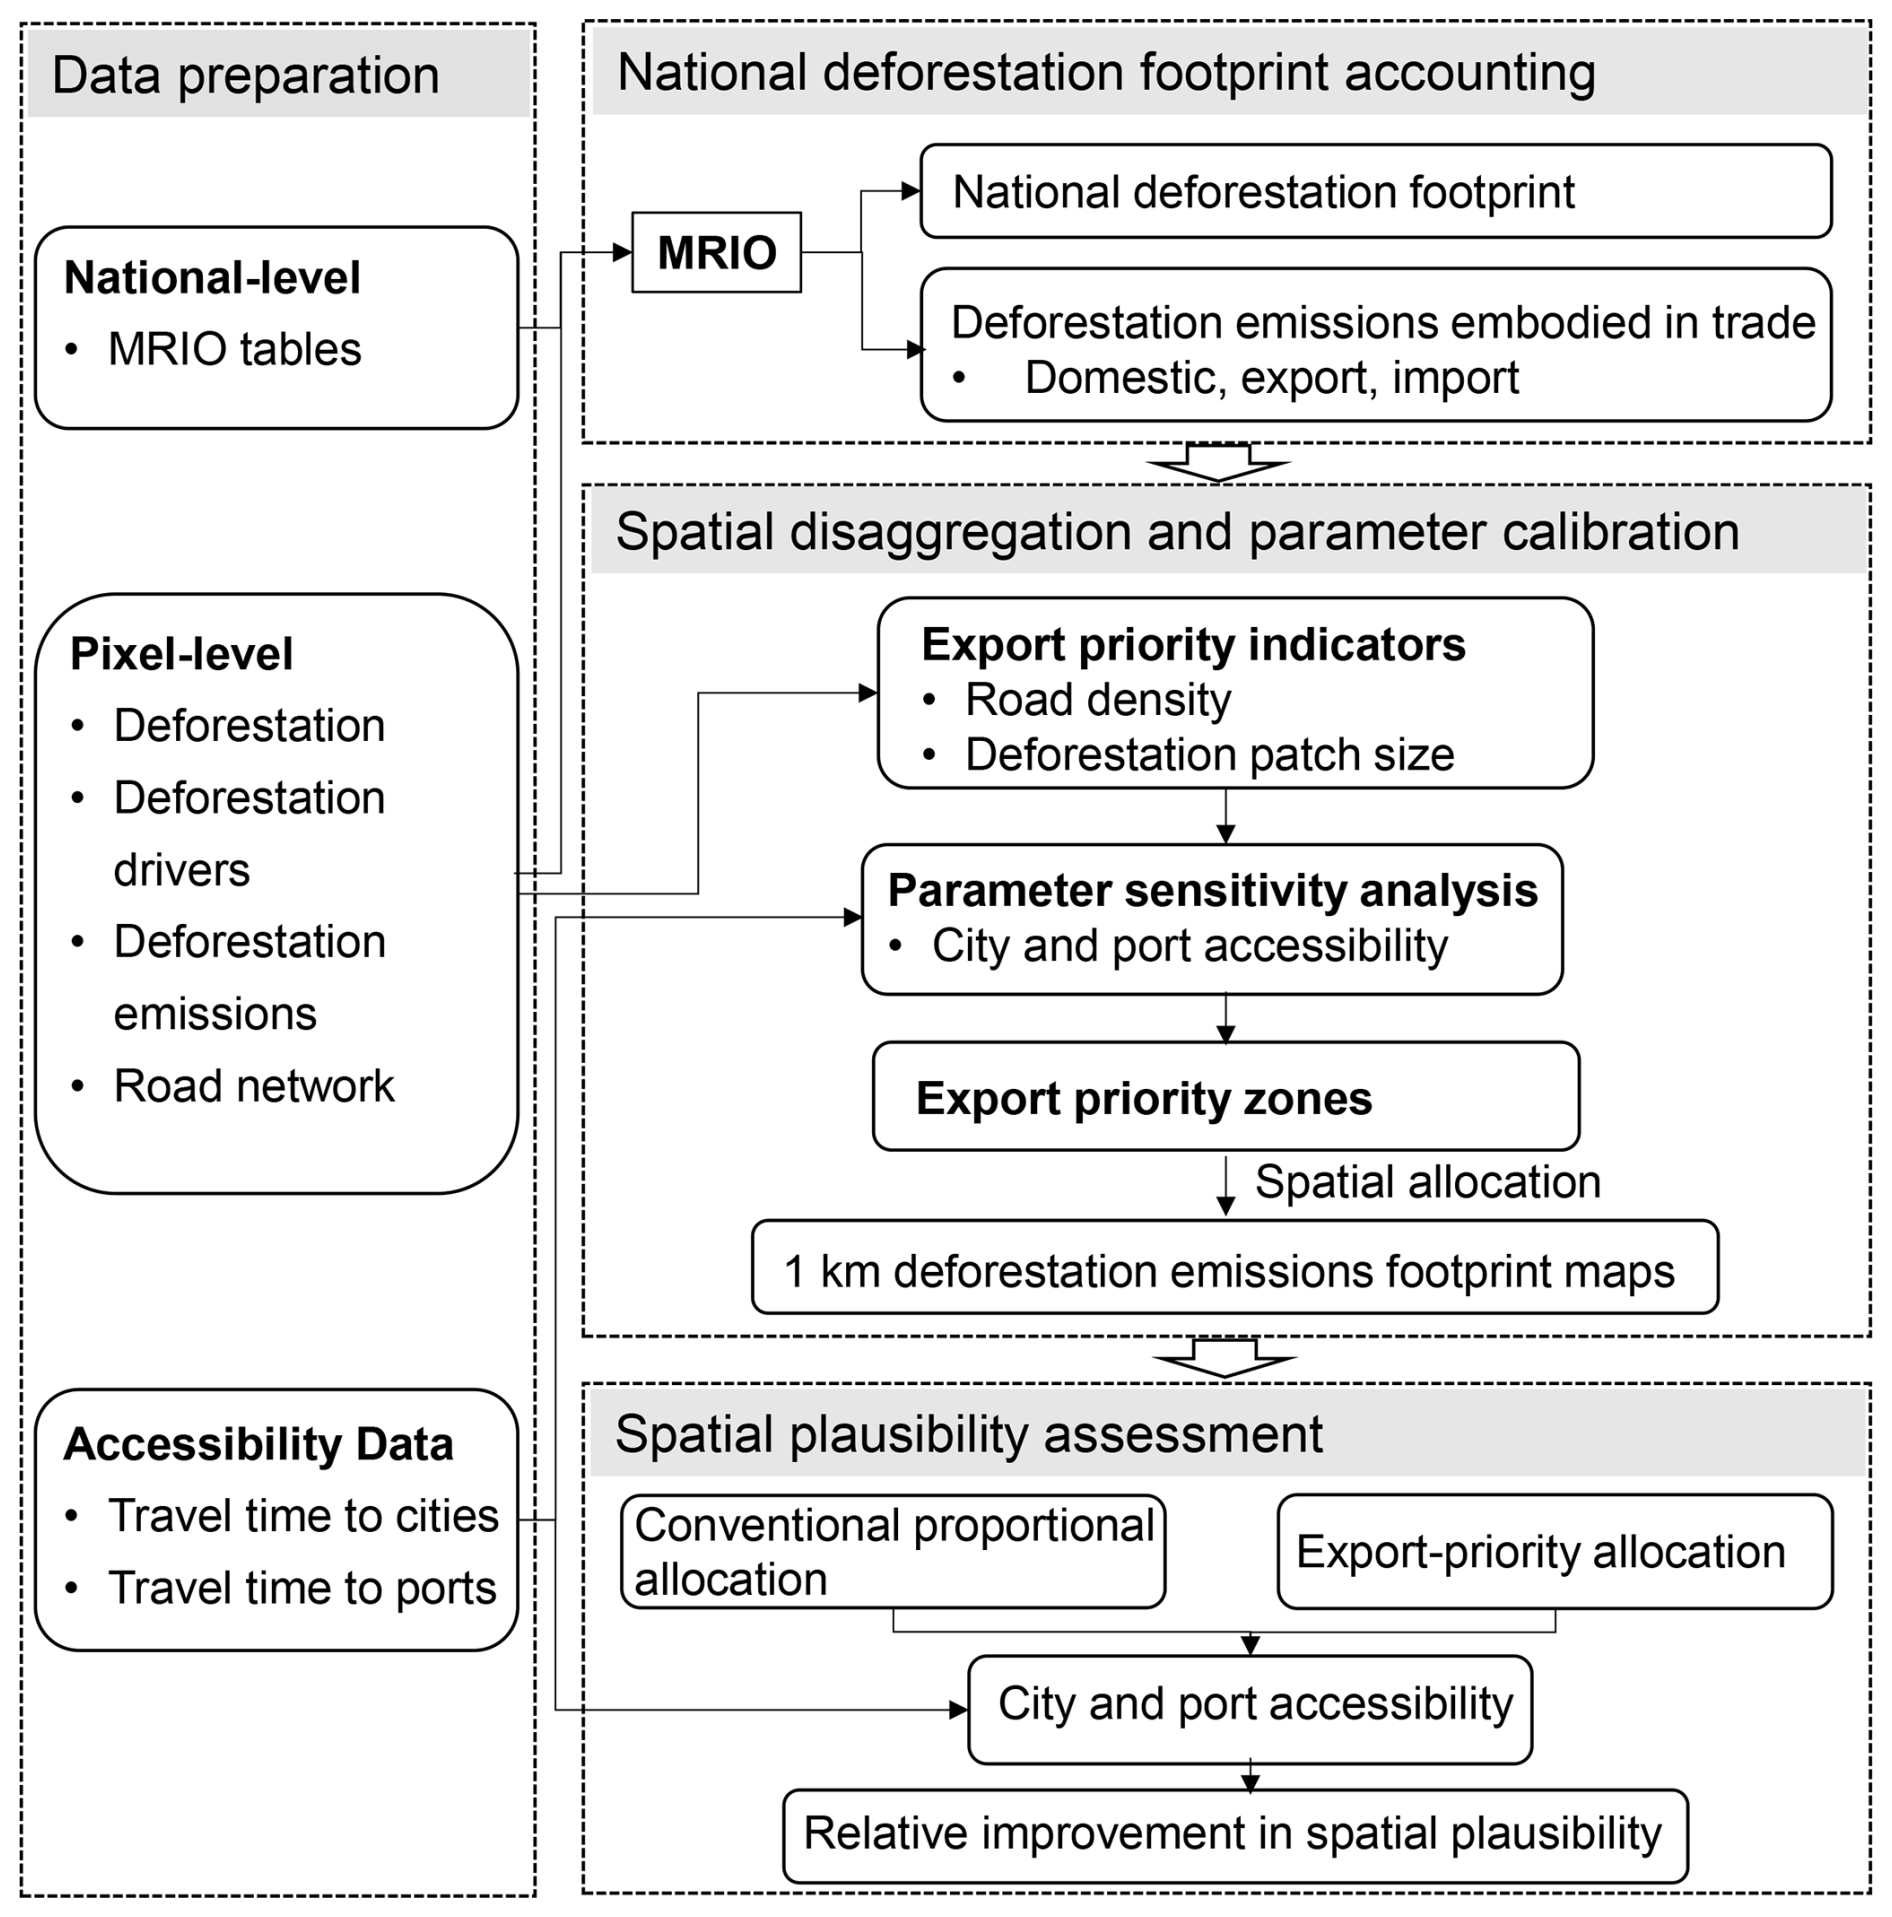
Figure 1Overview of the SMRIO framework and data processing workflow for generating the global 1 km gridded consumption-based deforestation emissions footprint dataset. The workflow includes data preparation, national-level deforestation emissions accounting, spatial disaggregation, and spatial plausibility assessment, together with the corresponding data sources. Parameter calibration and sensitivity analysis were conducted during the spatial disaggregation stage based on spatial plausibility criteria.
2.1 Data preparation
2.1.1 Global MRIO tables at the national level
MRIO tables provide a comprehensive representation of monetary flows associated with production, consumption, and trade among economic sectors and countries and are widely used to quantify consumption-based environmental footprints (Kanemoto et al., 2016; Lenzen et al., 2018; Liu et al., 2022). An MRIO table consists primarily of intermediate transactions, which describe monetary flows of goods and services among producing sectors within and across countries, and final demand, which records purchases by final consumers in each country. Together with sectoral total output, these data trace how production in one country is linked through international supply chains to final consumption in another country. In this study, we utilized Eora26, a simplified version of the Eora global MRIO tables, for 2001–2020. Eora26 provides a consistent time series covering 187 countries and regions with a harmonized classification of 26 economic sectors (Lenzen et al., 2013). Specifically, we used the economic core of Eora26, including intermediate transactions, final demand, and sectoral total output, to characterize production-consumption linkages across countries and sectors. The environmental satellite accounts provided by Eora26 were not used in this study. Instead, the deforestation emissions satellite account was independently constructed using the pixel-level deforestation and deforestation emissions data described in Sect. 2.1.2, to ensure consistency with the spatially explicit deforestation emissions used for subsequent spatial allocation. This independently constructed environmental extension was linked to the Eora26 economic system to attribute deforestation emissions to domestic and foreign final demand through global supply chains. The detailed accounting procedure is described in Sect. 2.2.1.
2.1.2 Pixel-level deforestation, deforestation emissions, and road densities
We obtained annual deforestation data from Hansen et al. (2013), derived from time-series analysis of growing-season Landsat imagery and updated annually on Global Forest Watch. Forest loss was identified using a decision-tree classification based on time-series spectral metrics derived from Landsat observations, while the year of forest loss was determined using the maximum annual decline in tree cover together with the maximum annual decline in growing-season Normalized Difference Vegetation Index (NDVI). Deforestation is defined as the complete removal of tree cover canopy or a stand-replacement disturbance at the scale of Landsat pixels, following Hansen et al. (2013). The deforestation emissions data were obtained from Harris et al. (2021), which provide global annual forest carbon emissions estimates at a spatial resolution of 30 m. Harris et al. also used the annual forest loss data from Hansen et al. (2013), ensuring consistency with our study's basic data. Harris et al. mapped carbon emissions from global forest extent by synthesizing information from over 637 000 ground plots, 707 561 waveform lidar observations, and other satellite data into a spatial forest carbon monitoring framework. To maintain temporal consistency with MRIO tables, we only used deforestation data up to 2020.
Deforestation drivers were classified following Curtis et al. (2018) into five major categories: commodity-driven deforestation (e.g., agriculture, mining), shifting agriculture (e.g., shifting cultivation), forestry (e.g., timber harvesting), wildfire (e.g., forest fires), and urbanization (e.g., urban expansion). Wildfire-related deforestation was excluded from this study, as it is not directly linked to economic activities or final consumption. The remaining drivers were mapped to corresponding economic sectors in the Eora26 classification.
Transportation accessibility was represented using road density, derived from the Global Roads Inventory Project (GRIP) dataset (Meijer et al., 2018). The GRIP dataset harmonizes approximately 60 geospatial datasets on road infrastructure and provides a global raster of road density at a 5-arcminute resolution. These pixel-level datasets capture spatial heterogeneity required to distribute national-level deforestation emissions footprints to 1 km grid cells.
All spatial analyses were conducted on a common 30 m grid. Coarser-resolution raster datasets were aligned to the 30 m analysis grid before spatial allocation and related calculations. The resulting deforestation emissions footprints were subsequently aggregated to 1 km grid cells by summing the constituent 30 m pixels, yielding the final 1 km gridded dataset provided in this study.
2.2 Mapping high-spatial resolution deforestation emissions footprint
2.2.1 National deforestation emissions footprints accounting
As described in Sect. 2.1.1, the MRIO framework links production in each country and sector to intermediate use and final demand both domestically and abroad. Accordingly, total sectoral output (X) is accounted for by intermediate transactions (T) and final demand (y) as expressed as Eq. (1):
where denotes total output of sector i in region r; is the intermediate input-output from sector i in region r to sector j in region s; is the final demand in region s supplied by sector i in region r.
When the technical coefficient A is introduced, Eq. (1) can be reformulated as follows:
where represents the amount of input of sector i in region r to satisfy the unit value increase in output of sector j in region s; I is the identity matrix; is the Leontief inverse matrix (L), which represents the gross output from sector i in region r to satisfy one monetary unit of final demand in sector j of region s.
To link deforestation with economic activities, we matched the deforestation drivers to the corresponding economic sectors in Eora26. Commodity-driven deforestation was associated with both the agricultural and mining and quarrying sectors. Shifting agriculture and forestry were assigned to the agricultural sector, while urbanization was assigned to the construction sector. When a deforestation driver was associated with multiple economic sectors, the corresponding deforestation area was allocated among these sectors in proportion to their value added (Hoang and Kanemoto, 2021; Kanemoto et al., 2016). Based on this sectoral correspondence, we defined a direct deforestation intensity vector f as:
where f represents deforestation area per monetary unit of sectoral outputs; is the direct deforestation area satellite account, with denoting the deforestation area of sector i in region r.
Thus, deforestation area embodied in interregional supply chains and attributable to final demand can be calculated as
where E is the matrix of deforestation area embodied in supply chains and attributed to final demand; is a diagonal matrix of f; Y is the final demand.
By aggregating deforestation areas across countries and sectors, we obtained national-level deforestation footprints for each consuming country, distinguishing between domestic and foreign sources. These footprints were subsequently spatially allocated to grid cells and combined with spatially explicit deforestation emissions data to calculate the corresponding deforestation emissions footprints, as described in Sect. 2.2.2.
The framework does not assume a direct temporal correspondence between deforestation occurring in a given year and commodities produced or exported in that same year. Instead, annual deforestation emissions are treated as an environmental pressure associated with the production and trade system represented in the corresponding MRIO year and attributed to final demand based on annual production–consumption linkages.
2.2.2 Export priority zones and spatial allocation
To spatially allocate national deforestation footprints to grid cells, we extended the SMRIO framework by introducing export priority zones, which reflect the likelihood that deforestation in a given location is driven by export-oriented production. The allocation of deforestation area to domestic and foreign final demand is determined by the MRIO framework. Export-priority zones are used only to identify grid cells more likely to be associated with export-oriented production during spatial disaggregation within producing countries. The national-level deforestation footprints were allocated to grid cells according to the export-priority criteria, while preserving the total deforestation area attributed to each consuming country. The spatial allocation procedure is formulated as follows:
where Fs denotes deforestation footprint map of country s in the world; R denotes map of deforestation area for each of h=1 to 4 drivers, and , , and are maps of deforestation area caused by driver h in the first, second and third priority export areas in country r, respectively. d denotes deforestation area, and d1, d2, and d3 are deforestation areas in the first, second and third priority export areas in country r. The embodied deforestation term (E) and d are in absolute values; i and j represent the sectors of origin and destination, and r and s denote the countries of production and final sale; t is the country of final demand.
The international demand for export-oriented agricultural products is widely recognized as a significant driver of deforestation (Defries et al., 2010). Profit-driven export trade in agricultural and forestry commodities tends to be concentrated in regions with extensive farmland (Friis and Nielsen, 2019) and well-connected locations (Verburg et al., 2011). Export-oriented agricultural and forestry production tends to occur in regions characterized by large deforestation patches and high transportation accessibility (Meijer et al., 2018). Based on this assumption, export priority zones were identified using two indicators: deforestation patch size and road density. Larger patch sizes and higher road densities were assumed to indicate a higher probability of export-driven deforestation.
Deforestation patches were identified through landscape pattern analysis at a spatial resolution of 30 m, with road density used as a proxy for accessibility. A parameter sensitivity analysis was conducted to determine appropriate thresholds for both indicators. We tested three deforestation patch size (200×200, 300×300, and 400×400 pixels) and seven road density values (50, 60, 70, 80, 90, 100, and 110 m km−2). For each parameter combination, a preliminary gridded deforestation emissions footprint dataset was generated and assessed using global accessibility datasets described in Sect. 2.3. Thresholds were selected based on spatial plausibility criteria. Specifically, the share of deforestation emissions in accessible areas was maximized, while the share allocated to extremely remote regions was minimized. Using these criteria, a deforestation patch size threshold of 300 pixels and a road density threshold of 100 m km−2 were chosen, resulting in the delineation of three export priority zones (Table 1).
Table 1The delineation of three export priority in this study.
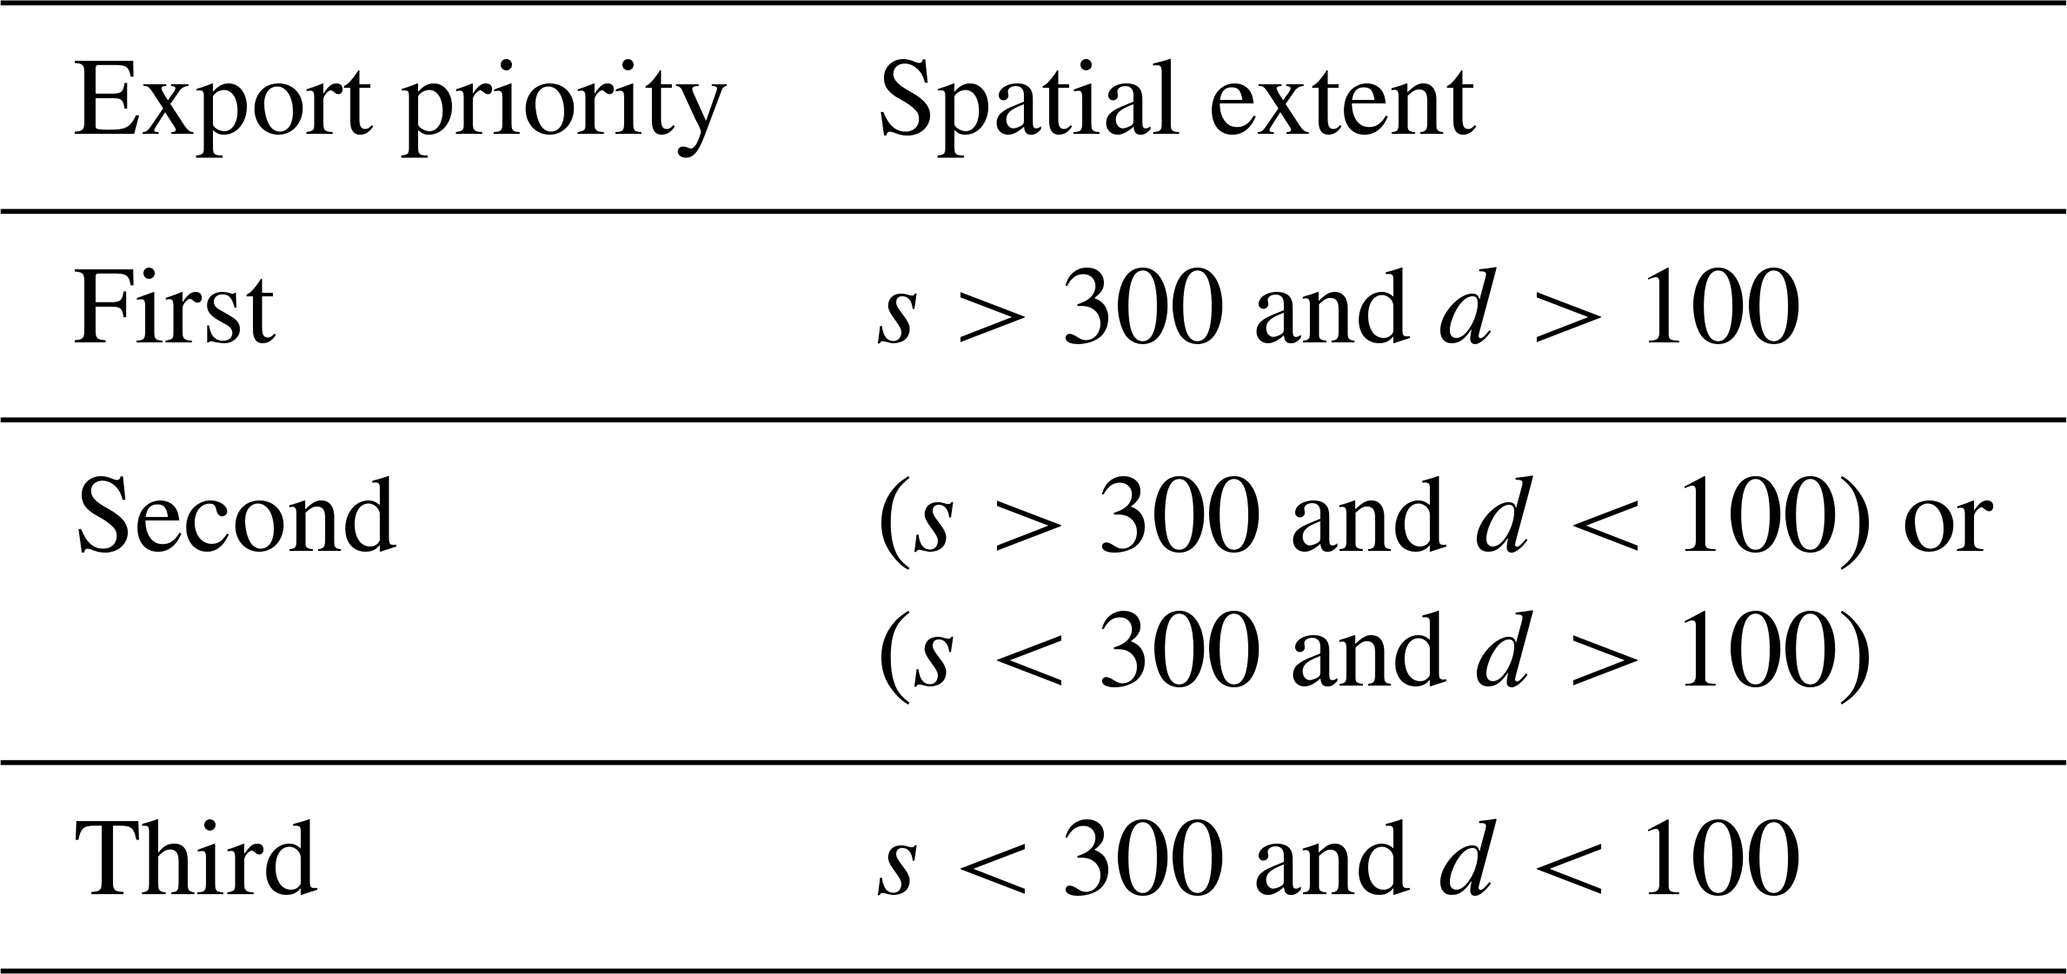
Notes: s denotes deforested patch size measured in pixels (30 m×30 m); d denotes the road density (unit: m km−2).
Deforestation area embodied in international trade were first allocated to the highest export priority zones. If area exceeded the total deforestation area of a given zone, the remaining area were sequentially allocated to lower export priority zones. In contrast, deforestation driven by domestic consumption were allocated in opposite order, from lower to higher export priority zones.
The resulting gridded deforestation footprints were then overlaid with spatially explicit deforestation emissions data. For each grid cell, the deforestation footprint attributed to each consuming country was multiplied by the corresponding carbon emissions density to calculate its deforestation carbon emissions footprints. The resulting gridded emissions footprints were subsequently aggregated for each consuming country to obtain national-level consumption-based deforestation emissions, distinguishing between domestic and foreign sources. Finally, the gridded emissions footprints were aggregated to 1 km resolution to generate the final dataset.
2.3 Spatial plausibility assessment
2.3.1 Accessibility to cities
Spatial plausibility of the gridded deforestation emissions footprints was assessed based on travel time to cities of different population sizes. We used the global travel time to cities dataset (Weiss et al., 2018), and classified cities into four categories according to population: <10 000; 10 000−20 000; 20 000−50 000; and >50 000 inhabitants. Deforestation emissions footprints located more than five hours from the nearest city were considered less consistent with export-oriented production, as travel times beyond this threshold substantially reduce market access and trade participation (Hochard and Barbier, 2017). Accordingly, travel time to the nearest city was divided into four intervals: <1, 1–2, 2–5, and >5 h.
2.3.2 Accessibility to ports
To further assess spatial plausibility with respect to export-oriented deforestation emissions, travel time to ports was assessed using the Global Accessibility to Ports dataset (Nelson et al., 2019). Ports in the dataset are classified into five categories Large, Medium, Small, Very small, and Any. Deforestation emissions footprints located at very long travel times to ports were considered less closely associated with export-driven deforestation (Gries et al., 2009). Travel time to the nearest port was divided into four intervals for analysis: <24, 24–48, 48–72, and >72 h.
2.3.3 Comparison with conventional spatial allocation approaches
We compared the spatial distribution of deforestation emissions footprints derived from the optimized export priority zones with those obtained using a conventional proportional allocation approach that does not consider accessibility or patch size. The comparison focused on the relative shares of footprints in accessible versus remote areas, illustrating the effectiveness of the proposed approach in enhancing the spatial plausibility of deforestation emissions footprints.
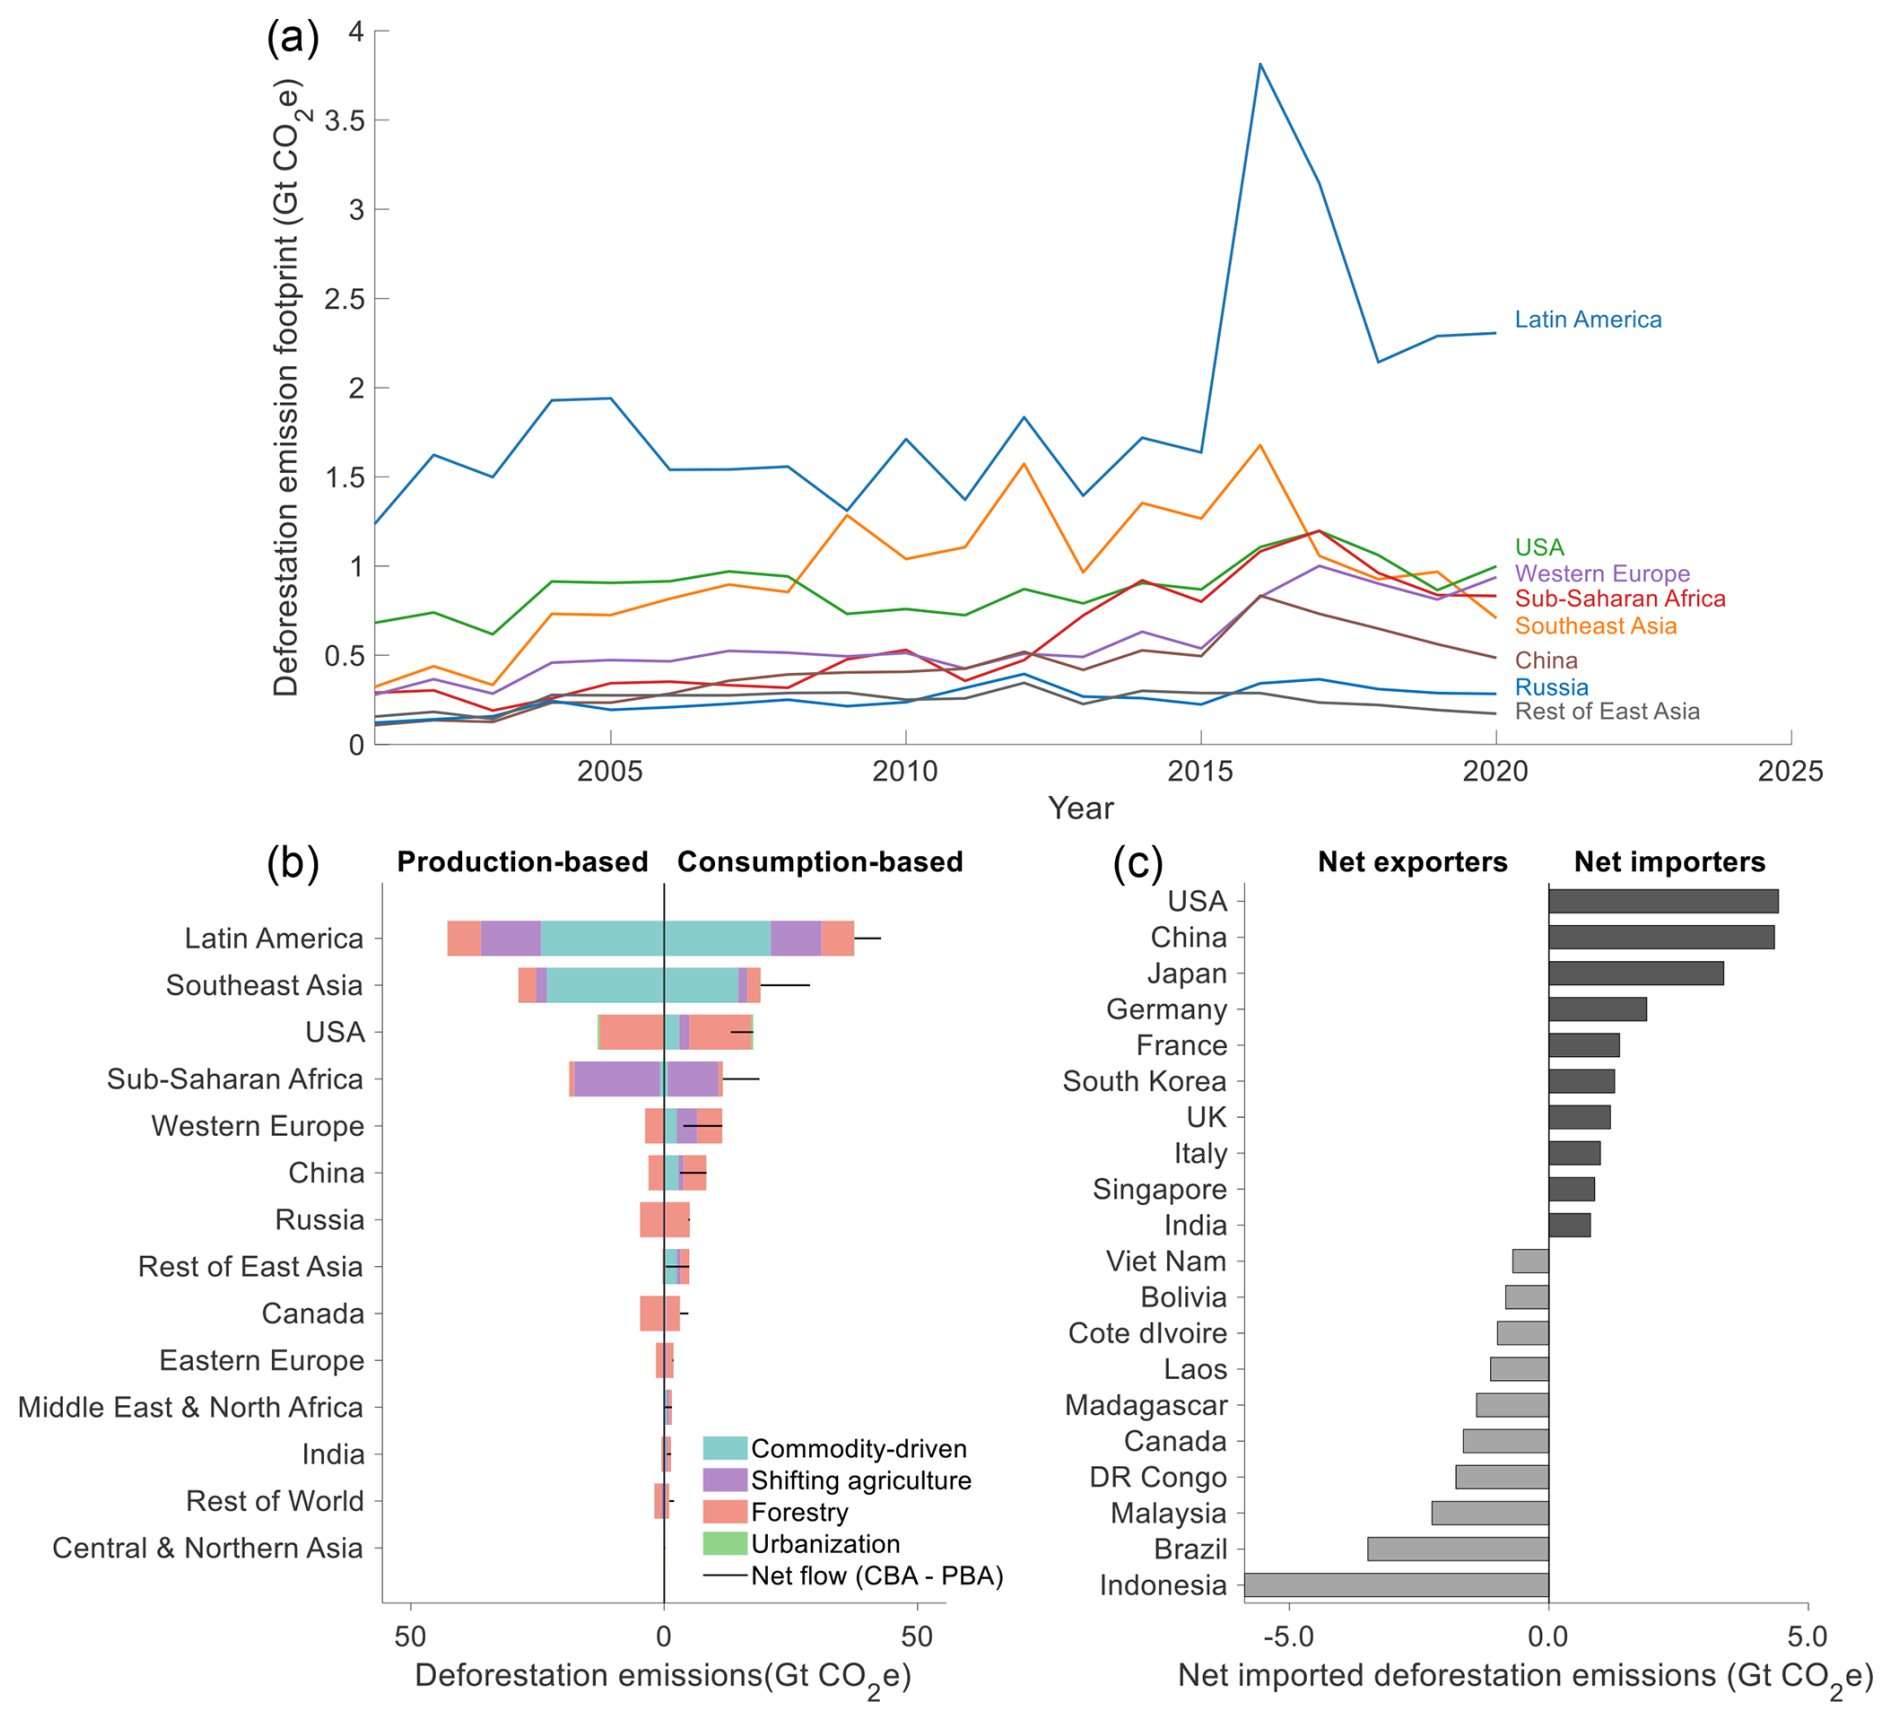
Figure 2Temporal dynamics, regional patterns, and net trade flows of global consumption-based deforestation emissions, 2001–2020. (a) Temporal changes in consumption-based deforestation emission across world regions. (b) Comparison of cumulative deforestation emissions by drivers across world regions and net trade flows (consumption-based minus production-based emissions). (c) Ranking of the top net exporters and net importers of deforestation emissions based on net trade flows. Positive values indicate net importers, whereas negative values indicate net exporters.
3.1 Overview of the global consumption-based deforestation emission footprint between 2001–2020
We estimated global consumption-based deforestation emissions associated with dominant anthropogenic activities for the period 2001–2020 using the improved SMRIO model. During this period, global deforestation resulted in total emissions of 124.5 Gt CO2e. Notably, 39.6 Gt CO2e of these emissions were embodied in trade, accounting for 31.8 % of total global deforestation emissions. Regionally, the largest consumption-based deforestation emissions were observed in Latin America, Southeast Asia, and the United States (Fig. 2a). The deforestation emission footprints in Latin America and the United States remained relatively stable prior to 2015, followed by a marked increase in 2016 and a subsequent decline. This increase was particularly pronounced in Latin America. In Western Europe, Southeast Asia, Sub-Saharan Africa, and China, deforestation emission footprints gradually increased before 2015, peaked around 2016, and then showed a decreasing trend thereafter. In contrast, Russia and the rest of East Asia exhibited relatively small interannual variability throughout the entire study period. The pronounced peak in Latin America in 2016 was predominantly driven by Brazil, where forest loss and production-based deforestation emissions increased substantially. As most of Brazil's consumption-based deforestation emissions were associated with domestic final demand, the increase in its production-based emissions was also reflected in the regional consumption-based footprint.
Cumulative deforestation emissions from 2001–2020 were further disaggregated by deforestation drivers for both consumption- and production-based perspectives across world regions (Fig. 2b). From the consumption perspective, Latin America and Southeast Asia exhibit large emission footprints associated with commodity-driven deforestation. In contrast, the United States, China, Russia, and Canada show relatively larger contributions from forestry-related activities. Sub-Saharan Africa exhibits the highest share of emissions footprints associated with shifting agriculture (Fig. 2b). From the production perspective, Latin America and Southeast Asia are the dominant contributors to deforestation emissions, with a large proportion of emissions attributable to commodity-driven deforestation. In the United States, Western Europe, China, and other regions, forestry is the primary driver of deforestation emissions, whereas deforestation emissions associated with these regions from a consumption perspective arise from multiple drivers (Fig. 2b). At the national level, differences between consumption-based and production-based deforestation emissions varied substantially among countries (Fig. 2c). The United States, China, Japan, and Germany were among the largest net imports of deforestation emissions, whereas Indonesia, Brazil, Malaysia, and the Democratic Republic of the Congo were among the largest net exporters.
3.2 Spatiotemporal distribution of consumption-based deforestation emissions for major consuming countries
The new dataset, generated using the improved SMRIO framework, captures spatially explicit information on the distribution of consumption-based deforestation emissions at a 1 km resolution. Figure 3 presents cumulative maps of deforestation emission footprints associated with consumption in four major net-importing countries, including the United States, China, Japan, and Germany, during 2001–2020, together with the contributions from domestic and foreign source regions. Deforestation emissions induced by consumption in the United States are widely distributed across both domestic and international regions (Fig. 3a). Major hotspots occur within the United States and tropical forest regions, particularly in Southeast Asia (e.g., Indonesia and Malaysia), the Amazon Basin, coastal West Africa (e.g., Côte d'Ivoire and Liberia), eastern Madagascar, and Chile. The source attribution results show that domestic sources contributed 59.8 % of the US consumption-based deforestation emissions. The top 11 source countries (including the United States) accounting for 88.3 % of the total footprint (Fig. 3b).
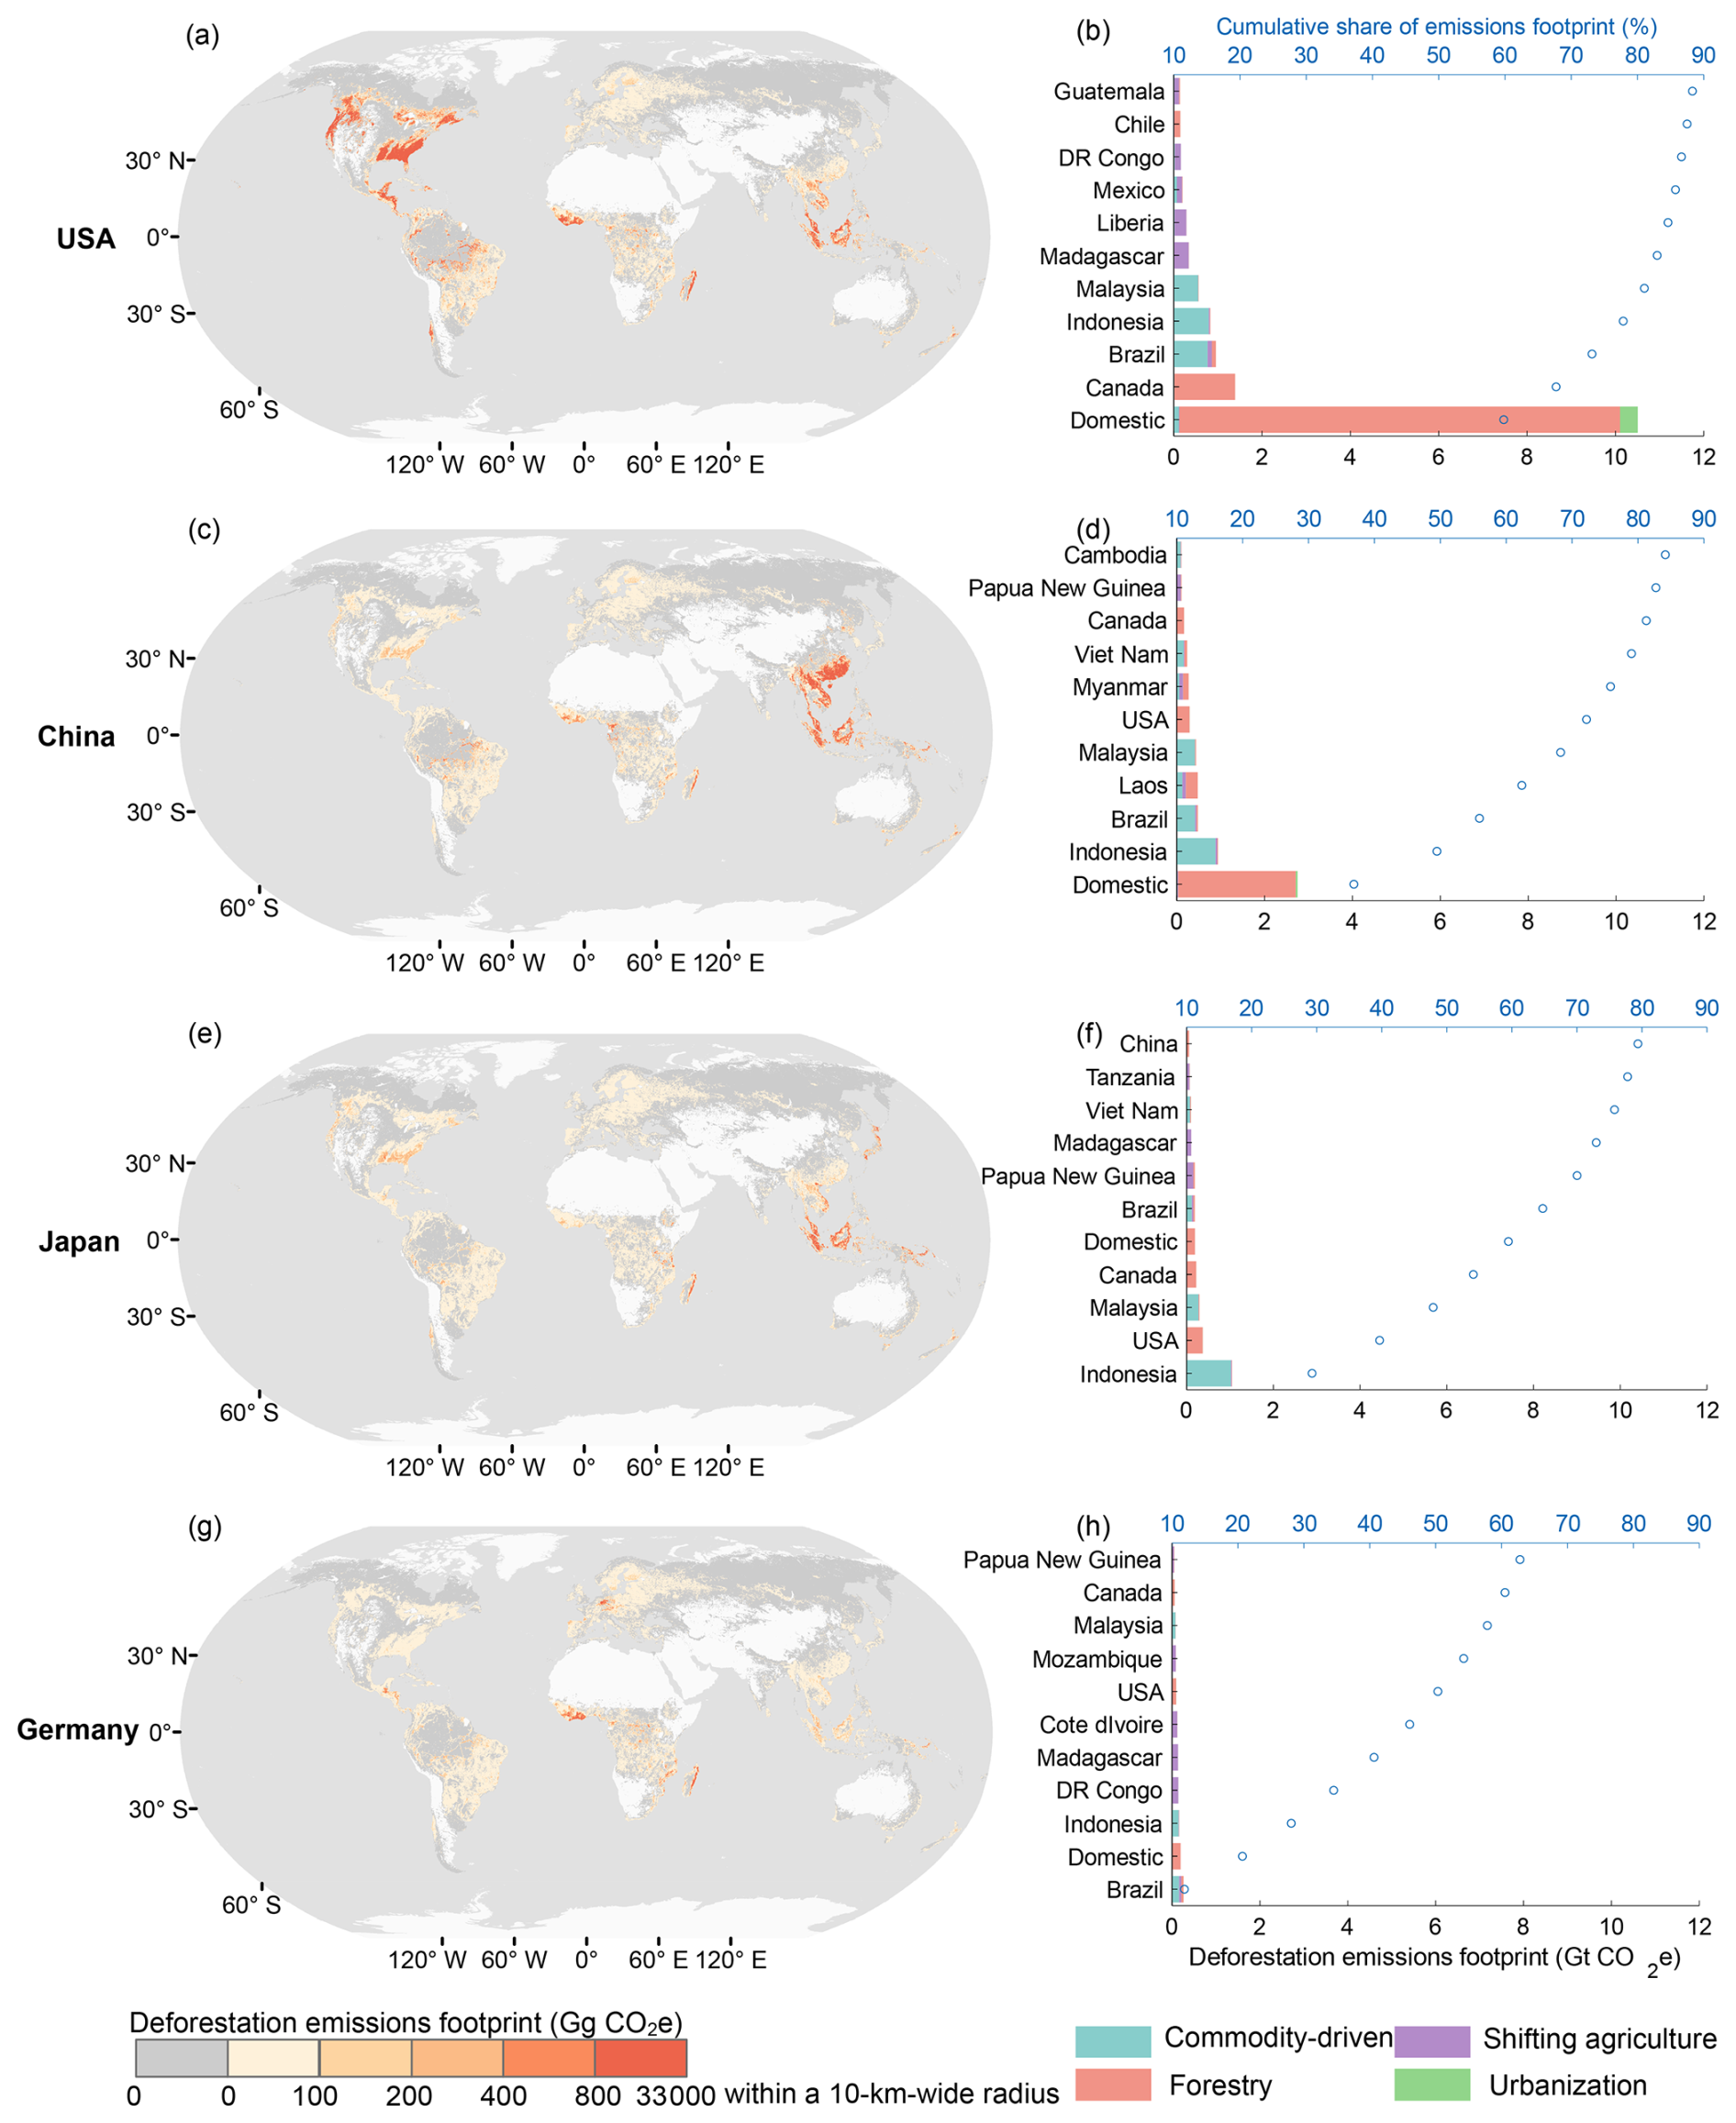
Figure 3Spatial patterns and source contributions of cumulative consumption-based deforestation emissions footprints for major net-importing countries, 2001–2020. (a, c, e, g) Global distribution of cumulative deforestation emissions footprints for the United States, China, Japan, and Germany, respectively. (b, d, f, h) Contributions of domestic and major foreign source countries and deforestation drivers to the cumulative footprints of the four countries. Blue points indicate the cumulative share of total footprint.
China's consumption-based deforestation emissions are more spatially concentrated (Fig. 3c). Domestic emission hotspots are mainly located in north China, while international footprints extend primarily to Southeast Asia, particularly Indonesia and Malaysia, as well as to Central and West Africa, including Gabon and Cameroon. Domestic sources contributed 36.9 % of China's consumption-based deforestation emissions, while the top 11 source countries (including China) accounting for 84.1 % of the total footprint (Fig. 3d).
The deforestation emissions footprints of Japan and Germany were predominantly distributed across overseas source regions (Fig. 3e–h). For Japan, major foreign emission hotspots are concentrated in Southeast Asia and South America, whereas Germany's footprints are mainly associated with South America, Southeast Asia, and parts of Africa. Japan and Germany showed relatively small domestic contributions, accounting for 5.4 % and 8.8 % of their respective consumption-based deforestation emissions. The top 11 source countries (including Japan and Germany) accounted for 79.4 % and 62.8 % of the total footprints, respectively (Fig. 3f and h).
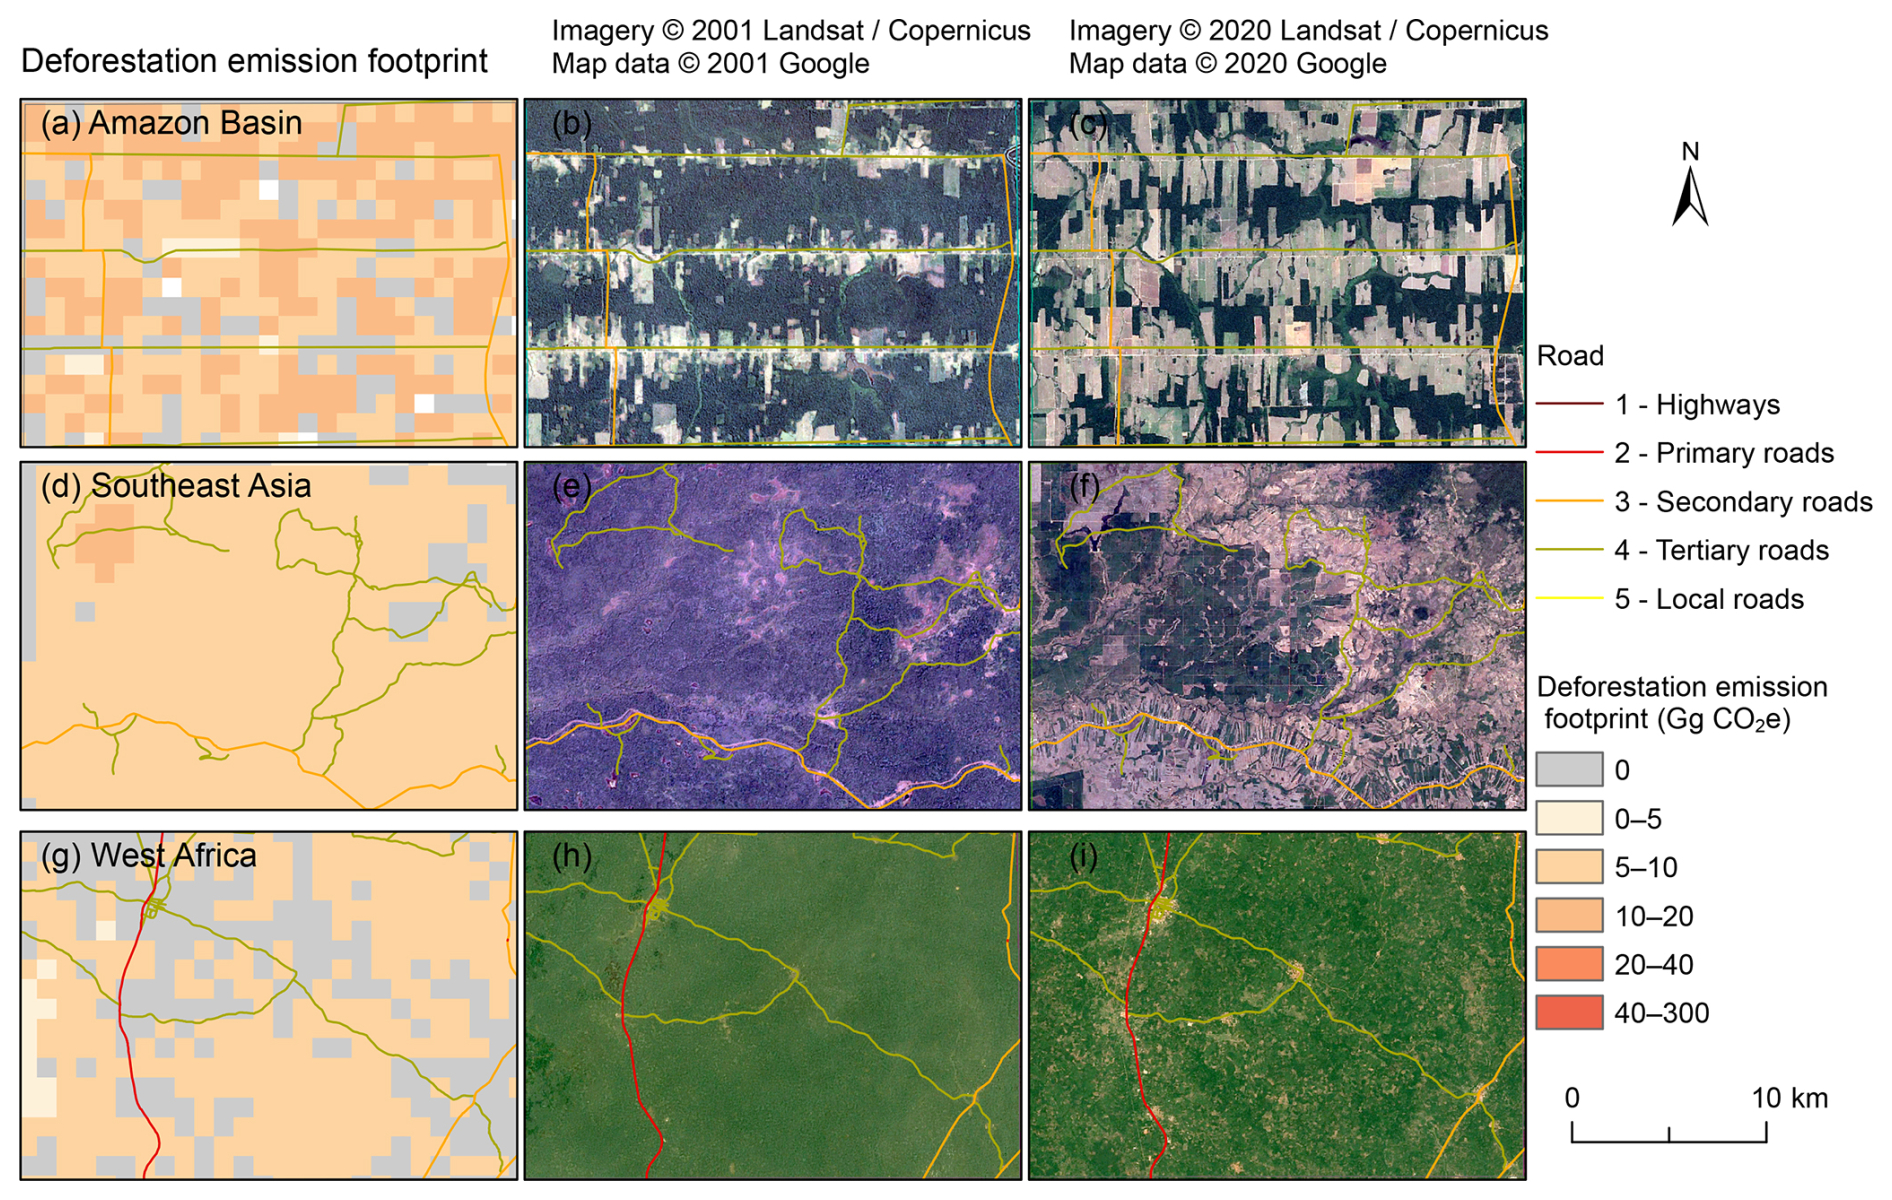
Figure 4Regional examples of consumption-based deforestation emissions (Gg CO2e) at 1 km resolution. Panels (a–c) show cumulative emissions attributable to US final consumption within a 25 km×25 km sample window in the Amazon Basin (centered at 9.58° S, 63.26° W) from 2001–2020, along with high-resolution Google Earth imagery in 2001 and 2020. Panels (d–f) and (g–i) present the corresponding results for the 25 km×25 km sample windows in Southeast Asia (centered at 12.18° N, 106.77° E) and West Africa (centered at 7.30° N, 3.15° W). Second column: 2001 imagery; third column: 2020 imagery. Satellite imagery © 2001, 2020 Landsat/Copernicus, Map data © 2001, 2020 Google.
3.3 Regional examples of consumption-based deforestation emissions
To illustrate the spatial details of the consumption-based deforestation emissions dataset, we selected three sample areas representing hotspots of deforestation emissions footprints, each with a spatial extent of approximately 25 km×25 km (Fig. 4). These samples are located in the Amazon Basin (Brazil), Southeast Asia, and West Africa, representing regions with distinct deforestation drivers, trade linkages, and accessibility conditions. The 1 km resolution allows for clear delineation of the spatial distribution of deforestation emissions footprints associated with different drivers. As shown in the Fig. 4, the deforestation emissions footprints are primarily concentrated in road-dense areas, with relatively larger and more aggregated patch. For instance, in the Amazon Basin, the deforestation emissions footprints extend along roads and gradually spread outward, forming patches with relatively regular shapes (Fig. 4a–c). In Southeast Asia, where the road network is less evenly distributed than in the Amazon, the deforestation emissions footprints are less aggregated and display a more uniform spatial distribution pattern (Fig. 4d–f). In the West African region, the road network is less dense than in Southeast Asia, and the deforestation emissions are dispersed into smaller patches, resulting in a more scattered spatial distribution compared with Southeast Asia (Fig. 4g–i).
3.4 Spatial plausibility assessment using accessibility indicators
The optimal parameter combination used in this study was selected based on the spatial plausibility of the resulting datasets under different parameter settings. Figure 5 presents the changes in the distribution of global export-driven deforestation emissions across accessibility zones for datasets generated under different parameter combinations, relative to the conventional approach. Compared with the conventional dataset, the dataset produced in this study generally increases the share of deforestation emissions located within areas with travel times to ports of less than 12 h, while reducing the share in areas with travel times between 12 and 48 h. Except for parameter combination 2 (d100−s300), all other combinations increase the share of deforestation emissions in regions with travel times to ports exceeding 72 h (Fig. 5a). Similarly, relative to the conventional dataset, the dataset generated in this study increases the share of deforestation emissions in areas with travel times to cities of less than 2 h, while reducing the share in areas where travel time to cities exceeds 2 h. The magnitude of change follows a clear gradient: the closer to cities (higher accessibility), the larger the increase, whereas more remote areas (lower accessibility) experience larger reductions (Fig. 5b). Considering both port and city accessibility, parameter combination 2 (d100−s300) was selected as the optimal setting. Although the increase in emissions within 12 h of ports under combination 2 (d100−s300) is smaller than that under combination 4 (d50−s300), it is the only combination that reduces emissions in areas with travel times to ports exceeding 72 h. In addition, combination 2 (d100−s300) achieves the strongest improvement in areas within 1 h of cities. Based on these considerations, parameter combination 2 (d100−s300) was adopted in this study.
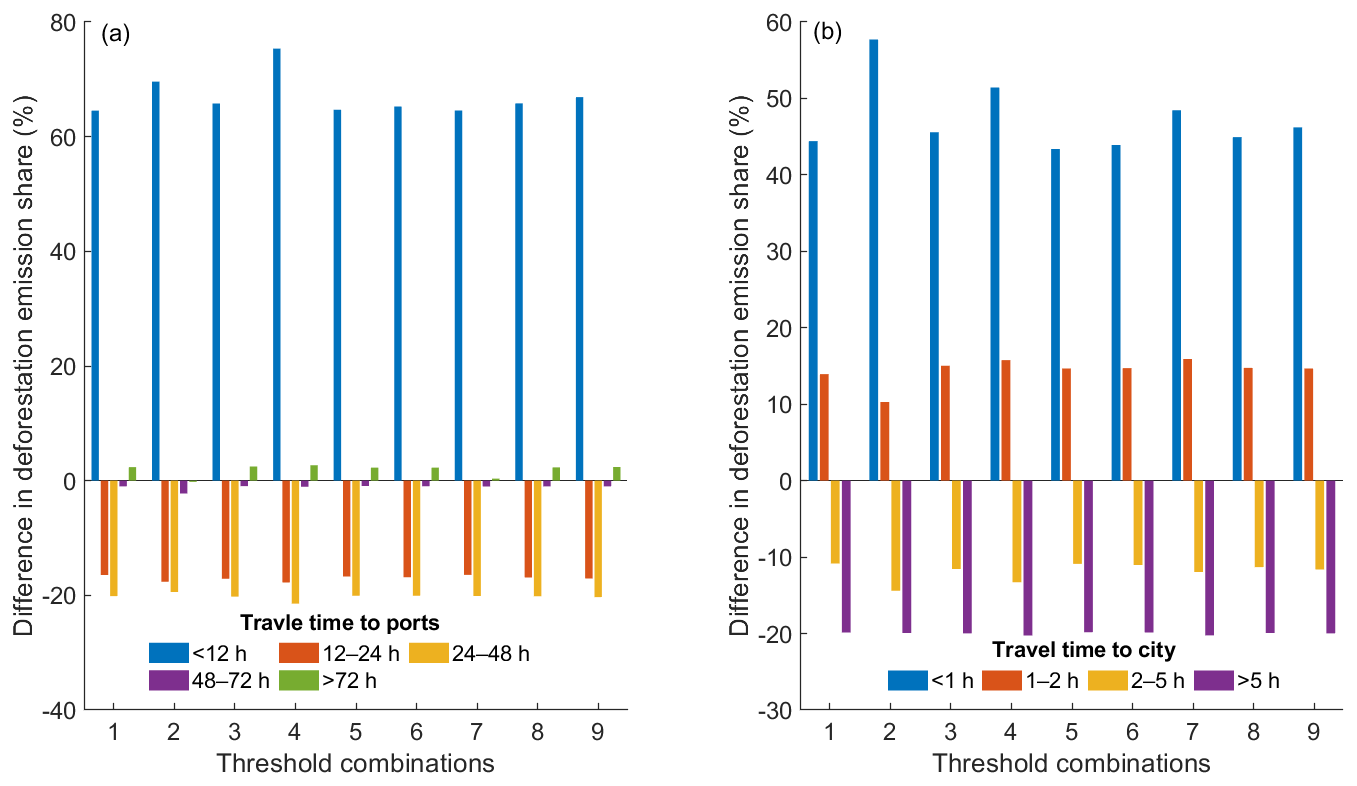
Figure 5Sensitivity analysis of parameter combinations showing changes in export-driven deforestation emissions across port (a) and city (b) accessibility zones relative to the conventional approach. Nine parameter combinations (d100−s400, d100−s300, d100−s200, d50−s300, d60−s300, d70−s300, d80−s300, d90−s300, and d110−s300) were evaluated, where d denotes road density (m km−2) and s denotes deforested patch size (pixels, 30 m×30 m resolution).
The spatial plausibility of the gridded deforestation emission footprint developed in this study was assessed using an independent global accessibility dataset. Results show that consumption-driven deforestation emissions are concentrated in areas with high accessibility. The proportion of deforestation emissions increases as accessibility improves. Only a minimal fraction of emissions occurs in very remote regions (Fig. 6a and c). Compared with conventional approaches, the dataset produced in this study increases the proportion of deforestation emissions in well-accessible areas (e.g., travel time to ports<12 h or to cities<2 h) while reducing the share in less accessible areas (e.g., travel time to ports>12 h or to cities>2 h), with the reductions becoming more pronounced as accessibility decreases (Fig. 6b and d).
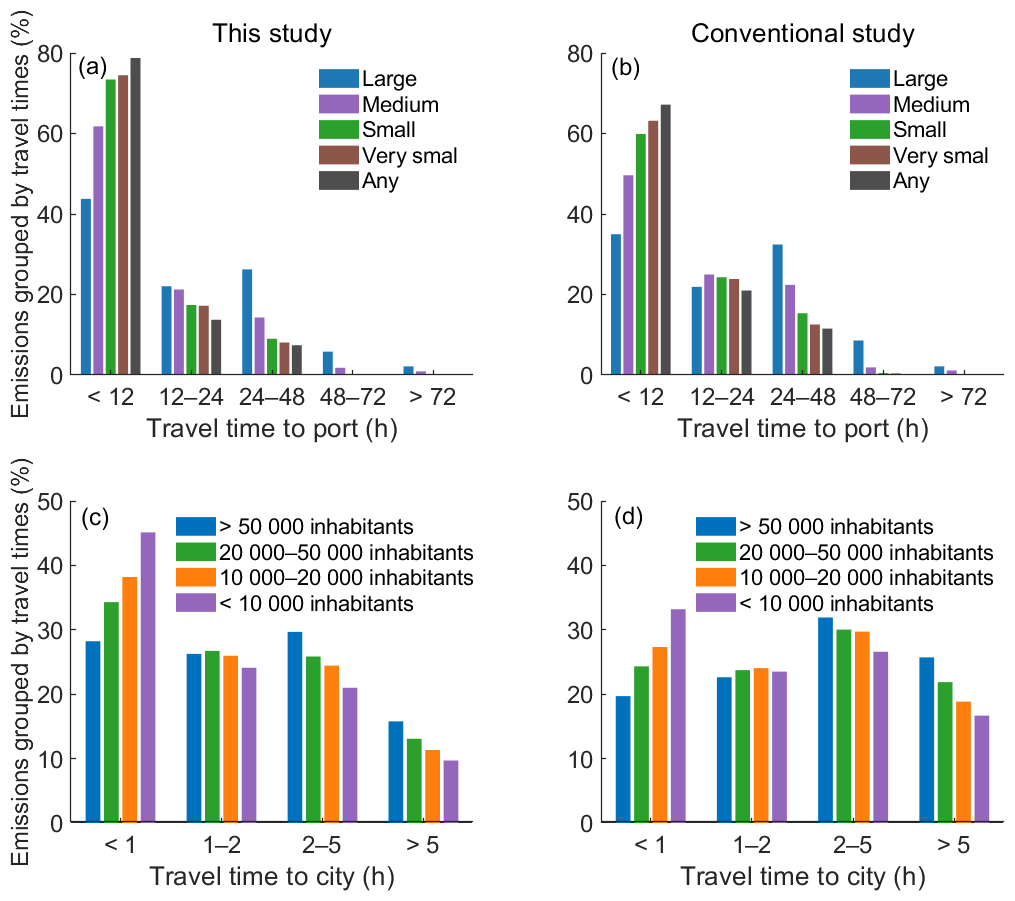
Figure 6Proportion of export-driven deforestation emissions across accessibility zones. Accessibility is measured as travel time to ports (a–b) and cities of different population sizes (c–d). Panels (a, c): this study; panels (b, d): conventional methods.
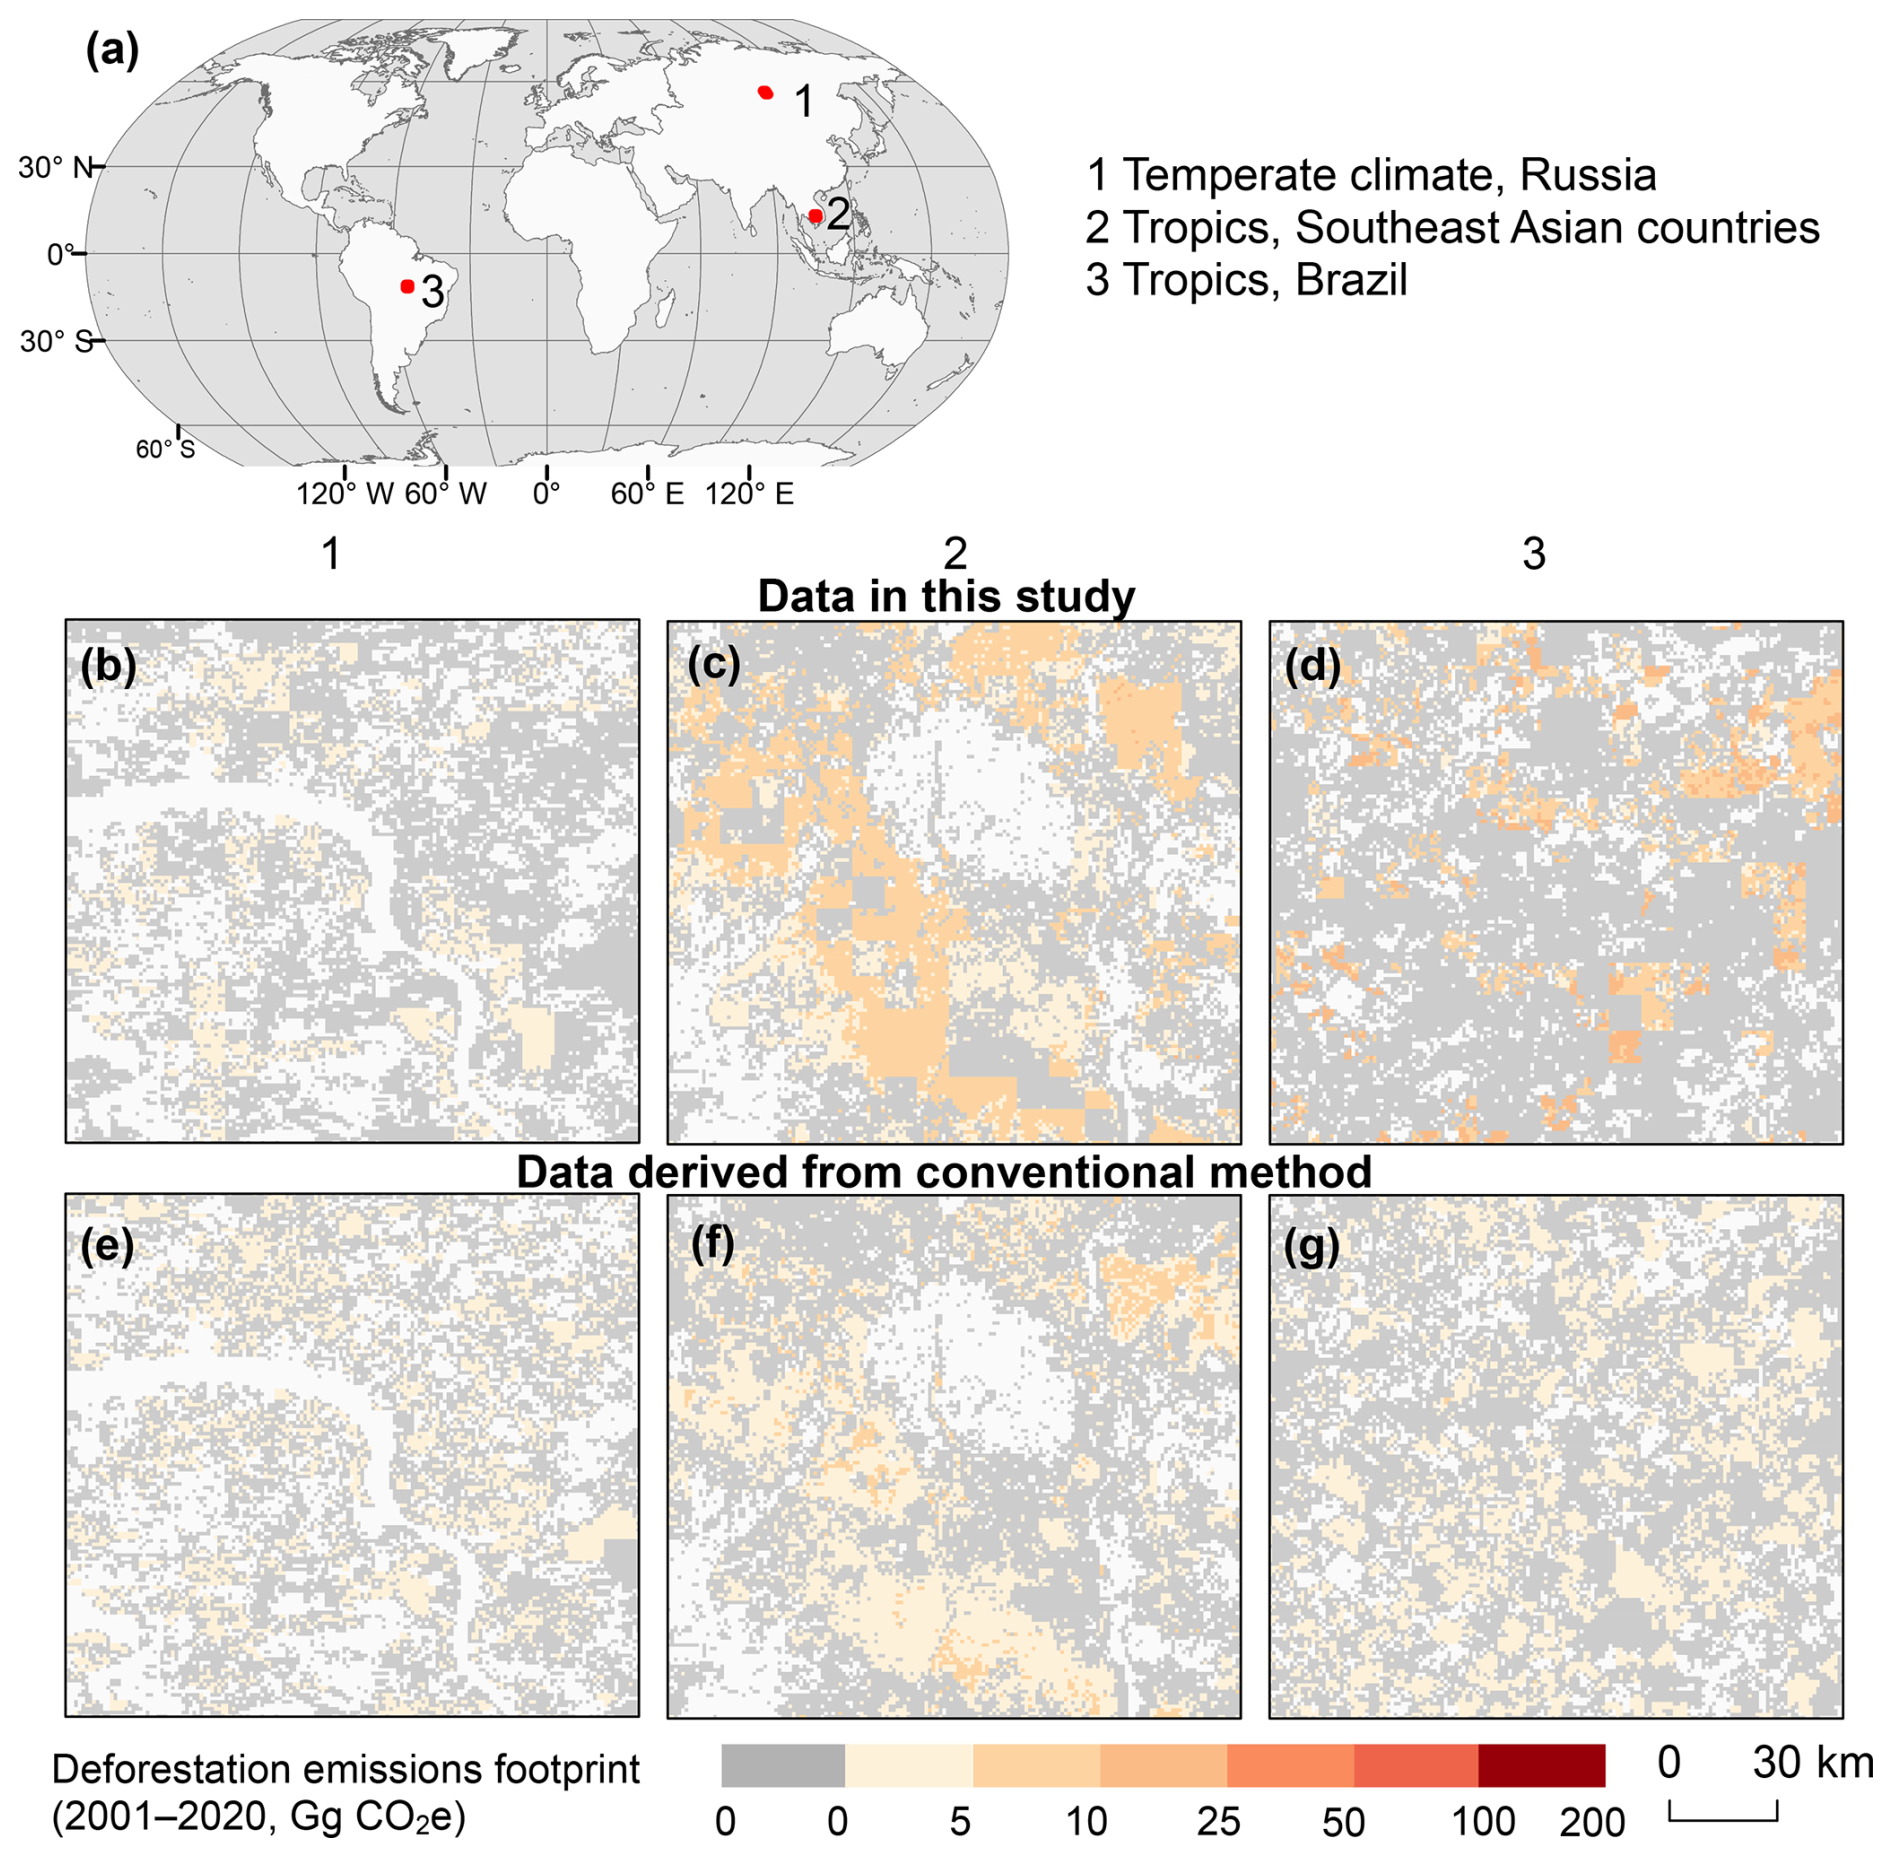
Figure 7Spatial distribution of deforestation emission footprint hotspots from 2001–2020 derived from this study and from the conventional method. The three sample windows are centered at (1) 55.99° N, 102.90° E, (2) 12.98° N, 105.59° E, and (3) 11.30° S, 54.71° W.
We further compared the spatial distribution patterns of deforestation emission footprints derived from this study with those obtained using the conventional approach (Fig. 7). Using the US consumption-driven deforestation emission footprints as an example, three representative regions with substantial deforestation emissions were selected: Russia (b, e), Southeast Asia (c, f), and Brazil (d, g). These regions span different climate zones and exhibit varying levels of transportation infrastructure. The spatial patterns of deforestation emission footprints in these regions show consistent characteristics. Compared with the conventional approach, the deforestation emissions estimated in this study are confined to a smaller spatial extent and exhibit a more clustered distribution, whereas those derived from the conventional approach are more broadly distributed and relatively uniform across deforested areas. Regional differences are also evident: deforestation emission footprints in Southeast Asia and Brazil are more spatially clustered than those in Russia.
4.1 Significance of mapping deforestation emissions embodied in international trade
Deforestation emissions are a significant source of greenhouse gases, making large-scale and accurate accounting crucial for mitigating these emissions. However, at this stage, fine-scale consumption-based inventories of deforestation emissions remain limited. In this study, we utilized an improved SMRIO model to map the global 1 km deforestation emission footprint for 2001–2020 from a consumption-based perspective. During this period, total deforestation emissions amounted to 124.5 Gt CO2e. Of these emissions, 39.6 Gt CO2e were embodied in international trade, accounting for 31.8 % of global deforestation emissions. The share is slightly higher than that reported for land-use emissions (27 %; Hong et al., 2022) and is comparable to the share of fossil-fuel emissions embedded in international trade (23 %–30 %; Wiedmann and Lenzen, 2018). Land-use and fossil-fuel emissions embedded in international trade have received increasing attention in climate mitigation (Hong et al., 2022; Yang et al., 2020; Wiedmann and Lenzen, 2018; Kanemoto et al., 2016). Our results suggest that deforestation emissions hidden in international trade should also receive similar attention. Accurate accounting of consumption-based deforestation is therefore essential for international climate mitigation initiatives such as REDD+ (Pendrill et al., 2019b; Lambin et al., 2018). Our previous study demonstrated that spatially explicit deforestation footprints can reveal substantial subnational heterogeneity and inequality in forest-related economic benefits (Tang et al., 2026). The gridded dataset developed in this study provides spatially explicit information that complements national-scale accounting approaches. For example, in West Africa, the dataset captures fine-scale spatial heterogeneity in deforestation emissions footprints associated with cocoa-producing regions in Côte d'Ivoire and Ghana. The gridded representation reveals localized hotspots that are not evident in nationally aggregated statistics, underscoring the value of high-resolution spatial data for informing targeted local policy interventions.
4.2 Comparisons with existing datasets
To date, several datasets of deforestation footprint have been developed in previous studies (Pendrill et al., 2019b; Henders et al., 2015). However, these datasets have significant limitations. For instance, some studies focus only on tropical forests (Henders et al., 2015), while others use accounting methods that do not fully capture detailed deforestation emissions (Pendrill et al., 2019b). In addition, many existing datasets are compiled at national scales, which limits their ability to represent spatial heterogeneity in deforestation emissions. Global deforestation footprint datasets derived from SMRIO model partially address the scale limitation. However, these datasets typically distribute footprints uniformly across producing regions, ignoring intra-country spatial heterogeneity (Hoang and Kanemoto, 2021; Yang et al., 2020). In this study, our data overcame these limitations by introducing export priority areas to spatially allocate deforestation emissions, thereby improving the spatial representation of deforestation emission footprints. By integrating spatially explicit deforestation emissions data from Harris et al. (2021), which are consistent with the annual forest loss data from Hansen et al. (2013), our dataset provides a more detailed representation of the spatial distribution of deforestation emissions and enables more precise estimation of deforestation emission footprints.
4.3 Limitations and uncertainties
Although this study provides a global fine-scale dataset of deforestation emission footprints for 2001–2020, several uncertainties should be considered when using the dataset. First, due to the lack of detailed supply-chain information, it is not possible to identify the exact export destinations of deforestation emissions at the sub-national level (Yang et al., 2020). Consequently, this study assumes equal export probabilities across regions, consistent with previous research (Yang et al., 2020). Second, this dataset includes only deforestation emissions associated with economic activities. Emissions from wildfire are excluded because they cannot be directly linked to economic drivers. Third, the temporal coverage of the dataset is constrained by the availability of input–output databases. Input-output tables typically involve significant time lags in compilation and release (He et al., 2022). In contrast, many underlying datasets used in this study, such as satellite-based deforestation observations and related drivers, are updated more frequently (Hosseiny et al., 2024; Liu et al., 2025). Once updated input-output databases become available, our dataset can be readily extended to include more recent years. Future improvements would benefit from more traceable and transparent global supply-chain data, which would enable more accurate spatial allocation of consumption-based deforestation emissions. The annual accounting approach used in this study does not explicitly capture temporal relationships between forest clearing and subsequent commodity production. Instead, annual deforestation emissions are attributed to final demand through the production–consumption linkages represented in the corresponding MRIO year.
4.4 Potential applications
This dataset provides the 1 km gridded deforestation emission footprints associated with the major consuming countries for the period 2001–2020. Compared with existing datasets, it offers a longer time series, broader spatial coverage, and higher spatial resolution, enabling detailed analyses of spatial heterogeneity of deforestation emission footprints within countries. The spatial plausibility of the dataset has been evaluated using accessibility data, demonstrating its suitability for quantitative analyses. The dataset has significant applications in climate change mitigation research from a consumer perspective, providing essential information for accounting consumption-based deforestation carbon emissions. It is also critical for designing targeted emission reduction policies in deforestation hotspot regions. In addition, the dataset can serve as input to climate and carbon cycle models to assess the contribution of consumption-driven deforestation emissions to global warming and to quantify the relative contributions of major consuming countries to cumulative CO2 emissions and associated temperature responses.
The global gridded dataset of consumption-based deforestation carbon emissions for 2001–2020 generated in this study is publicly available at https://doi.org//10.6084/m9.figshare.28091879 (Tang et al., 2024). The dataset includes annual global deforestation emission footprints associated with seven major consuming countries, along with accompanying documentation describing the dataset overview, usage notes, and limitations. The documentation is provided in a README.txt file. The dataset is provided in GeoTIFF format at a spatial resolution of 30 arcsec (approximately 1 km at the equator). Each grid cell reports annual deforestation-related carbon emissions attributed to the final consumption of specific countries.
The proportion of consumption-driven deforestation emissions is comparable to that of consumption-driven fossil fuel emissions, underscoring the importance of accounting for and mitigating these emissions. Despite their significance, detailed global datasets on consumption-based deforestation emissions remain scarce. This study presents the first time-series, gridded datasets of consumption-based deforestation emissions from 2001–2020. The dataset indicates that deforestation emissions footprint is increasing in most regions worldwide. Although the use of spatially explicit data addresses some limitations of previous datasets, uncertainties remain, particularly in the allocation of exports from individual regions. Future improvements will require more detailed and traceable supply chain information to enhance the accuracy of consumption-based deforestation emission datasets.
DT: Conceptualization, Methodology, Software, Formal analysis, Visualization, Writing – Original Draft. YY: Conceptualization, Writing – Review and Editing, Funding acquisition. RL: Resources, Writing – Review and Editing, XL: Conceptualization, Writing – Review and Editing, Supervision, Funding acquisition.
At least one of the (co-)authors is a member of the editorial board of Earth System Science Data. The peer-review process was guided by an independent editor, and the authors also have no other competing interests to declare.
Publisher's note: Copernicus Publications remains neutral with regard to jurisdictional claims made in the text, published maps, institutional affiliations, or any other geographical representation in this paper. The authors bear the ultimate responsibility for providing appropriate place names. Views expressed in the text are those of the authors and do not necessarily reflect the views of the publisher.
We thank the institutions and research teams that made the datasets used in this study openly available. We also thank the anonymous reviewers and the topical editor for their constructive comments.
This research has been supported by the National Natural Science Foundation of China, Key Programme (grant no. 42130107), the National Natural Science Foundation of China, Youth Science Fund Project (grant no. 42501514), and the National Natural Science Foundation of China (grant no. 42371410).
This paper was edited by Francesco N. Tubiello and reviewed by two anonymous referees.
Cook-Patton, S. C., Leavitt, S. M., Gibbs, D., Harris, N. L., Lister, K., Anderson-Teixeira, K. J., Briggs, R. D., Chazdon, R. L., Crowther, T. W., Ellis, P. W., Griscom, H. P., Herrmann, V., Holl, K. D., Houghton, R. A., Larrosa, C., Lomax, G., Lucas, R., Madsen, P., Malhi, Y., Paquette, A., Parker, J. D., Paul, K., Routh, D., Roxburgh, S., Saatchi, S., van den Hoogen, J., Walker, W. S., Wheeler, C. E., Wood, S. A., Xu, L., and Griscom, B. W.: Mapping carbon accumulation potential from global natural forest regrowth, Nature, 585, 545–550, https://doi.org/10.1038/s41586-020-2686-x, 2020.
Curtis, P. G., Slay, C. M., Harris, N. L., Tyukavina, A., and Hansen, M. C.: Classifying drivers of global forest loss, Science, 361, 1108–1111, https://doi.org/10.1126/science.aau3445, 2018.
DeFries, R. S., Rudel, T., Uriarte, M., and Hansen, M.: Deforestation driven by urban population growth and agricultural trade in the twenty-first century, Nat. Geosci., 3, 178–181, https://doi.org/10.1038/ngeo756, 2010.
FAO: Global Forest Resources Assessment, Rome, https://doi.org/10.4060/cd6709en, 2025.
Friedlingstein, P., O'Sullivan, M., Jones, M. W., Andrew, R. M., Bakker, D. C. E., Hauck, J., Landschützer, P., Le Quéré, C., Luijkx, I. T., Peters, G. P., Peters, W., Pongratz, J., Schwingshackl, C., Sitch, S., Canadell, J. G., Ciais, P., Jackson, R. B., Alin, S. R., Anthoni, P., Barbero, L., Bates, N. R., Becker, M., Bellouin, N., Decharme, B., Bopp, L., Brasika, I. B. M., Cadule, P., Chamberlain, M. A., Chandra, N., Chau, T.-T.-T., Chevallier, F., Chini, L. P., Cronin, M., Dou, X., Enyo, K., Evans, W., Falk, S., Feely, R. A., Feng, L., Ford, D. J., Gasser, T., Ghattas, J., Gkritzalis, T., Grassi, G., Gregor, L., Gruber, N., Gürses, Ö., Harris, I., Hefner, M., Heinke, J., Houghton, R. A., Hurtt, G. C., Iida, Y., Ilyina, T., Jacobson, A. R., Jain, A., Jarníková, T., Jersild, A., Jiang, F., Jin, Z., Joos, F., Kato, E., Keeling, R. F., Kennedy, D., Klein Goldewijk, K., Knauer, J., Korsbakken, J. I., Körtzinger, A., Lan, X., Lefèvre, N., Li, H., Liu, J., Liu, Z., Ma, L., Marland, G., Mayot, N., McGuire, P. C., McKinley, G. A., Meyer, G., Morgan, E. J., Munro, D. R., Nakaoka, S.-I., Niwa, Y., O'Brien, K. M., Olsen, A., Omar, A. M., Ono, T., Paulsen, M., Pierrot, D., Pocock, K., Poulter, B., Powis, C. M., Rehder, G., Resplandy, L., Robertson, E., Rödenbeck, C., Rosan, T. M., Schwinger, J., Séférian, R., Smallman, T. L., Smith, S. M., Sospedra-Alfonso, R., Sun, Q., Sutton, A. J., Sweeney, C., Takao, S., Tans, P. P., Tian, H., Tilbrook, B., Tsujino, H., Tubiello, F., van der Werf, G. R., van Ooijen, E., Wanninkhof, R., Watanabe, M., Wimart-Rousseau, C., Yang, D., Yang, X., Yuan, W., Yue, X., Zaehle, S., Zeng, J., and Zheng, B.: Global Carbon Budget 2023, Earth Syst. Sci. Data, 15, 5301–5369, https://doi.org/10.5194/essd-15-5301-2023, 2023.
Friis, C. and Nielsen, J. Ø.: Telecoupling: Exploring land-use change in a globalised world, Palgrave Studies in Natural Resource Management, Springer, Switzerland, https://doi.org/10.1007/978-3-030-11105-2, 2019.
Gries, T., Naudé, W., and Matthee, M.: The optimal distance to port for exporting firms, J. Regional Sci., 49, 513–528, https://doi.org/10.1111/j.1467-9787.2008.00599.x, 2009.
Hansen, M. C., Potapov, P. V., Moore, R., Hancher, M., Turubanova, S. A., Tyukavina, A., Thau, D., Stehman, S. V., Goetz, S. J., Loveland, T. R., Kommareddy, A., Egorov, A., Chini, L., Justice, C. O., and Townshend, J. R.: High-resolution global maps of 21st-century forest cover change, Science, 342, 850–853, https://doi.org/10.1126/science.1244693, 2013.
Harris, N. L., Gibbs, D. A., Baccini, A., Birdsey, R. A., de Bruin, S., Farina, M., Fatoyinbo, L., Hansen, M. C., Herold, M., Houghton, R. A., Potapov, P. V., Suarez, D. R., Roman-Cuesta, R. M., Saatchi, S. S., Slay, C. M., Turubanova, S. A., and Tyukavina, A.: Global maps of twenty-first century forest carbon fluxes, Nat. Clim. Change, 11, 234–240, https://doi.org/10.1038/s41558-020-00976-6, 2021.
He, K., Mi, Z., Coffman, D. M., and Guan, D.: Using a linear regression approach to sequential interindustry model for time-lagged economic impact analysis, Struct. Change Econ. D., 62, 399–406, https://doi.org/10.1016/j.strueco.2022.03.017, 2022.
Henders, S., Persson, U. M., and Kastner, T.: Trading forests: land-use change and carbon emissions embodied in production and exports of forest-risk commodities, Environ. Res. Lett., 10, 125012, https://doi.org/10.1088/1748-9326/10/12/125012, 2015.
Hoang, N. T. and Kanemoto, K.: Mapping the deforestation footprint of nations reveals growing threat to tropical forests, Nat. Ecol. Evol., 5, 845–853, https://doi.org/10.1038/s41559-021-01417-z, 2021.
Hochard, J. and Barbier, E.: Market accessibility and economic growth: Insights from a new dimension of inequality, World Dev., 97, 279–297, https://doi.org/10.1016/j.worlddev.2017.04.018, 2017.
Hong, C., Zhao, H., Qin, Y., Burney, J. A., Pongratz, J., Hartung, K., Liu, Y., Moore, F. C., Jackson, R. B., Zhang, Q., and Davis, S. J.: Land-use emissions embodied in international trade, Science, 376, 597–603, https://doi.org/10.1126/science.abj1572, 2022.
Hosseiny, B., Zaboli, M., and Homayouni, S.: Forest Change Mapping using Multi-Source Satellite SAR, Optical, and LiDAR Remote Sensing Data, ISPRS Annals of the Photogrammetry, Remote Sensing and Spatial Information Sciences, 163–168, https://doi.org/10.5194/isprs-annals-X-4-2024-163-2024, .
Kanemoto, K., Moran, D., and Hertwich, E. G.: Mapping the Carbon Footprint of Nations, Environ. Sci. Technol., 50, 10512–10517, https://doi.org/10.1021/acs.est.6b03227, 2016.
Lambin, E. F., Gibbs, H. K., Heilmayr, R., Carlson, K. M., Fleck, L. C., Garrett, R. D., le Polain de Waroux, Y., McDermott, C. L., McLaughlin, D., Newton, P., Nolte, C., Pacheco, P., Rausch, L. L., Streck, C., Thorlakson, T., and Walker, N. F.: The role of supply-chain initiatives in reducing deforestation, Nat. Clim. Change, 8, 109–116, https://doi.org/10.1038/s41558-017-0061-1, 2018.
Lenzen, M., Moran, D., Kanemoto, K., and Geschke, A.: Building Eora: a global multi-region input-output database at high country and sector resolution, Econ. Syst. Res., 25, 20–49, https://doi.org/10.1080/09535314.2013.769938, 2013.
Lenzen, M., Sun, Y.-Y., Faturay, F., Ting, Y.-P., Geschke, A., and Malik, A.: The carbon footprint of global tourism, Nat. Clim. Change, 8, 522–528, https://doi.org/10.1038/s41558-018-0141-x, 2018.
Liu, W., Zhang, X., Zhao, T., Wang, J., Li, Z., and Liu, L.: Revealing the proximate drivers behind global tree cover loss using multisourced remote sensing products during 2000–2020, Forest Ecol. Manag., 579, https://doi.org/10.1016/j.foreco.2025.122501, 2025.
Liu, X., Zhang, J., Zhang, H., Tang, D., Hu, G., and Li, X.: China's Mismatch of Public Awareness and Biodiversity Threats under Economic Trade, Environ. Sci. Technol., 56, 9784–9796, https://doi.org/10.1021/acs.est.2c00844, 2022.
Meijer, J. R., Huijbregts, M. A. J., Schotten, K. C. G. J., and Schipper, A. M.: Global patterns of current and future road infrastructure, Environ. Res. Lett., 13, 064006, https://doi.org/10.1088/1748-9326/aabd42, 2018.
Moran, D., Giljum, S., Kanemoto, K., and Godar, J.: From Satellite to Supply Chain: New Approaches Connect Earth Observation to Economic Decisions, One Earth, 3, 5–8, https://doi.org/10.1016/j.oneear.2020.06.007, 2020.
Nelson, A., Weiss, D. J., van Etten, J., Cattaneo, A., McMenomy, T. S., and Koo, J.: A suite of global accessibility indicators, Sci. Data, 6, 266, https://doi.org/10.1038/s41597-019-0265-5, 2019.
Pendrill, F., Persson, U. M., Godar, J., and Kastner, T.: Deforestation displaced: trade in forest-risk commodities and the prospects for a global forest transition, Environ. Res. Lett., 14, 055003, https://doi.org/10.1088/1748-9326/ab0d41, 2019a.
Pendrill, F., Persson, U. M., Godar, J., Kastner, T., Moran, D., Schmidt, S., and Wood, R.: Agricultural and forestry trade drives large share of tropical deforestation emissions, Global Environ. Chang., 56, 1–10, https://doi.org/10.1016/j.gloenvcha.2019.03.002, 2019b.
Souza Jr., C.: Assessing the scale of rubber deforestation in southeast Asia, Nature, 623, 256–257, https://doi.org/10.1038/d41586-023-03153-9, 2023.
Tang, D., Yao, Y., Li, R., and Li, X.: Consumption-based Carbon Emissions for Deforestation (2001–2020), figshare [data set], https://doi.org/10.6084/m9.figshare.28091879, 2024.
Tang, D., Yao, Y., Shi, H., Xu, Y., Liu, X., Gao, M., Xie, B., and Li, X.: High-resolution mapping of global deforestation footprints and livelihood inequalities: Toward equitable forest governance, Land Use Policy, 171, 108281, https://doi.org/10.1016/j.landusepol.2026.108281, 2026.
Tubiello, F. N., Branthomme, A., Obli-Laryea, G., Piccoli, M., Ramadan, N., Condor, R. D., Wanner, N., Brivio, R., Jonsson, Ö., Conchedda, G., and Pekkarinen, A.: FAO estimates of net forest emissions and removals, 1990–2025, Earth Syst. Sci. Data, 18, 6799–6813, https://doi.org/10.5194/essd-18-6799-2026, 2026.
Verburg, P. H., Ellis, E. C., and Letourneau, A.: A global assessment of market accessibility and market influence for global environmental change studies, Environ. Res. Lett., 6, 034019, https://doi.org/10.1088/1748-9326/6/3/034019, 2011.
Wang, Y., Hollingsworth, P. M., Zhai, D., West, C. D., Green, J. M. H., Chen, H., Hurni, K., Su, Y., Warren-Thomas, E., Xu, J., and Ahrends, A.: High-resolution maps show that rubber causes substantial deforestation, Nature, 623, 340–346, https://doi.org/10.1038/s41586-023-06642-z, 2023.
Weiss, D. J., Nelson, A., Gibson, H. S., Temperley, W., Peedell, S., Lieber, A., Hancher, M., Poyart, E., Belchior, S., Fullman, N., Mappin, B., Dalrymple, U., Rozier, J., Lucas, T. C. D., Howes, R. E., Tusting, L. S., Kang, S. Y., Cameron, E., Bisanzio, D., Battle, K. E., Bhatt, S., and Gething, P. W.: A global map of travel time to cities to assess inequalities in accessibility in 2015, Nature, 553, 333–336, https://doi.org/10.1038/nature25181, 2018.
Wiedmann, T. and Lenzen, M.: Environmental and social footprints of international trade, Nat. Geosci., 11, 314–321, https://doi.org/10.1038/s41561-018-0113-9, 2018.
Yang, Y., Qu, S., Cai, B., Liang, S., Wang, Z., Wang, J., and Xu, M.: Mapping global carbon footprint in China, Nat. Commun., 11, 2237, https://doi.org/10.1038/s41467-020-15883-9, 2020.