the Creative Commons Attribution 4.0 License.
the Creative Commons Attribution 4.0 License.
 | 16 Nov 2026
Mapping 20-years winter wheat dynamics in global primary planting areas using Gaussian mixture models with adaptive thresholds
Yanan Wen
Tuo Chen

Tiecheng Bai
Ke Yao
Liheng Zhong
Han Chen
Meiling Liu
Xieqin Huang
Shunlin Liang
Shuangxi Miao
Jianxi Huang
Understanding the spatiotemporal dynamics of winter wheat is essential for ensuring global food security. Currently, limited research has focused on the global dynamics of wheat over the past decades. In this study, we propose a novel framework to map fractional winter wheat dynamics from 2001 to 2020 at 1 km resolution in key global planting areas from MODIS satellite data, utilizing a flexible Gaussian mixture model (GMM). We first created the stratified samples of winter wheat fractions at 1 km resolution from multiple public crop datasets to establish the training base, and then developed a robust random forest regression model using MODIS surface reflectance to map regional fractional distributions of winter wheat. Subsequently, we estimated the actual wheat cover fractions across different regions and years by analyzing crop mixtures within 1° × 1° grids with GMM. The model parameters were utilized to determine optimal thresholds for winter wheat extraction. The performance of our proposed framework was evaluated spatially and temporally, revealing significant insights into global winter wheat dynamics. Results demonstrated that our mapping approach aligns closely with existing local winter wheat maps and statistical data, achieving annual coefficients of determination (R2) above 0.81 with FAO statistics in primary planting regions and exceeding 0.72 at subnational scales. We present the first comprehensive effort to map global winter wheat distribution and dynamics from 2001 to 2020 at a near-global scale. The proposed framework is readily adaptable to other major crops and demonstrates strong agreement with existing maps and statistical records. The resulting high-resolution global winter wheat map series provides valuable inputs for global crop modelling and contributes to achieving the “Zero Hunger”. The product is publicly available at https://doi.org/10.6084/m9.figshare.32149033 (Wen et al., 2026).
- Article
(8949 KB) - Full-text XML
-
Supplement
(1351 KB) - BibTeX
- EndNote


As one of the world's most important cereal crops, wheat plays a crucial role in global food security and the sustainability of agricultural systems. Ongoing population growth and the increasing frequency of extreme weather events are intensifying pressures on cropland systems, posing substantial challenges to global food production (Blickensdörfer et al., 2022; Yang et al., 2023). Among wheat types, winter wheat exerts a preponderant influence on the global production landscape, encompassing a substantial proportion of the total harvested wheat area, estimated to exceed three-quarters (Jiang et al., 2022; Wójcik-Gront, 2018). For example, winter wheat contributes approximately 70 %–80 % of total wheat production in the United States (Ren et al., 2019) and more than 95 % in China and Ukraine (Júnior et al., 2022; Zhang et al., 2022b). Globally, winter wheat cultivation exhibits strong spatial heterogeneity and long-term variability due to differences in climatic conditions, farm size, and field fragmentation (Zhang et al., 2019). Mapping the long-term dynamics of winter wheat globally for agricultural activities (e.g., early warning of global food crises, agricultural land optimization, and sustainable decision-making) is extremely challenging yet critically important (Hunt et al., 2019; Nelson and Burchfield, 2021).
The development of new sensors and satellite platforms has greatly improved the efficiency and accuracy of crop mapping using remote sensing techniques (Ashourloo et al., 2022). However, efficiently compositing time-series observations to extract key phenological information during crop growth remains challenging because of frequent cloud contamination and the relatively long revisit intervals of sensors such as Landsat (Zhu et al., 2022). Despite the relatively short revisit cycle for Sentinel-2 data (i.e., 5 d), its relatively short period and spatial resolution variation make it difficult to apply widely in long-term crop mapping (Kathirvelu et al., 2023). Over past decades, the Moderate Resolution Imaging Spectroradiometer (MODIS) data has been widely applied for crop mapping and its dynamics at a large scale (Zhong et al., 2019). Notably, MODIS images with the high temporal availability, can capture the spectral dynamics of crop types across the entire growth period, enabling retrieval of subtle but crucial phenological information across different growth stages (Huang et al., 2022; Qu et al., 2021).
Only limited efforts have mapped crop dynamics at large spatial scales, particularly using satellite observations at spatial resolutions of 250–1000 m. This is because mixed-pixel disturbance and spectral confusion within crop regions may affect mapping performance (Zhang et al., 2021). For example, winter wheat exhibits spectral and phenological similarities to other winter cereals (e.g., winter barley and winter rye) in Europe, as well as winter rapeseed and winter garlic in China (Fu et al., 2025; Liu et al., 2024; Tian et al., 2024; Yang et al., 2025a). Such confusion is typically more pronounced during the vegetative growth stage, especially from emergence and tillering to green-up and stem elongation, as crops display similar green-canopy traits and growth patterns over time (Akanbi et al., 2024). More specifically, spectral confusion between winter wheat and other winter cereals may persist until the heading stage, whereas winter garlic may exhibit spectral and phenological patterns similar to those of winter wheat throughout much of the growing season.
To mitigate such a problem, model-driven approaches (e.g., linear and nonlinear models) and data-driven approaches are widely employed through decomposing crop spectral signals (Wang et al., 2015); as such, fractional information is more reliable than binary pixels, especially at relatively coarse resolution. Although several fractional mapping models (e.g., linear spectral mixture models, multiple endmember-based approaches, and regression methods based on machine learning technology) have been developed with relatively good performance at regional scales (Ghaffari et al., 2017; Kathirvelu et al., 2023), they are inapplicable to support large-scale applications, due to spectral variability within and among different crop types. Fortunately, the Gaussian Mixture Model (GMM) offers a probabilistic interpretation with sufficiently smooth identification boundaries, enabling mapping reliable crop dynamics (Wang et al., 2019). Moreover, the GMM demonstrates excellent spectrum unmixing capabilities for coarse resolution satellite observations (Chen et al., 2018). However, most studies about crop monitoring based on the GMM have been limited to cluster and area estimation for different crop types (You et al., 2023), and few studies have been directly used to investigate large-scale crop dynamics across space and time (Harshvardhan et al., 2020).
Although several global and national datasets of crop extent with temporal and spatial dynamics have been proposed (Dong et al., 2020a; Shen et al., 2025), few studies have directly mapped crop fractions. Currently, crop type maps use only binary maps (e.g., wheat and non-wheat) to represent single crop distribution across time and space (Ghassemi et al., 2022). Most fractional maps of crops in agricultural practices are mainly aggregated from high resolution maps (e.g., 10 to 30 m), which is difficult to implement at the global scale and across multiple years (Ma et al., 2019; Rufin et al., 2022), to support analyses such as agricultural status (e.g., cropland expansion, fallow, and crop distribution patterns). Therefore, crop fraction map is critical to comprehensively understand temporal and spatial differences within and among homogeneous crop pixels, and further to effectively reduce uncertainty of fragmented and complex agricultural production structures (Hu et al., 2021). In addition, crop fraction map can be set as input parameters to support global crop growth model (e.g., APSIM) to improve model simulation ability (Hao et al., 2021).
Here, we developed a framework using gaussian parameter regression strategy to generate large-scale and long-term winter wheat fraction maps at the global scale, at 1 km resolution and spanning from 2001 to 2020. We derived fractional wheat samples from existing knowledge, i.e., publicly available winter wheat datasets at relatively fine resolution, and further developed a regression model using MODIS surface reflectance to map fractional distributions of winter wheat. Subsequently, we utilized a gaussian parameter-based method for the estimation of the optimal threshold from the estimated fractional maps. Finally, we assessed the mapping performance from spatial and temporal perspectives using multiple crop cover datasets and official statistics. Our fractional mapping framework bridges the critical gap between temporally inconsistent high-resolution binary maps and coarse-resolution mixed pixels. It delivers a long-term, spatially continuous, and sub-pixel-accurate benchmark for global winter wheat dynamics, maximizing its potential for regional crop yield modelling, climate impact assessment, and agricultural policy decision-making.
2.1 Study area
To capture global winter wheat dynamics, we selected 53 countries representing the main winter wheat cultivation regions (Fig. 1). To collect sufficient samples of winter wheat proportion across different countries, we divided these countries into two parts (i.e., pink and blue regions in Fig. 1) regarding available winter wheat datasets (e.g., the winter wheat classification datasets and yield data). Here, the region included in our analysis represents most of global wheat cultivation, encompassing about 92 % of the harvested areas and 93 % of global production (FAOSTAT, 2025).

Figure 1The primary planted areas of winter wheat in our study, including Asia, Europe, Oceania, North America, and South America.
2.2 Datasets
We adopted daily MOD09GA v061 images as our primary dataset, spanning from 2001 to 2020, to map the dynamics of winter wheat in a form of fraction. Specifically, we used all available MOD09GA v061 surface reflectance images to better capture the seasonal dynamics of winter wheat (Ding et al., 2022), with seven calibrated daily spectral bands and spatial resolutions of 500 m, of which the atmospheric effect has been corrected. Rather than applying a universal timeline, we adjusted the 12-month processing window to align with crop calendars – setting the timeline from September to August of the following year for the Northern Hemisphere and from April to March for the Southern Hemisphere to cover the full winter wheat growth cycle. In addition, we identified and masked cloud, cloud shadow, aerosol, and snow observations by using the pixel quality assurance (QA) layer to retain only valid observations. We computed the 5th, 50th, and 95th percentiles of valid observations for each spectral band monthly, using these as the spectral-temporal features.
We used four crop type datasets to collect winter wheat samples with proportion information. The Cropland Data Layer (CDL) was produced by the National Agricultural Statistics Service (NASS) in the United States Department of Agriculture (USDA) at 30 m resolution, which provides annual crop cover from 2008 with mean accuracies exceeding 95 % (USDA-NASS, 2025). For Canada, the Agriculture and Agri-Food Canada (AAFC) provides an Annual Crop Inventory (ACI) product using high-resolution remotely sensed imagery, to depict national crop cover at a 30 m resolution from 2011 to present (AAFC, 2025). The EUCROPMAP product offers detailed spatial information of 19 crop types across Europe (EU) in 2018 with 10 m resolution and high accuracy (d'Andrimont et al., 2026; Shao et al., 2023). In addition, Dong et al. (2020a) generated the China winter wheat maps at 30 m resolution with high accuracy. To characterize the winter wheat fractional changes at the pixel scale (i.e., 1 km), we aggregated 10 and 30 m binary winter wheat maps into 1 km winter wheat fractional maps. We utilized all acquired winter wheat proportion samples to construct the regression model for estimating their wheat proportions. Besides, they were also used to derive locally optimal thresholds using parameters from GMM.
In addition, we also collected global winter wheat yield data (i.e., GlobalWheatYield4km) as a reference for countries where winter wheat datasets were not available (Zhang et al., 2024). The GlobalWheatYield4km dataset provides pixel-level yield information of spring and winter wheat at a 4 km resolution. We aggregated 4 km binary winter wheat maps into the 10 km fractional maps to collect proportion samples. Given that the GlobalWheatYield4km data covers the whole period over the past two decades, here we temporally extended the extracted winter wheat samples from 2020 to other years. Moreover, we collected cultivated acreage statistics data from the Food and Agriculture Organization (FAO) to validate our mapping results. Specifically, we utilized the crop acreage of wheat from the Crops and Livestock Products at the country level to validate our temporal and spatial results from 2001 to 2020 (FAOSTAT, 2025).
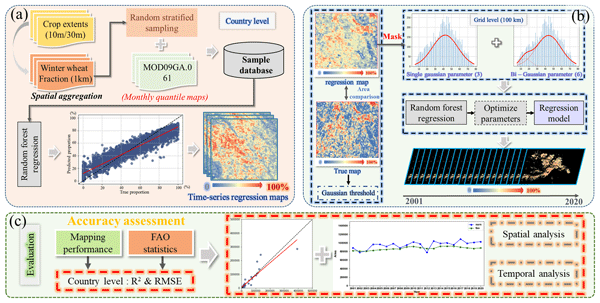
We presented a framework for capturing the long-term and large-scale dynamics of winter wheat across key producing regions worldwide (Fig. 2). First, using collected winter wheat samples in each country, we estimated the fraction of winter wheat within each 1 km resolution over past decades (Fig. 2a). These winter wheat samples derived from proportion maps aggregated by crop type map, using the random stratified sampling approach. Then, we identified the winter wheat dynamics with estimated locally optimal thresholds, using multiple gaussian curve parameters across time and space (Fig. 2b). Specifically, we extracted gaussian parameters by decomposing gaussian curves, and these parameters served as inputs to estimate the locally optimal thresholds within each 100 km grid. Finally, we assessed the mapping performance across spatial and temporal perspectives using multiple datasets from various sources (i.e., publicly available crop datasets and official statistics) (Fig. 2c).

Figure 2The methodology of winter wheat mapping with gaussian parameter regression strategy, including the generation of regression proportion map from the winter wheat products (a), the estimation of locally optimal thresholds using gaussian parameters (b), and the temporal and spatial evaluation of mapping performance (c).
3.1 Generating regressed fraction maps of winter wheat
We generated fractional maps of winter wheat using the robust random forest regression model in each country (Fig. 3) with 252 predictors (Table S1 in the Supplement). Due to their high spatial resolution or long-term data availability, several crop datasets, i.e., CDL (Borrelli et al., 2023), EUCROPMAP (Hao et al., 2020), China winter wheat maps (Dong et al., 2020a), and GlobalWheatYield4km (Zhao et al., 2023), have been widely utilized in agricultural fields. First, we adopted these data to extract reliable training samples for winter wheat with true fraction references using a random stratified sampling algorithm. In our study area, we first aggregated binary maps with fine spatial resolution (i.e., 10 or 30 m) of winter wheat into 1 km using the mean filter to generate the fractional map, which represents the proportion of winter wheat within each pixel (Fig. 3a). Particularly, in regions where crop data are unavailable (e.g., India, Australia, and Brazil), we aggregated the 4 km GlobalWheatYield4km dataset to 10 km and incorporated them as ancillary data for deriving fractional samples. Then, we used a random stratified sampling scheme to collect training samples for winter wheat proportion estimation in each country (Fig. 3b). Specifically, we divided each regressive map from 0 % to 100 % using the interval of 10 %, based on which an equal number of samples were randomly extracted within each category. We collected approximately 10 000 samples in total for most countries, while several smaller countries (e.g., Monaco) provided around 5000 samples due to their limited spatial extent. Finally, we mapped the winter wheat dynamics in a fractional form from 2001 to 2020 by introducing the previously developed “adaptive strategies” approach (Fig. 3c) (Wen et al., 2022), which aims to use representative samples with repeated sampling to improve the model performance. It is worth noting that this is an iterative process of training the model for robust performance. We collected representative winter wheat samples and incorporated them into the training dataset for years with relatively poor model performance. We retrained the RF model with the revised samples and iteratively expanded the training dataset to enhance its robustness across years.
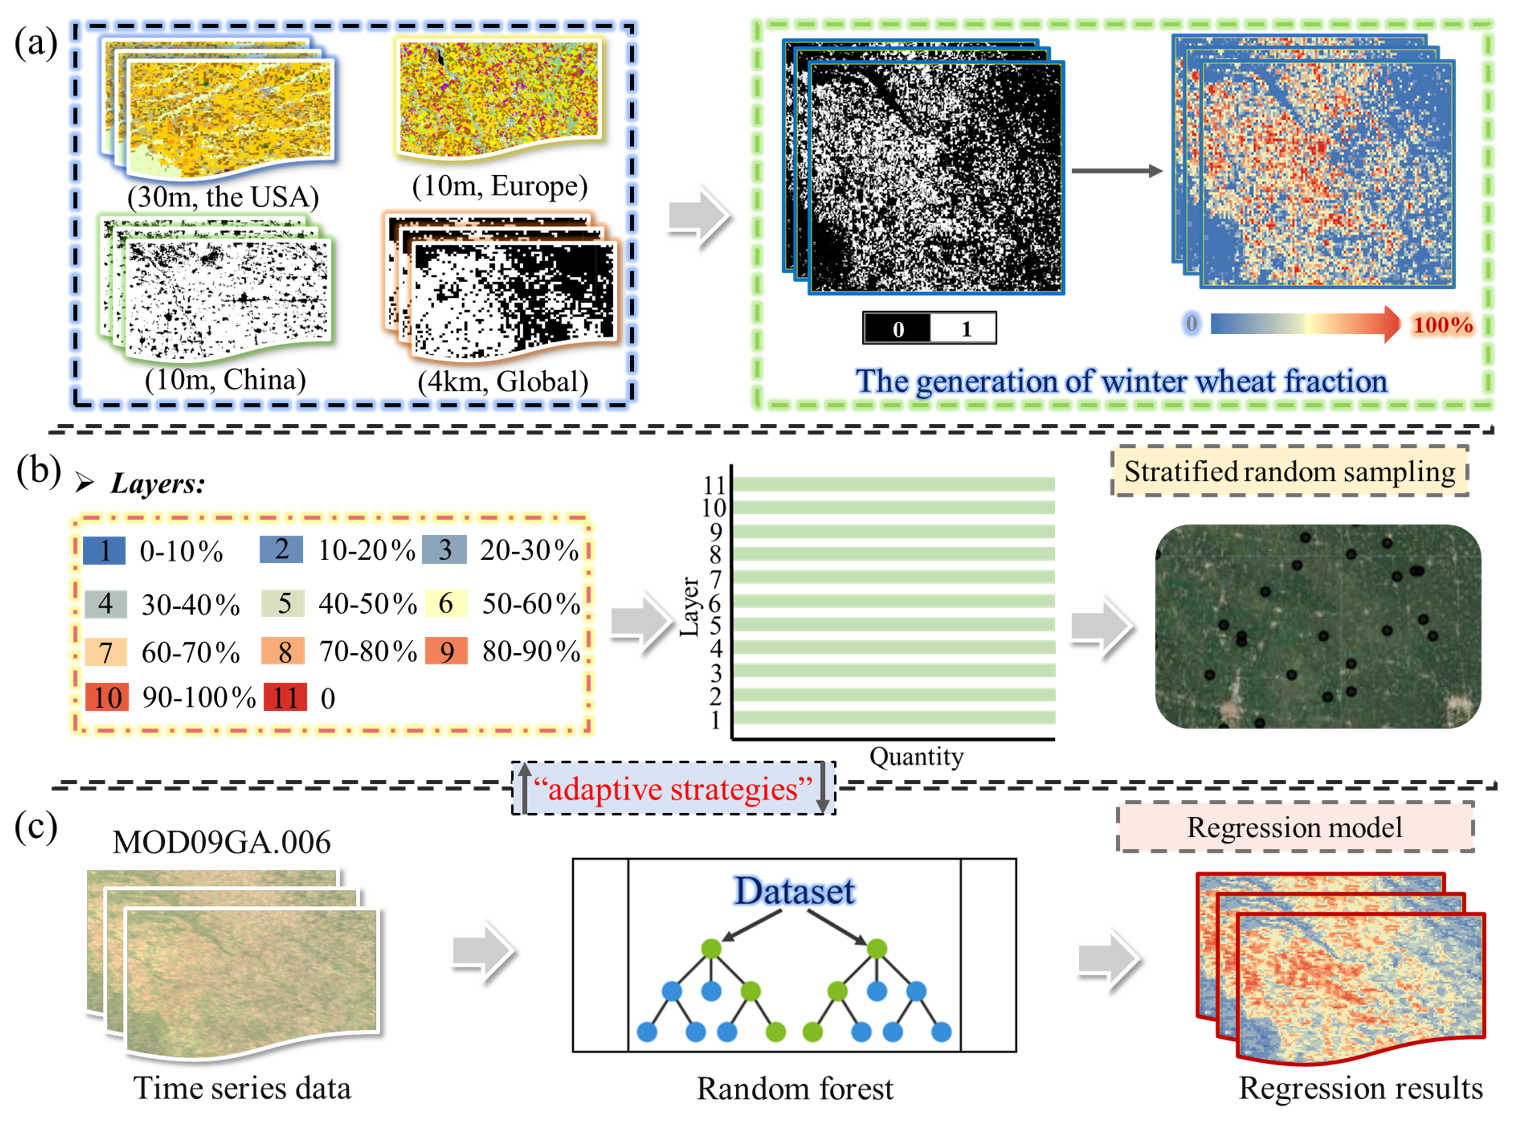
Figure 3Mapping the winter wheat fraction using samples from existing datasets, including the generation of winter wheat fraction maps (a), stratified random sampling (b), and establishment of winter wheat regression model (c).
3.2 Predicting the locally adaptive threshold using gaussian parameters
We analyzed the gaussian parameters within the 100 km (approximately 1°) grids to train the global random forest regression model regarding segmentation threshold (Fig. 4). First, we established a global seamless grid (i.e., 100 km × 100 km) for all countries in our study area, to extract gaussian parameters in the next step. Besides, we retained the cropland extent using the five available GLAD global cropland extent layers (i.e., 2003, 2007, 2011, 2015, and 2019) and selected the temporally nearest cropland layer for each mapping year to mask the non-cropland areas to reduce uncertainties (Potapov et al., 2022). It is worth noting that we utilized the 30 m GLAD cropland dataset rather than the 500 m MCD12Q1 cropland classes to more accurately delineate fragmented cropland and minimize mixed-pixel effects. In particular, we used the receiver operating characteristic (ROC) curve to derive the ROC-derived optimal threshold (balanced point) between referenced and predicted proportion maps, which is necessary to further exclude uncertain winter wheat pixels (Fig. 4b). We evaluated candidate winter wheat fraction thresholds within each 100 km grid and selected the value that maximized the difference between TPR and the FPR as the ROC-derived optimal threshold.
where is the ROC-derived optimal threshold for grid g, and TPR and FPR are the true-positive and false-positive rates at candidate threshold t.

Figure 4The estimation model of the locally adaptive threshold using gaussian parameters, including two data mask steps (a), an illustration of the gaussian parameter for each curve within each grid (b), and the locally adaptive threshold estimation corresponding to gaussian parameter within each grid (c).
We then analyzed the gaussian parameters in both the single and bi-Gaussian curves within each 100 km grid as the training features, respectively (Fig. 4b). These models show clear physical meaning regarding the dominant crop types (Guan et al., 2023). Taking the bi-Gaussian curve as an example, clear differences between the two distributions of winter wheat are observed, demonstrating the discriminative power of gaussian parameters, including the mean (μ), amplitude (A), and standard deviation (σ). The μ and A of the gaussian curve reflect the regional planting intensity and the spatial concentration of winter wheat within each 100 km grid, in which higher values of both parameters generally indicate a more dominant distribution of winter wheat in the regional cropping structure (Skakun et al., 2017). The σ characterizes the spatial heterogeneity of winter wheat distribution, where larger values are associated with greater field fragmentation and a mosaic pattern of different crops (Liu et al., 2020; Masiliūnas et al., 2021). Considering the possibility of relatively high proportion within the grids in the major planted regions of winter wheat, we also adopted the parameters derived from single gaussian function to enrich the diversity of input features. The single and bi-Gaussian models are defined as follows.
where x is the winter wheat fraction, and μ, A, and σ denote the mean, amplitude, and standard deviation, respectively.
where (μ1, A1, σ1) and (μ2, A2, σ2) describe the two Gaussian components within a 100 km grid. We applied the single and bi-Gaussian distributions to demonstrate variations in winter wheat planting structure within each grid, rather than to identify specific crop types. It is worth noting that we used two Gaussian components for each grid and applied identical parameters to them in the single Gaussian distribution to maintain consistency for threshold regression parameters.
We finally estimated the locally adaptive threshold for winter wheat proportion using these gaussian features as inputs for each grid, under which value areas are relatively consistent between referenced and predicted fractional maps (Fig. 4c). We used the gaussian parameter features to predict the locally adaptive threshold for each 100 km grid using the random forest regression model.
where Tg is the predicted locally adaptive threshold for the gth 100 km grid, Zg represents the gaussian parameter features, M is the number of trees in the RF model, and hm denotes the prediction of the mth regression tree. Specifically, we employed the locally adaptive threshold within each 100 km grid to filter the RF-predicted winter wheat proportion. The thresholding process is defined as follows.
Where and represent the final threshold-filtered winter wheat fraction and the initial RF-predicted winter wheat proportion for the ith pixel in the gth 100 km grid, and Tg is the adaptive threshold for that grid. Pixels with predicted fractions below the threshold are masked as NoData, whereas those at or above the threshold retain their original predicted proportion values. We further divided the collected samples into training (70 %) and validation (30 %) datasets here. That is, we developed the robust regression model of winter wheat identification based on training samples to estimate the locally adaptive thresholds for each local grid, while the remaining samples were used for validating threshold estimation in our study. This local adaptive thresholding strategy serves primarily as a spatial background filter to prune spurious, low-fraction noise induced by spectral mixing in non-wheat pixels. Furthermore, by accounting for global heterogeneity in field patch sizes, it avoids the systemic overestimation in fragmented landscapes or underestimation in high-density belts that a uniform global threshold would produce.
3.3 Evaluating the mapping performance
We evaluated our fractional mapping results at both the grid and country scales. At the grid scale, we used publicly available winter wheat datasets as reference data, and compared with aggregated winter wheat areas within 100 km grids to assess the performance of the gaussian parameter-based threshold estimation approach. At the country scale, we employed the Pearson correlation coefficient (R), coefficient of determination (R2), and root-mean-square error (RMSE) to evaluate the mapping performance of the derived fractional winter wheat results (Pott et al., 2021; Tran et al., 2022) with surveyed records from the FAO database at country level (https://www.fao.org/faostat/en/#data, last access: 25 August 2026). In addition, we also assessed the mapping area at the subregional and pixel scale between our mapping results and official statistics in several regions (e.g., China, the US, and EU countries). Here, pixel-level evaluation was conducted at a 5 km resolution to stabilize interannual variations from crop rotation, maintain direct spatial compatibility with gridded meteorological drivers and crop yield models (e.g., GLAM) (Becker-Reshef et al., 2018), and ensure scale robustness.
4.1 Importance of input features derived from winter wheat regression model
Both the MODIS spectral and phenological features are crucial for mapping the spatiotemporal dynamics of winter wheat fractions (Fig. 5). We measured the importance of input features to the mapping performance in the random forest regressor by summing the 5th, 50th, and 95th percentile importance scores for each band within each month, thereby better assessing the spectral-temporal characteristics of winter wheat mapping. In general, input features derived from the sixth to the tenth months of the winter wheat growing season (i.e., Green-up-jointing, Heading-grain filling, and Senescence-harvest stages) play vital roles in the mapping performance, suggesting the growing status in these stages is considerably different from other non-winter wheat types. Besides, input features such as B1, B2, and B7 are more crucial than B3, B4, B5, and B6. Specifically, B2 in the Green-up-jointing stage is the most essential feature in our study, followed by B1 in the Green-up-jointing stage and B2 in the Heading-grain filling stage (i.e., red rectangles). These two bands are important to estimate the proportion of winter wheat, probably due to the rapid changes in canopy structure and chlorophyll content during the Green-up-jointing and Heading-grain filling stages (Fan et al., 2024; Li et al., 2024). In addition, B7 is essential to winter wheat classification as its relatively high importance after the Overwintering growing stage.

Figure 5The importance of spectral-temporal features in different months to the winter wheat classification.
4.2 Winter wheat regression model
The spatial distributions between aggregated fraction maps from fine resolution (i.e., true proportion) and the regressive maps (i.e., predicted proportion) in winter wheat are relatively consistent, as illustrated in four countries (i.e., China, US, France, and Germany) (Fig. 6). We visualized the distribution of 5000 samples with fraction values in the form of frequency histogram in each country, which were derived from aggregated and regressive maps of winter wheat using stratified random sampling approach from 0 % to 100 % using the interval of 10 % to improve sample representativeness, respectively. We found there is a relatively high similarity between true and predicted proportions in China and US (Fig. 6a–b), while those in France and Germany show some fraction gaps in low-proportion distributions (i.e., 0 %–20 %) (Fig. 6c–d). This phenomenon is attributable to (1) in Western Europe, small and isolated wheat patches generate weak spectral signals surrounded by dense non-cropland features. At coarse resolutions, these weak mixed signatures resemble background noise and are subsequently masked by our local adaptive thresholding algorithm, (2) the systematic error associated with machine learning-based regression, characterized by the underestimation of high fraction values and overestimation of low fraction values (Yahiaoui et al., 2021), and (3) uncertainties arising from data quality limitations and variations in MODIS image availability over previous decades (Ren et al., 2021). In addition, we further quantified the Wasserstein distance between the true and predicted proportions, which represents the difference in their probability distributions (Naumann et al., 2026). Overall, these four countries have a low Wasserstein distance, suggesting the predicted proportions in those regions agree well with the true proportions. For example, the Wasserstein distance in China, the US, France, and Germany are 5.81, 7.85, 12.74, and 15.43, respectively.
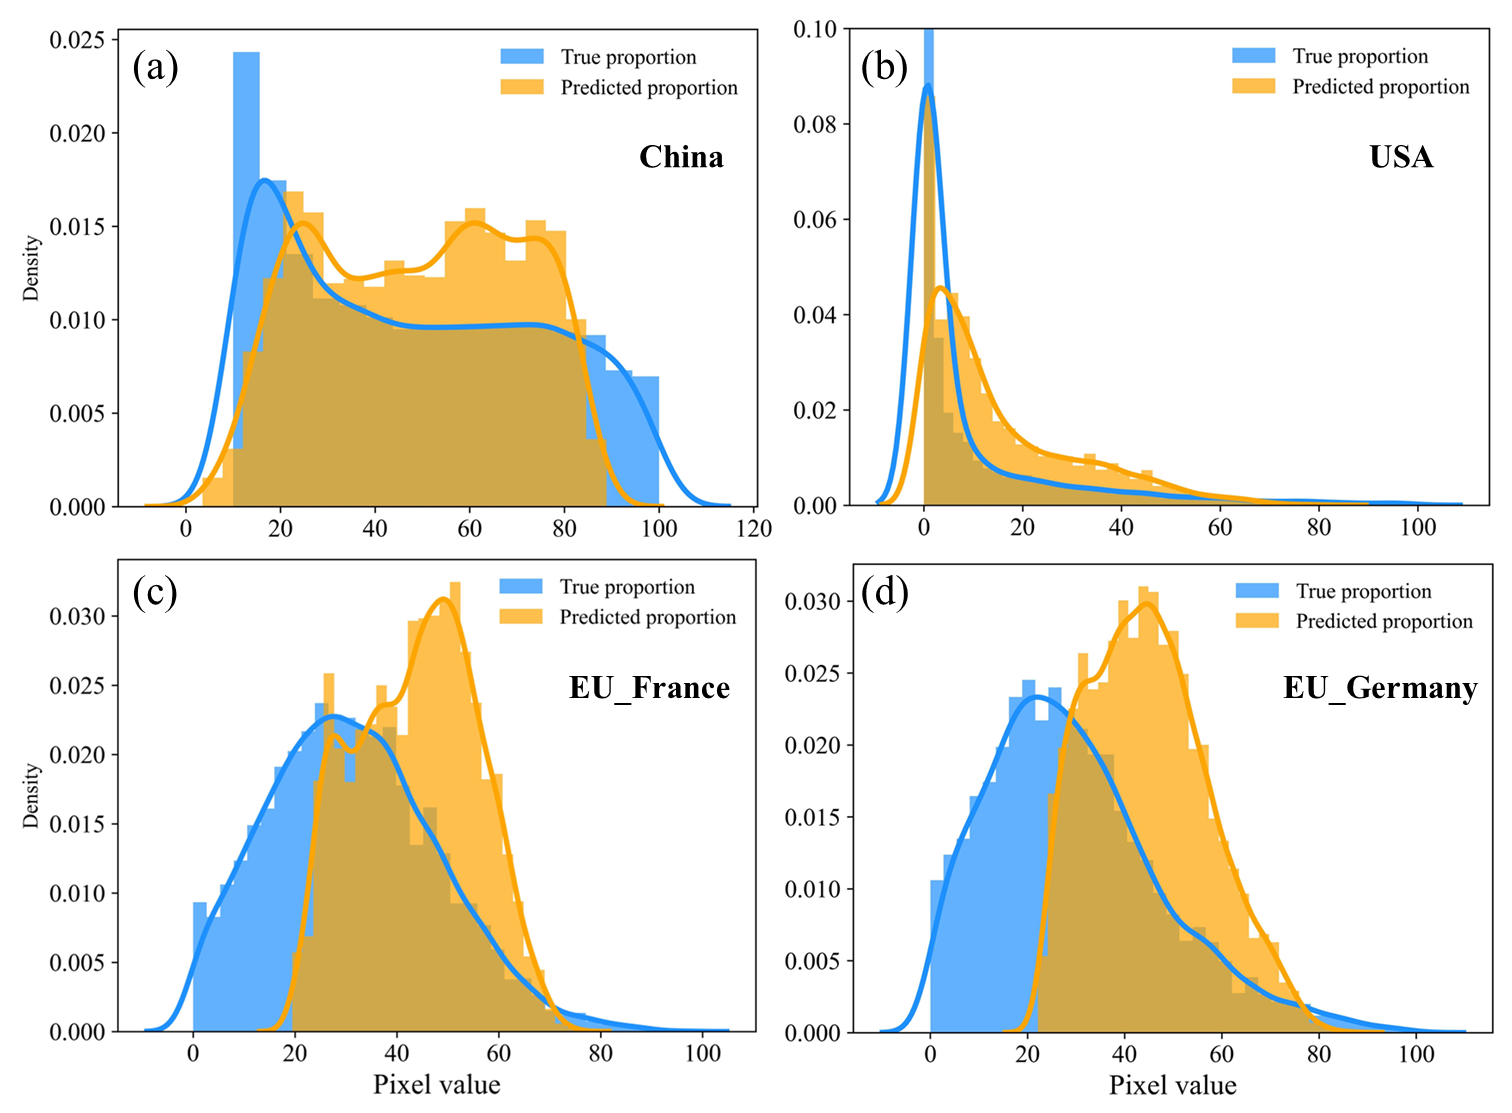
Figure 6The comparison of spatial distribution between aggregated fraction maps and regressive maps for winter wheat in China (a), the US (b), France (c), and Germany (d).
4.3 Gaussian parameter-derived optimal thresholds
We developed the robust and harmonized gaussian parameters derived optimal thresholds for winter wheat fraction map with good performance. Using the same validation dataset illustrated in Sect. 3.2, we compared the area differences of winter wheat between true and predicted proportions at 100 km grid scale, to evaluate the robustness of the model in various regions, such as China, US, and EU countries. Overall, our predicted result (i.e., yellow box) agrees well with the reference proportion (i.e., blue box) (Fig. 7), suggesting the final model can achieve optimal thresholds using gaussian derived parameters, within 100 km grids at a large scale. Besides violin plot, mean value (i.e., red rhombuses), and median (i.e., black bold lines) also show good agreement for these two fraction maps in different countries. In addition, the winter wheat area within each grid in China is commonly larger than the other two regions, indicating that there is a relatively large gap in cropping patterns in these three countries, which may be related to regionalization and varieties standardization of wheat production in China (Jin et al., 2023).

Figure 7Comparison of the derived areas using gaussian parameter derived optimal thresholds at the 100 km grid scale in China, the US, and EU countries. Blue and yellow represent the reference data and our results, respectively. The boxplots and violin plots show the area distributions. Red diamonds indicate the mean values, and black bold lines denote the median values.
We evaluated the robustness of the gaussian threshold estimation by assessing both grid-size sensitivity and spatial independence between the training and validation data. First, we conducted a sensitivity analysis to determine an appropriate grid size by comparing the R2 values of winter wheat optimal thresholds from predicted and reference fraction maps for 50, 100, and 200 km grids. The R2 values were 0.902, 0.967, and 0.972 for the 50, 100, and 200 km grids, suggesting the mapping agreement improved substantially from 50 to 100 km, whereas increasing the grid size from 100 to 200 km provides only limited improvement. Although the 200 km grid achieved the highest R2, its coarse scale might merge diverse cropping patterns and weaken the local accuracy of the gaussian-based thresholds (Xie et al., 2025). In addition, we assigned entire 100 km spatial blocks exclusively to either the training or validation dataset to reduce spatial dependence between the training and validation data. The R2 value between the predicted and reference optimal thresholds was 0.926, indicating the threshold estimation performance remained stable after reducing spatial dependence between the training and validation grids.
4.4 Accuracy assessment of winter wheat fraction maps
4.4.1 Compared with country-level FAO statistics
The comparison of our mapping results with FAO acreage statistics from 2001 to 2020 indicates that winter wheat mapping accuracies are generally high across most countries in the study region (Fig. 8). The R2 values, all above 0.81, confirm that the mapped winter wheat areas are in strong agreement with FAO statistics at the national scale. Besides, the slope between our fractional mapping results and statistics data tends to be 1, i.e., the differences in the winter wheat area of these two results are relatively small at the country scale. At the national level, our mapping results exhibit a similar annual trend to the reference data during 2001 to 2020, with the annual difference relative to the long-term mean within 10 % (Fig. S1 in the Supplement), suggesting our model can well capture the dynamics of winter wheat. Nevertheless, our mapped results of winter wheat fractions are slightly overestimated in most years (e.g., 2013 and 2019), which may be closely related to the systematic disturbance of the random forest regression model (Schwalbert et al., 2020) and the data quality (e.g., the available crop datasets and MODIS images) (Wang et al., 2020).
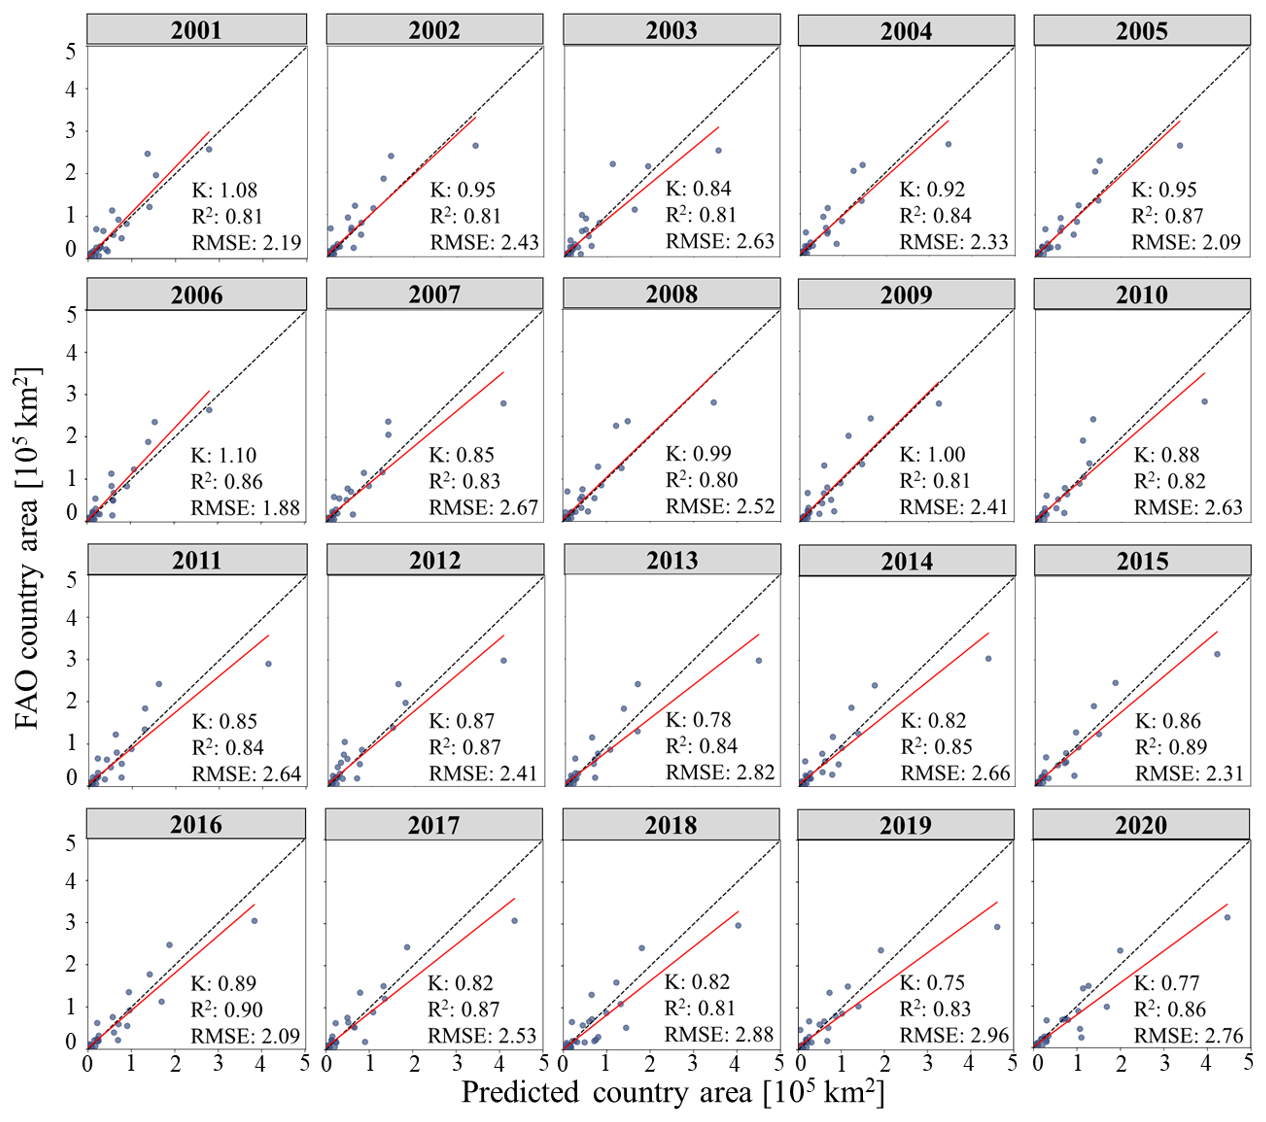
Figure 8Comparison of national-level winter wheat areas derived from our mapping results and FAO statistical data over the period 2001–2020.
4.4.2 Compared the spatial pattern with other winter wheat products
Comparing our mapped results in 2020 and the crop type datasets (i.e., CDL and the winter wheat product), most winter wheat growing regions (i.e., China and the US) of winter wheat have similar spatial distributions (Figs. 9, 10). Here, we aggregated binary winter wheat maps at finer resolution into 1 km winter wheat fractional maps, to integrate the comparison criteria to the fractional level. Our mapped results show strong agreement with the reference datasets, indicating that the fractional mapping model achieves high accuracy at a large scale. Enlarged views of three representative winter wheat growing regions are presented to further illustrate the performance of the gaussian mixture-based locally optimal threshold approach (Figs. 9c, 10c). The derived fractional mapping results for sites A–C in China and the US are close to the acquired reference fraction data, although there exists a missing phenomenon in some distribution areas with a low fraction of winter wheat. In addition, our model could also achieve relatively good performance in EU winter wheat growing countries (i.e., France, Poland, and Germany in 2018) (Fig. S2).

Figure 9Comparison of mapping performance between the existing product (a) and our mapped results, (b) for China in 2020, Panel (c) shows enlarged views for typical regions. The left images of (c) are the aggregated winter wheat map produced by Dong et al. (2020a), and the right is our result.
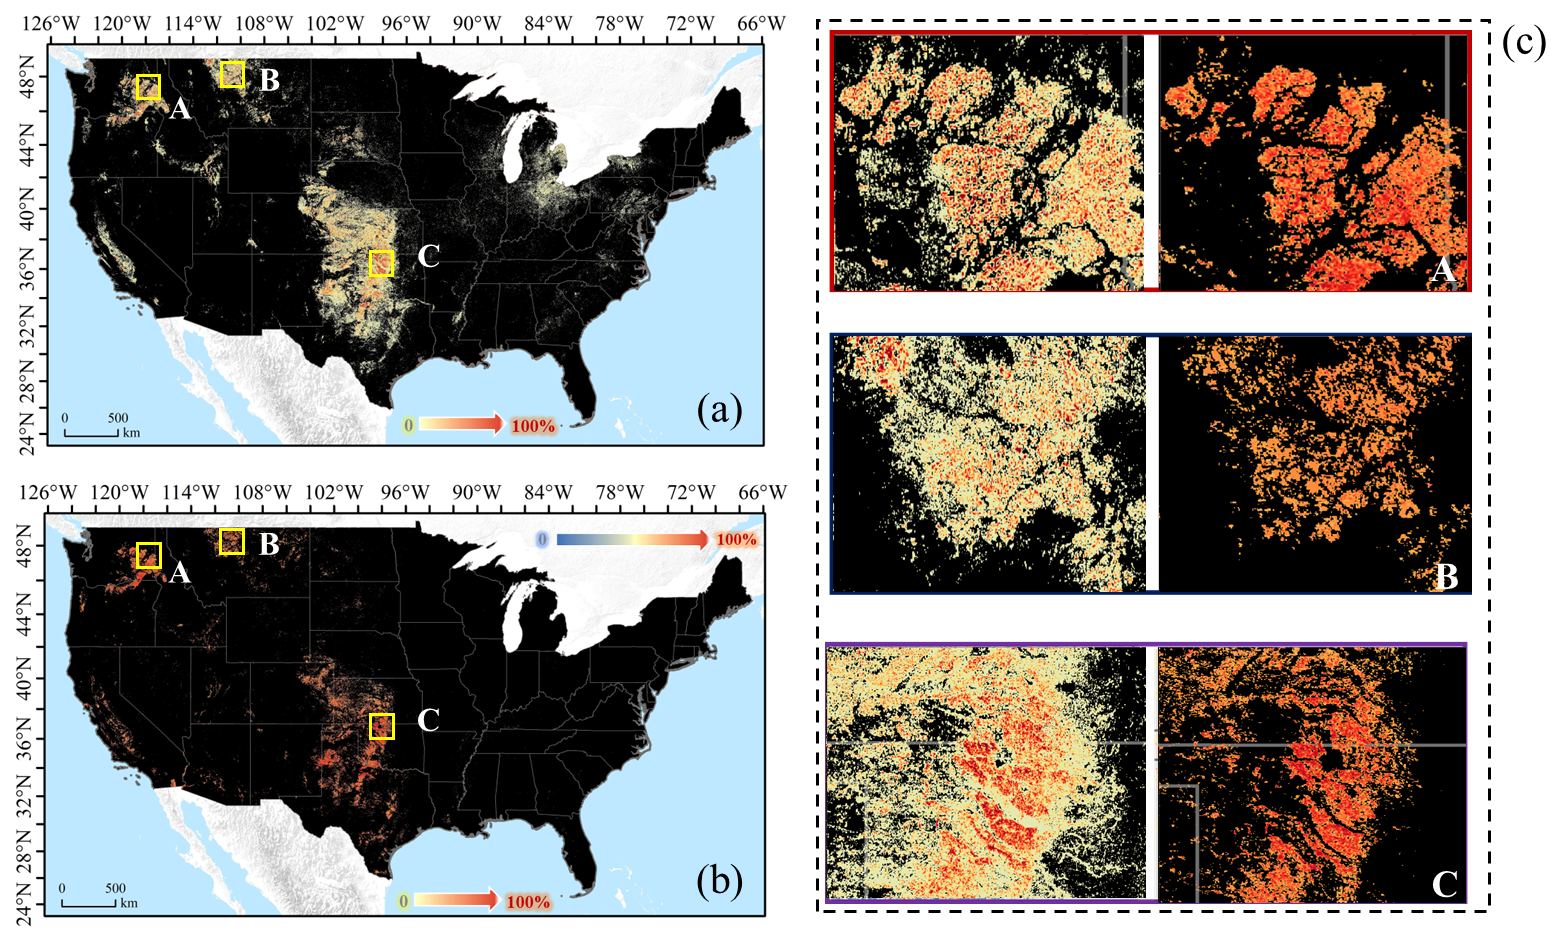
Figure 10Comparison of mapping performance between the CDL product (a) and our mapped results (b) for US in 2020. Panel (c) is enlarged views for typical regions. The left images of (c) is the aggregated winter wheat map in 1 km from CDL data (USDA-NASS, 2025), and the right is our result.
4.4.3 Compared with winter wheat products at various levels
The proposed mapping method is robust in mapping temporal winter wheat distribution dynamics at the country level. Here, we aggregated our mapped result and other winter wheat products (e.g., the 30 m winter wheat maps in China, CDL, EUCROPMAP) into 5 km (same resolution as the gridded yield data) to validate the mapping performance of our method over a long time series. The result indicated that our fractional mapping results had high accuracy in four different regions in 2018, with the mean R-value and RMSE as 0.78 and 0.04, respectively (Fig. 11). Moreover, the proposed fraction mapping framework demonstrated high accuracy in producing reliable results across different years (i.e., the mean R-value and RMSE were 0.84 and 0.05 in China from 2016 to 2020, and 0.74 and 0.04 in the US from 2008 to 2020) (Figs. S3, 4). It is worth noting that there are two distinct clusters of data points only in China from 2016 to 2020 (Figs. 11, S3), while other countries exhibit a single concentration of data points at lower values (e.g., the US from 2008 to 2020, and France, Germany, and Poland in 2018) (Figs. 11, S4). This distinct bimodal pattern in China reflects a dual agricultural structure, where high-fraction clusters correspond to large, contiguous wheat blocks in intensive agricultural basins (e.g., the North China Plain), whereas low-fraction clusters correspond to fragmented, smallholder patches in mountainous or transitional zones (Fig. S5). In contrast, intercropped crop rotation mosaics in the US generate a continuous fraction gradient, while European landscapes dominated by bordered, medium-to-small contiguous parcels produce a more localized cluster distribution. In addition, we compared our annual fractional mapping results with the ChinaWheat30L dataset from 2001 to 2020 to further assess mapping performance at the pixel scale (Yang et al., 2025a). The comparison results of R and RMSE suggested excellent adaptation and effectiveness of the proposed winter wheat proportion mapping framework across years in our study (Table S2).
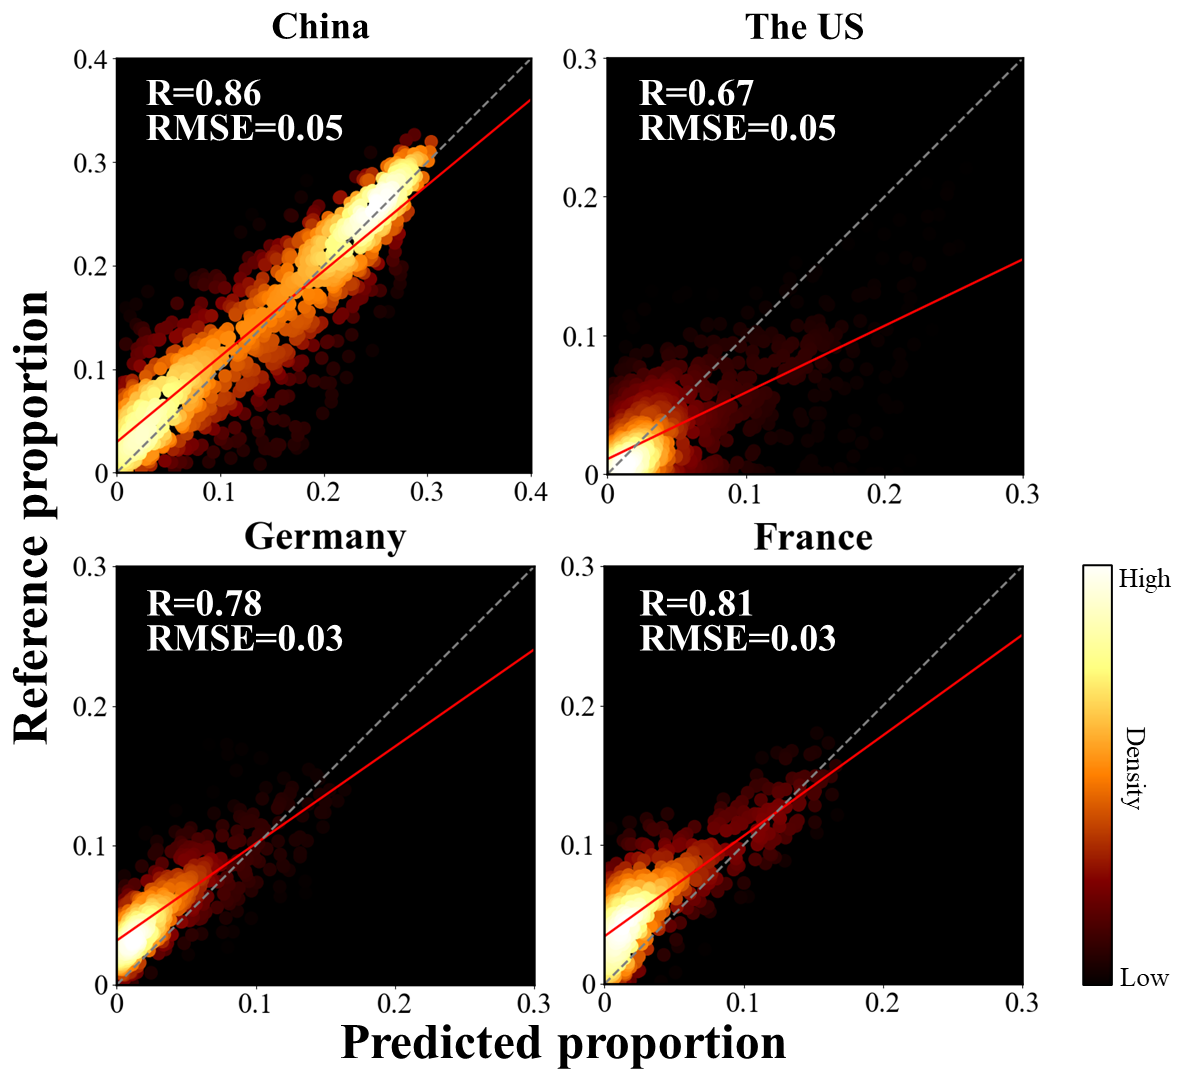
Figure 11Comparison of aggregated winter wheat fraction data at 5 km between our results and the other winter wheat products in 2018.
The employed fraction framework of winter wheat shows great mapping performance regarding the temporal trends of area dynamics at the subregional level, compared to the publicly available winter wheat products (Fig. 12). We selected the subnational-level regions with a relatively high cover of winter wheat in China (i.e., 24 provinces) and the US (i.e., 37 states) to illustrate the effectiveness of mapping performance across time in our study, respectively. The R2 in both China and the US in temporal dynamics are above 0.95 and 0.72, respectively, suggesting the regression results in those sub-administrative regions are considerably consistent with the reference data (Fig. 12a–b). Furthermore, the mean R2 in China and the US is 0.97 and 0.80, respectively. Here, we selected 2016 and 2008 as the start years to determine accuracy in China and the US, considering the conterminous national extent of winter wheat. In addition, the EU countries also have a high R2 between our results and EUCROPMAP data in 2018, with a high R2 of 0.88 (Fig. 12c). Given that only a few states in Canada grow winter wheat, we compared the accuracies between our results and ACI data by using yearly national planted area from 2011–2020, which shows our results match well with the survey data (Fig. S6). Overall, our results show a high consistency between predicted results and publicly available winter wheat products, indicating the proposed fraction mapping framework was reliable for mapping winter wheat dynamics.
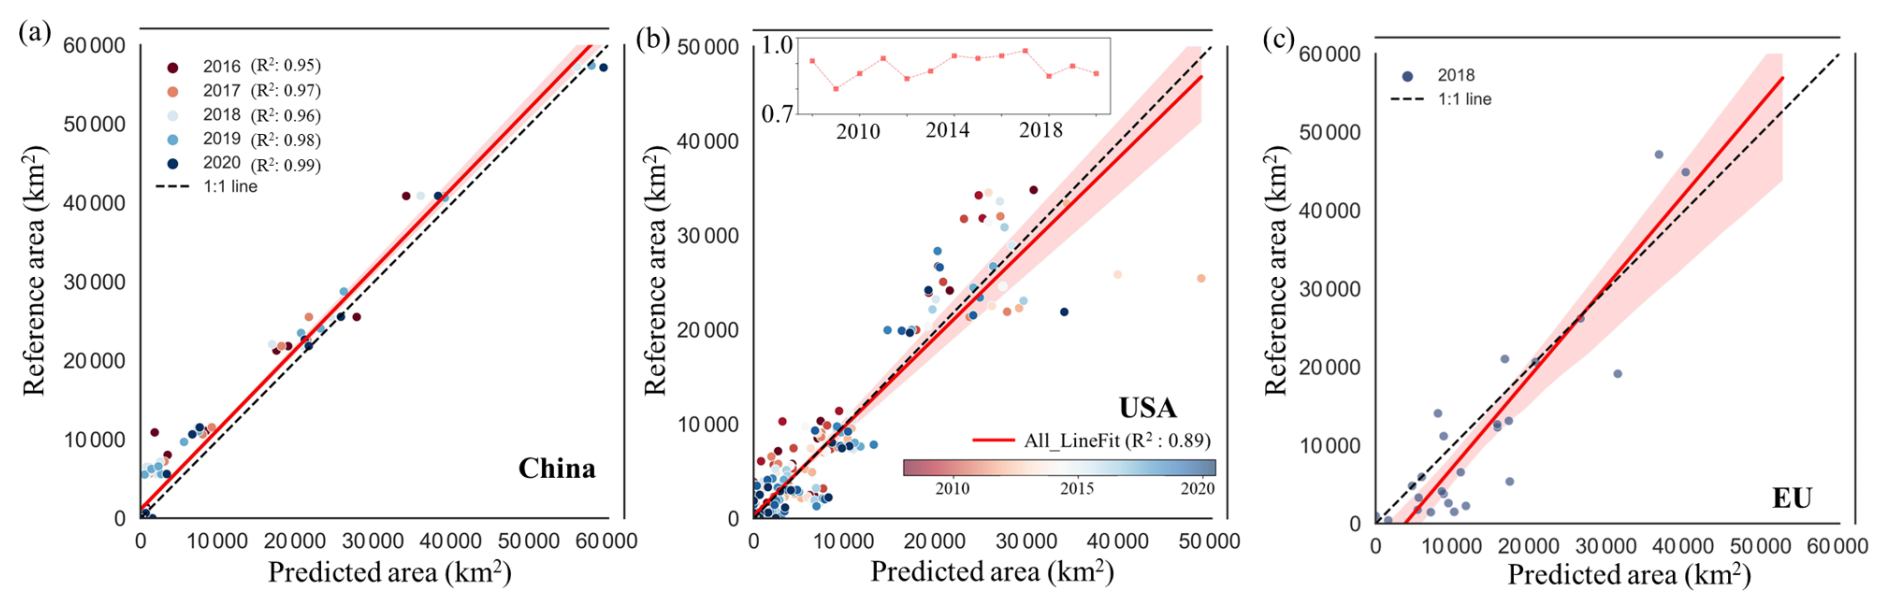
Figure 12Comparison of region-scale winter wheat areas in China (a), the US (b), and the EU (c). The line chart in (b) shows the changes in R2 values for the US from 2008 to 2020.
The temporal dynamics of winter wheat area between our results and the ChinaWheat30L data show good performance regarding the temporal extension in our study (Fig. 13). In the 24 provinces of China, the values of the R2 measured from our results are above 0.9, indicating the obtained winter wheat areas for 2016 to 2020 are highly consistent with the ChinaWheat30L data at the subnational scale (Fig. 13a). It is worth noting that the model performance using samples derived from 2016–2020 demonstrates significant temporal transferability, allowing it to be effectively applied to the years 2001–2015, even though it was not trained on samples from that earlier period (Fig. 13b). For example, the mean R2 in both 2001–2015 and 2016–2020 is 0.95 and 0.96, respectively. In addition, we found the fitted regression line lies above the 1 : 1 line at high values from 2001 to 2015, suggesting an underestimation of winter wheat area in these regions, whereas the opposite pattern was observed from 2016 to 2020. This phenomenon may be attributable to the variations in climate and management, which influence winter wheat growth, canopy development, and spectral-temporal traits, thereby in turn affecting the estimation of high winter wheat proportions (Lobert et al., 2023). On the other hand, the long-term operational changes in MODIS radiometric calibration and sensor response might cause temporal inconsistencies in spectral observations, which can influence regression estimates and add to the observed bias (Heck et al., 2019).
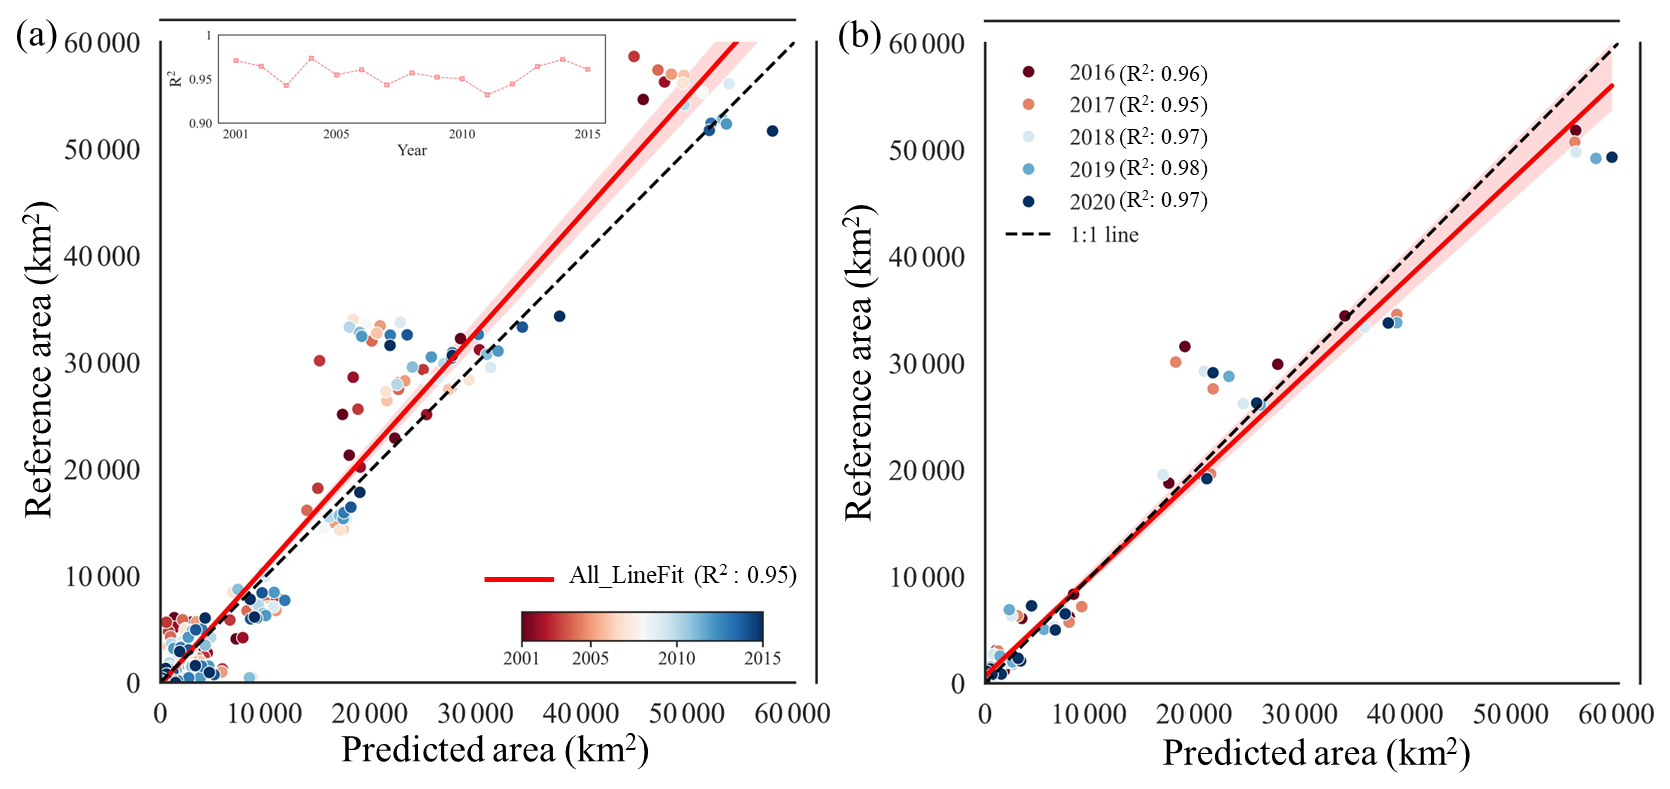
Figure 13Comparison of region-scale winter wheat areas in China between our results and the ChinaWheat30L data for 2001–2015 (a) and 2016–2020 (b). The line chart in (a) shows the changes in R2 values for China from 2001 to 2015.
4.5 Uncertainty
Several sources of errors and uncertainties limited the performance of the proposed large-scale fraction mapping approach for winter wheat. First, we adopted two masking methods (i.e., cropland and ROC masks) to exclude non-winter wheat pixels after generating regressed fraction maps. Consequently, pixels with extremely low fractions were excluded in our mapping results, given that our coarse resolution data (e.g., MODIS) are not able to characterize highly spatially mosaic maps derived from fine resolution data (e.g., Sentinel or Landsat). Second, the referred high-resolution products (e.g., 10 to 30 m) may also contain errors and uncertainties from crop datasets and spectrum, although we have already excluded many uncertain samples using “adaptive strategies” approach (Wen et al., 2022). Third, due to the complex non-linear coupling among atmospheric contamination, cropland mask inaccuracies, and sensor spatial resolution, a fully decoupled variance decomposition to isolate individual error sources remains unfeasible. Furthermore, our two-stage pipeline carries an inherent risk of error propagation where Stage 1 fraction prediction uncertainties inevitably flow into Stage 2 GMM parameterization and thresholding, making step-by-step error tracking an ongoing methodological limitation. Finally, we acknowledge that aggregating pixel-level fractions to estimate total wheat area assumes additive and unbiased fraction predictions; thus, any systematic bias in local fraction estimation can propagate linearly into regional and national area totals.
Temporal changes in winter wheat spectral and phenological traits, along with MODIS observations, are important considerations for long-term monitoring over two decades. Climatic and agronomic changes (e.g., climate warming, cultivar shifts, and changes in sowing dates and agricultural management) can alter winter wheat phenology, thereby affecting its spectral-temporal characteristics over time (Tao et al., 2022). These temporal variations can limit the applicability of winter wheat mapping models across different time periods, particularly in years lacking contemporaneous reference samples (Lei et al., 2024; Mohammadi et al., 2024; Pham et al., 2024). Hence, we further evaluated temporal transferability at the subnational scale in China, where the model trained on samples from 2016–2020 achieved mean R2 values of 0.95 for 2001–2015 and 0.96 for 2016–2020 (Fig. 13). The comparable R2 values between these two periods indicate strong temporal transferability, although our results show a relatively large systematic underestimation from 2001 to 2015. In addition, the long-term operation of Terra MODIS can lead to uncertainties related to sensor performance, due to sensor degradation and calibration issues. Although ongoing calibration and Collection 6.1 processing greatly enhance the temporal consistency of MODIS observations, previous studies suggest that sensor performance and product stability remain important considerations (Román et al., 2024; Yan et al., 2021).
The product is publicly available at https://doi.org/10.6084/m9.figshare.32149033 (Wen et al., 2026). The dataset includes GeoTIFF images, with values ranging from 0 to 100 representing the proportion of winter wheat cultivation in each pixel. We encourage users to independently verify the global winter wheat maps.
The Cropland Data Layer (CDL) is obtained from https://www.nass.usda.gov/Research_and_Science/Cropland/metadata/meta.php (last access: 25 August 2026). The Annual Crop Inventory (ACI) dataset is obtained from https://open.canada.ca/data/en/dataset (last access: 25 August 2026). The EUCROPMAP dataset is obtained from https://doi.org/10.2905/JRC.6ZVVSM8 (d'Andrimont et al., 2026). The China winter wheat maps at 30 m spatial resolution are obtained from https://doi.org/10.6084/m9.figshare.12003990 (Dong et al., 2020b). The GlobalWheatYield4km dataset is obtained from https://doi.org/10.6084/m9.figshare.10025006 (Luo et al., 2022). The global cropland extent dataset developed is obtained from https://glad.umd.edu/dataset/croplands (last access: 25 August 2026). The ChinaWheat30L dataset is obtained from https://doi.org/10.5281/zenodo.15124014 (Yang et al., 2025b). Wheat growing area statistics from the Food and Agriculture Organization of the United Nations (FAO) are obtained from https://www.fao.org/faostat/en/#data/QCL (last access: 25 August 2026).
Here, we developed a framework to map the spatiotemporal dynamics of winter wheat fractions across major global planting regions with robust performance, based on parameters derived from a GMM. Specifically, in the main global planted countries, the mean R2 over the 20-year period is about 0.81 compared with the acreage statistics from FAO data. Moreover, our fractional mapping results in our study show strong agreement with reference datasets in the study area, capturing a similar annual trend from 2001 to 2020. On one hand, most growing districts (i.e., China, the US, and EU countries) of winter wheat have relatively similar spatial distribution between our mapping results and the crop type datasets. On the other hand, the proposed fraction mapping method demonstrated good performance at the regional scale, with mean R2 of 0.97 and 0.80 in China and the US, respectively. At the grid scale, the mean R-value and RMSE were 0.84 and 0.05 in China from 2016 to 2020, and 0.74 and 0.04 in the US from 2008 to 2020.
Accurate and timely winter wheat mapping is essential for supporting global food security and promoting sustainable agricultural practices. This is the first attempt at mapping global wheat distribution and dynamics over such a long period. The proposed mapping framework is flexible and extendable to other crop types (e.g., maize and rice), showing good performance with existing local maps and statistics (Olofsson et al., 2014). Notably, our fraction map of winter wheat can improve the model simulation ability regarding the global crop growth model (e.g., APSIM), supporting the “Zero Hunger” (Zhang et al., 2022a).
The supplement related to this article is available online at https://doi.org/10.5194/essd-18-8311-2026-supplement.
XL, TB and JH designed the research and experiments; YW, TC and XL performed the experiments and wrote the original manuscript; TB, KY, LZ, HC, ML, XH, SL, SM, and JH revised the paper. All authors reviewed and revised the manuscript.
At least one of the (co-)authors is a member of the editorial board of Earth System Science Data. The peer-review process was guided by an independent editor, and the authors also have no other competing interests to declare.
Publisher's note: Copernicus Publications remains neutral with regard to jurisdictional claims made in the text, published maps, institutional affiliations, or any other geographical representation in this paper. The authors bear the ultimate responsibility for providing appropriate place names. Views expressed in the text are those of the authors and do not necessarily reflect the views of the publisher.
The authors would like to express their gratitude for the publicly available data resources utilized in this study. The authors also acknowledge the Google Earth Engine platform for providing cloud-based geospatial data access and processing capabilities.
This research was supported by the National Key Research and Development Program of China (Project no. 2023YFD1501305), “Tianshan Talents” Cultivation Program of the Xinjiang Uygur Autonomous Region (grant no. 2024TSYCTD0019), the NSFC Funds for International Cooperation and Exchange (grant no. 42361164614), the State Key Program of National Natural Science of China (grant no. 42530109), and the National Natural Science Foundation of China (grant nos. 42571476 and 42371413).
This paper was edited by Yuanzhi Yao and reviewed by two anonymous referees.
AAFC: Annual crop inventory 2025, https://open.canada.ca/data/en/dataset (last access: 25 August 2026), 2025.
Akanbi, O. D., Bhuvanagiri, D. C., Barcelos, E. I., Nihar, A., Gonzalez Hernandez, B., Yarus, J. M., and French, R. H.: Integrating multiscale geospatial analysis for monitoring crop growth, nutrient distribution, and hydrological dynamics in large-scale agricultural systems, J. Geovisualization Spatial Anal., 8, 9, https://doi.org/10.1007/s41651-023-00164-y, 2024.
Ashourloo, D., Nematollahi, H., Huete, A., Aghighi, H., Azadbakht, M., Shahrabi, H. S., and Goodarzdashti, S.: A new phenology-based method for mapping wheat and barley using time-series of sentinel-2 images, Remote Sens. Environ., 280, 113206, https://doi.org/10.1016/j.rse.2022.113206, 2022.
Becker-Reshef, I., Franch, B., Barker, B., Murphy, E., Santamaria-Artigas, A., Humber, M., Skakun, S., and Vermote, E.: Prior season crop type masks for winter wheat yield forecasting: a US case study, Remote Sens., 10, 1659, https://doi.org/10.3390/rs10101659, 2018.
Blickensdörfer, L., Schwieder, M., Pflugmacher, D., Nendel, C., Erasmi, S., and Hostert, P.: Mapping of crop types and crop sequences with combined time series of sentinel-1, sentinel-2 and landsat 8 data for Germany, Remote Sens. Environ., 269, 112831, https://doi.org/10.1016/j.rse.2021.112831, 2022.
Borrelli, P., Panagos, P., Alewell, C., Ballabio, C., de Oliveira Fagundes, H., Haregeweyn, N., Lugato, E., Maerker, M., Poesen, J., and Vanmaercke, M.: Policy implications of multiple concurrent soil erosion processes in European farmland, Nat. Sustain., 6, 103–112, https://doi.org/10.1038/s41893-022-00988-4, 2023.
Chen, X., Wang, D., Chen, J., Wang, C., and Shen, M.: The mixed pixel effect in land surface phenology: a simulation study, Remote Sens. Environ., 211, 338–344, https://doi.org/10.1016/j.rse.2018.04.030, 2018.
d'Andrimont, R., Verhegghen, A., Lemoine, G., Kempeneers, P., Meroni, M., and van der Velde, M.: EUCROPMAP 2018, European Commission, Joint Research Centre [data set], https://doi.org/10.2905/JRC.6ZVVSM8, 2026.
Ding, Y., Qu, Y., Peng, Z., Wang, M., and Li, X.: Estimating surface albedo of arctic sea ice using an ensemble back-propagation neural network: toward a better consideration of reflectance anisotropy and melt ponds, IEEE T. Geosci. Remote Sens., 60, 1–17, https://doi.org/10.1109/TGRS.2022.3202046, 2022.
Dong, J., Fu, Y., Wang, J., Tian, H., Fu, S., Niu, Z., Han, W., Zheng, Y., Huang, J., and Yuan, W.: Early-season mapping of winter wheat in China based on Landsat and Sentinel images, Earth Syst. Sci. Data, 12, 3081–3095, https://doi.org/10.5194/essd-12-3081-2020, 2020a.
Dong, J., Fu, Y., Wang, J., Tian, H., Fu, S., Niu, Z., Han, W., Zheng, Y., Huang, J., and Yuan, W.: 30m winter wheat distribution map of China for four years (2016–2019), figshare [data set], https://doi.org/10.6084/m9.figshare.12003990.v2, 2020b.
Fan, L., Xia, L., Yang, J., Sun, X., Wu, S., Qiu, B., Chen, J., Wu, W., and Yang, P.: A temporal-spatial deep learning network for winter wheat mapping using time-series sentinel-2 imagery, ISPRS J. Photogramm., 214, 48–64, https://doi.org/10.1016/j.isprsjprs.2024.06.005, 2024.
FAOSTAT: Crops and livestock products, https://www.fao.org/faostat/en/#data/QCL (last access: 25 August 2026), 2025.
Fu, Y., Chen, X., Song, C., Huang, X., Dong, J., Peng, Q., and Yuan, W.: High-resolution mapping of global winter-triticeae crops using a sample-free identification method, Earth Syst. Sci. Data, 17, 95–115, https://doi.org/10.5194/essd-17-95-2025, 2025.
Ghaffari, O., Valadan Zoej, M. J., and Mokhtarzade, M.: Reducing the effect of the endmembers' spectral variability by selecting the optimal spectral bands, Remote Sens., 9, 884, https://doi.org/10.3390/rs9090884, 2017.
Ghassemi, B., Dujakovic, A., Żółtak, M., Immitzer, M., Atzberger, C., and Vuolo, F.: Designing a European-wide crop type mapping approach based on machine learning algorithms using LUCAS field survey and sentinel-2 data, Remote Sens., 14, 541, https://doi.org/10.3390/rs14030541, 2022.
Guan, H., Huang, J., Li, L., Li, X., Miao, S., Su, W., Ma, Y., Niu, Q., and Huang, H.: Improved gaussian mixture model to map the flooded crops of VV and VH polarization data, Remote Sens. Environ., 295, 113714, https://doi.org/10.1016/j.rse.2023.113714, 2023.
Hao, P., Di, L., Zhang, C., and Guo, L.: Transfer learning for crop classification with cropland data layer data (CDL) as training samples, Sci. Total Environ., 733, 138869, https://doi.org/10.1016/j.scitotenv.2020.138869, 2020.
Hao, S., Ryu, D., Western, A., Perry, E., Bogena, H., and Franssen, H. J. H.: Performance of a wheat yield prediction model and factors influencing the performance: a review and meta-analysis, Agr. Syst., 194, 103278, https://doi.org/10.1016/j.agsy.2021.103278, 2021.
Harshvardhan, G. M., Gourisaria, M. K., Pandey, M., and Rautaray, S. S.: A comprehensive survey and analysis of generative models in machine learning, Comput. Sci. Rev., 38, 100285, https://doi.org/10.1016/j.cosrev.2020.100285, 2020.
Heck, E., de Beurs, K. M., Owsley, B. C., and Henebry, G. M.: Evaluation of the MODIS collections 5 and 6 for change analysis of vegetation and land surface temperature dynamics in north and South America, ISPRS J. Photogramm., 156, 121–134, https://doi.org/10.1016/j.isprsjprs.2019.07.011, 2019.
Hu, Q., Yin, H., Friedl, M. A., You, L., Li, Z., Tang, H., and Wu, W.: Integrating coarse-resolution images and agricultural statistics to generate sub-pixel crop type maps and reconciled area estimates, Remote Sens. Environ., 258, 112365, https://doi.org/10.1016/j.rse.2021.112365, 2021.
Huang, X., Huang, J., Li, X., Shen, Q., and Chen, Z.: Early mapping of winter wheat in henan province of China using time series of sentinel-2 data, GISci. Remote Sens., 59, 1534–1549, https://doi.org/10.1080/15481603.2022.2104999, 2022.
Hunt, M. L., Blackburn, G. A., Carrasco, L., Redhead, J. W., and Rowland, C. S.: High resolution wheat yield mapping using sentinel-2, Remote Sens. Environ., 233, 111410, https://doi.org/10.1016/j.rse.2019.111410, 2019.
Jiang, T., Wang, B., Xu, X., Cao, Y., Li Liu, D., He, L., Jin, N., Ma, H., Chen, S., and Zhao, K.: Identifying sources of uncertainty in wheat production projections with consideration of crop climatic suitability under future climate, Agr. Forest Meteorol., 319, 108933, https://doi.org/10.1016/j.agrformet.2022.108933, 2022.
Jin, S., Zhang, F., Zheng, Y., Zhou, L., Zuo, X., Zhang, Z., Zhao, W., Zhang, W., and Pan, X.: CSKNN: cost-sensitive K-nearest neighbor using hyperspectral imaging for identification of wheat varieties, Comput. Electr. Eng., 111, 108896, https://doi.org/10.1016/j.compeleceng.2023.108896, 2023.
Júnior, R. de S. N., Ewert, F., Webber, H., Martre, P., Hertel, T. W., van Ittersum, M. K., and Asseng, S.: Needed global wheat stock and crop management in response to the war in Ukraine, Global Food Secur., 35, 100662, https://doi.org/10.1016/j.gfs.2022.100662, 2022.
Kathirvelu, K., Yesudhas, A. V. P., and Ramanathan, S.: Spectral unmixing based random forest classifier for detecting surface water changes in multitemporal pansharpened landsat image, Expert Syst. Appl., 224, 120072, https://doi.org/10.1016/j.eswa.2023.120072, 2023.
Lei, L., Wang, X., Zhang, L., Hu, X., and Zhong, Y.: CROPUP: historical products are all you need? An end-to-end cross-year crop map updating framework without the need for in situ samples, Remote Sens. Environ., 315, 114430, https://doi.org/10.1016/j.rse.2024.114430, 2024.
Li, W., Weiss, M., Jay, S., Wei, S., Zhao, N., Comar, A., Lopez-Lozano, R., De Solan, B., Yu, Q., and Wu, W.: Daily monitoring of effective green area index and vegetation chlorophyll content from continuous acquisitions of a multi-band spectrometer over winter wheat, Remote Sens. Environ., 300, 113883, https://doi.org/10.1016/j.rse.2023.113883, 2024.
Liu, L., Xiao, X., Qin, Y., Wang, J., Xu, X., Hu, Y., and Qiao, Z.: Mapping cropping intensity in China using time series landsat and sentinel-2 images and Google earth engine, Remote Sens. Environ., 239, 111624, https://doi.org/10.1016/j.rse.2019.111624, 2020.
Liu, M., He, W., and Zhang, H.: WPS: a whole phenology-based spectral feature selection method for mapping winter crop from time-series images, ISPRS J. Photogramm., 210, 141–159, https://doi.org/10.1016/j.isprsjprs.2024.03.005, 2024.
Lobert, F., Löw, J., Schwieder, M., Gocht, A., Schlund, M., Hostert, P., and Erasmi, S.: A deep learning approach for deriving winter wheat phenology from optical and SAR time series at field level, Remote Sens. Environ., 298, 113800, https://doi.org/10.1016/j.rse.2023.113800, 2023.
Luo, Y., Zhang, Z., Cao, J., Zhang, L., Zhang, J., Han, J., Zhuang, H., Cheng, F., Xu, J., Tao, F. and Tang, Q.: Accurately estimating global wheat yields at 4-km resolution during 1982–2020 (GlobalWheatYield4km), figshare [data set], https://doi.org/10.6084/m9.figshare.10025006.v2, 2022.
Ma, L., Yang, S., Gu, Q., Li, J., Yang, X., Wang, J., and Ding, J.: Spatial and temporal mapping of cropland expansion in northwestern China with multisource remotely sensed data, Catena, 183, 104192, https://doi.org/10.1016/j.catena.2019.104192, 2019.
Masiliūnas, D., Tsendbazar, N.-E., Herold, M., Lesiv, M., Buchhorn, M., and Verbesselt, J.: Global land characterisation using land cover fractions at 100 m resolution, Remote Sens. Environ., 259, 112409, https://doi.org/10.1016/j.rse.2021.112409, 2021.
Mohammadi, S., Belgiu, M., and Stein, A.: A source-free unsupervised domain adaptation method for cross-regional and cross-time crop mapping from satellite image time series, Remote Sens. Environ., 314, 114385, https://doi.org/10.1016/j.rse.2024.114385, 2024.
Naumann, P., Kauffmann, J., and Montavon, G.: Wasserstein distances made explainable: insights into dataset shifts and transport phenomena, IEEE Trans. Pattern Anal., https://doi.org/10.1109/TPAMI.2026.3656947, 2026.
Nelson, K. S. and Burchfield, E. K.: Landscape complexity and US crop production, Nat. Food, 2, 330–338, https://doi.org/10.1038/s43016-021-00281-1, 2021.
Olofsson, P., Foody, G. M., Herold, M., Stehman, S. V., Woodcock, C. E., and Wulder, M. A.: Good practices for estimating area and assessing accuracy of land change, Remote Sens. Environ., 148, 42–57, https://doi.org/10.1016/j.rse.2014.02.015, 2014.
Pham, V.-D., Tetteh, G., Thiel, F., Erasmi, S., Schwieder, M., Frantz, D., and van der Linden, S.: Temporally transferable crop mapping with temporal encoding and deep learning augmentations, Int. J. Appl. Earth Obs., 129, 103867, https://doi.org/10.1016/j.jag.2024.103867, 2024.
Potapov, P., Turubanova, S., Hansen, M. C., Tyukavina, A., Zalles, V., Khan, A., Song, X.-P., Pickens, A., Shen, Q., and Cortez, J.: Global maps of cropland extent and change show accelerated cropland expansion in the twenty-first century, Nat. Food, 3, 19–28, https://doi.org/10.1038/s43016-021-00429-z, 2022.
Pott, L. P., Amado, T. J. C., Schwalbert, R. A., Corassa, G. M., and Ciampitti, I. A.: Satellite-based data fusion crop type classification and mapping in rio grande do sul, brazil, ISPRS J. Photogramm., 176, 196–210, https://doi.org/10.1016/j.isprsjprs.2021.04.015, 2021.
Qu, C., Li, P., and Zhang, C.: A spectral index for winter wheat mapping using multi-temporal landsat NDVI data of key growth stages, ISPRS J. Photogramm., 175, 431–447, https://doi.org/10.1016/j.isprsjprs.2021.03.015, 2021.
Ren, J., Shao, Y., Wan, H., Xie, Y., and Campos, A.: A two-step mapping of irrigated corn with multi-temporal MODIS and landsat analysis ready data, ISPRS J. Photogramm., 176, 69–82, https://doi.org/10.1016/j.isprsjprs.2021.04.007, 2021.
Ren, S., Qin, Q., and Ren, H.: Contrasting wheat phenological responses to climate change in global scale, Sci. Total Environ., 665, 620–631, https://doi.org/10.1016/j.scitotenv.2019.01.394, 2019.
Román, M. O., Justice, C., Paynter, I., Boucher, P. B., Devadiga, S., Endsley, A., Erb, A., Friedl, M., Gao, H., and Giglio, L.: Continuity between NASA MODIS collection 6.1 and VIIRS collection 2 land products, Remote Sens. Environ., 302, 113963, https://doi.org/10.1016/j.rse.2023.113963, 2024.
Rufin, P., Bey, A., Picoli, M., and Meyfroidt, P.: Large-area mapping of active cropland and short-term fallows in smallholder landscapes using PlanetScope data, Int. J. Appl. Earth Obs., 112, 102937, https://doi.org/10.1016/j.jag.2022.102937, 2022.
Schwalbert, R. A., Amado, T., Corassa, G., Pott, L. P., Prasad, P. V., and Ciampitti, I. A.: Satellite-based soybean yield forecast: integrating machine learning and weather data for improving crop yield prediction in southern Brazil, Agr. Forest Meteorol., 284, 107886, https://doi.org/10.1016/j.agrformet.2019.107886, 2020.
Shao, C., Shuai, Y., Wu, H., Deng, X., Zhang, X., and Xu, A.: Development of a spectral index for the detection of yellow-flowering vegetation, Remote Sens., 15, 1725, https://doi.org/10.3390/rs15071725, 2023.
Shen, R., Peng, Q., Li, X., Chen, X., and Yuan, W.: CCD-Rice: a long-term paddy rice distribution dataset in China at 30 m resolution, Earth Syst. Sci. Data, 17, 2193–2216, https://doi.org/10.5194/essd-17-2193-2025, 2025.
Skakun, S., Franch, B., Vermote, E., Roger, J.-C., Becker-Reshef, I., Justice, C., and Kussul, N.: Early season large-area winter crop mapping using MODIS NDVI data, growing degree days information and a gaussian mixture model, Remote Sens. Environ., 195, 244–258, https://doi.org/10.1016/j.rse.2017.04.026, 2017.
Tao, F., Zhang, L., Zhang, Z., and Chen, Y.: Climate warming outweighed agricultural managements in affecting wheat phenology across china during 1981–2018, Agr. Forest Meteorol., 316, 108865, https://doi.org/10.1016/j.agrformet.2022.108865, 2022.
Tian, H., Yang, M., Wu, F., Qin, Y., Zhang, X., Liu, J., and Yan, W.: Potentiality of landsat-9 for early-season mapping of winter garlic and winter wheat, Geo-spatial Inf. Sci., 27, 2199–2210, https://doi.org/10.1080/10095020.2024.2311868, 2024.
Tran, K. H., Zhang, H. K., McMaine, J. T., Zhang, X., and Luo, D.: 10 m crop type mapping using sentinel-2 reflectance and 30 m cropland data layer product, Int. J. Appl. Earth Obs., 107, 102692, https://doi.org/10.1016/j.jag.2022.102692, 2022.
USDA-NASS: Cropland data layer metadata, https://www.nass.usda.gov/Research_and_Science/Cropland/metadata/meta.php (last access: 25 August 2026), 2025.
Wang, Q., Shi, W., Atkinson, P. M., and Zhao, Y.: Downscaling MODIS images with area-to-point regression kriging, Remote Sens. Environ., 166, 191–204, https://doi.org/10.1016/j.rse.2015.06.003, 2015.
Wang, S., Azzari, G., and Lobell, D. B.: Crop type mapping without field-level labels: random forest transfer and unsupervised clustering techniques, Remote Sens. Environ., 222, 303–317, https://doi.org/10.1016/j.rse.2018.12.026, 2019.
Wang, S., Di Tommaso, S., Faulkner, J., Friedel, T., Kennepohl, A., Strey, R., and Lobell, D. B.: Mapping crop types in southeast India with smartphone crowdsourcing and deep learning, Remote Sens., 12, 2957, https://doi.org/10.3390/rs12182957, 2020.
Wen, Y., Li, X., Mu, H., Zhong, L., Chen, H., Zeng, Y., Miao, S., Su, W., Gong, P., Li, B., and Huang, J.: Mapping corn dynamics using limited but representative samples with adaptive strategies, ISPRS J. Photogramm., 190, 252–266, https://doi.org/10.1016/j.isprsjprs.2022.06.012, 2022.
Wen, Y., Chen, T., and Xuecao, L.: 20-years winter wheat dynamics in global primary planting areas, figshare [data set], https://doi.org/10.6084/m9.figshare.32149033.v1, 2026.
Wójcik-Gront, E.: Variables influencing yield-scaled global warming potential and yield of winter wheat production, Field Crops Res., 227, 19–29, https://doi.org/10.1016/j.fcr.2018.07.015, 2018.
Xie, Y., Nhu, A. N., Song, X.-P., Jia, X., Skakun, S., Li, H., and Wang, Z.: Accounting for spatial variability with geo-aware random forest: a case study for US major crop mapping, Remote Sens. Environ., 319, 114585, https://doi.org/10.1016/j.rse.2024.114585, 2025.
Yahiaoui, I., Bradaï, A., Douaoui, A., and Abdennour, M. A.: Performance of random forest and buffer analysis of sentinel-2 data for modelling soil salinity in the lower-cheliff plain (algeria), Int. J. Remote Sens., 42, 148–171, https://doi.org/10.1080/01431161.2020.1823515, 2021.
Yan, K., Pu, J., Park, T., Xu, B., Zeng, Y., Yan, G., Weiss, M., Knyazikhin, Y., and Myneni, R. B.: Performance stability of the MODIS and VIIRS LAI algorithms inferred from analysis of long time series of products, Remote Sens. Environ., 260, 112438, https://doi.org/10.1016/j.rse.2021.112438, 2021.
Yang, G., Li, X., Liu, P., Yao, X., Zhu, Y., Cao, W., and Cheng, T.: Automated in-season mapping of winter wheat in China with training data generation and model transfer, ISPRS J. Photogramm., 202, 422–438, https://doi.org/10.1016/j.isprsjprs.2023.07.004, 2023.
Yang, G., Li, X., Xiong, Y., He, M., Zhang, L., Jiang, C., Yao, X., Zhu, Y., Cao, W., and Cheng, T.: Annual winter wheat mapping for unveiling spatiotemporal patterns in China with a knowledge-guided approach and multi-source datasets, ISPRS J. Photogramm., 225, 163–179, https://doi.org/10.1016/j.isprsjprs.2025.04.031, 2025a.
Yang, G., Cheng, T., Li, X., Xiong, Y., He, M., Jiang, C., Yao, X., Zhu, Y., and Cao, W.: ChinaWheat30L: Long-term winter wheat maps of China at 30-m resolution from 2000 to 2023 (Version 2), Zenodo [data set], https://doi.org/10.5281/zenodo.15124014, 2025b.
You, N., Dong, J., Li, J., Huang, J., and Jin, Z.: Rapid early-season maize mapping without crop labels, Remote Sens. Environ., 290, 113496, https://doi.org/10.1016/j.rse.2023.113496, 2023.
Zhang, H., Du, H., Zhang, C., and Zhang, L.: An automated early-season method to map winter wheat using time-series sentinel-2 data: a case study of shandong, china, Comput. Electron. Agr., 182, 105962, https://doi.org/10.1016/j.compag.2020.105962, 2021.
Zhang, J., Wang, S., Pradhan, P., Zhao, W., and Fu, B.: Mapping the complexity of the food-energy-water nexus from the lens of sustainable development goals in China, Resour. Conserv. Recy., 183, 106357, https://doi.org/10.1016/j.resconrec.2022.106357, 2022a.
Zhang, Q., Men, X., Hui, C., Ge, F., and Ouyang, F.: Wheat yield losses from pests and pathogens in China, Agr. Ecosyst. Environ., 326, 107821, https://doi.org/10.1016/j.agee.2021.107821, 2022b.
Zhang, X.-W., Liu, J.-F., Qin, Z., and Fen, Q. I. N.: Winter wheat identification by integrating spectral and temporal information derived from multi-resolution remote sensing data, J. Integr. Agr., 18, 2628–2643, https://doi.org/10.1016/S2095-3119(19)62615-8, 2019.
Zhang, Z., Luo, Y., Han, J., Xu, J., and Tao, F.: Estimating global wheat yields at 4 km resolution during 1982–2020 by a spatiotemporal transferable method, Remote Sens., 16, 2342, https://doi.org/10.3390/rs16132342, 2024.
Zhao, Y., Tao, H., He, P., Yao, X., Cheng, T., Zhu, Y., Cao, W., and Tian, Y.: Annual 30 m winter wheat yield mapping in the huang-huai-hai plain using crop growth model and long-term satellite images, Comput. Electron. Agr., 214, 108335, https://doi.org/10.1016/j.compag.2023.108335, 2023.
Zhong, L., Hu, L., Zhou, H., and Tao, X.: Deep learning based winter wheat mapping using statistical data as ground references in kansas and northern texas, US, Remote Sens. Environ., 233, 111411, https://doi.org/10.1016/j.rse.2019.111411, 2019.
Zhu, X., Duan, S.-B., Li, Z.-L., Wu, P., Wu, H., Zhao, W., and Qian, Y.: Reconstruction of land surface temperature under cloudy conditions from landsat 8 data using annual temperature cycle model, Remote Sens. Environ., 281, 113261, https://doi.org/10.1016/j.rse.2022.113261, 2022.