the Creative Commons Attribution 4.0 License.
the Creative Commons Attribution 4.0 License.
 | 13 Oct 2026
High-quality remote sensing reflectance products over China and US coast
Shuhui Zhao
Youlv Wu
Jingning Lv
Dan Zhao
Yan Zheng
Lian Feng

Remote sensing reflectance (Rrs) is fundamental for deriving bio-optical properties of global surface waters. However, accurate atmospheric correction (AC) to derive Rrs in coastal waters remains challenging due to strongly absorbing aerosols and complex water optics. To address this, we developed an improved processing framework that integrates flexible use of global gridded aerosol models better suited for coastal environments and incorporates tailored masking strategies. Based on this framework, we generated a high-quality Rrs dataset from Moderate Resolution Imaging Spectroradiometer (MODIS) Aqua observations, spanning 2003–2022 for the coastal waters of China and the United States (US) – two regions where complex water optics and frequent anthropogenic aerosols have long impeded retrieval accuracy and valid data yield. Compared to the NASA standard MODIS Aqua Rrs products, the improved framework achieved a significant reduction in systematic bias. Multiple validation metrics support this, with the restoration of the mean regression slope to unity (1.00 ± 0.08 vs. 0.90 ± 0.06) across eight bands being the most prominent. Performance gains are particularly pronounced in the 488–555 nm range, which is most relevant to water color applications. The new dataset also yields significantly more valid retrievals, with regional mean increases of 56 % in the Chinese coastal waters and 18 % in the US coastal waters at 443 nm. Furthermore, it recovers fine-scale features in turbid waters and captures long-term dynamics, demonstrating its robustness for coastal monitoring. As a complementary resource optimized for estuaries, bays, and turbid coastal regions, the new dataset fills a critical gap in the ocean color data portfolio where standard products are less reliable. The dataset is available at https://doi.org/10.5281/zenodo.16413443 (Zhao et al., 2025).
- Article
(26342 KB) - Full-text XML
- BibTeX
- EndNote


Remote sensing reflectance (Rrs), representing the fraction of the top-of-atmosphere (TOA) signal attributable to water-leaving radiance (Gordon, 1997), is fundamental for deriving bio-optical properties of global surface waters, such as inherent optical properties (IOPs) (Lee et al., 2002; Werdell et al., 2013), concentrations of chlorophyll a (Chl) (O'Reilly, 2000; Hu et al., 2019; Tong et al., 2022) and particulate organic carbon (POC) (Stramski et al., 1999; Stramski et al., 2022), among many others. Accurate atmospheric correction (AC) – which removes atmospheric contributions from the total radiance measured by satellite sensors – is critical for retrieving Rrs and estimating water quality parameters (Gordon and Wang, 1994; Gordon, 1997). However, a key challenge in AC lies in accurately characterizing aerosol radiative properties, especially in the presence of absorbing aerosols which strongly absorb light at short blue bands (410 or 412 nm and 443 nm) (Bassani et al., 2015; IOCCG and and Mélin, 2019). In coastal regions where such aerosols (e.g., dust, smoke, and urban aerosols) are prevalent (Charlson et al., 1992), the aerosol models developed by Ahmad et al. (2010) (hereafter referred to as AF10), which are widely used in current operational AC, fail to account for strong aerosol absorption (Zhao et al., 2023), leading to systematic underestimation and limited reliability of Rrs (Wang and Jiang, 2018). In addition to aerosol-related issues, the cloud mask applied in current ocean color data processing pipelines often misclassifies highly reflective turbid waters (e.g., those with high suspended sediment concentrations) as clouds, resulting in the loss of usable Rrs data in coastal regions (Wang and Shi, 2006). Together, these issues severely constrain the usability of Rrs products in coastal regions and hamper the accurate retrieval of biogeochemical properties in these dynamic environments.
One of the key factors determining the accuracy of Rrs retrievals after atmospheric correction is whether the adopted aerosol models can effectively capture the microphysical and optical properties of aerosols, thereby accurately estimating their scattering contributions (Prospero et al., 1983; Gordon et al., 1997; Bassani et al., 2015). To address this, a range of aerosol models has been developed and refined by incorporating observational data and analyzing aerosol sources (Shettle and Fenn, 1979; Gordon and Wang, 1994; Ahmad et al., 2010; Zhao et al., 2023). Early work by Shettle and Fenn (1979) classified aerosols into five types (rural, urban, maritime, tropospheric, and fog) and accounted for humidity effects to produce a set of models (denoted as SF79). Building on this, Gordon and Wang (1994) formulated 12 humidity-dependent aerosol models (denoted as GW94) tailored for marine applications. With improved observational capacity, Ahmad et al. (2010) developed the AF10 models based on long-term data from 11 AErosol RObotic NETwork (AERONET) sites. The AF10 models parameterize aerosol particle size, refractive index, and fine-mode fraction as functions of relative humidity. Compared to GW94, they significantly reduced the uncertainties in aerosol optical thickness (AOT) and Ångström exponent (He et al., 2011; Mélin et al., 2013). As a result, the AF10 models have become the default aerosol model set in most current operational ocean color data processing systems (Mobley et al., 2016).
However, current operational AC based on AF10 models frequently yields poor Rrs retrievals in coastal regions, often resulting in underestimated Rrs values, particularly in the blue bands (Wang and Jiang, 2018). This limitation stems from the spatial representativeness of the AERONET sites used to build AF10 models: only three coastal stations (all in Chesapeake Bay) were included, while the remaining sites were located over open oceans. As a result, AF10 models primarily represent non- or weakly absorbing aerosols over the open ocean, and do not adequately reflect the high AOT and strong absorption features commonly present in coastal regions (Zhao et al., 2023). Although many studies have proposed aerosol model refinements (Giles et al., 2012; Hamill et al., 2016; Bru et al., 2017; Zhou et al., 2020; Montes et al., 2022), most focus on specific aerosol types or lack representation of seasonal variability, limiting their broader applicability for coastal waters.
Recognizing the limitations of the AF10 models, Zhao et al. (2023) developed a set of global gridded aerosol models tailored for inland and coastal waters. Leveraging AERONET observations from 1475 sites worldwide, they generated 3207 monthly aerosol models distributed across 310 5°×5° grids, and compiled the models into lookup tables compatible with the Sea-viewing Wide Field-of-view Sensor (SeaWiFS) Data Analysis System (SeaDAS) to allow seamless integration into operational AC workflows. Validation using Moderate Resolution Imaging Spectroradiometer (MODIS) Aqua data over six lacustrine or estuarine regions showed that the gridded models substantially improved Rrs retrieval accuracy compared to the AF10 models. Recently, Lv et al. (2024) further demonstrated the robustness of the gridded models through extended validations across multiple coastal regions and MODIS bands, with notable reductions in aerosol overcorrection errors under complex aerosol conditions.
Although such global gridded aerosol models have shown promise in characterizing the complex aerosol properties of coastal regions, several practical challenges hinder their direct application in operational coastal Rrs product generation. One key limitation lies in the intrinsic complexity of coastal environments, where both atmospheric and water optical conditions can exhibit strong spatial heterogeneity within a single satellite scene – from nearshore turbid waters dominated by strongly absorbing continental aerosols to offshore regions with clearer water and weakly absorbing marine aerosols. Applying either model type uniformly across such spatial gradients can lead to potential retrieval errors – for instance, using AF10 models nearshore often results in overestimated aerosol path radiance and underestimated Rrs, while applying the gridded models offshore may produce unrealistically high Rrs values due to overestimated aerosol absorption. These challenges highlight the necessity of developing a dynamic and integrated model selection scheme that can adaptively select between gridded and AF10 aerosol models under spatially heterogeneous conditions, to support accurate AC across the full coastal domain and generate spatially consistent, quality-assured Rrs products suitable for large-scale analysis.
In addition to aerosol model selection issues, a more suitable cloud masking strategy is also essential for improving the usability of coastal Rrs data. The default cloud mask employed in current operational processing workflows – originally designed for open-ocean applications – relies on a Rayleigh reflectance threshold at 869 nm () to identify cloudy pixels (Robinson et al., 2003). However, in turbid coastal waters, this threshold can easily be exceeded due to high water-leaving radiance, leading to misclassification of valid pixels as cloudy (Wang and Shi, 2006). As a result, a substantial portion of valid data was incorrectly discarded, limiting the spatial coverage and continuity of the standard Rrs products. To address this, previous studies have proposed using alternative thresholds at 1240 or 2130 nm, as these relaxed cloud masking thresholds help retain more turbid water pixels. However, the relaxation of the cloud masking criteria may increase the risk of residual contamination from thin clouds. Therefore, targeted masking approaches must be incorporated during data processing to complement the modified cloud masking threshold, thereby ensuring data reliability.
In summary, while prior studies have addressed two major limitations of standard Rrs products in coastal waters – namely, the inadequacy of aerosol models and the excessive cloud masking – these improvements are not yet fully integrated into operational data production. This study bridges the gap by developing an improved processing framework that integrates refined aerosol model assignment and targeted masking strategies.
The framework is applied to generate a consistent, high-quality MODIS Rrs dataset (2003–2022) for two strategically selected regions: the coastal waters of China and the United States (US). These regions together provide representative cases for the optical challenges in coastal zones – from the highly turbid waters and frequent absorbing aerosols of China's coast to the diverse optical environments and significant anthropogenic influences along the US coast (Charlson et al., 1992; Wang et al., 2017), and serve as a rigorous testbed to validate the framework's robustness under the most demanding conditions.
The performance of the resulting dataset is comprehensively evaluated, with analyses presented on its radiometric accuracy, data coverage, and ability to resolve fine-scale and long-term spatiotemporal patterns. These results are then discussed to critically position the new framework within the current landscape of coastal ocean color research and outline its potential for future development.
2.1 Datasets
2.1.1 Satellite Imagery
This study utilized two types of MODIS Aqua satellite data acquired from the NASA Ocean Biology Processing Group (https://oceandata.sci.gsfc.nasa.gov/, last access: 8 October 2026): Level-1A (L1A) and Level-2 (L2) ocean color products. L1A products contain unprocessed full-resolution data, supplemented with radiometric and geometric calibration coefficients and georeferencing parameters. L2 products provide derived geophysical variables (e.g., Rrs, Chl) at the same spatial resolution and geolocation as L1A data. A total of 136 544 L1A images acquired between 2002 and 2022 (data beyond 2022 were excluded here due to satellite orbital changes beginning in 2023 (Twedt et al., 2023; NASA Ocean Biology Processing Group, 2024) were used in this study for two main purposes:
-
Matchup validation: A subset of 4961 L1A images (2002–2022) was used to generate satellite Rrs for validation against in situ measurements, with temporal coverage aligned to field campaigns.
-
New coastal Rrs dataset generation: Most of the images (128 226 scenes, from 2003 to 2022) were used to generate the new Rrs dataset for two regions: the coastal waters of Chinese mainland (106–127° E, 17–41° N) and the US (128–65° W, 18–51° N).
NASA standard Level-2 Rrs products generated using the operational AC algorithm developed by NASA OBPG (NASA Ocean Biology Processing Group, 2022) were also obtained. This dataset was used for:
-
Comparative validation with Rrs data generated in this study using a common set of in situ measurements.
-
Evaluation of improvements in valid data yield by comparing valid observations counts (see Sect. 2.3.2) and assessing single-scene retrievals.
Both the new dataset and standard products include Rrs at 10 spectral bands: 412, 443, 469, 488, 531, 547, 555, 645, 667, and 678 nm, all at 1 km spatial resolution.
2.1.2 Ancillary Environmental Data
To support accurate AC, this study also incorporated ancillary data (Global Modeling and Assimilation Office, 2015a, b, c; Canada Meteorological Center, 2012, 2017) during the processing of MODIS imagery. These inputs – automatically acquired via the SeaDAS processing environment – include meteorological variables (e.g., wind speed, surface pressure, relative humidity) and concentrations of atmospheric gases (e.g., water vapor, ozone, nitrogen dioxide). These parameters are essential for calculating Rayleigh scattering, atmospheric transmittance, and gaseous absorption, and thus directly influence the quality of retrieved Rrs values. The best available ancillary data at the time of processing were used, consistent with standard SeaDAS ancillary data usage practices. This approach helps minimize the influence of auxiliary input differences when comparing with the standard Rrs products and improves the reliability of Rrs values derived with our improved processing framework.
2.1.3 In Situ Data
To evaluate the performance of the improved processing framework and compare its outputs with the standard products, we used in situ Rrs measurements archived in the SeaWiFS Bio-optical Archive and Storage System (SeaBASS, https://seabass.gsfc.nasa.gov/, last access: 8 October 2026) (Werdell et al., 2003; Bailey and Werdell, 2006). SeaBASS provides precompiled satellite–in situ matchup records, each containing metadata such as geographic coordinates, sampling time, cruise ID, measured Rrs values, corresponding MODIS Aqua filenames, and validation flags. In this study, the metadata was used to extract satellite-derived Rrs from outputs of our improved processing framework and standard products, rather than using the satellite Rrs values directly included in the SeaBASS records. This allowed us to apply a unified and more stringent quality control (QC) strategy (see Sect. 2.2.2) to both data, ensuring consistency and reliability of the accuracy assessment.
The in situ measurements cover eight MODIS bands: 412, 443, 488, 531, 547, 555, 667, and 678 nm. Due to a lack of in situ records at 469 and 645 nm, these two bands were excluded from all accuracy assessments (see Sect. 2.3.1).
To ensure compatibility with the coverage of the global gridded aerosol models and focus on coastal conditions, observations located outside the spatial domain of the global gridded aerosol models or over inland waters were excluded. A total of 6362 in situ records were retained for validation, distributed across a wide range of coastal environments (see Fig. 1).
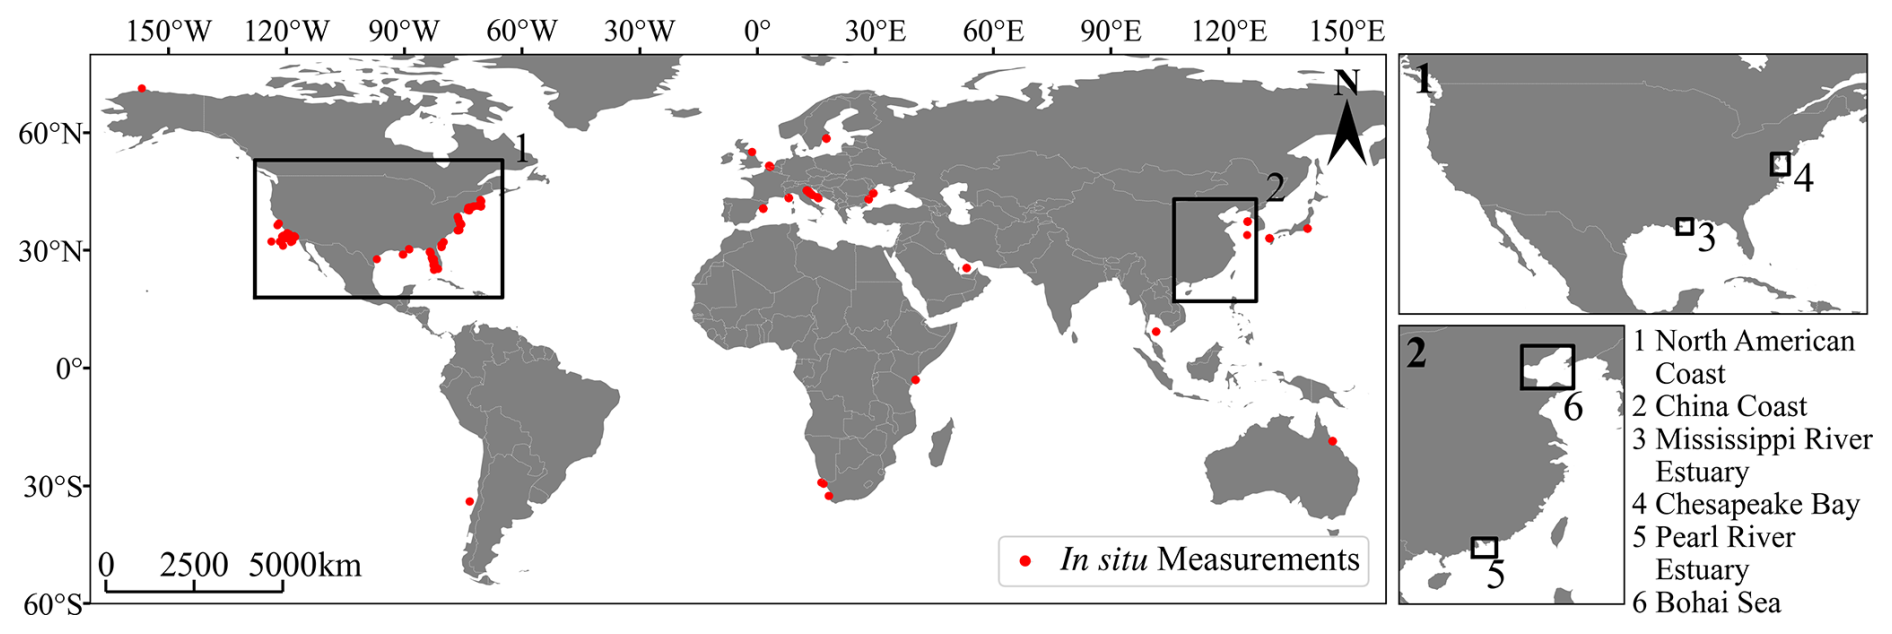
Figure 1Distribution of in situ measurements. Also shown are the study areas – the coastal waters of China and the United States – as well as four specific regions of interest: the Mississippi River Estuary, Chesapeake Bay, Pearl River Estuary, and Bohai Sea.
2.2 Processing Framework
Accurate AC is essential for deriving reliable Rrs in optically complex coastal waters, where high turbidity and variable aerosol properties present persistent challenges. In this study, we refined current operational ocean color AC algorithm (Mobley et al., 2016) to enhance its performance in such environments. All processing was conducted using SeaDAS software (version 8.3.0).
Our modifications build upon the standard near-infrared (NIR) iterative approach, which estimates aerosol contributions by assuming negligible water-leaving radiance in the NIR bands and minimizing residual signals through iteration (Gordon and Wang, 1994; Mobley et al., 2016). While effective over open ocean, this method could produce biased results in coastal waters due to sharp gradients in both water optical properties and aerosol characteristics. To address these limitations, we introduced a more flexible AC approach tailored to spatially heterogeneous coastal conditions. The full procedure is detailed in Sect. 2.2.1.
Additionally, a unified set of QC strategies was applied to both the newly generated data in this study and standard Rrs products to ensure consistency in evaluation. These procedures are described in Sect. 2.2.2.
2.2.1 Improved Atmospheric Correction
Building upon the standard NIR iterative approach, we further enhanced AC performance in coastal waters by incorporating the global gridded aerosol models (Zhao et al., 2023) and introducing a spatially adaptive aerosol model selection strategy. The overall process is illustrated in Fig. 2.
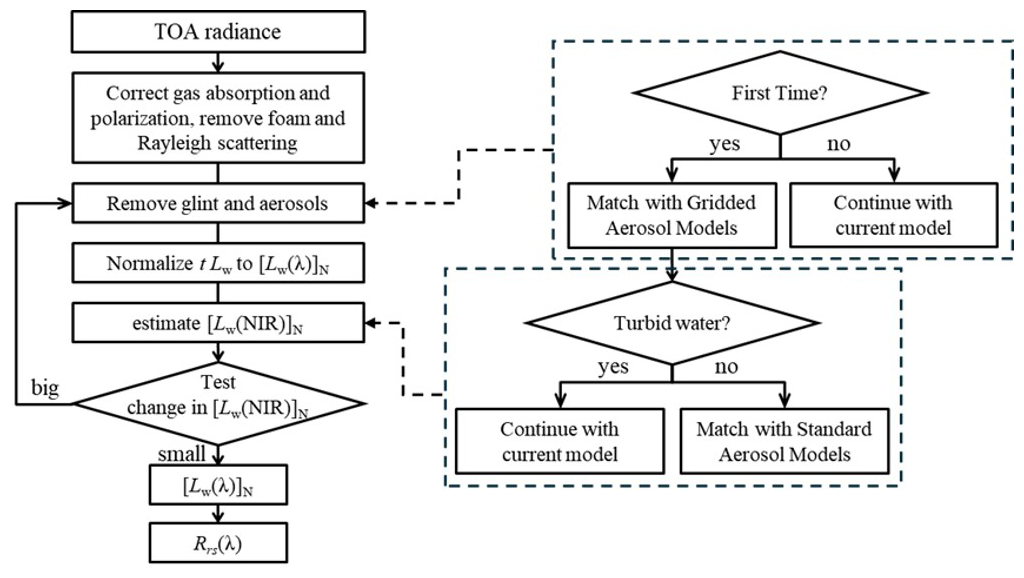
Figure 2Improved atmospheric correction (AC) workflow. Notation: t (diffuse transmittance), Lw (water-leaving radiance), λ (wavelengths), NIR (near-infrared), N (normalization).
After preprocessing steps such as Rayleigh scattering and sun glint removal, the initial aerosol contribution was estimated using a gridded aerosol model selected based on the pixel's geographic location and date (Zhao et al., 2023), since the gridded models offer improved representation of the diverse and potentially absorbing aerosols common in coastal regions.
To account for spatial heterogeneity in coastal conditions, each pixel was preliminarily classified based on its normalized NIR water-leaving radiance (denoted as [Lw(NIR)]N). Specifically, a pixel was classified as “turbid” if [Lw(NIR)]N exceeded the empirical threshold defined by the TURBIDW flag in NASA Standard Level-2 Ocean Color Flags. Although this classification nominally distinguishes between clear and turbid waters, it served here primarily as a proxy for proximity to land. Turbid waters – characterized by elevated NIR reflectance due to high concentrations of suspended sediments or phytoplankton – are typically concentrated in nearshore zones, where riverine input and absorbing aerosols from anthropogenic sources are most pronounced (Husar et al., 1997). For these pixels, the gridded aerosol model originally assigned to the location was retained throughout iteration to better represent local aerosol properties. In contrast, pixels classified as “clear” were generally located offshore, where continental aerosol influence is weaker and water clarity is higher. For these pixels, an AF10 aerosol model was selected following the conventional open-ocean AC algorithm and used in subsequent iterations, as continued use of the gridded model in such areas could lead to underestimation of aerosol path radiance and overestimation of water-leaving radiance. This spatially adaptive model selection approach – guided by an indirect indicator of coastal influence – was key to improving retrieval performance across diverse coastal environments.
The iteration proceeded until the change in [Lw(NIR)]N between successive steps fell below a set threshold, after which the final [Lw(λ)]N was converted to Rrs(λ).
While the NIR-SWIR switching method is considered more robust for highly turbid waters – leveraging the near-zero water-leaving radiance assumption in the shortwave infrared (SWIR) bands – it is constrained by the low signal-to-noise ratios (SNR) of MODIS Aqua SWIR bands (Wang et al., 2009; Werdell et al., 2010). As demonstrated in previous studies (Shi and Wang, 2007; Wang et al., 2009) and confirmed by our tests, excessive noise in these bands can significantly compromise retrieval accuracy. Therefore, we retained the NIR iterative approach, with enhanced reliability achieved through spatially adaptive aerosol model selection.
2.2.2 Quality Control Strategies
To ensure reliability and comparability of Rrs retrievals, a unified set of QC strategies was applied to both the newly generated data in this study and standard products prior to subsequent analysis. These procedures aimed to eliminate contaminated or highly uncertain retrievals and to support robust evaluation of data accuracy and comparison of valid data yield.
NASA Standard Level-2 Ocean Color Flags (l2_flags) were used to mask pixels affected by clouds, ice, sun glint, stray light, and extreme solar or sensor viewing angles. In addition, pixels flagged as MAXAERITER, indicating that the maximum number of aerosol iterations was reached without convergence, were also excluded to minimize the influence of potential AC failure under complex water or aerosol conditions.
Among these flags, the CLDICE mask was customized for turbid coastal waters by applying a revised threshold (). This adjustment reduces excessive cloud masking over areas with high AOT and turbid waters (Zhao et al., 2023; Zhang et al., 2014) and serves as the targeted first step to recover valid turbid-water pixels that are frequently misclassified. In contrast, the standard Rrs products used for comparison was originally generated with the conventional threshold.
To mitigate the potential inclusion of non-water features resulting from the relaxed cloud mask, a secondary spectral filter was applied. Specifically, any TURBIDW-flagged pixel with Rrs in any of the four blue bands (412–488 nm) exceeding the value at 531 nm was excluded. This criterion effectively identifies cloud-contaminated water pixels whose spectral shapes deviate from typical turbid water profiles – characterized by a reflectance peak near the green wavelengths and decreasing reflectance toward the blue, due to strong absorption by colored dissolved organic matter (CDOM) and Chl (Kirk, 2010). In contrast, cloud-contaminated pixels often exhibit spuriously enhanced blue-band reflectance, resulting in anomalous spectral peaks uncharacteristic of true turbid waters. This filter is hereafter referred to as the “Wrong Turbid Water Mask”.
Extremely turbid waters were also excluded to reduce uncertainty in AC performance. Specifically, pixels exhibiting saturated Rrs signals in the 667 nm band – typically associated with very high suspended sediment concentrations – were filtered out, as such conditions compromise the reliability of both aerosol estimation and water-leaving radiance retrievals (Hu et al., 2012). This step is referred to as the “Saturated Rrs(667) Mask”.
By implementing this multi-step QC framework – comprising initial flagging, targeted cloud mask relaxation with subsequent spectral filtering, and exclusion of unreliable water signals – we prioritize data recovery in challenging coastal regions while proactively controlling for quality, thereby achieving a balance between coverage and reliability. Applying these QC strategies consistently across both datasets ensured that subsequent analyses were based on equivalently screened, quality-assured Rrs products.
2.3 Data Usability Assessment
2.3.1 Accuracy Evaluation
To assess the accuracy of the Rrs data derived with our processing framework and compare it with standard products, satellite–in situ matchups were compiled following NASA OBPG protocols (Bailey and Werdell, 2006). As mentioned in Sect. 2.1.3, both two kinds of satellite Rrs values were re-extracted based on the SeaBASS-provided metadata (e.g., geographic coordinates, acquisition time), with the same stricter QC strategy (Sect. 2.2.2) applied to ensure comparability.
Matchups were identified based on a ±3 h temporal window between satellite overpass and in situ measurement. To ensure spatial representativeness and minimize the impact of pixel-level variability, a 5×5 pixel window centered on the in situ location was extracted from each satellite image. Within each window, only non-land pixels were considered. A matchup was deemed valid only if more than 50 % of the pixels in the window passed QC screening and the coefficient of variation (standard deviation divided by the mean) was below 0.15 – ensuring spatial homogeneity and consistency with in situ conditions.
Rrs accuracy was evaluated using four metrics: regression slope, coefficient of determination (R2), median absolute percentage error (MdAPE), and normalized root mean square error (NRMSE). Among them, MdAPE serves as a robust indicator of relative error, being less sensitive to outliers than MAPE (mean absolute percentage error). NRMSE provides a scale-independent measure suitable for cross-band error comparison. These metrics were calculated as follows:
where Xi and Yi denote the in situ and satellite-derived Rrs values respectively, and N is the number of valid matchups.
2.3.2 Valid Data Yield Comparison
Because valid Rrs retrievals are often restricted by atmospheric conditions and QC thresholds (Wang and Shi, 2006; IOCCG and Wang, 2010), the frequency with which a dataset provides usable values serves as a practical indicator of its spatiotemporal utility. To quantify differences in data availability between the new dataset for coastal waters of China and US and the standard products, we computed a pixel-level metric representing the number of days with valid Rrs retrievals throughout the analysis period. For each pixel and spectral band, the number of days with valid retrievals was counted and denoted as VO (Valid Observation). A retrieval was considered valid if the Rrs value was non-negative and passed all QC filters described in Sect. 2.2.2.
The difference in valid observation counts between the two datasets was defined as:
Here, VOD (Valid Observation Difference) captures the pixel-wise and band-wise difference in the number of valid retrieval days between the new and standard datasets. A positive VOD indicates that the new dataset provided valid Rrs values on more days than the standard dataset at the specific pixel and spectral band.
2.4 Analysis of Spatiotemporal Dynamics
To demonstrate the practical utility of the new Rrs dataset for long-term monitoring, we conducted a preliminary spatiotemporal analysis over the study regions. For each pixel and spectral band, a monthly time series of mean Rrs was first constructed by averaging all valid retrievals within each calendar month over the 20-year period (i.e., 240 monthly averages per pixel). The overall mean of this time series was then calculated and used to visualize the typical spatial patterns of Rrs across the study region.
To detect long-term trends, we applied the seasonal Mann–Kendall test – a non-parametric method that accounts for intra-annual variability and is robust to missing or abnormally distributed data (Mann, 1945; Kendall, 1970) – to the 240-month Rrs time series of each pixel. To ensure reliable trend estimation, only pixels with valid data in at least 50 % of the months were retained. The rate of change (% yr−1) was then calculated by dividing the Mann–Kendall slope by the corresponding long-term mean Rrs for each pixel.
3.1 In Situ Validation
The comprehensive validation (shown in Fig. 3) demonstrates that Rrs products generated with our improved processing framework achieve strong agreement with field observations. The most significant improvement is the correction of the pervasive systematic low bias present in the standard product, as evidenced by the average regression slope across the eight MODIS Aqua bands increasing from 0.90 ± 0.06 to 1.00 ± 0.08. This indicates that the aerosol overcorrection problem inherent to the standard AC algorithm in coastal waters has been substantially mitigated.
The improvement is particularly pronounced in the 488–555 nm range, where the new Rrs data consistently outperform the standard products across all metrics. These results confirm that the use of global gridded aerosol models, providing a regionally informed prior, is highly effective in enhancing retrieval accuracy for water color applications.
Despite these improvements, some challenges remain in the blue bands (412 and 443 nm), where strong absorption and high aerosol sensitivity complicate AC (IOCCG and Sathyendranath, 2014; Kirk, 2010). While the regression slopes improve relative to the standard products, other metrics show slightly reduced performance, likely due to the limited temporal resolution of monthly aerosol models in highly dynamic coastal regions. Nevertheless, the use of geographically informed aerosol priors still helps reduce the overcorrection tendencies typical of the standard products.
In the red bands (667 and 678 nm), the retrievals exhibit a slight overestimation (slopes = 1.06–1.16), attributable to the combined effects of aerosol model uncertainty and the very low water-leaving signal (IOCCG and and Mélin, 2019). Crucially, even with this residual uncertainty, our new data better preserve high Rrs values in turbid waters that are systematically underestimated by the standard product, demonstrating an effective correction of this bias.
In summary, the improved processing framework delivers a substantial advance in coastal Rrs accuracy by using global gridded aerosol models to achieve a major reduction in systematic bias. This establishes a more reliable radiometric foundation for coastal monitoring, long-term change detection, and downstream biogeochemical applications.
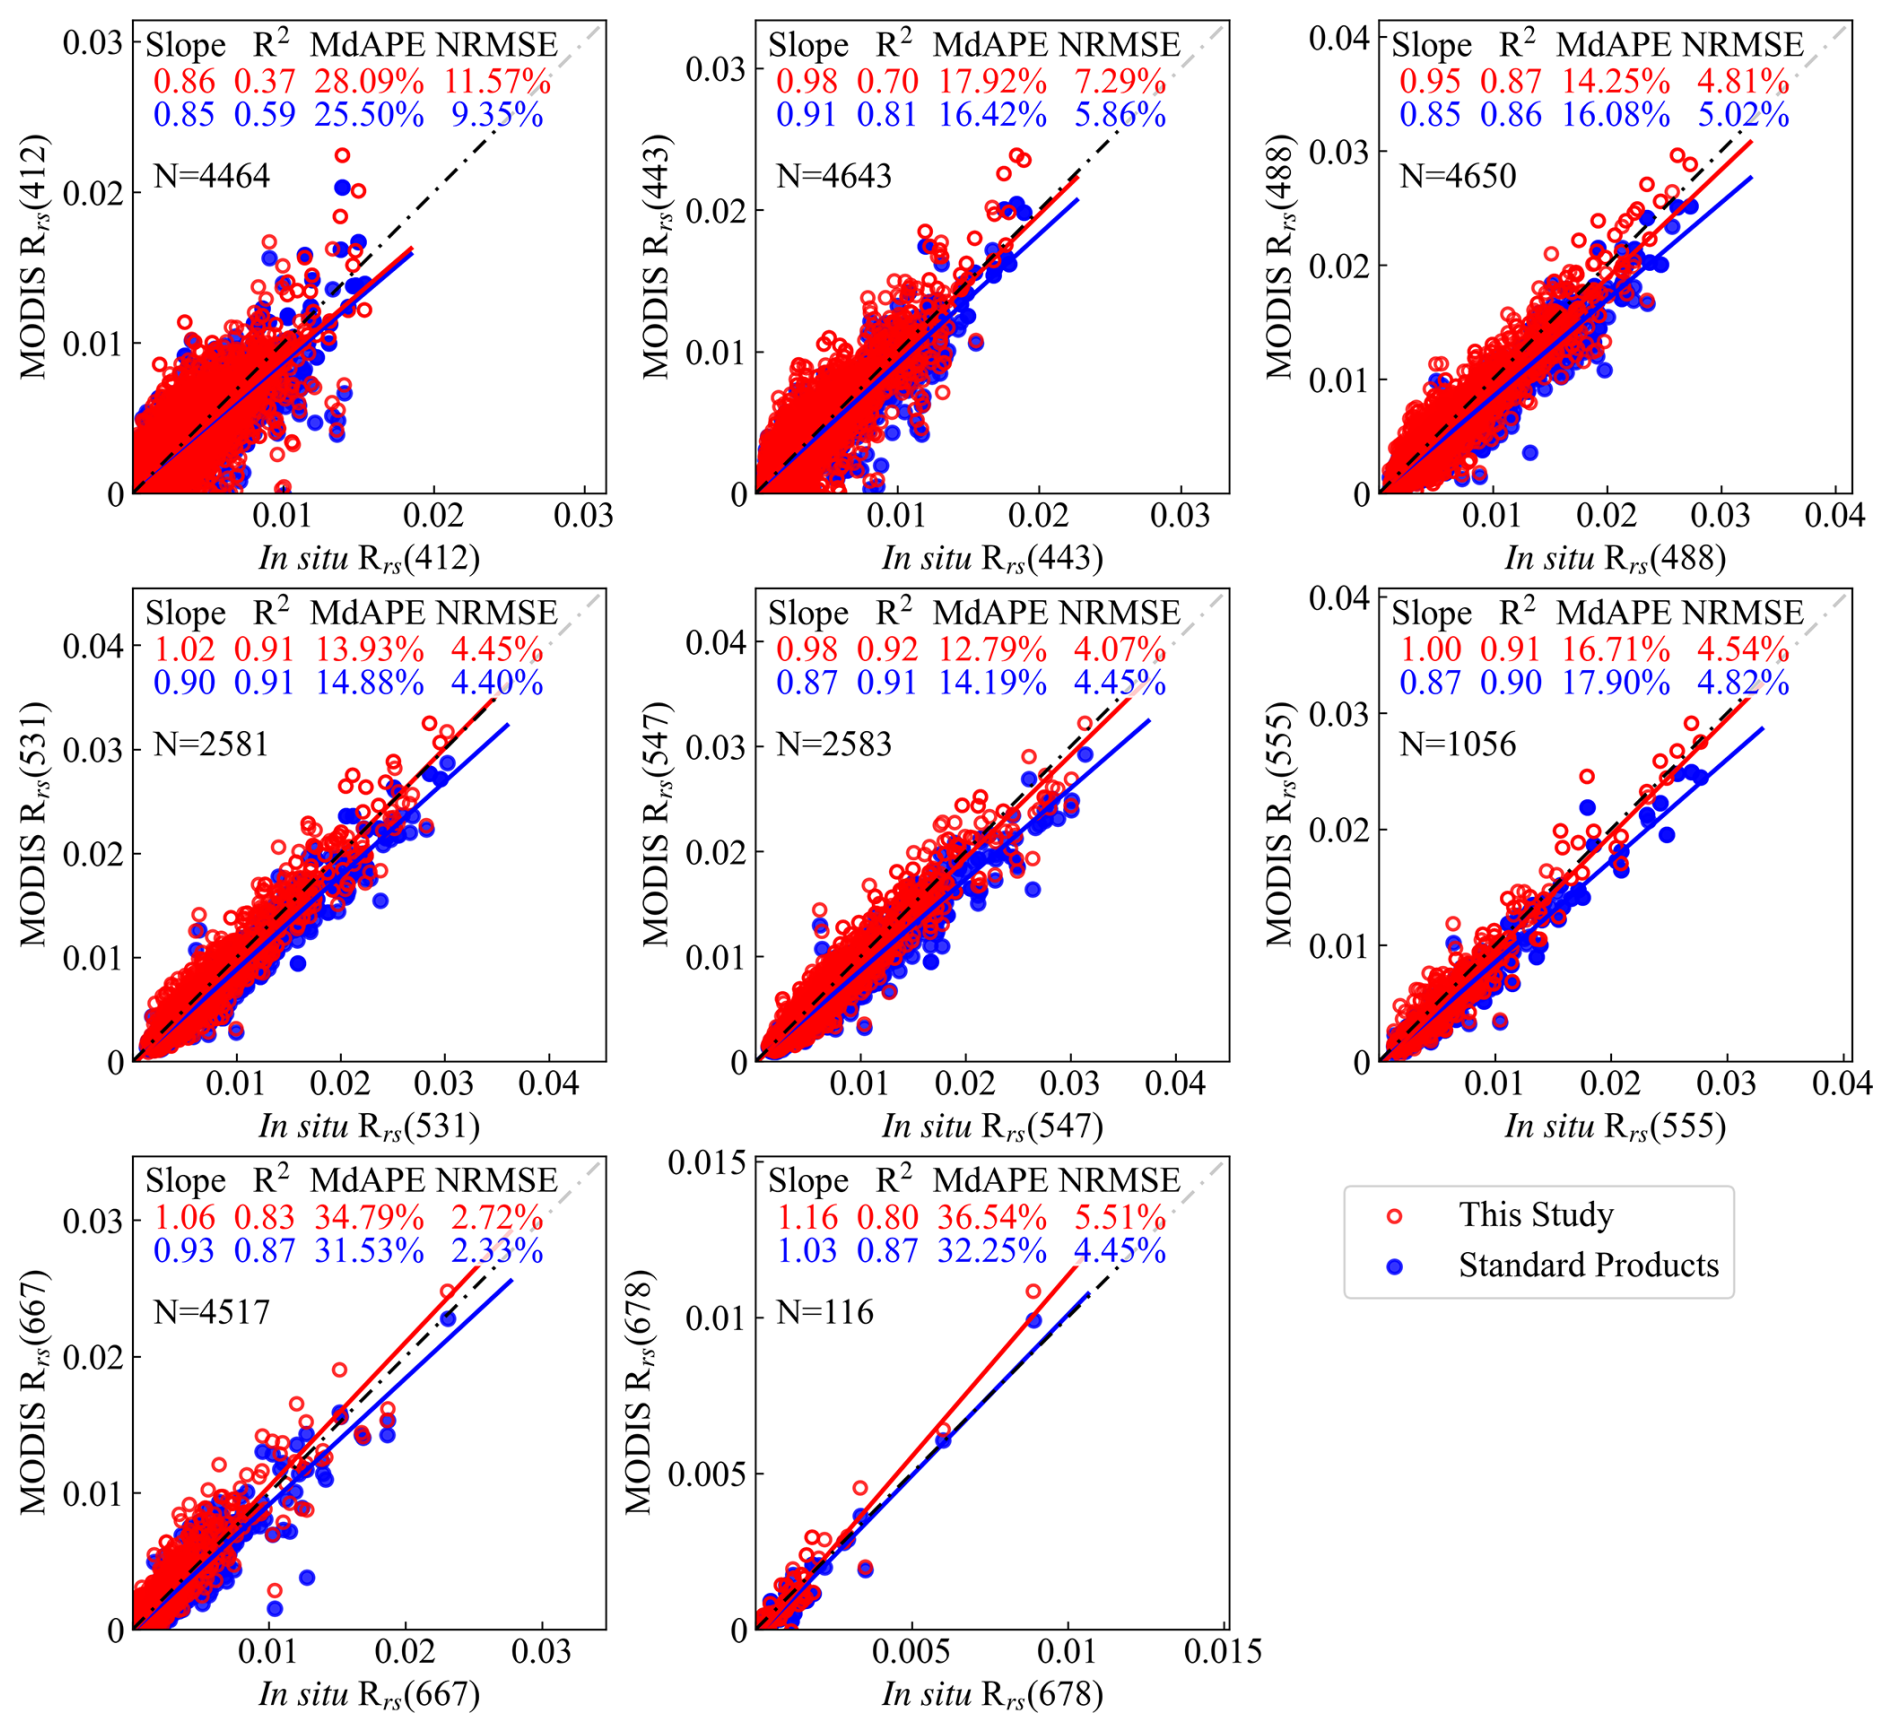
Figure 3Scatter plots showing the validation of Rrs (unit: sr−1) from this study and from NASA standard MODIS Aqua products against in situ measurements across eight spectral bands. Accuracy metrics and the number of match-ups (N) are annotated.
3.2 Valid Data Yield Comparison
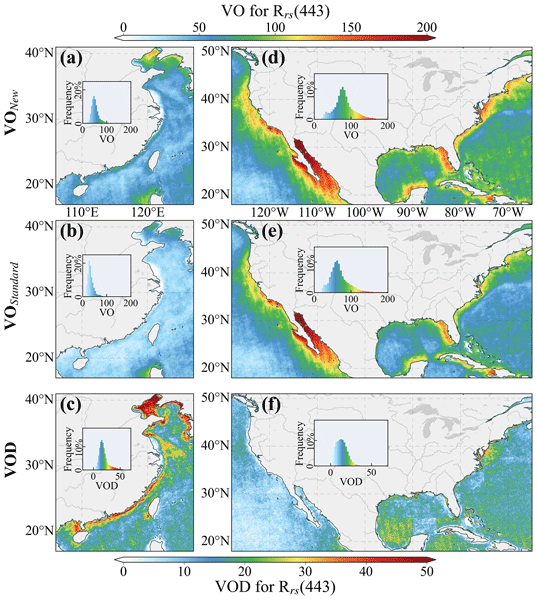
Figure 4 presents the spatial distribution of valid observations (VO) at 443 nm for both the new Rrs dataset and standard products, along with their difference (VOD), over the coastal waters of China and the US in 2007 (region locations shown in Fig. 1). The year 2007 was selected as a reference due to its high data availability and broad spatial coverage in both study regions, providing a practical basis for consistent comparison.
In the Chinese coastal waters, the new dataset consistently yields more valid retrievals than the standard products, with notable improvements in the Bohai Sea, the Yellow Sea, and along the broader coastline. On average, the new dataset provides 50 VO pixel−1 yr−1, with local maxima reaching 140 d in the Bohai Sea – a region where semi-enclosed geography and sediment-laden river inflows result in persistently turbid conditions that challenge conventional AC (Xu et al., 2018). In contrast, the standard products yield an average of 32 VO, with a maximum of ∼ 110 d observed off the northern coast of the Philippines. The resulting VOD indicates an average increase of 18 d yr−1 in the Chinese coastal waters, reaching up to 94 d in some areas. These improvements reflect the enhanced retrieval capacity of the new processing framework in optically complex coastal regions where the standard operational processing tends to underperform.
In the US coastal waters, the difference between the two datasets is generally smaller but still appreciable. The new dataset achieves an average of 80 VO yr−1, compared to 68 of the standard products. Both datasets report their highest VO in the Gulf of California, with values of 232 (new) and 225 (standard). The average VOD in this region is 12 d yr−1, with localized peaks up to 115 d, particularly around Chesapeake Bay, the western Gulf of Mexico, and Cuba.
Overall, the new dataset delivers a regional average increase of 18 d yr−1 in the Chinese coastal waters and 12 d yr−1 in the US coastal waters for Rrs(443), corresponding to relative gains of approximately 56 % and 18 %, respectively. Similar improvements are observed at other visible wavelengths, as illustrated in Figs. 5 and 6 for 547 and 667 nm, further confirming the broader enhancement in valid data yield provided by the new dataset across the visible spectrum.
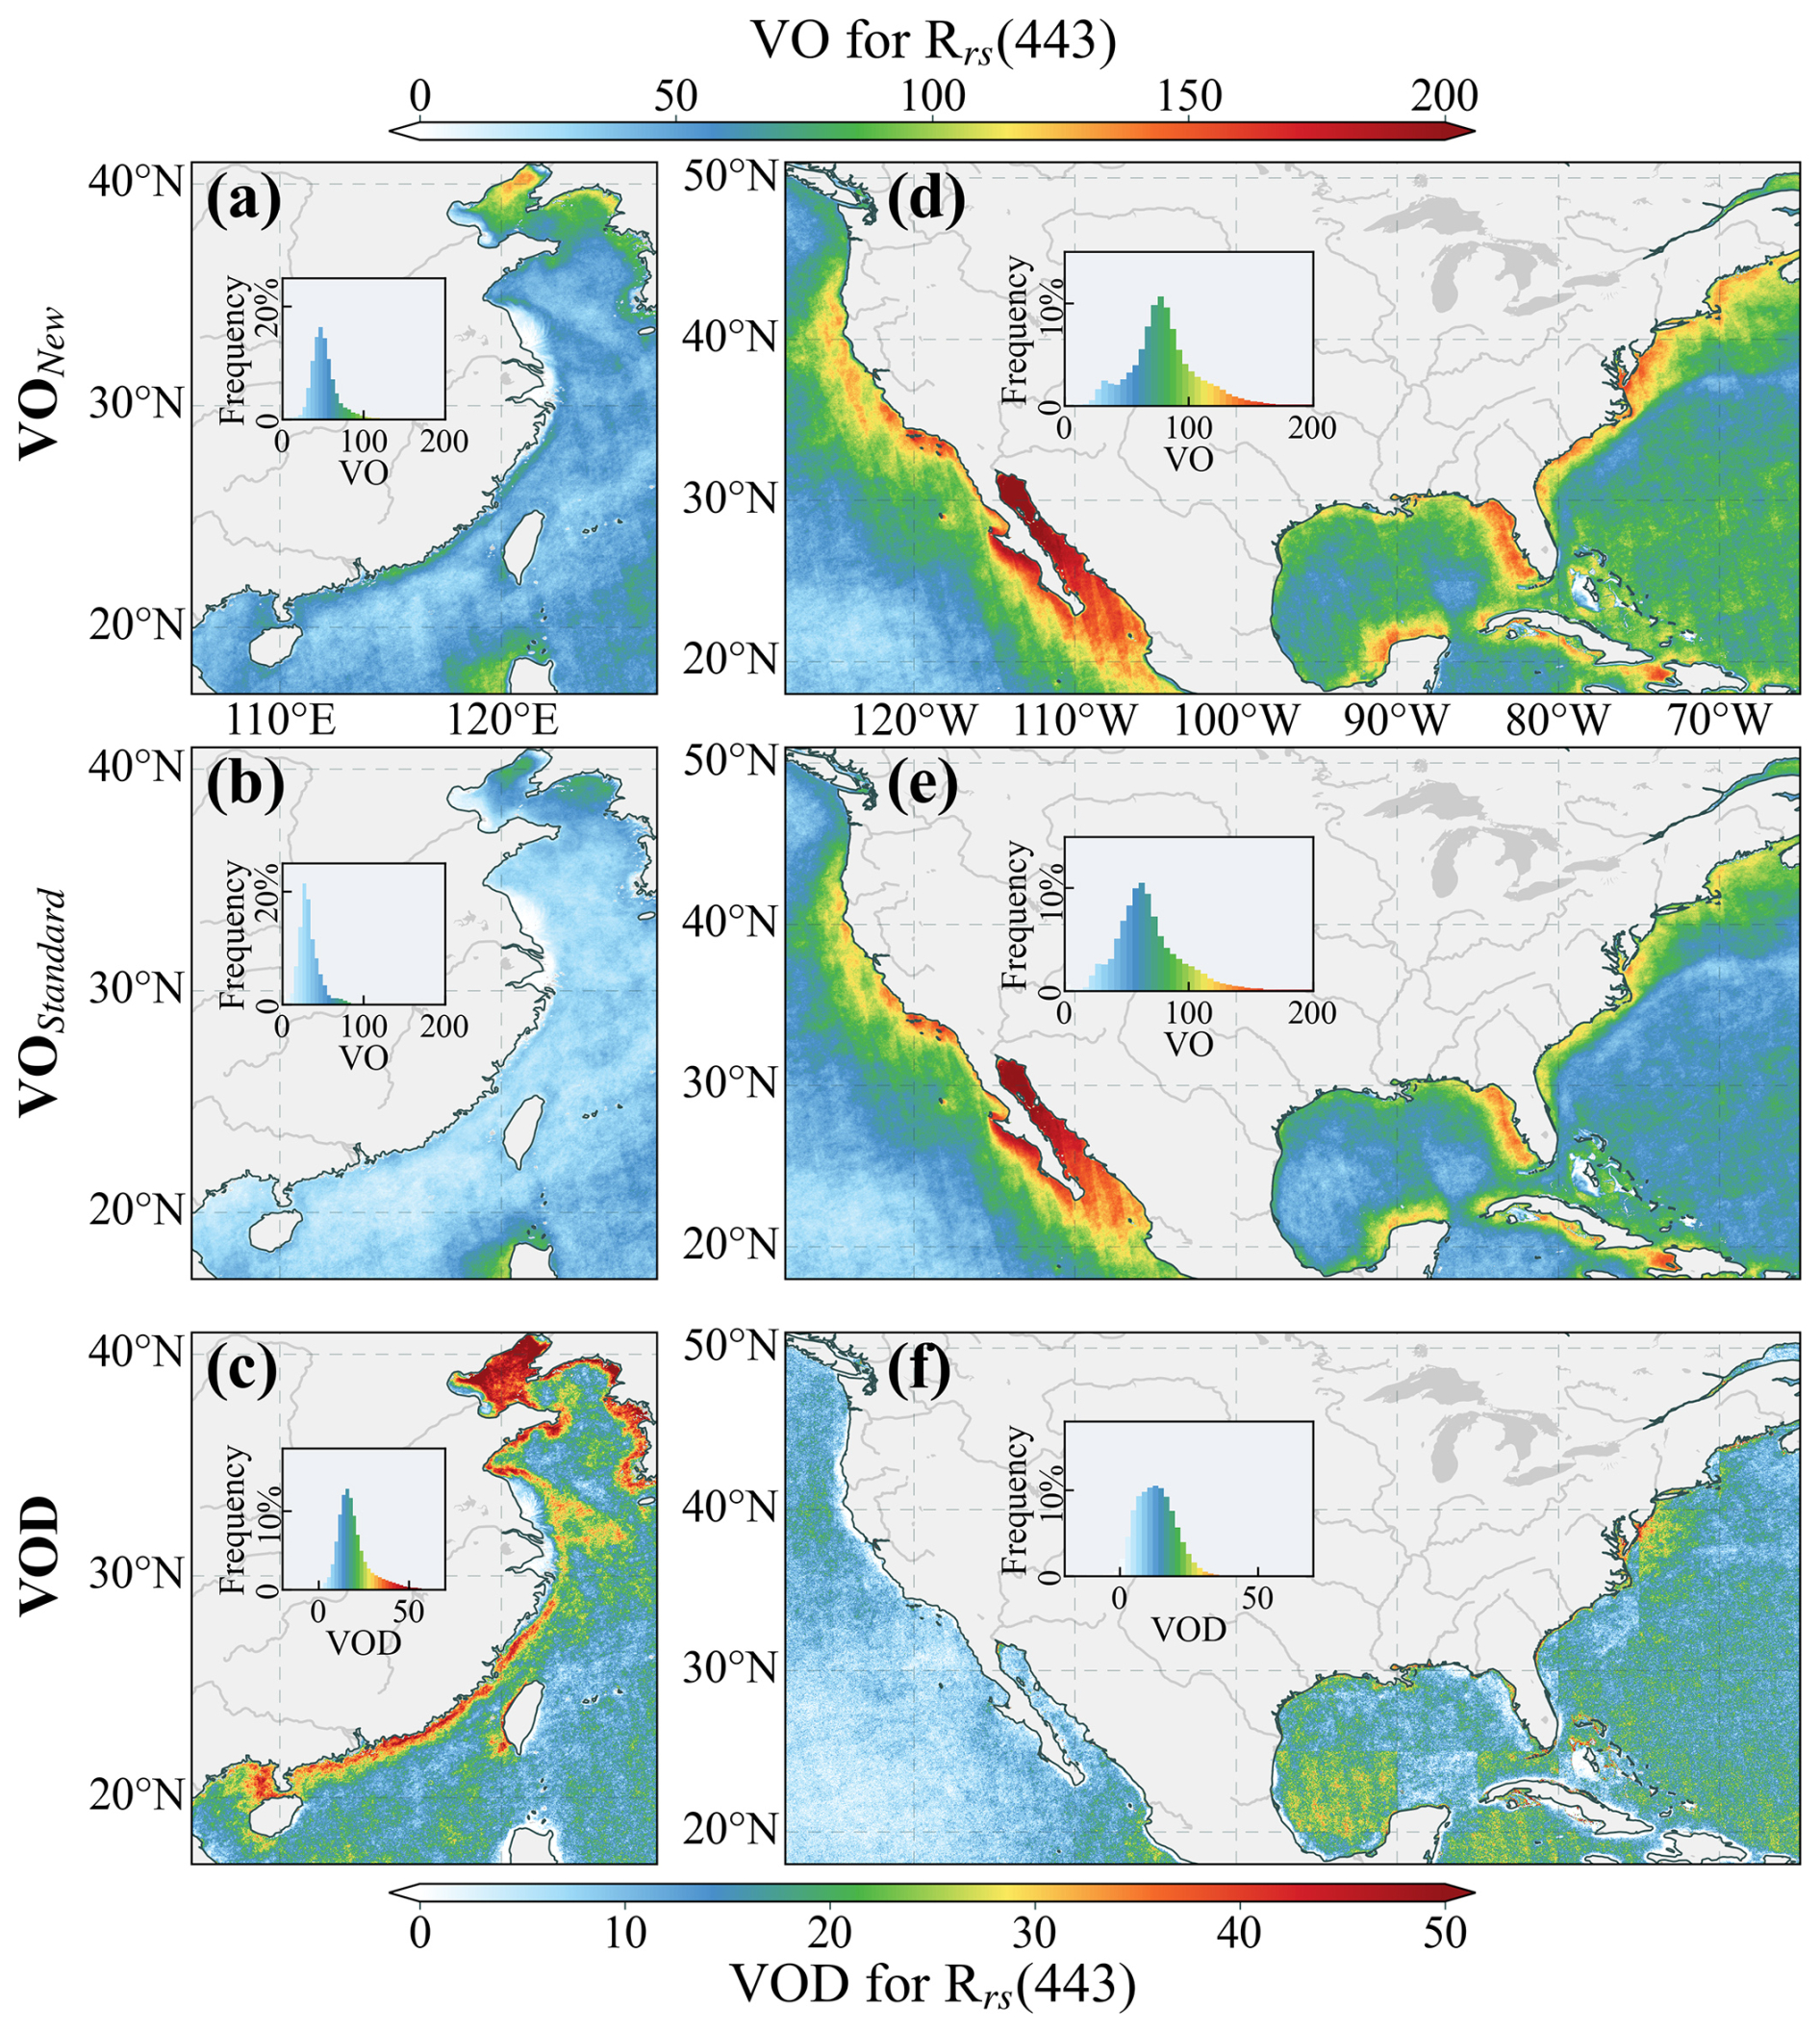
Figure 4Spatial distribution of valid observations for the new dataset (VONew), the standard products (VOStandard) and their difference (VOD, valid observation difference) for Rrs(443) in the coastal waters of China and the United States (US) in 2007.
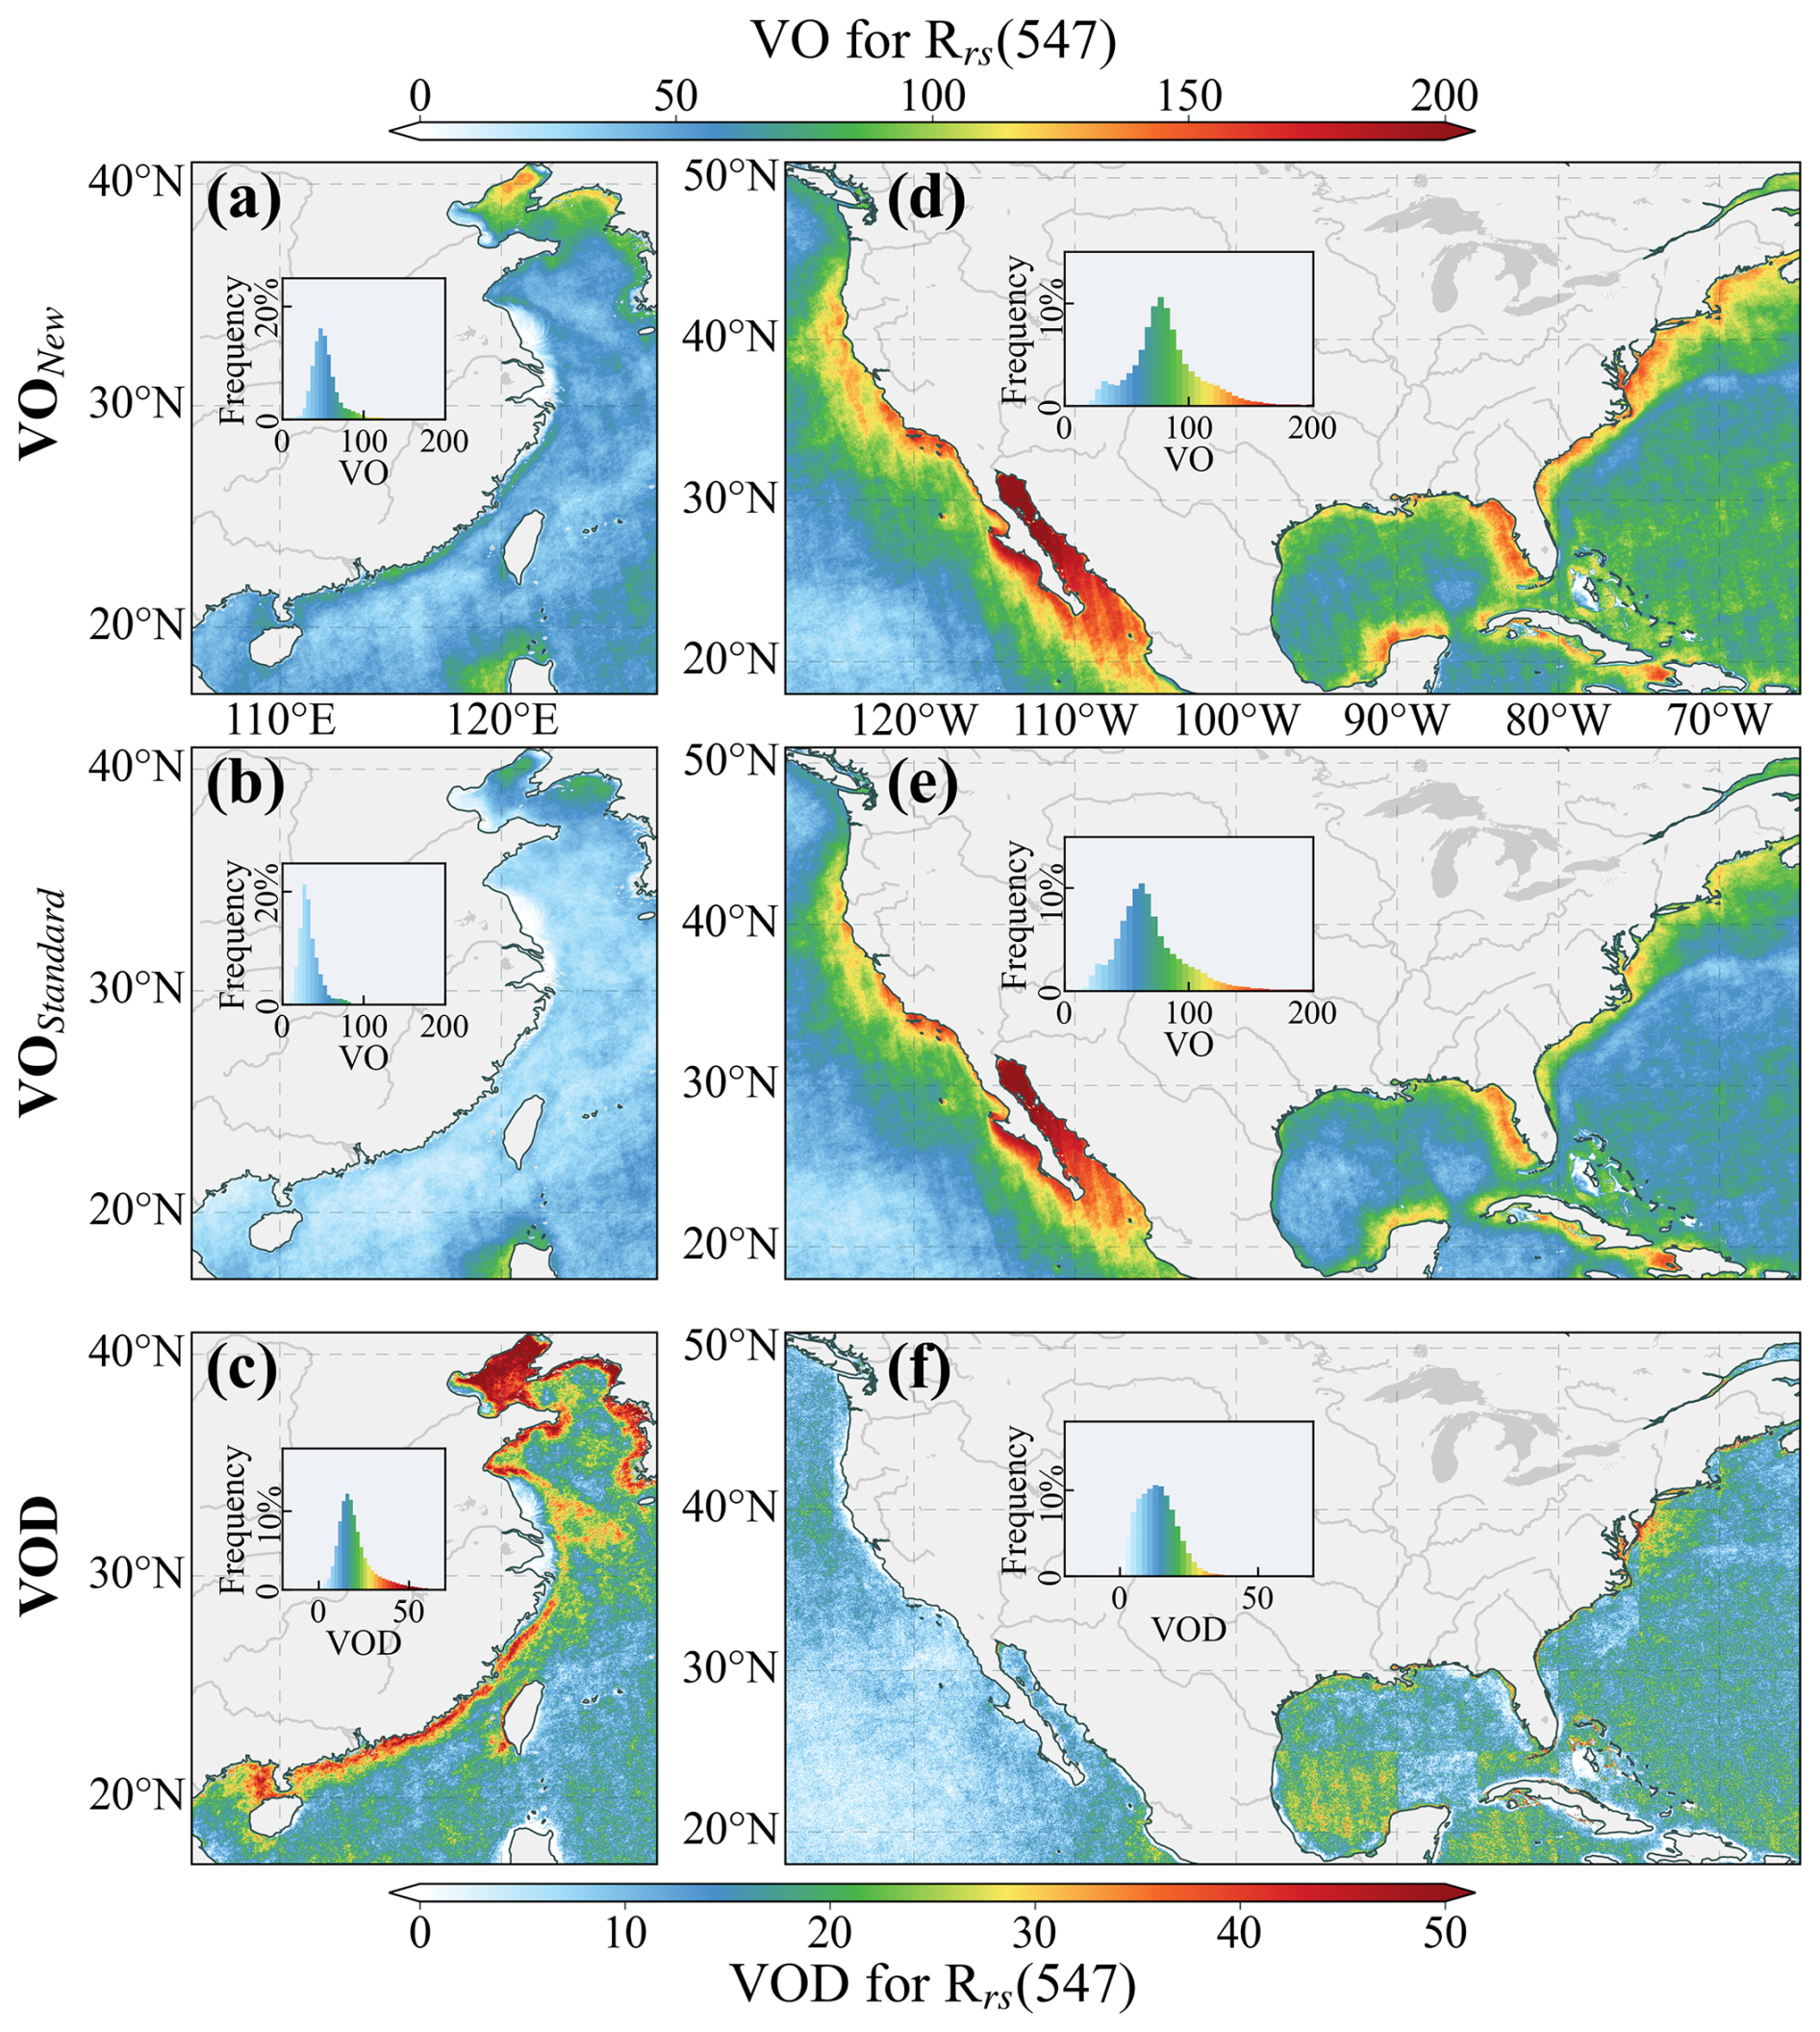
Figure 5Spatial distribution of VONew, VOStandard, and VOD for Rrs(547) in the coastal waters of China and the US in 2007.
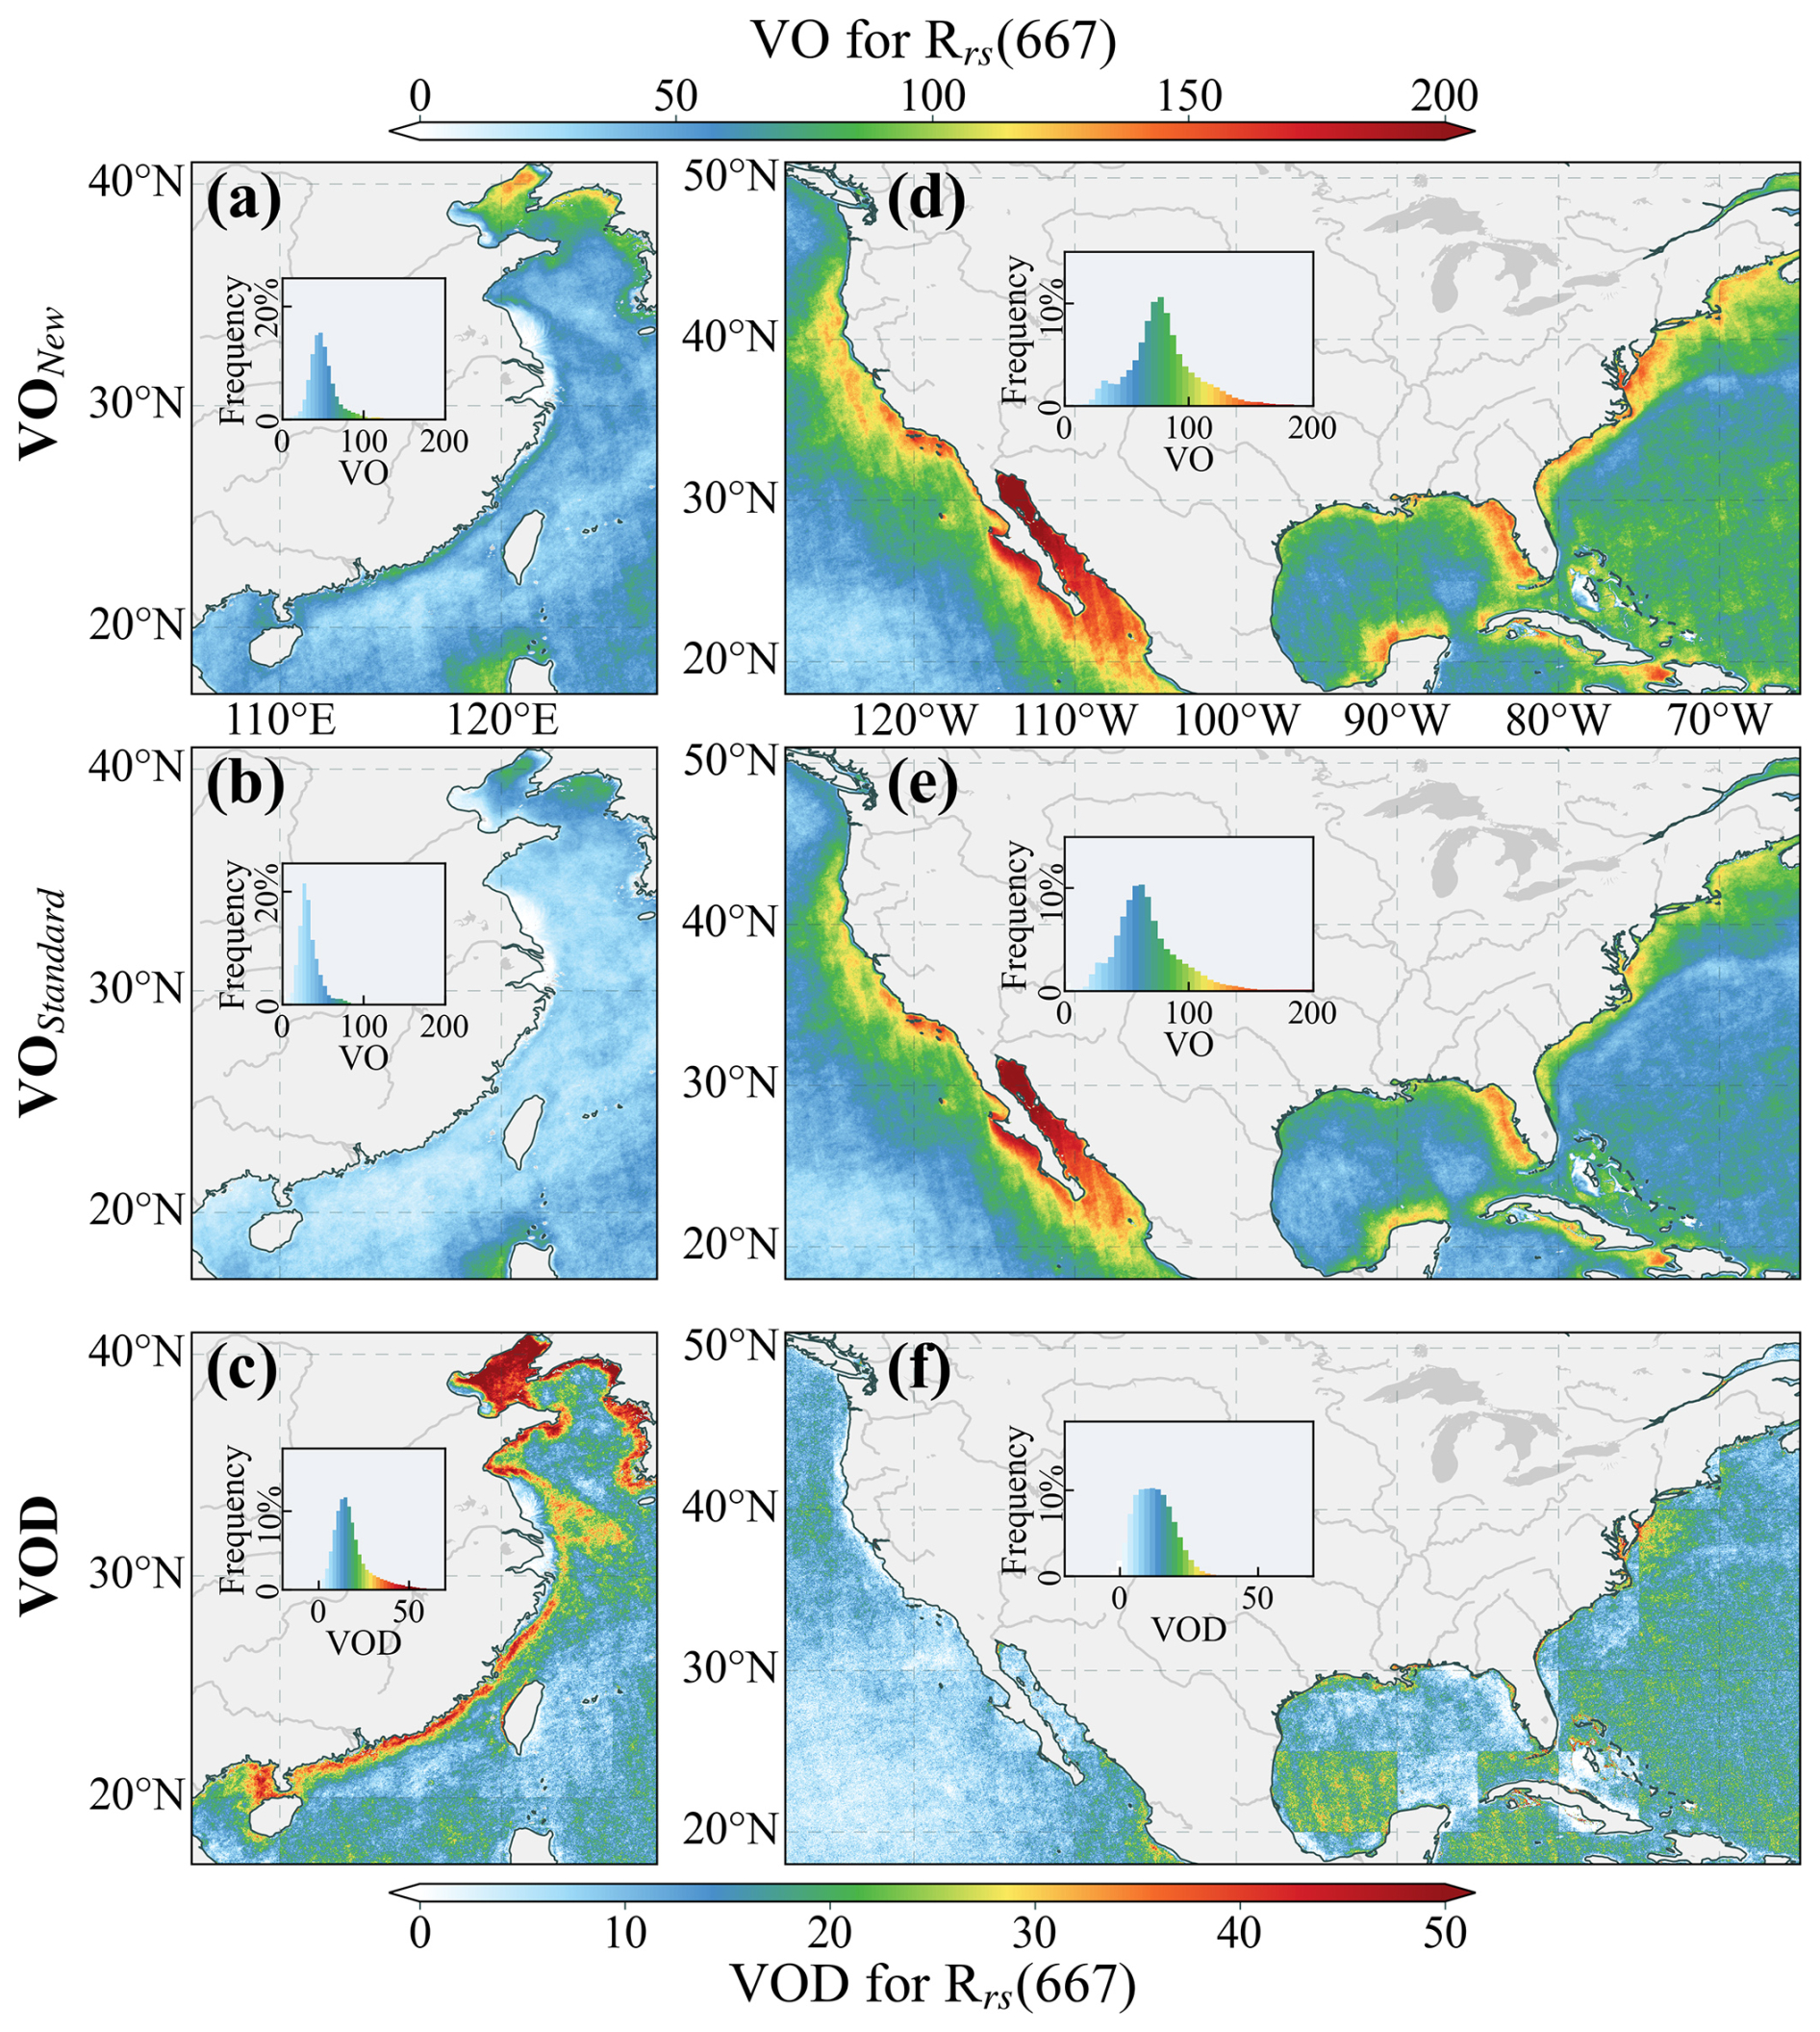
Figure 6Spatial distribution of VONew, VOStandard, and VOD for Rrs(667) in the coastal waters of China and the US in 2007.
Since cloud masking significantly affects the availability of valid satellite ocean color retrievals (Zhao et al., 2023; Zhang et al., 2014), a sensitivity analysis was conducted to isolate the effect of the updated cloud-masking strategy on data availability.
Specifically, we reprocessed the 2007 MODIS data for both study regions using the standard NIR iterative AC algorithm and the AF10 aerosol models, but replaced the default cloud-masking threshold () with the revised threshold () adopted in our processing framework. All other processing steps, including the QC procedures described in Sect. 2.2.2, were kept consistent. This configuration is denoted as AF10&2130, and its VOAF10&2130 was then compared to the new dataset's VONew. Their difference, defined as VODAF10&2130 = VONew − VOAF10&2130, quantifies the change of VO when using the full improved framework beyond the cloud-masking update alone.
Results show that adjusting the cloud-masking threshold alone leads to substantial increases in VO relative to the standard products (VOAF10&2130 in Fig. 7 > VOStandard in Fig. 4), particularly along the Chinese coast. This confirms that the updated threshold more effectively preserves valid water pixels in highly turbid areas that would otherwise be incorrectly excluded.
Interestingly, Fig. 7 shows that VODAF10&2130 is negative in many regions, suggesting that the AF10&2130 configuration can sometimes produce more VO than our full processing framework. However, the added retrievals may not be of comparable quality. Although these additional pixels passed the same QC filters, these filters – especially those based on spectral shape and signal saturation – were optimized for the improved processing framework. Consequently, they may not fully capture retrieval errors specific to the AF10&2130 configuration, especially the known Rrs underestimation issue associated with AF10 models in coastal waters (see Fig. 3).
Overall, the new dataset achieves a more balanced outcome by integrating a spatially adaptive aerosol model selection strategy, an improved cloud mask, and tailored QC criteria. These components jointly enhance not only the data yield but also the reliability of Rrs retrievals in challenging coastal environments.
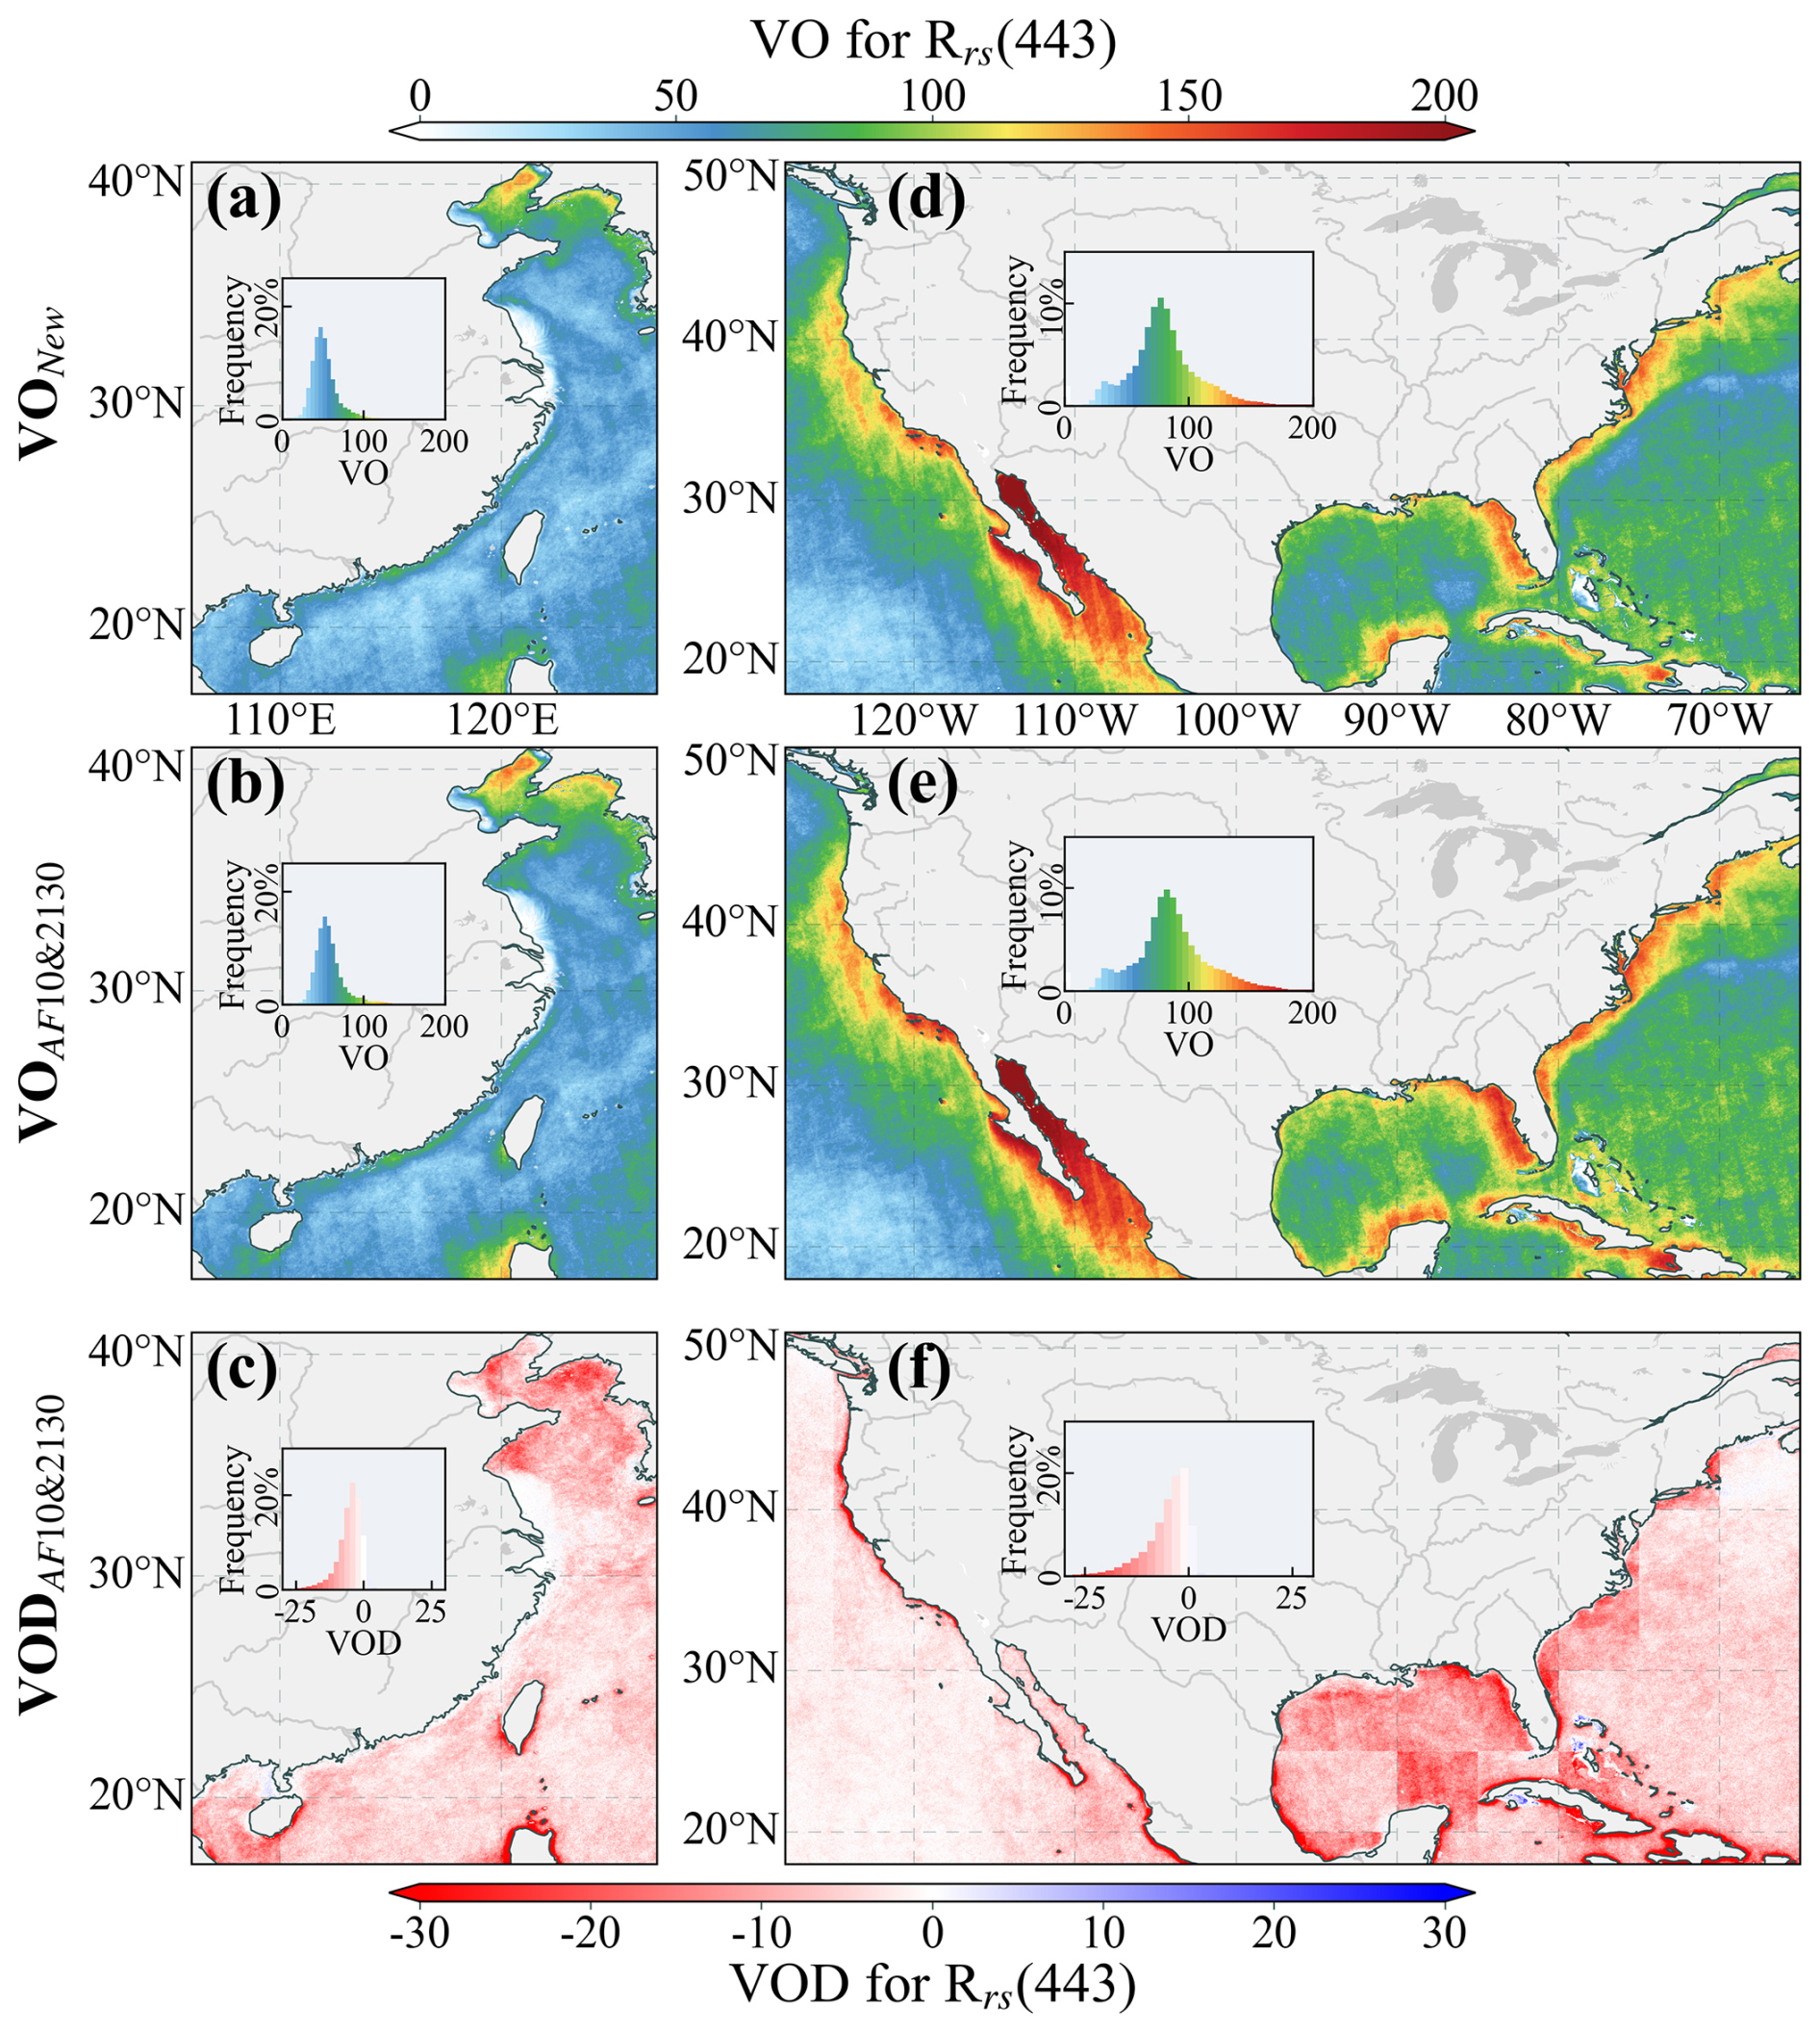
Figure 7Spatial distribution of valid observations for the new dataset (VONew), the AF10&2130 configuration (VOAF10&2130) and their difference (VODAF10&2130 = VONew−VOAF10&2130) for Rrs(443) in the coastal waters of China and the US in 2007.
3.3 Single-Scene Imagery Comparison
To further assess the utility of the new Rrs dataset, we conducted single-scene comparisons across four representative coastal regions: the Pearl River Estuary, the Bohai Sea, the Chesapeake Bay, and the Mississippi River Estuary (see Fig. 1 for their locations). This analysis aimed to evaluate the dataset's ability to capture regional Rrs features under diverse optical conditions, and to delineate the respective contributions of the updated cloud mask and improved aerosol model. To this end, the comparisons include not only our new dataset and the standard product, but also the AF10&2130 configuration (defined in Sect. 3.2) that applies the standard AF10 aerosol models with our updated cloud mask ().
Figures 8 and 9 present the comparative results for the Pearl River Estuary and the Bohai Sea, both of which are characterized by turbid nearshore waters (Liu et al., 2012; Xu et al., 2018). In these regions, the new dataset provides a markedly more extensive coverage of valid data than the standard product. For instance, while the standard products yield few valid pixels within the Pearl River Estuary and large portions of the Bohai Sea, the new dataset successfully recovers these missing observations. This enables the capture of fine-scale coastal structures – such as the distinct high-reflectance band along the Pearl River Estuary's western coast – that are otherwise lost. Critically, the AF10&2130 configuration achieves near-identical spatial coverage of valid pixels, confirming that the relaxed cloud mask is the primary driver for the increased data availability in our new dataset.
However, among the restored turbid water pixels, critical differences exist in the retrieved Rrs values. In specific regions characterized by intense sediment plumes, such as the western coast of the Pearl River Estuary and the central Bohai Sea, the Rrs values retrieved by the AF10&2130 configuration are systematically and significantly lower than those in our new dataset. This pattern is consistent with the known limitation of the standard AF10 models, which tend to overestimate aerosol path radiance in the presence of absorbing aerosols, thereby over-correcting the water-leaving signal and leading to a pervasive low bias. The regionally informed aerosol models integrated into our framework effectively mitigate this issue. Previously validated for strongly absorbing coastal regions like the Bohai Sea (Lv et al., 2024; Zhao et al., 2023), these models provide a more accurate representation of local aerosol properties. Consequently, within the sample windows (marked by black rectangles in Figs. 8 and 9), our new dataset yields higher and physically more plausible Rrs values. For example, the mean Rrs(547) in the Pearl River Estuary window increases from approximately 0.0233 sr−1 (AF10&2130) to 0.0270 sr−1, representing a more realistic spectral magnitude for these turbid waters.
We further examined two representative regions in the US coastal waters: the Chesapeake Bay and the Mississippi River Estuary. The same three-way comparisons presented in Figs. 10 and 11 (new dataset, standard product, AF10&2130) corroborate the findings from the Chinese seas. The relaxed cloud mask remains the primary driver for increased data coverage, recovering valid pixels in areas (e.g., the northern Chesapeake Bay and western Mississippi River Delta) that are typically flagged in the standard product. Meanwhile, the improved aerosol model ensures the radiometric fidelity of these recovered pixels. Within the highlighted sample windows, the new dataset yields Rrs values that are consistently higher than the AF10&2130 baseline – for example, approximately 0.0242 sr−1 versus 0.0199 sr−1 in the Chesapeake Bay at 547 nm – further evidencing the mitigation of systematic underestimation. These consistent results across geographically and optically diverse waters confirm that the observed improvements are not region-specific.
The analysis of the QC masks provides further insight. The missing pixels in the standard product are primarily flagged as cloud- or ice-contaminated, which is a misclassification attributable to the high reflectance of turbid water at 869 nm. Our updated cloud mask successfully recognizes these pixels as valid water observations. Furthermore, the new dataset's complementary QC filters (e.g., the “Wrong Turbid Water Mask” and “Saturated Rrs(667) Mask” introduced in Sect. 2.2.2) work in tandem with the relaxed cloud mask. These filters enhance overall reliability by screening out pixels with anomalous spectral features, ensuring that data quality is maintained even if the detection constraints are relaxed.
Nevertheless, the new dataset still fails to retrieve valid data in certain extremely turbid waters, such as portions of the western Bohai Sea, indicating remaining challenges in AC for waters with exceptionally high reflectance. In summary, the integrated framework underlying our new dataset delivers a substantial advancement: it significantly increases data availability in coastal zones through a tailored cloud mask, while concurrently ensuring the radiometric accuracy of the recovered data through optimized aerosol correction and specialized QC filters. This dual improvement enhances the dataset's suitability for detailed ocean color analysis and reliable water quality monitoring in optically complex nearshore environments.
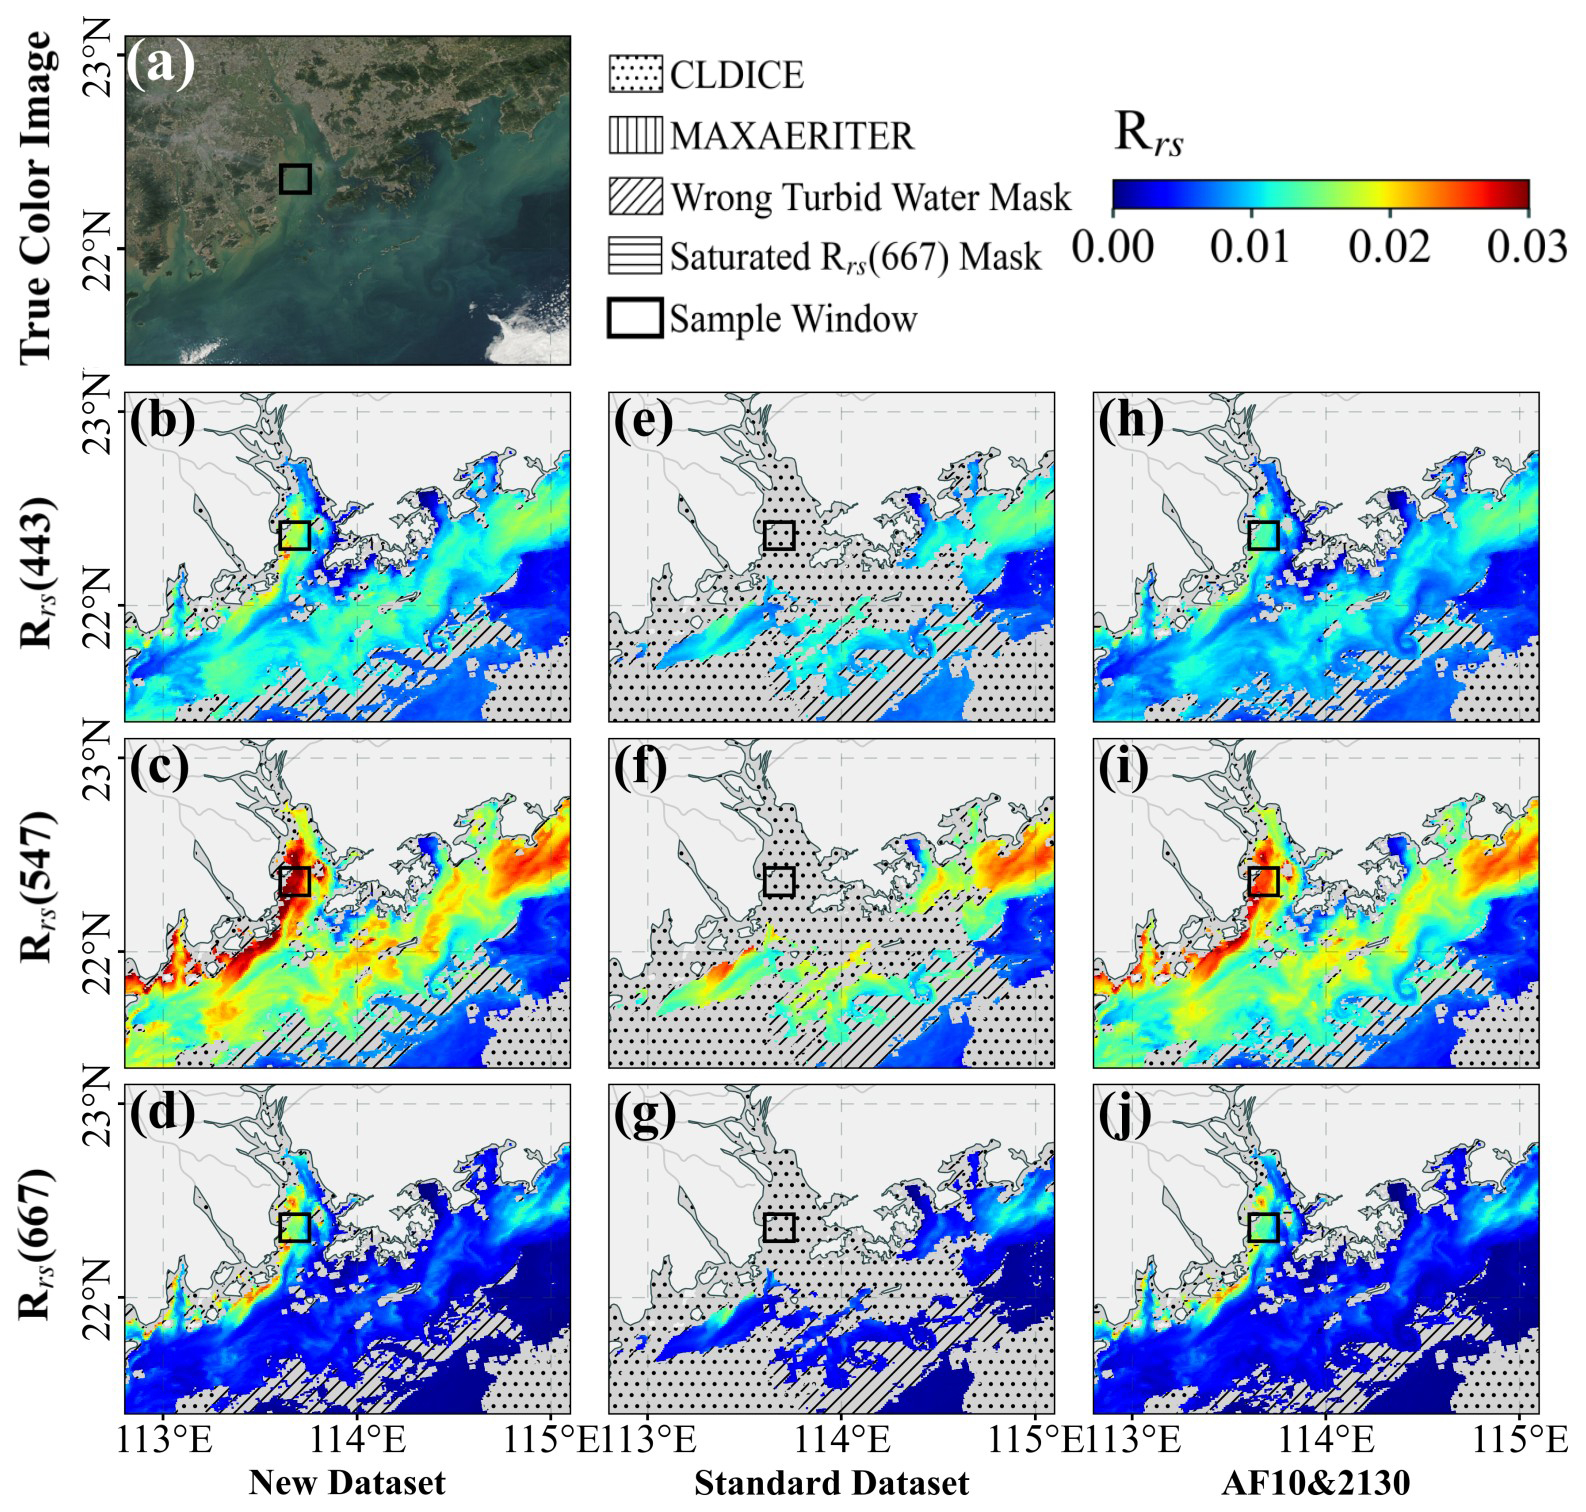
Figure 8Comparison of Rrs (units: sr−1) derived from single-scene MODIS Aqua observations over the Pearl River Estuary (14 December 2014). The top image shows a true color composite (a), followed by Rrs at 443, 547, and 667 nm from the new dataset (b–d), from the standard dataset (e–g) and from the AF10&2130 configuration (h–j). Invalid pixels are marked with hatched patterns based on quality control masks. Black rectangles mark the sample windows where average Rrs values are calculated and compared quantitatively in the text.
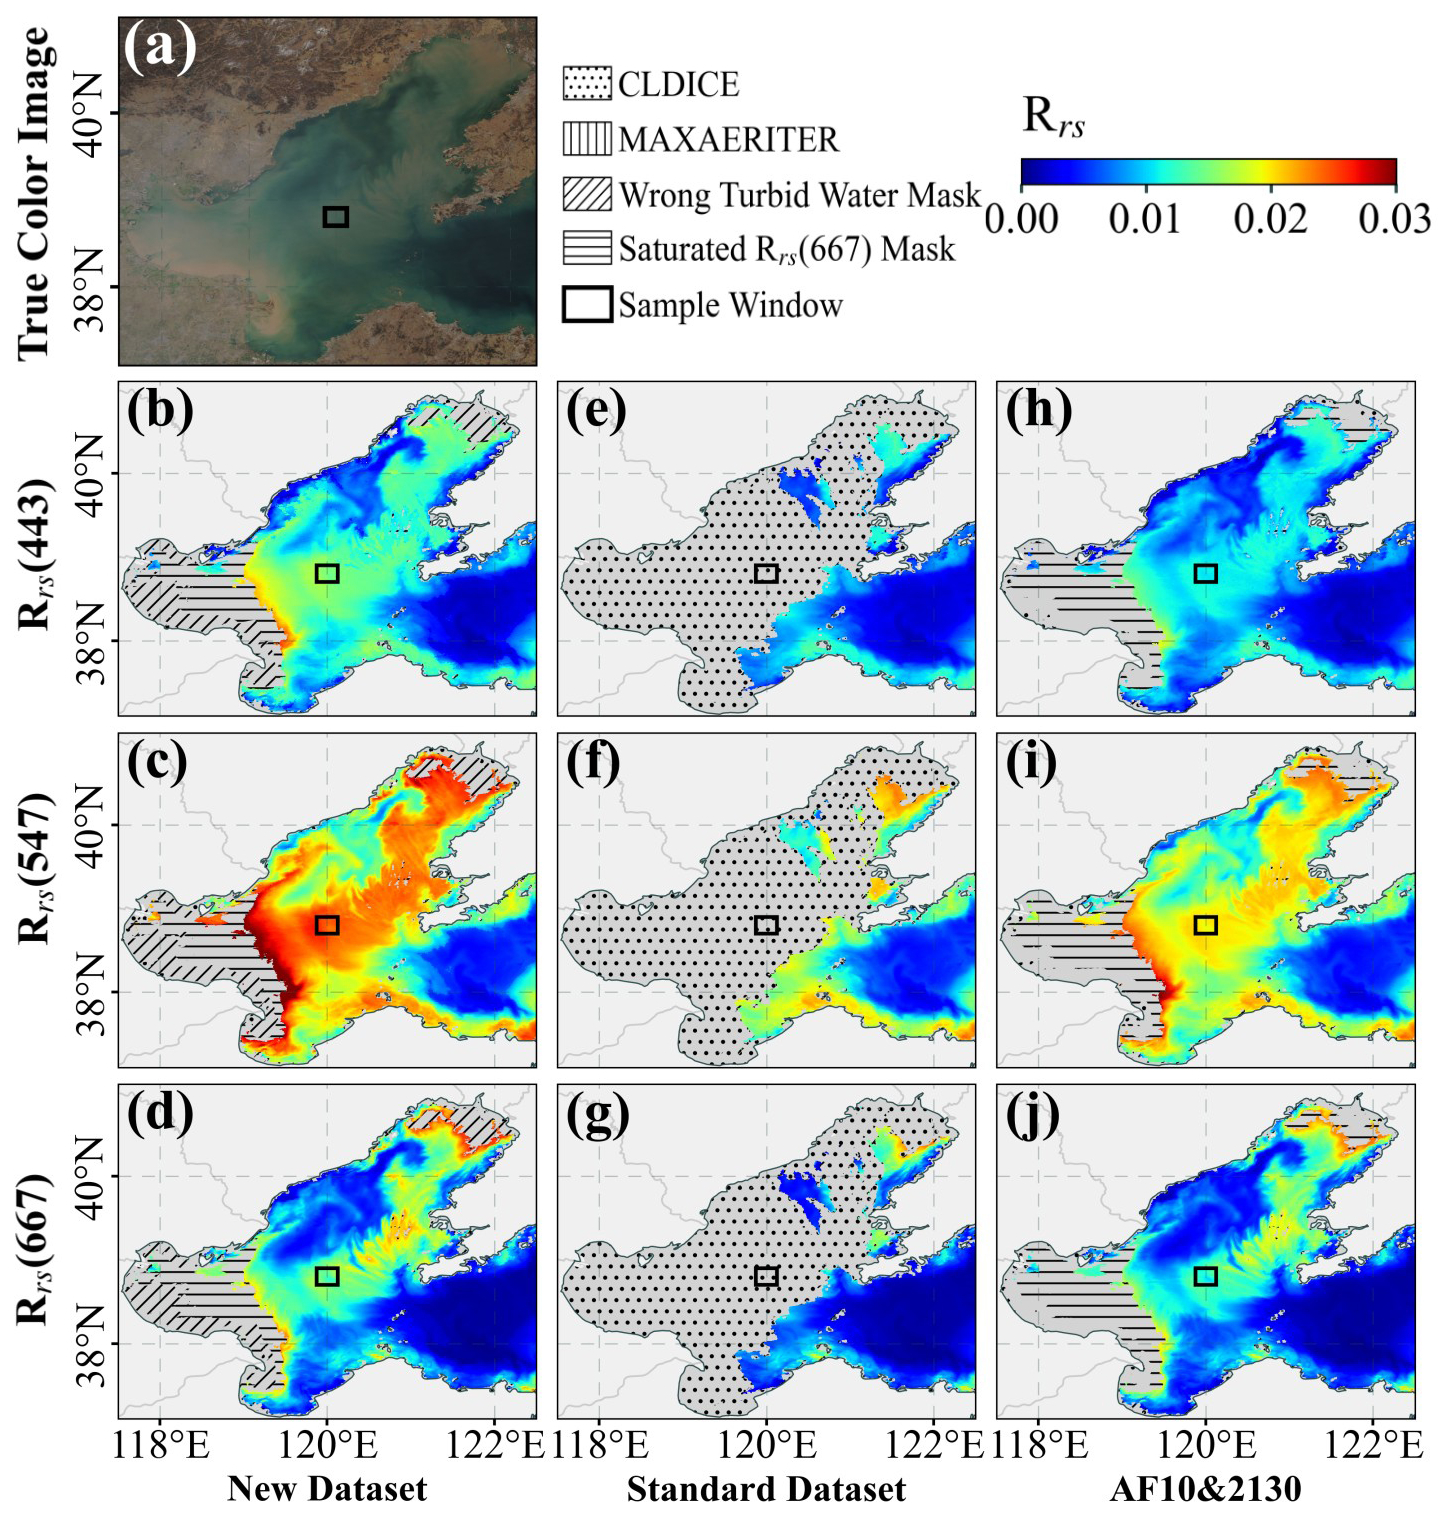
Figure 9Comparison of Rrs (units: sr−1) derived from single-scene MODIS Aqua observations over the Bohai Sea (11 March 2020). The top image shows a true color composite (a), followed by Rrs at 443, 547, and 667 nm from the new dataset (b–d), from the standard dataset (e–g) and from the AF10&2130 configuration (h–j). Invalid pixels are marked with hatched patterns based on quality control masks. Black rectangles mark the sample windows where average Rrs values are calculated and compared quantitatively in the text.
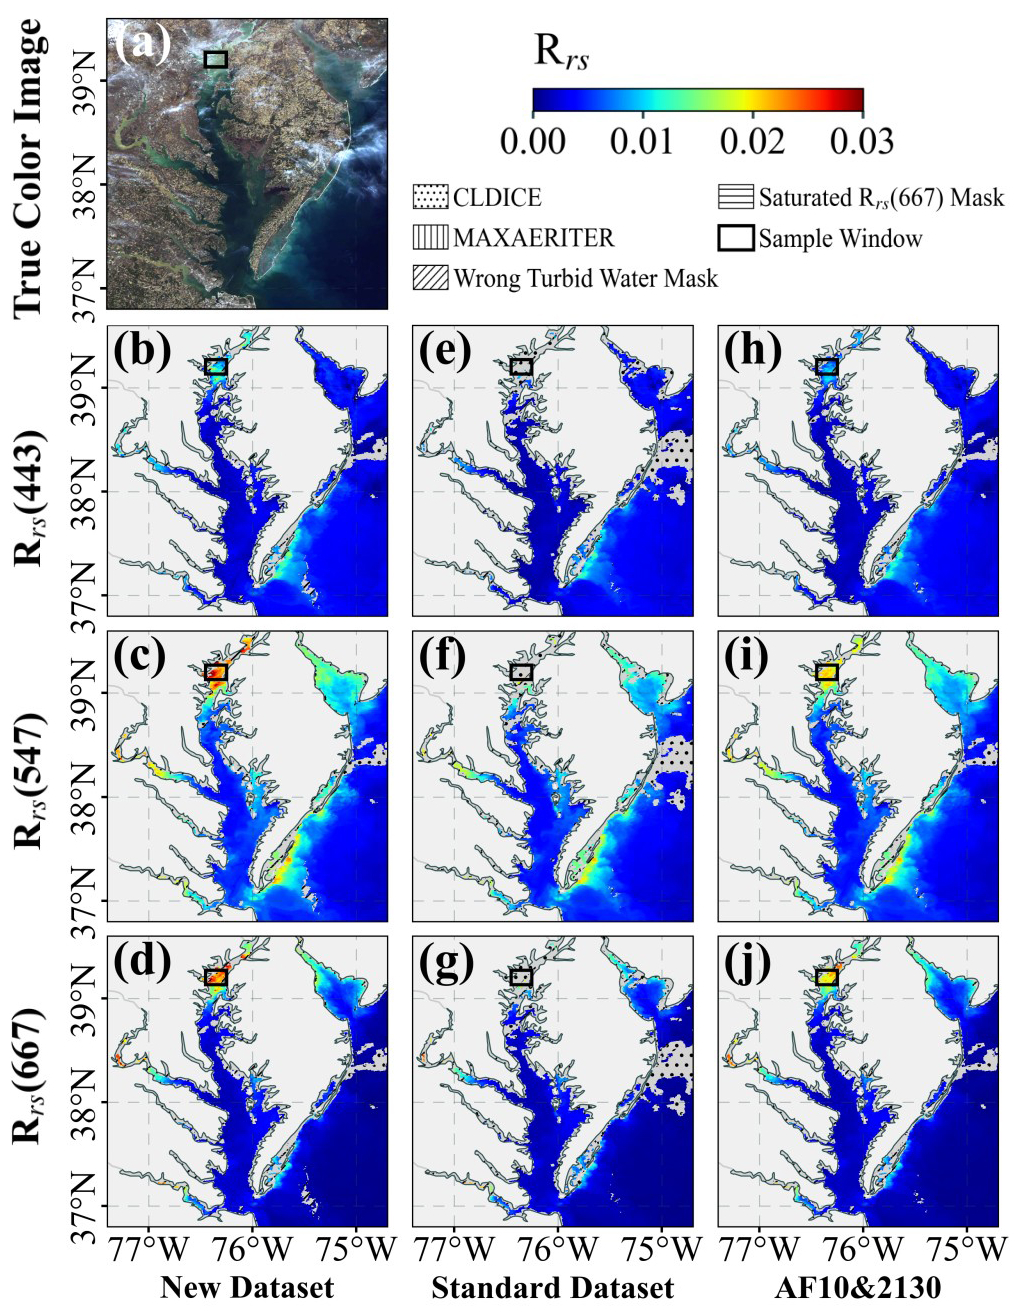
Figure 10Comparison of Rrs (units: sr−1) derived from single-scene MODIS Aqua observations over the Chesapeake Bay (5 February 2019). The top image shows a true color composite (a), followed by Rrs at 443, 547, and 667 nm from the new dataset (b–d), from the standard dataset (e–g) and from the AF10&2130 configuration (h–j). Invalid pixels are marked with hatched patterns based on quality control masks. Black rectangles mark the sample windows where average Rrs values are calculated and compared quantitatively in the text.
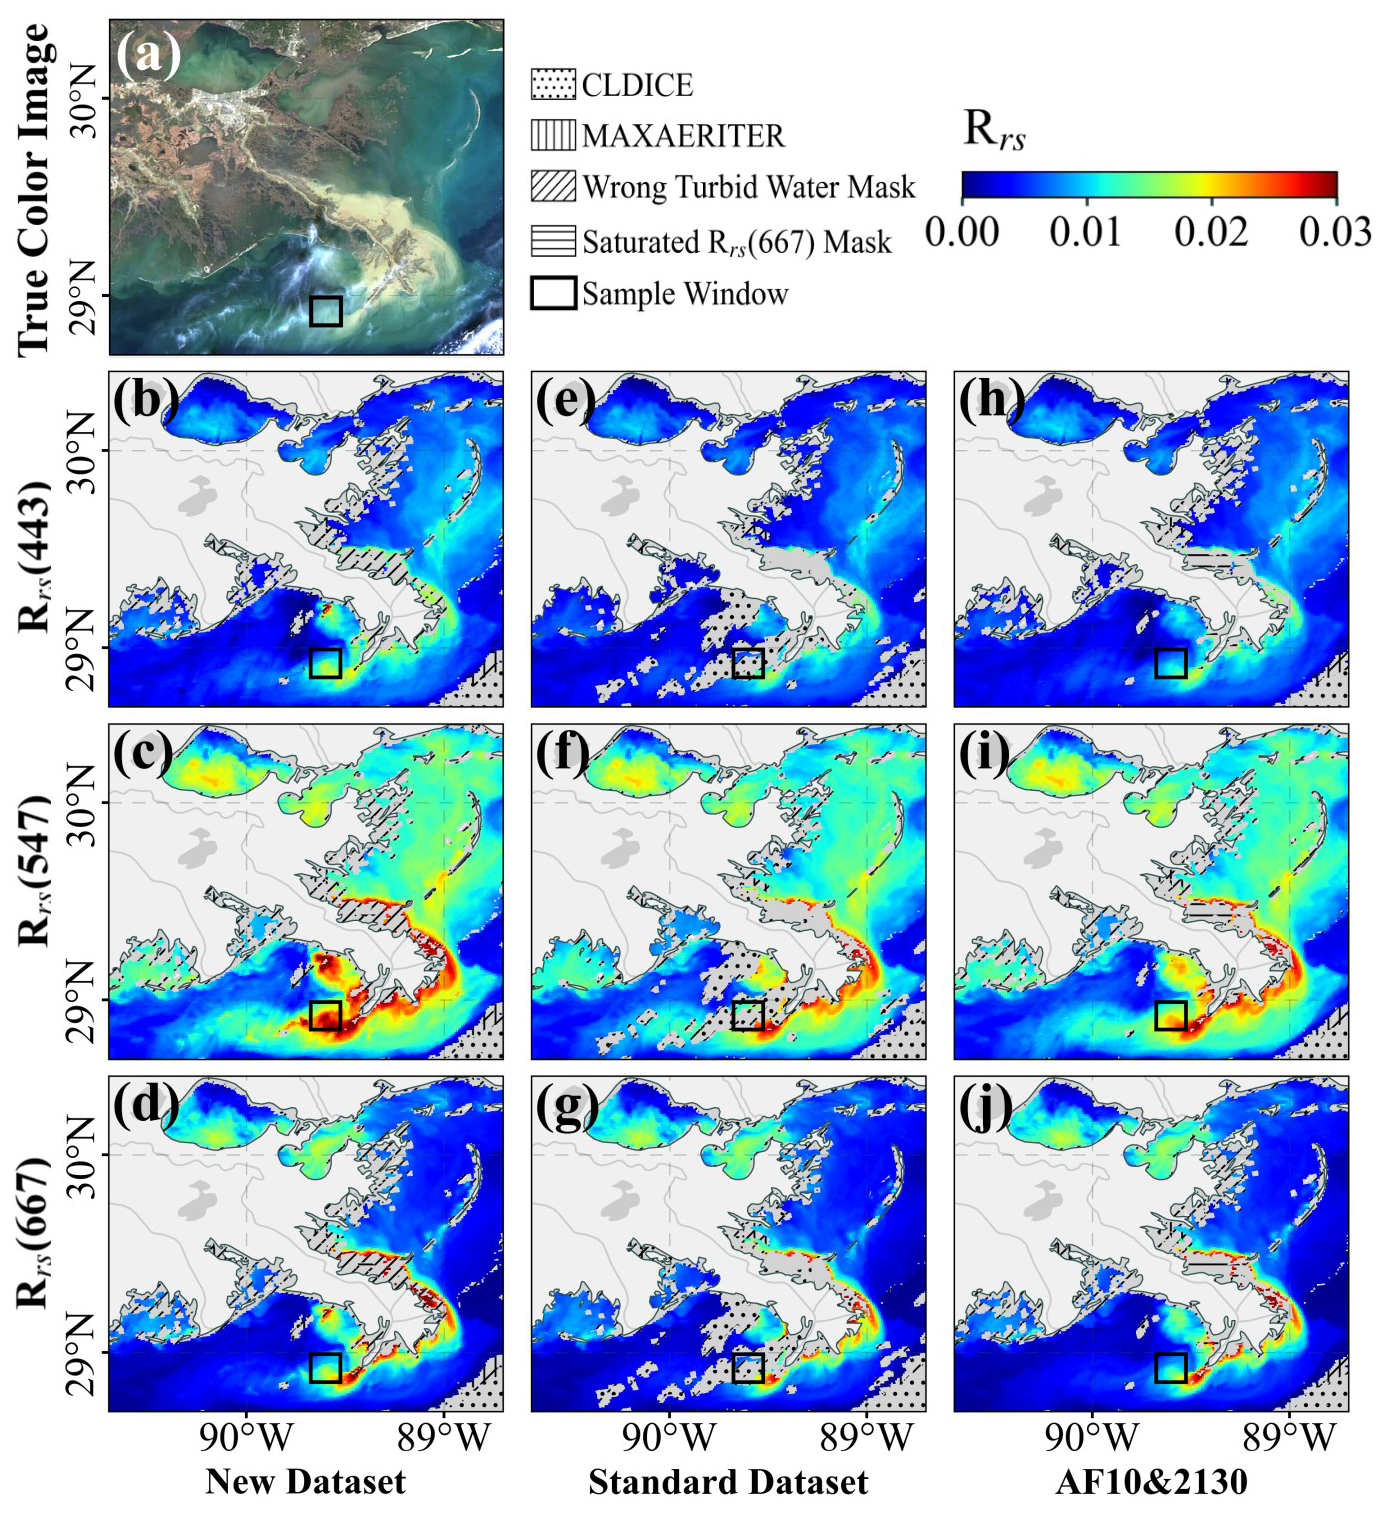
Figure 11Comparison of Rrs (units: sr−1) derived from single-scene MODIS Aqua observations over the Mississippi River Estuary (13 January 2021). The top image shows a true color composite (a), followed by Rrs at 443, 547, and 667 nm from the new dataset (b–d), from the standard dataset (e–g) and from the AF10&2130 configuration (h–j). Invalid pixels are marked with hatched patterns based on quality control masks. Black rectangles mark the sample windows where average Rrs values are calculated and compared quantitatively in the text.
3.4 Spatiotemporal Patterns and Trends
Figure 12 illustrates the spatial distribution of long-term mean Rrs values at 443, 547, and 667 nm for the coastal waters of China and the US over the 2003–2022 period. These patterns reveal clear wavelength dependence and regional variability.
In Chinese coastal waters (Fig. 12a–c), the regional average Rrs(443) is 0.00679 sr−1, rising to 0.00866 sr−1 within the 30 m isobath (marked by the white dashed line), where optically complex conditions dominate. Notably high Rrs(443) values are observed in nearshore areas such as the western Bohai Sea (0.00738 sr−1), the Yangtze River Estuary and Hangzhou Bay (0.01213 sr−1), the Pearl River Estuary, and the eastern Beibu Gulf. These high Rrs(443) values persist despite strong absorption by high concentrations of CDOM and Chl, suggesting that backscattering by suspended sediments dominates the blue reflectance signal in these turbid waters (Kirk, 2010; Feng et al., 2014; Ye et al., 2016). In contrast, significantly low Rrs(443) values (< 0.003 sr−1) occur in the central and northern Yellow Sea, where sediment loads are reduced and absorption remains high, resulting in suppressed reflectance in the blue band (Kirk, 2010; Ye et al., 2016; Ling et al., 2020). At longer wavelengths (547 and 667 nm), high Rrs values are more restricted to highly turbid nearshore and estuarine waters. Within the 30 m isobath, the mean Rrs(547) and Rrs(667) values reach 0.01551 and 0.00819 sr−1, respectively, decreasing to 0.00506 and 0.00184 sr−1 farther offshore. These spatial patterns reflect the varying contributions of optically active constituents to spectral reflectance.
In US coastal waters (Fig. 12d–f) the long-term mean Rrs values exhibit distinct spatial features. At 443 nm, high Rrs values (> 0.03 sr−1) are found around the shallow Bahamas Banks, while low values (< 0.003 sr−1) dominate the East and West Coasts of the US, indicative of strong absorption by CDOM and Chl (Mannino et al., 2008; Kirk, 2010). At 547 and 667 nm, high Rrs values are observed in regions such as the northwestern Gulf of California, the Gulf of Mexico coast, and around Chesapeake Bay. As in the Chinese coastal waters, Rrs decreases sharply with increasing distance from shore.
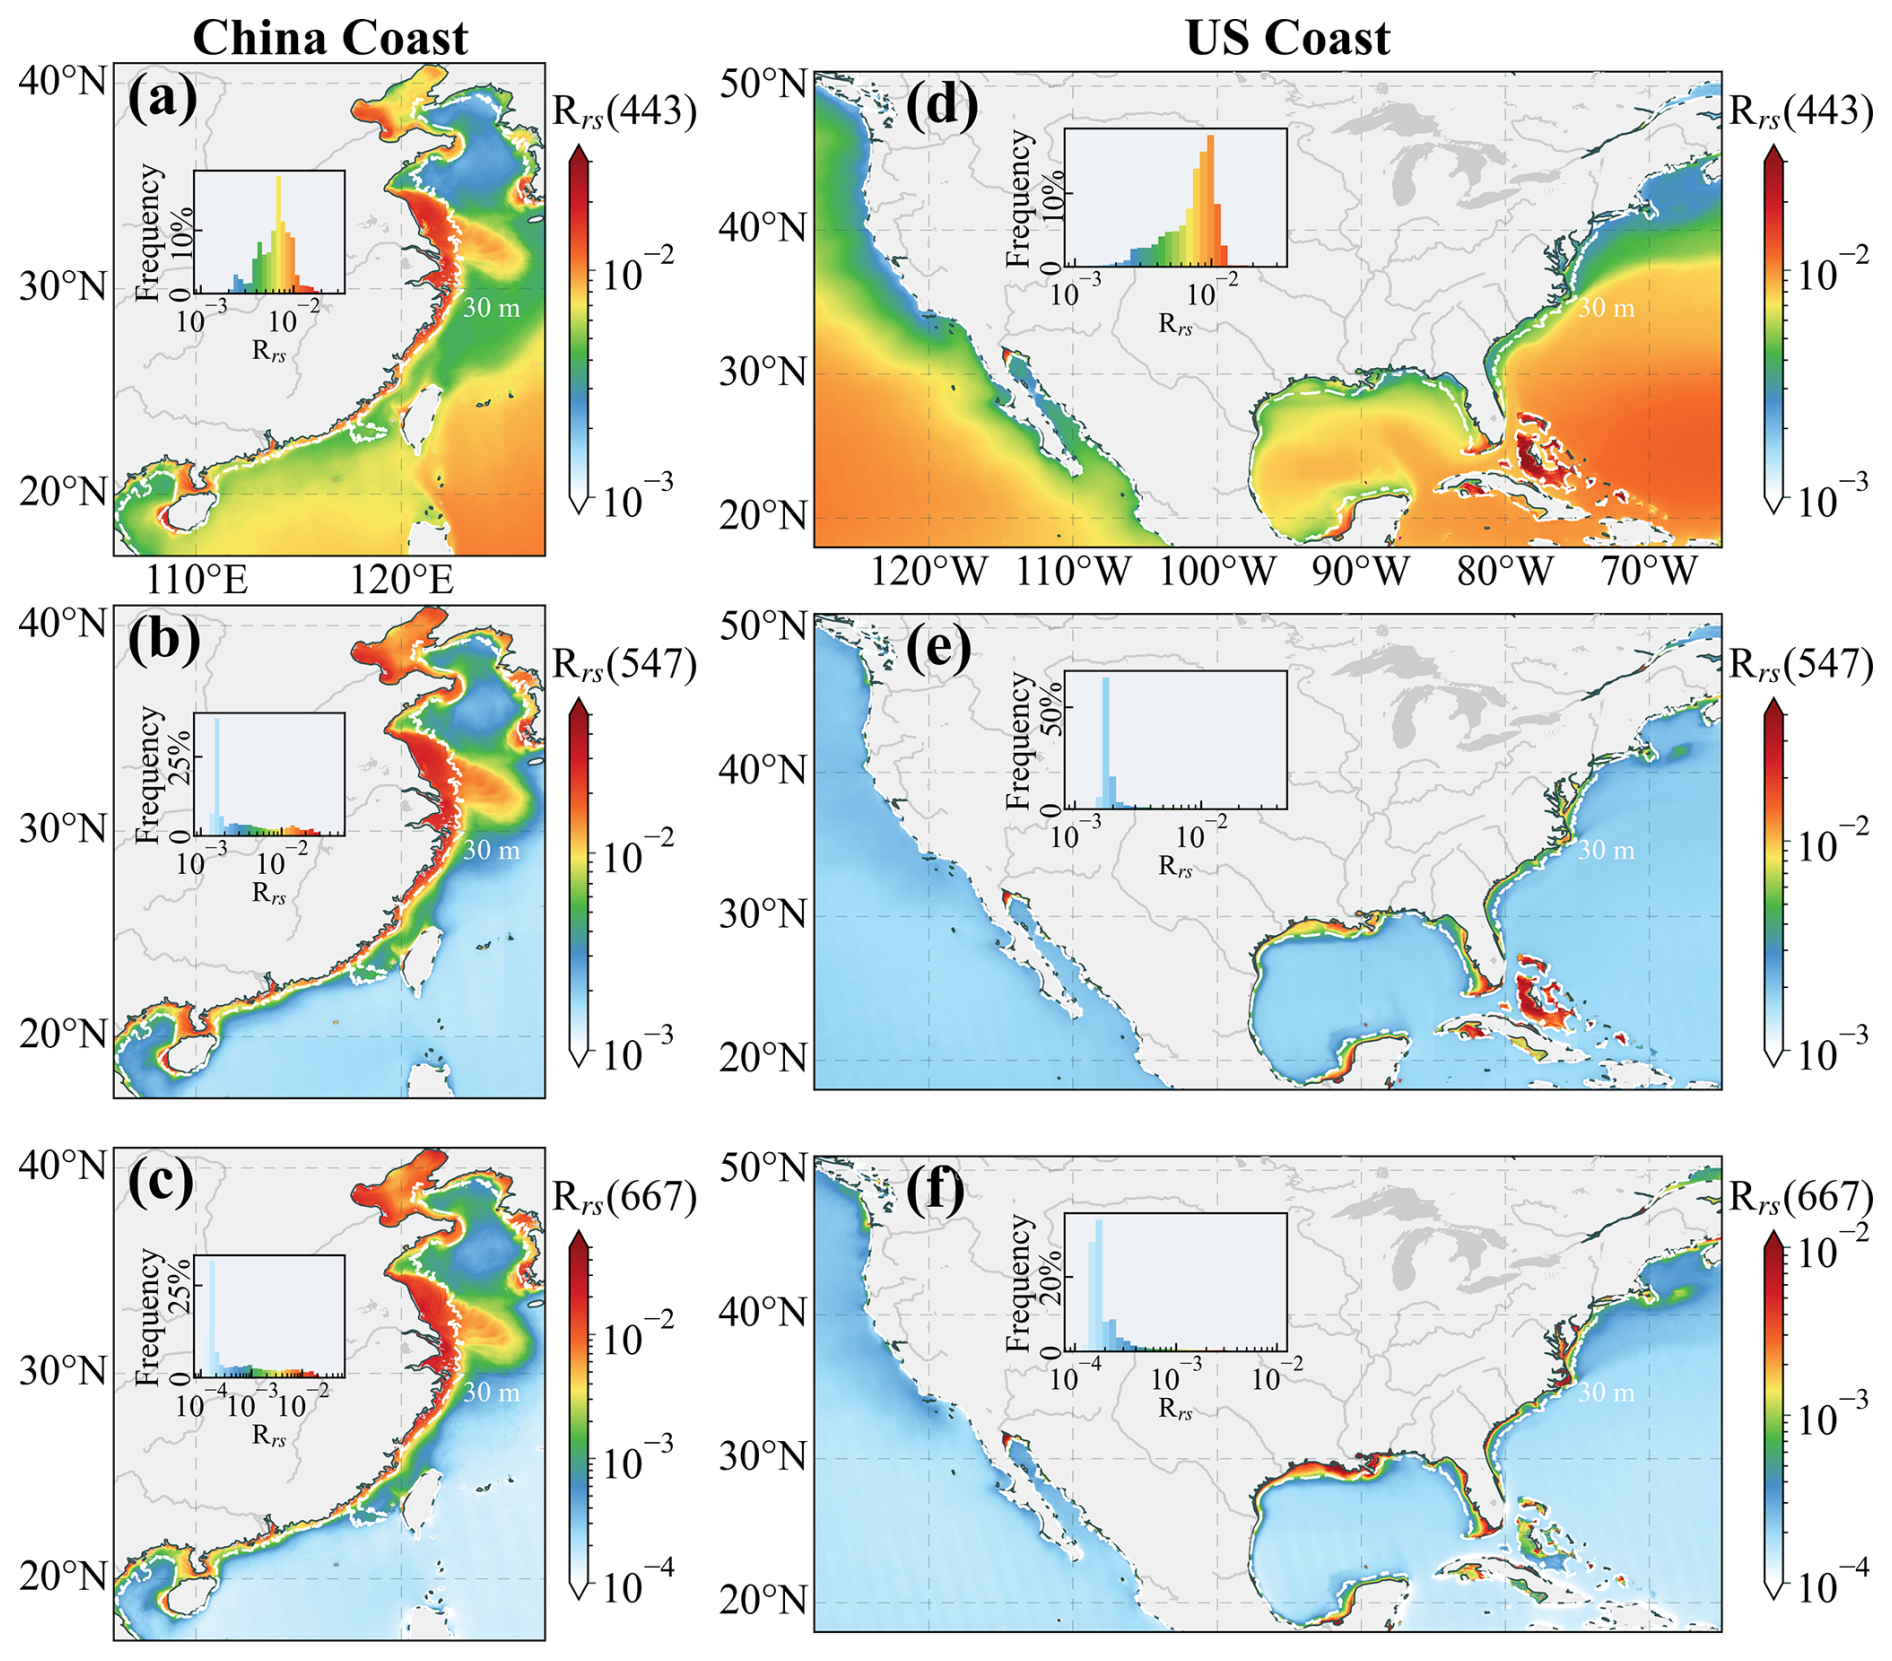
Figure 12Spatial distribution of long-term mean Rrs (units: sr−1) at 443, 547, and 667 nm for China (a–c) and US (d–f) coastal waters, derived from the new dataset (2003–2022). White dashed lines indicate the approximate 30 m isobath.
Figure 13 illustrates the spatial distribution of long-term Rrs trends (% yr−1) for the same wavelengths, as estimated using the seasonal Mann-Kendall test over the 240-month period.
In Chinese coastal waters (Fig. 13a–c), Rrs(443) generally shows increasing trends, with a mean rate of 0.64 % yr−1 and localized peaks reaching 6.85 % yr−1 in the central Yellow Sea. Rrs(547) and Rrs(667) also exhibit upward trends in this region, potentially reflecting rising suspended sediment concentrations and declining Chl and CDOM levels in recent years, as previously observed by Wang et al. (2023). In contrast, most of Laizhou Bay, Bohai Bay, and the eastern Liaodong Bay show consistent negative trends across all three wavelengths, possibly indicating a reduction in suspended sediment loads. This trend aligns with earlier findings that attribute such declines to weakening wind-driven sediment resuspension (Li et al., 2022; Zhao et al., 2022). The mean trends for Rrs(547) and Rrs(667) are 0.18 % yr−1 and 0.24 % yr−1, respectively, although widespread declines are also evident in other areas, such as the northern South China Sea, with maximum decreases reaching −6.70 % yr−1 and −9.08 % yr−1.
In the US coastal waters (Fig. 13d–f), Rrs(443) exhibits a mean increase of 0.28 % yr−1, with peak increases reaching 7.22 % yr−1. Strong positive trends are observed along the US West Coast, near the Bahamas, and within the Gulf Stream region. In contrast, notable declines occur in areas such as southern Florida Peninsula and the western Gulf of Mexico, with rates reaching −6.06 % yr−1. For Rrs(547) and Rrs(667), the overall trends are negligible (−0.004 % yr−1 and 0.042 % yr−1, respectively), with most coastal regions – except the western Gulf of Mexico – showing decreasing trends, with minimum values of −5.68 % yr−1 and −7.51 % yr−1, respectively. A particularly complex pattern emerges along the Gulf Stream: while Rrs(443) increases significantly, Rrs(547) and Rrs(667) exhibit moderate decreases. This may reflect the growing influence of oligotrophic Gulf Stream waters (Leonelli et al., 2022) and enhanced upper-ocean stratification associated with regional ocean warming (Todd and Ren, 2023). These processes are known to suppress vertical mixing and nutrient supply (Li et al., 2020), leading to reduced phytoplankton biomass (Yu et al., 2023) and lower concentrations of suspended matter (Wei et al., 2021) in the surface layer. Such reductions in optically active constituents diminish absorption in the blue bands and scattering in the green and red bands, consistent with the observed Rrs trends in this region. Additionally, the magnitude of Rrstrends is greater in the Chinese coastal waters than in the US coastal waters, likely reflecting stronger anthropogenic influences, hydrological variability, and regional-specific geomorphological settings.
The observed spatiotemporal patterns and trends in Rrs underscore the robustness of the new dataset in capturing diverse coastal optical dynamics. Their consistency with previously reported trends lends further confidence in the dataset's reliability and demonstrates its value as a foundation for future research into long-term environmental change, human impacts, and climate-related ecosystem responses in coastal waters.
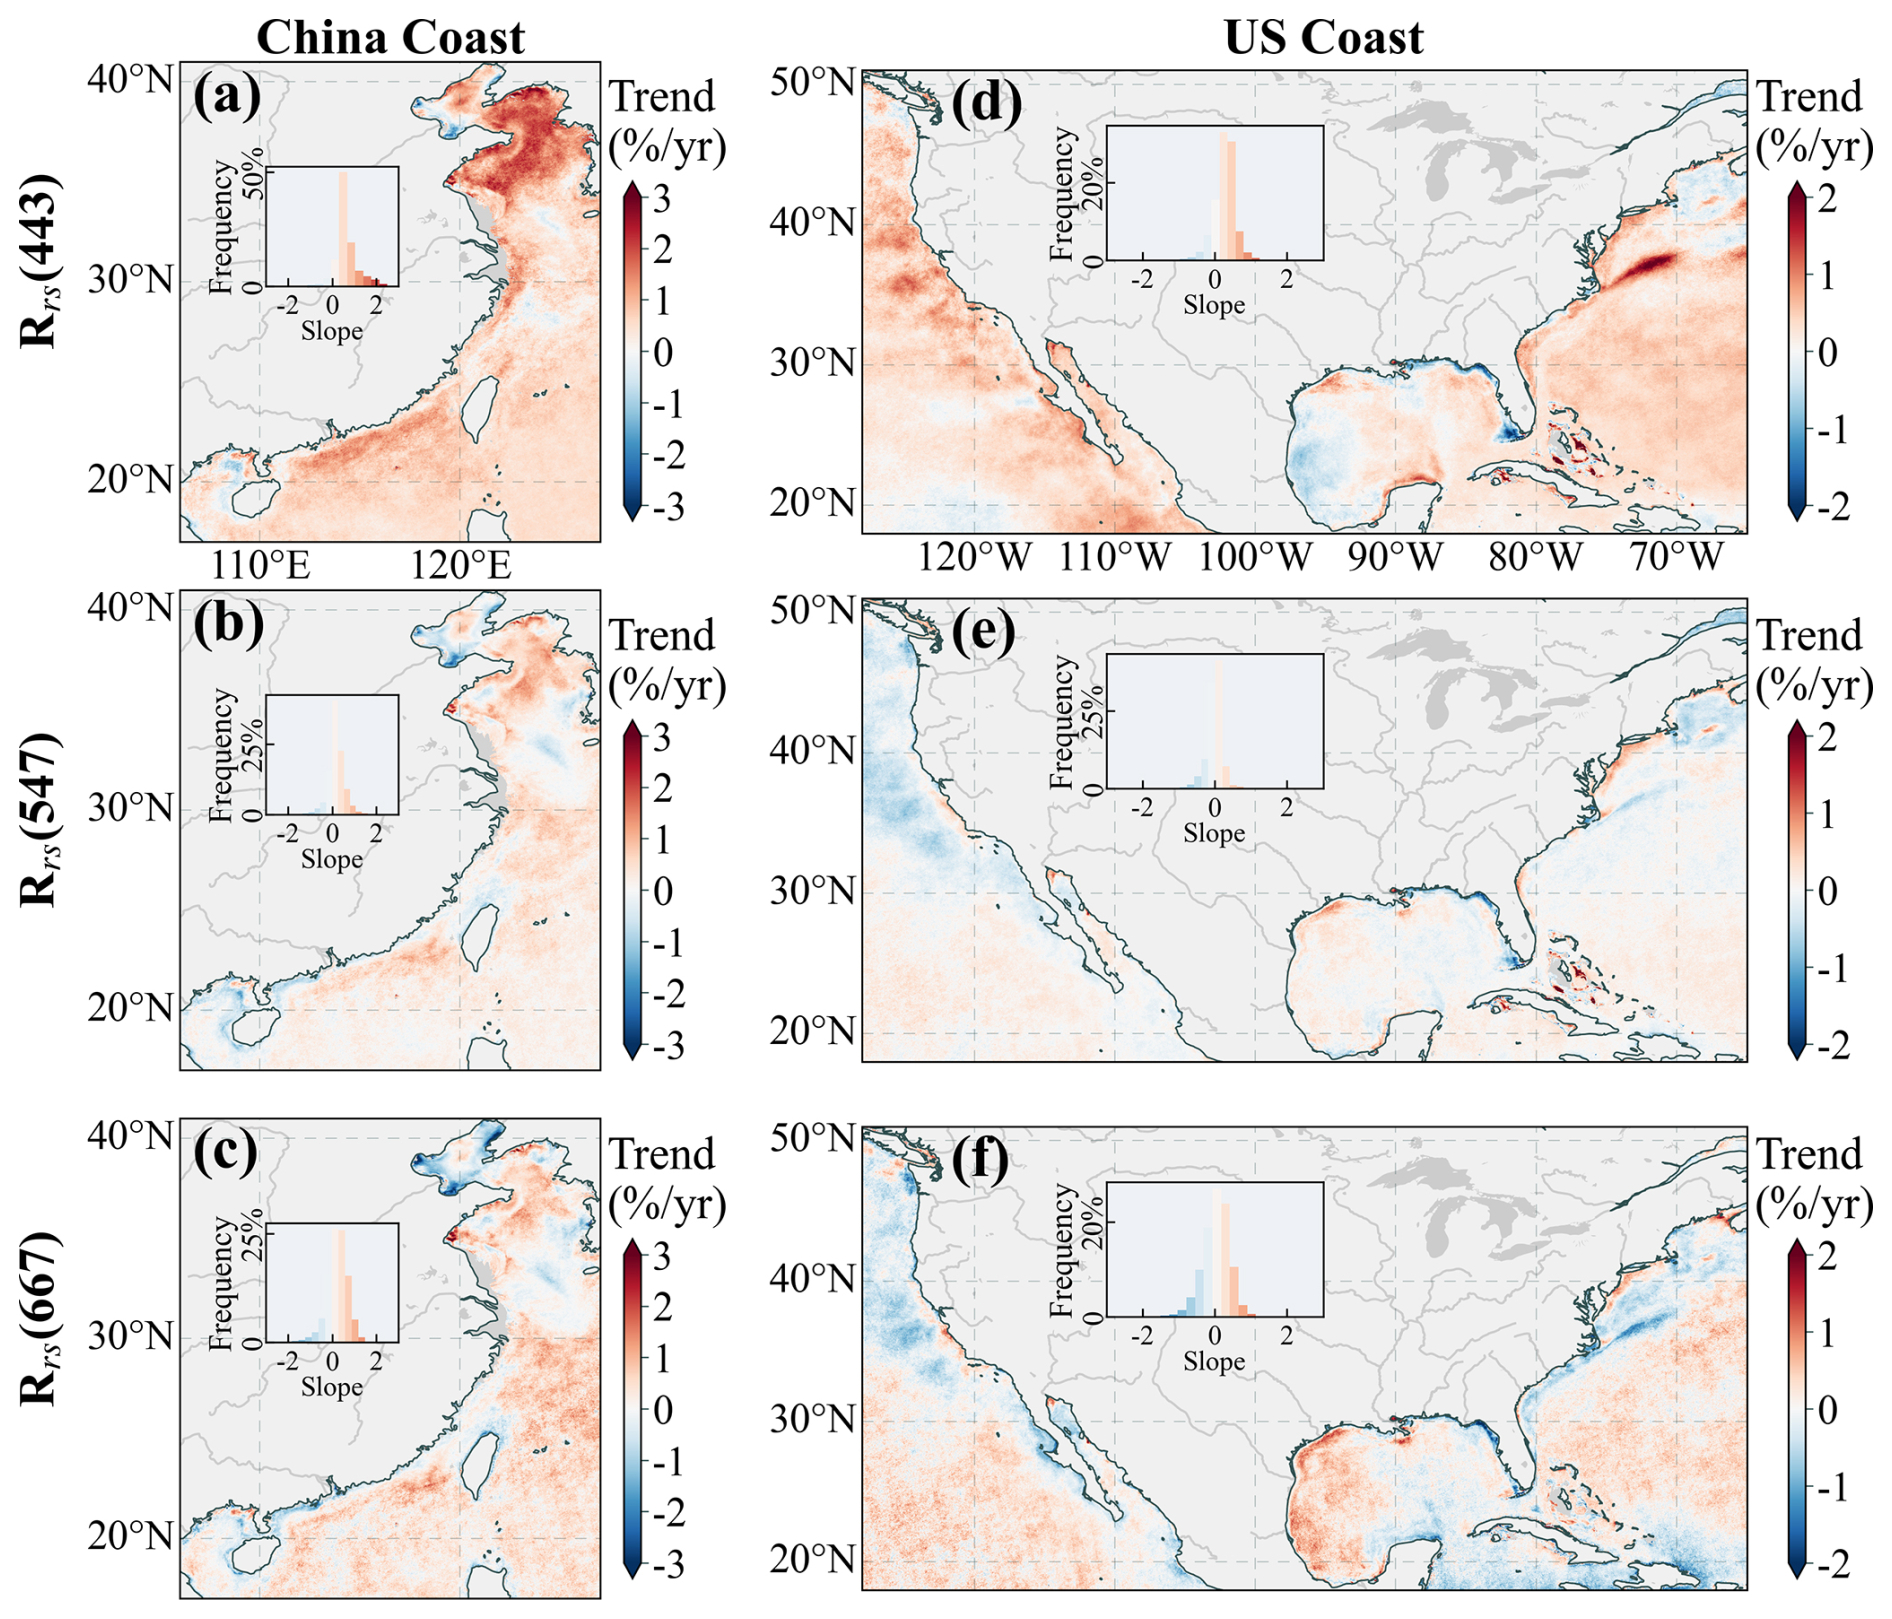
Figure 13Long-term Rrstrends (units: % yr−1) from 2003 to 2022, derived using the seasonal Mann-Kendall test at 443, 547, and 667 nm for China (a–c) and US (d–f) coastal waters. Rates are computed as the Mann-Kendall slope divided by the corresponding 20-year average Rrs.
4.1 Comparison Against Other AC Algorithms for Coastal Waters
To further contextualize the performance of our framework, we conducted a scene-based intercomparison with three advanced AC algorithms for complex waters: OC-SMART (Fan et al., 2021), POLYMER (Steinmetz et al., 2011), and NIR-SWIR, using the same four representative regions from Sect. 3.3. This analysis also included results from the standard NIR iterative algorithm with AF10 aerosol models and relaxed cloud mask (AF10&2130, as mentioned before). This configuration provides a reference baseline that embodies the persistent low bias, so the corrective effect of other algorithms can be assessed against it. For a fair and controlled comparison, the NIR-SWIR and AF10&2130 configurations used the same cloud mask and quality control steps as our new dataset, while OC-SMART and POLYMER were run with their default settings.
The comparative imagery (Figs. 14–17) demonstrates the superior performance of our framework. While all five methods successfully capture major spatial patterns associated with turbid water features (e.g., sediment plumes) in the 547 and 667 nm bands, our new dataset consistently retrieves the highest Rrs values in the most turbid regions across all scenes and bands (443, 547, 667 nm). In contrast, the Rrs values retrieved by OC-SMART, POLYMER, and NIR-SWIR in these challenging areas are frequently comparable to, or only marginally higher than, those of the AF10&2130 configuration. Given that the AF10&2130 configuration is quantitatively demonstrated to suffer from systematic underestimation (Sect. 3.1, Fig. 3), this indicates that the corrective effect of these other algorithms on the low bias is limited in optically extreme waters, whereas our improved framework provides the most robust correction.
Regarding data quality, NIR-SWIR results exhibit increased image noise due to the low signal-to-noise ratio of MODIS Aqua's SWIR bands. While POLYMER and OC-SMART generally perform well, isolated issues such as unmasked anomalous pixels (Bohai Sea for POLYMER) and striping artifacts (Mississippi River Estuary at 443 nm for OC-SMART) were observed. In terms of data coverage, the default masks for OC-SMART and POLYMER retained slightly more data in the Pearl River Estuary than our more conservative QC chain.
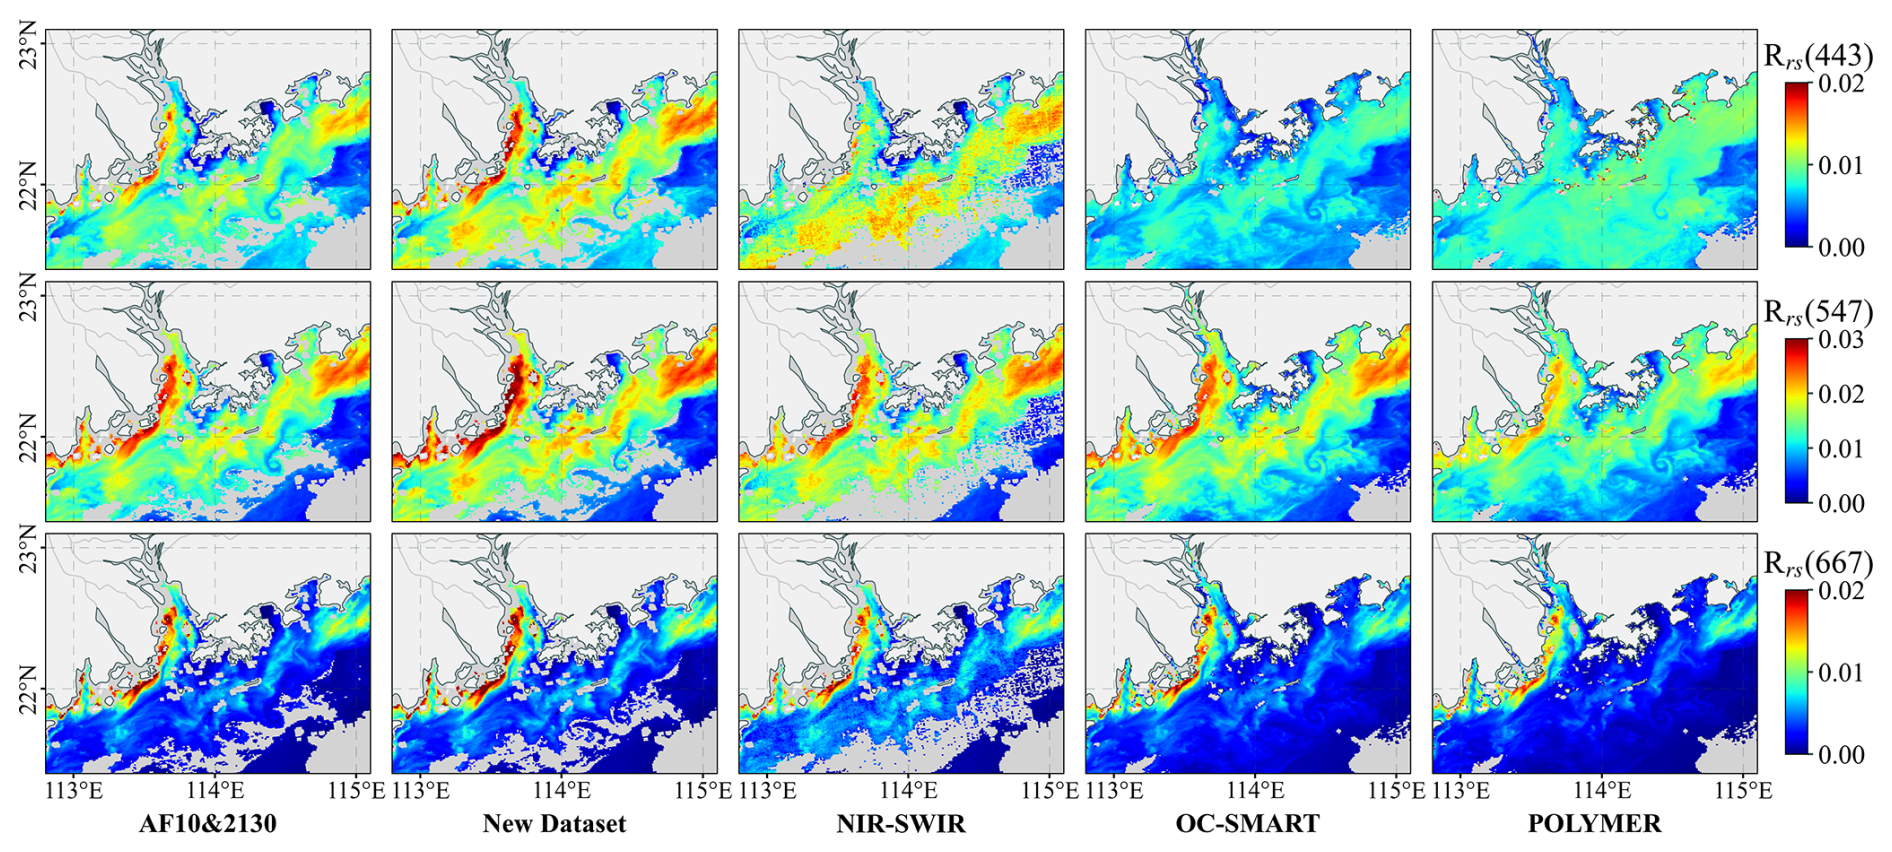
Figure 14Comparison of Rrs (units: sr−1) derived from single-scene MODIS Aqua observations over the Pearl River Estuary (14 December 2014). The figure shows Rrs at 443 nm (top row), 547 nm (middle row), and 667 nm (bottom row) as processed by the AF10&2130 configuration (first column), our new dataset (second column), the NIR-SWIR algorithm with AF10 aerosol models and as cloud mask threshold (third column), OC-SMART (fourth column), and POLYMER (fifth column).
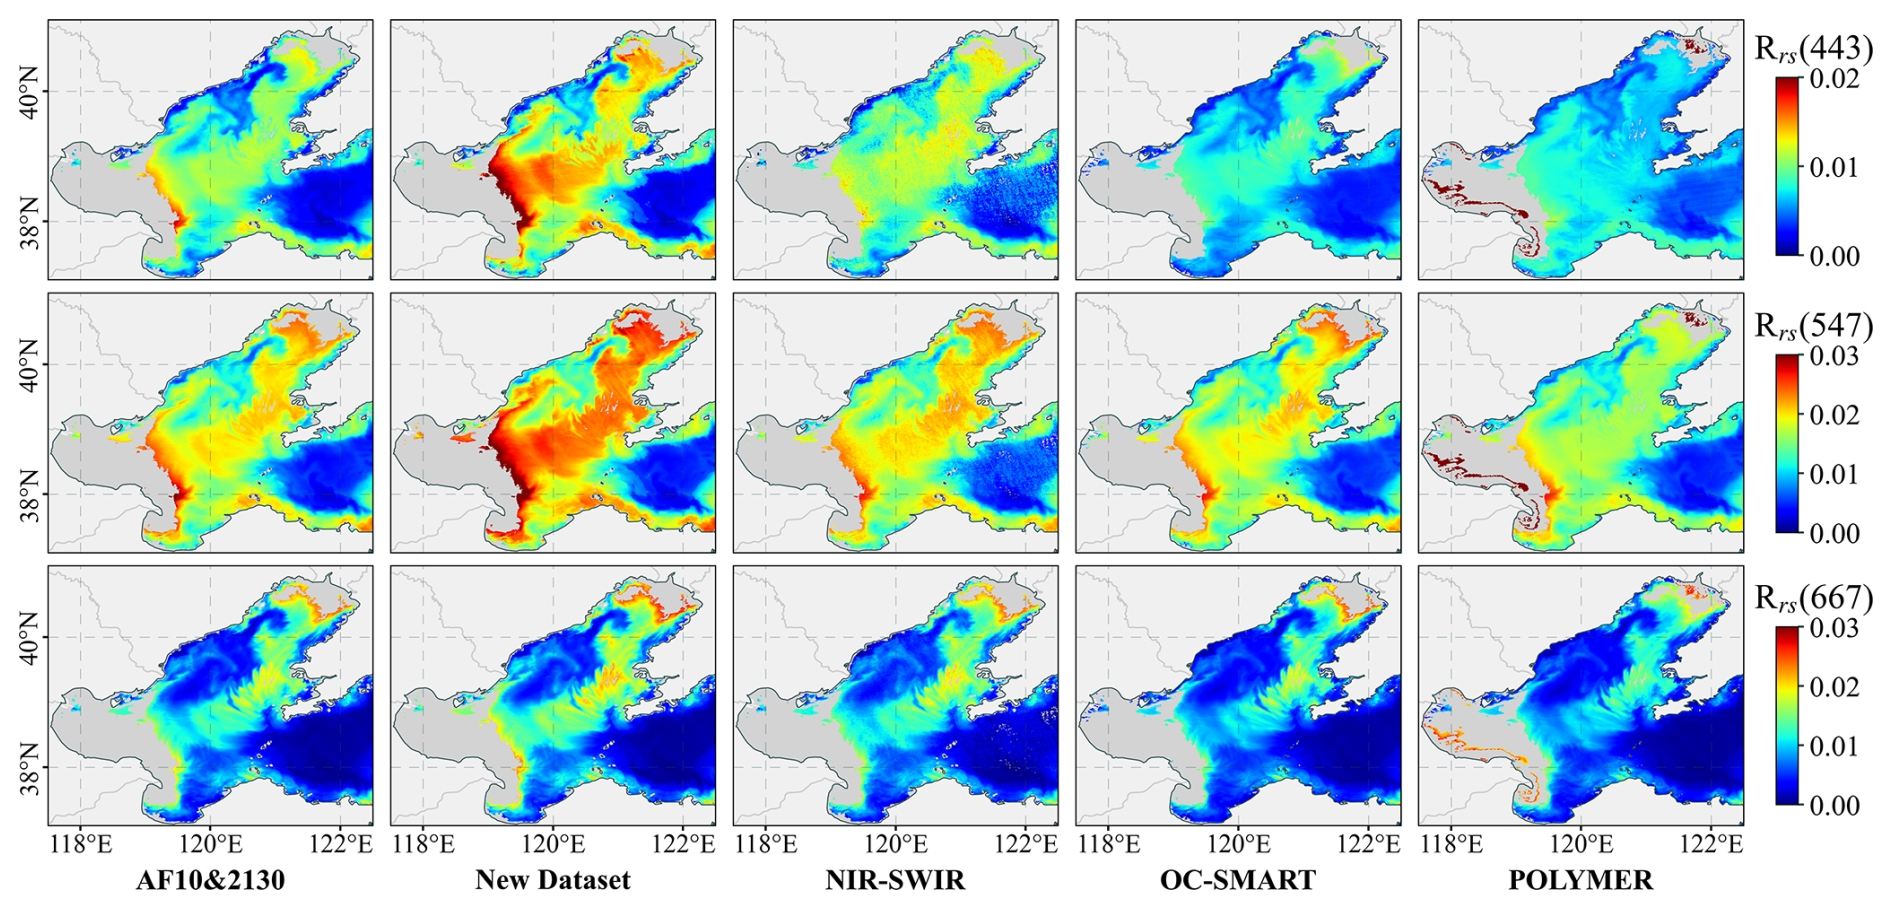
Figure 15Comparison of Rrs (units: sr−1) derived from single-scene MODIS Aqua observations over the Bohai Sea (11 March 2020). The figure shows Rrs at 443 nm (top row), 547 nm (middle row), and 667 nm (bottom row) as processed by the AF10&2130 configuration (first column), our new dataset (second column), the NIR-SWIR algorithm with AF10 aerosol models and as cloud mask threshold (third column), OC-SMART (fourth column), and POLYMER (fifth column).
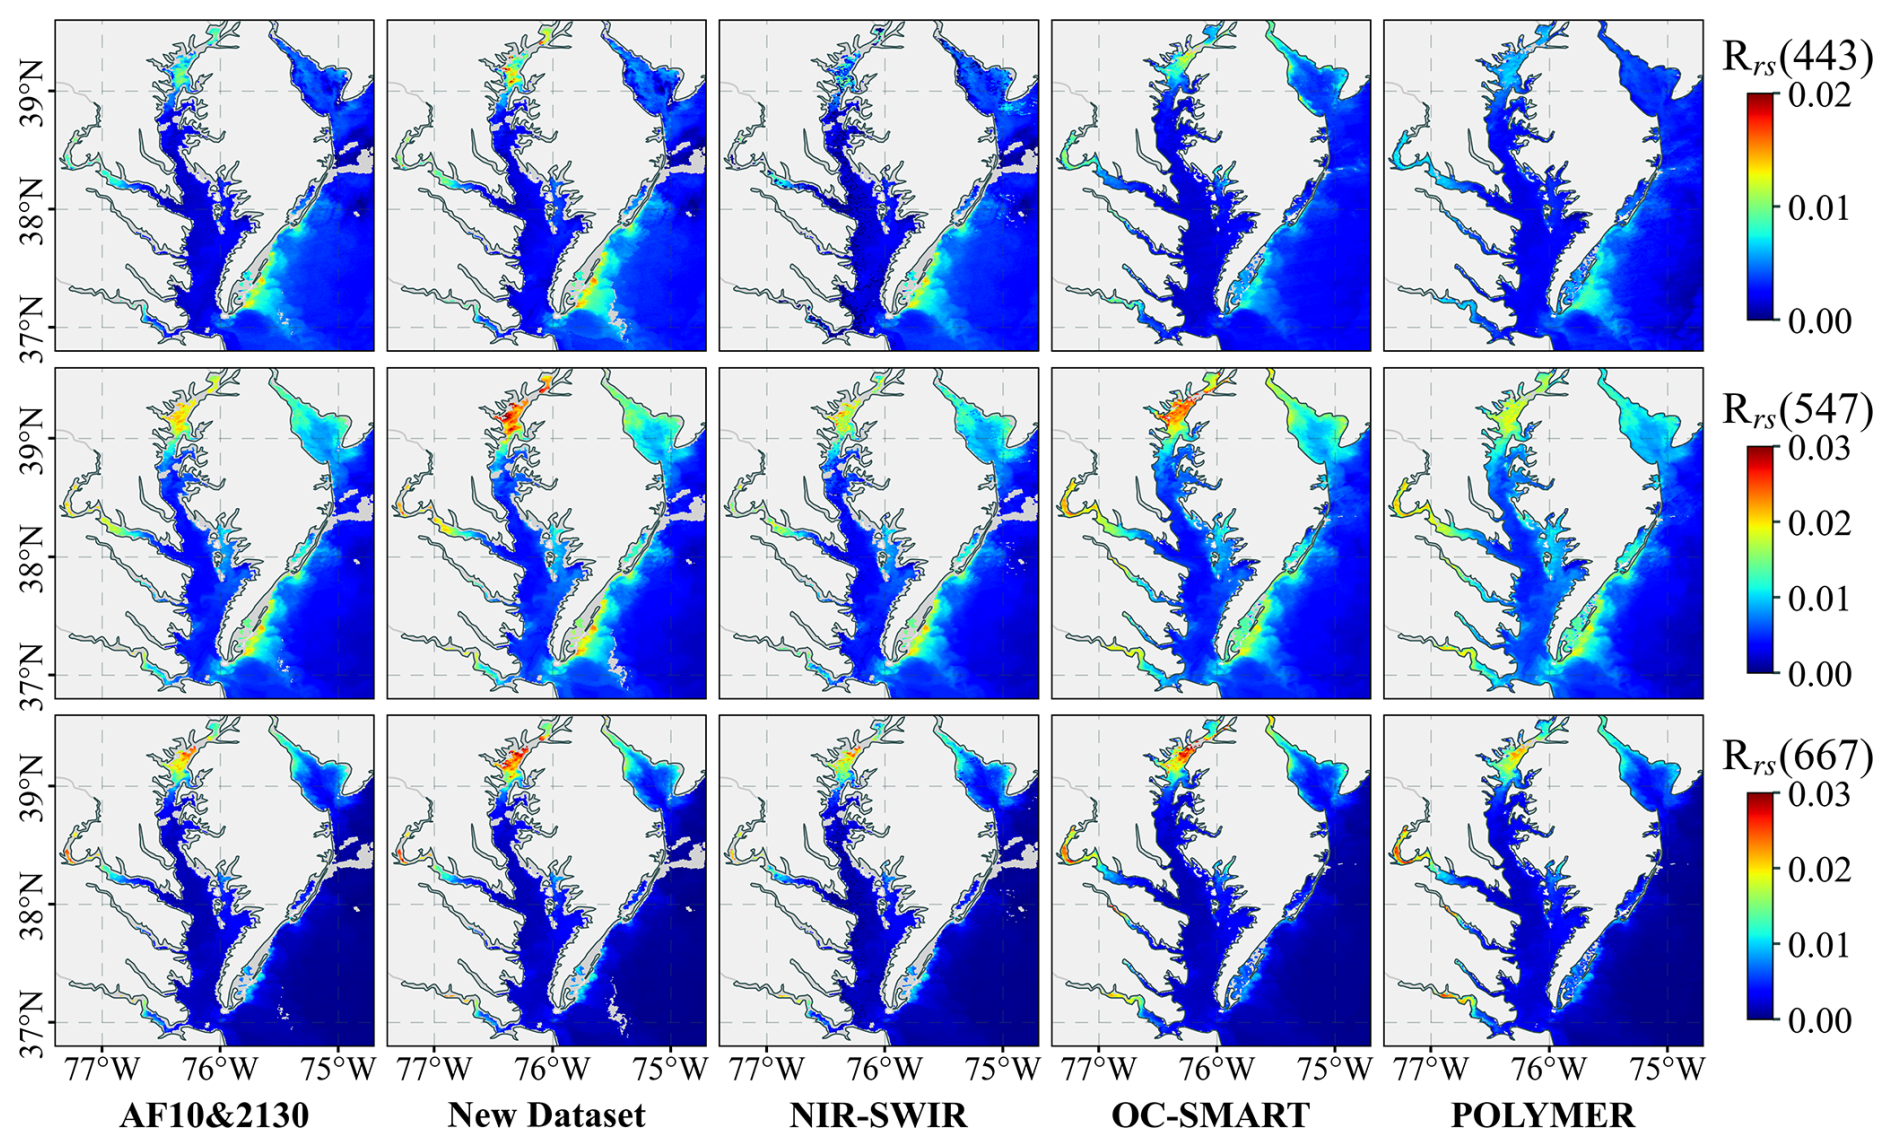
Figure 16Comparison of Rrs (units: sr−1) derived from single-scene MODIS Aqua observations over the Chesapeake Bay (5 February 2019). The figure shows Rrs at 443 nm (top row), 547 nm (middle row), and 667 nm (bottom row) as processed by the AF10&2130 configuration (first column), our new dataset (second column), the NIR-SWIR algorithm with AF10 aerosol models and as cloud mask threshold (third column), OC-SMART (fourth column), and POLYMER (fifth column).
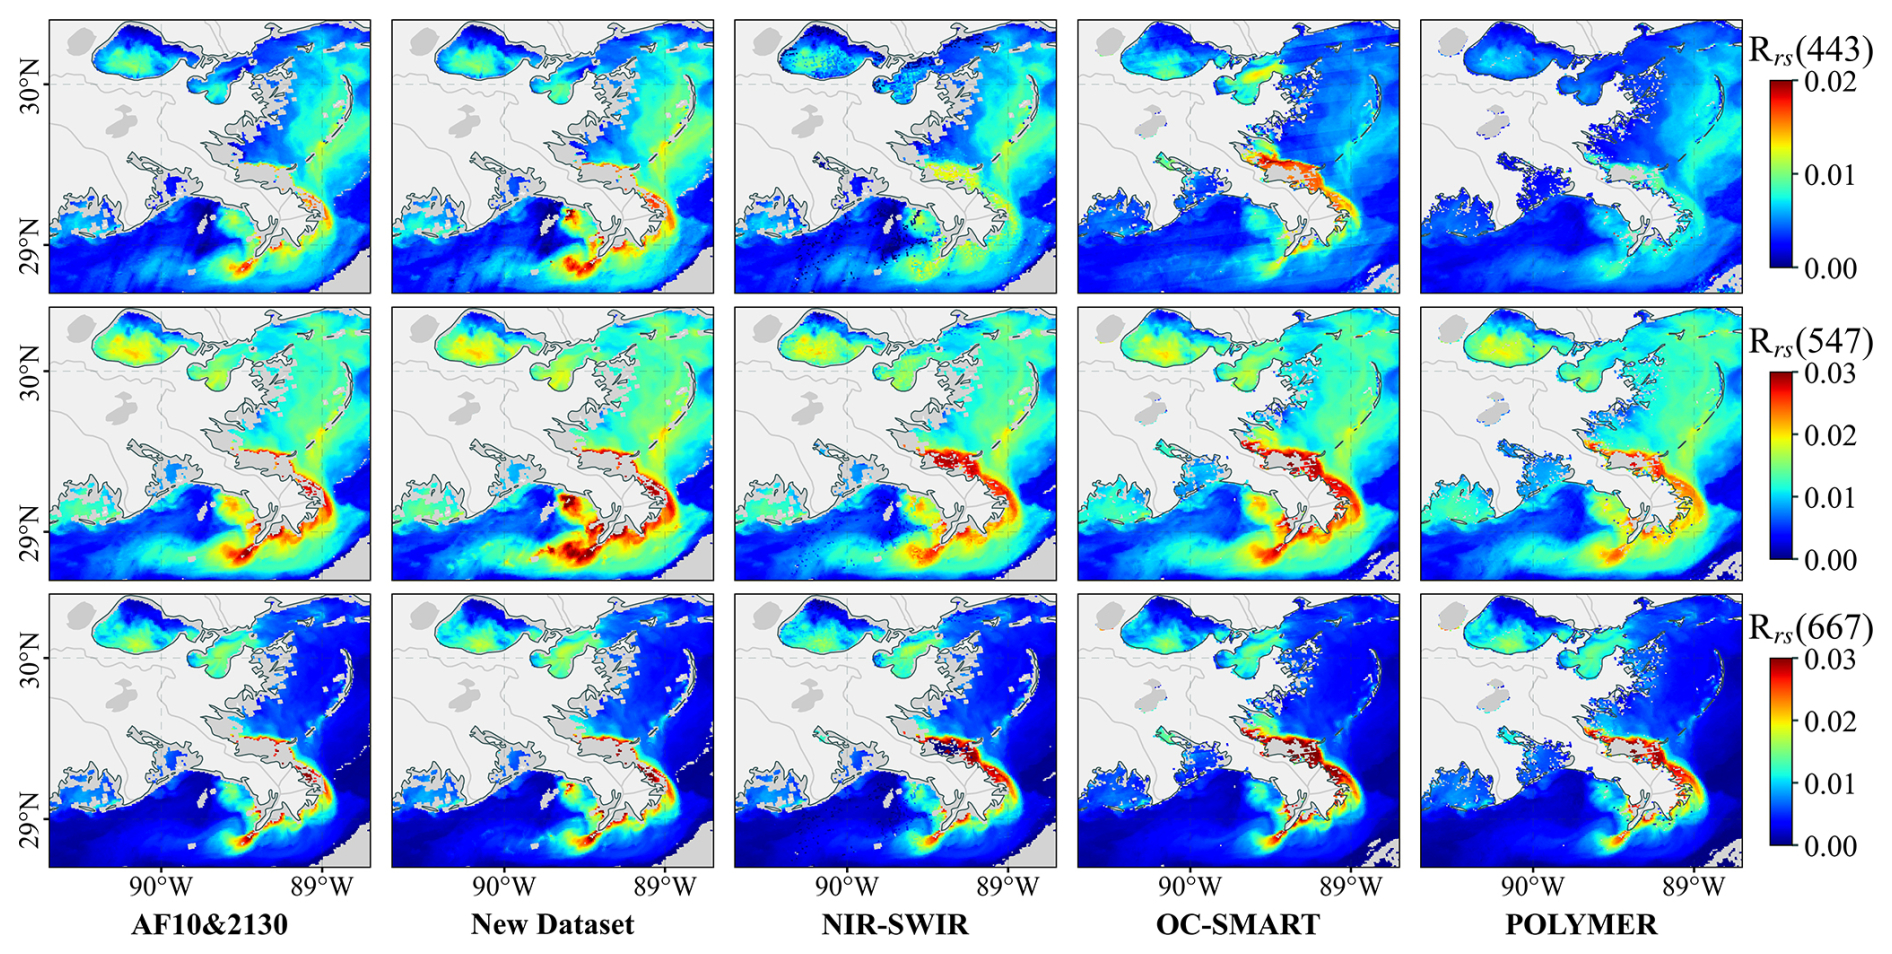
Figure 17Comparison of Rrs (units: sr−1) derived from single-scene MODIS Aqua observations over the Mississippi River Estuary (13 January 2021). The figure shows Rrs at 443 nm (top row), 547 nm (middle row), and 667 nm (bottom row) as processed by the AF10&2130 configuration (first column), our new dataset (second column), the NIR-SWIR algorithm with AF10 aerosol models and as cloud mask threshold (third column), OC-SMART (fourth column), and POLYMER (fifth column).
Beyond these empirical results, our methodological approach itself warrants discussion. It enhances a physically based, modular component (aerosol modeling) within the radiative transfer framework. This differs from strategies that depend on comprehensively pre-trained spectral or bio-optical models (e.g., POLYMER, OC-SMART), whose performance is inherently tied to the optical domains covered during their training or optimization. Adapting our framework to a new coastal region would primarily involve updating the modular aerosol prior with local or regional climatological data. In contrast, methods like POLYMER or OC-SMART may require significant recalibration or retraining to maintain performance outside their original optimization domain. Thus, our design offers a more straightforward and transparent path for regional scalability.
4.2 Considerations on the Aerosol Model Selection Strategy
A pivotal component of our improved AC framework is the dynamic selection of aerosol models, guided by the normalized water-leaving radiance in the NIR band ([Lw(NIR)]N). This design is predicated on the strong empirical spatial co-occurrence observed in coastal zones: waters exhibiting high turbidity (and thus elevated [Lw(NIR)]N) are typically nearshore, and this high turbidity spatially co-occurs with prevalent continentally influenced, often absorbing aerosols. Conversely, in offshore regions, waters are generally clear (with low [Lw(NIR)]N) and maritime aerosols prevail. We leveraged this consistent geographic pattern as a practical and effective proxy to implement a necessary transition between aerosol models across the land-ocean gradient. This spatially adaptive selection prevents the systematic underestimation that would occur if AF10 models were applied to turbid nearshore waters, while simultaneously avoiding the overestimation that would arise if gridded models representing absorbing aerosols were used in clear offshore waters. The success of this approach is evidenced by the reduction of systematic bias (Fig. 3) and the spatially coherent Rrs fields without discontinuities (e.g., Figs. 8, 9).
It is important to clarify that this strategy does not assert a direct physical causation between water optical properties and aerosol characteristics. Rather, it is a pragmatic solution that capitalizes on their correlated spatial distributions driven by common terrestrial influences. Consequently, the performance of this approach is inherently tied to the robustness of this co-occurrence relationship. In regions or under conditions where this relationship weakens or decouples (e.g., during long-range transport of dust or smoke over clear ocean), the proxy may be less effective. To overcome this limitation and extend the framework's applicability, research could focus on integrating direct, physically based aerosol indicators (e.g., from multi-angle or polarimetric sensors). Alternatively, developing regionally adapted or higher-resolution co-occurrence models could refine the proxy and enhance the robustness of the aerosol selection process.
4.3 Considerations on Quality Control Strategies
The QC strategy is integral to the reliability of any ocean color dataset. Our framework combines a relaxed cloud mask () with additional filters (e.g., the “Wrong Turbid Water Mask”), to prioritize the retention of valid turbid water pixels that are routinely discarded by standard processors, while implementing safeguards against anomalous retrievals.
However, when comparing with OC-SMART and POLYMER (Sect. 4.1, Fig. 14), we observed that their default masks retained slightly more valid pixels than our more conservative QC chain. This difference is primarily attributable to our “Wrong Turbid Water Mask,” (See Fig. 8), which excluded some pixels based on spectral criteria. This illustrates an inherent tension in QC design for coastal waters: an overly conservative spectral filter may reject some valid but optically extreme water pixels, whereas a more permissive mask risks retaining subtle cloud contamination or other artifacts. Our current strategy prioritizes per-pixel confidence over initial data yield, accepting a minor reduction in the latter for enhanced overall reliability.
Looking forward, cloud and cloud-shadow detection remains one of the most persistent challenges in global aquatic remote sensing. Although the QC framework used in this study performs robustly in the target regions, its universal optimization is non-trivial due to the vast diversity of atmospheric and aquatic conditions. The development and integration of more advanced, physically based or machine-learning-driven cloud masking algorithms, capable of regional adaptation and distinguishing between high turbidity and true cloud cover, represents a critical future direction. Such advancements could potentially obviate the need for heuristic spectral filters like the “Wrong Turbid Water Mask”, further automating the pipeline and enhancing the consistency and yield of quality-controlled data products across all coastal zones.
4.4 Considerations on Model Representativity
The performance of our AC framework is inherently linked to the quality of the aerosol prior. The representational characteristics of the gridded aerosol models – namely, their spatial (5°) and temporal (monthly) resolution – thus constitute a fundamental aspect of the framework's design. While these models have proven effective, their fixed resolution may not fully capture the high heterogeneity of aerosols in coastal areas at instantaneous and pixel scales. However, as integrated into our processing chain (Sect. 2.2.1), the model serves as an optimized starting point for iterative refinement, a design that mitigates the impact of imperfect prior matching. The validation results (Fig. 3) and scene-based comparison (e.g., Fig. 8) confirm that this approach yields a significant and effective correction of the systematic bias at the current model resolution. Future work to further enhance fine-scale coastal retrievals could therefore focus on developing regional aerosol climatology or integrating real-time assimilation products with higher spatiotemporal resolution, thereby providing an even more accurate AC starting point.
The high-quality coastal Rrs dataset generated in this study is publicly available at https://doi.org/10.5281/zenodo.16413443 (Zhao et al., 2025). The dataset is provided in monthly composites and stored in GeoTIFF format at 0.01° spatial resolution under the EPSG: 4326 (WGS84) spatial reference system.
This study has developed and validated an improved processing framework for coastal ocean color retrieval, integrating and operationalizing key advancements in aerosol modeling and cloud masking. A central innovation is the spatially adaptive selection of aerosol models, guided by water turbidity as a proxy for continental aerosol influence, which effectively addresses the systematic bias across the land-ocean gradient. Coupled with tailored quality control strategies, this framework was used to generate a high-quality, consistent MODIS Aqua Rrs dataset (2003–2022) for the coastal waters of China and the United States. The resulting dataset was rigorously evaluated against NASA standard Rrs products through a series of comparative analyses under consistent and stringent quality control strategies.
Compared to the standard products, the new dataset demonstrates a decisive improvement: a substantial reduction in systematic low bias alongside a marked increase in valid retrieval coverage. This dual enhancement is most pronounced in turbid coastal regions and is evident across all scales of analysis – from pixel-level validation to the resolution of fine-scale features and long-term spatiotemporal patterns. The dataset thus provides a more reliable and complete observational foundation for characterizing coastal optical variability.
The dataset is explicitly positioned as a complementary resource optimized for turbid coastal regions, estuaries, and bays, filling a gap where standard products are less reliable. Although this study focused on MODIS Aqua and two regional cases, the methodology is scalable and transferable to other sensors and global coastal zones. Future work may involve broader in situ validation and the application of this dataset to retrieve biogeochemical parameters such as Chl, suspended sediments, and CDOM, thereby extending its utility for coastal management and climate-related research.
JL, YW and SZ developed and implemented the improved atmospheric correction algorithm. YW and SZ designed quality control strategies. JL and SZ collected and processed the data. SZ analyzed the data and wrote the paper. DZ provided refined aerosol models. YZ helped refine the scientific question. LF conceptualized the study and designed the research framework. All of the co-authors revised the paper.
The contact author has declared that none of the authors has any competing interests.
Publisher's note: Copernicus Publications remains neutral with regard to jurisdictional claims made in the text, published maps, institutional affiliations, or any other geographical representation in this paper. The authors bear the ultimate responsibility for providing appropriate place names. Views expressed in the text are those of the authors and do not necessarily reflect the views of the publisher.
We would like to thank the NASA Ocean Biology Processing Group for providing the MODIS Aqua data and maintaining the SeaBASS archive, and the original contributors of the in situ data used in this study. We also thank the NASA Global Modeling and Assimilation Office for the MERRA-2 ancillary data, GHRSST and Environment Canada for the sea-surface temperature and sea-ice data, and the editor and reviewers for their constructive comments.
This research was supported by the National Natural Science Foundation of China (grant nos. 42321004 and 42425604); the Fundamental and Interdisciplinary Disciplines Breakthrough Plan of the Ministry of Education of China (grant no. JYB2025XDXM909); the Guangdong Province Grant (grant no. 2024JC08L034); the Guangdong Provincial Key Laboratory of Soil and Groundwater Pollution Control (grant no. 2023B1212060002); the Shenzhen Science and Technology Program (grant no. KcXFZ20240903093659003); and the SUSTech High-level University Special Fund (grant no. G030290001).
This paper was edited by François G. Schmitt and reviewed by two anonymous referees.
Ahmad, Z., Franz, B. A., McClain, C. R., Kwiatkowska, E. J., Werdell, J., Shettle, E. P., and Holben, B. N.: New aerosol models for the retrieval of aerosol optical thickness and normalized water-leaving radiances from the SeaWiFS and MODIS sensors over coastal regions and open oceans, Appl. Optics, 49, 5545–5560, https://doi.org/10.1364/AO.49.005545, 2010.
Bailey, S. W. and Werdell, P. J.: A multi-sensor approach for the on-orbit validation of ocean color satellite data products, Remote Sens. Environ., 102, 12–23, https://doi.org/10.1016/j.rse.2006.01.015, 2006.
Bassani, C., Manzo, C., Braga, F., Bresciani, M., Giardino, C., and Alberotanza, L.: The impact of the microphysical properties of aerosol on the atmospheric correction of hyperspectral data in coastal waters, Atmos. Meas. Tech., 8, 1593–1604, https://doi.org/10.5194/amt-8-1593-2015, 2015.
Bru, D., Lubac, B., Normandin, C., Robinet, A., Leconte, M., Hagolle, O., Martiny, N., and Jamet, C.: Atmospheric Correction of Multi-Spectral Littoral Images Using a PHOTONS/AERONET-Based Regional Aerosol Model, https://doi.org/10.3390/rs9080814, 2017.
Canada Meteorological Center: GHRSST Level 4 CMC0.2deg Global Foundation Sea Surface Temperature Analysis (GDS version 2), NASA Physical Oceanography Distributed Active Archive Center [data set], https://doi.org/10.5067/GHCMC-4FM02, 2012.
Canada Meteorological Center: GHRSST Level 4 CMC0.1deg Global Foundation Sea Surface Temperature Analysis (GDS version 2), NASA Physical Oceanography Distributed Active Archive Center [data set], https://doi.org/10.5067/GHCMC-4FM03, 2017.
Charlson, R. J., Schwartz, S. E., Hales, J. M., Cess, R. D., Coakley, J. A., Hansen, J. E., and Hofmann, D. J.: Climate Forcing by Anthropogenic Aerosols, Science, 255, 423–430, 1992.
Fan, Y., Li, W., Chen, N., Ahn, J.-H., Park, Y.-J., Kratzer, S., Schroeder, T., Ishizaka, J., Chang, R., and Stamnes, K.: OC-SMART: A machine learning based data analysis platform for satellite ocean color sensors, Remote Sens. Environ., 253, 112236, https://doi.org/10.1016/j.rse.2020.112236, 2021.
Feng, L., Hu, C., Chen, X., and Song, Q.: Influence of the Three Gorges Dam on total suspended matters in the Yangtze Estuary and its adjacent coastal waters: Observations from MODIS, Remote Sens. Environ., 140, 779–788, https://doi.org/10.1016/j.rse.2013.10.002, 2014.
Giles, D. M., Holben, B. N., Eck, T. F., Sinyuk, A., Smirnov, A., Slutsker, I., Dickerson, R. R., Thompson, A. M., and Schafer, J. S.: An analysis of AERONET aerosol absorption properties and classifications representative of aerosol source regions, J. Geophys.Res.-Atmos., 117, https://doi.org/10.1029/2012JD018127, 2012.
Global Modeling and Assimilation Office: MERRA-2 inst1_2d_asm_Nx: 2d, 1-Hourly, Instantaneous, Single-Level, Assimilation, Single-Level Diagnostics V5.12.4, Goddard Earth Sciences Data and Information Services Center (GES DISC) [data set], https://doi.org/10.5067/3Z173KIE2TPD, 2015a.
Global Modeling and Assimilation Office: MERRA-2 tavg1_2d_lnd_Nx: 2d, 1-Hourly, Time-Averaged, Single-Level, Assimilation, Land Surface Diagnostics V5.12.4, Goddard Earth Sciences Data and Information Services Center (GES DISC) [data set], https://doi.org/10.5067/RKPHT8KC1Y1T, 2015b.
Global Modeling and Assimilation Office: MERRA-2 tavg1_2d_ocn_Nx: 2d, 1-Hourly, Time-Averaged, Single-Level, Assimilation, Ocean Surface Diagnostics V5.12.4, Goddard Earth Sciences Data and Information Services Center (GES DISC) [data set], https://doi.org/10.5067/Y67YQ1L3ZZ4R, 2015c.
Gordon, H. R.: Atmospheric correction of ocean color imagery in the Earth Observing System era, J. Geophys. Res.-Atmos., 102, 17081–17106, https://doi.org/10.1029/96JD02443, 1997.
Gordon, H. R. and Wang, M.: Retrieval of water-leaving radiance and aerosol optical thickness over the oceans with SeaWiFS: a preliminary algorithm, Appl. Optics, 33, 443–452, https://doi.org/10.1364/AO.33.000443, 1994.
Gordon, H. R., Du, T., and Zhang, T.: Remote sensing of ocean color and aerosol properties: resolving the issue of aerosol absorption, Appl. Optics, 36, 8670–8684, https://doi.org/10.1364/AO.36.008670, 1997.
Hamill, P., Giordano, M., Ward, C., Giles, D., and Holben, B.: An AERONET-based aerosol classification using the Mahalanobis distance, Atmos. Environ., 140, 213–233, https://doi.org/10.1016/j.atmosenv.2016.06.002, 2016.
He, X. Q., Pan, D. L., Bai, Y., Zhu, Q. K., and Gong, F.: Evaluation of the aerosol models for SeaWiFS and MODIS by AERONET data over open oceans, Appl. Optics, 50, 4353–4364, https://doi.org/10.1364/AO.50.004353, 2011.
Hu, C., Feng, L., Lee, Z., Davis, C. O., Mannino, A., McClain, C. R., and Franz, B. A.: Dynamic range and sensitivity requirements of satellite ocean color sensors: learning from the past, Appl. Optics, 51, 6045–6062, https://doi.org/10.1364/AO.51.006045, 2012.
Hu, C., Feng, L., Lee, Z., Franz, B. A., Bailey, S. W., Werdell, P. J., and Proctor, C. W.: Improving Satellite Global Chlorophyll a Data Products Through Algorithm Refinement and Data Recovery, J. Geophys. Res.-Oceans, 124, 1524–1543, https://doi.org/10.1029/2019JC014941, 2019.
Husar, R. B., Prospero, J. M., and Stowe, L. L.: Characterization of tropospheric aerosols over the oceans with the NOAA advanced very high resolution radiometer optical thickness operational product, J. Geophys. Res.-Atmos., 102, 16889–16909, https://doi.org/10.1029/96JD04009, 1997.
IOCCG and Mélin, F. (Ed.): Uncertainties in Ocean Colour Remote Sensing, Reports of the International Ocean Colour Coordinating Group, IOCCG, Dartmouth, Canada, https://doi.org/10.25607/OBP-696, 2019.
IOCCG and Sathyendranath, S. (Ed.): Phytoplankton Functional Types from Space, Reports of the International Ocean Colour Coordinating Group, IOCCG, Dartmouth, Canada, https://doi.org/10.25607/OBP-106, 2014.
IOCCG and Wang, M. (Ed.): Atmospheric Correction for Remotely-Sensed Ocean-Colour Products, Reports of the International Ocean Colour Coordinating Group, IOCCG, Dartmouth, Canada, https://doi.org/10.25607/OBP-101, 2010.
Kendall, M. G.: Rank Correlation Methods, 4th Edn., Griffin, ISBN 978-0-85264-199-6, 1970.
Kirk, J. T. O.: Light and Photosynthesis in Aquatic Ecosystems, 3, Cambridge University Press, Cambridge, https://doi.org/10.1017/CBO9781139168212, 2010.
Lee, Z., Carder, K. L., and Arnone, R. A.: Deriving inherent optical properties from water color: a multiband quasi-analytical algorithm for optically deep waters, Appl. Optics, 41, 5755–5772, https://doi.org/10.1364/AO.41.005755, 2002.
Leonelli, F. E., Bellacicco, M., Pitarch, J., Organelli, E., Buongiorno Nardelli, B., de Toma, V., Cammarota, C., Marullo, S., and Santoleri, R.: Ultra-Oligotrophic Waters Expansion in the North Atlantic Subtropical Gyre Revealed by 21 Years of Satellite Observations, Geophys. Res. Lett., 49, e2021GL096965, https://doi.org/10.1029/2021GL096965, 2022.
Li, G., Cheng, L., Zhu, J., Trenberth, K. E., Mann, M. E., and Abraham, J. P.: Increasing ocean stratification over the past half-century, Nat. Clim. Change, 10, 1116-1123, https://doi.org/10.1038/s41558-020-00918-2, 2020.
Li, P., Chen, S., Ke, Y., Ji, H., Li, P., and Fan, Y.: Spatiotemporal dynamics of suspended particulate matter in the Bohai Sea, China over the past decade from the space perspective, Sci. Total Environ., 851, 158210, https://doi.org/10.1016/j.scitotenv.2022.158210, 2022.
Ling, Z., Sun, D., Wang, S., Qiu, Z., Huan, Y., Mao, Z., and He, Y.: Remote sensing estimation of colored dissolved organic matter (CDOM) from GOCI measurements in the Bohai Sea and Yellow Sea, Environ. Sci. Pollut. Res., 27, 6872–6885, https://doi.org/10.1007/s11356-019-07435-6, 2020.
Liu, J., Yan, W., Chen, Z., and Lu, J.: Sediment sources and their contribution along northern coast of the South China Sea: Evidence from clay minerals of surface sediments, Cont. Shelf Res., 47, 156–164, https://doi.org/10.1016/j.csr.2012.07.013, 2012.
Lv, J., Feng, L., and Zhao, D.: Validation of Global Gridded Aerosol Models in Inland/Coastal Water Atmospheric Correction for MODIS, VIIRS, and Landsat, IEEE T. Geosci. Remote, 62, 1–10, https://doi.org/10.1109/TGRS.2024.3427836, 2024.
Mann, H. B.: Nonparametric Tests Against Trend, Econometrica, 13, 245–259, https://doi.org/10.2307/1907187, 1945.
Mannino, A., Russ, M. E., and Hooker, S. B.: Algorithm development and validation for satellite-derived distributions of DOC and CDOM in the U.S. Middle Atlantic Bight, J. Geophys. Res.-Oceans, 113, https://doi.org/10.1029/2007JC004493, 2008.
Mélin, F., Zibordi, G., and Holben, B. N.: Assessment of the Aerosol Products From the SeaWiFS and MODIS Ocean-Color Missions, IEEE Geosci. Remote Sens. Lett., 10, 1185–1189, https://doi.org/10.1109/LGRS.2012.2235408, 2013.
Mobley, C., Werdell, J., Franz, B., Ahmad, Z., and Bailey, S.: Atmospheric Correction for Satellite Ocean Color Radiometry, https://doi.org/10.13140/RG.2.2.23016.78081, 2016.
Montes, M., Pahlevan, N., Giles, D. M., Roger, J.-C., Zhai, P.-w., Smith, B., Levy, R., Werdell, P. J., and Smirnov, A.: Augmenting Heritage Ocean-Color Aerosol Models for Enhanced Remote Sensing of Inland and Nearshore Coastal Waters, Front. Remote Sens., 3, https://doi.org/10.3389/frsen.2022.860816, 2022.
NASA Ocean Biology Processing Group: MODIS Data Degradation Notice, NASA Earthdata Forum, https://forum.earthdata.nasa.gov/viewtopic.php?t=5333 (last access: 8 October 2026), 2024.
NASA Ocean Biology Processing Group: Aqua MODIS Level-2 Regional Ocean Color (OC) Data (version 2022.0), NASA Ocean Biology Distributed Active Archive Center [data set], https://doi.org/10.5067/AQUA/MODIS/L2/OC/2022.0, 2022.
O'Reilly, J.: Ocean color chlorophyll a algorithms for SeaWiFS, OC2, and OC4: Version 4, SeaWiFS Postlaunch Calibration and Validation Analyses, 11, 9–23, 2000.
Prospero, J. M., Charlson, R. J., Mohnen, V., Jaenicke, R., Delany, A. C., Moyers, J., Zoller, W., and Rahn, K.: The atmospheric aerosol system: An overview, Rev. Geophys., 21, 1607–1629, https://doi.org/10.1029/RG021i007p01607, 1983.
Robinson, W. D., Franz, B. A., Patt, F. S., Bailey, S. W., and Werdell, P. J.: Masks and flags updates, NASA Technical Memorandum – SeaWiFS Postlaunch Technical Report Series, NASA/TM-2003-206892, 22, NASA, 34–40, https://oceandata.sci.gsfc.nasa.gov/images/resources/seawifs/PLVol22.pdf (last access: 8 October 2026), 2003.
Shettle, E. P. and Fenn, R. W.: Models for the Aerosols of the Lower Atmosphere and the Effects of Humidity Variations on Their Optical Properties, Environmental Research Papers No. 676, AFGL-TR-79-0214, Air Force Geophysics Laboratory, https://www.researchgate.net/publication/235074087_Models_for_the_Aerosols_of_the_Lower_Atmosphere_and_the_Effects_of_Humidity_Variations_on_their_Optical_Properties (last access: 8 October 2026), 1979.
Shi, W. and Wang, M.: Detection of turbid waters and absorbing aerosols for the MODIS ocean color data processing, Remote Sens. Environ., 110, 149–161, https://doi.org/10.1016/j.rse.2007.02.013, 2007.
Steinmetz, F., Deschamps, P.-Y., and Ramon, D.: Atmospheric correction in presence of sun glint: application to MERIS, Opt. Express, 19, 9783–9800, https://doi.org/10.1364/OE.19.009783, 2011.
Stramski, D., Reynolds, R. A., Kahru, M., and Mitchell, B. G.: Estimation of Particulate Organic Carbon in the Ocean from Satellite Remote Sensing, Science, 285, 239–242, https://doi.org/10.1126/science.285.5425.239, 1999.
Stramski, D., Joshi, I., and Reynolds, R. A.: Ocean color algorithms to estimate the concentration of particulate organic carbon in surface waters of the global ocean in support of a long-term data record from multiple satellite missions, Remote Sens. Environ., 269, 112776, https://doi.org/10.1016/j.rse.2021.112776, 2022.
Todd, R. E. and Ren, A. S.: Warming and lateral shift of the Gulf Stream from in situ observations since 2001, Nat. Clim. Change, 13, 1348–1352, https://doi.org/10.1038/s41558-023-01835-w, 2023.
Tong, Y., Feng, L., Zhao, D., Xu, W., and Zheng, C.: Remote sensing of chlorophyll a concentrations in coastal oceans of the Greater Bay Area in China: Algorithm development and long-term changes, Int. J. Appl. Earth Obs., 112, 102922, https://doi.org/10.1016/j.jag.2022.102922, 2022.
Twedt, K., Xiong, X., Geng, X., Wilson, T., and Mu, Q.: Impact of satellite orbit drift on MODIS Earth scene observations used in calibration of the reflective solar bands, Proc. SPIE 12685, Earth Observing Systems XXVIII, 126850O, https://doi.org/10.1117/12.2676873, 2023.
Wang, M. and Jiang, L.: Atmospheric Correction Using the Information From the Short Blue Band, IEEE T. Geosci. Remote, 56, 6224–6237, https://doi.org/10.1109/TGRS.2018.2833839, 2018.
Wang, M. and Shi, W.: Cloud Masking for Ocean Color Data Processing in the Coastal Regions, IEEE T. Geosci. Remote, 44, 3196–3205, https://doi.org/10.1109/TGRS.2006.876293, 2006.
Wang, M., Son, S., and Shi, W.: Evaluation of MODIS SWIR and NIR-SWIR atmospheric correction algorithms using SeaBASS data, Remote Sens. Environ., 113, 635–644, https://doi.org/10.1016/j.rse.2008.11.005, 2009.
Wang, S., Li, X., Sun, D., He, X., Zhang, H., Zhao, W., and He, Y.: Satellite estimation of suspended particle types using a backscattering efficiency-based model in the marginal seas, Opt. Express, 31, 890–906, https://doi.org/10.1364/OE.476192, 2023.
Wang, Y., Wang, J., Levy, R. C., Xu, X., and Reid, J. S.: MODIS Retrieval of Aerosol Optical Depth over Turbid Coastal Water, Remote Sensing, 9, 595, https://doi.org/10.3390/rs9060595, 2017.
Wei, J., Wang, M., Jiang, L., Yu, X., Mikelsons, K., and Shen, F.: Global Estimation of Suspended Particulate Matter From Satellite Ocean Color Imagery, J. Geophys. Res.-Oceans, 126, e2021JC017303, https://doi.org/10.1029/2021JC017303, 2021.
Werdell, P. J., Franz, B. A., Bailey, S. W., Feldman, G. C., Boss, E., Brando, V. E., Dowell, M., Hirata, T., Lavender, S. J., Lee, Z., Loisel, H., Maritorena, S., Mélin, F., Moore, T. S., Smyth, T. J., Antoine, D., Devred, E., d'Andon, O. H. F., and Mangin, A.: Generalized ocean color inversion model for retrieving marine inherent optical properties, Appl. Optics, 52, 2019–2037, https://doi.org/10.1364/AO.52.002019, 2013.
Werdell, P. J., Bailey, S., Fargion, G., Pietras, C., Knobelspiesse, K., Feldman, G., and McClain, C.: Unique data repository facilitates ocean color satellite validation, Eos T. Am. Geophys. Un., 84, 377–387, https://doi.org/10.1029/2003EO380001, 2003.
Werdell, P. J., Franz, B. A., and Bailey, S. W.: Evaluation of shortwave infrared atmospheric correction for ocean color remote sensing of Chesapeake Bay, Remote Sens. Environ., 114, 2238–2247, https://doi.org/10.1016/j.rse.2010.04.027, 2010.
Xu, Y., Zhou, S., Hu, L., Wang, Y., and Xiao, W.: Different controls on sedimentary organic carbon in the Bohai Sea: River mouth relocation, turbidity and eutrophication, J. Mar. Syst., 180, 1–8, https://doi.org/10.1016/j.jmarsys.2017.12.004, 2018.
Ye, H., Li, J., Li, T., Shen, Q., Zhu, J., Wang, X., Zhang, F., Zhang, J., and Zhang, B.: Spectral Classification of the Yellow Sea and Implications for Coastal Ocean Color Remote Sensing, Remote Sens., 8, 321, https://doi.org/10.3390/rs8040321, 2016.
Yu, S., Bai, Y., He, X., Gong, F., and Li, T.: A new merged dataset of global ocean chlorophyll-a concentration for better trend detection, Front. Mar. Sci., 10, 2023, https://doi.org/10.3389/fmars.2023.1051619, 2023.
Zhang, M., Ma, R., Li, J., Zhang, B., and Duan, H.: A Validation Study of an Improved SWIR Iterative Atmospheric Correction Algorithm for MODIS-Aqua Measurements in Lake Taihu, China, IEEE T. Geosci. Remote, 52, 4686–4695, https://doi.org/10.1109/TGRS.2013.2283523, 2014.
Zhao, D., Feng, L., and He, X.: Global Gridded Aerosol Models Established for Atmospheric Correction Over Inland and Nearshore Coastal Waters, J. Geophys. Res.-Atmos., 128, e2023JD038815, https://doi.org/10.1029/2023JD038815, 2023.
Zhao, G., Jiang, W., Wang, T., Chen, S., and Bian, C.: Decadal Variation and Regulation Mechanisms of the Suspended Sediment Concentration in the Bohai Sea, China, J. Geophys. Res.-Oceans, 127, e2021JC017699, https://doi.org/10.1029/2021JC017699, 2022.
Zhao, S., Wu, Y., Lv, J., Zhao, D., Zheng, Y., and Feng, L.: High-Quality Remote Sensing Reflectance Products over China and US Coast (MODIS, 2003–2022), Zenodo [data set], https://doi.org/10.5281/zenodo.16413443, 2025.
Zhou, Y., Levy, R. C., Remer, L. A., Mattoo, S., and Espinosa, W. R.: Dust Aerosol Retrieval Over the Oceans With the MODIS/VIIRS Dark Target Algorithm: 2. Nonspherical Dust Model, Earth Space Sci., 7, e2020EA001222, https://doi.org/10.1029/2020EA001222, 2020.