the Creative Commons Attribution 4.0 License.
the Creative Commons Attribution 4.0 License.
 | 07 Oct 2026
Improved estimation of net ecosystem CO2 exchange over North America using LSTM-based flux upscaling (2001–2021)
Chengcheng Huang
Wei He

Brendan Byrne
Ngoc Tu Nguyen
Jingfeng Xiao
Hua Yang
Philippe Ciais
Songhan Wang
Peipei Xu
Mengyao Zhao
Weimin Ju
Accurate estimation of regional-scale terrestrial carbon budgets is of great importance but remains challenging. With particular advantages, the Long Short-Term Memory (LSTM) network method shows potential for improving regional carbon budget upscaling estimations. Here, using LSTM, we upscaled regional net ecosystem carbon exchange (NEE) with available flux tower measurements and satellite land surface observations in North America. With well-established ecosystem-specific LSTMs, we produced monthly NEE at a spatial resolution of 0.1°×0.1° over 2001–2021 (labelled as MemoryFlux). Unlike existing upscaling estimates, our dataset properly identified the Midwest Corn Belt as a region of large seasonal carbon uptake during the peak growing season, a feature revealed by previous top-down studies and recognized as a model benchmark. Moreover, the seasonal variations in NEE estimated by MemoryFlux were strongly correlated with those from independent atmospheric inversions, including the ensemble mean of the Orbiting Carbon Observatory-2 Model Intercomparison Project (OCO-2 v10 MIP; r=0.96, p<0.001) and CarbonTracker2022 (CT2022) (r=0.97, p<0.001). The mean annual NEE was estimated at −1.27 ± 0.12 Pg C yr−1, which was closer in magnitude to inversions (−0.83 to −0.70 Pg C yr−1) than existing upscaling estimates (−3.30 to −1.68 Pg C yr−1). In addition, MemoryFlux captured spatial NEE anomaly patterns associated with six selected severe drought and flood events. We further found that explicitly incorporating historical predictor information improved the representation of NEE interannual variability and spatial anomalies associated with climate extremes. MemoryFlux provides an improved bottom-up estimation of North American NEE and shows greater consistency in magnitude with independent atmospheric inversion estimates than several existing EC-based upscaling products. The MemoryFlux dataset is available at https://doi.org/10.5281/zenodo.20482274 (Huang and He, 2026).
- Article
(12728 KB) - Full-text XML
-
Supplement
(1579 KB) - BibTeX
- EndNote


Terrestrial ecosystems, as important carbon sinks on Earth, absorb approximately one fourth of the carbon dioxide (CO2) released by human activities, which significantly slows down the rising CO2 in the atmosphere and the pace of global warming (Friedlingstein et al., 2022). Net ecosystem CO2 exchange (NEE), defined as the difference between the CO2 released by total ecosystem respiration and the CO2 sequestered by photosynthesis (Ballantyne et al., 2021), indicates the current net carbon balance of terrestrial ecosystems. Climate extremes, e.g., droughts, floods, heatwaves, and wildfires, strongly impact terrestrial CO2 exchange processes, leading to non-negligible interannual variations (IAVs) in ecosystem carbon budgets (Le Quéré et al., 2018). Accurate quantification of NEE at regional and global scales is essential for advancing our understanding of carbon-climate feedbacks (Yao et al., 2018).
NEE is only measurable at the plot scale with the eddy covariance (EC) technique (Wofsy et al., 1993), and cannot be observed directly over large scales. Feasible ways to estimate large-scale NEE include top-down inversion of atmospheric CO2concentration measurements and bottom-up estimation using process-based terrestrial biosphere models (TBMs) and data-driven machine learning (ML) upscaling. In recent years, the availability of atmospheric CO2 observations has been greatly enhanced by space-based observations (Byrne et al., 2019), making it possible to infer the large-scale space-time distribution of carbon fluxes by using transport models and atmospheric CO2 data. Compared to bottom-up estimates, top-down inversions constrained by atmospheric CO2 data provide an independent perspective on regional carbon exchange and a seasonal cycle of NEE that is more consistent with tower observations by assimilating the loss of CO2 from various carbon release and transport pathways (Byrne et al., 2018). However, confined by sampling density, current atmospheric CO2 inversions only provide reliable estimates at relatively coarse spatial resolutions (Byrne et al., 2023). Process-based TBMs, which explicitly take the physical processes of energy, carbon, and water cycles into account, have become important tools for studying ecosystem carbon budgets (White et al., 2000). Nevertheless, TBM-based flux estimates are subject to substantial uncertainties arising from model structure, parameterization, and forcing data (Foster et al., 2024; Huntzinger et al., 2012), and lack effective constraints from multi-source observations (Ciais et al., 2022). Recently, the rapid development of ML approaches has paved new avenues for modelling the terrestrial carbon cycle. Data-driven ML approaches are straightforward and efficient for assessing NEE since they allow for easy integration of data and full use of information from various sources (Xiao et al., 2008, 2011, 2014). These methods derive the NEE estimates through spatial extrapolation without making any assumptions about ecosystem patterns (Jung et al., 2019; Xiao et al., 2014).
However, compared with top-down inversions, which assimilate various carbon flux transport pathways, large-scale bottom-up ML-based NEE estimates contain considerable uncertainty, primarily due to the difficulty of capturing the complex and highly nonlinear ecosystem responses to disturbances and climate extremes (Vicca et al., 2014). Characterizing the potential effects of climate variability on terrestrial carbon cycling remains challenging because the spatiotemporal dynamics and underlying response mechanisms are not yet fully understood. Observations suggest that ecosystem CO2 flux responses are influenced not only by contemporary environmental conditions but also by memory effects of previous climate variability, disturbances, and their interactions (Monger et al., 2015). Such memory effects can operate across multiple time scales through dynamic interactions between biomes and their environment (Kraft et al., 2019), because terrestrial ecosystems may require months to years to recover from disturbances associated with climate extremes (Ogle et al., 2015). These temporal dependencies pose challenges to the advancement of research on the carbon cycle and climate change. Incorporating information on antecedent vegetation states and environmental conditions can therefore improve the representation of current ecosystem response to climate variability at large spatial scales (Seddon et al., 2016). Moreover, the dependence of carbon cycle dynamics on climate variability is more complex, as the IAVs in temperature and precipitation can substantially influence carbon flux estimates in terrestrial ecosystems (Piao et al., 2020).
To understand the memory effects of climate extremes on ecosystem carbon fluxes, a considerable amount of research has been conducted (Aubinet et al., 2018; Liu et al., 2018; Shen et al., 2016; Wu et al., 2015). Generally, the link between NEE IAVs and the memory effects of these climate extremes has not been sufficiently characterized by ML-based models. ML methods typically do not directly consider carbon fluxes and stocks at previous time steps, while reflecting the effects of past disturbances to some extent through the use of certain independent datasets (e.g., vegetation indices) (Tao et al., 2020). Thus, these approaches cannot fully represent the inherent temporal interactions of ecosystem carbon cycle processes (Papagiannopoulou et al., 2017). Poor understanding and inadequate representation of memory effects result in substantial uncertainty in estimating regional carbon budgets and considerable differences between top-down inversions and bottom-up estimates (Deng et al., 2013). Consistency between bottom-up estimates and independent atmospheric inversions across fundamentally different methodologies is nevertheless a key way to increase the confidence in quantifying terrestrial ecosystem carbon fluxes at large scales. Therefore, developing the capacity of bottom-up models to explicitly incorporate historical information contained in climate and vegetation time series is urgently needed to better represent temporal variability in ecosystem carbon fluxes.
The Long Short-Term Memory (LSTM) network is a temporal dynamic statistical approach (Besnard et al., 2019; Hochreiter and Schmidhuber, 1997), which effectively addresses long-term dependence issues and thus can incorporate the memory effects of climate change on the terrestrial carbon cycle. LSTM has exhibited an outstanding power in characterizing the memory effects of climate and vegetation on NEE and improving the overall prediction accuracy at the site level (Besnard et al., 2019; Huang et al., 2024; Liu et al., 2023; Ma et al., 2026). As a pioneer such study over large scales, Liu et al. (2023) proved the importance of the memory effects for assessing IAVs in NEE by conducting an upscaling estimation of global gridded NEE using LSTM. In our previous work, we established plant functional type (PFT)-specific LSTM models for NEE prediction using flux tower measurements from more than 80 sites and multiple satellite land surface datasets over North America, and found that the LSTM framework provided better site-level predictive performance and representation of NEE IAVs than a Random Forest model using contemporaneous predictors (Huang et al., 2024). Yet, the ability of LSTM models to characterize regional spatiotemporal NEE patterns, particularly with the aid of multi-source satellite land surface data, has not been sufficiently examined. For example, Liu et al. (2023) used only one satellite vegetation variable, the normalized difference vegetation index (NDVI), and did not investigate the performance of the upscaling result in capturing the impacts of large-scale climate extremes.
In this study, we focus on North America, a region with the most extensive eddy flux observations globally and a relatively well-studied carbon budget. In particular, the substantial carbon uptake in the Midwest Corn Belt has been widely reported as a continental-scale phenomenon since the start of the CarbonTracker inversion (Peters et al., 2007) and during the Mid-Continent Intensive campaign (Schuh et al., 2013), and it has been revisited as a model benchmark feature. However, existing global flux upscaling datasets generally fail to capture this phenomenon. To upscale NEE, we employ an LSTM DL algorithm that fully utilizes in situ CO2 flux observations in combination with diverse remote sensing and climate variables. From this, we generate a long-term gridded NEE dataset at a spatial resolution of 0.1° and monthly intervals from 2001 to 2021. The resulting dataset, named MemoryFlux, is publicly available for research purposes. We aim to answer a key scientific question: Does explicitly incorporating historical predictor information and integrating multi-source satellite data improve the representation of North American NEE? An ensemble of flux upscaling datasets and atmospheric inversions is used for comparison. We evaluate the consistency and differences among MemoryFlux, previously reported empirical knowledge, existing bottom-up products, and independent top-down inversion estimates, with particular attention to seasonal, interannual, and spatial variability. We also assess whether MemoryFlux shows greater consistency with inversions than existing bottom-up upscaling products and whether it provides a coherent representation of NEE anomalies associated with selected climate extremes. We anticipate that MemoryFlux, which explicitly incorporates historical ecosystem information within an LSTM framework, provides a robust representation of ecosystem carbon fluxes and serves as a valuable resource for investigating terrestrial carbon dynamics and ecosystem–climate interactions.
2.1 Datasets
2.1.1 CO2 eddy covariance flux data
The study area encompassed the major terrestrial land-cover types across North America, extending from 5 to 80° N. We used observations from 84 flux sites (Table S1 in the Supplement), totalling 7711 monthly NEE records (Table S2), drawn from FLUXNET2015 (Pastorello et al., 2020) and the AmeriFlux network (Novick et al., 2018). These observations were combined with various remote sensing and climate reanalysis datasets. The target variable was monthly average NEE (NEE_VUT_REF; ), with negative NEE values indicating net carbon uptake by terrestrial ecosystems and positive values indicating net carbon release to the atmosphere. The database covered 10 major plant functional types (PFTs) in North America (Fig. 1), following the International Geosphere-Biosphere Programme (IGBP) classification: evergreen needleleaf forest (ENF), deciduous broadleaf forest (DBF), mixed forest (MF), cropland (CRO), grassland (GRA), woody savanna (WSA), open shrubland (OSH), closed shrubland (CSH), savanna (SAV), and permanent wetland (WET).
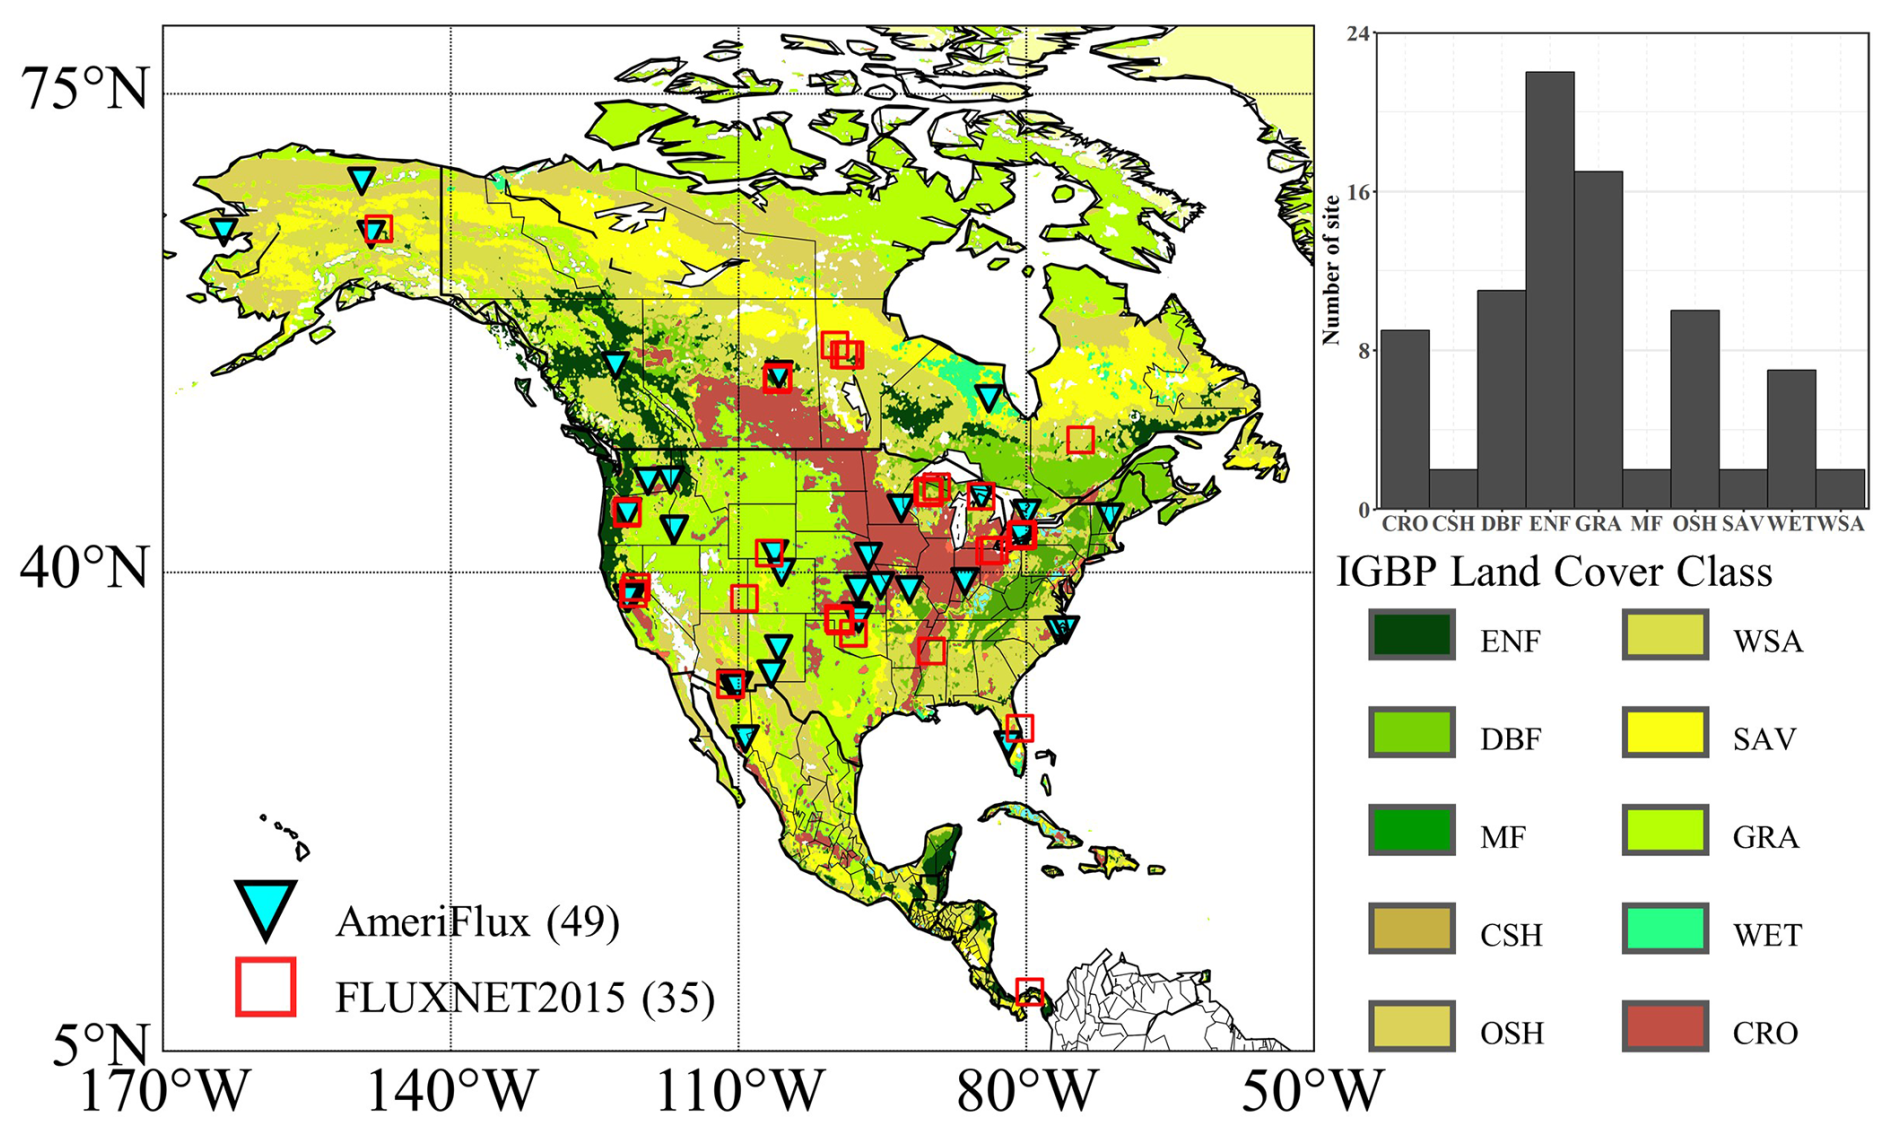
Figure 1Distribution of the eddy covariance flux towers used in this study. The background information reveals the land cover types across North America, derived from the MCD12C1 dataset. MODIS Land Cover Type Product (MCD12C1) © NASA and U.S. Geological Survey.
2.1.2 Climate reanalysis data
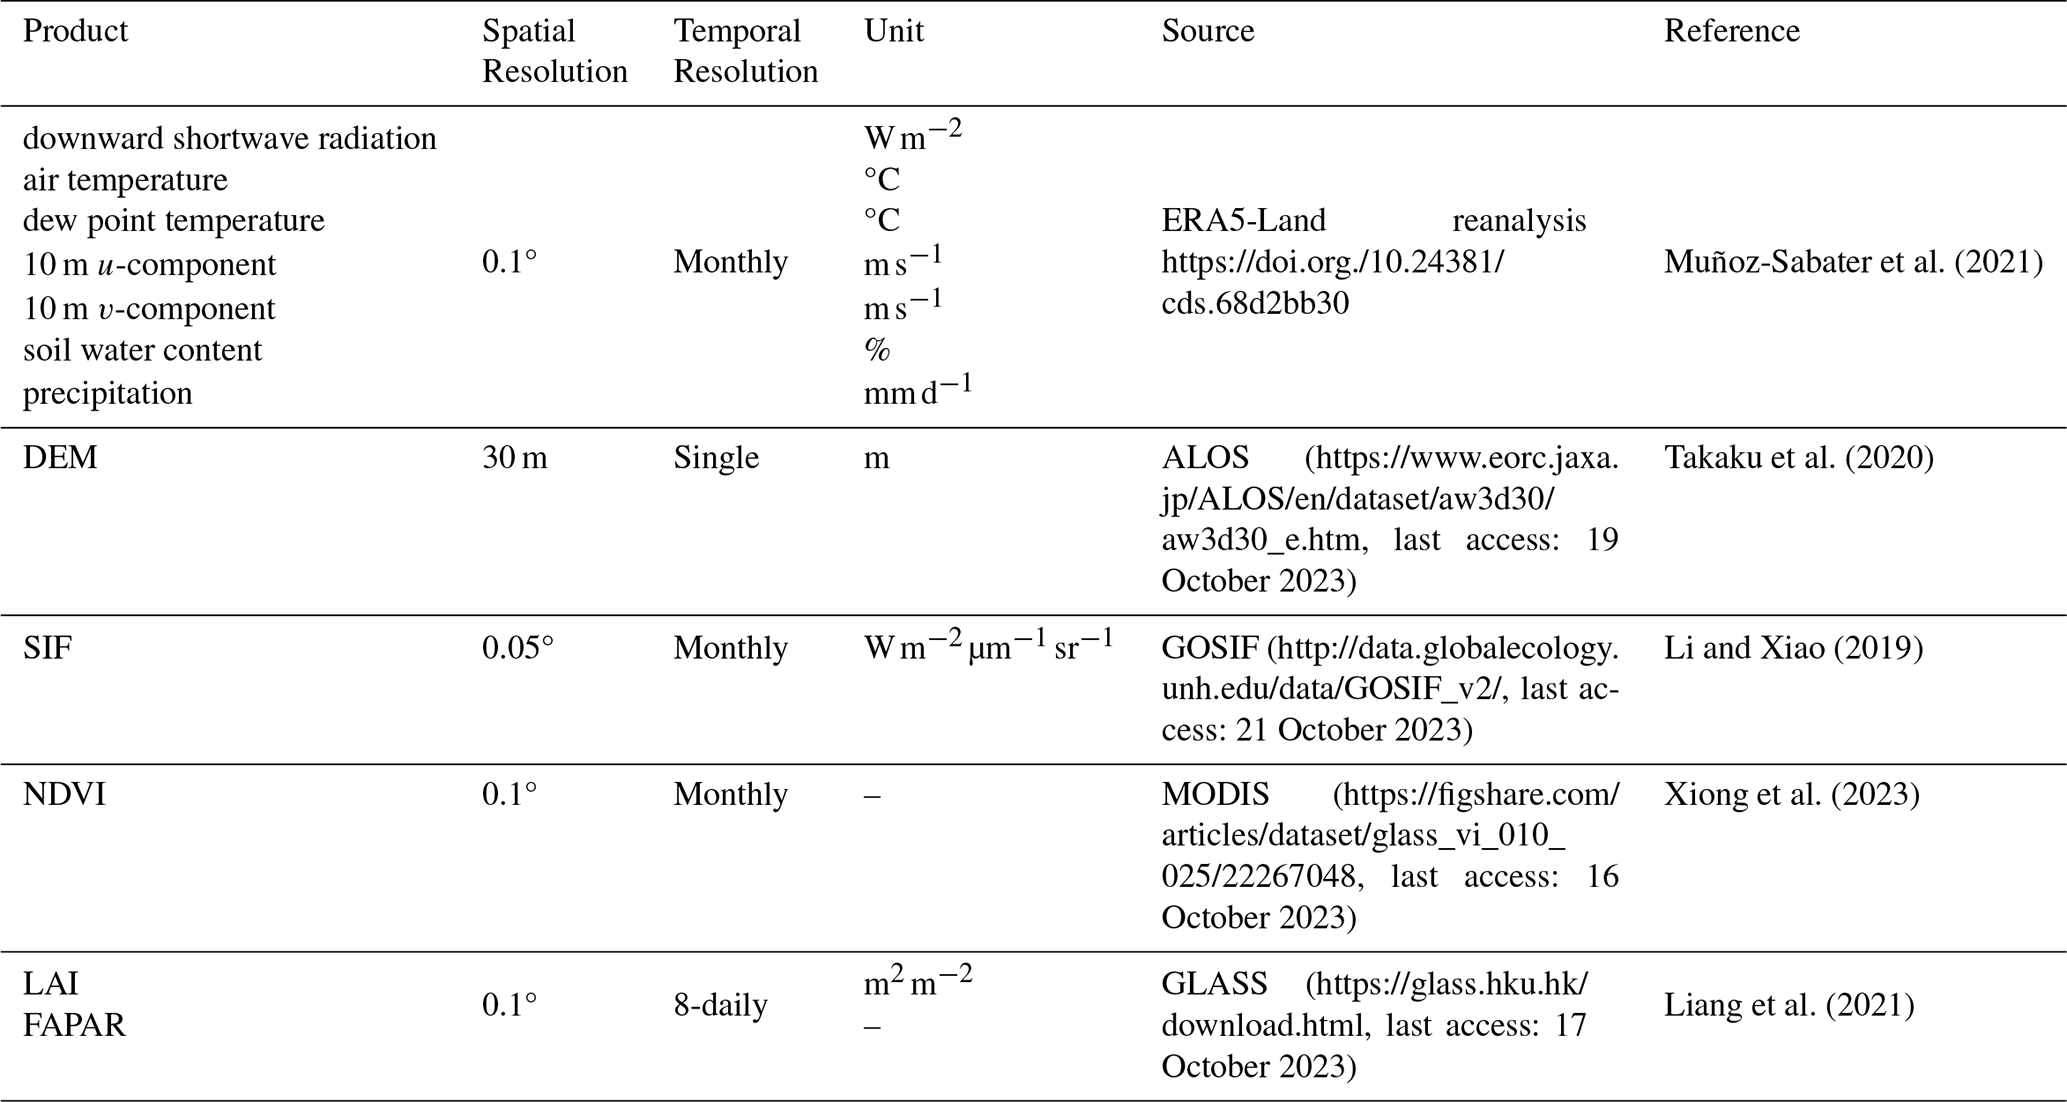
Information about the predictive features used in this study for upscaling NEE is listed in Table 1. These variables were selected to correspond as closely as possible to the climate and environmental drivers used at the site level (Huang et al., 2024). We extracted seven variables from ERA5-Land, including downward shortwave radiation (DSR), air temperature (Ta), dew point temperature (Td), the 10 m u-component of wind (U10), the 10 m v-component of wind (V10), soil water content in the first soil layer (0–7 cm; SWC), and precipitation (P). ERA5-Land is the land component of the fifth generation of European Reanalysis (ERA5) (Muñoz-Sabater et al., 2021), developed by the Copernicus Climate Change Service at the European Centre for Medium-Range Weather Forecasts. It integrates various data sources, including both remote sensing observations and ground-based measurements, ultimately providing monthly data at 0.1° resolution.
Table 1Basic information about the predictive datasets used in this study. All gridded predictors were converted to the same units as their corresponding variables used for site-level model training.
The U10 and V10 components from ERA5-Land were used to calculate wind speed (WS), which served as a predictor of NEE:
According to Eqs. (2)–(6), vapor pressure deficit (VPD; hPa) was calculated using the Ta and Td retrieved from ERA5-Land:
where SVP and AVP represent saturated and actual vapor pressure (hPa), respectively. These values can be computed using the following equations:
where Ta is the air temperature (°C), while Td denotes the dew point temperature (°C). Pmst and Pmsl represent the air pressure (hPa) and the air pressure at the mean sea level (1013.25 hPa), respectively. Z represents the altitude (m) and was provided by the Advanced Land Observing Satellite (ALOS) (Tadono et al., 2016). The 30 m data were resampled to 0.1° to align with the resolution of the ERA5-Land reanalysis dataset. Thereby, monthly VPD values with consistent spatial and temporal coverage were generated.
2.1.3 Satellite data
We further selected remote sensing variables to represent the growth status of vegetation. NDVI was utilized in this study, which can indicate disturbance by displaying spectral browning signals linked to drought, harvesting, and fire (Myers-Smith et al., 2020). We employed the new global seamless 0.1°, monthly NDVI product, which was derived from Moderate Resolution Imaging Spectroradiometer (MODIS) surface reflectance data using an LSTM network method (Xiong et al., 2023). This product provides long-term information on global vegetation dynamics.
Two MODIS-based Global Land Surface Satellite (GLASS) product suites (Liang et al., 2021) were used: leaf area index (LAI) and fraction of absorbed photosynthetically active radiation (FAPAR). Both components have a 0.1° resolution and 8 d intervals, covering the period from 2000 to 2021. To match the monthly temporal resolution of NEE, we generated monthly composites by averaging the 8 d values. For 8 d windows spanning two months, the values were allocated to each month by weighting them according to the number of days within that month.
We also represented the space-time variations of NEE by incorporating novel satellite datasets. Solar-induced chlorophyll fluorescence (SIF) has brought considerable advancement in measuring terrestrial photosynthesis and is reported to have a strong correlation with NEE changes (Huang et al., 2024; Shiga et al., 2018). We employed the monthly Global Orbiting Carbon Observatory-2 (OCO-2) based SIF (GOSIF), a reconstructed SIF dataset with a high resolution (0.05°), developed using OCO-2 SIF, MODIS vegetation index, and MERRA-2 reanalysis data (Li and Xiao, 2019). Subsequently, we resampled the SIF data to a 0.1° resolution using the averaging approach.
For each 0.05° grid cell, the modal MCD12C1 land-cover class over 2001–2021 was designated as the representative class, such that interannual land-cover changes were not considered (Jung et al., 2019). This procedure produced a static PFT map and reduced potential noise associated with year-to-year classification error in the MODIS land-cover product. The resulting map was then resampled to a spatial resolution of 0.1° using the majority aggregation method.
2.1.4 NEE data products for comparison
Due to the sparse distribution of EC flux towers and the mismatch between product grids and tower footprints, large-scale evaluation of the upscaling NEE estimates required comparisons with published regional carbon flux products. Atmospheric inversions infer surface fluxes by combining atmospheric CO2 observations with atmospheric transport models. This makes them useful for characterizing large-scale seasonal and interannual variations, and they therefore serve as independent references for evaluating bottom-up products. We selected two monthly atmospheric inversions for comparison: the OCO-2 Model Intercomparison Project (MIP) (Byrne et al., 2023) and CarbonTracker2022 (Peters et al., 2007). For OCO-2 v10 MIP, we used the ensemble-mean posterior land flux from the “LNLGIS” experiment (“land”), which assimilates OCO-2 Land Nadir and Land Glint XCO2 retrievals together with in situ CO2 measurements and provides 1° estimates for 2015–2020. To improve comparability with EC-based ecosystem NEE, we removed the prescribed wildfire-emission component using the National Oceanic and Atmospheric Administration (NOAA) CarbonTracker “fire_flux_imp” estimate. We also included CarbonTracker2022 (CT2022), the latest version of CarbonTracker developed by NOAA (Jacobson et al., 2023; Peters et al., 2007). For CT2022, we used the optimized terrestrial biosphere flux (“bio_flux_opt”), which provides 1° global land–atmosphere CO2 exchange for 2001–2020, with wildfire emissions represented separately from the optimized biosphere flux. Importantly, closer agreement between MemoryFlux and the atmospheric inversions was not interpreted as direct evidence of higher accuracy. Instead, the inversions were treated as independent references based on fundamentally different methodologies, providing complementary information for assessing the consistency of regional NEE estimates in the absence of large-scale direct observations.
We also compared MemoryFlux with representative ML-based bottom-up NEE products at regional and global scales. At the regional scale, we used the EC-MOD2012 dataset for North America, which provided NEE estimates at 1 km spatial and 8 d temporal resolution for 2000–2012 and was derived from EC flux measurements and MODIS observations (Xiao et al., 2014). At the global scale, we included the FLUXCOM 2020 ensemble products (RS+CRUJRA1.1, 2001–2017; RS+ERA5, 2001–2018) developed by the Max Planck Institute for Biogeochemistry (MPI-BGC) (Jung et al., 2019). These products provide 0.5° monthly NEE estimates with broad spatial coverage and continuous temporal records. We also included FLUXCOM-X, the latest generation of FLUXCOM products, which provided global 0.05° NEE estimates (2001–2021) with improved methodology and data integration (Nelson et al., 2024). In addition, we used NIES2020 (1999–2019, 0.1° every 10 d) from the National Institute for Environmental Studies, Japan. Unlike FLUXCOM, which used static PFT information, NIES2020 derived vegetation-type information from LAI-related variables, thereby improving the representation of spatial heterogeneity and enhancing model generalization across ecosystems (Zeng et al., 2020).
Together, these complementary datasets provided a broad comparison framework, covering regional to global upscaling products and atmospheric inversion results. Comparisons with these datasets allowed us to assess the consistency and differences among MemoryFlux, previously reported regional NEE patterns, existing bottom-up products, and independent top-down inversion estimates, as well as to evaluate how effectively MemoryFlux represents regional-scale seasonal, interannual, and extreme-event-related variability in NEE.
2.2 The LSTM model for NEE upscaling
Conventional non-recurrent models generally treat observations at each time step independently and do not contain a dedicated architecture for explicitly representing temporal dependencies between current NEE and antecedent predictor conditions. The Long Short-Term Memory (LSTM) network (Hochreiter and Schmidhuber, 1997), a dynamic statistical model, can use previous variable data of a certain look-back window as input to predict the NEE output at the current time. NEE is a variable influenced by multiple factors, such as climate and environment. Considering that this influence changes over time, it is essential to predict NEE using historical data that capture its response to climate and disturbance conditions over specific periods.
In our previous work, we used an LSTM model to simulate NEE and its IAVs at the site level by linking monthly CO2 fluxes with environmental and vegetation predictors (Huang et al., 2024). The model was trained with a six-month look-back window to predict current NEE, enabling it to capture temporal dependencies in vegetation dynamics and meteorological conditions. This window length corresponds to the empirical memory effects of most ecosystems reported by Liu et al. (2023) and was further validated to provide good predictive performance at the site scale (Huang et al., 2024; Ma et al., 2026). Key inputs for site-scale model training included meteorological and environmental variables measured at EC flux towers (TA_F, WS_F, P_F, DSR_F, SWC_F_MDS_#, and VPD_F), together with vegetation variables derived from remote sensing datasets (NDVI, LAI, FAPAR, and SIF). For SWC, the shallowest available SWC measurement at each site was used to maximize data availability. We used the quality-controlled and gap-filled variables provided by the flux networks, removed values flagged as −9999 as well as obvious outliers, and retained only sites with at least 18 consecutive valid monthly observations. For sites represented in both FLUXNET and AmeriFlux, the record with the longer and more complete time series was used. The LSTM models were trained using tower-observed meteorological variables rather than ERA5-Land data. This design was intended to make full use of co-located EC-site observations when establishing empirical relationships between NEE and its environmental drivers. We adopted an improved temporal cross-validation strategy to minimize overfitting and enhance model robustness (Fig. S1 in the Supplement). Specifically, the initial 70 % of data from each site were assigned to the training set, while the remaining 30 % were reserved as an independent testing set. During model training, we further employed nested ten-fold cross-validation to internally validate the training set and optimize model hyperparameters using a combination of early stopping and grid search (Bergstra and Bengio, 2012). This design effectively reduced the risk of data leakage and enhanced the model's generalization to unseen data while strictly maintaining the independence of the training, validation, and testing datasets. Loss curves (Fig. S2) confirmed the robustness of the LSTM models.
Building on this foundation, we applied the LSTM framework to regional carbon flux upscaling across North America. To reduce inconsistencies between site-training and regional prediction, ERA5-Land variables were harmonized with the corresponding EC-site variables in terms of physical definitions and units before being used as model inputs. Remote sensing and meteorological reanalysis gridded datasets were then processed into pixel-level predictor time series and fed into the corresponding PFT-specific LSTM models, yielding monthly NEE estimates at 0.1° spatial resolution. Predictions were generated for 10 PFTs (ENF, DBF, MF, CRO, GRA, WSA, OSH, CSH, SAV, and WET) represented in the site-level training dataset. For the SAV PFT, SWC was not included as a predictor because reliable site-level SWC observations were unavailable. To maintain consistency between site-level model training and regional upscaling, SWC was also excluded from the corresponding gridded SAV model. Despite the reduced predictor set, the SAV LSTM model still demonstrated strong predictive performance (R2=0.83; Fig. S3).
3.1 Spatial patterns of NEE in North America
Figure 2 illustrated the spatial patterns of long-term mean NEE from MemoryFlux over 2001–2021. The long-term mean highlighted the dominant spatial distribution of NEE while minimizing the influence of interannual variations. Annually, the strongest carbon uptake was observed in the southeastern United States, followed by the northern Pacific Coast and tropical regions, whereas major carbon sources were concentrated in the tundra of northern and central Canada, as well as in the arid central U.S., where precipitation is limited. During the peak growing season (July–August), the Corn Belt in the Upper Midwest U.S. (Fig. 2b and c) emerged as the dominant carbon-uptake region. As the peak growing season progressed, the spatial extent of strong carbon uptake contracted in August, though it remained largely consistent with the North American Corn Belt. By the end of the peak growing season (September), the carbon uptake area further diminished (Fig. 2d). From July to September, CO2 sources were mainly concentrated in the western U.S. and southwestern Canada, with both their spatial extent and magnitude increasing over time.
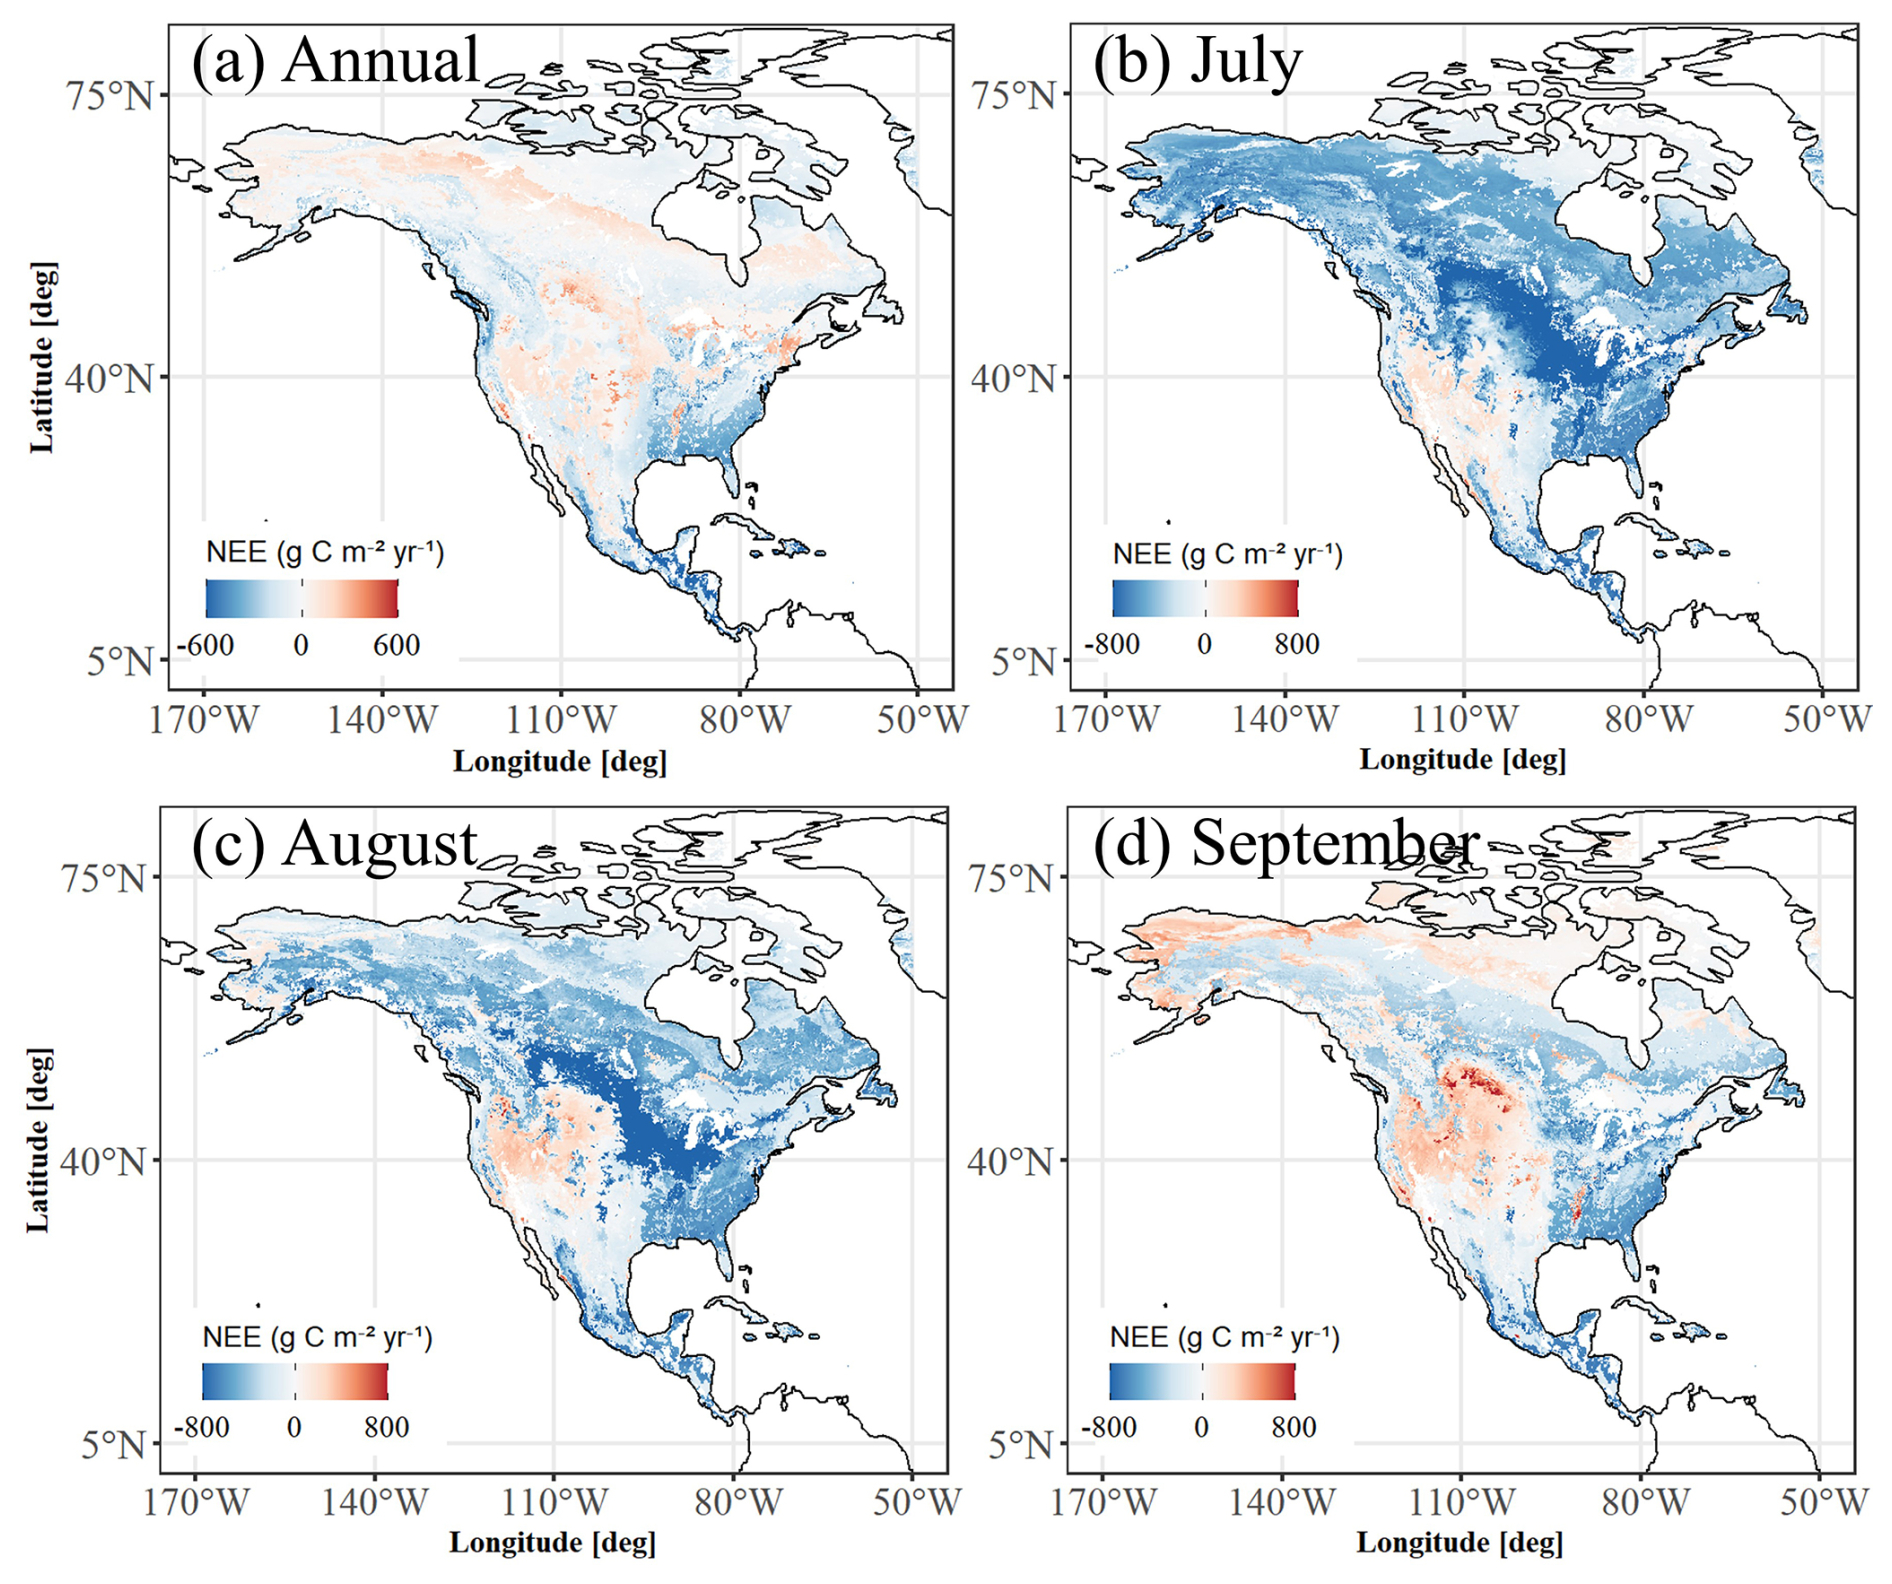
Figure 2Spatial distribution of NEE from MemoryFlux dataset, (a) on an annual basis, (b, c) during the peak growing season, and (d) in September, averaged over 2001–2021 at 0.1° resolution across North America.
To further evaluate spatial patterns, we compared MemoryFlux with seven other NEE datasets (Fig. 3). At the annual scale, MemoryFlux and the other ML-based flux-upscaling products consistently identified the southeastern United States as the region of strongest carbon uptake, whereas the OCO-2 v10 MIP and CT2022 inversions showed stronger annual uptake centred over the Midwest Corn Belt. This discrepancy may reflect methodological differences and uncertainties inherent in both EC-based upscaling and atmospheric inversion approaches. During the peak growing season, MemoryFlux reproduced pronounced seasonal carbon uptake over the Midwest U.S. croplands, a feature also evident in OCO-2 v10 MIP, CT2022, and EC-MOD2012. In contrast, other global flux-upscaling products showed their strongest seasonal uptake in the southeastern United States. These results indicated that the seasonal and annual spatial patterns represented by MemoryFlux were more consistent with previous empirical evidence and with most published estimates. Latitudinal gradients were generally consistent across datasets, although the inversions exhibited weaker NEE variations with latitude (Fig. 3b and d). Furthermore, only the regional NEE estimates from MemoryFlux, EC-MOD2012, and the global FLUXCOM-X consistently identified annual CO2 sources in northern and central Canada, as well as in the central U.S., and captured growing season CO2 release in the western U.S. and southwestern Canada. Among these datasets, only the OCO-2 v10 MIP inversions indicated the northern Pacific Coast and tropical regions as annual carbon sources.
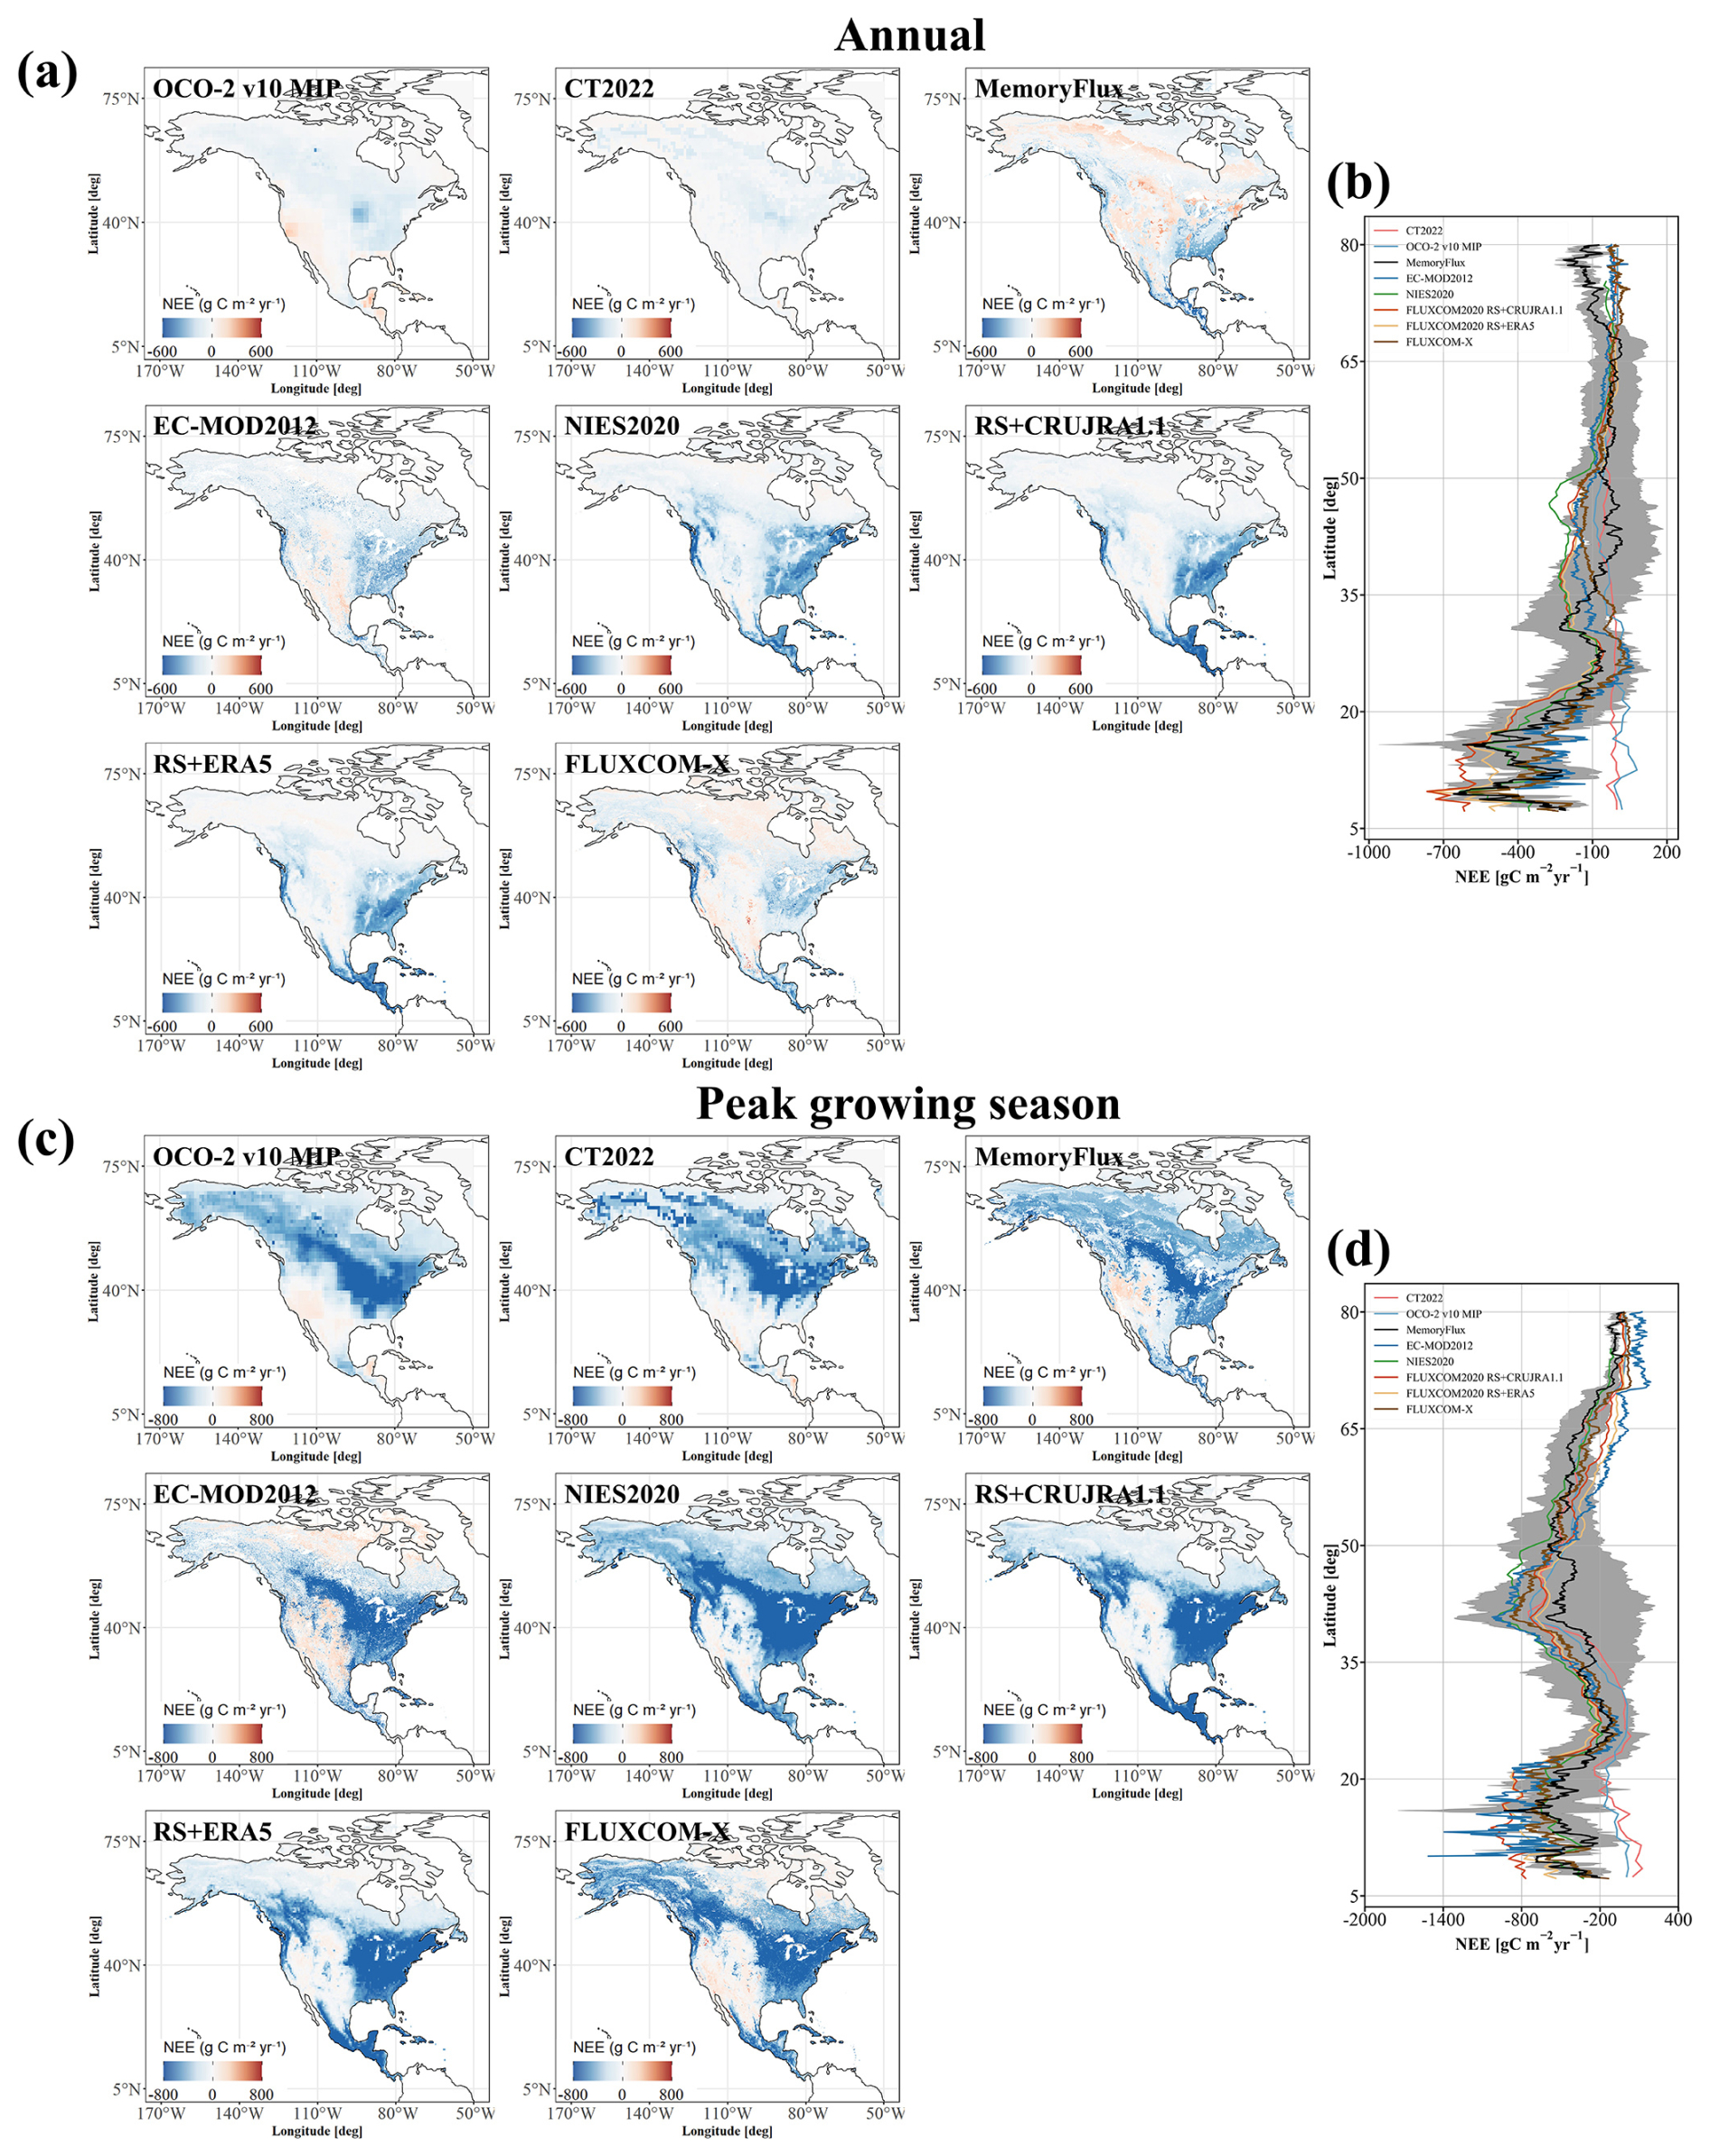
Figure 3Spatial distribution of NEE in North America on an annual basis and during the peak growing season (July–August) derived from OCO-2 v10 MIP, CT2022, MemoryFlux, EC-MOD2012, NIES2020, FLUXCOM2020 RS+CRUJRA1.1, FLUXCOM2020 RS+ERA5, and FLUXCOM-X. The shades around the lines in (b) and (d) represent the range of standard deviation.
We further analysed the contributions of major ecoregions to annual total NEE using the vegetation-type classification of Olson et al. (2001), as implemented in the CarbonTracker project (Fig. S4). On average, MemoryFlux indicated that Forests/Wooded ecoregions served as the dominant carbon sink in North America, with a mean uptake of −0.76 Pg C yr−1, whereas Grass/Shrubs contributed only marginally, with uptake close to zero. Although all products agreed on the leading role of Forests/Wooded ecosystems as carbon sinks, the magnitude of their contributions varied across datasets. MemoryFlux and FLUXCOM-X attributed more than 85 % of the total carbon sink to forests; EC-MOD2012 and the other global upscaling products estimated about 75 %, while OCO-2 v10 MIP and CT2022 reported substantially lower shares of 65 % and 38 %, respectively. Moreover, only a few products (EC-MOD2012 and FLUXCOM-X) suggested that Grass/Shrubs acted as a weak carbon source.
3.2 Seasonal variations of NEE in North America
To evaluate the seasonal variations represented by MemoryFlux, we compared it with other NEE datasets (Fig. 4 and Table S3). This comparison was limited to 2015–2017 when all products except EC-MOD2012 were available. The results revealed that MemoryFlux exhibited similar seasonal patterns to other NEE datasets, demonstrating carbon uptake during warm seasons and carbon release during cold seasons. The estimated NEE seasonal cycle matched well with the OCO-2 v10 MIP (RMSE=0.11 Pg C per month, MAE=0.09 Pg C per month, r=0.96, p<0.001) and CT2022 inversions (RMSE=0.13 Pg C per month, MAE=0.11 Pg C per month, r=0.97, p<0.001). However, it had weaker net carbon uptake in June, particularly relative to the global upscaling products. Notably, all upscaling NEE products exhibited earlier spring onset and later autumn senescence compared with atmospheric inversions. Furthermore, these global upscaling NEE products generally estimated stronger carbon uptake than both the atmospheric inversions and MemoryFlux, particularly during the growing seasons. NIES2020 exhibited the largest amplitude in the seasonal NEE cycle, particularly in July (Fig. 4a).
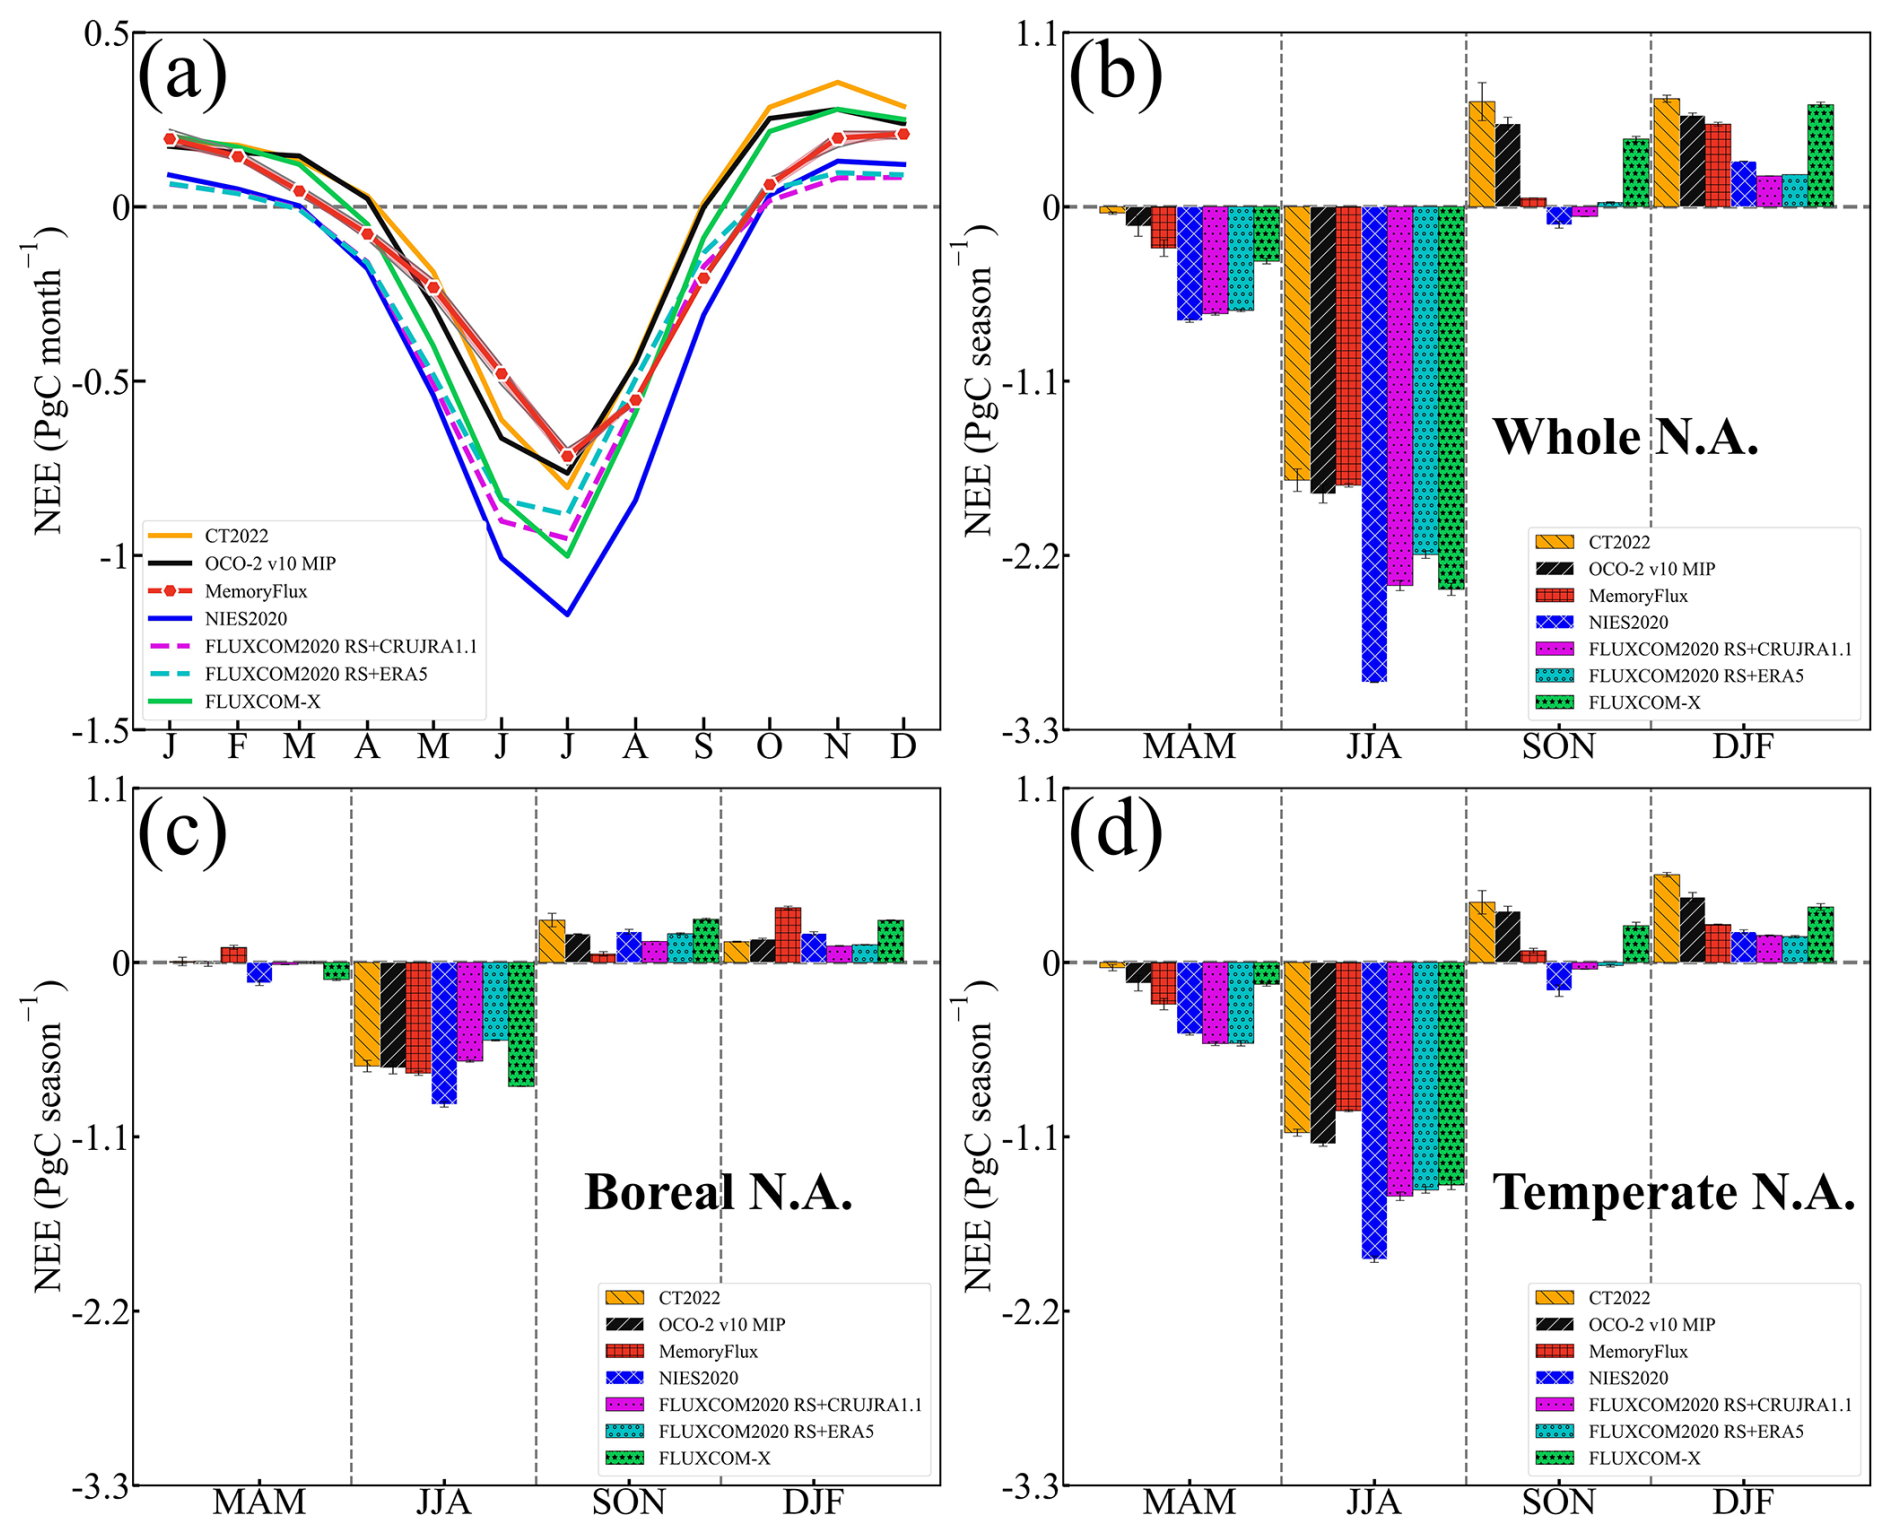
Figure 4Comparison of the seasonal patterns of MemoryFlux estimated by LSTM models against other products. (a) NEE mean seasonal cycle variations (Pg C per month) in 2015–2017 derived from MemoryFlux (the shaded area which boundary is standard deviation, the grey line represents the NEE seasonal cycle), NIES2020, OCO-2 v10 MIP, CT2022, FLUXCOM2020 RS+CRUJRA1.1, FLUXCOM2020 RS+ERA5, and FLUXCOM-X. (b–d) Statistics of NEE over the season scale in whole, boreal, and temperate North America. Error bars indicate the standard deviation across years, representing interannual variability. Note that EC-MOD2012 was excluded from this comparison due to the data unavailability.
When we compared these NEE products across the four seasons, we observed consistent patterns but notable differences in magnitude (Fig. 4b and Table S4). In MAM (March–May) and JJA (June–August), most global upscaling products indicated stronger net carbon uptake than both the atmospheric CO2 inversions and MemoryFlux. Even the recently updated FLUXCOM-X showed relatively strong JJA carbon uptake, second only to NIES2020. In contrast, MemoryFlux was closer in magnitude to the top-down inversions during MAM and JJA; for example, its JJA uptake was more similar to OCO-2 v10 MIP and CT2022 than to the estimates of any other upscaling product. During SON (September–November), FLUXCOM2020 RS+CRUJRA1.1 and NIES2020 indicated net carbon uptake over North America, whereas the atmospheric inversions, MemoryFlux, and the other globally upscaling estimates suggested net carbon release. In DJF (December–February), the FLUXCOM2020 ensembles and NIES2020 exhibited weaker carbon release than the other products. Consequently, MemoryFlux, which explicitly incorporated historical predictor information, showed greater consistency with atmospheric inversions than the other upscaling estimates.
We further compared seasonal NEE patterns between the boreal and temperate regions of North America based on the Transcom regional partitioning (Fig. 4c and d). Overall, the boreal region showed better agreement among products, whereas the larger discrepancies in carbon uptake between the global upscaling products and both MemoryFlux and the atmospheric inversions were mainly concentrated in the temperate region. During SON, the net carbon uptake reported by NIES2020 and FLUXCOM2020 RS+CRUJRA1.1 was mainly associated with the temperate region, while the boreal region remained a net carbon release. FLUXCOM-X exhibited net carbon uptake in MAM in both regions, whereas CT2022 and MemoryFlux showed this pattern only in the temperate region. Additionally, MemoryFlux estimated stronger carbon release in the boreal region during MAM and DJF, but weaker carbon release during SON, compared with the other products.
3.3 Annual total and interannual variations of NEE in North America
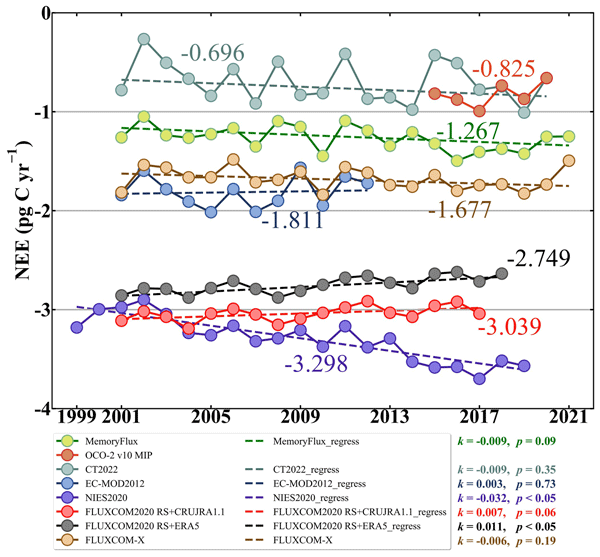
We first investigated annual total NEE and its IAVs across the eight datasets (Fig. 5 and Table S5). MemoryFlux estimated annual NEE ranging from −1.50 to −1.05 Pg C yr−1 over 2001–2021, with a mean of −1.27 Pg C yr−1 and an interannual standard deviation of 0.12 Pg C yr−1. The atmospheric inversions yielded weaker mean carbon uptake (CT2022: −0.70 ± 0.20 Pg C yr−1; OCO-2 v10 MIP: −0.83 ± 0.11 Pg C yr−1), whereas the bottom-up upscaling products estimated stronger uptake (Table S5). We further compared annual NEE over common periods. For 2015–2020, mean annual NEE was −1.38 Pg C yr−1 for MemoryFlux, −0.83 Pg C yr−1 for OCO-2 v10 MIP, −0.69 Pg C yr−1 for CT2022, and −1.75 Pg C yr−1 for FLUXCOM-X. For 2001–2012, the corresponding estimates were −1.21 Pg C yr−1 for MemoryFlux, −0.66 Pg C yr−1 for CT2022, −1.81 Pg C yr−1 for EC-MOD2012, −3.19 Pg C yr−1 for NIES2020, −3.05 and −2.78 Pg C yr−1 for the two FLUXCOM2020 ensemble products, and −1.65 Pg C yr−1 for FLUXCOM-X. These common-period comparisons showed that MemoryFlux was closer in magnitude to the atmospheric inversions than several regional and global EC-based flux-upscaling products, including EC-MOD2012, NIES2020, the FLUXCOM2020 ensemble products, and FLUXCOM-X. Among all datasets, NIES2020 estimated the strongest carbon sink at −3.30 ± 0.22 Pg C yr−1.
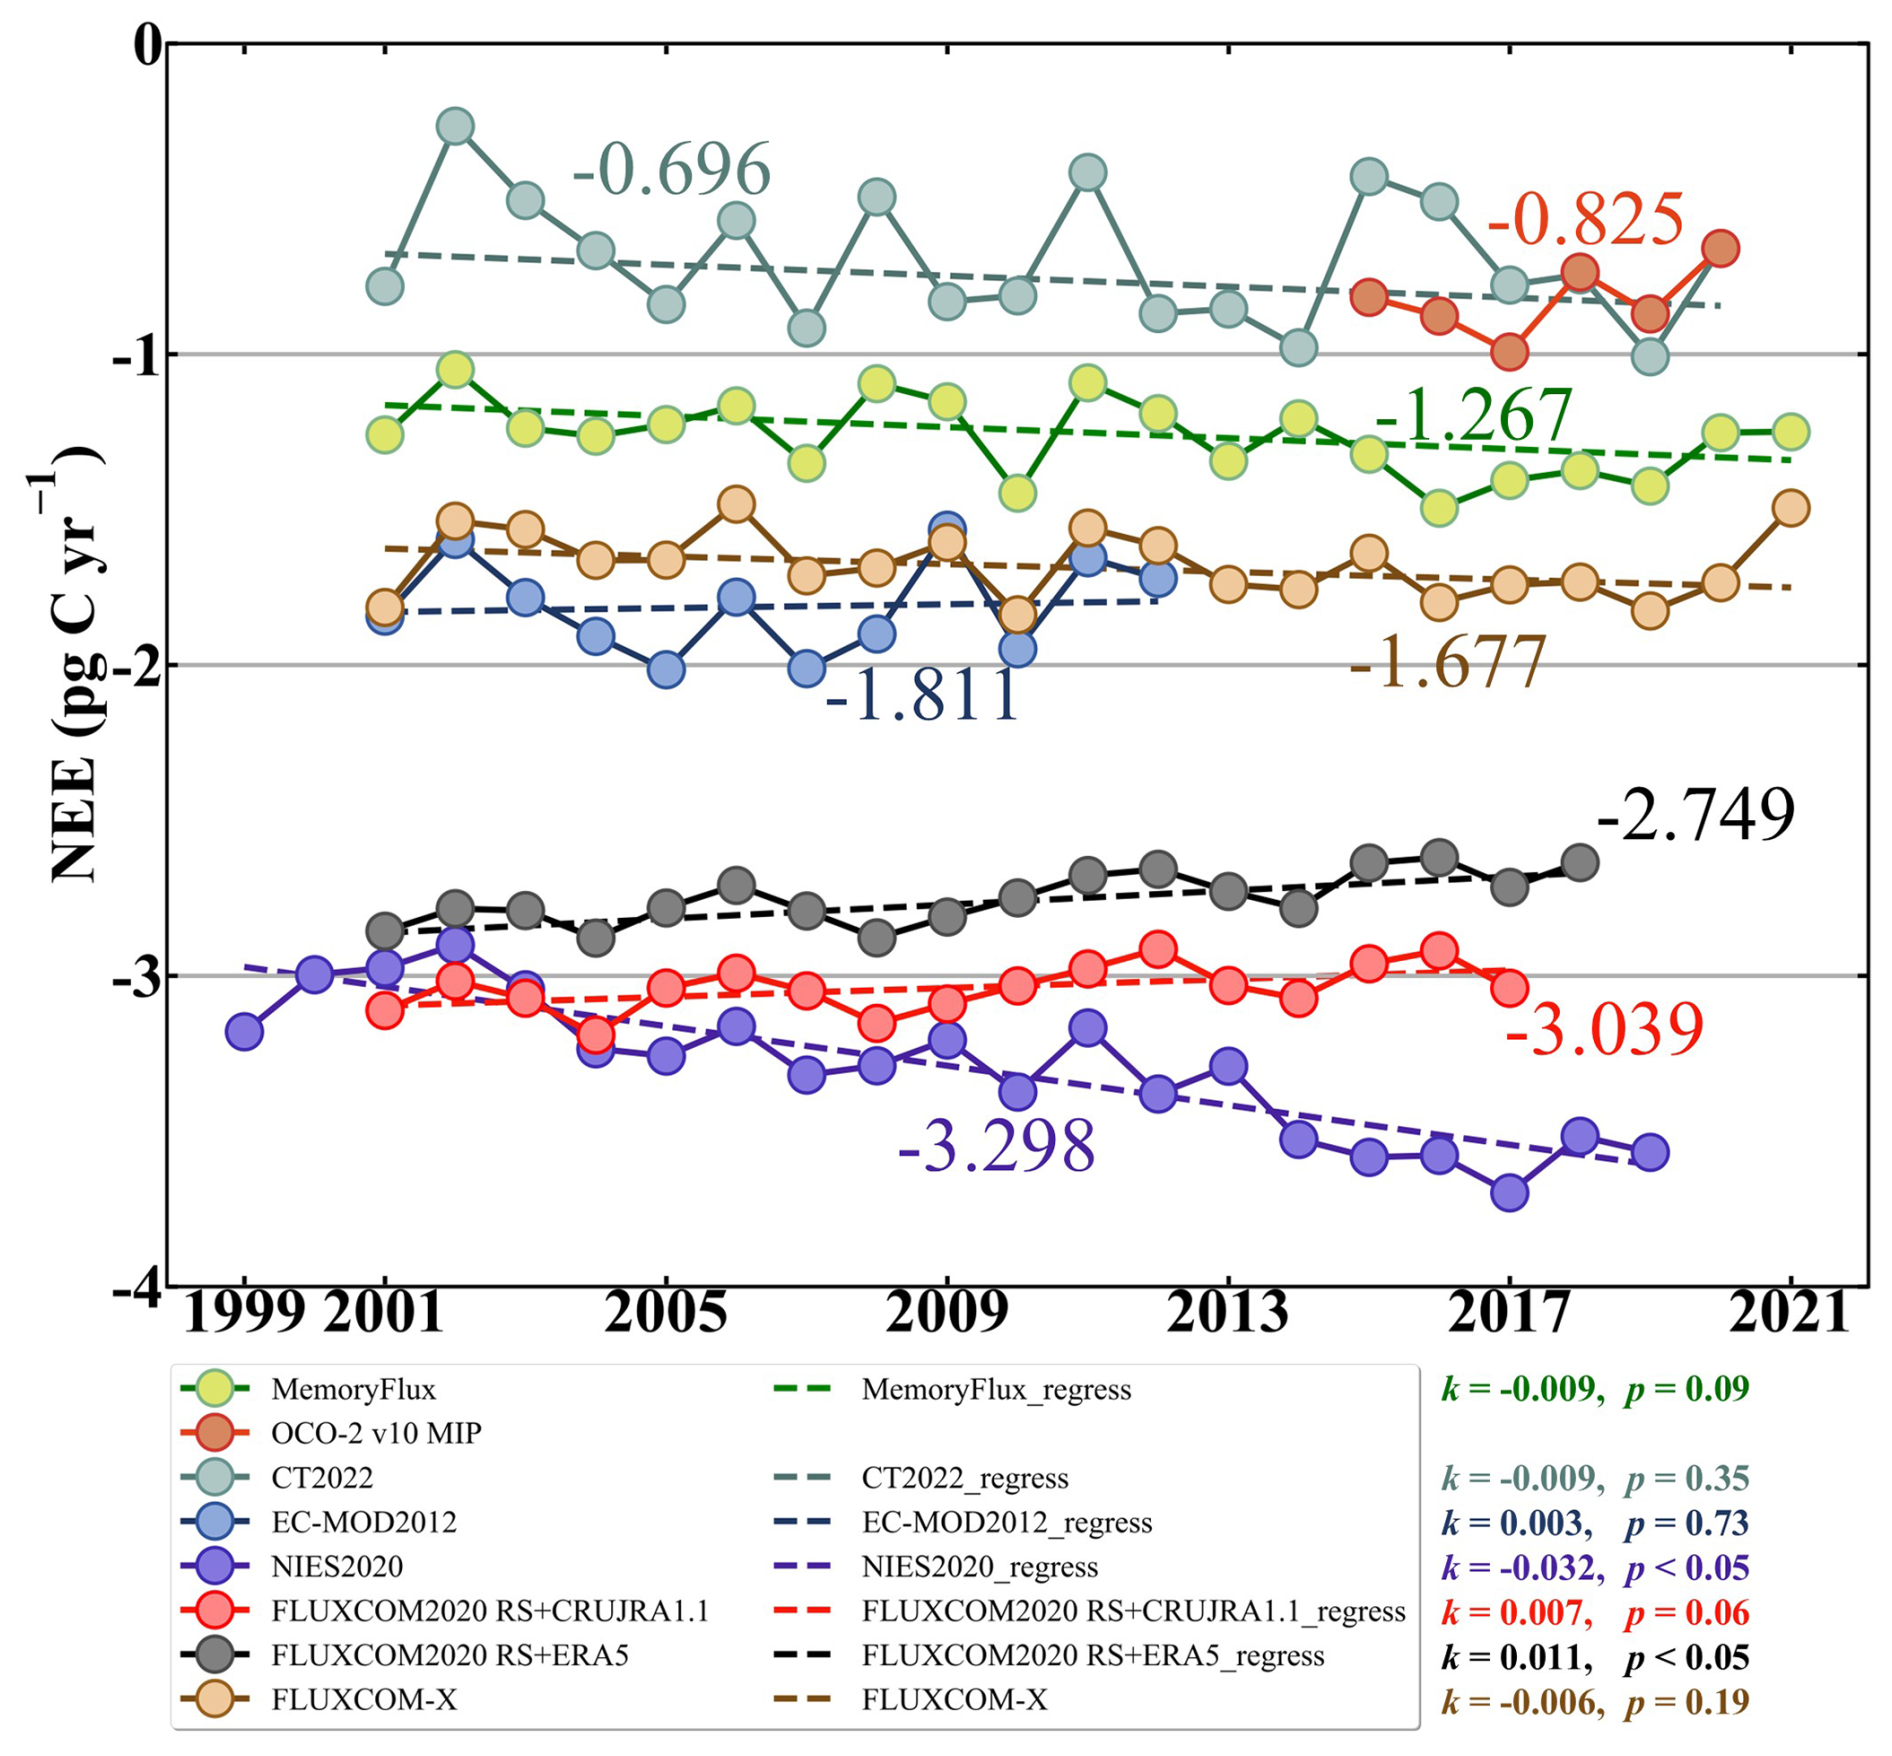
Figure 5Annual total and interannual variations of North American NEE estimated by OCO-2 v10 MIP, CT2022, MemoryFlux, EC-MOD2012, NIES2020, FLUXCOM2020 RS+CRUJRA, FLUXCOM2020 RS+ERA5, and FLUXCOM-X. Dashed lines represent the long-term trend calculated using the Mann–Kendall test and Theil–Sen slope method. Due to the limited data, we did not estimate a slope for OCO-2 v10 MIP.
To further evaluate model performance, we calculated the correlation coefficients (r) for interannual variations in NEE between MemoryFlux and the other products. MemoryFlux showed positive correlations with OCO-2 v10 MIP (r=0.70, p=0.12), CT2022 (r=0.41, p=0.07), EC-MOD2012 (r=0.68, p<0.05), and FLUXCOM-X (r=0.69, p<0.05), whereas weaker correlations were found with the other datasets. Although the correlations with OCO-2 v10 MIP and CT2022 were not statistically significant, the overall comparison indicated that MemoryFlux, estimated using the LSTM DL approach, captured both the magnitude and IAVs of NEE reasonably well. Long-term NEE trends were assessed using the Mann–Kendall test and Theil–Sen slope method. Due to limited data, no slope was estimated for OCO-2 v10 MIP. MemoryFlux, CT2022, NIES2020, and FLUXCOM-X showed tendencies toward increasing carbon uptake (MemoryFlux: Pg C yr−2, p=0.09; CT2022: Pg C yr−2, p=0.35; NIES2020: Pg C yr−2, p<0.05; FLUXCOM-X: Pg C yr−2, p=0.19), whereas EC-MOD2012 and the FLUXCOM 2020 ensembles indicated a slight decrease, although most trends were not statistically significant. Regional analysis further found that the temperate region accounted for much of the inter-product divergence in annual carbon sink magnitude (Fig. S5). Compared with the atmospheric inversions and MemoryFlux, the upscaling products tended to indicate stronger carbon uptake in the temperate region, whereas the boreal region showed relatively good agreement across datasets.
To evaluate whether explicitly incorporating historical climate and environmental information improved the representation of NEE IAVs, we generated two LSTM-based NEE datasets, MemoryFlux and nonMemoryFlux. The two configurations were identical with respect to predictors, model architecture, data partitioning, and nested cross-validation, differing only in their temporal input structure. MemoryFlux updated its internal state using information from previous time steps, thereby modelling temporal dependencies and potential memory effects between antecedent environmental conditions and current NEE. In contrast, nonMemoryFlux was driven only by synchronous explanatory variables. Both configurations may retain some implicit legacy information through contemporaneous vegetation-state predictors (e.g., NDVI and LAI), whereas MemoryFlux additionally incorporated historical predictor sequences explicitly through its temporal look-back structure. Therefore, the comparison of the two datasets provided a controlled assessment of the added value of explicitly incorporating historical predictor information. We found that nonMemoryFlux reproduced the IAVs of NEE reasonably well (r=0.82, p<0.001), but clear differences from MemoryFlux remained (Fig. 6). In particular, nonMemoryFlux tended to exhibit a stronger increasing trend (−0.013 Pg C yr−2) and estimated stronger carbon uptake in recent years (since 2014), when the 2015/16 El Nino events and frequent droughts and heatwaves hit North America, suggesting that it failed to capture the legacy effects of climate extremes on terrestrial ecosystems. The maximum difference reached 186 Tg C yr−1 in 2014 (14.6 % of the mean carbon uptake), and the mean absolute difference was 64 Tg C yr−1 (5.0 %), highlighting the importance of accounting for memory effects in carbon flux upscaling.
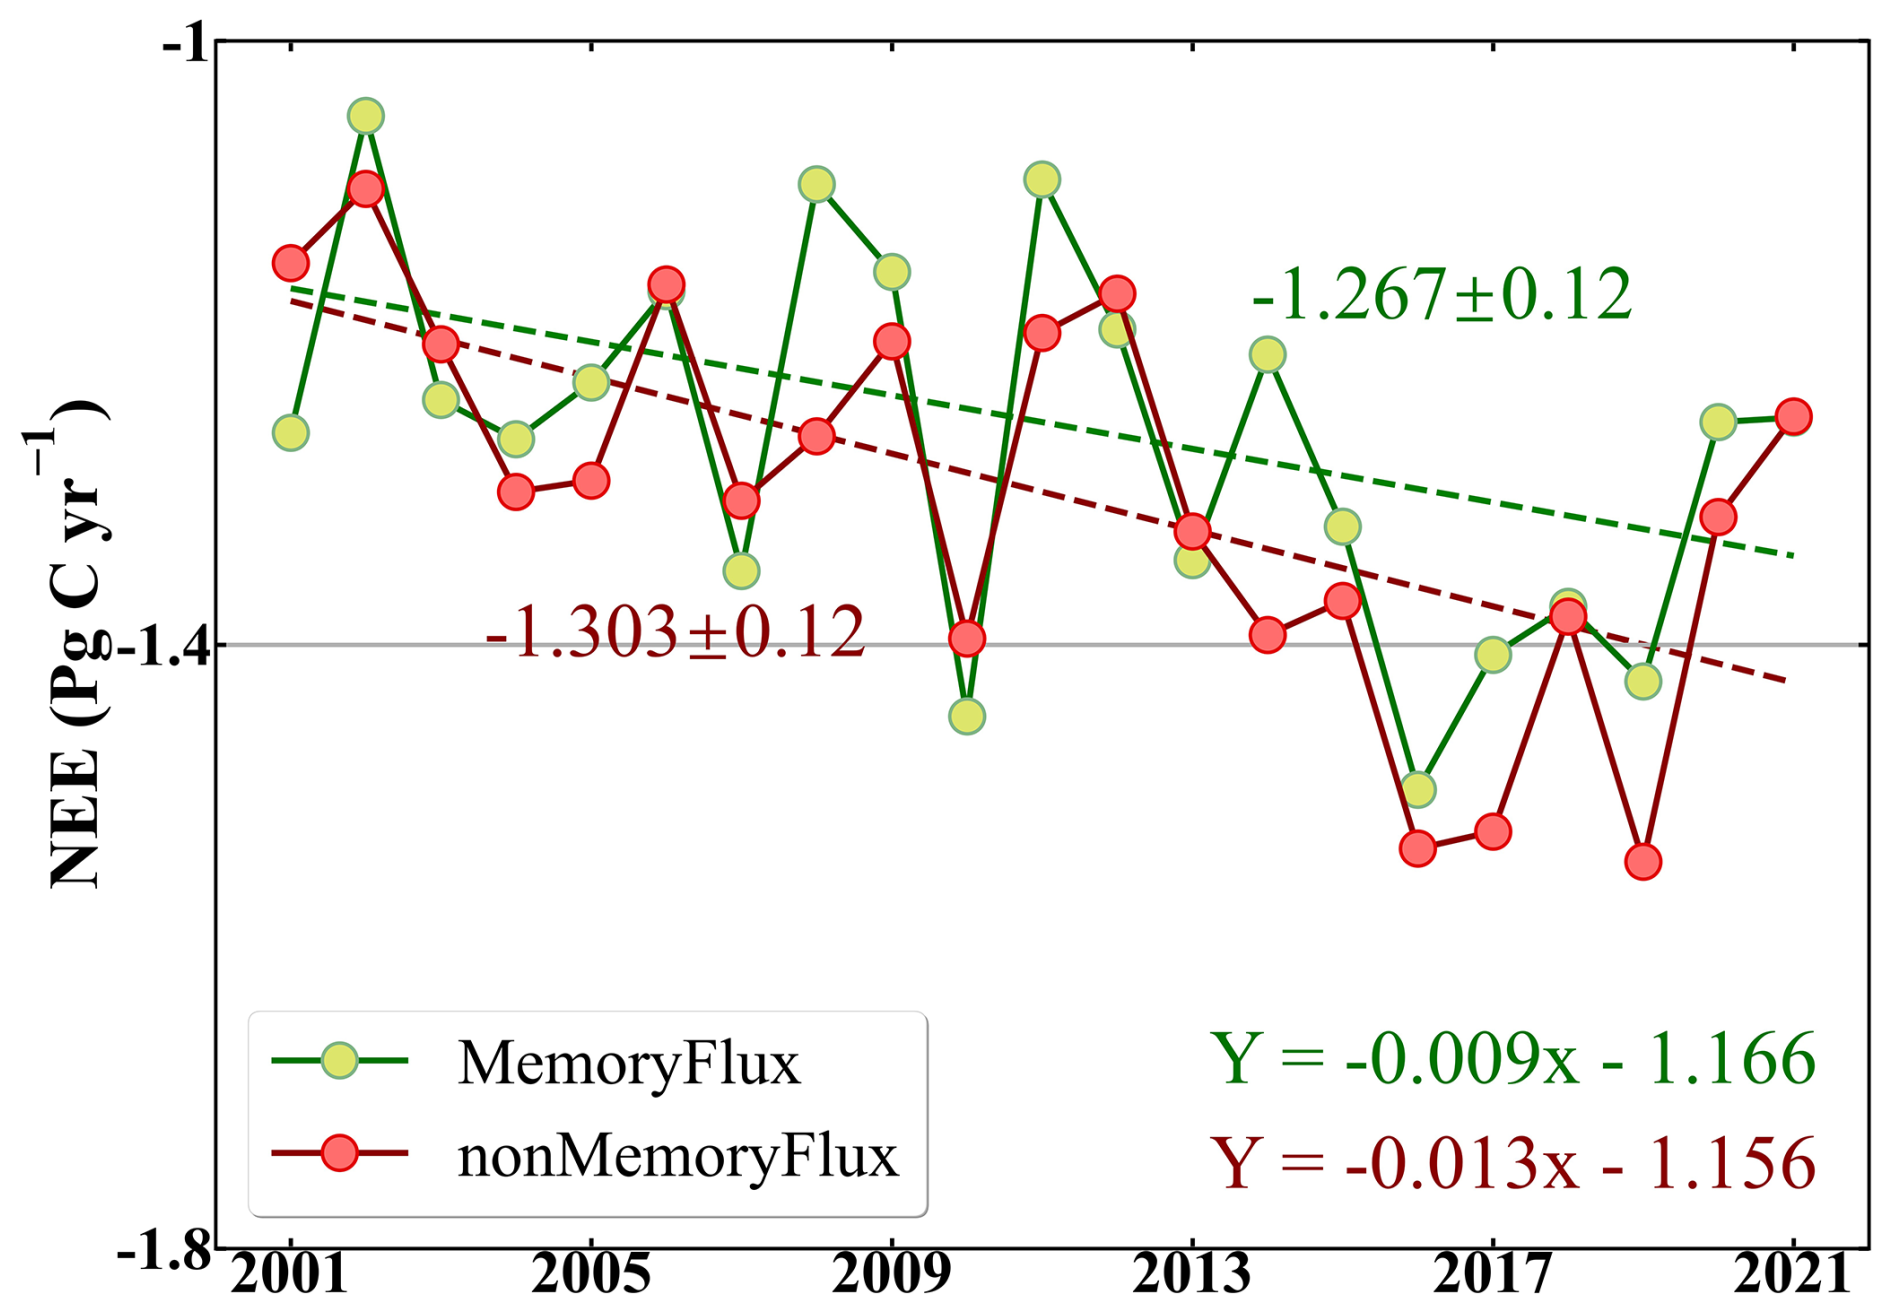
Figure 6Comparison of interannual variations in North American NEE estimated by MemoryFlux and nonMemoryFlux. MemoryFlux explicitly incorporates historical predictor information through a temporal look-back structure, whereas nonMemoryFlux uses only contemporaneous predictors. The dashed lines represent long-term trends calculated using the Mann–Kendall test and Theil–Sen slope method.
We further compared, at the PFT level, the predictive performance of the LSTM models used to generate MemoryFlux and nonMemoryFlux (Fig. S6). Overall, R2 increased from 0.63 for nonMemoryFlux to 0.79 for MemoryFlux, while RMSE decreased from 1.12 to 0.83 and MAE decreased from 0.69 to 0.52 . Improvements were observed across all PFTs, with particularly pronounced gains for ENF, for which R2 increased by 0.39 (Tables S6 and S7). We also evaluated whether the temporal input structure improved the representation of seasonal and interannual variations in carbon fluxes at the site scale by comparing NEE estimates from MemoryFlux and nonMemoryFlux with long-term flux-tower observations across PFTs (Fig. S7). Clear differences were evident in their representation of temporal variability. MemoryFlux generally reproduced the observed seasonal cycle and IAVs more closely than nonMemoryFlux, particularly at lower NEE values, whereas nonMemoryFlux showed weaker IAVs. Together, these results suggested that explicitly incorporating historical predictor information improved both overall predictive performance and the representation of temporal variations in NEE.
3.4 Capturing climate extremes impacts on regional NEE
We further evaluated the ability of the LSTM-based model to represent NEE IAVs at the grid scale by examining its representation of spatial NEE anomalies associated with selected climate extremes. Given that the largest impacts typically occurred from June to August (summer, JJA), we focused our analysis on regional carbon flux anomalies during summer. Regional NEE anomalies were calculated as the difference between mean summer NEE during the event year and the corresponding multi-year mean summer NEE for each dataset. Soil moisture (SM) anomalies were used to characterize the severity and spatial extent of drought and flood conditions. The Global Land Evaporation Amsterdam Model (GLEAM) v3.7a dataset at 0.25° resolution was employed for this study (Martens et al., 2017). Furthermore, regional anomalies in SIF from the GOSIF dataset were utilized to provide information on concurrent changes in vegetation activity. The SIF and SM datasets were used as supporting ecological and hydroclimatic indicators and were not intended as direct proxies or independent observations of NEE. In the analysis, we chose six events, including the 2011 drought in Mexico and the southern U.S. (Dobler-Morales and Bocco, 2021; Weiss et al., 2012), the 2012 North American drought (Boyer et al., 2013), the 2013 California drought (Swain et al., 2014), the 2017 flash drought across the northern U.S. and Canadian Prairie (Hoell et al., 2020), the 2019 Midwest American floods (Yin et al., 2020), and the southwestern North American drought and associated wildfires during 2020–2021 (Mankin et al., 2021). Across these climate extremes, drought and flood conditions caused negative and positive SM anomalies, respectively, and negative SIF anomalies, leading to anomalous CO2 release from land to the atmosphere, as reflected by positive NEE anomalies.
Figure 7 showed the areas affected by selected climate extremes across North America during JJA 2011–2013, JJA 2017, JJA 2019, and JJA 2021, based on multiple datasets. Black rectangles indicated the regions most strongly affected by the selected extreme climate events. For the 2020–2021 drought in southwestern North America, the NEE anomaly was evaluated for JJA 2021 relative to the corresponding climatological baseline, as this period represents a more mature and severe phase of the event. In arid regions, MemoryFlux exhibited positive NEE anomalies during JJA that spatially coincided with negative SM and SIF anomalies indicated by the environmental proxy datasets. During the 2019 Midwest American floods, SM showed positive anomalies (highlighted by the red rectangle and the reversed colour bar), which spatially coincided with negative SIF and positive NEE anomalies. The spatial extent of the NEE anomalies represented by MemoryFlux was also broadly consistent with the reported extent of the 2019 flood, with widespread flooding across the Midwest and more limited impacts farther south (Fig. S8). The spatial correspondence among MemoryFlux NEE anomalies, environmental proxy anomalies, and the documented extent of the selected extreme events suggested that MemoryFlux provided a coherent representation of regional NEE anomaly patterns associated with these events. We further examined the added value of explicitly incorporating historical predictor information by comparing MemoryFlux with nonMemoryFlux. The nonMemoryFlux model showed weaker spatial correspondence with the anomaly patterns associated with several extreme events, including the 2011–2012 droughts and the 2019 flood, whereas MemoryFlux represented these regional anomaly patterns more clearly (Fig. 7). These results suggested that explicitly incorporating historical predictor information can improve the representation of NEE anomalies associated with climate extremes.
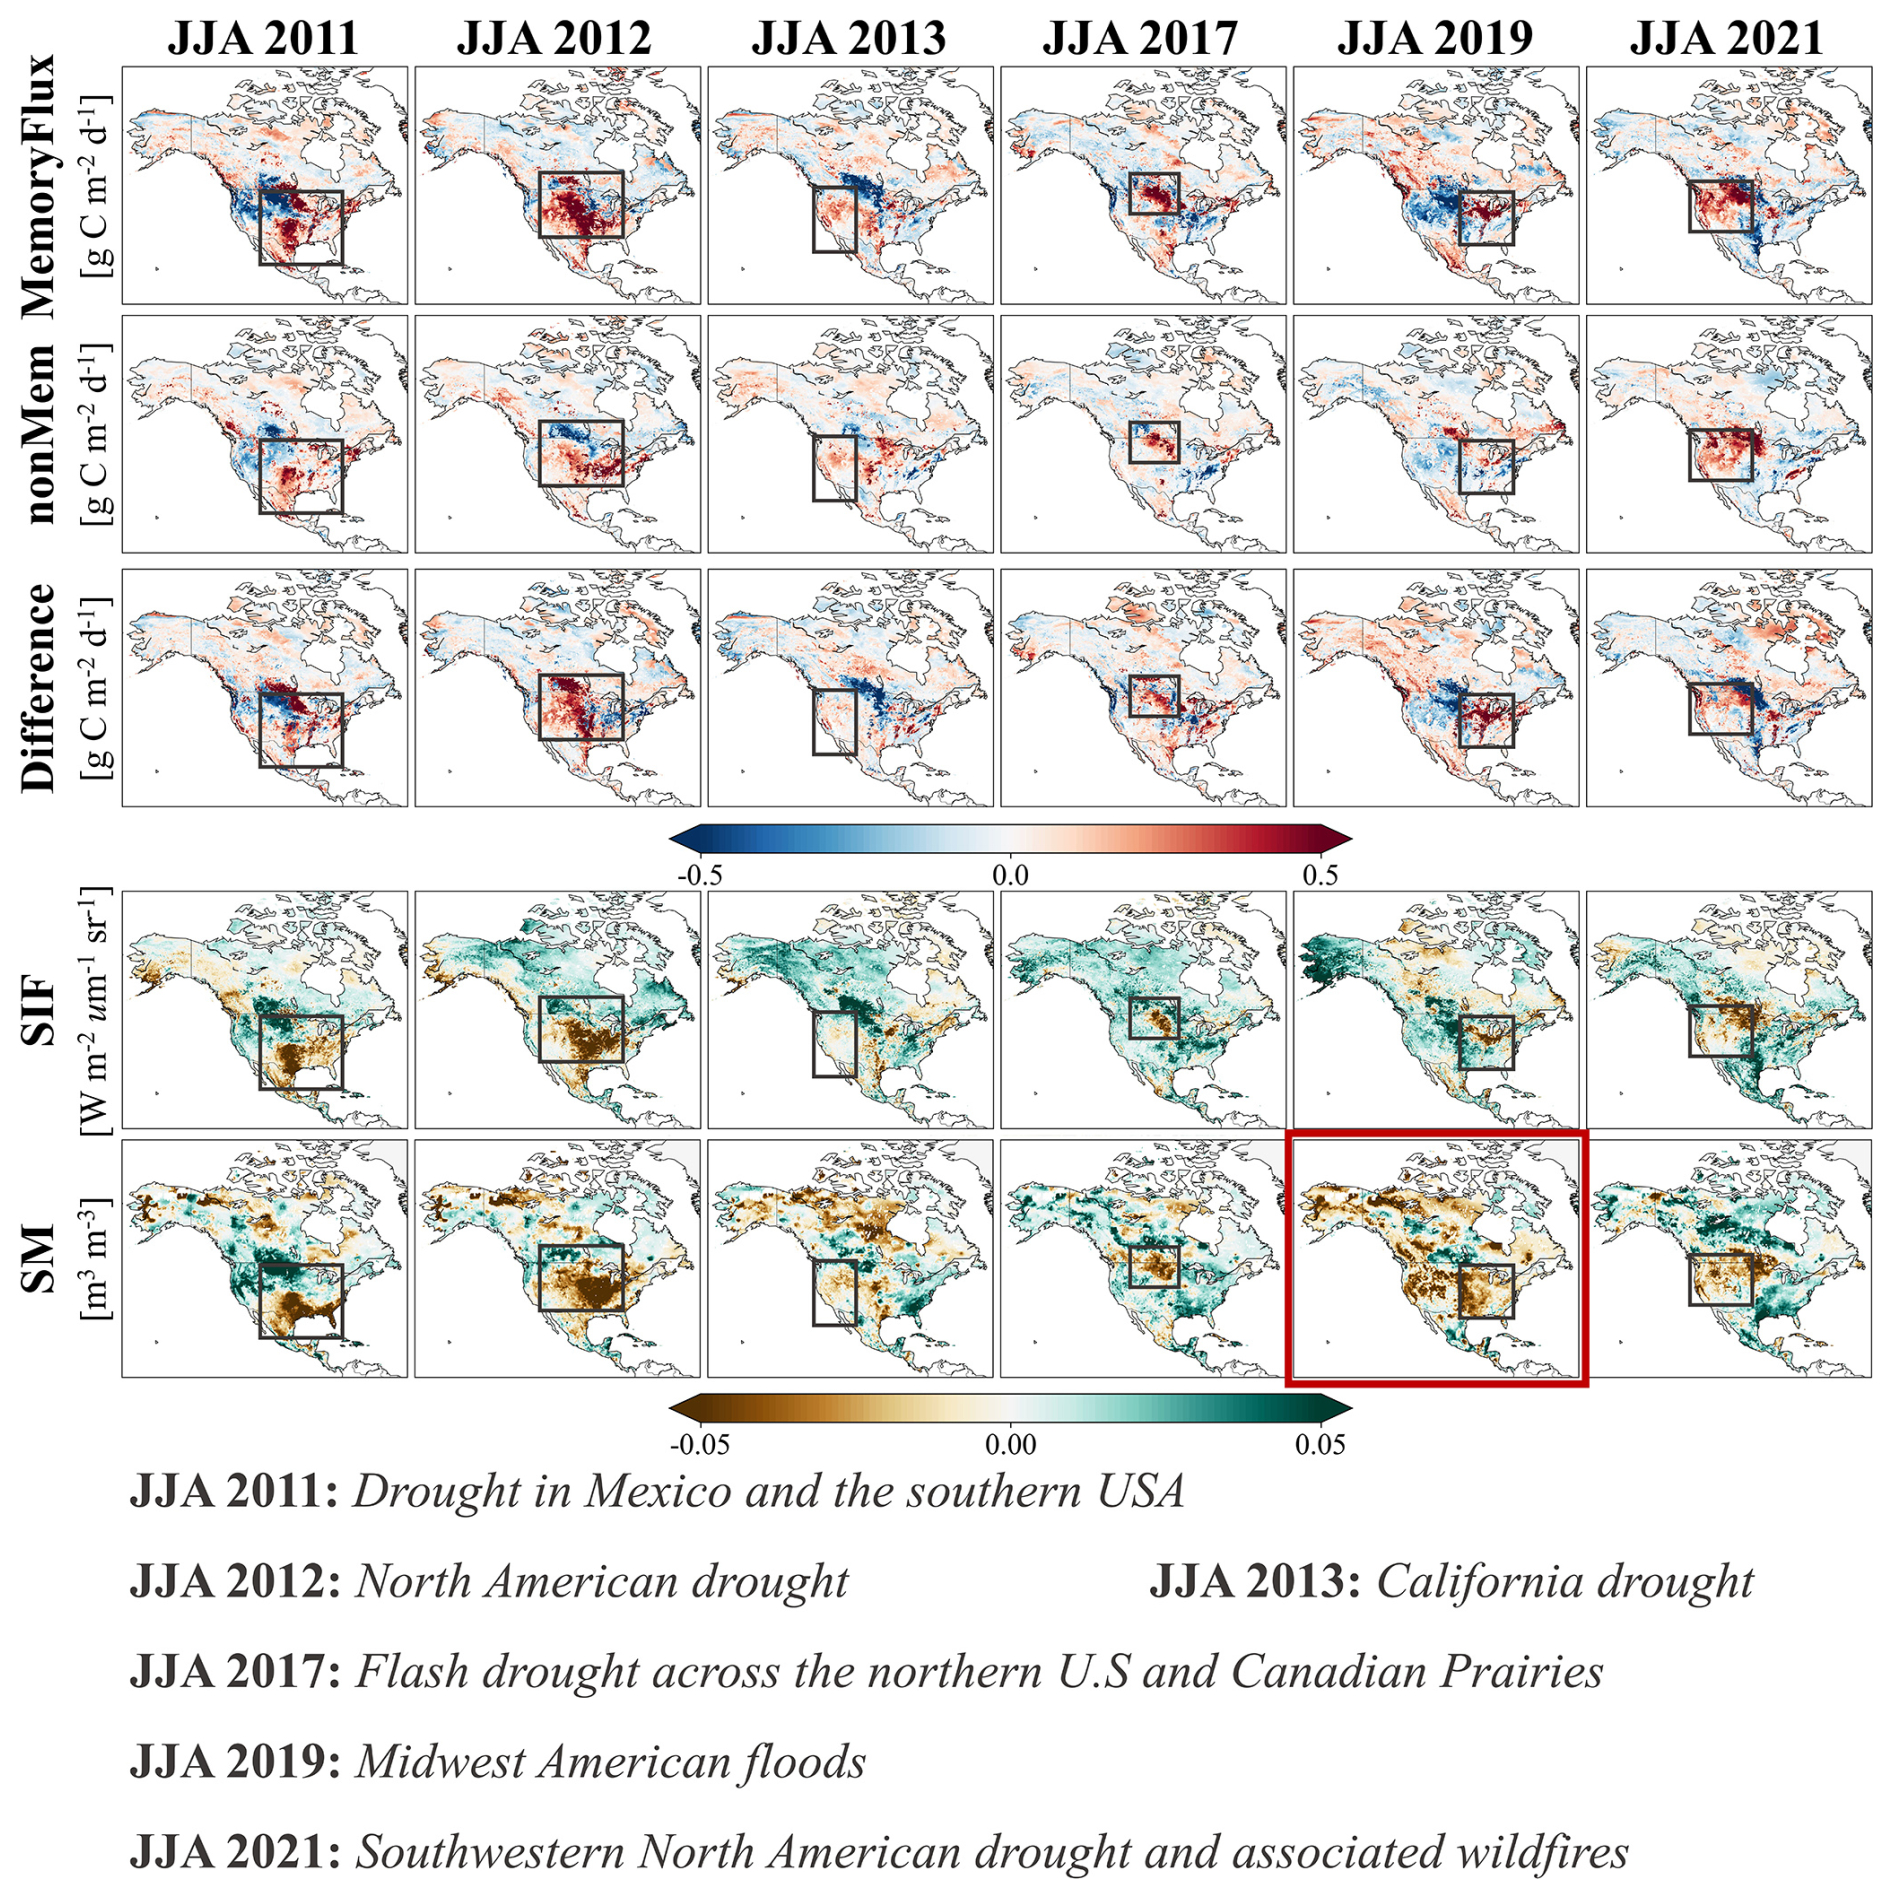
Figure 7Spatial anomalies of NEE derived from MemoryFlux and nonMemoryFlux, together with environmental proxy anomalies from GOSIF and GLEAM, during JJA for selected major drought and flood events in North America over the study period. The third row shows the difference between the MemoryFlux and nonMemoryFlux NEE anomalies. Black rectangles indicate the regions most strongly affected by the selected extreme climate events.
To further assess how MemoryFlux represents NEE anomalies associated with climate extremes, we compared its spatial anomaly patterns with those from several contemporary NEE products (Fig. 8). It can be observed that, in general, the regional flux upscaling estimates from EC-MOD2012 captured the climate extremes–induced regional flux anomalies well, yet they indicated a much larger spatial extent of drought impacts. Among the global flux upscaling estimates, NIES2020 and FLUXCOM-X exhibited anomaly patterns broadly similar to those of MemoryFlux, whereas the two FLUXCOM2020 datasets generally showed weaker anomaly magnitudes. MemoryFlux also showed broad spatial consistency with the OCO-2 v10 MIP in indicating the climate extreme events in 2017 and 2019. Furthermore, MemoryFlux generally agreed with the CT2022 inversion for several of the selected events but with spatial differences, possibly due to the limited capacity of in situ based atmospheric CO2 inversions to capture flux anomalies at finer spatial scales. To improve comparability, we recalculated the anomalies using a common 2011–2017 reference period for products with overlapping temporal coverage, including MemoryFlux, FLUXCOM-X, CT2022, NIES2020, and the FLUXCOM2020 ensemble products (Fig. S9). The recalculated results showed that the spatial extent and overall patterns of the regional NEE anomalies remained broadly similar to those obtained using the original product-specific reference periods, although the anomaly magnitudes changed slightly. Overall, among the NEE datasets considered, MemoryFlux provided a coherent representation of regional carbon flux anomaly patterns across the selected extreme events, including relatively moderate events such as the 2013 California drought (Fig. 8).
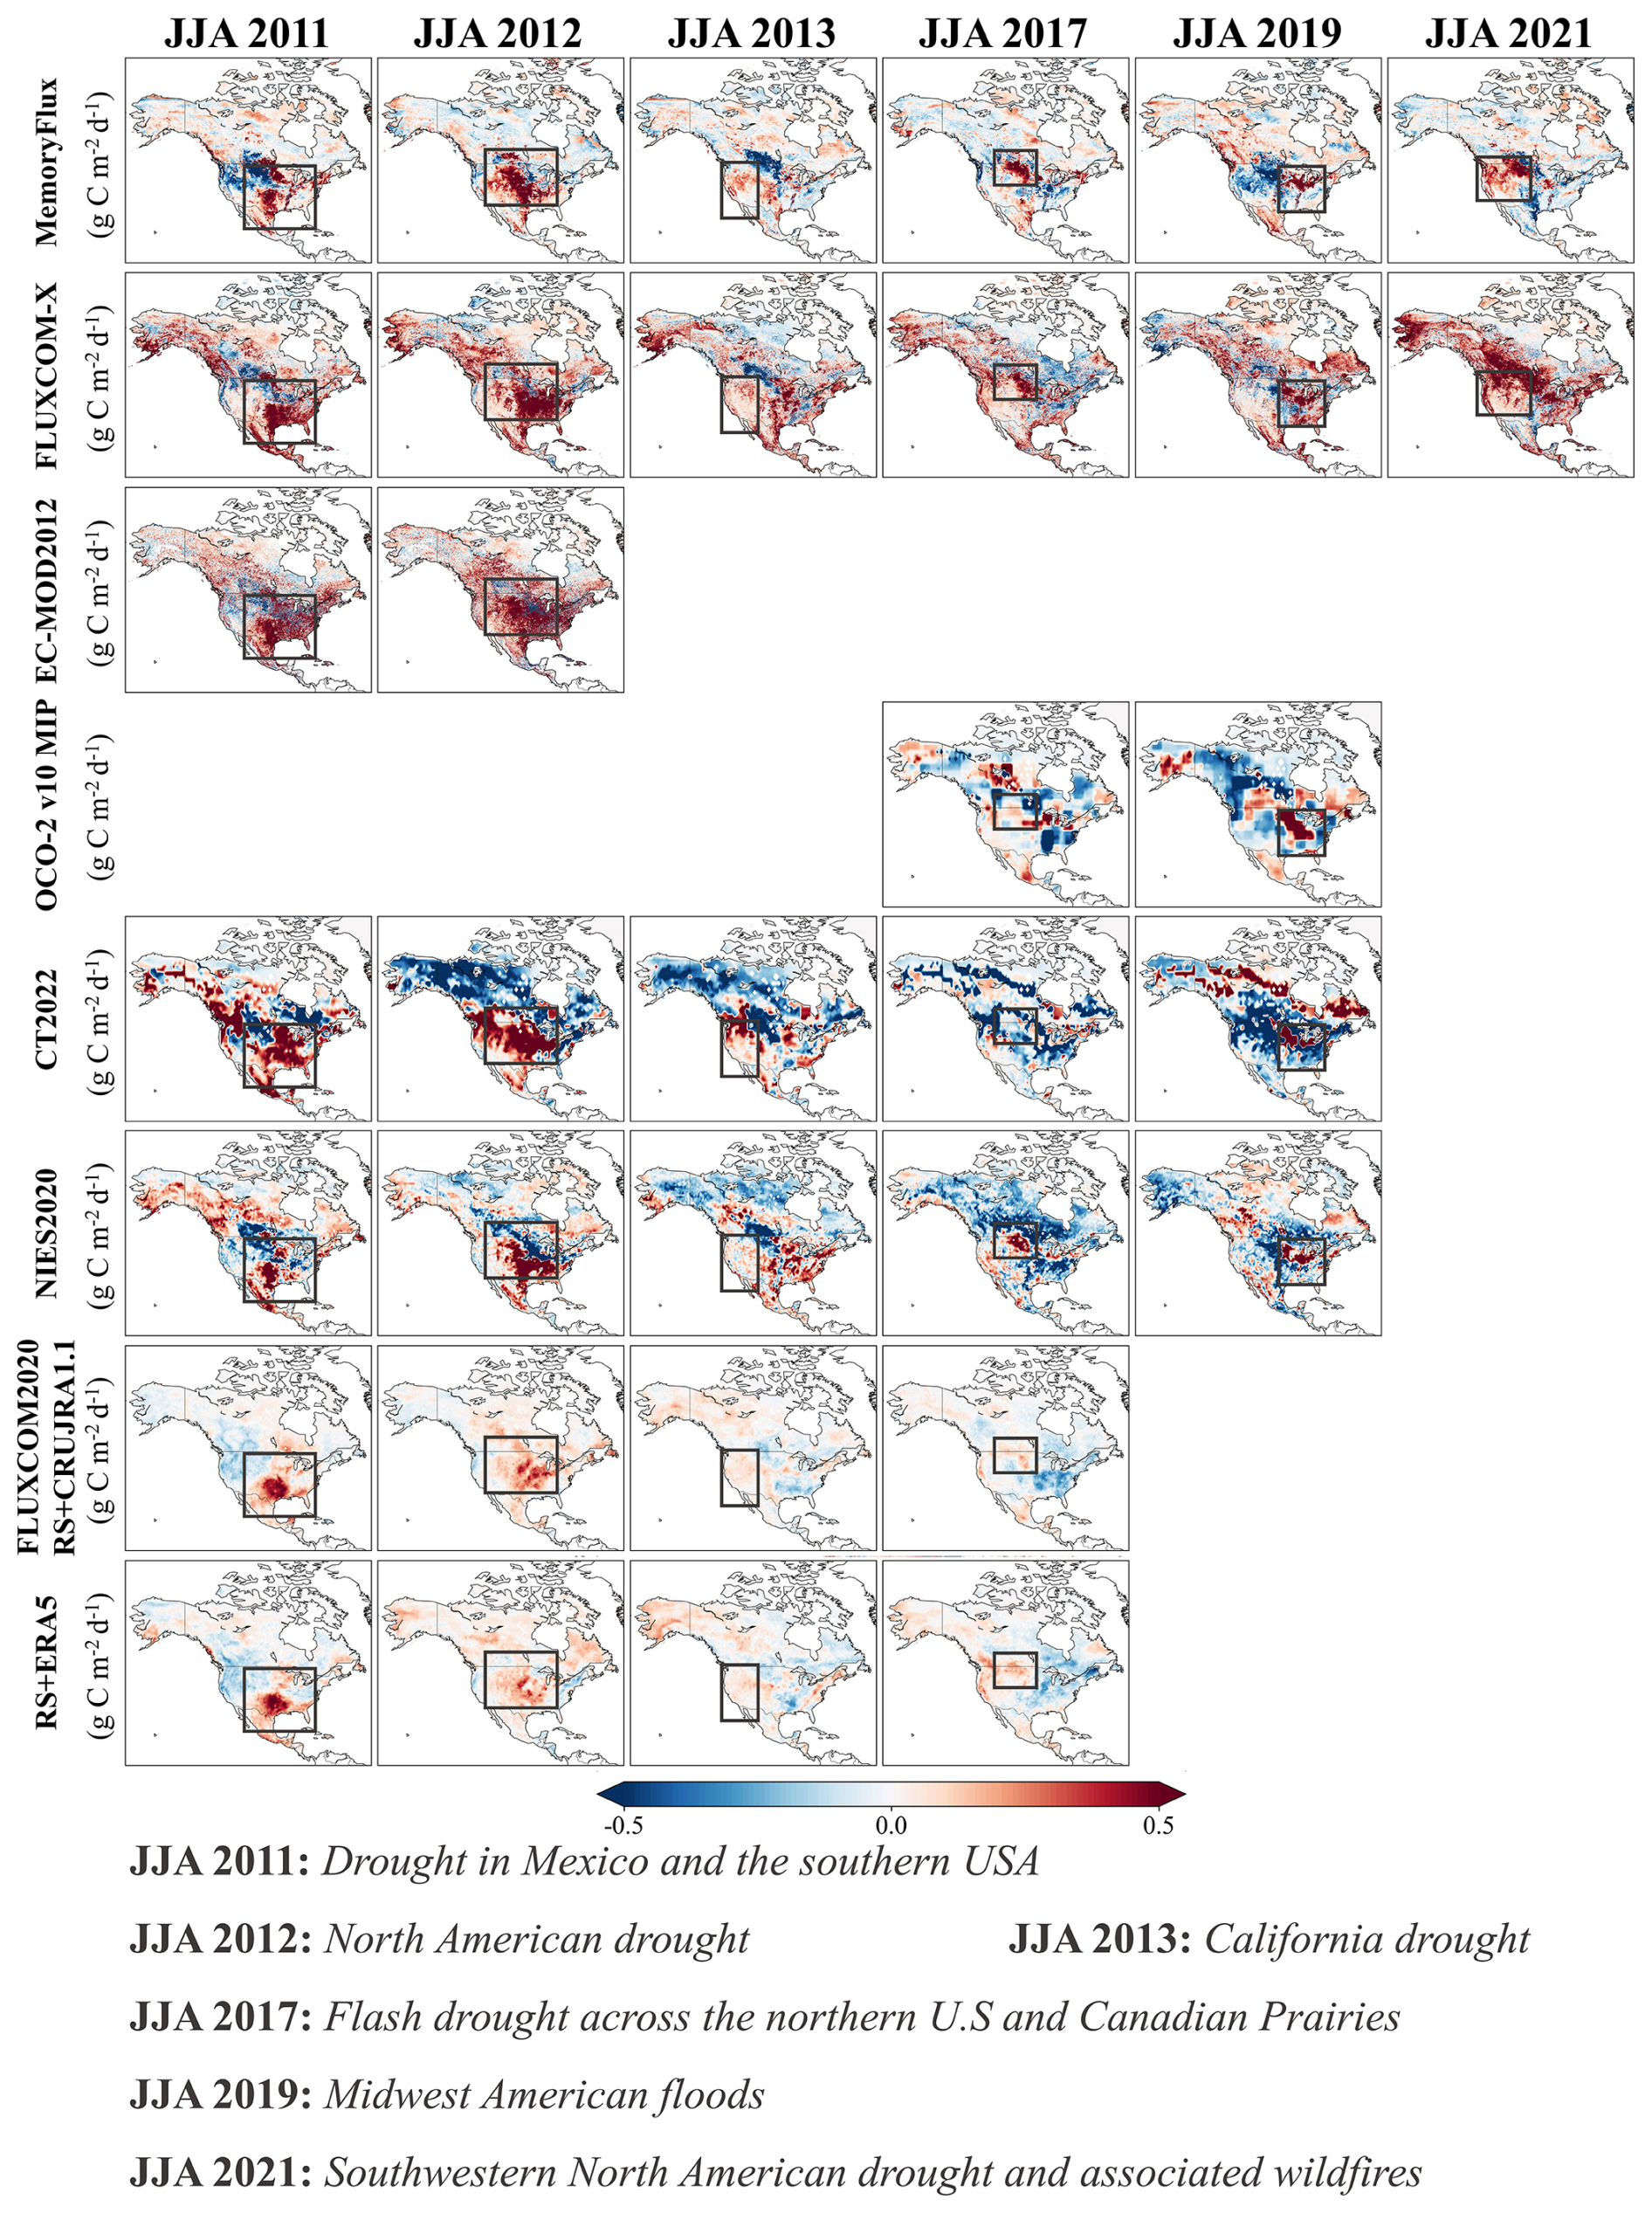
Figure 8Spatial anomalies of JJA NEE associated with selected major drought and flood events in North America during the study period, as represented by MemoryFlux, EC-MOD2012, OCO-2 v10 MIP, CT2022, NIES2020, FLUXCOM2020 RS+CRUJRA1.1, FLUXCOM2020 RS+ERA5, and FLUXCOM-X. Black rectangles indicate the regions most strongly affected by the selected extreme climate events.
4.1 North American terrestrial carbon budget: spatial distribution, magnitude, and IAV
Our estimate reasonably identified the spatial features of NEE on an annual basis and during the peak growing season. Annually, the most spatially extensive carbon sinks were located in the southeastern U.S. and characterized by mild temperatures and ample precipitation, agreeing with previous reports (Guanter et al., 2014; Huntzinger et al., 2012). Additionally, large annual carbon sinks were observed along the North Pacific coast and in tropical regions of North America, where evergreen forests prevailed (Anthoni et al., 2002). During the peak growing season, the net carbon uptake of croplands was highest in the central and western regions, leading to a large regional carbon uptake in the Midwest Corn Belt (Schuh et al., 2013). Previous studies have demonstrated the peak global photosynthesis in this region (Guanter et al., 2014; Hilton et al., 2017; Mueller et al., 2016). However, the seasonal carbon uptake was transitory. As the peak growing season advanced, both the spatial extent and magnitude of the strong carbon uptake decreased, because most of the absorbed carbon ended up in crop products that were consumed by humans and livestock or converted into bioethanol. The detection of this seasonal carbon uptake further validated the ability of MemoryFlux to diagnose spatial patterns of NEE. The large carbon sources on an annual basis were observed in the tundra regions of northern and central Canada (Virkkala et al., 2021), as well as in the arid regions of the central U.S. Warming in these regions could lead to the release of soil carbon, thereby accelerating climate change (Natali et al., 2019; Schuur et al., 2021). Many areas in the western U.S. were almost carbon neutral owing to limited vegetation distribution and precipitation (Xiao et al., 2014). Furthermore, according to the carbon sink statistics over boreal and temperate North America, all products indicated that Forests/Wooded biomes constituted the largest ecosystem carbon sink. These biomes were characterized by relatively low disturbance and high productivity (Yadav et al., 2022). Several studies supported forests as the main carbon sink across North America (Kurz et al., 2013; Stinson et al., 2011).
The mean annual NEE estimated by MemoryFlux was −1.27 ± 0.12 Pg C yr−1, which was closer in magnitude to top-down atmospheric inversions than to the bottom-up upscaling estimates considered in this study. Several previous studies provide context for our estimates. King et al. (2015) revealed a mean annual net land-atmosphere exchange for North America of −0.89 ± 0.40 Pg C yr−1 based on 11 inverse models during 2000–2009. Foster et al. (2024) reported a mean ±1 standard deviation annual NEE for North America of −0.81 ± 0.48 Pg C yr−1 across 8 inverse models from 2007 to 2010. The Second State of the Carbon Cycle Report (SOCCR2) reported estimates of −0.61 Pg C yr−1 with an uncertainty of ±75 % using a bottom-up approach and of −0.70 Pg C yr−1 with an uncertainty of ±12 % using a top-down method over the period 2004–2013 (Hayes et al., 2018). Our slightly higher NEE estimates compared to those from previous top-down inversions may partly reflect differences in system boundaries and flux components represented by EC-based upscaling and atmospheric inversions. For example, fluxes associated with harvested products, fires, inland waters, and other lateral or disturbance-related carbon transfers may not be fully represented by tower-based ecosystem NEE but can influence atmospheric inversion estimates (Ballantyne et al., 2021). Over the past two decades, MemoryFlux showed a non-significant tendency toward increasing carbon uptake in North America, similar in direction to CT2022, NIES2020, and FLUXCOM-X and broadly consistent with previous studies reporting a strengthening of terrestrial carbon uptake (Keenan and Williams, 2018; Walker et al., 2021).
4.2 Capturing climate extremes-induced carbon flux anomalies over North America
The IAVs in atmospheric CO2 concentrations can primarily be ascribed to the response of terrestrial ecosystem carbon fluxes to climate anomalies (Battle et al., 2000). Therefore, in principle, it is reasonable to use top-down approaches (e.g., OCO-2 v10 MIP and CT2022) to represent carbon anomalies in these events. OCO-2 XCO2-based inversions (OCO-2 v10 MIP) have been proven to effectively capture regional carbon flux anomalies associated with climate extremes and have shown significantly better performance than in situ CO2-based inversions (Chen et al., 2024; He et al., 2023a, b). In this study, the regional NEE anomaly patterns represented by MemoryFlux showed broad consistency with those from atmospheric inversion products and were spatially coherent with concurrent anomalies in SM and SIF. This agreement suggested that MemoryFlux provided a reasonable representation of regional NEE anomaly patterns associated with the selected extreme events. However, this assessment was primarily qualitative. Because continuous regional-scale NEE observations that could serve as an independent reference were unavailable, rigorous quantitative evaluation of model performance during extreme events remains difficult. Moreover, SM and SIF were not direct observations of NEE and therefore provided supporting ecological and hydroclimatic information rather than direct validation of carbon-flux estimates. Accordingly, the present analysis should be interpreted as a diagnostic assessment of spatial consistency rather than as evidence of superior quantitative accuracy.
Here, we further discuss how the implementation of an LSTM architecture in MemoryFlux improved the model estimates of IAVs and climate extremes-induced carbon flux anomalies, i.e., what the roles of explicitly incorporating historical predictor information and employing critical predictive variables play in this issue. Our findings showed that excluding the historical climate and environmental information from the LSTM models resulted in changes to the predicted spatial and temporal variability of NEE, which showed lower consistency with top-down inversions and contemporary upscaling products. At the PFT level, MemoryFlux also achieved better predictive performance than nonMemoryFlux, with the overall R2 increasing from 0.63 to 0.79, accompanied by corresponding reductions in RMSE and MAE (Fig. S6; Tables S6 and S7). Substantial differences between MemoryFlux and nonMemoryFlux were also observed in modelling the seasonality and IAVs of NEE at the pixel scale. In particular, nonMemoryFlux showed a weaker representation of NEE IAVs (Fig. S7). However, the annual total NEE estimated by nonMemoryFlux was relatively close to that estimated by MemoryFlux. This may be because the differences between MemoryFlux and nonMemoryFlux diminished as the carbon flux was aggregated from the pixel scale to the annual total at the regional scale of North America. This scale effect reduced the differences between the two models. Therefore, the improvement in the magnitude of total NEE in North America can be primarily attributed to the inclusion of additional predictive variables, such as SIF and SWC. In contrast, the effective characterization of NEE IAVs and climate extremes-induced carbon flux anomalies resulted from explicitly incorporating historical information of vegetation and the environment.
Overall, MemoryFlux showed a more coherent representation of subcontinental NEE anomaly patterns across the selected events than nonMemoryFlux. However, it should be noted that nonMemoryFlux also roughly captured the major spatial patterns of NEE anomalies associated with climate extremes in many cases, although differences in anomaly magnitude and spatial extent were evident relative to MemoryFlux. This could be explained by the fact that the impacts of climate extremes are typically most severe during the concurrent period, while their impact gradually weakens over time (Piao et al., 2019). Therefore, a model using only contemporaneous predictors may capture the dominant concurrent response while representing potential legacy effects less clearly. In addition, nonMemoryFlux included contemporaneous vegetation variables that may themselves retain information related to antecedent environmental conditions and therefore partially encode legacy signals. Accordingly, the comparison between MemoryFlux and nonMemoryFlux should not be interpreted as a strict contrast between models with and without memory, but rather as an assessment of the added value of explicitly incorporating historical predictor information through the LSTM look-back structure.
4.3 Limitations and Future Perspectives
Several limitations should be acknowledged. Firstly, the reliability of flux upscaling is tightly linked to the number of observations, meaning that regions and ecosystems with few observations may suffer from larger uncertainties (see Fig. S2g and h) (Zou et al., 2024). Although we included as many flux-tower sites as possible across North America, observational coverage remains highly uneven among regions and PFTs. For example, SAV, MF, WSA, and CSH were each represented by only two sites, with fewer than 300 monthly NEE observations (Table S2). For the SAV PFT, SWC was excluded from the predictor set. Although the SAV model still showed good predictive performance, the reduced predictor set may limit further improvements in model performance. Predictions for sparsely sampled PFTs and regions with limited flux-tower coverage should therefore be interpreted with greater caution. Furthermore, although we provide quantitative PFT-level model performance metrics (Tables S6 and S7), the current version of MemoryFlux does not include a spatially explicit uncertainty framework that fully characterizes uncertainties arising from model structure, predictor data, and spatial extrapolation. Developing such a framework will be an important direction for future improvements to the dataset.
Second, the site-level models were trained using tower-observed meteorological variables, whereas regional upscaling relied on ERA5-Land gridded predictors, potentially introducing a predictor-domain mismatch despite harmonization of variable definitions and units. Comparisons at flux-tower locations showed strong agreement for Ta, DSR, VPD, and P, but weaker agreement for WS and SWC (Fig. S10). These discrepancies may reflect differences in spatial representativeness between point-scale observations and 0.1° gridded reanalysis data, as well as differences in variable definitions, local topography, surface roughness, and soil-moisture measurement depth, and therefore represent an additional source of uncertainty in regional extrapolation.
Third, the accuracy of PFTs or land cover type classifications may substantially impact the flux upscaling results, as the modelled relationships depend on these classifications. Although the static PFT map used here helps reduce interannual classification noise, it cannot capture actual land-cover transitions, including cropland expansion or abandonment, forest disturbance and regrowth, and fire-induced vegetation changes. Such mismatches may introduce additional uncertainty into regional NEE estimates. How to balance the representativeness of observations across ecosystems is an important issue for upscaling flux from sites to regions. Developing cross-PFT methods could be a promising way, for example, by replacing them with parameter-environmental relationships, as proposed by Famiglietti et al. (2023).
Lastly, while this study suggests that explicitly incorporating historical information improved the temporal and spatial representation of upscaling NEE, differences between MemoryFlux and top-down atmospheric CO2 inversions remained. In particular, the large discrepancies occurred in the Midwest U.S., which may be linked to the pronounced impact of human management on croplands (Marcolla et al., 2017). Incorporating disturbance history and management information into ML modelling of carbon fluxes is expected to further improve the representation of these processes and enhance comparability among NEE estimates derived from different approaches. Furthermore, although these inversions provide valuable independent references for evaluating seasonal and interannual variations and large-scale carbon budgets, they are not direct measurements of NEE and are subject to uncertainties arising from factors such as atmospheric transport characterization and prior assumptions. Given the limited availability of large-scale direct flux observations, comparisons with atmospheric inversions provide a practical complementary means of evaluating regional NEE estimates. Future improvements in EC networks and inversion methods are expected to further enhance the accuracy and reliability of regional carbon flux modelling. Therefore, our results are preliminary, and we anticipate that refining our methodology will yield improved estimates in the future, particularly in terms of seasonality during the non-growing season.
The datasets used in this paper are available from open resources. Eddy covariance data for the 35 FLUXNET sites utilized in this study are available from the FLUXNET2015 dataset (https://fluxnet.org/data/fluxnet2015-dataset/, last access: 17 October 2023). Eddy covariance data for the remaining 49 sites are available from the AmeriFlux website (https://ameriflux.lbl.gov/data/download-data/, last access: 17 October 2023). GLASS LAI and FAPAR products are available from https://glass.hku.hk/download.html (last access: 17 October 2023). NDVI dataset is available from https://doi.org/10.6084/m9.figshare.22267048.v1 (Xiong, 2023). GOSIF is available from http://data.globalecology.unh.edu/data/GOSIF_v2/ (last access: 21 October 2023). ERA5-Land data are available from https://doi.org/10.24381/cds.68d2bb30 (Muñoz Sabater, 2019). DEM is available from: https://www.eorc.jaxa.jp/ALOS/en/dataset/aw3d30/aw3d30_e.htm (last access: 19 October 2023). EC-MOD2012 is available at the Global Ecology Data Repository (http://globalecology.unh.edu/data.html, last access: 29 February 2024). The data for the OCO-2 MIP project are available at https://gml.noaa.gov/ccgg/OCO2_v10mip/ (last access: 18 November 2024). The CarbonTracker2022 carbon flux data are publicly available at https://gml.noaa.gov/aftp/products/carbontracker/co2/ (last access: 30 November 2023). The upscaling FLUXCOM-X products are open access at https://doi.org/10.18160/5NZG-JMJE (Nelson et al., 2023). The MemoryFlux dataset, which explicitly incorporated historical predictor information, along with the main related code, is available at https://doi.org/10.5281/zenodo.20482274 (Huang and He, 2026).
This study presents a new regional-scale upscaled estimate of NEE from a bottom-up perspective. The LSTM-based upscaling, combined with selected remote sensing variables and environmental factors, produced results that were consistent with established knowledge and with most NEE products, whereas other datasets exhibited consistency only in specific aspects. MemoryFlux reproduced major growing-season and annual spatial patterns of NEE at a fine resolution of 0.1°×0.1° and showed strong seasonal consistency with the top-down atmospheric CO2 inversions from OCO-2 v10 MIP (r=0.96, p<0.001) and CT2022 (r=0.97, p<0.001). The mean annual total and standard deviation of NEE from 2001 to 2021 were −1.27 ± 0.12 Pg C yr−1, which was closer in magnitude to top-down inversions (OCO-2 v10 MIP and CT2022) than to the regional (EC-MOD2012) and global (NIES2020, FLUXCOM2020 RS+CRUJRA1.1, FLUXCOM2020 RS+ERA5, and FLUXCOM-X) flux upscaling estimates. Annual NEE ranged from −1.50 to −1.05 Pg C yr−1 over the study period. MemoryFlux also showed positive interannual correlations with OCO-2 v10 MIP (r=0.70, p=0.12) during 2015–2020, CT2022 during 2001–2020 (r=0.41, p=0.07), EC-MOD2012 during 2001–2012 (r=0.68, p<0.05), and FLUXCOM-X during 2001–2021 (r=0.69, p<0.05). The annual total NEE exhibited a non-significant tendency toward increasing carbon uptake in North America ( Pg C yr−2, p=0.09). In addition, MemoryFlux represented pronounced NEE anomaly patterns associated with the selected droughts during 2011–2013, 2017, and 2020–2021, as well as the 2019 Midwest floods. When historical predictor information was not explicitly incorporated during model training, the resulting NEE estimates showed markedly different spatial and temporal variability, showing less agreement with top-down inversions and other upscaling products, particularly at smaller scales.
Overall, the results indicate the added value of explicitly incorporating historical predictor information for representing NEE IAVs, particularly under climate extremes. MemoryFlux improves the representation of the spatial and temporal characteristics of NEE across North America and therefore provides a useful regional dataset for investigating terrestrial carbon dynamics and ecosystem–climate interactions.
The supplement related to this article is available online at https://doi.org/10.5194/essd-18-7367-2026-supplement.
CH: data curation, formal analysis, investigation, methodology, software, validation, visualization, and writing: original draft. WH: conceptualization, funding acquisition, methodology, project administration, resources, supervision, validation, and writing: review and editing. BB: conceptualization, methodology, and writing: review and editing. NTN: conceptualization and writing: review and editing. JX: conceptualization, formal analysis, and writing: review and editing. HY: conceptualization and writing: review and editing. PC: formal analysis and writing: review and editing. SW, XL, HM, PX, MZ, HC, and WJ: writing: review and editing. All authors contributed to reviewing and editing the final version of the manuscript.
At least one of the (co-)authors is a member of the editorial board of Earth System Science Data. The peer-review process was guided by an independent editor, and the authors also have no other competing interests to declare.
Publisher's note: Copernicus Publications remains neutral with regard to jurisdictional claims made in the text, published maps, institutional affiliations, or any other geographical representation in this paper. The authors bear the ultimate responsibility for providing appropriate place names. Views expressed in the text are those of the authors and do not necessarily reflect the views of the publisher.
We acknowledge FLUXNET and AmeriFlux for providing the flux tower data. CarbonTracker CT2022 results were provided by NOAA GML, Boulder, Colorado, USA. OCO-2 v10 MIP was provided by the NOAA/ESRL Global Monitoring Laboratory. We sincerely thank MPI-BGC and NIES for sharing the FLUXCOM2020 and NIES2020 flux datasets, respectively. We also sincerely acknowledge Shunlin Liang's group for sharing GLASS LAI and FAPAR data.
This research is funded by the National Natural Science Foundation of China (grant no. 42277453) and the Basic Research Program of Qinghai Province (grant no. 2025-ZJ-737). J.X. is supported by University of New Hampshire via Bridge Support. B.B.'s research was carried out at the Jet Propulsion Laboratory, California Institute of Technology, under a contract with the National Aeronautics and Space Administration (80NM0018D0004).
This paper was edited by Yuqiang Zhang and reviewed by Chaoyang Wu and one anonymous referee.
Anthoni, P. M., Unsworth, M. H., Law, B. E., Irvine, J., Baldocchi, D. D., Tuyl, S. V., and Moore, D.: Seasonal differences in carbon and water vapor exchange in young and old-growth ponderosa pine ecosystems, Agr. Forest Meteorol., 111, 203–222, https://doi.org/10.1016/S0168-1923(02)00021-7, 2002.
Aubinet, M., Hurdebise, Q., Chopin, H., Debacq, A., De Ligne, A., Heinesch, B., Manise, T., and Vincke, C.: Inter-annual variability of Net Ecosystem Productivity for a temperate mixed forest: A predominance of carry-over effects?, Agr. Forest Meteorol., 262, 340–353, https://doi.org/10.1016/j.agrformet.2018.07.024, 2018.
Ballantyne, A. P., Liu, Z., Anderegg, W. R., Yu, Z., Stoy, P., Poulter, B., Vanderwall, J., Watts, J., Kelsey, K., and Neff, J.: Reconciling carbon-cycle processes from ecosystem to global scales, Front. Ecol. Environ., 19, 57–65, https://doi.org/10.1002/fee.2296, 2021.
Battle, M., Bender, M. L., Tans, P. P., White, J. W. C., Ellis, J. T., Conway, T., and Francey, R. J.: Global Carbon Sinks and Their Variability Inferred from Atmospheric O2 and δ13C, Science, 287, 2467–2470, https://doi.org/10.1126/science.287.5462.2467, 2000.
Bergstra, J. and Bengio, Y.: Random search for hyper-parameter optimization, J. Mach. Learn. Res., 13, 281–305, 2012.
Besnard, S., Carvalhais, N., Arain, M. A., Black, A., Brede, B., Buchmann, N., Chen, J., Clevers, J. G. P. W., Dutrieux, L. P., Gans, F., Herold, M., Jung, M., Kosugi, Y., Knohl, A., Law, B. E., Paul-Limoges, E., Lohila, A., Merbold, L., Roupsard, O., Valentini, R., Wolf, S., Zhang, X., and Reichstein, M.: Memory effects of climate and vegetation affecting net ecosystem CO2 fluxes in global forests, PLOS ONE, 14, e0211510, https://doi.org/10.1371/journal.pone.0211510, 2019.
Boyer, J. S., Byrne, P., Cassman, K. G., Cooper, M., Delmer, D., Greene, T., Gruis, F., Habben, J., Hausmann, N., Kenny, N., Lafitte, R., Paszkiewicz, S., Porter, D., Schlegel, A., Schussler, J., Setter, T., Shanahan, J., Sharp, R. E., Vyn, T. J., Warner, D., and Gaffney, J.: The U. S. drought of 2012 in perspective: A call to action, Glob. Food Secur.-Agr., 2, 139–143, https://doi.org/10.1016/j.gfs.2013.08.002, 2013.
Byrne, B., Wunch, D., Jones, D. B. A., Strong, K., Deng, F., Baker, I., Köhler, P., Frankenberg, C., Joiner, J., Arora, V. K., Badawy, B., Harper, A. B., Warneke, T., Petri, C., Kivi, R., and Roehl, C. M.: Evaluating GPP and Respiration Estimates Over Northern Midlatitude Ecosystems Using Solar-Induced Fluorescence and Atmospheric CO2 Measurements, J. Geophys. Res.-Biogeo., 123, 2976–2997, https://doi.org/10.1029/2018JG004472, 2018.
Byrne, B., Jones, D. B. A., Strong, K., Polavarapu, S. M., Harper, A. B., Baker, D. F., and Maksyutov, S.: On what scales can GOSAT flux inversions constrain anomalies in terrestrial ecosystems?, Atmos. Chem. Phys., 19, 13017–13035, https://doi.org/10.5194/acp-19-13017-2019, 2019.
Byrne, B., Baker, D. F., Basu, S., Bertolacci, M., Bowman, K. W., Carroll, D., Chatterjee, A., Chevallier, F., Ciais, P., Cressie, N., Crisp, D., Crowell, S., Deng, F., Deng, Z., Deutscher, N. M., Dubey, M. K., Feng, S., García, O. E., Griffith, D. W. T., Herkommer, B., Hu, L., Jacobson, A. R., Janardanan, R., Jeong, S., Johnson, M. S., Jones, D. B. A., Kivi, R., Liu, J., Liu, Z., Maksyutov, S., Miller, J. B., Miller, S. M., Morino, I., Notholt, J., Oda, T., O'Dell, C. W., Oh, Y.-S., Ohyama, H., Patra, P. K., Peiro, H., Petri, C., Philip, S., Pollard, D. F., Poulter, B., Remaud, M., Schuh, A., Sha, M. K., Shiomi, K., Strong, K., Sweeney, C., Té, Y., Tian, H., Velazco, V. A., Vrekoussis, M., Warneke, T., Worden, J. R., Wunch, D., Yao, Y., Yun, J., Zammit-Mangion, A., and Zeng, N.: National CO2 budgets (2015–2020) inferred from atmospheric CO2 observations in support of the global stocktake, Earth Syst. Sci. Data, 15, 963–1004, https://doi.org/10.5194/essd-15-963-2023, 2023.
Chen, H., He, W., Liu, J., Nguyen, N. T., Chevallier, F., Yang, H., Lv, Y., Huang, C., Rödenbeck, C., Miller, S. M., Jiang, F., Liu, J., Johnson, M. S., Philip, S., Liu, Z., Zeng, N., Basu, S., and Baker, D. F.: Satellite-detected large CO2 release in southwestern North America during the 2020–2021 drought and associated wildfires, Environ. Res. Lett., 19, 054047, https://doi.org/10.1088/1748-9326/ad3cf7, 2024.
Ciais, P., Bastos, A., Chevallier, F., Lauerwald, R., Poulter, B., Canadell, J. G., Hugelius, G., Jackson, R. B., Jain, A., Jones, M., Kondo, M., Luijkx, I. T., Patra, P. K., Peters, W., Pongratz, J., Petrescu, A. M. R., Piao, S., Qiu, C., Von Randow, C., Regnier, P., Saunois, M., Scholes, R., Shvidenko, A., Tian, H., Yang, H., Wang, X., and Zheng, B.: Definitions and methods to estimate regional land carbon fluxes for the second phase of the REgional Carbon Cycle Assessment and Processes Project (RECCAP-2), Geosci. Model Dev., 15, 1289–1316, https://doi.org/10.5194/gmd-15-1289-2022, 2022.
Deng, F., Chen, J. M., Pan, Y., Peters, W., Birdsey, R., McCullough, K., and Xiao, J.: The use of forest stand age information in an atmospheric CO2 inversion applied to North America, Biogeosciences, 10, 5335–5348, https://doi.org/10.5194/bg-10-5335-2013, 2013.
Dobler-Morales, C. and Bocco, G.: Social and environmental dimensions of drought in Mexico: An integrative review, Int. J. Disast. Risk Re., 55, 102067, https://doi.org/10.1016/j.ijdrr.2021.102067, 2021.
Famiglietti, C. A., Worden, M., Quetin, G. R., Smallman, T. L., Dayal, U., Bloom, A. A., Williams, M., and Konings, A. G.: Global net biome CO2 exchange predicted comparably well using parameter–environment relationships and plant functional types, Global Change Biol., 29, 2256–2273, https://doi.org/10.1111/gcb.16574, 2023.
Foster, K. T., Sun, W., Shiga, Y. P., Mao, J., and Michalak, A. M.: Multiscale assessment of North American terrestrial carbon balance, Biogeosciences, 21, 869–891, https://doi.org/10.5194/bg-21-869-2024, 2024.
Friedlingstein, P., Jones, M. W., O'Sullivan, M., Andrew, R. M., Bakker, D. C. E., Hauck, J., Le Quéré, C., Peters, G. P., Peters, W., Pongratz, J., Sitch, S., Canadell, J. G., Ciais, P., Jackson, R. B., Alin, S. R., Anthoni, P., Bates, N. R., Becker, M., Bellouin, N., Bopp, L., Chau, T. T. T., Chevallier, F., Chini, L. P., Cronin, M., Currie, K. I., Decharme, B., Djeutchouang, L. M., Dou, X., Evans, W., Feely, R. A., Feng, L., Gasser, T., Gilfillan, D., Gkritzalis, T., Grassi, G., Gregor, L., Gruber, N., Gürses, Ö., Harris, I., Houghton, R. A., Hurtt, G. C., Iida, Y., Ilyina, T., Luijkx, I. T., Jain, A., Jones, S. D., Kato, E., Kennedy, D., Klein Goldewijk, K., Knauer, J., Korsbakken, J. I., Körtzinger, A., Landschützer, P., Lauvset, S. K., Lefèvre, N., Lienert, S., Liu, J., Marland, G., McGuire, P. C., Melton, J. R., Munro, D. R., Nabel, J. E. M. S., Nakaoka, S.-I., Niwa, Y., Ono, T., Pierrot, D., Poulter, B., Rehder, G., Resplandy, L., Robertson, E., Rödenbeck, C., Rosan, T. M., Schwinger, J., Schwingshackl, C., Séférian, R., Sutton, A. J., Sweeney, C., Tanhua, T., Tans, P. P., Tian, H., Tilbrook, B., Tubiello, F., van der Werf, G. R., Vuichard, N., Wada, C., Wanninkhof, R., Watson, A. J., Willis, D., Wiltshire, A. J., Yuan, W., Yue, C., Yue, X., Zaehle, S., and Zeng, J.: Global Carbon Budget 2021, Earth Syst. Sci. Data, 14, 1917–2005, https://doi.org/10.5194/essd-14-1917-2022, 2022.
Guanter, L., Zhang, Y., Jung, M., Joiner, J., Voigt, M., Berry, J. A., Frankenberg, C., Huete, A. R., Zarco-Tejada, P., Lee, J.-E., Moran, M. S., Ponce-Campos, G., Beer, C., Camps-Valls, G., Buchmann, N., Gianelle, D., Klumpp, K., Cescatti, A., Baker, J. M., and Griffis, T. J.: Global and time-resolved monitoring of crop photosynthesis with chlorophyll fluorescence, P. Natl. Acad. Sci. USA, 111, E1327–E1333, https://doi.org/10.1073/pnas.1320008111, 2014.
Hayes, D. J., Vargas, R., Alin, S. R., Conant, R. T., Hutyra, L. R., Jacobson, A. R., Kurz, W. A., Liu, S., McGuire, A. D., Poulter, B., and Woodall, C. W.: The North American carbon budget, in: Second State of the Carbon Cycle Report (SOCCR2): A Sustained Assessment Report, edited by: Cavallaro, N., Shrestha, G., Birdsey, R., Mayes, M. A., Najjar, R. G., Reed, S. C., Romero-Lankao, P., and Zhu, Z., U. S. Global Change Research Program, Washington, DC, USA, 71–108, https://doi.org/10.7930/SOCCR2.2018.Ch2, 2018.
He, W., Jiang, F., Ju, W., Byrne, B., Xiao, J., Nguyen, N. T., Wu, M., Wang, S., Wang, J., Rödenbeck, C., Li, X., Scholze, M., Monteil, G., Wang, H., Zhou, Y., He, Q., and Chen, J. M.: Do State-Of-The-Art Atmospheric CO2 Inverse Models Capture Drought Impacts on the European Land Carbon Uptake?, J. Adv. Model. Earth Sy., 15, e2022MS003150, https://doi.org/10.1029/2022MS003150, 2023a.
He, W., Jiang, F., Ju, W., Chevallier, F., Baker, D. F., Wang, J., Wu, M., Johnson, M. S., Philip, S., Wang, H., Bertolacci, M., Liu, Z., Zeng, N., and Chen, J. M.: Improved Constraints on the Recent Terrestrial Carbon Sink Over China by Assimilating OCO-2 XCO2 Retrievals, J. Geophys. Res.-Atmos., 128, e2022JD037773, https://doi.org/10.1029/2022JD037773, 2023b.
Hilton, T. W., Whelan, M. E., Zumkehr, A., Kulkarni, S., Berry, J. A., Baker, I. T., Montzka, S. A., Sweeney, C., Miller, B. R., and Elliott Campbell, J.: Peak growing season gross uptake of carbon in North America is largest in the Midwest USA, Nat. Clim. Change, 7, 450–454, https://doi.org/10.1038/nclimate3272, 2017.
Hochreiter, S. and Schmidhuber, J.: Long Short-Term Memory, Neural Comput., 9, 1735–1780, https://doi.org/10.1162/neco.1997.9.8.1735, 1997.
Hoell, A., Parker, B.-A., Downey, M., Umphlett, N., Jencso, K., Akyuz, F. A., Peck, D., Hadwen, T., Fuchs, B., Kluck, D., Edwards, L., Perlwitz, J., Eischeid, J., Deheza, V., Pulwarty, R., and Bevington, K.: Lessons Learned from the 2017 Flash Drought across the U. S. Northern Great Plains and Canadian Prairies, B. Am. Meteorol. Soc., 101, E2171–E2185, https://doi.org/10.1175/BAMS-D-19-0272.1, 2020.
Huang, C. and He, W.: Improved estimation of net ecosystem CO2 exchange over North America using LSTM-based flux upscaling (2001–2021), Zenodo [code, data set], https://doi.org/10.5281/zenodo.20482274, 2026.
Huang, C., He, W., Liu, J., Nguyen, N. T., Yang, H., Lv, Y., Chen, H., and Zhao, M.: Exploring the Potential of Long Short-Term Memory Networks for Predicting Net CO2 Exchange Across Various Ecosystems With Multi-Source Data, J. Geophys. Res.-Atmos., 129, e2023JD040418, https://doi.org/10.1029/2023JD040418, 2024.
Huntzinger, D. N., Post, W. M., Wei, Y., Michalak, A. M., West, T. O., Jacobson, A. R., Baker, I. T., Chen, J. M., Davis, K. J., Hayes, D. J., Hoffman, F. M., Jain, A. K., Liu, S., McGuire, A. D., Neilson, R. P., Potter, C., Poulter, B., Price, D., Raczka, B. M., Tian, H. Q., Thornton, P., Tomelleri, E., Viovy, N., Xiao, J., Yuan, W., Zeng, N., Zhao, M., and Cook, R.: North American Carbon Program (NACP) regional interim synthesis: Terrestrial biospheric model intercomparison, Ecol. Model., 232, 144–157, https://doi.org/10.1016/j.ecolmodel.2012.02.004, 2012.
Jacobson, A. R., Schuldt, K. N., Tans, P., Andrews, A., Miller, J. B., Oda, T., Basu, S., Mund, J., Weir, B., Ott, L., Aalto, T., Abshire, J. B., Aikin, K., Aoki, S., Apadula, F., Arnold, S., Baier, B., Bartyzel, J., Beyersdorf, A., Biermann, T., Biraud, S. C., Boenisch, H., Brailsford, G., Brand, W. A., Chen, G., Chen, H., Chmura, L., Clark, S., Colomb, A., Commane, R., Conil, S., Couret, C., Cox, A., Cristofanelli, P., Cuevas, E., Curcoll, R., Daube, B., Davis, K. J., De Wekker, S., Della Coletta, J., Delmotte, M., DiGangi, E., DiGangi, J. P., di Sarra, A. G., Dlugokencky, E., Elkins, J. W., Emmenegger, L., Fang, S., Fischer, M. L., Forster, G., Frumau, A., Galkowski, M., Gatti, L. V., Gehrlein, T., Gerbig, C., Gheusi, F., Gloor, E., Gomez-Trueba, V., Goto, D., Griffis, T., Hammer, S., Hanson, C., Haszpra, L., Hatakka, J., Heimann, M., Heliasz, M., Hensen, A., Hermansen, O., Hintsa, E., Holst, J., Ivakhov, V., Jaffe, D. A., Jordan, A., Joubert, W., Karion, A., Kawa, S. R., Kazan, V., Keeling, R. F., Keronen, P., Kneuer, T., Kolari, P., Komínková, K., Kort, E., Kozlova, E., Krummel, P., Kubistin, D., Labuschagne, C., Lam, D. H. Y., Lan, X., Langenfelds, R. L., Laurent, O., Laurila, T., Lauvaux, T., Lavric, J., Law, B. E., Lee, J., Lee, O. S. M., Lehner, I., Lehtinen, K., Leppert, R., Leskinen, A., Leuenberger, M., Levin, I., Levula, J., Lin, J., Lindauer, M., Loh, Z., Lopez, M., Luijkx, I. T., Lunder, C. R., Machida, T., Mammarella, I., Manca, G., Manning, A., Manning, A., Marek, M. V., Martin, M. Y., Matsueda, H., McKain, K., Meijer, H., Meinhardt, F., Merchant, L., Mihalopoulos, N., Miles, N. L., Miller, C. E., Mitchell, L., Mölder, M., Montzka, S., Moore, F., Moossen, H., Morgan, E., Morgui, J.-A., Morimoto, S., Müller-Williams, J., Munger, J. W., Munro, D., Myhre, C. L., Nakaoka, S.-I., Necki, J., Newman, S., Nichol, S., Niwa, Y., Obersteiner, F., O'Doherty, S., Paplawsky, B., Peischl, J., Peltola, O., Piacentino, S., Pichon, J.-M., Pickers, P., Piper, S., Pitt, J., Plass-Dülmer, C., Platt, S. M., Prinzivalli, S., Ramonet, M., Ramos, R., Reyes-Sanchez, E., Richardson, S. J., Riris, H., Rivas, P. P., Ryerson, T., Saito, K., Sargent, M., Sasakawa, M., Scheeren, B., Schuck, T., Schumacher, M., Seifert, T., Sha, M. K., Shepson, P., Shook, M., Sloop, C. D., Smith, P., Stanley, K., Steinbacher, M., Stephens, B., Sweeney, C., Thoning, K., Timas, H., Torn, M., Tørseth, K., Trisolino, P., Turnbull, J., van den Bulk, P., van Dinther, D., Vermeulen, A., Viner, B., Vitkova, G., Walker, S., Watson, A., Wofsy, S. C., Worsey, J., Worthy, D., Young, D., Zaehle, S., Zahn, A., and Zimnoch, M.: CarbonTracker CT2022, NOAA Global Monitoring Laboratory, https://doi.org/10.25925/Z1GJ-3254, 2023.
Jung, M., Koirala, S., Weber, U., Ichii, K., Gans, F., Camps-Valls, G., Papale, D., Schwalm, C., Tramontana, G., and Reichstein, M.: The FLUXCOM ensemble of global land-atmosphere energy fluxes, Sci. Data, 6, 74, https://doi.org/10.1038/s41597-019-0076-8, 2019.
Keenan, T. F. and Williams, C. A.: The Terrestrial Carbon Sink, Annu. Rev. Env. Resour., 43, 219–243, https://doi.org/10.1146/annurev-environ-102017-030204, 2018.
King, A. W., Andres, R. J., Davis, K. J., Hafer, M., Hayes, D. J., Huntzinger, D. N., de Jong, B., Kurz, W. A., McGuire, A. D., Vargas, R., Wei, Y., West, T. O., and Woodall, C. W.: North America's net terrestrial CO2 exchange with the atmosphere 1990–2009, Biogeosciences, 12, 399–414, https://doi.org/10.5194/bg-12-399-2015, 2015.
Kraft, B., Jung, M., Körner, M., Requena Mesa, C., Cortés, J., and Reichstein, M.: Identifying Dynamic Memory Effects on Vegetation State Using Recurrent Neural Networks, Front. Big Data, 2, https://doi.org/10.3389/fdata.2019.00031, 2019.
Kurz, W. A., Shaw, C. H., Boisvenue, C., Stinson, G., Metsaranta, J., Leckie, D., Dyk, A., Smyth, C., and Neilson, E. T.: Carbon in Canada's boreal forest – A synthesis, Environ. Rev., 21, 260–292, https://doi.org/10.1139/er-2013-0041, 2013.
Le Quéré, C., Andrew, R. M., Friedlingstein, P., Sitch, S., Pongratz, J., Manning, A. C., Korsbakken, J. I., Peters, G. P., Canadell, J. G., Jackson, R. B., Boden, T. A., Tans, P. P., Andrews, O. D., Arora, V. K., Bakker, D. C. E., Barbero, L., Becker, M., Betts, R. A., Bopp, L., Chevallier, F., Chini, L. P., Ciais, P., Cosca, C. E., Cross, J., Currie, K., Gasser, T., Harris, I., Hauck, J., Haverd, V., Houghton, R. A., Hunt, C. W., Hurtt, G., Ilyina, T., Jain, A. K., Kato, E., Kautz, M., Keeling, R. F., Klein Goldewijk, K., Körtzinger, A., Landschützer, P., Lefèvre, N., Lenton, A., Lienert, S., Lima, I., Lombardozzi, D., Metzl, N., Millero, F., Monteiro, P. M. S., Munro, D. R., Nabel, J. E. M. S., Nakaoka, S., Nojiri, Y., Padin, X. A., Peregon, A., Pfeil, B., Pierrot, D., Poulter, B., Rehder, G., Reimer, J., Rödenbeck, C., Schwinger, J., Séférian, R., Skjelvan, I., Stocker, B. D., Tian, H., Tilbrook, B., Tubiello, F. N., van der Laan-Luijkx, I. T., van der Werf, G. R., van Heuven, S., Viovy, N., Vuichard, N., Walker, A. P., Watson, A. J., Wiltshire, A. J., Zaehle, S., and Zhu, D.: Global Carbon Budget 2017, Earth Syst. Sci. Data, 10, 405–448, https://doi.org/10.5194/essd-10-405-2018, 2018.
Li, X. and Xiao, J.: A Global, 0.05-Degree Product of Solar-Induced Chlorophyll Fluorescence Derived from OCO-2, MODIS, and Reanalysis Data, Remote Sens.-Basel, 11, 517, https://doi.org/10.3390/rs11050517, 2019.
Liang, S., Cheng, J., Jia, K., Jiang, B., Liu, Q., Xiao, Z., Yao, Y., Yuan, W., Zhang, X., Zhao, X., and Zhou, J.: The Global Land Surface Satellite (GLASS) Product Suite, B. Am. Meteorol. Soc., 102, E323–E337, https://doi.org/10.1175/BAMS-D-18-0341.1, 2021.
Liu, L., Zhang, Y., Wu, S., Li, S., and Qin, D.: Water memory effects and their impacts on global vegetation productivity and resilience, Sci. Rep.-UK, 8, 2962, https://doi.org/10.1038/s41598-018-21339-4, 2018.
Liu, W., He, H., Wu, X., Ren, X., Zhang, L., Shi, L., Feng, L., Wang, Y., and Lv, Y.: Importance of the memory effect for assessing interannual variation in net ecosystem exchange, Agr. Forest Meteorol., 341, 109691, https://doi.org/10.1016/j.agrformet.2023.109691, 2023.
Ma, T., He, W., Fang, S., Xiao, J., Nguyen, N. T., Yang, H., Xu, P., Huang, C., Zhao, M., Liu, S., Lei, X., and Huang, Z.: Temporal Memory Mechanisms and Biome-Specific Drivers of Ecosystem Carbon Flux: Insights From Explainable Deep Learning Modeling, Global Change Biol., 32, e70722, https://doi.org/10.1111/gcb.70722, 2026.
Mankin, J. S., Simpson, I., Hoell, A., Fu, R., Lisonbee, J., Sheffield, A., and Barrie, D.: NOAA Drought Task Force Report on the 2020–2021 Southwestern U. S. Drought, NOAA Drought Task Force, MAPP, and NIDIS, https://doi.org/10.25923/j0rj-an85, 2021.
Marcolla, B., Rödenbeck, C., and Cescatti, A.: Patterns and controls of inter-annual variability in the terrestrial carbon budget, Biogeosciences, 14, 3815–3829, https://doi.org/10.5194/bg-14-3815-2017, 2017.
Martens, B., Miralles, D. G., Lievens, H., van der Schalie, R., de Jeu, R. A. M., Fernández-Prieto, D., Beck, H. E., Dorigo, W. A., and Verhoest, N. E. C.: GLEAM v3: satellite-based land evaporation and root-zone soil moisture, Geosci. Model Dev., 10, 1903–1925, https://doi.org/10.5194/gmd-10-1903-2017, 2017.
Monger, C., Sala, O. E., Duniway, M. C., Goldfus, H., Meir, I. A., Poch, R. M., Throop, H. L., and Vivoni, E. R.: Legacy effects in linked ecological–soil–geomorphic systems of drylands, Front. Ecol. Environ., 13, 13–19, https://doi.org/10.1890/140269, 2015.
Mueller, N. D., Butler, E. E., McKinnon, K. A., Rhines, A., Tingley, M., Holbrook, N. M., and Huybers, P.: Cooling of US Midwest summer temperature extremes from cropland intensification, Nat. Clim. Change, 6, 317–322, https://doi.org/10.1038/nclimate2825, 2016.
Muñoz Sabater, J.: ERA5-Land monthly averaged data from 1950 to present, Copernicus Climate Change Service (C3S) Climate Data Store (CDS) [data set], https://doi.org/10.24381/cds.68d2bb30, 2019.
Muñoz-Sabater, J., Dutra, E., Agustí-Panareda, A., Albergel, C., Arduini, G., Balsamo, G., Boussetta, S., Choulga, M., Harrigan, S., Hersbach, H., Martens, B., Miralles, D. G., Piles, M., Rodríguez-Fernández, N. J., Zsoter, E., Buontempo, C., and Thépaut, J.-N.: ERA5-Land: a state-of-the-art global reanalysis dataset for land applications, Earth Syst. Sci. Data, 13, 4349–4383, https://doi.org/10.5194/essd-13-4349-2021, 2021.
Myers-Smith, I. H., Kerby, J. T., Phoenix, G. K., Bjerke, J. W., Epstein, H. E., Assmann, J. J., John, C., Andreu-Hayles, L., Angers-Blondin, S., Beck, P. S. A., Berner, L. T., Bhatt, U. S., Bjorkman, A. D., Blok, D., Bryn, A., Christiansen, C. T., Cornelissen, J. H. C., Cunliffe, A. M., Elmendorf, S. C., Forbes, B. C., Goetz, S. J., Hollister, R. D., de Jong, R., Loranty, M. M., Macias-Fauria, M., Maseyk, K., Normand, S., Olofsson, J., Parker, T. C., Parmentier, F.-J. W., Post, E., Schaepman-Strub, G., Stordal, F., Sullivan, P. F., Thomas, H. J. D., Tømmervik, H., Treharne, R., Tweedie, C. E., Walker, D. A., Wilmking, M., and Wipf, S.: Complexity revealed in the greening of the Arctic, Nat. Clim. Change, 10, 106–117, https://doi.org/10.1038/s41558-019-0688-1, 2020.
Natali, S. M., Watts, J. D., Rogers, B. M., Potter, S., Ludwig, S. M., Selbmann, A.-K., Sullivan, P. F., Abbott, B. W., Arndt, K. A., Birch, L., Björkman, M. P., Bloom, A. A., Celis, G., Christensen, T. R., Christiansen, C. T., Commane, R., Cooper, E. J., Crill, P., Czimczik, C., Davydov, S., Du, J., Egan, J. E., Elberling, B., Euskirchen, E. S., Friborg, T., Genet, H., Göckede, M., Goodrich, J. P., Grogan, P., Helbig, M., Jafarov, E. E., Jastrow, J. D., Kalhori, A. A. M., Kim, Y., Kimball, J. S., Kutzbach, L., Lara, M. J., Larsen, K. S., Lee, B.-Y., Liu, Z., Loranty, M. M., Lund, M., Lupascu, M., Madani, N., Malhotra, A., Matamala, R., McFarland, J., McGuire, A. D., Michelsen, A., Minions, C., Oechel, W. C., Olefeldt, D., Parmentier, F.-J. W., Pirk, N., Poulter, B., Quinton, W., Rezanezhad, F., Risk, D., Sachs, T., Schaefer, K., Schmidt, N. M., Schuur, E. A. G., Semenchuk, P. R., Shaver, G., Sonnentag, O., Starr, G., Treat, C. C., Waldrop, M. P., Wang, Y., Welker, J., Wille, C., Xu, X., Zhang, Z., Zhuang, Q., and Zona, D.: Large loss of CO2 in winter observed across the northern permafrost region, Nat. Clim. Change, 9, 852–857, https://doi.org/10.1038/s41558-019-0592-8, 2019.
Nelson, J. A., Walther, S., Jung, M., Gans, F., Kraft, B., Weber, U., Hamdi, Z., Duveiller, G., and Zhang, W.: FLUXCOM-X-BASE, ICOS Carbon Portal [data set], https://doi.org/10.18160/5NZG-JMJE, 2023.
Nelson, J. A., Walther, S., Gans, F., Kraft, B., Weber, U., Novick, K., Buchmann, N., Migliavacca, M., Wohlfahrt, G., Šigut, L., Ibrom, A., Papale, D., Göckede, M., Duveiller, G., Knohl, A., Hörtnagl, L., Scott, R. L., Dušek, J., Zhang, W., Hamdi, Z. M., Reichstein, M., Aranda-Barranco, S., Ardö, J., Op de Beeck, M., Billesbach, D., Bowling, D., Bracho, R., Brümmer, C., Camps-Valls, G., Chen, S., Cleverly, J. R., Desai, A., Dong, G., El-Madany, T. S., Euskirchen, E. S., Feigenwinter, I., Galvagno, M., Gerosa, G. A., Gielen, B., Goded, I., Goslee, S., Gough, C. M., Heinesch, B., Ichii, K., Jackowicz-Korczynski, M. A., Klosterhalfen, A., Knox, S., Kobayashi, H., Kohonen, K.-M., Korkiakoski, M., Mammarella, I., Gharun, M., Marzuoli, R., Matamala, R., Metzger, S., Montagnani, L., Nicolini, G., O'Halloran, T., Ourcival, J.-M., Peichl, M., Pendall, E., Ruiz Reverter, B., Roland, M., Sabbatini, S., Sachs, T., Schmidt, M., Schwalm, C. R., Shekhar, A., Silberstein, R., Silveira, M. L., Spano, D., Tagesson, T., Tramontana, G., Trotta, C., Turco, F., Vesala, T., Vincke, C., Vitale, D., Vivoni, E. R., Wang, Y., Woodgate, W., Yepez, E. A., Zhang, J., Zona, D., and Jung, M.: X-BASE: the first terrestrial carbon and water flux products from an extended data-driven scaling framework, FLUXCOM-X, Biogeosciences, 21, 5079–5115, https://doi.org/10.5194/bg-21-5079-2024, 2024.
Novick, K. A., Biederman, J. A., Desai, A. R., Litvak, M. E., Moore, D. J. P., Scott, R. L., and Torn, M. S.: The AmeriFlux network: A coalition of the willing, Agr. Forest Meteorol., 249, 444–456, https://doi.org/10.1016/j.agrformet.2017.10.009, 2018.
Ogle, K., Barber, J. J., Barron-Gafford, G. A., Bentley, L. P., Young, J. M., Huxman, T. E., Loik, M. E., and Tissue, D. T.: Quantifying ecological memory in plant and ecosystem processes, Ecol. Lett., 18, 221–235, https://doi.org/10.1111/ele.12399, 2015.
Olson, D. M., Dinerstein, E., Wikramanayake, E. D., Burgess, N. D., Powell, G. V. N., Underwood, E. C., D'amico, J. A., Itoua, I., Strand, H. E., Morrison, J. C., Loucks, C. J., Allnutt, T. F., Ricketts, T. H., Kura, Y., Lamoreux, J. F., Wettengel, W. W., Hedao, P., and Kassem, K. R.: Terrestrial Ecoregions of the World: A New Map of Life on Earth: A new global map of terrestrial ecoregions provides an innovative tool for conserving biodiversity, BioScience, 51, 933–938, https://doi.org/10.1641/0006-3568(2001)051[0933:TEOTWA]2.0.CO;2, 2001.
Papagiannopoulou, C., Miralles, D. G., Decubber, S., Demuzere, M., Verhoest, N. E. C., Dorigo, W. A., and Waegeman, W.: A non-linear Granger-causality framework to investigate climate–vegetation dynamics, Geosci. Model Dev., 10, 1945–1960, https://doi.org/10.5194/gmd-10-1945-2017, 2017.
Pastorello, G., Trotta, C., Canfora, E., Chu, H., Christianson, D., Cheah, Y.-W., Poindexter, C., Chen, J., Elbashandy, A., Humphrey, M., Isaac, P., Polidori, D., Reichstein, M., Ribeca, A., van Ingen, C., Vuichard, N., Zhang, L., Amiro, B., Ammann, C., Arain, M. A., Ardö, J., Arkebauer, T., Arndt, S. K., Arriga, N., Aubinet, M., Aurela, M., Baldocchi, D., Barr, A., Beamesderfer, E., Belelli Marchesini, L., Bergeron, O., Beringer, J., Bernhofer, C., Berveiller, D., Billesbach, D., Black, T. A., Blanken, P. D., Bohrer, G., Boike, J., Bolstad, P. V., Bonal, D., Bonnefond, J.-M., Bowling, D. R., Bracho, R., Brodeur, J., Brümmer, C., Buchmann, N., Burban, B., Burns, S. P., Buysse, P., Cale, P., Cavagna, M., Cellier, P., Chen, S., Chini, I., Christensen, T. R., Cleverly, J., Collalti, A., Consalvo, C., Cook, B. D., Cook, D., Coursolle, C., Cremonese, E., Curtis, P. S., D’Andrea, E., da Rocha, H., Dai, X., Davis, K. J., De Cinti, B., de Grandcourt, A., De Ligne, A., De Oliveira, R. C., Delpierre, N., Desai, A. R., Di Bella, C. M., di Tommasi, P., Dolman, H., Domingo, F., Dong, G., Dore, S., Duce, P., Dufrêne, E., Dunn, A., Dušek, J., Eamus, D., Eichelmann, U., ElKhidir, H. A. M., Eugster, W., Ewenz, C. M., Ewers, B., Famulari, D., Fares, S., Feigenwinter, I., Feitz, A., Fensholt, R., Filippa, G., Fischer, M., Frank, J., Galvagno, M., Gharun, M., Gianelle, D., Gielen, B., Gioli, B., Gitelson, A., Goded, I., Goeckede, M., Goldstein, A. H., Gough, C. M., Goulden, M. L., Graf, A., Griebel, A., Gruening, C., Grünwald, T., Hammerle, A., Han, S., Han, X., Hansen, B. U., Hanson, C., Hatakka, J., He, Y., Hehn, M., Heinesch, B., Hinko-Najera, N., Hörtnagl, L., Hutley, L., Ibrom, A., Ikawa, H., Jackowicz-Korczynski, M., Janouš, D., Jans, W., Jassal, R., Jiang, S., Kato, T., Khomik, M., Klatt, J., Knohl, A., Knox, S., Kobayashi, H., Koerber, G., Kolle, O., Kosugi, Y., Kotani, A., Kowalski, A., Kruijt, B., Kurbatova, J., Kutsch, W. L., Kwon, H., Launiainen, S., Laurila, T., Law, B., Leuning, R., Li, Y., Liddell, M., Limousin, J.-M., Lion, M., Liska, A. J., Lohila, A., López-Ballesteros, A., López-Blanco, E., Loubet, B., Loustau, D., Lucas-Moffat, A., Lüers, J., Ma, S., Macfarlane, C., Magliulo, V., Maier, R., Mammarella, I., Manca, G., Marcolla, B., Margolis, H. A., Marras, S., Massman, W., Mastepanov, M., Matamala, R., Matthes, J. H., Mazzenga, F., McCaughey, H., McHugh, I., McMillan, A. M. S., Merbold, L., Meyer, W., Meyers, T., Miller, S. D., Minerbi, S., Moderow, U., Monson, R. K., Montagnani, L., Moore, C. E., Moors, E., Moreaux, V., Moureaux, C., Munger, J. W., Nakai, T., Neirynck, J., Nesic, Z., Nicolini, G., Noormets, A., Northwood, M., Nosetto, M., Nouvellon, Y., Novick, K., Oechel, W., Olesen, J. E., Ourcival, J.-M., Papuga, S. A., Parmentier, F.-J., Paul-Limoges, E., Pavelka, M., Peichl, M., Pendall, E., Phillips, R. P., Pilegaard, K., Pirk, N., Posse, G., Powell, T., Prasse, H., Prober, S. M., Rambal, S., Rannik, Ü., Raz-Yaseef, N., Rebmann, C., Reed, D., Resco de Dios, V., Restrepo-Coupe, N., Reverter, B. R., Roland, M., Sabbatini, S., Sachs, T., Saleska, S. R., Sánchez-Cañete, E. P., Sanchez-Mejia, Z. M., Schmid, H. P., Schmidt, M., Schneider, K., Schrader, F., Schroder, I., Scott, R. L., Sedlák, P., Serrano-Ortíz, P., Shao, C., Shi, P., Shironya, I., Siebicke, L., Šigut, L., Silberstein, R., Sirca, C., Spano, D., Steinbrecher, R., Stevens, R. M., Sturtevant, C., Suyker, A., Tagesson, T., Takanashi, S., Tang, Y., Tapper, N., Thom, J., Tomassucci, M., Tuovinen, J.-P., Urbanski, S., Valentini, R., van der Molen, M., van Gorsel, E., van Huissteden, K., Varlagin, A., Verfaillie, J., Vesala, T., Vincke, C., Vitale, D., Vygodskaya, N., Walker, J. P., Walter-Shea, E., Wang, H., Weber, R., Westermann, S., Wille, C., Wofsy, S., Wohlfahrt, G., Wolf, S., Woodgate, W., Li, Y., Zampedri, R., Zhang, J., Zhou, G., Zona, D., Agarwal, D., Biraud, S., Torn, M., and Papale, D.: The FLUXNET2015 dataset and the ONEFlux processing pipeline for eddy covariance data, Sci. Data, 7, 225, https://doi.org/10.1038/s41597-020-0534-3, 2020.
Peters, W., Jacobson, A. R., Sweeney, C., Andrews, A. E., Conway, T. J., Masarie, K., Miller, J. B., Bruhwiler, L. M. P., Pétron, G., Hirsch, A. I., Worthy, D. E. J., van der Werf, G. R., Randerson, J. T., Wennberg, P. O., Krol, M. C., and Tans, P. P.: An atmospheric perspective on North American carbon dioxide exchange: CarbonTracker, P. Natl. Acad. Sci. USA, 104, 18925–18930, https://doi.org/10.1073/pnas.0708986104, 2007.
Piao, S., Liu, Q., Chen, A., Janssens, I. A., Fu, Y., Dai, J., Liu, L., Lian, X., Shen, M., and Zhu, X.: Plant phenology and global climate change: Current progresses and challenges, Global Change Biol., 25, 1922–1940, https://doi.org/10.1111/gcb.14619, 2019.
Piao, S., Wang, X., Wang, K., Li, X., Bastos, A., Canadell, J. G., Ciais, P., Friedlingstein, P., and Sitch, S.: Interannual variation of terrestrial carbon cycle: Issues and perspectives, Global Change Biol., 26, 300–318, https://doi.org/10.1111/gcb.14884, 2020.
Schuh, A. E., Lauvaux, T., West, T. O., Denning, A. S., Davis, K. J., Miles, N., Richardson, S., Uliasz, M., Lokupitiya, E., Cooley, D., Andrews, A., and Ogle, S.: Evaluating atmospheric CO2 inversions at multiple scales over a highly inventoried agricultural landscape, Global Change Biol., 19, 1424–1439, https://doi.org/10.1111/gcb.12141, 2013.
Schuur, E. A. G., Bracho, R., Celis, G., Belshe, E. F., Ebert, C., Ledman, J., Mauritz, M., Pegoraro, E. F., Plaza, C., Rodenhizer, H., Romanovsky, V., Schädel, C., Schirokauer, D., Taylor, M., Vogel, J. G., and Webb, E. E.: Tundra Underlain By Thawing Permafrost Persistently Emits Carbon to the Atmosphere Over 15 Years of Measurements, J. Geophys. Res.-Biogeo., 126, e2020JG006044, https://doi.org/10.1029/2020JG006044, 2021.
Seddon, A. W. R., Macias-Fauria, M., Long, P. R., Benz, D., and Willis, K. J.: Sensitivity of global terrestrial ecosystems to climate variability, Nature, 531, 229–232, https://doi.org/10.1038/nature16986, 2016.
Shen, W., Jenerette, G. D., Hui, D., and Scott, R. L.: Precipitation legacy effects on dryland ecosystem carbon fluxes: direction, magnitude and biogeochemical carryovers, Biogeosciences, 13, 425–439, https://doi.org/10.5194/bg-13-425-2016, 2016.
Shiga, Y. P., Tadić, J. M., Qiu, X., Yadav, V., Andrews, A. E., Berry, J. A., and Michalak, A. M.: Atmospheric CO2 Observations Reveal Strong Correlation Between Regional Net Biospheric Carbon Uptake and Solar-Induced Chlorophyll Fluorescence, Geophys. Res. Lett., 45, 1122–1132, https://doi.org/10.1002/2017GL076630, 2018.
Stinson, G., Kurz, W. A., Smyth, C. E., Neilson, E. T., Dymond, C. C., Metsaranta, J. M., Boisvenue, C., Rampley, G. J., Li, Q., White, T. M., and Blain, D.: An inventory-based analysis of Canada's managed forest carbon dynamics, 1990 to 2008, Global Change Biol., 17, 2227–2244, https://doi.org/10.1111/j.1365-2486.2010.02369.x, 2011.
Swain, D. L., Tsiang, M., Haugen, M., Singh, D., and Diffenbaugh, N. S.: The extraordinary California drought of 2013/2014: Character, context, and the role of climate change, B. Am. Meteorol. Soc., 95, S3–S7, 2014.
Tadono, T., Nagai, H., Ishida, H., Oda, F., Naito, S., Minakawa, K., and Iwamoto, H.: GENERATION OF THE 30 M-MESH GLOBAL DIGITAL SURFACE MODEL BY ALOS PRISM, Int. Arch. Photogramm. Remote Sens. Spatial Inf. Sci., XLI-B4, 157–162, https://doi.org/10.5194/isprs-archives-XLI-B4-157-2016, 2016.
Takaku, J., Tadono, T., Doutsu, M., Ohgushi, F., and Kai, H.: UPDATES OF “AW3D30” ALOS GLOBAL DIGITAL SURFACE MODEL WITH OTHER OPEN ACCESS DATASETS, Int. Arch. Photogramm. Remote Sens. Spatial Inf. Sci., XLIII-B4-2020, 183–189, https://doi.org/10.5194/isprs-archives-XLIII-B4-2020-183-2020, 2020.
Tao, F., Chen, Y., and Fu, B.: Impacts of climate and vegetation leaf area index changes on global terrestrial water storage from 2002 to 2016, Sci. Total Environ., 724, 138298, https://doi.org/10.1016/j.scitotenv.2020.138298, 2020.
Vicca, S., Bahn, M., Estiarte, M., van Loon, E. E., Vargas, R., Alberti, G., Ambus, P., Arain, M. A., Beier, C., Bentley, L. P., Borken, W., Buchmann, N., Collins, S. L., de Dato, G., Dukes, J. S., Escolar, C., Fay, P., Guidolotti, G., Hanson, P. J., Kahmen, A., Kröel-Dulay, G., Ladreiter-Knauss, T., Larsen, K. S., Lellei-Kovacs, E., Lebrija-Trejos, E., Maestre, F. T., Marhan, S., Marshall, M., Meir, P., Miao, Y., Muhr, J., Niklaus, P. A., Ogaya, R., Peñuelas, J., Poll, C., Rustad, L. E., Savage, K., Schindlbacher, A., Schmidt, I. K., Smith, A. R., Sotta, E. D., Suseela, V., Tietema, A., van Gestel, N., van Straaten, O., Wan, S., Weber, U., and Janssens, I. A.: Can current moisture responses predict soil CO2 efflux under altered precipitation regimes? A synthesis of manipulation experiments, Biogeosciences, 11, 2991–3013, https://doi.org/10.5194/bg-11-2991-2014, 2014.
Virkkala, A.-M., Aalto, J., Rogers, B. M., Tagesson, T., Treat, C. C., Natali, S. M., Watts, J. D., Potter, S., Lehtonen, A., Mauritz, M., Schuur, E. A. G., Kochendorfer, J., Zona, D., Oechel, W., Kobayashi, H., Humphreys, E., Goeckede, M., Iwata, H., Lafleur, P. M., Euskirchen, E. S., Bokhorst, S., Marushchak, M., Martikainen, P. J., Elberling, B., Voigt, C., Biasi, C., Sonnentag, O., Parmentier, F.-J. W., Ueyama, M., Celis, G., St. Louis, V. L., Emmerton, C. A., Peichl, M., Chi, J., Järveoja, J., Nilsson, M. B., Oberbauer, S. F., Torn, M. S., Park, S.-J., Dolman, H., Mammarella, I., Chae, N., Poyatos, R., López-Blanco, E., Christensen, T. R., Kwon, M. J., Sachs, T., Holl, D., and Luoto, M.: Statistical upscaling of ecosystem CO2 fluxes across the terrestrial tundra and boreal domain: Regional patterns and uncertainties, Global Change Biol., 27, 4040–4059, https://doi.org/10.1111/gcb.15659, 2021.
Walker, A. P., De Kauwe, M. G., Bastos, A., Belmecheri, S., Georgiou, K., Keeling, R. F., McMahon, S. M., Medlyn, B. E., Moore, D. J. P., Norby, R. J., Zaehle, S., Anderson-Teixeira, K. J., Battipaglia, G., Brienen, R. J. W., Cabugao, K. G., Cailleret, M., Campbell, E., Canadell, J. G., Ciais, P., Craig, M. E., Ellsworth, D. S., Farquhar, G. D., Fatichi, S., Fisher, J. B., Frank, D. C., Graven, H., Gu, L., Haverd, V., Heilman, K., Heimann, M., Hungate, B. A., Iversen, C. M., Joos, F., Jiang, M., Keenan, T. F., Knauer, J., Körner, C., Leshyk, V. O., Leuzinger, S., Liu, Y., MacBean, N., Malhi, Y., McVicar, T. R., Penuelas, J., Pongratz, J., Powell, A. S., Riutta, T., Sabot, M. E. B., Schleucher, J., Sitch, S., Smith, W. K., Sulman, B., Taylor, B., Terrer, C., Torn, M. S., Treseder, K. K., Trugman, A. T., Trumbore, S. E., van Mantgem, P. J., Voelker, S. L., Whelan, M. E., and Zuidema, P. A.: Integrating the evidence for a terrestrial carbon sink caused by increasing atmospheric CO2, New Phytol., 229, 2413–2445, https://doi.org/10.1111/nph.16866, 2021.
Weiss, J. L., Overpeck, J. T., and Cole, J. E.: Warmer Led to Drier: Dissecting the 2011 Drought in the Southern U. S., Southwest Climate Outlook, 11, 3–4, 2012.
White, M. A., Thornton, P. E., Running, S. W., and Nemani, R. R.: Parameterization and Sensitivity Analysis of the BIOME–BGC Terrestrial Ecosystem Model: Net Primary Production Controls, Earth Interact., 4, 1–85, https://doi.org/10.1175/1087-3562(2000)004<0003:PASAOT>2.0.CO;2, 2000.
Wofsy, S. C., Goulden, M. L., Munger, J. W., Fan, S.-M., Bakwin, P. S., Daube, B. C., Bassow, S. L., and Bazzaz, F. A.: Net Exchange of CO2 in a Mid-Latitude Forest, Science, 260, 1314–1317, https://doi.org/10.1126/science.260.5112.1314, 1993.
Wu, D., Zhao, X., Liang, S., Zhou, T., Huang, K., Tang, B., and Zhao, W.: Time-lag effects of global vegetation responses to climate change, Global Change Biol., 21, 3520–3531, https://doi.org/10.1111/gcb.12945, 2015.
Xiao, J., Zhuang, Q., Baldocchi, D. D., Law, B. E., Richardson, A. D., Chen, J., Oren, R., Starr, G., Noormets, A., Ma, S., Verma, S. B., Wharton, S., Wofsy, S. C., Bolstad, P. V., Burns, S. P., Cook, D. R., Curtis, P. S., Drake, B. G., Falk, M., Fischer, M. L., Foster, D. R., Gu, L., Hadley, J. L., Hollinger, D. Y., Katul, G. G., Litvak, M., Martin, T. A., Matamala, R., McNulty, S., Meyers, T. P., Monson, R. K., Munger, J. W., Oechel, W. C., Paw U, K. T., Schmid, H. P., Scott, R. L., Sun, G., Suyker, A. E., and Torn, M. S.: Estimation of net ecosystem carbon exchange for the conterminous United States by combining MODIS and AmeriFlux data, Agr. Forest Meteorol., 148, 1827–1847, https://doi.org/10.1016/j.agrformet.2008.06.015, 2008.
Xiao, J., Zhuang, Q., Law, B. E., Baldocchi, D. D., Chen, J., Richardson, A. D., Melillo, J. M., Davis, K. J., Hollinger, D. Y., Wharton, S., Oren, R., Noormets, A., Fischer, M. L., Verma, S. B., Cook, D. R., Sun, G., McNulty, S., Wofsy, S. C., Bolstad, P. V., Burns, S. P., Curtis, P. S., Drake, B. G., Falk, M., Foster, D. R., Gu, L., Hadley, J. L., Katul, G. G., Litvak, M., Ma, S., Martin, T. A., Matamala, R., Meyers, T. P., Monson, R. K., Munger, J. W., Oechel, W. C., Paw, U. K. T., Schmid, H. P., Scott, R. L., Starr, G., Suyker, A. E., and Torn, M. S.: Assessing net ecosystem carbon exchange of U. S. terrestrial ecosystems by integrating eddy covariance flux measurements and satellite observations, Agr. Forest Meteorol., 151, 60–69, https://doi.org/10.1016/j.agrformet.2010.09.002, 2011.
Xiao, J., Ollinger, S. V., Frolking, S., Hurtt, G. C., Hollinger, D. Y., Davis, K. J., Pan, Y., Zhang, X., Deng, F., Chen, J., Baldocchi, D. D., Law, B. E., Arain, M. A., Desai, A. R., Richardson, A. D., Sun, G., Amiro, B., Margolis, H., Gu, L., Scott, R. L., Blanken, P. D., and Suyker, A. E.: Data-driven diagnostics of terrestrial carbon dynamics over North America, Agr. Forest Meteorol., 197, 142–157, https://doi.org/10.1016/j.agrformet.2014.06.013, 2014.
Xiong, C.: glass_vi_010_025, figshare [data set], https://doi.org/10.6084/m9.figshare.22267048.v1, 2023.
Xiong, C., Ma, H., Liang, S., He, T., Zhang, Y., Zhang, G., and Xu, J.: Improved global 250 m 8 d NDVI and EVI products from 2000–2021 using the LSTM model, Sci. Data, 10, 800, https://doi.org/10.1038/s41597-023-02695-x, 2023.
Yadav, V. S., Yadav, S. S., Gupta, S. R., Meena, R. S., Lal, R., Sheoran, N. S., and Jhariya, M. K.: Carbon sequestration potential and CO2 fluxes in a tropical forest ecosystem, Ecol. Eng., 176, 106541, https://doi.org/10.1016/j.ecoleng.2022.106541, 2022.
Yao, Y., Li, Z., Wang, T., Chen, A., Wang, X., Du, M., Jia, G., Li, Y., Li, H., Luo, W., Ma, Y., Tang, Y., Wang, H., Wu, Z., Yan, J., Zhang, X., Zhang, Y., Zhang, Y., Zhou, G., and Piao, S.: A new estimation of China's net ecosystem productivity based on eddy covariance measurements and a model tree ensemble approach, Agr. Forest Meteorol., 253–254, 84–93, https://doi.org/10.1016/j.agrformet.2018.02.007, 2018.
Yin, Y., Byrne, B., Liu, J., Wennberg, P. O., Davis, K. J., Magney, T., Köhler, P., He, L., Jeyaram, R., Humphrey, V., Gerken, T., Feng, S., Digangi, J. P., and Frankenberg, C.: Cropland Carbon Uptake Delayed and Reduced by 2019 Midwest Floods, AGU Advances, 1, e2019AV000140, https://doi.org/10.1029/2019AV000140, 2020.
Zeng, J., Matsunaga, T., Tan, Z.-H., Saigusa, N., Shirai, T., Tang, Y., Peng, S., and Fukuda, Y.: Global terrestrial carbon fluxes of 1999–2019 estimated by upscaling eddy covariance data with a random forest, Sci. Data, 7, 313, https://doi.org/10.1038/s41597-020-00653-5, 2020.
Zou, H., Chen, J., Li, X., Abraha, M., Zhao, X., and Tang, J.: Modeling net ecosystem exchange of CO2 with gated recurrent unit neural networks, Agr. Forest Meteorol., 350, 109985, https://doi.org/10.1016/j.agrformet.2024.109985, 2024.