the Creative Commons Attribution 4.0 License.
the Creative Commons Attribution 4.0 License.
Daily snow depth in the Southern Andes (2010–2024): a quality-controlled dataset from Chile and Argentina
Alexis Caro

Javier Medina
Fernando Gimeno
Jorge Huenante
Mariano Masiokas
Cristian Orrego
Ana Hernández
James McPhee
Pierre Pitte
Sebastián Krogh
David Farías-Barahona
Nevenka Bulovic
Iñigo Irarrázaval
Shelley MacDonell
Mauricio Zambrano-Bigiarini
Carlos Romero
Seasonal snow is a critical component of the water cycle in the Southern Andes of Chile and Argentina. Quantitative assessments of snow accumulation remain constrained by the scarcity, heterogeneity, and inconsistency of in situ observations, resulting in substantial uncertainties in mountain hydrological modeling. To address this gap, we compiled and quality-controlled snow depth observations to produce a consistent daily dataset from 81 stations between 21 and 54° S covering 2010–2024. Our quality-control procedure involved data compilation and preprocessing, followed by harmonization of snow depth observations, primarily by correcting the ground reference level relative to the soil surface during snow-free periods and removing anomalous spikes and observations outside physically plausible ranges. This process improved data reliability, increasing the Physical Consistency Index (PCI) from 87 % to 95 % at selected stations in the Maipo River Basin, while reducing the median number of days with data across stations by 23 % (from 1392 to 1074 d). The snow depth data availability increased from one station in 2010 to 57 stations in 2024, largely driven by the expansion of the monitoring network operated by the General Directorate of Water (DGA), Chile. However, this expansion remains spatially uneven across the Andean zones. The Mediterranean Andes have the largest number of stations (39), as well as the largest number of stations with highly complete records with 17 stations reaching 80 %–100 % data coverage, compared with only nine stations each in the Arid and Wet Andes, highlighting persistent spatial and temporal gaps. Using this newly quality-controlled dataset, we find that snow depth generally increases from the Arid to the Wet Andes in association with increasing precipitation, whereas its relationship with elevation is not consistently positive. The snow depth-elevation relationship is nonlinear in the Arid and Mediterranean Andes, with maximum observed snow depths at 4300 m a.s.l. in the Elqui River Basin and 3300 m a.s.l. in the Maipo River Basin. In contrast, the available observations indicate a positive snow depth-elevation relationship in the Wet Andes (Maule–Itata River Basin). However, these relationships should be interpreted in the context of the specific spatial and temporal conditions represented by the available observations. This open-access, quality-controlled snow depth dataset (https://doi.org/10.5281/zenodo.21577171, Medina and Caro, 2026) represents the largest and most complete collection of continuous snow depth observations for the Southern Andes and provides a basis for hydrological applications, reanalysis evaluation, and seasonal streamflow forecasting.
- Article
(11291 KB) - Full-text XML
- BibTeX
- EndNote
Seasonal snowpacks are a key component of mountain hydrology, storing winter precipitation and releasing water during the dry season, thereby sustaining downstream water resources (Stewart, 2009). Although snow accumulation generally occurs during winter, in tropical regions it can also occur during summer, in response to the seasonal precipitation regime (Caro et al., 2021). However, quantifying snow storage and its spatial variability remains challenging due to the limited availability and uneven distribution of in situ observations (Masiokas et al., 2020). This limitation is particularly pronounced in the Southern Andes (20–55° S), where long-term, quality-controlled observations of snow depth (SD) and snow water equivalent (SWE) remain scarce and fragmented across monitoring networks. In the Arid and Mediterranean Andes, the seasonal snowpack is a fundamental hydrological resource, providing water for human consumption and supporting ecosystems, agriculture, hydropower generation, and industrial activities (Masiokas et al., 2020).
The hydrological role of the seasonal snowpack varies across Andean climatic zones. In the Mediterranean Andes (31–36° S), seasonal and interannual streamflow variability of the main mountain rivers is primarily controlled by snowmelt, with secondary contributions from glacier melt and minimal influence from rainfall. As a result, river discharge exhibits a relatively simple unimodal regime, with peak flows occurring in late spring and early summer (Masiokas et al., 2016, 2019; Burger et al., 2019; Ayala et al., 2020). In contrast, in the Wet Andes (36–55° S), snowmelt accounts for approximately 26 % of the annual runoff (Krogh et al., 2015), and mountain rivers exhibit more complex seasonal patterns influenced by precipitation events throughout the year. Since 2010, the Arid and Mediterranean Andes have experienced a prolonged megadrought characterized by precipitation deficit and reduced snow accumulation (Garreaud et al., 2017, 2020). This has led to reduced river discharge, decreasing water availability and increased conflicts over water rights as demand increasingly exceeds supply (Rivera et al., 2016; Alvarez-Garreton et al., 2021). Although glacier melt has partially buffered streamflow reductions during the ongoing megadrought, sustaining runoff despite significant precipitation deficits, this compensatory effect is associated with accelerated ice loss. Its contribution is therefore expected to diminish in the future, potentially exacerbating water scarcity during prolonged dry conditions (Ayala et al., 2025; Caro et al., 2025).
SD and SWE are key variables for quantifying the hydrological contribution of the seasonal snowpack. While SWE is more directly related to water storage than SD, it is considerably more difficult to measure. SWE can be measured directly or estimated by combining SD with measured or modeled snow density values (Ntokas et al., 2021). Specifically, the end-of-winter spatial distribution of SD and SWE are crucial for forecasting spring and summer streamflow in high-mountain regions (Shaw et al., 2020a). However, because in situ snow observations are typically sparse and mostly located at low elevations, snow cover, SD, and SWE are commonly estimated using spatial extrapolation supported by satellite imagery and modeling approaches (Cornwell et al., 2016; Cortés and Margulis, 2017; Shaw et al., 2020a; Bulovic et al., 2025; Saavedra et al., 2026). In Chile, these limitations are further exacerbated for SWE, as observations are substantially more restricted than SD data in terms of spatial density and temporal coverage, with large data gaps. In Argentina, the number of stations reporting SWE data is also low, with most sites concentrated in the Dry Andes where snowmelt represents a crucial water resource for the adjacent lowlands. Regular daily SWE observations began in the early twenty-first century, although manual winter measurements from a limited number of snow courses date back to the early 1950s.
SD monitoring networks in the Southern Andes have expanded in recent years, increasing spatial coverage across a wider range of latitudes and elevations. In Chile, the growing demand for spatially distributed snow information has driven government agencies and private entities to expand these monitoring networks. The General Directorate of Water (Dirección General de Aguas, DGA) has consolidated national SD observations since 2010, while research institutions and universities, including the Centro de Estudios Avanzados en Zonas Áridas (CEAZA) and the Department of Civil Engineering at the Universidad de Chile (UdeChile), operate stations in the Arid and Mediterranean Andes. In the Wet Andes, monitoring efforts are led by the Centro de Estudios Científicos (CECs) and the Centro de Investigación en Ecosistemas de la Patagonia (CIEP). However, SWE observations from CEAZA, UdeChile, and CIEP are either unavailable or limited to short and discontinuous periods and, therefore, SWE records remain largely restricted to a small number of DGA stations. In Argentina, several institutions have expanded snow monitoring networks across the Andes, including the Instituto Argentino de Nivología, Glaciología y Ciencias Ambientales (IANIGLA), which has monitored SD variations near selected glaciers since 2014. Other institutions, typically responsible for water management at the provincial and regional levels, conduct SWE observations to support seasonal streamflow forecasts using automatic sensors (snow pillows, snow scales) and sporadic manual measurements at selected sites.
Publicly available SD data face challenges related to data acquisition, heterogeneous formats, and limited quality control, reducing their suitability for technical and scientific analyses. Existing regional studies of the Southern Andes (Cornwell et al., 2016; Cortés and Margulis, 2017; Bulovic et al., 2025), in situ observations are limited to only 12–26 sites. Considering all stations included in these studies, the interquartile range spans 32.4–34.8° S in latitude and approximately 2500–3600 m a.s.l. in elevation, indicating a strong concentration of observations at mid-elevations in central Chile–Argentina Andes. However, these datasets have been used to extrapolate SD and SWE conditions across a much broader region (29–44° S) of the Andes, encompassing climatically contrasting mountain basins and elevations well beyond those represented by the observation network (e.g., Bulovic et al., 2025), including high-elevation areas where seasonal snow accumulation is critical for sustaining downstream water resources during the dry season (Masiokas et al., 2020).
This limited spatial and elevational coverage introduces substantial uncertainty in characterizing how snow depth varies with elevation. While some studies in the Southern Andes report positive SD-elevation gradients from in situ observations (Cornwell et al., 2016; Cortés and Margulis, 2017), evidence from other mountain regions suggests more complex, non-linear relationships, with SD increasing toward a peak and decreasing at the highest elevations due to precipitation patterns and snow redistribution processes such as wind transport, sloughing, and avalanching (Grünewald et al., 2014). These contrasting findings highlight the lack of observational constraints at high elevations and limit our ability to robustly assess snow storage across elevation gradients in the Southern Andes.
Despite valuable progress in SD and SWE observations across the Southern Andes, estimating SWE from basin to regional scales remains challenging due to a restricted observational record. Latitudinal and elevational sampling biases limit the representativeness of current datasets, directly impacting the reliability of regional simulations. These challenges are exacerbated by the lack of a coordinated regional framework to date; no initiative has produced a homogenized quality-controlled SD dataset for the Southern Andes. This hinders our understanding of mountain hydrological processes and their variability across elevations and basins in the Southern Andes. It also limits hydrological model calibration and validation and increases uncertainty in climate change impact projections by hampering the generation of robust hydrological simulations, particularly for extreme years.
In this study, we provide the first daily, homogenized, quality-controlled SD dataset for the Southern Andes. The dataset covers 2010–2024 and integrates observations from automatic stations operated by government agencies, research centers, and universities across Chile and Argentina. Quality control was performed using a three-step Python-based algorithm. To illustrate its scientific utility, we further analyze snow depth–elevation relationships across river basins and climatic zones, addressing a key but still uncertain aspect of snow accumulation patterns in the Andes. This comprehensive and consistent dataset provides an observational basis for improving model calibration and seasonal streamflow forecasting, and for strengthening short- and long-term projections of water availability at local and regional scales under climate change scenarios.
The Southern Andes can be divided into three major climatic zones: the Arid, Mediterranean, and Wet Andes (Saavedra et al., 2017; Sarricolea et al., 2017; Caro et al., 2021). These zones are shown in Fig. 1 across the study area (21–54° S), together with the distribution of the SD stations analyzed in this study. In the northern Arid Andes, precipitation predominantly occurs during autumn (MAM) and winter (JJA). However, in its northernmost sector, significant precipitation also occurs during the austral summer (DJF), associated with the Bolivian Winter. At high elevations, air temperatures typically can remain below freezing for several months, reaching minimum values of −29 °C at Guanaco Glacier (5324 m a.s.l., 2008–2011) (MacDonell et al., 2013). The Mediterranean Andes encompass the most densely populated areas of Chile (65 % of the country's total population from the Valparaíso to Ñuble regions, INE, 2024), as well as 74 % of the country's agricultural land, and also support the country's main electricity generation (INE, 2022). Further south in the Wet Andes, the mountain range transitions to a wetter climate influenced by Pacific frontal systems. Although mean monthly precipitation also peaks in autumn–winter, it remains substantial through spring–summer (SON–DJF), exceeding 150 mm per month at the Lago Vargas station (1977–1991) (Dussaillant et al., 2012). Across Chile and Argentina, persistent snow cover, defined as areas where seasonal snow remains on the ground for several months each year, covers approximately 34 370 km2 between 29 and 36° S (Saavedra et al., 2018). Mountain river basins in Chile generally drain westward to the Pacific Ocean, whereas those in Argentina drain eastward to the Atlantic Ocean. Hydrological regimes also vary latitudinally. Southern basins are dominated by winter precipitation, with secondary contributions from spring snowmelt, producing a pluvio-nival regime. In contrast, northern basins rely mainly on spring and early summer snowmelt and, particularly on the Chilean side, to a lesser extent on winter precipitation, resulting in predominantly nival to nivo-pluvial regimes (Masiokas et al., 2019). These spatial patterns are governed by large-scale atmospheric circulation, as well as by latitudinal gradients, elevation, and local physiographic controls.
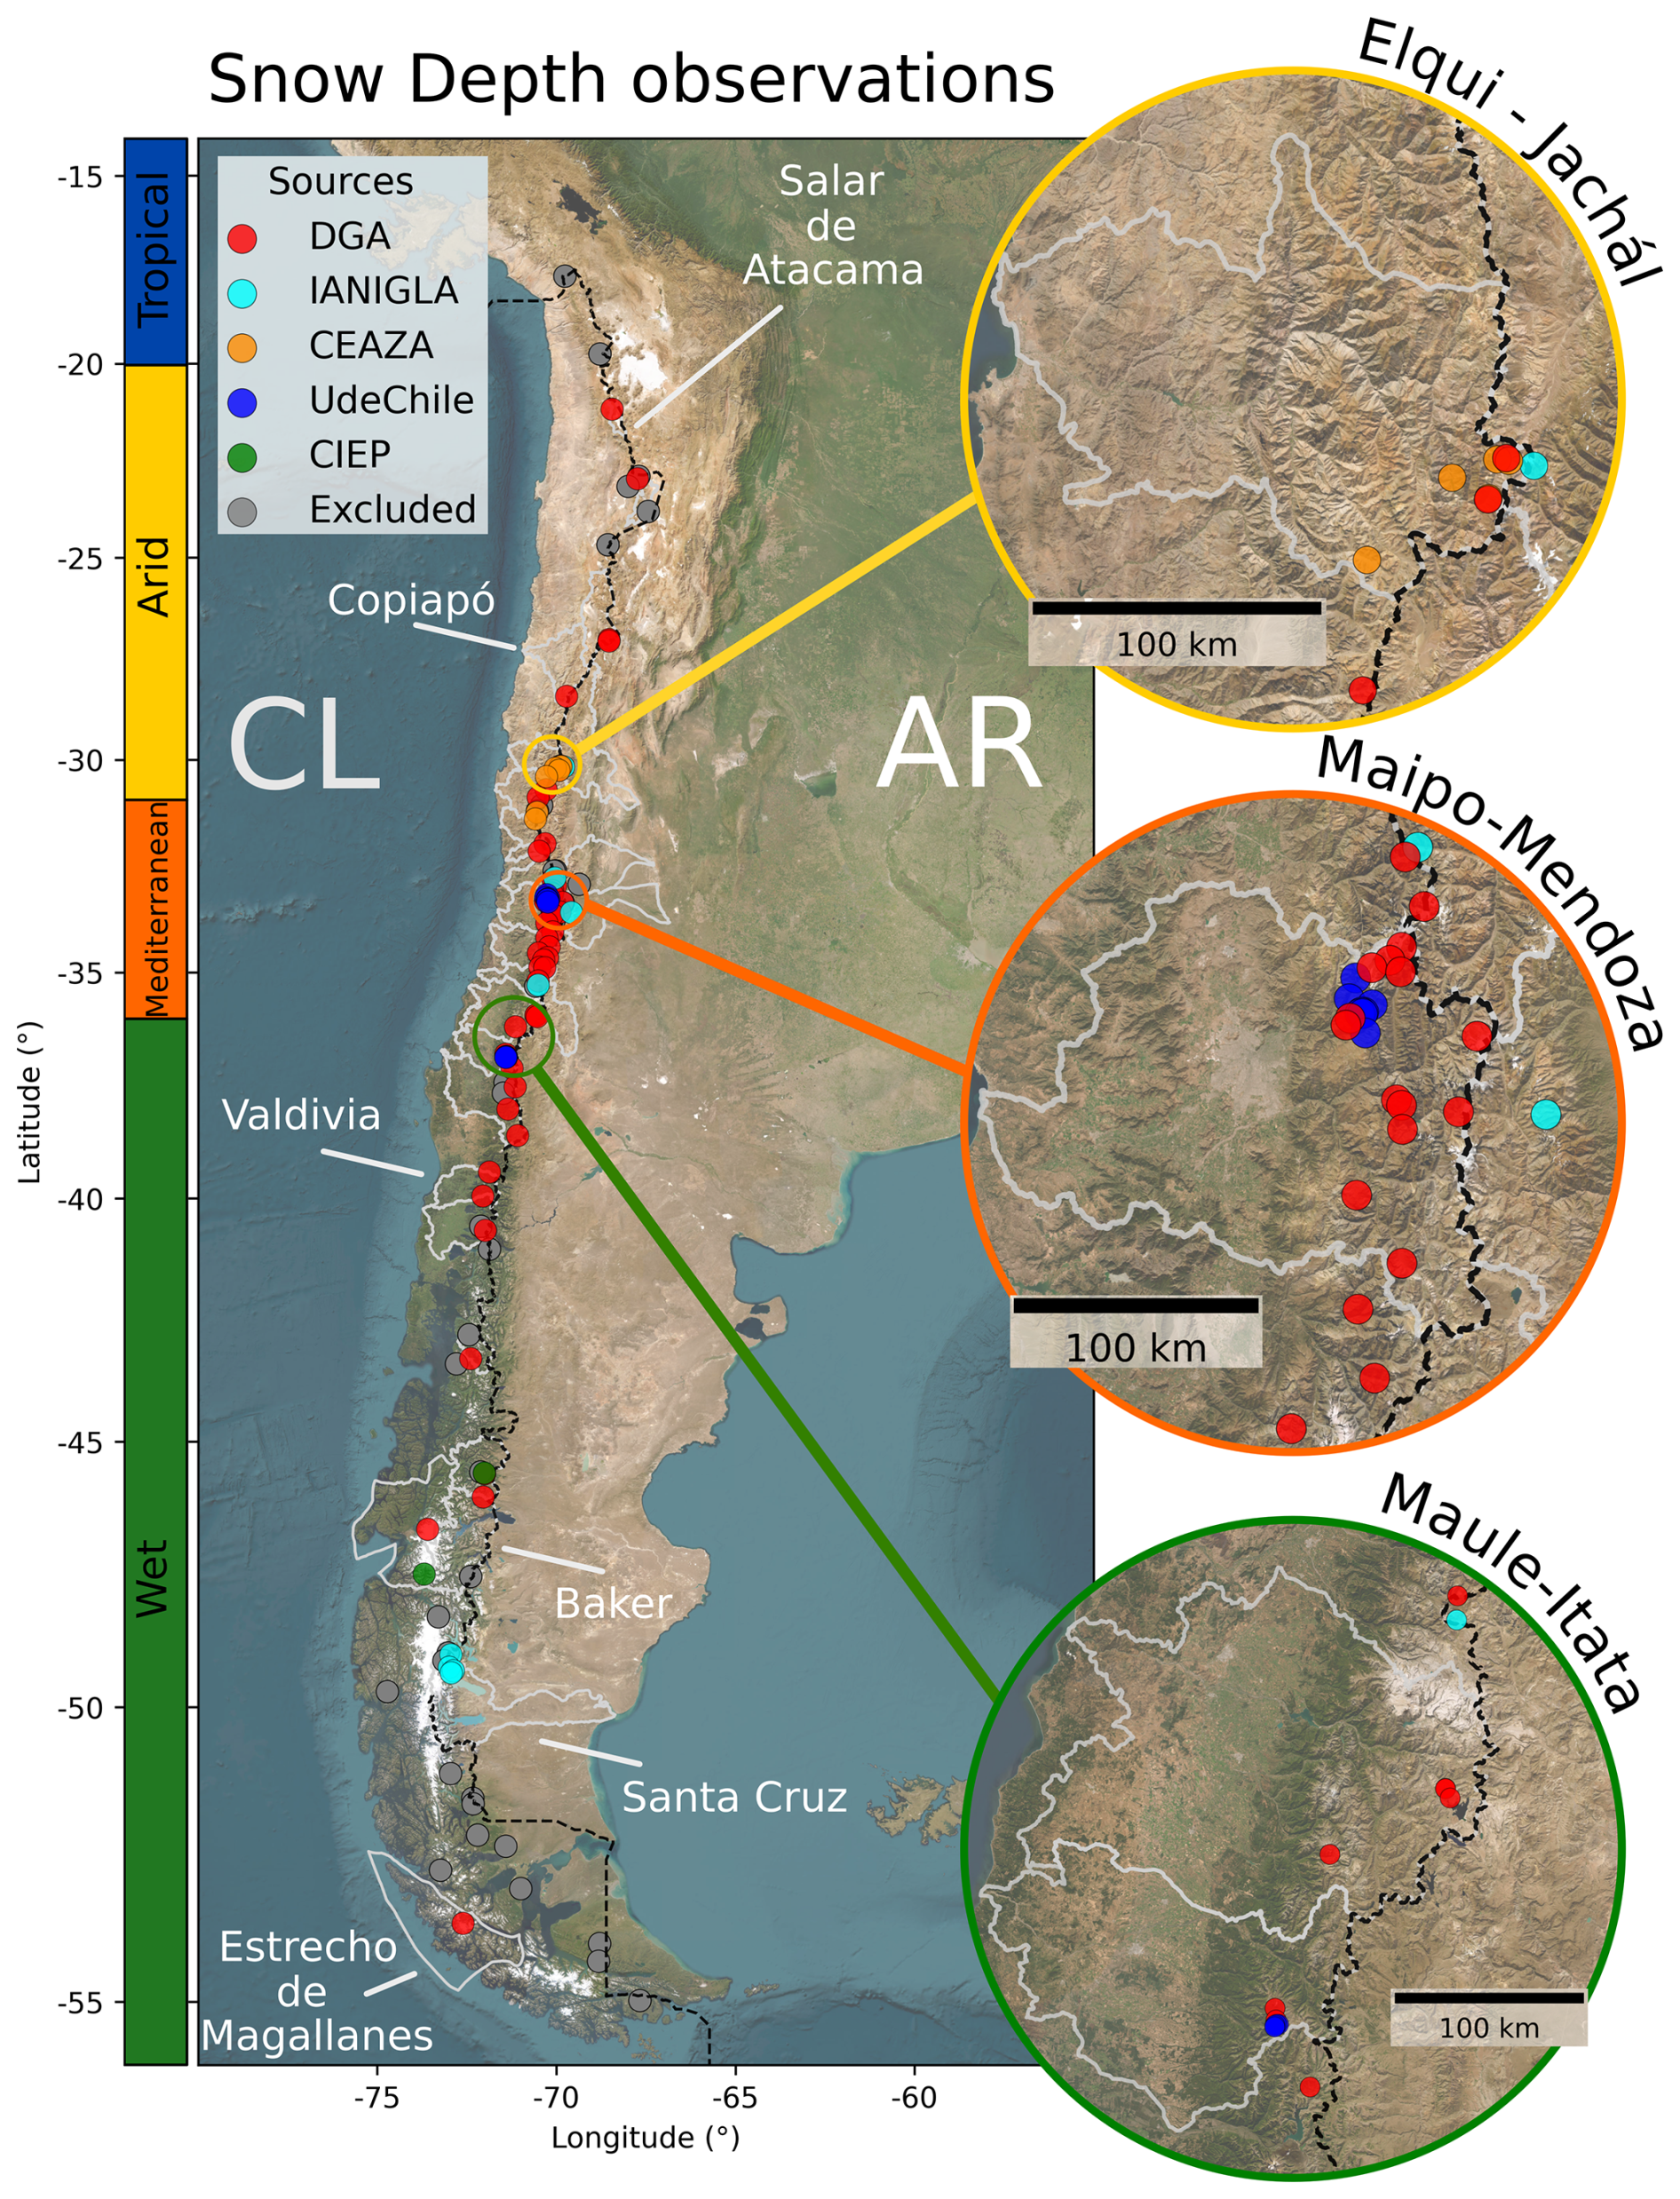
Figure 1Spatial distribution of the 81 snow depth stations retained after quality control across 26 river basins and three Andean climatic zones (Arid, Mediterranean, and Wet). Station locations are identified according to the contributing institutional networks (DGA, IANIGLA, CEAZA, UdeChile, and CIEP), together with the 37 stations excluded during the quality-control procedure. The Elqui–Jáchal, Maipo–Mendoza, and Maule–Itata river basins, located in each climate zone, are analyzed in greater detail in subsequent sections. Basemap imagery: Esri World Imagery © Esri, Maxar, Earthstar Geographics, and the GIS User Community | Powered by Esri.
The complete data-processing and quality-control workflow is summarized in Fig. 2. This procedure comprises three sequential steps, ranging from data compilation (Step 1) to harmonization of observations (Step 3). The resulting dataset was subsequently evaluated using an independent cross-variable validation based on concurrent snow depth, precipitation, and air temperature observations. Finally, SD-elevation relationships were analyzed at the river-basin scale.
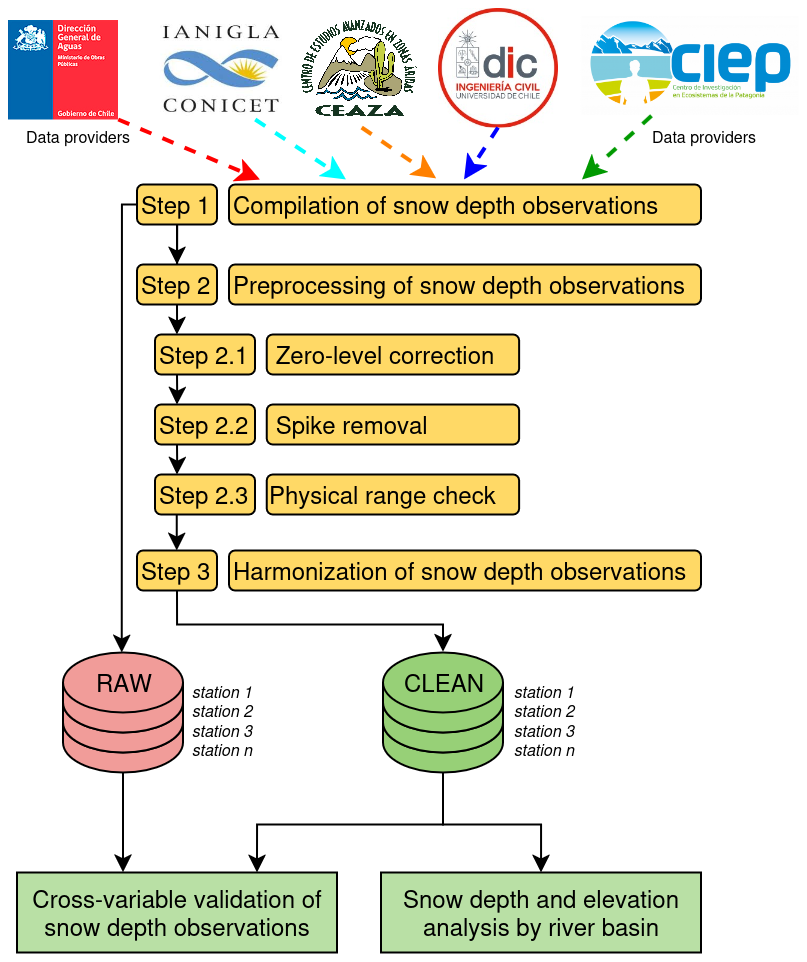
Figure 2Workflow of the data processing and quality-control procedure applied to the 2010–2024 snow. The logos at the top indicate the institutional networks that contributed the snow depth observations used to develop the final quality-control dataset.
3.1 Step 1 – Compilation of snow depth observations
This study compiled SD observations from 118 stations distributed across the Southern Andes (17–55° S), including both hourly and daily records, although hourly observations were not available at all stations. In addition, precipitation (Pr) and air temperature (AT) data were compiled to assess the physical consistency of the SD records at stations located in the Elqui and Maipo river basins (Table 3). Data were obtained from DGA, CEAZA, UdeChile, and CIEP in Chile, and from IANIGLA in Argentina.
SD observations were obtained either through direct requests or by downloading publicly available datasets. The original data for Chile are available from https://snia.mop.gob.cl/BNAConsultas/reportes (last access: 11 December 2025) (DGA), https://www.ceazamet.cl/index.php?pag=mod_mapa&p_cod=ceazamet (last access: 11 December 2025) (CEAZA), http://190.121.23.217/index_cdataaysen.php (last access: 11 December 2025) (CIEP) and Huerta et al. (2019). The data available for Argentina were provided by IANIGLA and is partially available from https://observatorioandino.com/estaciones/ (last access: 11 December 2025). Given the heterogeneous structure of these sources, the data were reorganized into a tabular format, with each column representing a monitoring station and each row containing the daily mean values for SD. This initial data compilation was consolidated into a single raw data file.
3.2 Step 2 – Preprocessing of snow depth observations
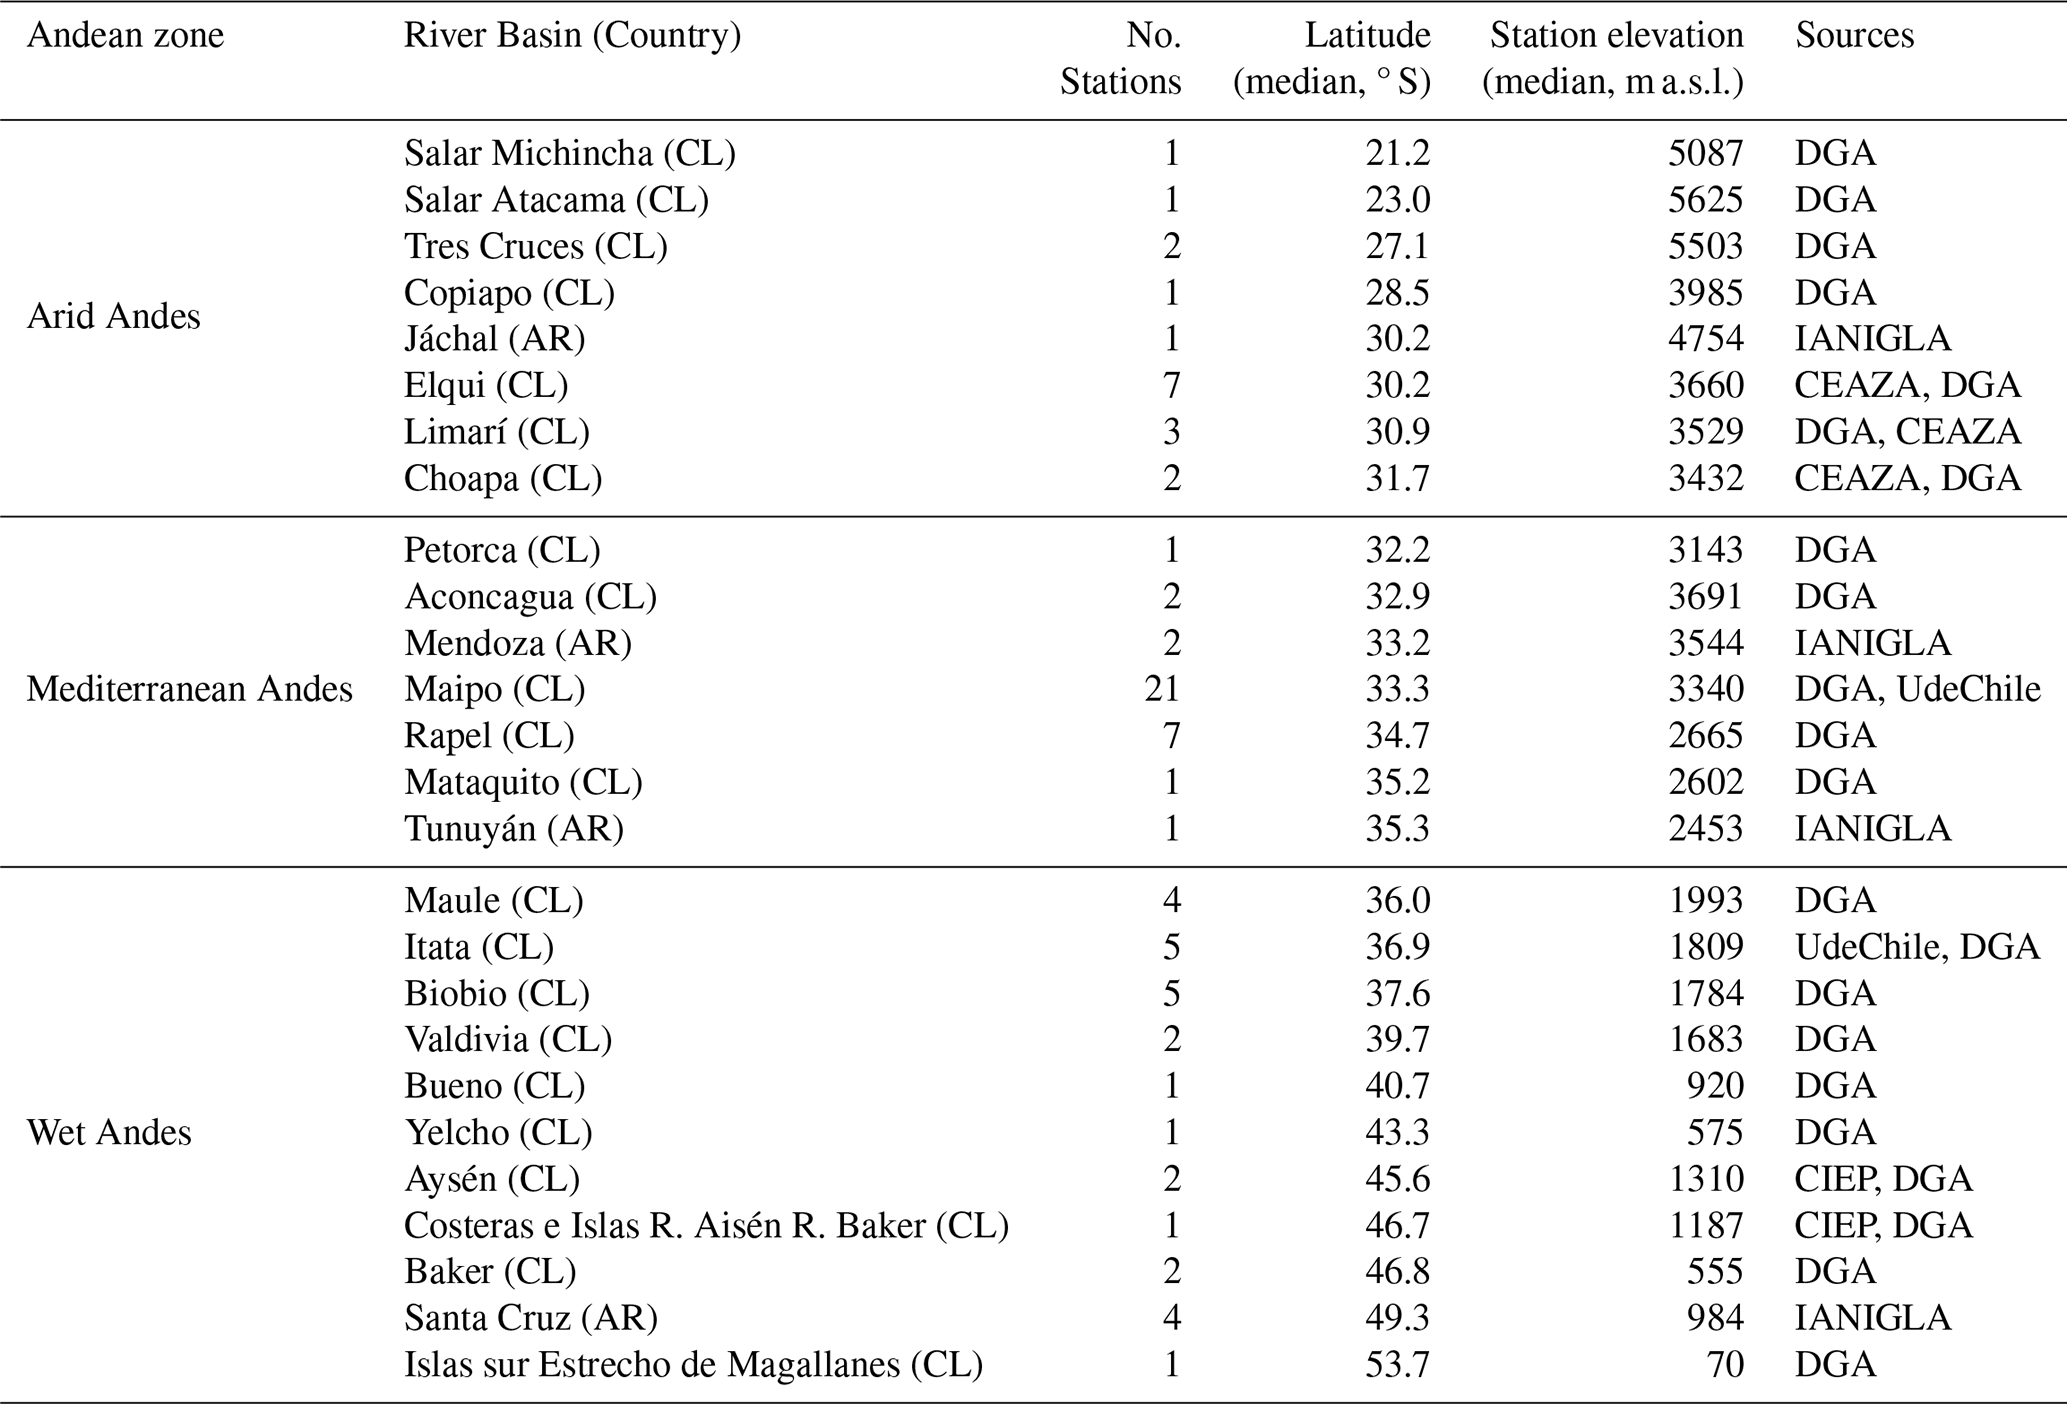
An initial visual screening was conducted to identify and exclude stations with records unsuitable for subsequent quality control and analysis based on the following criteria: (i) insufficient monthly data availability (less than 50 % of daily observations), and (ii) insufficient annual coverage (fewer than three months with available data during the snow season, from May to October). In addition, several stations were excluded because their records only became available in late 2025 or 2026. Following this procedure, 81 of the 118 stations with SD observations were retained, providing coverage across the Andes between 21 and 54° S. The selected stations span elevations from 30 to 5804 m a.s.l., with records covering the period 2010–2024. Table 1 summarizes the main characteristics of the compiled SD dataset aggregated by river basin, while metadata for the selected and excluded stations are provided in Tables A1 and A2, respectively.
Table 1Characteristics of snow depth stations by river basin across the Southern Andes (21–54° S). CL and AR refer to Chile and Argentina, respectively.
A series of automated algorithms implemented in Python using Pandas library (The pandas development team, 2025) were applied to perform three quality-control procedures: adjustment of the ground reference level (Step 2.1, Zero-level correction), corresponding to the soil surface established after sensor installation or maintenance; removal of anomalous spikes (Step 2.2, Spike removal); and identification and removal of implausible or physically unrealistic values (Step 2.3, Physical range check). For these automated procedures, parameters and thresholds were calibrated at the river-basin scale to account for regional SD variability and ensure physical consistency across stations sharing similar climatic environments. In addition to this basin-level processing, a supplementary manual filtering step was applied on a station-by-station basis.
3.2.1 Step 2.1 – Zero-level correction
This step realigns the ground reference level to account for instrumental drift during snow-free periods. The algorithm detects stable periods using a moving-window range (the difference between maximum and minimum SD) with a 0.5 cm stability threshold. Window lengths were calibrated by river basin (3–5 d; median: 5 d) to balance sensitivity to instrumental drift against short-term SD variability. From these stable windows, we defined a “validated offset” as the calculated displacement from the ground reference level. To protect actual shallow snow records, windows with median values exceeding a 5 cm snow threshold are preserved and not used for correction. Stable windows with median SD > 5 cm were excluded from offset estimation to avoid misclassifying shallow, persistent snow as instrumental drift. The 5 cm threshold was selected conservatively to exceed both nominal sensor noise (±1 cm) and typical surface–roughness effects (2 cm). If the validated offset is very small (within 0.3 cm), it is treated as noise and set to zero. Finally, to maintain data continuity, this offset is subtracted from subsequent observations only if the drift exceeds a 0.3 cm tolerance. Although sensor accuracy is ±1 cm (https://www.campbellsci.com/products/sr50at, last access: 1 March 2026), our use of daily averages from high-frequency (hourly) observations over multi-day windows dampens random noise. This reduction in variance justifies the stricter 0.3 cm threshold, enabling the detection of subtle systematic shifts that would otherwise be obscured by instrumental error.
In addition, the SR50A sensors, which have been widely used across stations in Chile and Argentina, have recently begun to be replaced at some stations by a newer generation of sensors with higher measurement precision. The sensor used at each station is indicated in Table A1.
3.2.2 Step 2.2 – Spike removal
To identify and remove isolated spikes in the daily mean SD time series, the median absolute deviation (MAD, Rousseeuw and Croux, 1993) was applied using a centered moving window. The window size (ω) was adjusted for each basin within a range of 3 to 15 d to account for local SD variability. Shorter windows increase sensitivity to local anomalies in stable snowpacks, whereas longer windows provide a more robust baseline under highly variable conditions. For the Arid Andes, window sizes typically ranged from 3 to 9 d (median: 3), while the Mediterranean and Wet Andes required longer windows (ranging from 6 to 15 d and 9 to 15 d, respectively) to obtain a robust moving median under greater SD variability. For a given day t, the MAD is calculated as:
where SDi represents the daily observation within the sliding window ω centered at day t, and is the median of that window.
A daily observation was flagged as a spike and removed if it met either of two independent criteria. The first criterion evaluated deviations from the window median using a scaling factor, k. Conceptually, k acts as a tolerance threshold that defines the acceptable range of natural variability around the median. Because snow accumulation is inherently irregular, k was adjusted to balance the removal of instrumental errors with the preservation of true snowfall events. This adjustment was determined through expert judgment, integrating visual inspection of time series with local knowledge of station-specific signal-to-noise ratios and SD variability. In this context, a lower k value provides a stricter filter for noise removal, while a higher k value is more permissive to accommodate natural variability and ensure that extreme physical signals are not erroneously discarded. Across the study area, k values ranged from 4 to 7, with median values calculated across basins being 4 in the Arid and Mediterranean Andes and 6 in the Wet Andes. To avoid inadvertently removing true extreme snowfall events, this criterion required that any suspected spike exhibit clear discontinuities () relative to both adjacent days. Additionally, the absolute difference between the two adjacent days had to remain small (), confirming that the event represented an isolated anomaly rather than a sustained change in SD. The second criterion acted as an absolute physical filter. Regardless of MAD, an observation was removed if the absolute difference relative to both adjacent days exceeded a basin-specific threshold representing an implausibly large day-to-day change in SD. These thresholds were established through expert judgment based on visual inspection of station records, physical plausibility, and inter-station consistency within each basin. Given the steep latitudinal precipitation gradient across the Andes, threshold values ranged from 20 to 150 cm (median: 50 cm) in the Arid Andes, 100 to 200 cm (median: 100 cm) in the Mediterranean Andes, and 60 to 350 cm (median: 140 cm) in the Wet Andes.
3.2.3 Step 2.3 – Physical range check
A physical range filter was applied to the SD time series at each station.
Lower and upper plausible thresholds were defined for each river basin based on station elevation, regional climatology, and expert knowledge. Observations below the ground reference level (defined in Step 2.1) were set to zero, whereas values exceeding the upper physical thresholds were considered implausible and removed. The median physical limits for basins were 0–140 cm in the Arid Andes, 0–360 cm in the Mediterranean Andes, and 0–300 cm in the Wet Andes. In some stations, the lower threshold in the Mediterranean and Wet Andes was set to 2 cm to account for sensor noise (±1 cm) and local surface roughness (e.g., low vegetation or rocky terrain). Setting these near-zero values to zero prevents instrumental and surface-related noise from being misinterpreted as shallow snow accumulation.
3.3 Step 3 – Harmonization of snow depth observations
When overlapping daily SD observations exist for the same station due to data being compiled from multiple sources, a single unified time series is constructed. For example, the DGA dataset for some stations may include multiple versions of the same SD observation, arising either from data updates or from the incorporation of post-processed information obtained from external sources for specific stations (e.g., universities or other monitoring agencies). This step is particularly important for any future updates of the quality-controlled SD dataset, as revised data releases from the original data providers may contain different observations for the same station and date than those included in earlier versions. Such differences may arise from technical decisions by data providers or from sensor replacements affecting SD observations.
The output of this step is a cleaned SD file that preserves the structure of the original raw SD dataset while containing quality-controlled values for each monitoring station.
3.4 Cross-variable validation of snow depth observations
A multivariable validation procedure was applied to assess the physical consistency of both raw and quality-controlled SD observations. The analysis was restricted to stations in the Elqui and Maipo River Basins where daily observations of SD, Pr, and AT were simultaneously available at the same station during the May–October period, corresponding to the snow accumulation season in the Southern Andes (Masiokas et al., 2020; Bulovic et al., 2025). The approach is based on the joint physical consistency among these variables. Snow accumulation, defined as a positive day-to-day change in SD (positive ΔSD), is expected to occur during precipitation events under sufficiently cold air temperature conditions. In contrast, snow ablation (negative ΔSD) may result from multiple processes (e.g., melt, sublimation, compaction, or wind redistribution), which are not directly observed at most weather stations. Accordingly, the validation was restricted to snow accumulation events.
We developed and implemented a new Physical Consistency Index (PCI) to classify each day as physically consistent (ϕi=1) or inconsistent (ϕi=0), following a multivariable framework inspired by the Perkins Skill Score (PSS, Perkins and Jones, 2008) and the Automated Quality assurance of daily surface observations procedures (AQ, Durre et al., 2010). This procedure filters the record to identify the robust snowfall signals that collectively constitute the index denominator (N). First, to mitigate measurement noise, a station-specific threshold (τ) was established as the 5th percentile of the positive ΔSD distribution, with a minimum of 1 cm to align with sensor accuracy. A day was retained as a potential snow accumulation event only when ΔSD > τ; consequently, all other observations, including negligible shifts (ΔSD ≤τ), stable snowpacks (ΔSD = 0), and ablation periods (negative ΔSD), were excluded from the denominator to ensure the index targets active snowfall signals. Second, to ensure physical consistency during snow accumulation events, we retained only days with measurable precipitation (Pr > 1 mm), thereby reducing uncertainties associated with gauge undercatch and wind–driven snow redistribution. For these events, an air temperature threshold (ATrain) was defined as the station-specific 95th percentile of AT to account for the large climatic variability across the Andes. A fixed usual threshold (e.g., 0–2 °C) was not adopted because the air temperature associated with snowfall varies substantially with local conditions. Using a station-specific percentile therefore provides a locally adapted threshold that better represents the upper temperature limit at which snowfall is still observed at each station. For example, the median air temperature threshold ranged from −3.2 to 2.2 °C (median: −2.2 °C) in the Elqui River Basin and from −3.8 to 3.8 °C (median: −1.5 °C) in the Maipo River Basin. Accumulation days with AT exceeding this threshold were classified as physically inconsistent (ϕi=0), whereas those with AT below the threshold were considered physically consistent and retained as valid snow accumulation signals (ϕi=1). The threshold is therefore intended to identify potential outliers in the observed snow accumulation signal rather than to represent a physically derived rain–snow transition temperature.
The PCI for each station was calculated as the ratio between the number of physically consistent snow accumulation days (ϕi=1) and the total number of identified snow accumulation days with Pr > 1 mm. This multivariable equation specifically targets the consistency of precipitation driven accumulation. By excluding days without precipitation from the denominator we minimize uncertainties associated with wind driven snow redistribution and instrumental noise, which do not represent true snowfall signals. This index is defined in Eq. (2), where ϕi is a binary consistency indicator for each day i, taking a value of 1 for physically consistent conditions and 0 otherwise.
where ϕi is the consistency indicator for each i daily snow accumulation day, defined as:
While the PCI provides a relative measure of the physical consistency of snow accumulation events, its interpretation in isolation can be misleading. As a ratio, highly noisy raw SD observations may artificially inflate PCI values, in some cases making them comparable to or even higher than those derived from the quality-controlled SD dataset. To complement the PCI, two additional metrics were developed in this study and computed using the same event definition and filtering criteria described in Eq. (2). First, the Net Inconsistency Reduction (ΔE) is defined in Eq. (3) as the difference between the number of physically inconsistent days detected in the raw (Nraw) and quality-controlled SD datasets (NQC), with positive values indicating a reduction in inconsistencies. Second, the Noise Ratio (NR) is defined in Eq. (4) as the proportion of the total number of apparent accumulation events detected in the raw dataset (Nevent, raw) to the number of events retained after quality-control (Nevent, QC). The interpretation of this metric allows for three scenarios: (1) NR > 1 indicates that the quality-control procedures up to Step 3 effectively identified and removed spurious positive SD spikes, revealing the presence of noise or measurement artifacts in the raw SD dataset; (2) NR = 1 suggests a high–quality raw record where no events were removed or recovered; and (3) NR < 1 indicates signal recovery, where the cleaning algorithm or manual quality control allowed the identification of valid accumulation events that were previously obscured or incorrectly recorded in the raw data. For example, a station with NR = 2.0 has had half of its raw accumulation signals removed as noise, whereas a station with NR = 0.5 has doubled its count of valid events through the correction of systematic errors.
The validation was restricted to the Elqui and Maipo River Basins because these basins provide suitable conditions for evaluating the physical consistency of snow accumulation using concurrent SD, Pr, and AT observations. In particular, they contain stations with overlapping observations of the three variables and sufficient altitudinal coverage to evaluate snow accumulation under contrasting meteorological conditions. These characteristics are essential for applying the proposed multivariable validation consistently across stations and for reducing the influence of spatial sampling limitations. The validation could not be extended to other regions, particularly the Wet Andes, because the availability of concurrent SD, Pr, and AT observations is more limited and unevenly distributed along the elevation gradient. This limitation is particularly evident for SD in the Maule–Itata basins, as shown later in the study.
3.5 Snow depth and elevation analysis by river basin
Due to the limited temporal continuity of SD observations across stations located at different elevations and in different river basins for the same dates, the observations were grouped into three precipitation year types. Based on precipitation records from the General Directorate of Water (DGA) and the Dirección Meteorológica de Chile (DMC), we identified, for three basins, years representative of different ranges of total annual precipitation: dry [0th to 30th percentile], normal (30th to 70th percentile], and wet (70th to 100th percentile] (Table A3). For this classification, precipitation records were obtained from relatively high-elevation stations within each basin to better represent mountain precipitation conditions. Specifically, we used the La Laguna Embalse station (3160 m a.s.l.) in the Elqui River Basin, 19 stations in the Maipo River Basin, and the Diguillín (670 m a.s.l.), Río Diguillín en San Lorenzo–Atacalco (727 m a.s.l.), and Las Trancas stations (1242 m a.s.l.) in the Maule–Itata River Basin. These basins were selected because they contain a sufficient number of SD observations spanning a broad elevation range.
A positive correlation between elevation and precipitation is generally expected, reflecting the influence of orographic enhancement of precipitation (Scaff et al., 2017). In contrast, mean air temperature is expected to exhibit a negative correlation with elevation, with lower mean temperatures typically observed at higher elevations (Voordendag et al., 2021; Aguayo et al., 2024; Caro et al., 2024). To quantify the combined influence of these elevation-dependent processes, the SD-elevation relationship was analyzed using the 25th, 50th, and 75th percentiles, as well as the cumulative distribution function (CDF), across three precipitation year types, providing a robust basis for comparing SD across elevations and contrasting climate conditions in the Andean zones.
To analyze the SD-elevation relationship, only stations with at least 70 % of daily SD data availability per month during the accumulation period (1 May to 31 October) were retained (Alvial Vásquez et al., 2020; Cordero et al., 2024), and elevation was derived from the 30 m SRTM digital elevation model (Farr et al., 2007). This approach enabled consistent comparison of SD observations across elevations within each precipitation year type. Additionally, the median July snow line elevation, together with its 25th percentile, was estimated for these three river basins using satellite-derived snow persistence for the period 2000–2024 to provide a reference for evaluating the elevational distribution of the SD observations. July corresponds to the month with the lowest snow line elevation in the year.
Monthly snow persistence was derived from daily MODIS Terra and Aqua snow products (MOD10A1/MYD10A1, Collection 6.1; 500 m spatial resolution), processed in Google Earth Engine and reported by Saavedra et al. (2026). Snow presence (1) and absence (0) were defined using a normalized difference snow index (NDSI) threshold of 0.4. Elevation was extracted from the same digital elevation model described above. Following Saavedra et al. (2026), the snow line elevation was defined as the 5 % snow persistence contour. Its elevation was then estimated by intersecting this contour with the DEM and calculating the median elevation of the intersecting pixels.
4.1 Spatial and temporal distribution of snow depth observations across the Southern Andes
SD observations are available from 81 stations distributed across 26 river basins between 21 and 54° S, for the period 2010–2024. The Mediterranean Andes contain the largest number of stations (37 stations in 7 basins), followed by the Wet Andes (28 stations in 11 basins) and the Arid Andes (16 stations in 8 basins). The number of stations with available SD observations increased markedly over the study period. From 2015 onwards, the number of stations reporting SD data increased substantially, with a relatively steady growth until 2022, followed by relative stabilization through 2024. Over the full study period, the DGA contributed the largest number of stations (52 stations), followed by the UdeChile (12 stations), IANIGLA (eight stations), CEAZA (seven stations), and the CIEP (two stations). These institutions exhibit distinct spatial coverage patterns. The DGA and IANIGLA provide the broadest geographical coverage across Chile and Argentina, respectively. In contrast, CEAZA is concentrated in the Elqui, Limarí, and Choapa River Basins within the Arid Andes; the UdeChile contributed stations mainly in the Mapocho and Itata River Basins across the Mediterranean and Wet Andes; and the CIEP is focused on the Aysén and Baker River Basins in the Wet Andes.
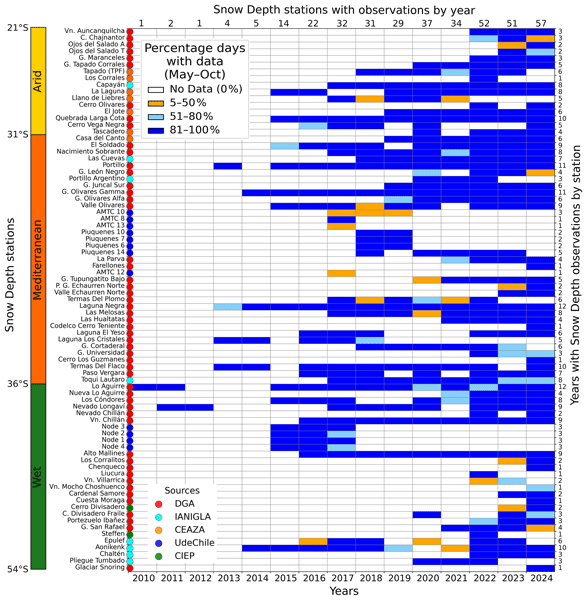
Figure 3 presents the years with SD observations across the 81 stations of our final quality-controlled snow depth dataset, considering records from May to October over the period 2010–2024. Prior to 2015, SD observations were sparse and almost exclusively provided by the DGA, with only eight stations reporting data, predominantly located in the Mediterranean Andes (five stations). Between 2015 and 2022, the network expanded considerably from 14 to 52 stations with SD observations. This increase is still concentrated in the Mediterranean Andes (24 stations), largely driven by DGA, but also reflects the incorporation of additional data sources, including UdeChile (eight stations) and IANIGLA (three stations). In parallel, the Arid Andes showed a notable increase in coverage, from zero stations prior to 2015 to 12 stations, mainly operated by DGA (six stations) and CEAZA (five stations). In contrast, the Wet Andes remain comparatively underrepresented throughout this period, with the stations reporting SD observations increasing from seven in 2015 to 16 in 2022, despite their substantially larger spatial extent relative to the other Andean zones.
During 2023–2024, the SD observational network reached its maximum spatial extent, with up to 57 stations reporting SD observations in 2024 across the Andes. This expansion is primarily driven by a substantial increase in stations operated by DGA in both the Arid and Wet Andes. In 2024, 25 stations report SD observations in the Mediterranean Andes, of which 22 are operated by DGA, while two stations correspond to IANIGLA and one to CEAZA. In the Arid Andes, 13 stations report SD observations, of which nine are operated by DGA. In the Wet Andes, 19 stations report SD data, with 16 operated by DGA. By 2024, the DGA played a dominant role in the recent expansion of the SD monitoring network, including the incorporation of SD observations at the northernmost and southernmost limits of the Southern Andes.
In addition to the expansion of the SD observational network in 2024, further observational potential arises from stations recently installed or upgraded during 2025 and 2026, as well as from stations currently affected by measurement inconsistencies that are expected to be resolved in the near future (Table A2). This indicates that the availability of SD observations is likely to continue increasing beyond the period analysed here. Conversely, a subset of stations corresponds to short-term deployments associated with specific research projects. These stations typically provide observations over limited time windows and contribute to characterizing SD conditions during particular years only. As such, they fall outside the core long-term monitoring network, which is primarily sustained by the DGA and IANIGLA.
In terms of SD data availability, Fig. 3 also shows the percentage of days with data from 0 % to 100 % in the period May to October. Across the 81 stations of our final SD dataset, the year-by-year analysis of data availability reveals marked differences among the Arid, Mediterranean, and Wet Andes in terms of both data completeness and temporal continuity. In the Arid Andes, only six stations achieve high data availability, with SD observations covering 80 %–100 % of days per year for at least five years. Among them, Quebrada Larga (DGA) and La Laguna (CEAZA) exhibit the highest data availability, followed by Capayán (IANIGLA). The number of stations achieving 80 %–100 % annual data availability increases markedly to 17 in the Mediterranean Andes. The highest data availability corresponds to DGA stations, with continuous 11 year records at Laguna Negra and Olivares Gamma, followed by Portillo station. These stations also exhibit the longest temporal coverage, in addition to the Laguna Los Cristales and Termas del Flaco stations. Further south, in the Wet Andes, only six stations achieve 80 %–100 % annual data availability for at least five years. Among them, Lo Aguirre (DGA) stands out as the station with the longest record in the Southern Andes, beginning in 2010, followed by Nevado de Longaví (DGA) in 2011 and Aonikenk (IANIGLA) in 2014. Notably, continuous records of at least nine years are observed at Volcán Chillán and Alto Mallines stations.
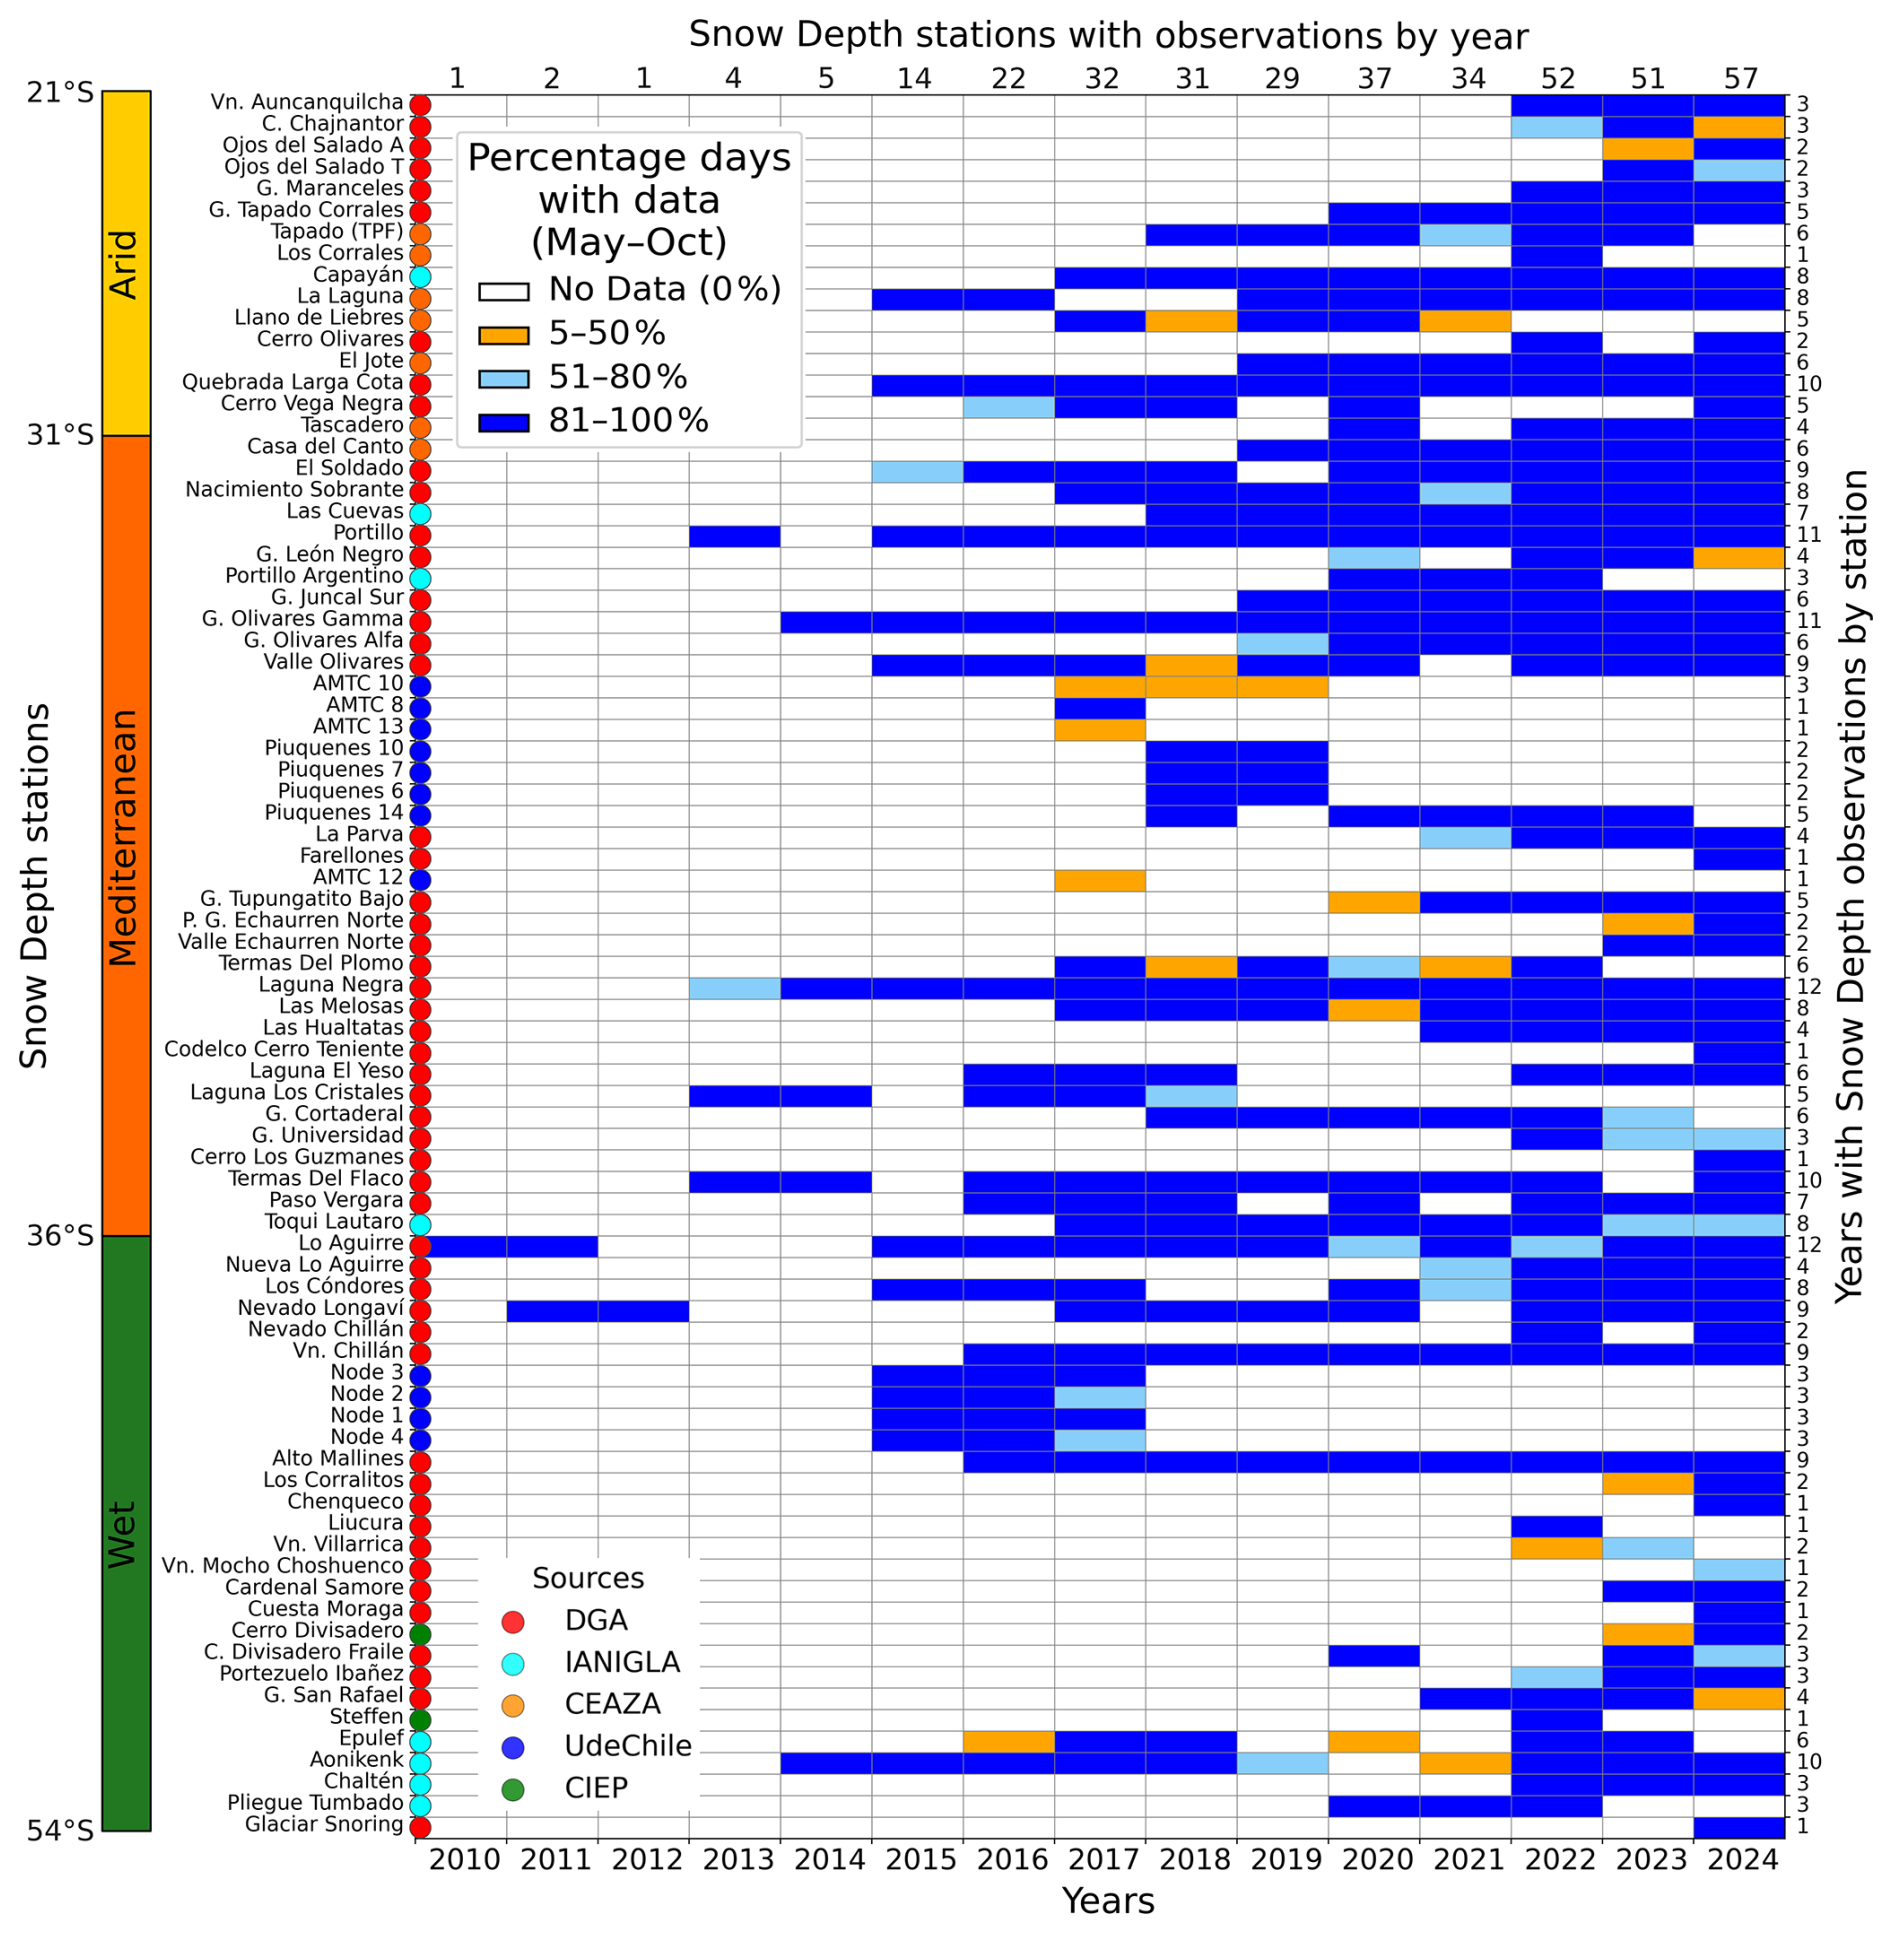
Figure 3Availability of quality-controlled daily snow depth observations for the 81 selected stations in Chile and Argentina (21–54° S) from 2010 to 2024. Stations are ordered latitudinally from north to south. Cell colors represent the annual availability of daily observations during the May–October snow season, classified from no data to high data availability. Colored circles beside each station indicate the institutional network from which the observations were obtained.
Figure 4 presents the daily SD observations in selected stations along the Southern Andes for the 2010–2024 period. SD observations show a consistent increase from the arid to the wet zones of Chile, in agreement with the corresponding gradient in total precipitation (Sarricolea et al., 2017). In the Arid Andes, north of 27° S, the high-elevation stations of Ojos del Salado and Cerro Chajnantor (both above 5600 m a.s.l.) exhibit limited seasonal snow depth, with most accumulation occurring during the austral summer. In contrast, Tapado station (30° S, 4300 m a.s.l.), located further south, shows larger snow accumulation predominantly during the winter season. This contrast highlights a marked difference in the seasonal timing of snow accumulation within the same Andean zone. In the Mediterranean Andes, stations located in the Aconcagua and Maipo River Basins exceed 200 cm of SD, with Las Melosas station (33° S, 3300 m a.s.l.) reaching values above 300 cm. Despite the high precipitation that occurs in the Wet Andes (Sarricolea et al., 2017), the possible predominance of rainfall over snowfall, combined with warmer mountain temperatures compared to those observed further north during the winter months, limits snow accumulation. As a result, SD values during recent years are close to 200 cm at the Volcán Chillán station (37° S, 2000 m a.s.l.), and reach around 150 cm east of the Southern Patagonian Icefield at the Aonikenk station (49° S, 1200 m a.s.l.).
A clear west–east gradient is observed across the Arid and Mediterranean Andes, with higher SD values on the western side compared to the eastern side. This pattern is consistent with the stronger influence of Pacific moisture on the western slopes (Viale and Nuñez, 2011). In the Arid and Mediterranean Andes, at latitudes where both Chilean and Argentine SD stations are available, stations located on the western side of the Andes show higher SD values than those on the eastern side. For example, stations in the Elqui River Basin present SD values exceeding 50 cm between 2018 and 2021, whereas stations in the Jáchal River Basin rarely exceed this threshold, even for stations located above 4000 m a.s.l. (Tapado TPF and Capayán). A similar pattern is observed in the Aconcagua and Maipo river basins compared to the Mendoza River Basin. However, this contrast in snow accumulation is not evident in the Wet Andes, where San Rafael station located on the western side of the Andes and Cordón Divisadero and Aonikenk stations located on the eastern side show similar SD values during 2022–2024, at latitudes where the occurrence of rainfall strongly influences snow accumulation.
The megadrought signal in the Chilean Central Andes between 2010 and 2021 (Garreaud et al., 2025) is evident in the SD observations, including a marked recovery of SD since 2023. Particularly, extremely dry conditions in 2019 and 2021 are evident, with SD stations located in the Aconcagua, Maipo, and Mendoza river basins above 3000 m a.s.l. showing reduced SD values. This signal is also identifiable in stations within the Maule and Itata river basins.
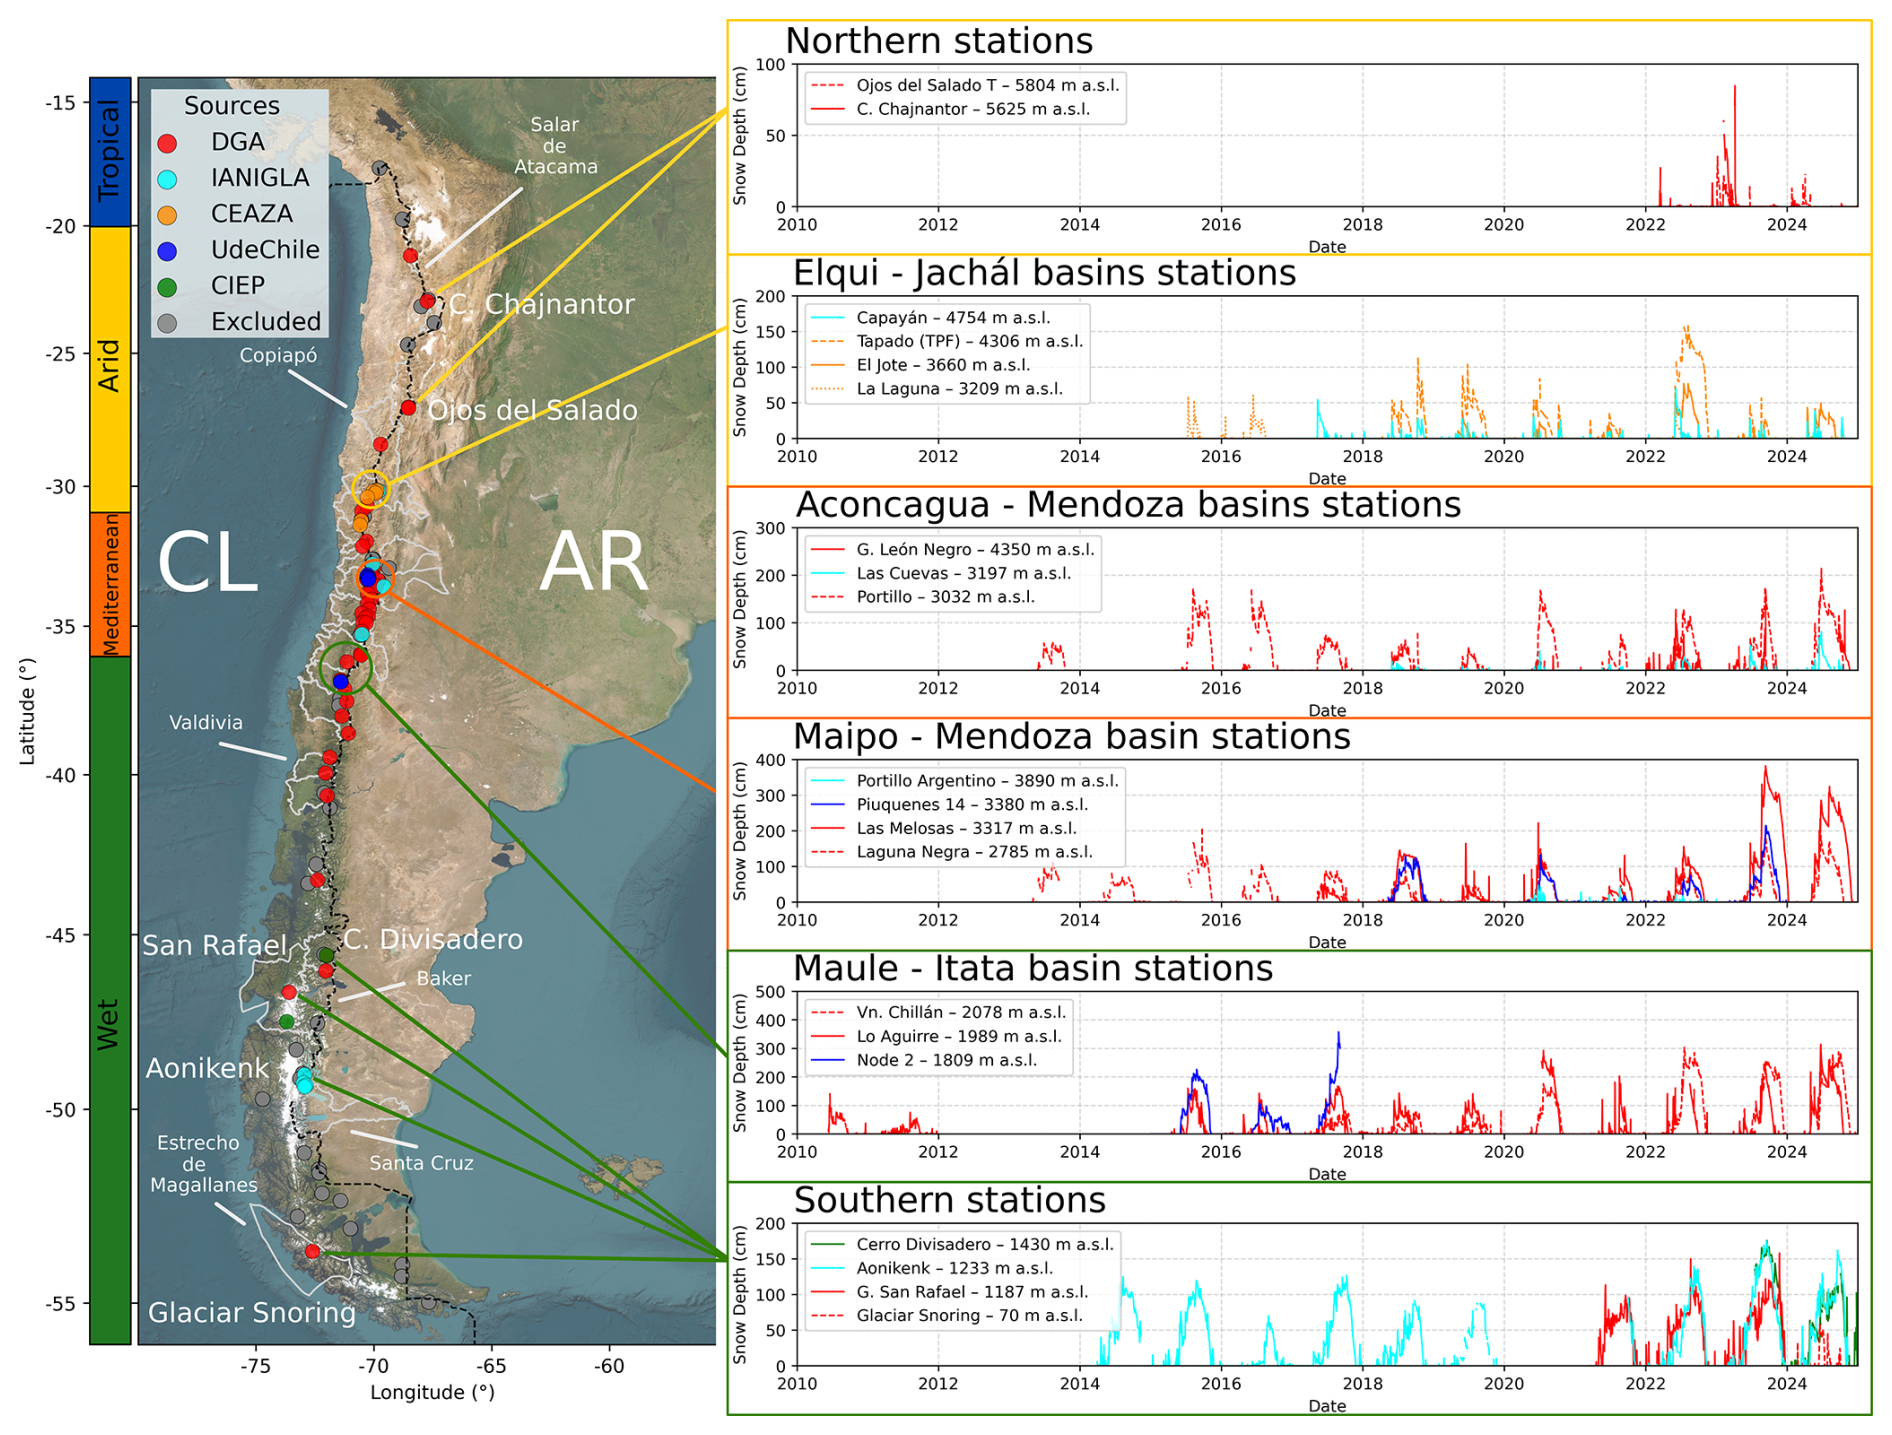
Figure 4Daily snow depth time series for selected stations across the Southern Andes of Chile (CL) and Argentina (AR), spanning 21–54° S during 2010–2024. Station locations and institutional networks are shown on the map. Time series illustrate seasonal and interannual SD variability and periods of missing data. Note that the vertical scale differs among panels. Basemap: Esri World Imagery © Esri, Maxar, Earthstar Geographics, and the GIS User Community.
4.2 Quality assessment of snow depth observations: comparison of raw and quality-controlled datasets
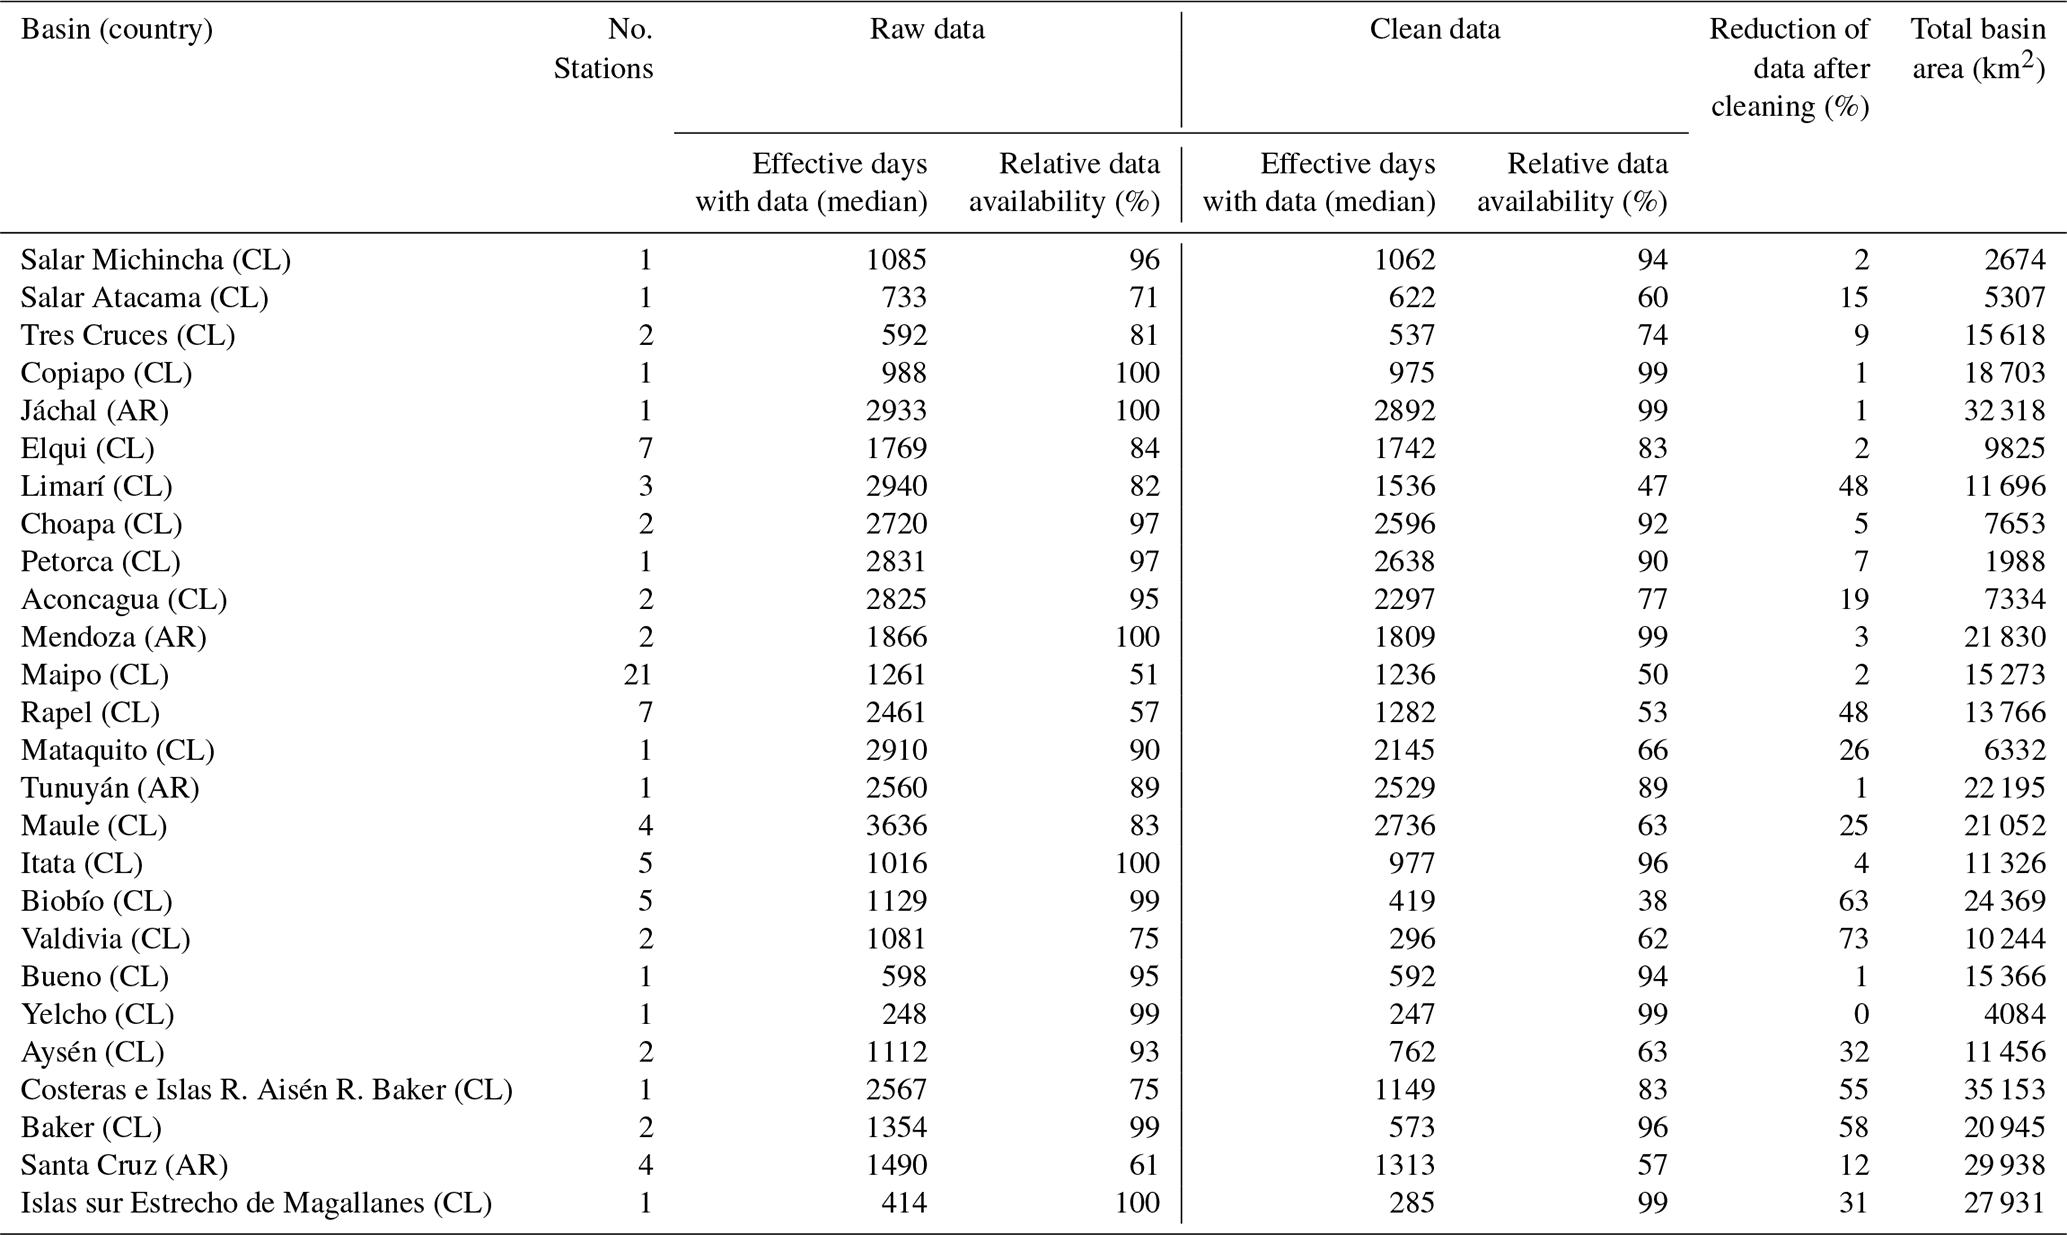
This section evaluates the quality of daily SD observations in both the raw and quality-controlled datasets over the 2010–2024 period. Table 2 summarizes the number of days with available SD observations and the relative data availability, defined as the proportion of days with data between the first and last available records, for both raw and quality-controlled datasets across 26 river basins spanning from 21 to 54° S. Details by station are shown in Table A4. Median values are reported throughout this section because the distribution of data availability across stations is strongly skewed by a few stations with exceptionally long records, making the median a more representative measure of the typical station than the mean.
Overall, a strong positive correspondence is observed between raw and quality-controlled effective days with data (r=0.9), indicating that the quality-control procedure preserves the relative ranking of stations in terms of data availability. No clear latitudinal dependence is identified in the reduction of data availability after cleaning. However, substantial basin-scale differences emerge. The largest median reductions in data availability (> 50 %) are concentrated in basins of the Wet Andes, including Valdivia (73 %), Biobío (63 %), Baker (58 %), and the Costeras e Islas R. Aisén R. Baker River Basins (55 %). These basins also exhibit relatively high initial data availability, suggesting that the quality-control procedure removes observations identified as inconsistent or exhibiting unusually high variability based on statistical and manual criteria.
The Vn. Mocho Choshuenco station largely explains the substantial number of SD observations filtered after applying the quality-control procedure in the Valdivia River Basin, as SD observations for the 2019–2022 period exhibit high dispersion that prevents both automated procedures and manual inspection from clearly identifying the seasonal snow accumulation cycle. In particular, the absence of clearly identifiable snow–free periods prevents reliable determination of the ground reference level the detection of low SD variability, leading to a large proportion of data being classified as unreliable and subsequently removed. Similar challenges were observed in the Biobío River Basin, particularly at Chenqueco and Liucura. At Chenqueco, several months in 2023 were discarded because SD remained below 2 cm and could not be reliably distinguished from sensor noise or surface roughness; consequently, only observations from 2024 were retained. At Liucura, only the 2022 record was preserved because the 2023–2024 period showed irregular autumn–winter accumulation, anomalously high summer SD values in 2024, and no stable ground reference level. A comparable situation is found in the Baker River Basin and Costeras e Islas R. Aisén R. Baker, where the large reduction in SD observations is mainly explained by two out of three stations. At Steffen station, although data are available for 2020–2024, the very limited variability (< 5 cm) prevents the identification of a clear seasonal cycle, with only a potential accumulation signal in 2022 reaching approximately 250 cm, whereas at G. San Rafael station, despite data availability from 2015 to 2024, the 2015–2019 period was excluded because accumulation and ground reference level months could not be distinguished, as illustrated by years such as 2016 and 2019, when higher SD values occur during spring (SON) and summer (DJF), which is inconsistent with the expected seasonal cycle in this zone.
Intermediate reductions of days with data after cleaning (20 %–50 %) are observed in several basins across all climatic zones, notably Rapel River Basin (48 %) in the Mediterranean Andes and Limarí River Basin (48 %) in the Arid Andes, indicating that data loss is not exclusively controlled by latitude but is instead strongly influenced by station-specific issues. In the Rapel River Basin, the large proportion of SD observations failing the quality-control procedure is primarily associated with three stations: Laguna El Yeso, Laguna Los Cristales, and G. Universidad. Different sources of inconsistency are identified. At Laguna El Yeso, data from 2013 and 2015 were excluded due to the absence of snow accumulation during expected winter months, the lack of a consistent ground reference level, and highly incomplete records limited to isolated spring–summer periods between 2019 and 2021. At Laguna Los Cristales, SD observations from 2021 to 2024 were removed due to the absence of variability in the SD time series. However, at the G. Universidad station data from 2017 to 2021 were excluded due to high short-term variability in SD observations over consecutive days; nevertheless, a more detailed, station-specific analysis could potentially recover a substantial number of valid observations. A comparable situation is observed in the Limarí River Basin, where data exclusion is restricted to the Cerro Vega Negra station (2015 and 2021–2023), driven by abrupt SD variations from near 0 to approximately 200 cm within 1–2 d, likely reflecting inverted or mis-scaled observations (e.g., meters instead of centimeters), which, despite being partially captured by the quality-control procedure, can still be misinterpreted as valid snow accumulation periods and are therefore removed.
In contrast, minimal reductions in the number of days with data after the quality-control procedure (< 1 %) are observed in basins with only one station, such as Yelcho, Bueno, and Tunuyán river basins. Notably, the Elqui and Maipo river basins, despite having the highest number of stations (7 and 21 stations, respectively), also exhibit very low median reductions (< 2 %). This indicates a high potential for SD analyses in these basins, supported by the combination of dense observational networks and consistently high-quality records relative to other basins across the Southern Andes.
Out of the 81 SD stations of our final quality-controlled dataset, 45 stations distributed between 21 and 49° S show reductions in data availability below 10 %, with a median of 1236 d with valid observations, after the quality-control procedure. Within this group, the Elqui River Basin includes five stations, Glaciar Tapado en Los Corrales, Tapado (TPF), Los Corrales, La Laguna, and El Jote, while the Maipo River Basin comprises 11 stations: Glaciar Juncal Sur, Glaciar Olivares Gamma, Glaciar Olivares Alfa, AMTC10, Piuquenes7, La Parva, Farellones, AMTC12, Laguna Negra, Las Melosas, and Las Hualtatas. The relatively high data availability and long observational records at these stations provide a robust basis for characterizing temporal variations in SD within these basins.
Table 2Effective days of snow depth observations for raw and quality-controlled datasets by river basin, considering all available records over the 2010–2024 period.
4.3 Assessing the physical consistency of snow depth with precipitation and air temperature by station
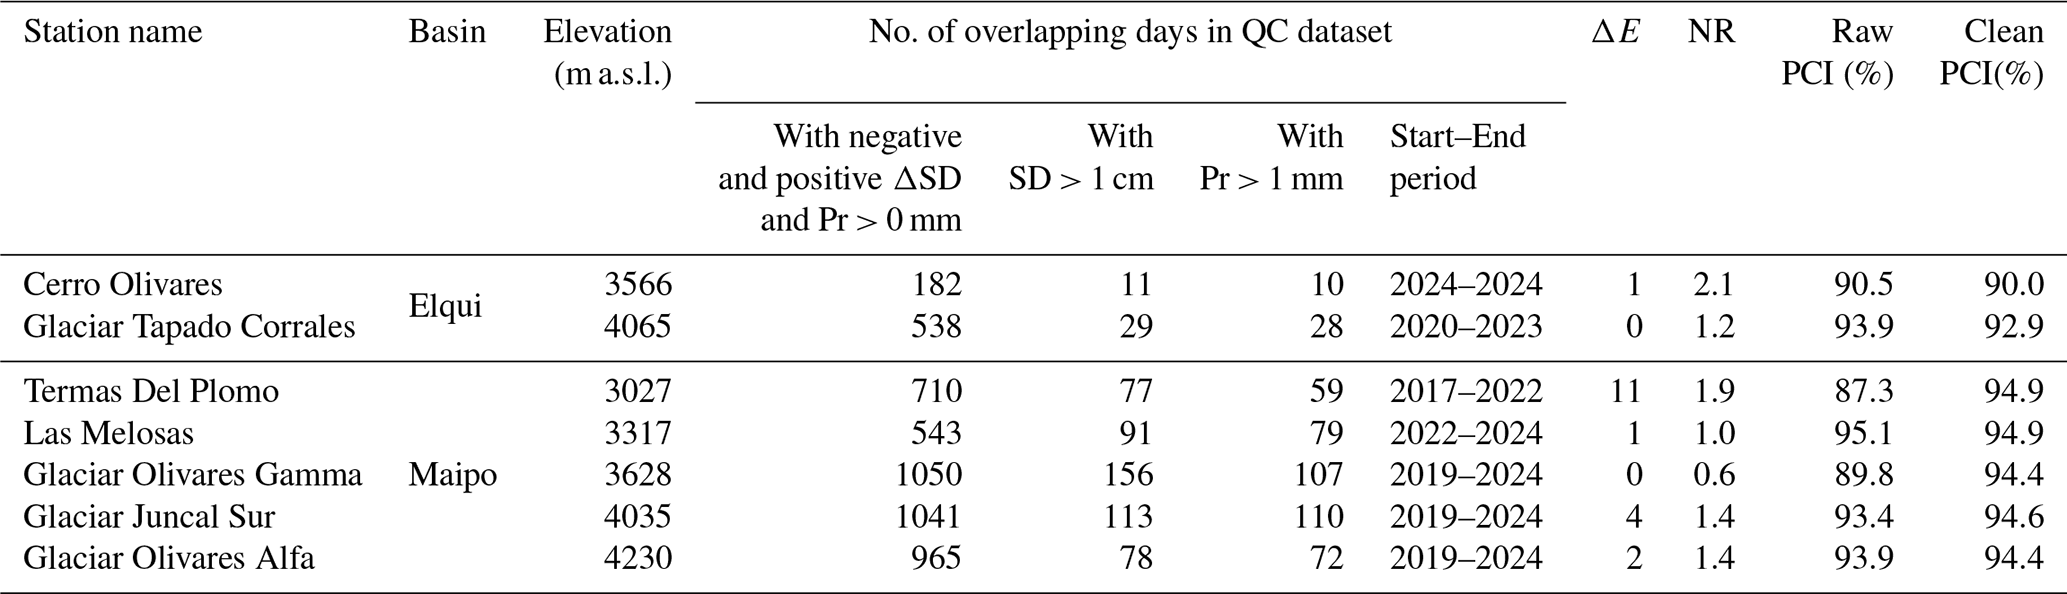
Table 3 summarizes the results of the PCI metric applied to stations located in the Elqui and Maipo River Basins, which are the two basins with the largest number of SD stations and the most comprehensive elevation distribution among the 26 river basins analyzed in this study. Two and five SD stations met the conditions required for this validation in Elqui and Maipo River Basins, respectively, including overlapping daily SD, Pr, and AT data during the accumulation period (May–October) over the period 2017 to 2024, and satisfied the three criteria related to air temperature threshold, snow accumulation, and precipitation events (see in Sect. 3.4). These strict data availability requirements substantially reduced the number of days available for PCI analysis. In the Elqui River Basin, the median number of days with overlapping quality-controlled SD, precipitation, and air temperature observations decreased from 360 to 19 d after applying all selection criteria. In the Maipo River Basin, the corresponding median decreased from 965 to 79 d. This reduction is primarily explained as the filter explicitly isolates precipitation-driven accumulation days, discarding the majority of the winter season characterized by zero precipitation, stable snowpacks, or ablation periods. Complete results for both the raw and quality-controlled datasets are provided in Tables A5 and A6.
Across the analyzed stations, the quality-control procedure improves the stability of physical consistency metrics. In the Elqui River Basin, the PCI in the quality-controlled dataset ranges between 90.0 % and 92.9 %, compared to 90.5 % and 93.9 % in the raw dataset, indicating only minor changes after cleaning. In contrast, in the Maipo River Basin, the PCI range narrows substantially after quality-control, converging to 94.4 %–94.9 % from a wider range of 87.3 %–95.1 % in the raw dataset. This reduction in dispersion reflects a more consistent representation of physically plausible conditions following the application of the quality-control procedure, while no clear relationship is observed between PCI and station elevation in the river basins. While the clean PCI is relatively stable, relying on it in isolation can be misleading. Because PCI is a ratio, similar values can arise from datasets with substantially different numbers of retained accumulation events. An example of this is observed at the Cerro Olivares station (Elqui River Basin), where despite a high Noise Ratio (NR = 2.1) indicating that more than half of the raw SD days were spurious values, the raw PCI (90.5 %) is similar to the clean PCI (90.0 %). Complementary, a similar behavior is observed at the Termas del Plomo station (Maipo River Basin), where a higher ΔE value (11) indicates a greater frequency of physically inconsistent accumulation signals, such as rain-to-snow transitions, which are effectively filtered by the algorithm. Despite this substantial removal of inconsistent events, the clean PCI (94.9 %) remains close to the raw PCI (95.1 %), reinforcing that similar PCI values can mask important improvements in the physical consistency of the dataset.
The quality-control procedure evaluation in these stations can be categorized into three groups. The first group comprises stations with higher absolute error removal (ΔE≥2), exhibiting an increase in PCI from 87.3 % in the raw data to 94.9 % after quality-control procedure. This group includes the Termas del Plomo, Glaciar Juncal Sur, and Glaciar Olivares Alfa stations. The improvement in PCI is associated with the removal of a substantial number of physically inconsistent days (NR ranging from 2 to 11). Notably, NR does not show a direct relationship with the PCI. The second group comprises stations with low error correction (ΔE≤1) and varying proportions of discarded noise (NR ranging from 1.0 to 2.1), which exhibit a slight decrease from raw PCI to quality-control PCI. This behavior is observed at Las Melosas, Glaciar Tapado Corrales and Cerro Olivares stations in the Elqui River Basin. This marginal decline does not indicate a deterioration in data quality. Rather, the quality-control procedure removes spurious noise, thereby reducing the total sample size (as reflected by NR), which increases the relative influence of the few remaining natural inconsistencies on the final PCI percentage. The third group exhibits a distinct behavior, represented by the Glaciar Olivares Gamma station, which stands out as a unique case of signal recovery. Unlike the previous groups, this pattern is explained by its metrics. Although no errors were detected by the automated filters (ΔE=0), manual correction of the record (executed in Step 2) increased the PCI from 89.8 % to 94.4 %. This improvement did not result from the automated noise filters, but from the correction of specific issues in the raw data associated with height-unit continuity errors caused by sensor handling or configuration issues. These errors could not be corrected automatically and therefore required manual intervention. This process nearly doubled the total number of valid accumulation events (NR =0.6), diluting the few remaining inconsistencies and increasing the final PCI. The increase in the number of valid accumulation events reduced the proportional contribution of the remaining inconsistent events, thereby increasing PCI. Although this station behaves as an outlier, it includes more than 100 analyzed days over six years, enabling this outcome, in contrast to Cerro Olivares, which comprises only 10 analyzed days within a single year of observations.
Table 3Assessment of snow depth, precipitation, and air temperature data before and after the quality-control procedure in the Elqui and Maipo river basins for the accumulation period May–October 2017–2024.
4.4 Deriving snow depth–elevation patterns from in situ measurements
We selected three river basins representing the Arid (Elqui), Mediterranean (Maipo), and Wet Andes (Maule–Itata) because they provide relatively consistent SD observations distributed across broad elevation gradients over the 2010–2024 period, despite the heterogeneous spatial coverage and temporal gaps that characterize the complete dataset. Despite this selection, none of these basins contain continuous observations for all years and elevations, which limits the analysis of SD variability on a year-by-year basis. To address this limitation, we adopt a representative-year approach based on three precipitation conditions, under dry, normal, and wet years (Table A3).
Figure 5 presents the cumulative distribution function (CDF) of daily SD observations at each station during the seasonal snow accumulation period (1 May–31 October) for the representative dry, normal, and wet years. For each station and precipitation-year type, the median SD (CDF = 0.5) was used as a representative measure of snow accumulation, providing a consistent basis for comparing SD across elevations and climatic conditions. Across the three basins, a coherent large-scale pattern emerges: SD increases with elevation and from dry to wet years, reflecting the combined control of orographic precipitation and zonal climatic gradients. In dry years, SD distributions are strongly compressed toward low values, considering elevation from 2000 to 4500 m a.s.l., with several stations exhibiting less than 50 cm of median SD. In contrast, wet years show a pronounced increase of SD with higher variability of SD over CDF 0.5. This transition is especially marked in the Wet Andes basin (Maule–Itata), where median SD exceeds 200 cm at all stations during wet conditions. Despite this general behavior, the CDF-based analysis indicates that the relationship between SD and elevation is not strictly positive within basins: (i) a positive SD-elevation relationship in the Arid Andes, (ii) a non-positive SD-elevation pattern in the Mediterranean Andes, characterized by mid-elevation SD maxima, and (iii) a consistently high and positive SD-elevation relationship in the Wet Andes.
In the Elqui River Basin (Arid Andes), SD exhibits a strong dependence on elevation and precipitation-year type. During the dry year (2021), median daily SD values are close to zero at most stations below 3600 m a.s.l., with only the highest elevation station, Tapado TPF (4306 m a.s.l.), reaching 16 cm. Under normal conditions (year 2018), SD increases substantially at high elevations (38 cm at Tapado TPF station), while remaining limited at mid elevations (4 cm at Llano de Liebres station). The wet year (2022) reveals a marked increase of SD across all elevations, with station coverage broadly comparable to that available for the dry year, with a clear altitudinal gradient: median SD reaches 132 cm at 4306 m a.s.l. and remains relatively high (e.g., 55 cm at 3660 m a.s.l. at El Jote station), although lower elevation stations still exhibit reduced accumulation (< 5 cm at 3200 m a.s.l. at La Laguna station). Overall, the observations suggest increasing SD toward the highest sampled elevations, although the relationship is not monotonic in all years.
In the Maipo River Basin (Mediterranean Andes), SD exhibits a complex and spatially heterogeneous distribution along the elevation gradient. During the dry year (2021), median SD remains close to zero at the highest elevations (e.g., Tupungatito Bajo, 4425 m a.s.l.), while intermediate elevations (3000–3400 m a.s.l.) show substantially higher values (e.g. 53 cm at Las Melosas and 27 cm at Termas del Plomo), indicating a non-monotonic SD-elevation relationship. In the normal year (2018), SD increases markedly across a broad elevation range, with several stations between 3300 and 3600 m a.s.l. exceeding 100 cm (e.g., Piuquenes14: 102 cm; Las Melosas: 129 cm), whereas lower elevations exhibit reduced values and the highest elevations lack observations. During the wet year (2024), median SD reaches its maximum, particularly at mid elevations (e.g. 260 cm at Las Melosas and 130 cm at Laguna Negra), while remaining comparatively low at elevations above 4000 m a.s.l. (close to 5 cm at G. Tupungatito Bajo and G. Olivares Alfa). The persistence of this mid-elevation maximum suggests the combined influence of several processes. First, mean winter precipitation in the subtropical Andes has been shown to peak on the windward slopes below the crest of the Andes, rather than at the highest elevations, as a result of orographic enhancement and upstream flow blocking (Viale and Nuñez, 2011). Second, wind-driven snow redistribution and enhanced sublimation at higher elevations, where drier atmospheric conditions prevail, may further reduce snow accumulation, thereby preventing the development of a simple positive SD-elevation relationship. Although winter-focused studies addressing these processes remain scarce in this region, Ayala et al. (2017) highlighted the significant role of sublimation on wind-exposed surfaces of the Juncal Norte Glacier near 4500 m a.s.l.
In the Maule–Itata River Basin (Wet Andes), SD exhibits a more consistent and coherent increase with both elevation and climatic wetness. Even during the dry year (2019), median daily SD values remain relatively high compared to northern basins (e.g., 77 cm at 1989 m a.s.l. at Lo Aguirre and 46 cm at 1977 m a.s.l. at Nevado Longaví). In the normal year (2017), SD increases substantially, reaching 350 cm at 2439 m a.s.l. (Los Cóndores), with all stations exceeding 50 cm. During the wet year (2024), SD shows a strong amplification across all elevations, with median values exceeding 200 cm at all stations and reaching up to 380 cm at Los Cóndores. Unlike the Elqui and Maipo river basins, the SD-elevation relationship remains largely positive and continuous, reflecting more humid atmospheric conditions and a reduced influence of sublimation at high elevations, which in turn favors more consistent snow accumulation across the elevation gradient in the Wet Andes (Schaefer et al., 2020).
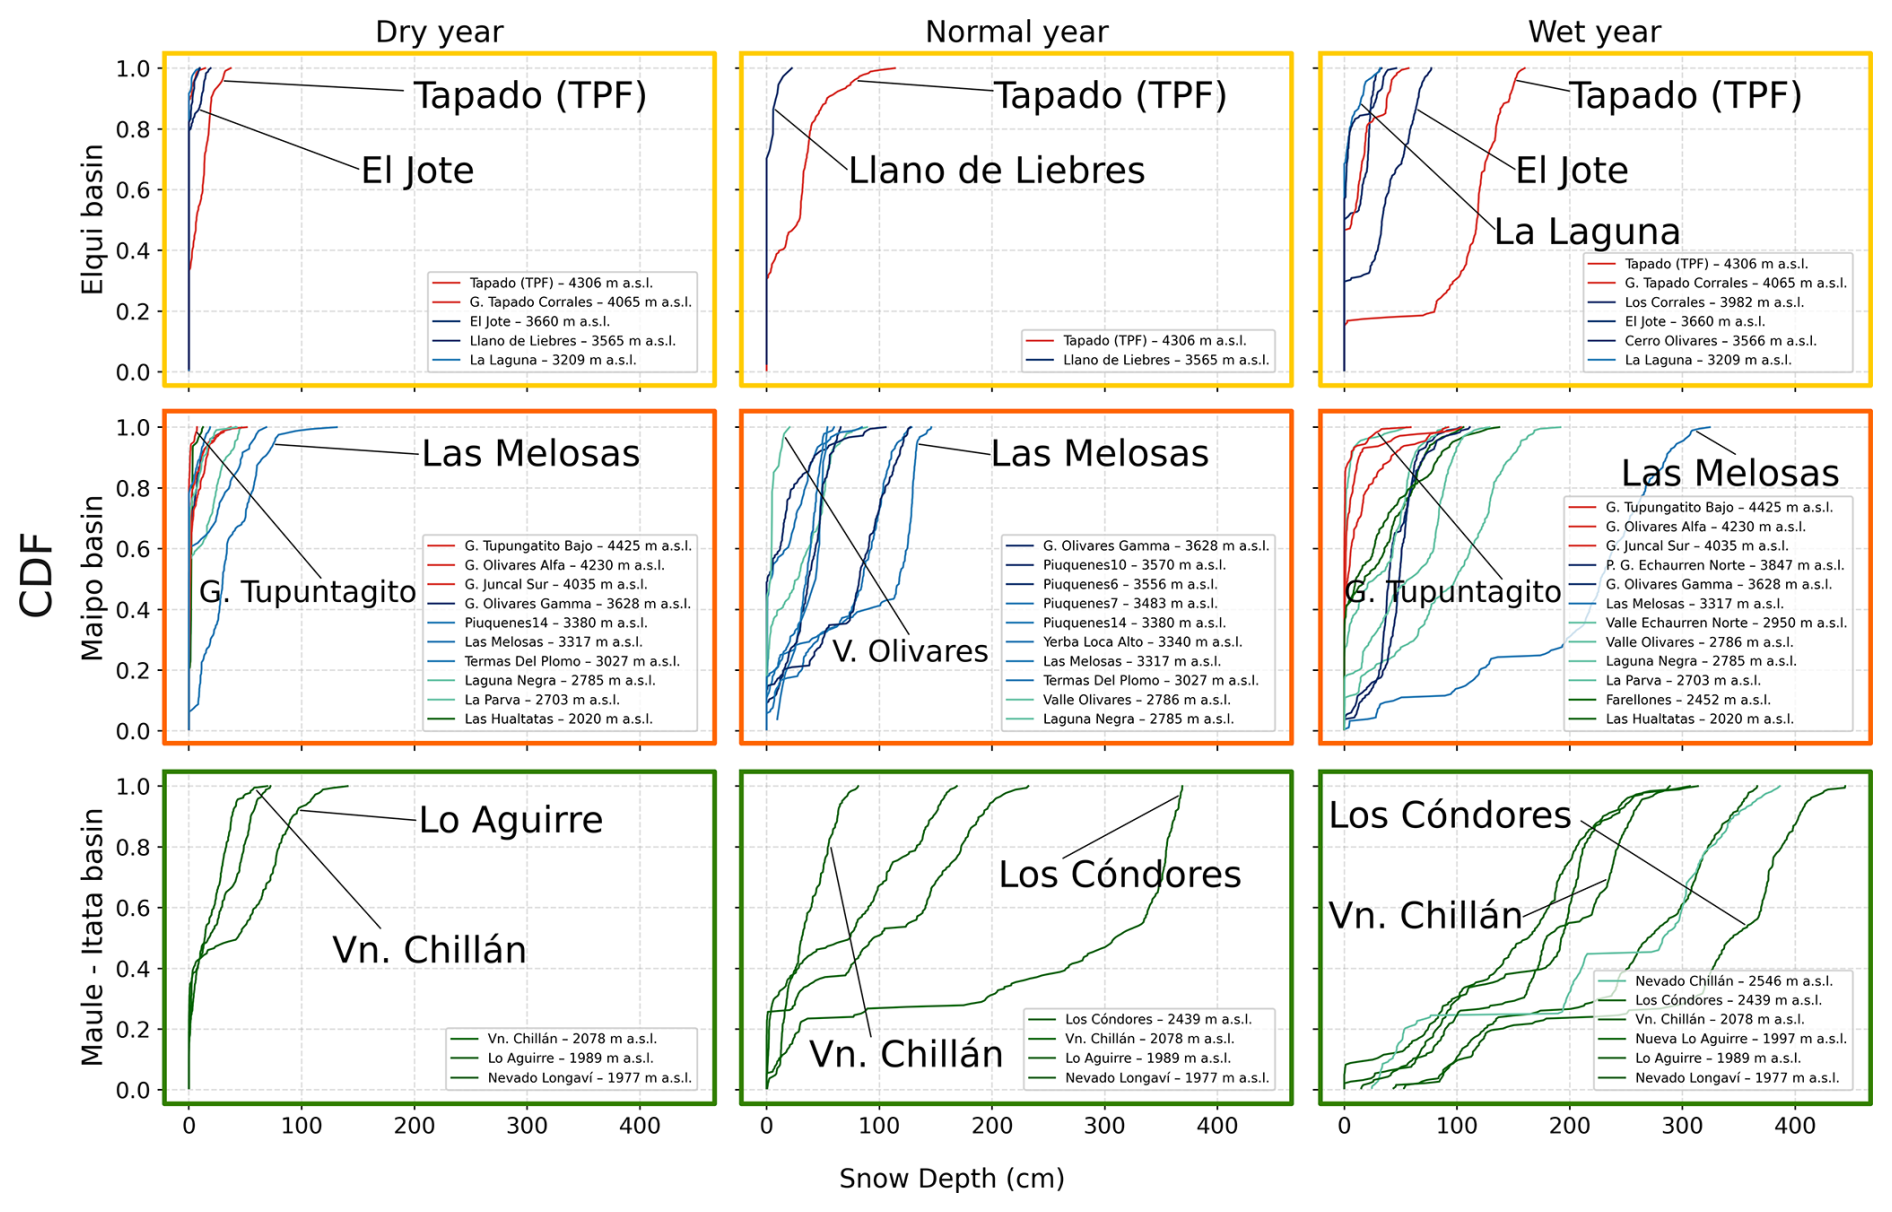
Figure 5Cumulative distribution functions of snow depth by elevation for specific years with dry, normal, and wet precipitation conditions across three river basins corresponding to each Andean zone. The dry (2021) and normal (2018) years are shared between the Arid and Mediterranean Andes, whereas wet years correspond to 2022 in the Arid Andes and 2024 in the Mediterranean Andes; in contrast, the Wet Andes are represented by a different set of years, with dry (2019), normal (2017), and wet (2024) precipitation conditions. The analysis is based on daily snow depth observations from 1 May to 31 October in the Elqui, Maipo, and Maule–Itata river basins.
In addition, an additional assessment of SD observations was conducted by examining the SD-elevation relationship together with the hypsometry of the three selected river basins.
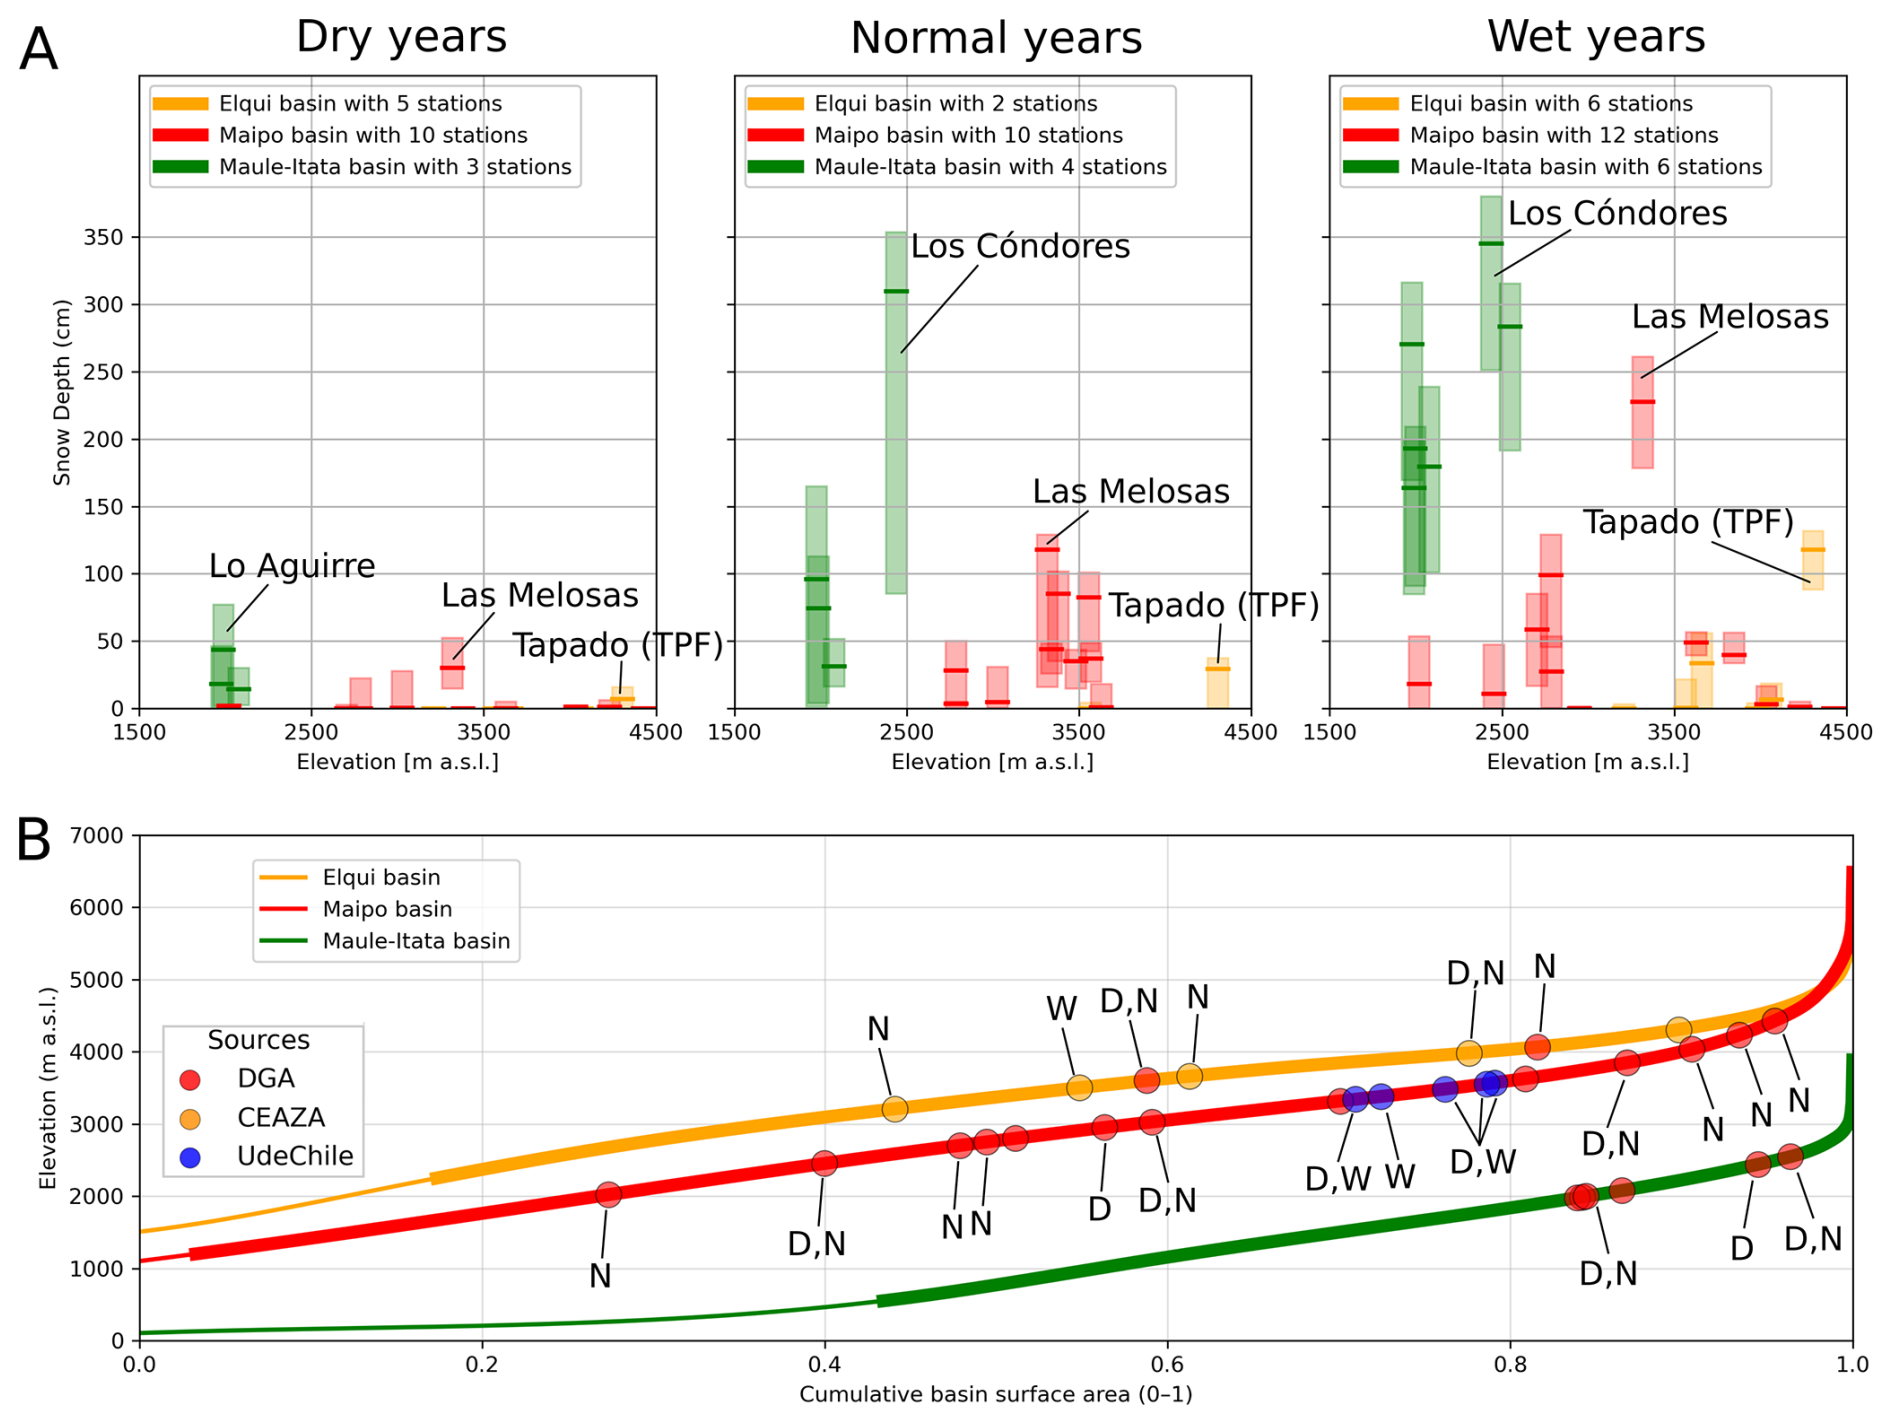
Figure 6Measured relationships between snow depth and elevation for three selected precipitation years, classified as dry (D), normal (N), and wet (W), across three river basins representing the Arid (Elqui, 29° S), Mediterranean (Maipo, 33° S), and Wet (Maule–Itata, 37° S) Andes in Chile. Only SD observations from stations with at least 70 % of daily observations per month during the accumulation period (1 May to 31 October) are included. In each upper panel (A), bars represent the 25th, 50th, and 75th percentile SD values, derived from all available observations for the corresponding selected precipitation year. The lower panel (B) compares station elevations with the basin hypsometric curves. The thin line indicates the minimum elevation of July snow persistence over the 2000–2024 period, while the thick line marks the elevation at which snow persistence reaches the 25th percentile (SP25). Circles denote the elevation of SD stations and are labeled according to the selected precipitation year (D, N, or W). Stations without labels correspond to sites with SD observations available for all three selected precipitation years.
Figure 6A shows that observed SD generally increases from the Arid to the Wet Andes, consistent with the regional precipitation gradient (Sarricolea et al., 2017). Furthermore, similar SD-elevation patterns, analysed through CDFs, were observed in the three river basins. Although the available stations do not fully represent the spatial variability within each basin, they constitute the most comprehensive in situ SD observations currently available and provide observational constraints on SD-elevation relationships. In the Elqui River Basin (29° S), the available observations indicate a positive relationship between SD and elevation during the dry year (2021), based on five stations spanning elevations from 3209 to 4306 m a.s.l. A similar positive relationship is observed during the normal year (2018), although this pattern is poorly constrained because only two stations are available, spanning elevations up to 3500 m a.s.l. However, during the wet year (2022), based on six stations spanning elevations from 3209 to 4306 m a.s.l., this pattern is interrupted: SD increases up to approximately 3600 m a.s.l., then declines toward 4000 m a.s.l., before increasing again up to the highest elevation with available SD observations (4300 m a.s.l.). These features are also reflected in the 25th and 75th percentile SD values. In the Maipo River Basin (33° S), the available observations indicate that the SD-elevation relationship remains positive up to approximately 2800–3300 m a.s.l. across all precipitation years, based on at least 10 stations spanning elevations from 2020 to 4425 m a.s.l. The available observations further suggest that above 3300 m a.s.l., SD begins to decline. In contrast, the available SD observations in the Maule–Itata River Basin (37° S), based on at least three stations during the dry year and six stations during the wet year, indicate a consistently positive SD-elevation relationship.
Although such SD-elevation patterns have not been previously documented in Chile at the basin scale over a wide elevation range, existing studies restricted to small microcatchments with short observational periods provide only partial insights. Mendoza et al. (2020) examined microcatchments in the Arid and Mediterranean Andes within a relatively narrow elevation range, finding that SD increased between 3600 and 3900 m a.s.l. in 2018, followed by a decrease at higher elevations, and that SD values declined on slopes steeper than 35°. Similarly, Shaw et al. (2020a, b) showed in a microcatchment of the Mediterranean Andes that SWE increased from approximately 3000 to 3800 m a.s.l., then declined up to 5400 m a.s.l., in the period 2017–2018.
The elevational distribution of SD stations under these precipitation regimes supports the observed SD patterns across the three river basins. Figure 6B presents the distribution of SD stations by elevation alongside the hypsometric curve for each basin. The lower bound of the hypsometric curve represents the minimum elevation of July snow persistence over the 2000–2024 period, while the elevation corresponding to the 25th percentile of snow persistence is indicated by a thick line.
Despite the generally well-distributed elevation range of stations, the Elqui River Basin includes five SD stations that do not provide observations during the analyzed normal precipitation year, highlighting the importance of CEAZA stations in characterizing the SD-elevation relationship in this basin. A comparable spatial distribution of SD stations across the three precipitation regimes is observed in the Maipo River Basin; however, of the 18 stations, nine lack observations for the selected normal year, particularly at the lowest and highest elevations. Although the SD network is largely composed of DGA stations, 13 spanning a broad elevation range (2020–4230 m a.s.l.), stations operated by UdeChile provide important complementary coverage in the Mapocho catchment. In contrast, the Maule–Itata River Basin comprises only DGA stations, with three stations lacking data during dry precipitation years.
As a result, when considering only these three specific precipitation conditions, just six stations capture SD variability across the Maule–Itata River Basin, which encompasses a snow–covered area of 30 690 km2 as defined by the snow line elevation estimated here. This contrasts with the smaller snow–covered areas of the Elqui (6460 km2) and Maipo (7730 km2) River Basins, where a denser SD station network is available.
The quality-controlled dataset is openly available through Zenodo at https://doi.org/10.5281/zenodo.21577171 (Medina and Caro, 2026). The repository provides daily snow depth observations from 69 automatic stations across the Southern Andes for 2010–2024, together with station metadata and a dataset overview figure. An interactive snow depth exploration tool is available at https://javiermedinamen-art.github.io/hidromet (last access: 1 September 2026), developed by the Laboratorio de Teledetección Ambiental. A concise file manifest describing all distributed files and their contents is provided in Tables A1 and A4. The same information is available in the Zenodo repository in the file Station metadata for snow depth observations.
Input data were obtained from public repositories and direct institutional contributions, including the DGA, CEAZA (or CEAZAMET), IANIGLA, the University of Chile, and CIEP. DGA data are distributed through the Chilean open-data framework, which allows data reuse and redistribution with proper attribution. CEAZA data usage policies explicitly allow their use in scientific publications with acknowledgment of the original source. Datasets from IANIGLA, the University of Chile, and CIEP were provided directly by these institutions for scientific research purposes, and co-authors actively affiliated with these institutions facilitated access to the corresponding datasets. The original observations were reprocessed and integrated into the quality-controlled dataset distributed with this study, while maintaining attribution to the original data providers.
The full data-processing and quality-control workflow comprises three sequential processing steps, followed by an independent cross–variable validation, as described in Sect. 3: (1) compilation of multi-institutional snow depth records; (2) automated and manual processing, including zero–level correction (Step 2.1), spike removal (Step 2.2), and physical-range filtering (Step 2.3), complemented by station-level expert screening; and (3) harmonization of overlapping series. The resulting dataset was subsequently evaluated through cross-variable validation using the Physical Consistency Index (PCI).
An executable demonstration of Step 2.1 (zero-level/ground-reference correction; function detect_flat_offsets) is available on GitHub at https://github.com/javiermedinamen-art/hidromet/tree/main/sd_cleaning_sample (last access 23 September 2026) and Zenodo at https://doi.org/10.5281/zenodo.22918463 (Medina, 2026). The sample is applied to the Valle Olivares station (05706003; 33° S) and includes the Python module, a Jupyter notebook, an example input CSV (date and snow depth in centimetres), dependency specifications, and a basin-level parameter table for Steps 2.1–2.3 (QC_parameters_by_river_basin). Default parameters in the sample correspond to the Maipo River Basin settings used for Valle Olivares (window = 5 d; var_thr = 0.5 cm; tol = 0.3 cm; drift_thr = 0.3 cm; snow_thr = 5 cm).
Steps 2.2, 2.3, and 3 are fully specified in Sect. 3, including the algorithms, decision rules, and thresholds used in the processing workflow. The complete source code implementing these steps is not publicly available but can be obtained from the authors upon request. Expected input and output formats for the automated cleaning stage are daily tabular files with one column per station (raw to quality-controlled snow depth in centimetres). The open dataset provides quality-controlled daily snow depth for 69 stations; institutional restrictions prevent redistribution of the remaining series included in the 81-station analysis.
This open-access, quality-controlled dataset provides the largest and most complete collection of continuous daily snow depth observations currently available for the Southern Andes, comprising 81 stations across 21–54° S over 2010–2024. Of the 118 candidate snow depth stations initially compiled across Chile and Argentina, 81 were retained after quality control. Records from 69 stations are openly distributed through Zenodo, while data-use restrictions prevent redistribution of the remaining 12 records. The quality-control procedure improved data reliability, increasing the newly proposed Physical Consistency Index from 90.5 % in the raw dataset to 92.9 % in the quality-controlled dataset for stations in the Elqui River Basin, and from 87.3 % to 94.9 % for stations in the Maipo River Basin. These results support the effectiveness of the quality-control procedure at the stations where independent cross–variable was possible, while resulting in an average 21 % reduction in data availability across the 26 river basins analysed. The main conclusions are as follows.
-
No clear latitudinal pattern is evident in station data quality across the 26 river basins. Nevertheless, several of the largest reductions in data availability after quality control occurred in Wet Andes basins, particularly Valdivia, Biobío, and Baker (> 50 %). In contrast, in the Arid and Mediterranean Andes, the Elqui and Maipo River Basins containing 7 and 21 retained stations, respectively, showed only minor reductions after quality control. The combination of relatively large station numbers and limited data loss makes these basins particularly suitable for basin–scale SD analyses.
-
Only three river basins provide sufficient elevational coverage to examine basin-scale quality-controlled SD-elevation relationship: Elqui, Maipo, and Maule–Itata. Nevertheless, the available stations do not fully represent the spatial variability of snow conditions within these basins. The available observations indicate non–linear SD-elevation relationships in two of these basins, with maximum observed SD at approximately 3300 m a.s.l. in the Maipo River Basin (Mediterranean Andes) and 4300 m a.s.l. in the Elqui River Basin (Arid Andes). Elqui River Basin shows increasing SD toward higher elevations but with non-monotonic behavior under wet conditions. In contrast, SD observations in the Maule–Itata River Basin (Wet Andes) indicate a predominantly positive SD-elevation relationship.
-
The spatial distribution of SD monitoring stations does not reflect the relative spatial extent of snow-covered areas in the study domain. The Maule–Itata River Basin has the largest snow-covered area (30 690 km2) yet a comparatively lower station density than the smaller Elqui (6460 km2) and Maipo (7730 km2) River Basins. In these basins, the DGA network is strongly complemented by stations operated by CEAZA and Universidad de Chile, which provide important complementary elevational and spatial coverage for improving the characterization of SD-elevation patterns.
This research underscores the need for sustained efforts to improve the availability and spatial representativeness of in situ snow depth observations through informed monitoring strategies and policy decisions.
Table A1Characteristics of 81 selected stations with snow depth observations in Chile and Argentina across 21–54° S.
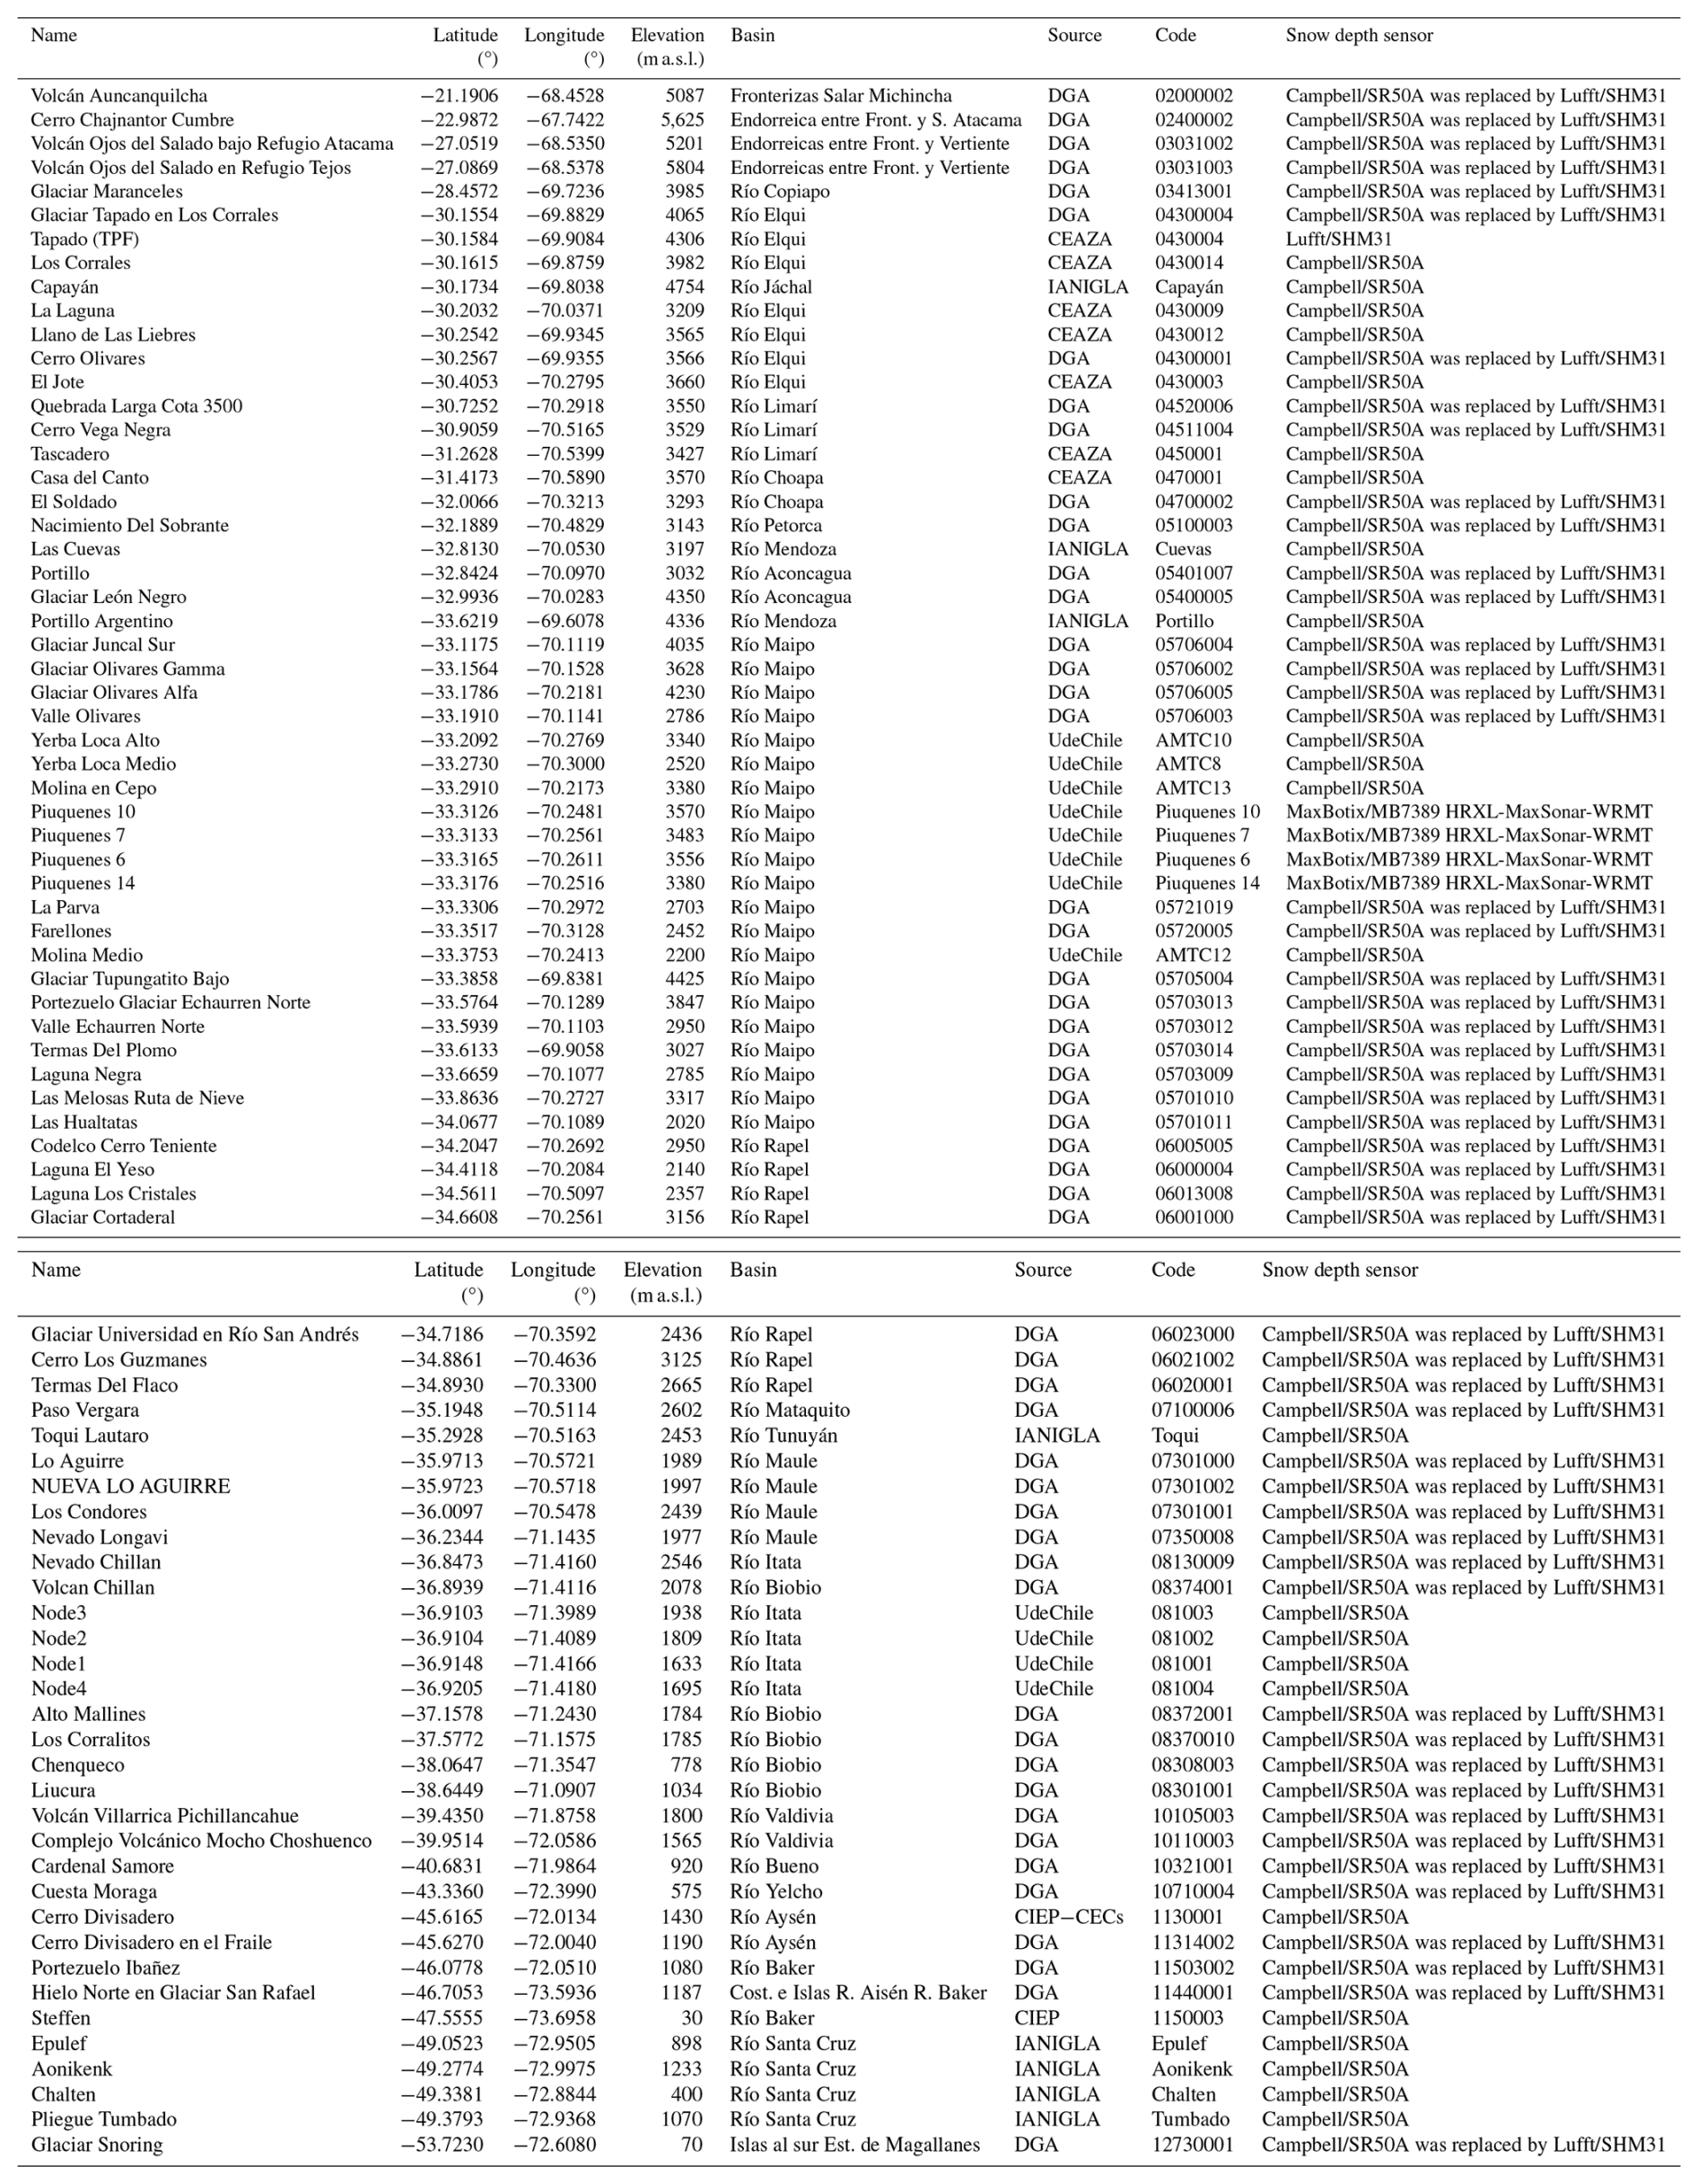
Table A2Characteristics of 37 excluded stations with snow depth observations in Chile and Argentina across 17–55° S.
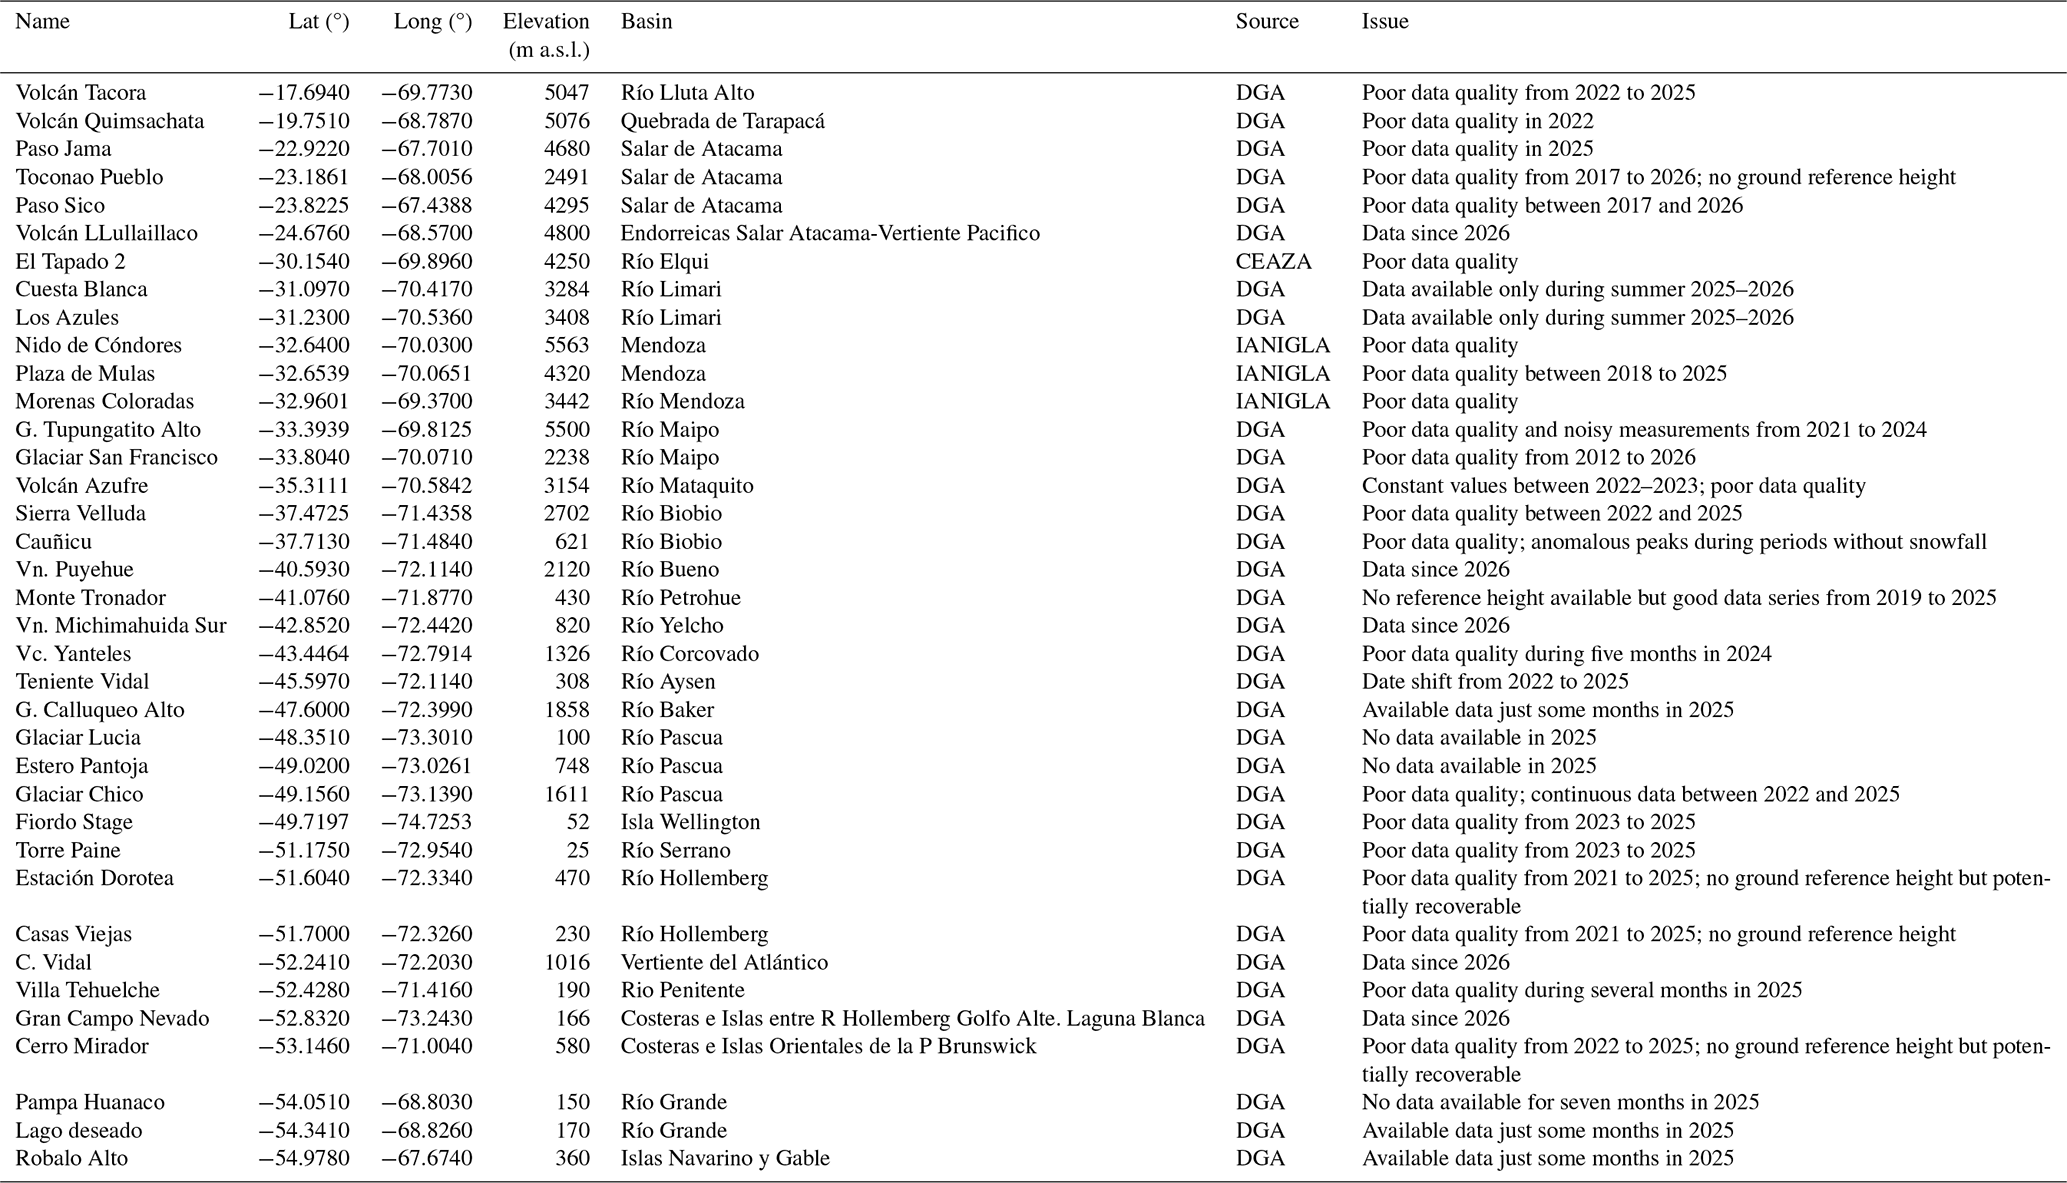
Table A3Precipitation–year types by river basin identified from percentiles of total precipitation: dry (P0–30), normal (P30–70), and wet (P70–100), based on available data for 2013–2024.
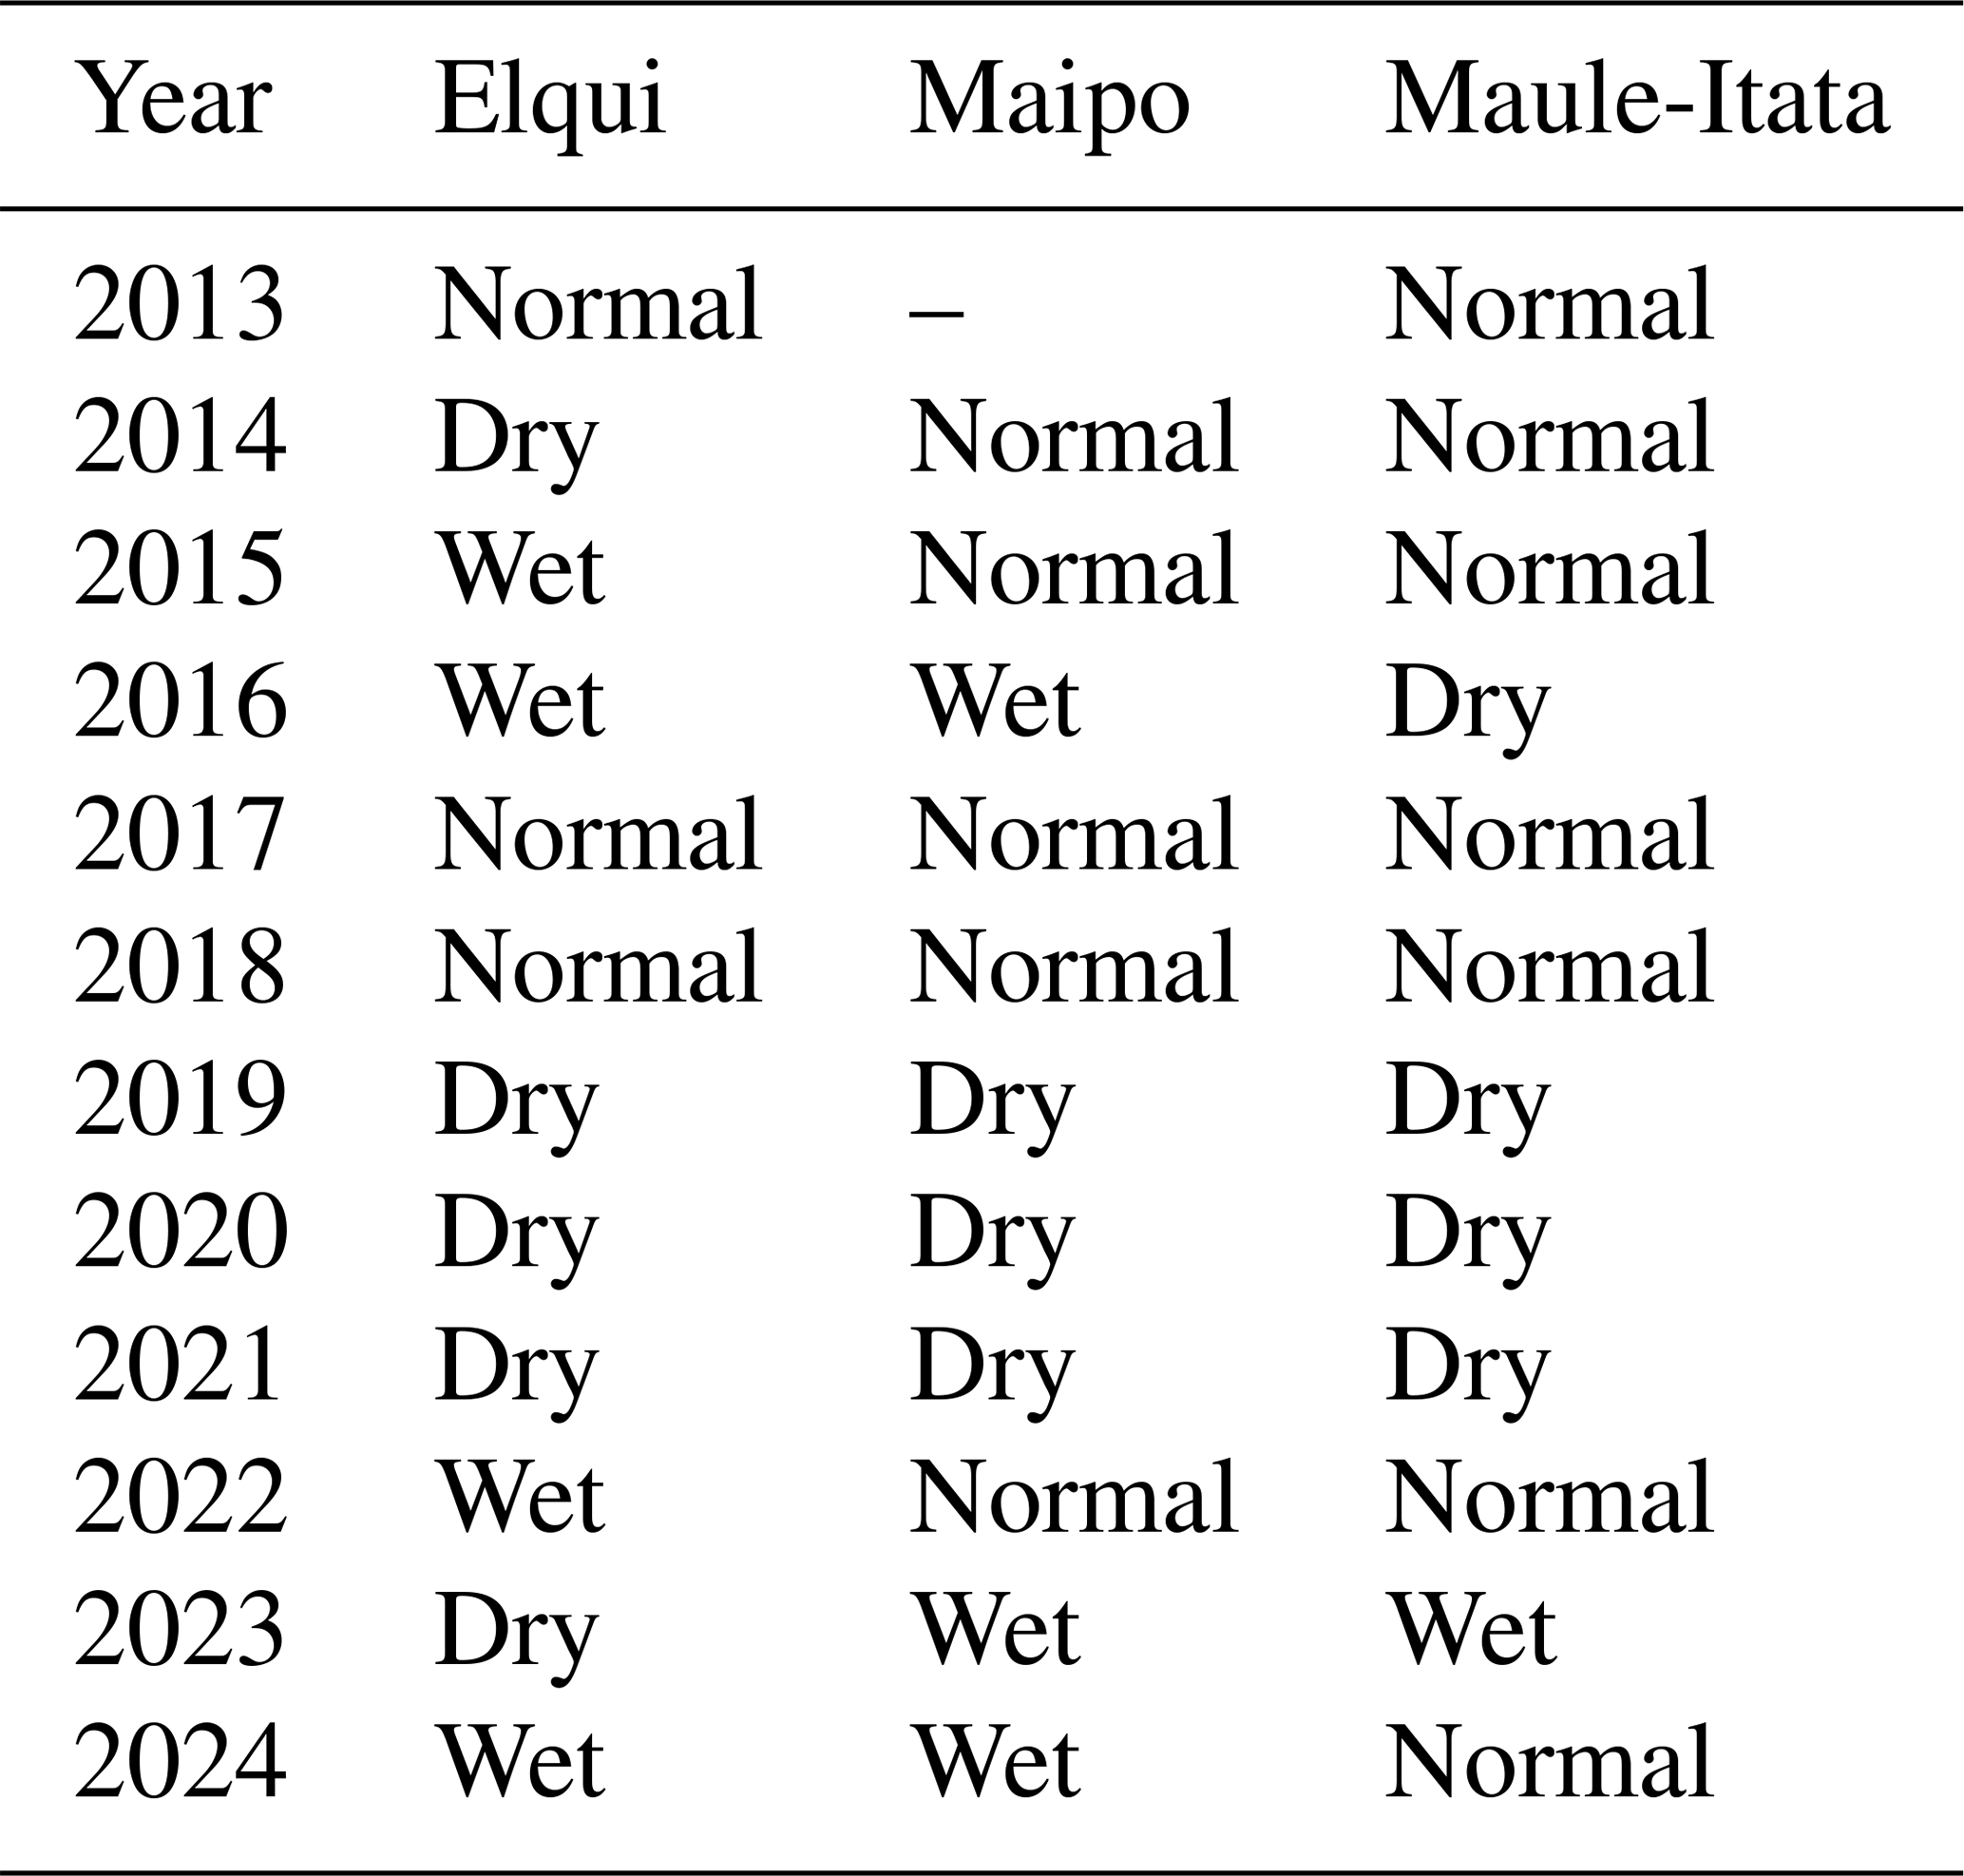
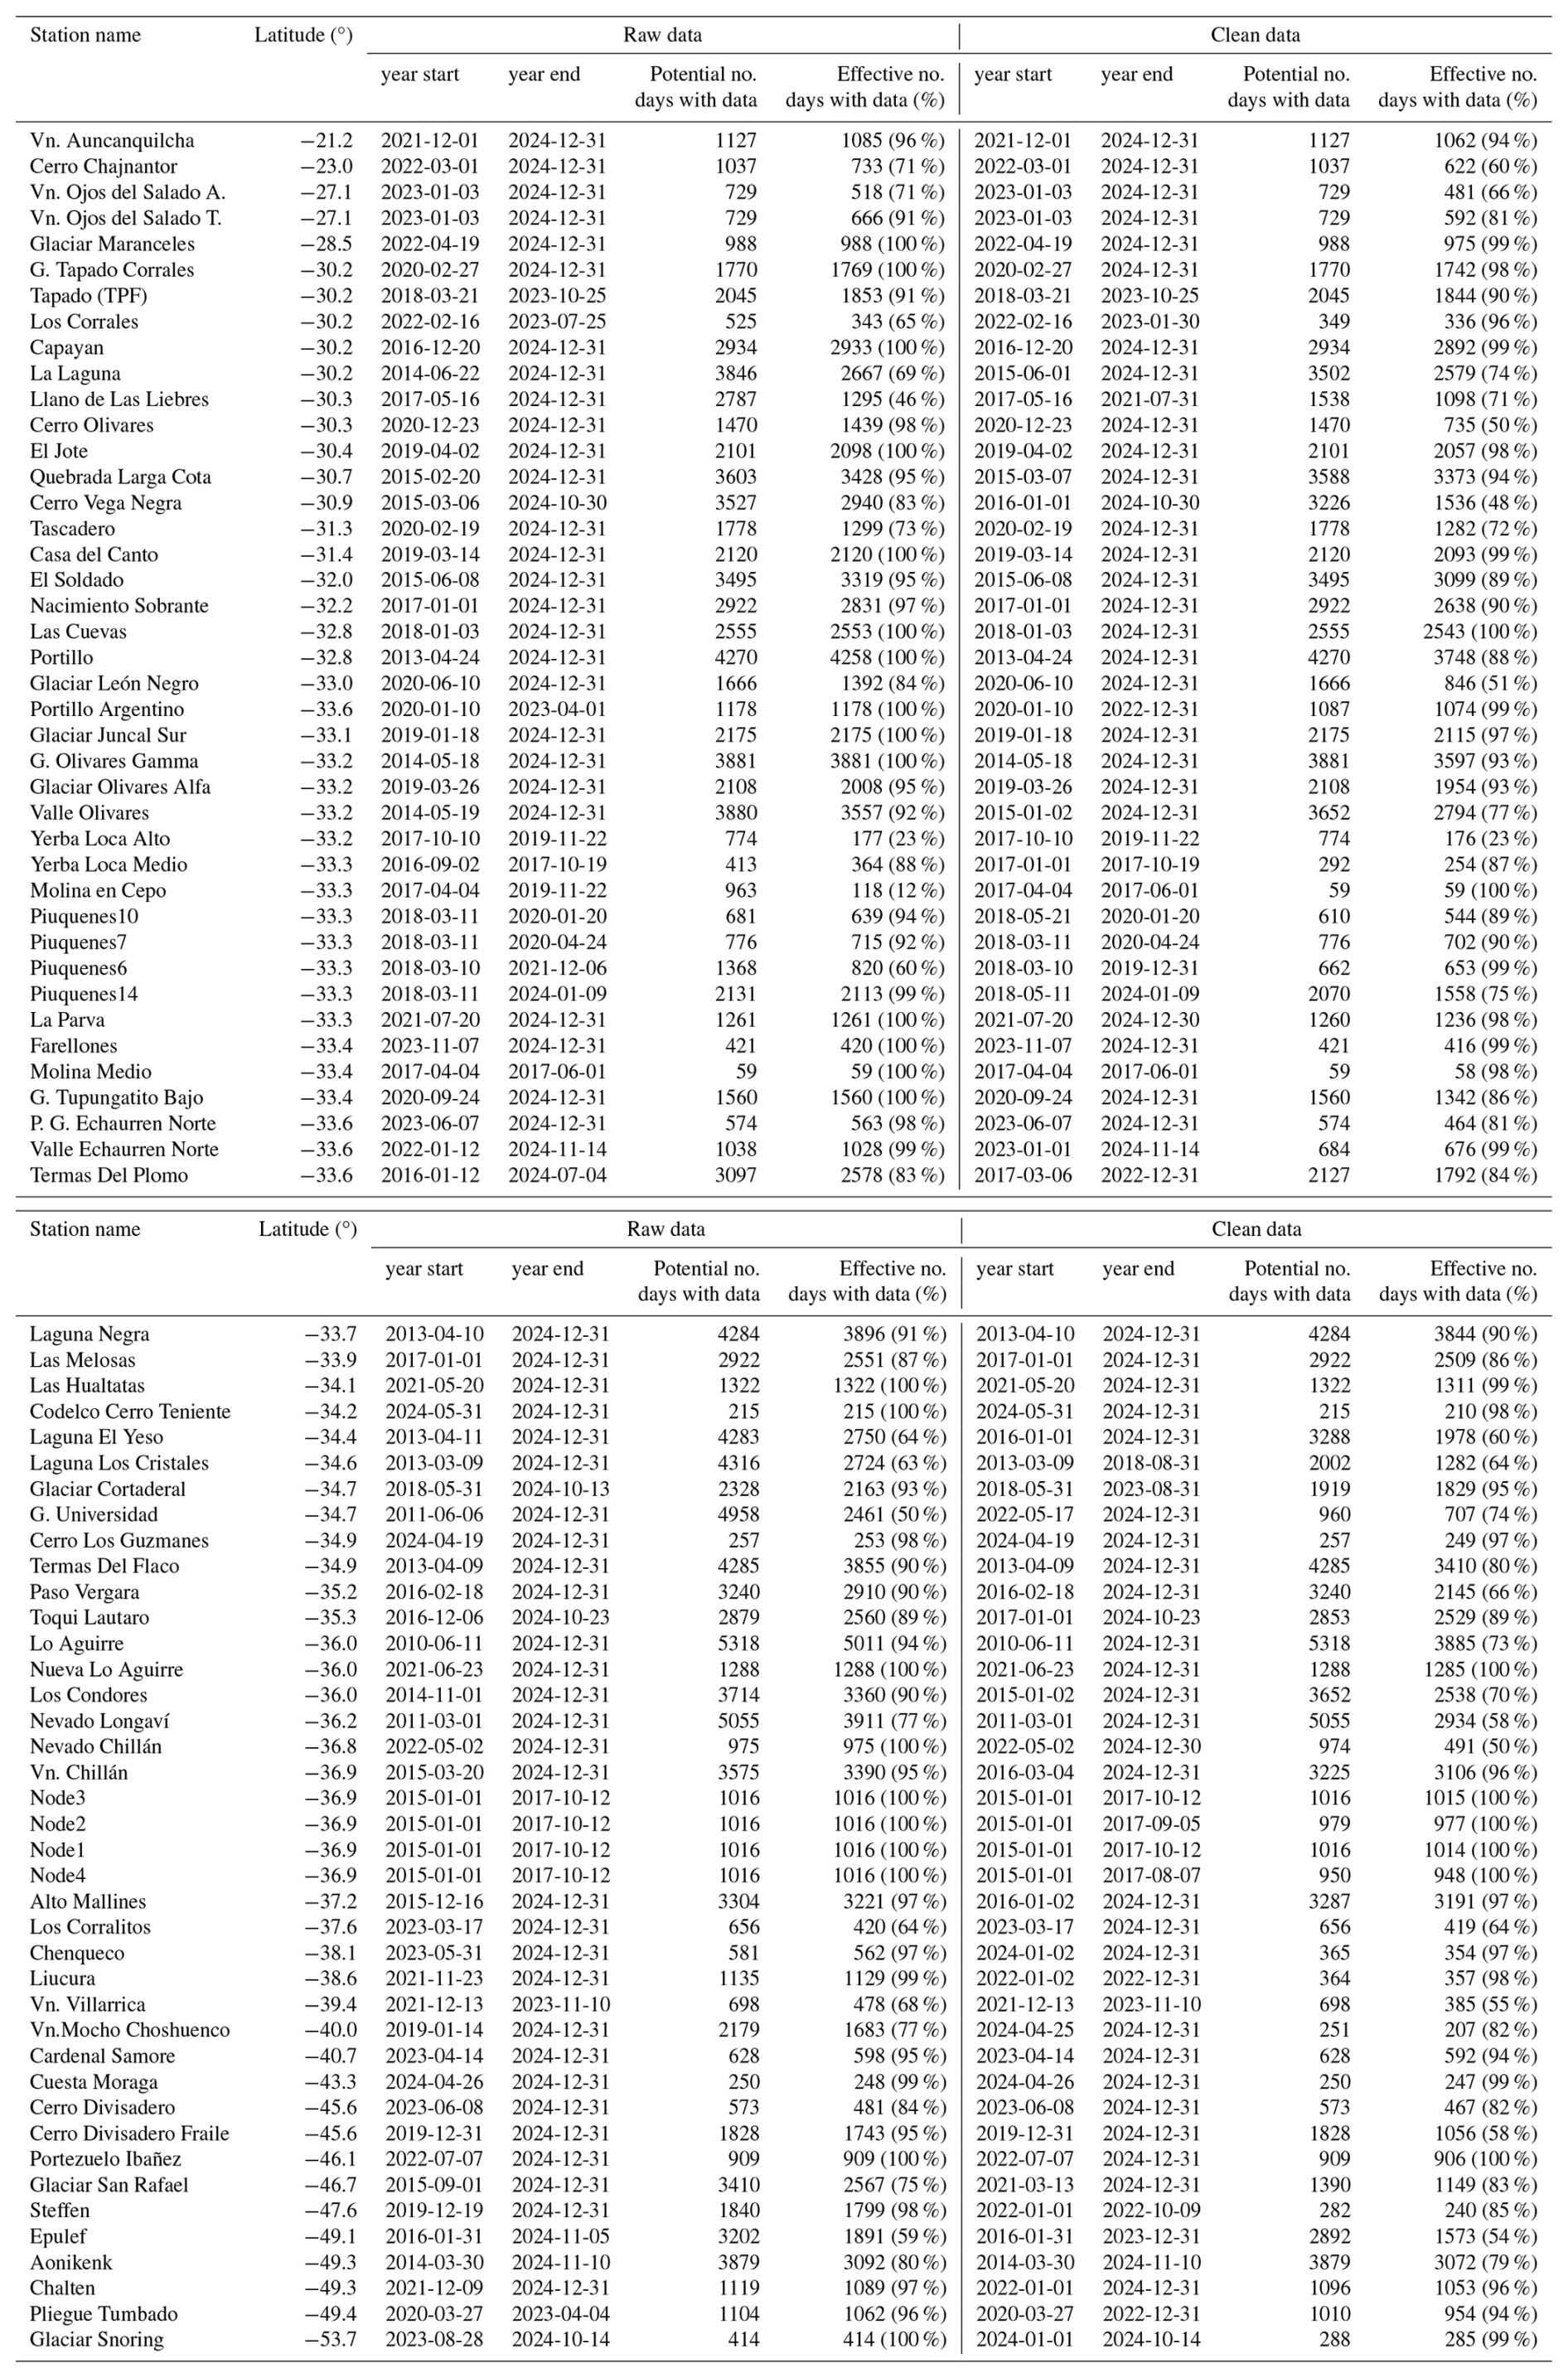
Table A5Summary of raw data reduction of successive quality-control filters for PCI construction.
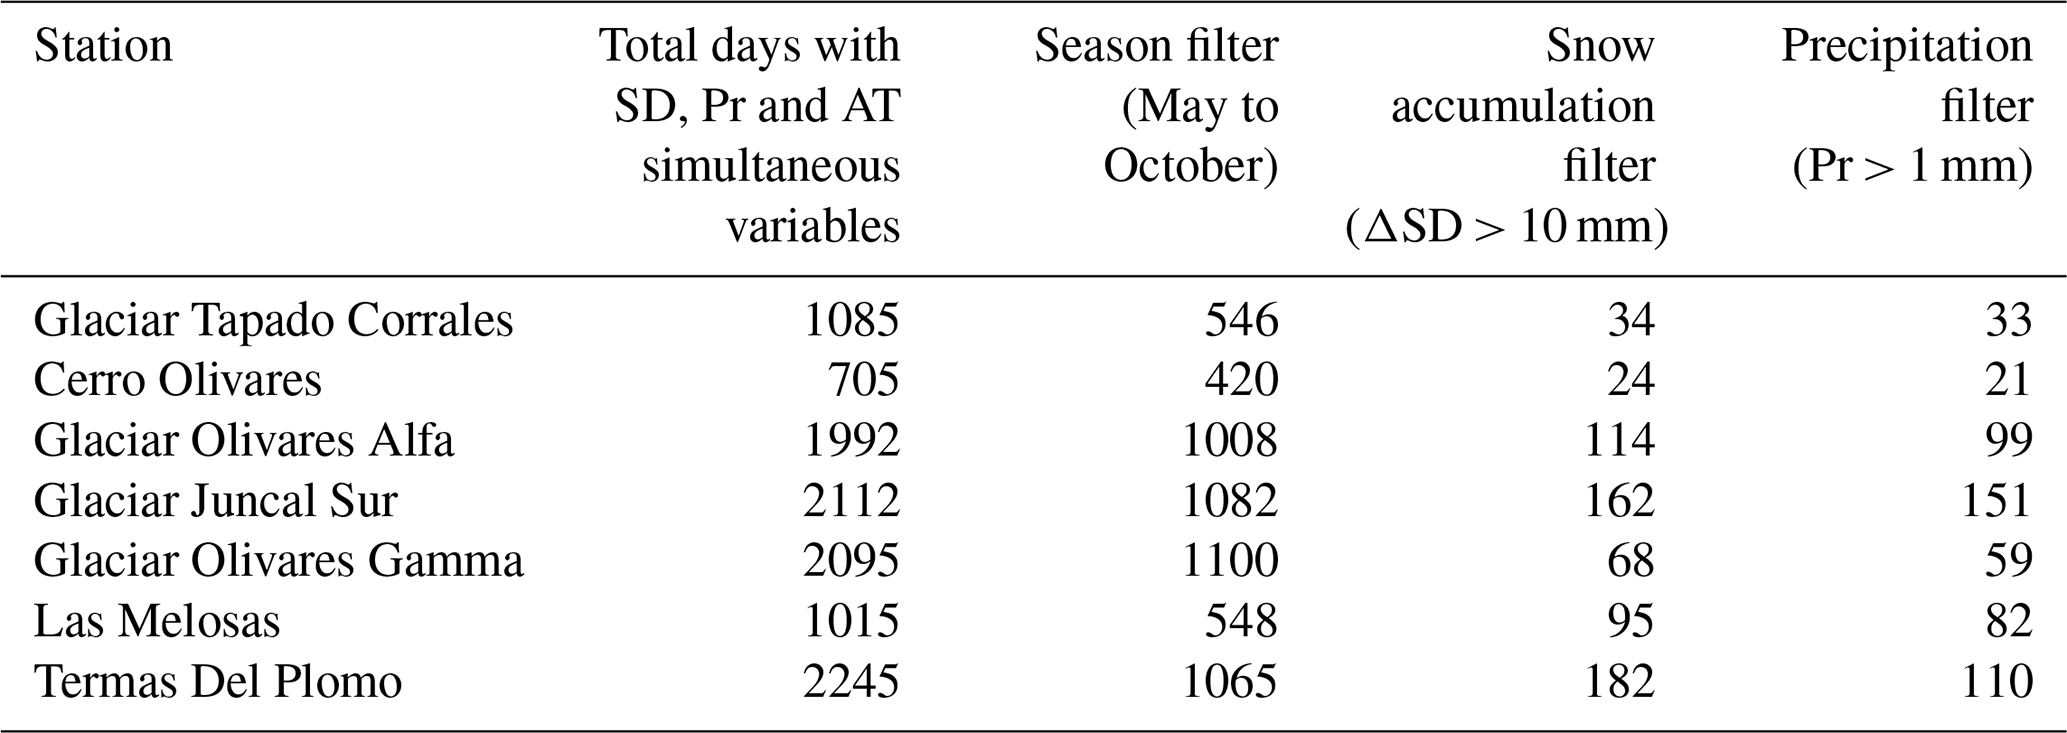
Table A6Summary of clean data reduction of successive quality-control filters for PCI construction.
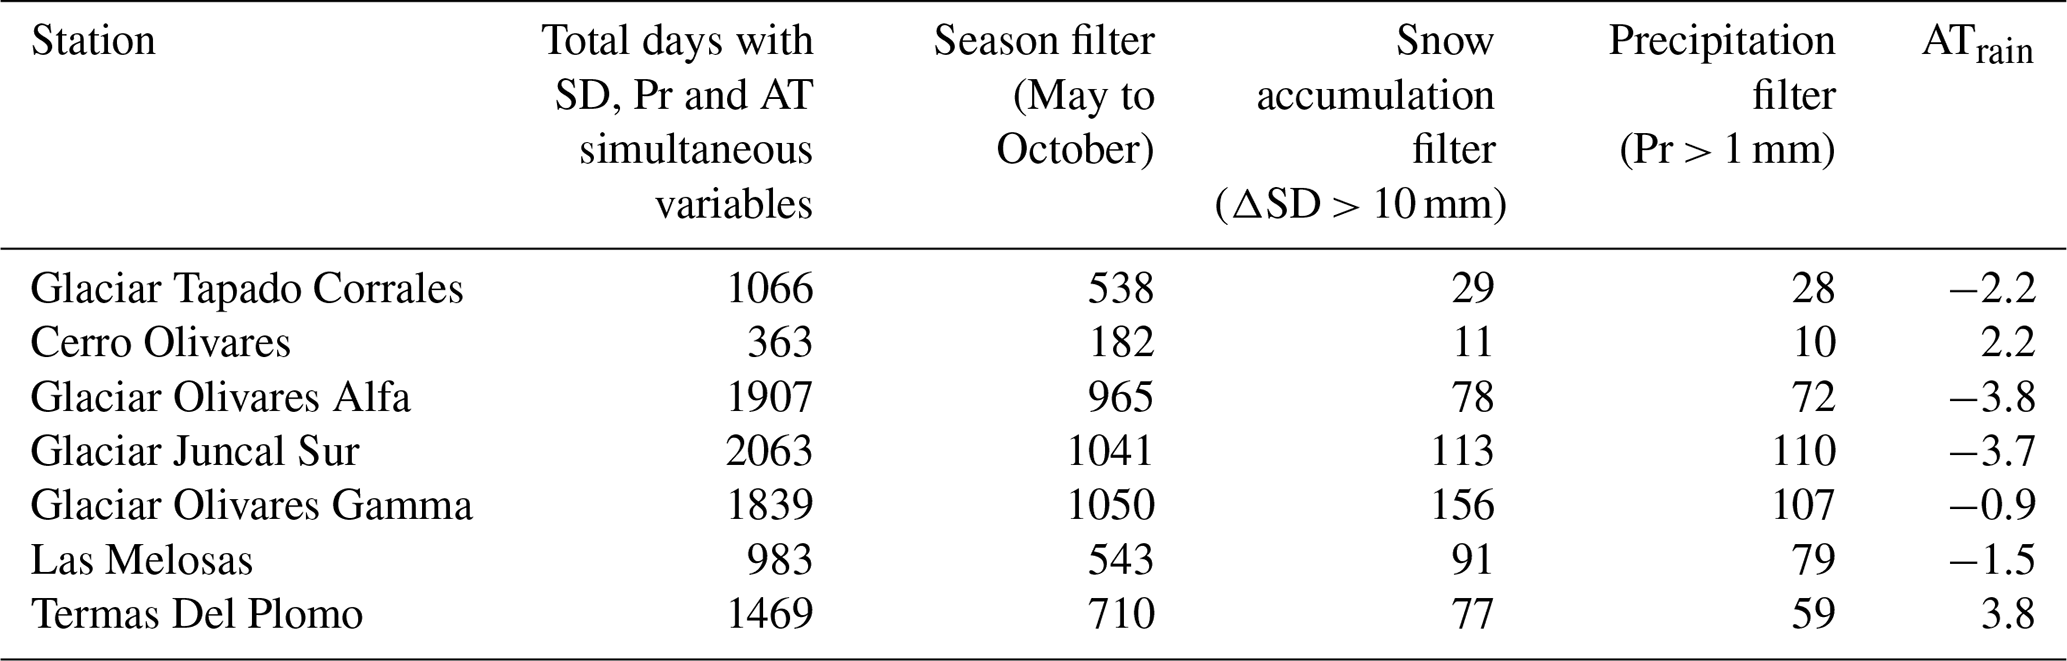
AC conceived the study and defined its scope. AC and JM compiled the station dataset, designed the quality-control procedure, performed the analyses, and prepared the tables and figures. JM developed the quality-control algorithm. AC drafted the first version of the manuscript. All co-authors reviewed and revised the manuscript.
The contact author has declared that none of the authors has any competing interests.
Publisher's note: Copernicus Publications remains neutral with regard to jurisdictional claims made in the text, published maps, institutional affiliations, or any other geographical representation in this paper. The authors bear the ultimate responsibility for providing appropriate place names. Views expressed in the text are those of the authors and do not necessarily reflect the views of the publisher.
The authors gratefully acknowledge DGA, CEAZA, the Department of Civil Engineering at the University of Chile, Marlene Huerta, CIEP, CECS, and IANIGLA for providing the snow depth data used in this study. We also thank Valentina Contreras and Antonia Flores for their contributions to data compilation. Finally, we thank the reviewers for their constructive comments, which helped improve the quality of this article.
This research has been supported by the Fondo de Fomento al Desarrollo Científico y Tecnológico (ANID/FONDEF/N.IT24I0092; ANID/FONDECYT/POSTDOCTORADO/N.3261164).
This paper was edited by Chris DeBeer and reviewed by two anonymous referees.
Aguayo, R., León-Muñoz, J., Aguayo, M., Baez-Villanueva, O., Fernandez, A., Zambrano-Bigiarini, M., Fernández, A., and Jacques-Coper, M.: PatagoniaMet: A multi-source hydrometeorological dataset for Western Patagonia, Sci. Data., 11, 6, https://doi.org/10.1038/s41597-023-02828-2, 2024.
Alvarez-Garreton, C., Boisier, J. P., Garreaud, R., Seibert, J., and Vis, M.: Progressive water deficits during multiyear droughts in basins with long hydrological memory in Chile, Hydrol. Earth Syst. Sci., 25, 429–446, https://doi.org/10.5194/hess-25-429-2021, 2021.
Alvial Vásquez, F.-J., Abarca-del-Río, R., and Ávila, A. I.: High-Resolution Precipitation Gridded Dataset on the South-Central Zone (34° S–41° S) of Chile, Front. Earth Sci., 8, 519975, https://doi.org/10.3389/feart.2020.519975, 2020.
Ayala, Á., Pellicciotti, F., Peleg, N., and Burlando, P.: Melt and surface sublimation across a glacier in a dry environment: distributed energy-balance modelling of Juncal Norte Glacier, Chile, J. Glaciol., 63, 803–822, https://doi.org/10.1017/jog.2017.46, 2017.
Ayala, Á., Farías-Barahona, D., Huss, M., Pellicciotti, F., McPhee, J., and Farinotti, D.: Glacier runoff variations since 1955 in the Maipo River basin, in the semiarid Andes of central Chile, The Cryosphere, 14, 2005–2027, https://doi.org/10.5194/tc-14-2005-2020, 2020.
Ayala, Á., Muñoz-Castro, E., Farinotti, D., Farías-Barahona, D., Mendoza, P. A., MacDonell, S., McPhee, J., Vargas, X., and Pellicciotti, F.: Less water from glaciers during future megadroughts in the Southern Andes, Commun. Earth Environ., 6, 860, https://doi.org/10.1038/s43247-025-02845-6, 2025.
Bulovic, N., Johnson, F., Lievens, H., Shaw, T. E., McPhee, J., Gascoin, S., Demuzere, M., and McIntyre, N.: Evaluating the performance of Sentinel-1 SAR derived snow depth retrievals over the extratropical Andes Cordillera, Water Resour. Res., 61, https://doi.org/10.1029/2024WR037766, 2025.
Burger, F., Ayala, Á., Farías, D., Shaw, T. E., MacDonell, S., Brock, B., McPhee, J., and Pellicciotti, F.: Interannual variability in glacier contribution to runoff from a high-elevation Andean catchment: Understanding the role of debris cover in glacier hydrology, Hydrol. Process., 33, 214–229, https://doi.org/10.1002/hyp.13354, 2019.
Caro, A., Condom, T., and Rabatel, A.: Climatic and morphometric explanatory variables of glacier changes in the Andes (8–55° S): New insights from machine learning approaches, Front. Earth Sci., 9, 713011, https://doi.org/10.3389/feart.2021.713011, 2021.
Caro, A., Condom, T., Rabatel, A., Champollion, N., García, N., and Saavedra, F.: Hydrological response of Andean catchments to recent glacier mass loss, The Cryosphere, 18, 2487–2507, https://doi.org/10.5194/tc-18-2487-2024, 2024.
Caro, A., Condom, T., Rabatel, A., Aguayo, R., and Champollion, N.: Future glacio–hydrological changes in the Andes: a focus on near-future projections up to 2050, Sci. Rep., 15, 10991, https://doi.org/10.1038/s41598-025-88069-2, 2025.
Cordero, R. R., Feron, S., Damiani, A., MacDonell, S., Carrasco, J., Pizarro, J., Karas, C., Jorquera, J., Sepulveda, E., Cabello, F., Fernandoy, F., Wang, C., Khan, A. L., and Casassa, G.: Rapid decline in extratropical Andean snow cover driven by the poleward migration of the Southern Hemisphere westerlies, Sci. Rep., 14, 26365, https://doi.org/10.1038/s41598-024-78014-0, 2024.
Cornwell, E., Molotch, N. P., and McPhee, J.: Spatio-temporal variability of snow water equivalent in the extra-tropical Andes Cordillera from distributed energy balance modeling and remotely sensed snow cover, Hydrol. Earth Syst. Sci., 20, 411–430, https://doi.org/10.5194/hess-20-411-2016, 2016.
Cortés, G. and Margulis, S.: Impacts of El Niño and La Niña on interannual snow accumulation in the Andes: Results from a high-resolution 31-year reanalysis, Geophys. Res. Lett., 44, 6859–6867, https://doi.org/10.1002/2017GL073826, 2017.
Durre, I., Menne, M. J., Gleason, B. E., Houston, T. G., and Vose, R. S.: Comprehensive automated quality assurance of daily surface observations, J. Appl. Meteorol. Clim., 49, 1615–1633, https://doi.org/10.1175/2010JAMC2375.1, 2010.
Dussaillant, A., Buytaert, W., Meier, C., and Espinoza, F.: Hydrological regime of remote catchments with extreme gradients under accelerated change: the Baker basin in Patagonia, Hydrolog. Sci. J., 57, 1530–1542, https://doi.org/10.1080/02626667.2012.726993, 2012.
Farr, T. G., Rosen, P. A., Caro, E., Crippen, R., Duren, R., Hensley, S., Kobrick, M., Paller, M., Rodriguez, E., Roth, L., Seal, D., Shaffer, S., Shimada, J., Umland, J., Werner, M., Oskin, M., Burbank, D., and Alsdorf, D.: The Shuttle Radar Topography Mission, Rev. Geophys., 45, RG2004, https://doi.org/10.1029/2005RG000183, 2007.
Garreaud, R. D., Alvarez-Garreton, C., Barichivich, J., Boisier, J. P., Christie, D., Galleguillos, M., LeQuesne, C., McPhee, J., and Zambrano-Bigiarini, M.: The 2010–2015 megadrought in central Chile: impacts on regional hydroclimate and vegetation, Hydrol. Earth Syst. Sci., 21, 6307–6327, https://doi.org/10.5194/hess-21-6307-2017, 2017.
Garreaud, R. D., Boisier, J. P., Rondanelli, R., Montecinos, A., Sepúlveda, H. H., and Veloso-Aguila, D.: The central Chile mega drought (2010–2018): A climate dynamics perspective, Int. J. Climatol., 40, 421–439, https://doi.org/10.1002/joc.6219, 2020.
Garreaud, R., Boisier, J. P., Alvarez-Garreton, C., Christie, D. A., Carrasco-Escaff, T., Vergara, I., Chávez, R. O., Aldunce, P., Camus, P., Suazo-Álvarez, M., Masiokas, M., Castro, G., Muñoz, A., Zambrano-Bigiarini, M., Fuster, R., and Godoy, L.: Hyperdroughts in central Chile: drivers, impacts, and projections, Hydrol. Earth Syst. Sci., 29, 5347–5369, https://doi.org/10.5194/hess-29-5347-2025, 2025.
Grünewald, T., Bühler, Y., and Lehning, M.: Elevation dependency of mountain snow depth, The Cryosphere, 8, 2381–2394, https://doi.org/10.5194/tc-8-2381-2014, 2014.
Huerta, M. L., Molotch N. P., and McPhee J.: Snowfall interception in a deciduous Nothofagus forest and implications for spatial snowpack distribution, Hydrol. Process., 33, 1818–1834, https://doi.org/10.1002/hyp.13439, 2019.
Instituto Nacional de Estadísticas (INE): Gráficas nacionales – Resultados del VIII Censo Nacional Agropecuario y Forestal, https://www.ine.gob.cl/censoagropecuario/resultados-finales/graficas-nacionales (last access: 10 December 2025), 2022.
Instituto Nacional de Estadísticas (INE): Resultados Censo 2024, https://censo2024.ine.gob.cl/resultados/ (last access: 10 December 2025), 2024.
Krogh, S. A., Pomeroy, J. W., and McPhee, J.: Physically based mountain hydrological modeling using reanalysis data in Patagonia, J. Hydrometeorol., 16, 172–193, https://doi.org/10.1175/JHM-D-13-0178.1, 2015.
MacDonell, S., Kinnard, C., Mölg, T., Nicholson, L., and Abermann, J.: Meteorological drivers of ablation processes on a cold glacier in the semi-arid Andes of Chile, The Cryosphere, 7, 1513–1526, https://doi.org/10.5194/tc-7-1513-2013, 2013.
Masiokas, M. H., Christie, D. A., Le Quesne, C., Pitte, P., Ruiz, L., Villalba, R., Luckman, B. H., Berthier, E., Nussbaumer, S. U., González-Reyes, Á., McPhee, J., and Barcaza, G.: Reconstructing the annual mass balance of the Echaurren Norte glacier (Central Andes, 33.5° S) using local and regional hydroclimatic data, The Cryosphere, 10, 927–940, https://doi.org/10.5194/tc-10-927-2016, 2016.
Masiokas, M. H., Cara, L., Villalba, R., Pitte, P., Luckman, B. H., Toum, E., Christie, D. A., Le Quesne, C., and Mauget, S.: Streamflow variations across the Andes (18°–55° S) during the instrumental era, Sci. Rep., 9, 17879, https://doi.org/10.1038/s41598-019-53981-x, 2019.
Masiokas, M. H., Rabatel, A., Rivera, A., Ruiz, L., Pitte, P., Ceballos, J. L., Barcaza, G., Soruco, A., Bown, F., Berthier, E., Dussaillant, I., and MacDonell, S.: A review of the current state and recent changes of the Andean cryosphere, Front. Earth Sci., 8, 99, https://doi.org/10.3389/feart.2020.00099, 2020.
Medina, J. : javiermedinamen-art/hidromet: July 25, 2026 (v4) Dataset Open The Southern Andes Daily Snow Depth Dataset (2010–2024): Quality-Controlled Dataset from Chile and Argentina, Zenodo [data set], https://doi.org/10.5281/zenodo.22918463, 2026.
Medina, J. and Caro, A.: The Southern Andes Daily Snow Depth Dataset (2010–2024): quality-controlled dataset from Chile and Argentina, Zenodo [data set], https://doi.org/10.5281/zenodo.21577171, 2026.
Mendoza, P. A., Shaw, T. E., McPhee, J., Musselman, K. N., Revuelto, J., and MacDonell, S.: Spatial distribution and scaling properties of lidar-derived snow depth in the extratropical Andes, Water Resour. Res., 56, e2020WR028480, https://doi.org/10.1029/2020WR028480, 2020.
Ntokas, K. F. F., Odry, J., Boucher, M.-A., and Garnaud, C.: Investigating ANN architectures and training to estimate snow water equivalent from snow depth, Hydrol. Earth Syst. Sci., 25, 3017–3040, https://doi.org/10.5194/hess-25-3017-2021, 2021.
Perkins, R. M. and Jones, J. A.: Climate variability, snow, and physiographic controls on storm hydrographs in small forested basins, western Cascades, Oregon, Hydrol. Process., 22, 4949–4964, https://doi.org/10.1002/hyp.7117, 2008.
Rivera, D., Godoy-Faúndez, A., Lillo, M., Alvez, A., Delgado, V., Gonzalo-Martín, C., Menasalvas, E., Costumero, R., and García-Pedrero, Á.: Legal disputes as a proxy for regional conflicts over water rights in Chile, J. Hydrol., 535, 36–45, https://doi.org/10.1016/j.jhydrol.2016.01.057, 2016.
Rousseeuw, P. J. and Croux, C.: Alternatives to the Median Absolute Deviation, J. Am. Stat. Assoc., 88, 1273–1283, https://doi.org/10.1080/01621459.1993.10476408, 1993.
Saavedra, F. A., Kampf, S. K., Fassnacht, S. R., and Sibold, J. S.: A snow climatology of the Andes Mountains from MODIS snow cover data, Int. J. Climatol., 37, 1526–1539, https://doi.org/10.1002/joc.4795, 2017.
Saavedra, F. A., Kampf, S. K., Fassnacht, S. R., and Sibold, J. S.: Changes in Andes snow cover from MODIS data, 2000–2016, The Cryosphere, 12, 1027–1046, https://doi.org/10.5194/tc-12-1027-2018, 2018.
Saavedra, F., Hernández-Duarte, A., Caro, A., Rabatel, A., Fassnacht, S., Condom, T., Kampf, S., Masiokas, M., Romero, C., Aguirre, Y., González, D., Contreras, V., Medina, J., and Arancibia, P.: Spatial and temporal variability of snow in the Andes using MODIS snow product 2000–2025, Front. Earth Sci., 14, 1564035, https://doi.org/10.3389/feart.2026.1564035, 2026.
Sarricolea, P., Herrera-Ossandon, M., and Meseguer-Ruiz, Ó.: Climatic regionalisation of continental Chile, J. Maps, 13, 66–73, https://doi.org/10.1080/17445647.2016.1259592, 2017.
Scaff, L., Rutllant, J. A., Rahn, D., Gascoin, S., and Rondanelli, R.: Meteorological interpretation of orographic precipitation gradients along an andes west slope basin at 30° S (Elqui valley, Chile), J. Hydrometeorol., 18, 713–727, https://doi.org/10.1175/JHM-D-16-0073.1, 2017.
Schaefer, M., Fonseca-Gallardo, D., Farías-Barahona, D., and Casassa, G.: Surface energy fluxes on Chilean glaciers: measurements and models, The Cryosphere, 14, 2545–2565, https://doi.org/10.5194/tc-14-2545-2020, 2020.
Shaw, T. E., Caro, A., Mendoza, P., Ayala, Á., Pellicciotti, F., Gascoin, S., and McPhee, J.: The utility of optical satellite winter snow depths for initializing a glacio-hydrological model of a high-elevation Andean catchment, Water Resour. Res., 56, e2020WR027188, https://doi.org/10.1029/2020WR027188, 2020a.
Shaw, T. E., Gascoin, S., Mendoza, P. A., Pellicciotti, F., and McPhee, J.: Snow Depth Patterns in a High Mountain Andean Catchment from Satellite Optical Tristereoscopic Remote Sensing, Water Resour. Res., 56, https://doi.org/10.1029/2019wr024880, 2020b.
Stewart, I. T.: Changes in snowpack and snowmelt runoff for key mountain regions, Hydrol. Process., 23, 78–94,https://doi.org/10.1002/hyp.7128, 2009.
The pandas development team: pandas-dev/pandas: Pandas (version 2.3.0), Zenodo [code], https://doi.org/10.5281/zenodo.15597513, 2025.
Viale, M. and Nuñez, M. N.: Climatology of Winter Orographic Precipitation over the Subtropical Central Andes and Associated Synoptic and Regional Characteristics, J. Hydrometeorol., 12, 481–507, https://doi.org/10.1175/2010JHM1284.1, 2011.
Voordendag, A., Réveillet, M., MacDonell, S., and Lhermitte, S.: Snow model comparison to simulate snow depth evolution and sublimation at point scale in the semi-arid Andes of Chile, The Cryosphere, 15, 4241–4259, https://doi.org/10.5194/tc-15-4241-2021, 2021.