the Creative Commons Attribution 4.0 License.
the Creative Commons Attribution 4.0 License.
 | 24 Sep 2026
Italian Fluvial Sediment Transport Database: a comprehensive hub for archiving and analyzing hydrological data
Marco Luppichini

Francesco Comiti
Andrea Andreoli
Barbara Aldighieri
Paolo Billi
Irene Maria Bollati
Andrea Brenna
Diletta Chirici
Paolo Ciavola
Silvia Cilli
Marco Donnini
Simona Francalanci
Lorenzo Innocenti
Laura Longoni
Luca Mao
Ivan Marchesini
Ilenia Murgia
Giacomo Pellegrini
Daniele Penna
Lorenzo Picco
Riccardo Rainato
Leonardo Schippa
Luca Solari
Gianluca Tronti
Bruno Testa
Matteo Verdone
Monica Bini
Fluvial sediment transport plays a key role in geomorphological and hydrological processes, influencing river morphology, watershed and coastal sediment balances, and the environmental response to climatic and anthropogenic changes. In Italy, the availability of homogeneous and long-term data is strongly limited due to the discontinuity of monitoring activities and the fragmentation of existing sources. This study presents the development of a relational database and web application specifically designed for the collection, storage, and consultation of sediment transport data, aimed at integrating and enhancing heterogeneous datasets from both historical and contemporary monitoring networks: the Italian Fluvial Sediment Transport Database (ITASED). The database architecture, developed in PostgreSQL with the PostGIS extension, enables a direct link between observational data and their associated geographical, instrumental, and methodological metadata, ensuring traceability, interoperability, and the possibility to perform multi-temporal analyses. The web interface, built using open-source technologies, allows controlled data entry and interactive data exploration through maps, tables, and export functions. Analysis of the archived datasets highlights strong instrumental, temporal, and spatial heterogeneity: some physical-chemical parameters (e.g., pH and electrical conductivity) show standardized measurement protocols, whereas sediment transport variables exhibit high methodological variability. Time series range from sub-daily to annual observations, with denser coverage in northern Italian basins (e.g., Po, Adige, Piave, Tagliamento) since 1924. Despite these inconsistencies, integration within a unified relational framework enhances the value of a largely underused data heritage. The experience gained through this project enabled the identification of both the limitations and the potential of Italy's sediment monitoring system, providing operational guidance for methodological standardization, metadata improvement, and data harmonization at the national scale. The ITASED represents a concrete step toward establishing a shared sedimentological archive that supports scientific research, environmental management, and sustainable river basin planning. The dataset is publicly available on Zenodo at https://doi.org/10.5281/zenodo.18799025 (Luppichini et al., 2026).
- Article
(15572 KB) - Full-text XML
- BibTeX
- EndNote


Sediment transport in rivers plays a key role in geomorphological and hydrological processes, shaping the morphological evolution of fluvial environments, influencing the sediment balances at the catchment scale and in coastal areas (Fortesa et al., 2021; Vercruysse et al., 2017; Zarfl and Dunn, 2022). Sediments carried by rivers contribute to the genesis of floodplains, deltas, and sediment replenishment in coastal systems, processes that have significant ecological and economic implications (Leatherman et al., 2000; Luppichini and Bini, 2025; Zhang et al., 2004). Their dynamics result from a complex interplay of multiple watershed local characteristics, including climatic conditions, geomorphological features, geological substrate, vegetation cover, and anthropogenic activities (Cox et al., 2021; Wei et al., 2023; Zhang et al., 2024). This interdependence among the aforementioned factors is central to the study of fluvial systems and represents a critical research field for understanding the mechanisms driving these phenomena and for developing targeted strategies for sustainable land management (Asselman, 1995; Gurnell et al., 2002; Hooke, 2006; Naik and Jay, 2011).
The extent and nature of these interactions vary considerably across basins. For example, climatic fluctuations, including changes in precipitation patterns and temperature, along with the intensification of natural disturbances, directly affect sediment mobilization and transport by modifying both sediment availability and the transport capacity of river flows (Jadhav et al., 2024). Furthermore, anthropogenic activities such as afforestation-deforestation dynamics, urban expansion, infrastructure development, in-channel sediment mining and water resource management have profoundly modified sediment transport regimes. These interventions can alter erosional processes in mountainous catchments, disrupt natural sediment fluxes through the construction of dams, weirs and check-dams, and modify sediment transport capacity via water abstraction or river channelization and training (Asselman, 1995; Favaro and Lamoureux, 2015; Naik and Jay, 2011; Rodríguez-Blanco et al., 2016; Surian and Rinaldi, 2004; Thodsen et al., 2008).
Despite the importance of these phenomena, a comprehensive understanding of the interactions between climatic variability, anthropogenic pressures, and sediment dynamics is often hampered by the lack of systematic monitoring data and by the fragmented accessibility of existing records. This limitation is particularly critical because fluvial sediment transport is an extremely complex process, featuring high spatial and temporal variability, and it is composed of two fractions (suspended load and bedload), which are controlled by partly distinct mechanisms. Therefore, such fractions may respond differently to natural and human-driven pressures. Suspended sediment transport is generally more directly linked to the mobilization of fine material from hillslopes (featuring different land uses), floodplains and channel banks, and is strongly influenced by precipitation intensity, runoff generation and vegetation cover (Battista et al., 2020; Fryirs, 2013; Vercruysse et al., 2017). In comparison to the suspended fraction, bedload transport, is more strongly dependent on the availability within the catchment of mobile coarser fractions, as well as on their connectivity within and to the channel network. Additional important factors for bedload fluxes are channel morphology, grain-size distribution, transport thresholds, and the occurrence and legacy of flood events (Surian and Rinaldi, 2004).
For this reason, the use of undifferentiated or poorly documented sediment datasets can limit the interpretation of hydro-sedimentary processes and may lead to misleading estimates of total sediment transport. Properly separated datasets for suspended load, bedload, and, where available, total load are therefore needed to distinguish the processes involved, evaluate the role of natural and anthropogenic drivers, and assess sediment budgets at the catchment scale. This requirement is particularly relevant for long-term analyses, where changes in monitoring methods, sampling frequency, instrumentation, and metadata completeness can strongly affect data comparability. This condition, with some degree of variability, is widely observed at the global scale (Walling and Fang, 2003). In particular, the scarcity of long, continuous, and consistent time series represents a significant obstacle to quantifying the specific contribution of climatic and anthropogenic factors to the different components of sediment transport and to accurately predicting how future environmental changes may alter riverine and coastal sediment balances (Luppichini et al., 2024; Syvitski et al., 2005).
In Italy, this issue is particularly pronounced. From the 1930s to the 1990s, the Italian Hydrographic and Ocean Service (Servizio Idrografico e Mareografico Italiano, SIMI) played a crucial role in systematically collecting suspended sediment transport data from major rivers across the country. However, with the dissolution of the service in the 1990s, the responsibility for monitoring was transferred to regional authorities, which faced significant challenges in maintaining continuity (Billi and Spalevic, 2022). Nonetheless, monitoring activities persisted in some basins and research observatories, although often with limited resources and reduced operational capacity. Examples include long-term or repeated monitoring experiences in the Adige basin, in the Piave basin and Rio Cordon instrumented catchment, and in other northern Italian basins such as the Po and Tagliamento, where sediment transport and related hydrological variables continued to be investigated through regional monitoring activities and research-based initiatives (Bonfrisco et al., 2025; Pellegrini et al., 2023; Rainato et al., 2017, 2025). In central Italy, additional datasets from rivers such as the Arno, Ombrone, and Versilia further document the persistence of local monitoring and research efforts, although generally with more fragmented spatial and temporal coverage (Francalanci et al., 2013). This has led to a highly fragmented data landscape: on one hand, there are paper-based historical records that are difficult to access and are not fully exploited; on the other hand, more recent data have been collected sporadically by public agencies or research groups, often without national-level coordination. The lack of a centralized platform designed to collect and harmonize these datasets has hindered their use for long-term analyses and to support water and land management policies.
To address this critical issue, the present work addresses two main objectives. The first is to create and strengthen a network of experts who, both in Italy and abroad, have been collecting data on sediment transport for several decades. Establishing this network aims to foster knowledge exchange and best practices, encouraging greater collaboration among institutions, universities, and land management authorities. The second objective is to develop a centralized database designed to store both historical and future data, integrating them into a single, accessible, and well-structured repository. Although the database is centred on sediment transport, it was designed with a broader hydro-sedimentary perspective and therefore also includes associated hydrological and physicochemical variables, such as flow rate, flow height, temperature, pH, electrical conductivity, and major ions. These variables provide essential context for interpreting sediment dynamics and for analysing the relationships between river flow conditions, water properties, and sediment transport processes. As part of this process, a web-based call for sediment transport data was launched (in 2025) to collect existing sediment transport and related hydrological datasets from public institutions, research groups, river basin authorities, and monitoring agencies. In this study, the term “data call” refers to a targeted request for available datasets and metadata, especially for data not already accessible through open repositories or standardised national platforms. This step was also intended to consolidate the expert network mentioned above and to identify dispersed or poorly accessible datasets suitable for harmonisation within the proposed database.
Comparable harmonization efforts have long been implemented in hydrology through international initiatives such as the Global Runoff Data Centre (GRDC) (Färber et al., 2025) and the Global Streamflow Indices and Metadata archive (GSIM) (Do et al., 2018). These databases integrate streamflow records from multiple national agencies and research institutions, applying standardized metadata structures and quality-control procedures to ensure consistency and comparability across regions. In contrast, sediment transport data are still largely fragmented, often dispersed among individual research projects or local monitoring programs. The development of the present database represents a first step toward a similar level of coordination in the field of fluvial sediment monitoring, promoting interoperability and long-term data accessibility.
The adopted IT infrastructure, comprising the database architecture, server environment, and web-based interface, combines a solid, well-organised backend with a flexible, intuitive frontend. This approach ensures not only data security and integrity but also broader dissemination of information, making it accessible to both technical experts and users with limited expertise. The availability of a centralized platform marks a significant step forward in addressing the current gaps in sediment transport monitoring, providing a valuable tool for land management and scientific research. In the long term, this initiative could facilitate greater integration of sediment data at the European level, contributing to a more comprehensive understanding of sediment dynamics in response to climate change and anthropogenic pressures.
The conceptual and logical design of the database and its graphical interface was carried out in close collaboration with the research groups and technical partners involved to understand their specific needs for storing and accessing sediment transport data. This participatory process supported the development of a pragmatic and shared standardization strategy, aimed at organizing heterogeneous datasets within a common relational structure while preserving the traceability of original data sources, measurement methods, instruments, units, and access conditions. The rationale behind this strategy was not to define a universal standard for sediment transport data, but to provide a flexible and reproducible framework suitable for the available datasets and adaptable to future contributions from different institutions or monitoring traditions. The physical model of the database was implemented as PostgreSQL database, while data entry, consultation, and updating were managed through a custom-developed web application designed to provide a structured and user-friendly tool for data management and integrated analysis.
Before being uploaded to the database, the datasets underwent a data-curation workflow aimed at harmonising heterogeneous sources while preserving their original traceability. Candidate datasets were selected according to their relevance to sediment transport or associated hydrological and physicochemical variables, the availability of temporal information, and the possibility of linking the observations to a river, monitoring station, and watershed. Parameter names were harmonised using the internal database vocabulary, so that equivalent terms from different sources could be stored under a common parameter definition. Measurement units were checked against the units associated with each parameter in the database; when necessary, values were converted to the adopted standard unit, while the original source and methodological information were retained to preserve traceability. Missing metadata, such as instrument type, measurement method, sampling frequency, or access conditions, were not reconstructed when unavailable, but were explicitly recorded as missing or unknown. Potential duplicated observations were checked using combinations of station, parameter, date/time, value, and source information before upload. This workflow allowed heterogeneous historical and recent datasets to be integrated into a common relational structure while documenting the main limitations inherited from the original sources.
2.1 PostgreSQL Database
The database was developed in PostgreSQL and installed on a server machine accessible via the HTTPS protocol (https://lca.dst.unipi.it/, last access: 21 September 2026). PostgreSQL is an open-source relational database management system (RDBMS), known for its adherence to SQL standards and advanced features. It is designed to handle workloads ranging from small individual databases to large-scale management systems, typical of complex applications. PostgreSQL has been extended with the PostGIS library, which adds support for geospatial data, making it an advanced tool for storing, managing, and analyzing spatial and geographic data. It complies with the standards of the Open Geospatial Consortium (OGC), including the Simple Features for SQL and SQL/MM Spatial (Strobl, 2008).
The relational schema is shown in Fig. 1. The information has been divided into 15 tables that allow for the storage of highly varied data.
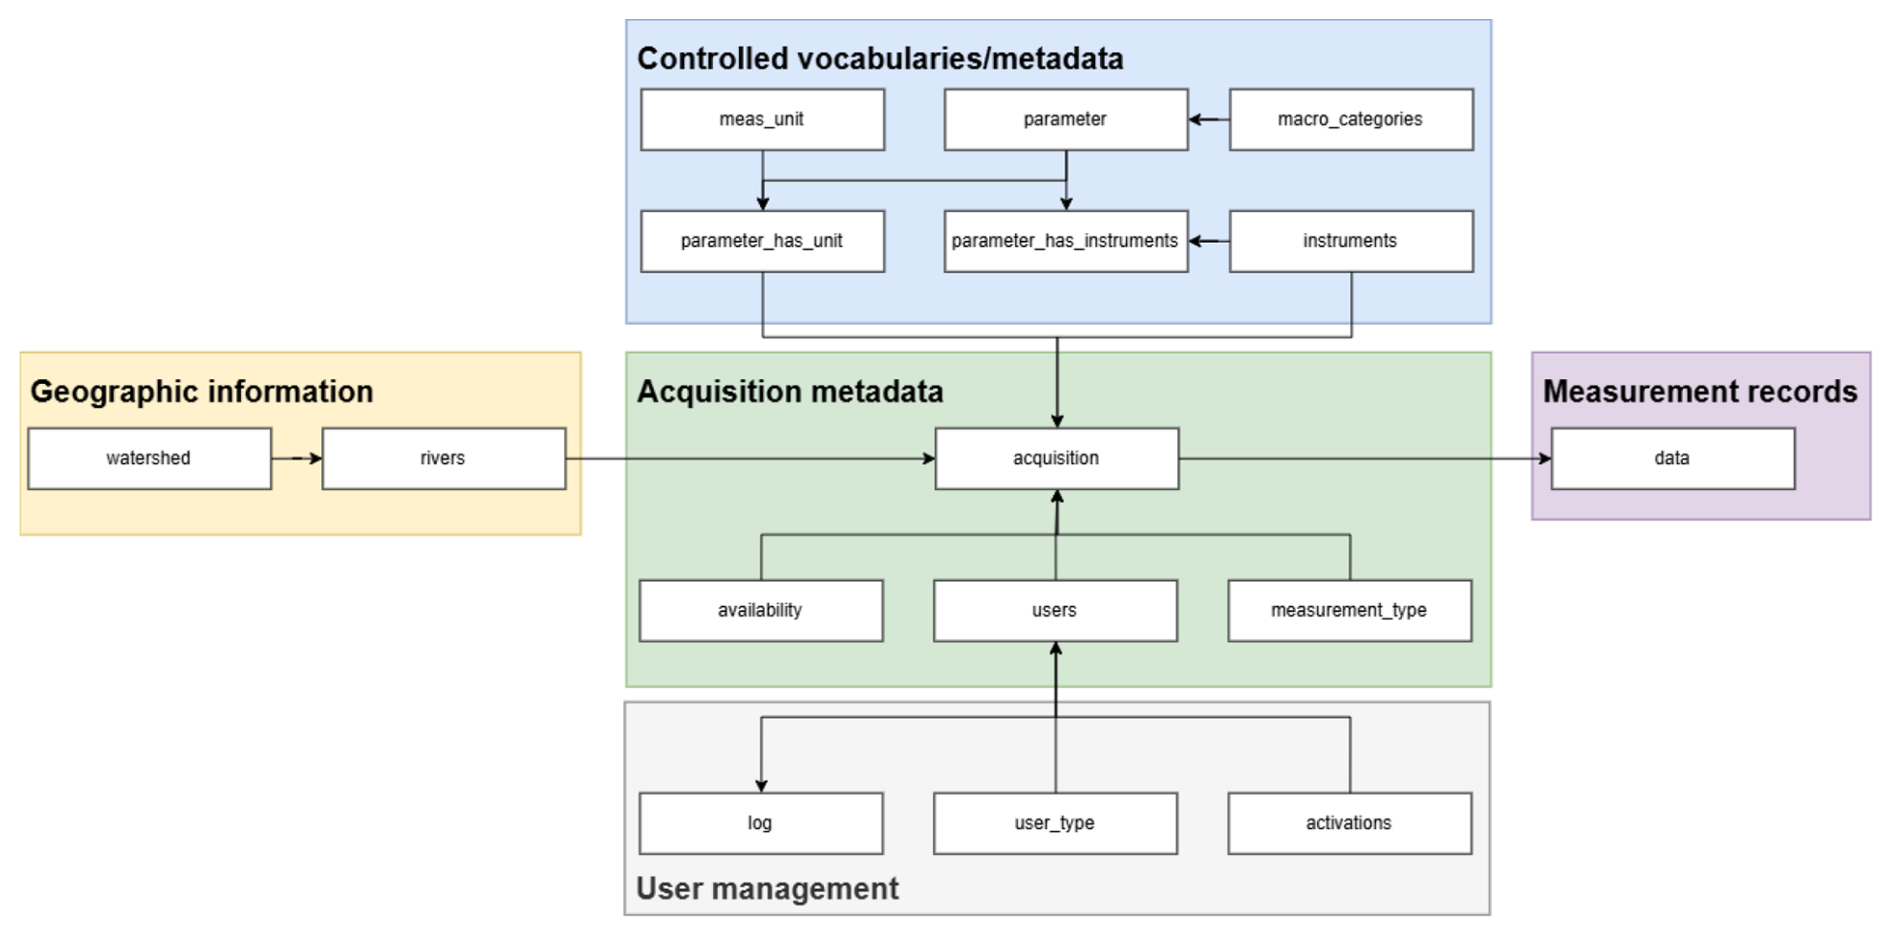
The “watershed” table represents the highest level of the geographic system and describes the watersheds, which represent the fundamental territorial unit for monitoring sediment transport. This table includes spatial information (geom), enabling integration with GIS systems, and descriptive attributes for the 272 main watersheds of Italy (http://sdi.isprambiente.it/geoserver/hy/bacini_principali/wfs?service=wfs&version=2.0.0&request=GetCapabilities, last access: 21 September 2026). Each watershed is linked to the corresponding river (in the “rivers” table). The “rivers” table represents the main watercourses that flow through the watersheds. Each river is associated with a watershed via the field id_watershed. This relationship allows rivers to be organized by their respective watersheds. The monitored rivers are described using a unique identifier (id) and a textual description (description), useful for identifying the river. The rivers serve as reference points for data acquisitions.
The “acquisition” table is the main repository for the data obtained from river monitoring. Each acquisition is geolocated using coordinates (coordx, coordy using the WGS84 coordinate reference system). The table also includes the monitored river (id_river), the measured parameter (id_parameter), the instrument used (id_instrument), the responsible user (id_user), additional information such as data availability (availability), specific reference (reference), and the monitoring section code (section_code). The acquisitions are also linked to a detail of the measurement type through id_meas_type.
The monitored parameters are defined in the “parameter” table. Each parameter describes a measurable element (e.g., pH, flow rate, velocity, suspended sediment concentration, etc.) and includes a textual description (description), a link to a general category through the field id_categorize, associated with the “macro_categories” table, which groups the parameters into broader categories (e.g., sediment concentration, river flow, chemical analysis, grain size, etc.). Parameters can be measured using different units of measurement and instruments, as described in the “parameter_has_unit” and “parameter_has_instruments” tables. The “instruments” table lists the tools used to collect field measurements. The “parameter_has_instruments” relationship establishes which instruments are used to measure each parameter. Each parameter is measured in a specific unit (e.g., °C, mg L−1), defined in the “meas_unit” table. This n:n association is managed through the “parameter_has_unit” table.
Finally, the collected data are stored in the “data” table, which archives the actual numerical values recorded during acquisitions. Each record in the table includes the measured value (value), the collection date (date), and a reference to the specific acquisition via id_acquisition.
This approach allows for the direct connection of the measured data to the geographical context, the monitored parameter, the instrument used, and the monitoring conditions.
Each data entry is linked to a responsible user (in the “users” table), which contains information about the system users, including personal details (name, surname, email) and technical information (affiliation, associated schema, last login date). It is related to the “user_type” table, which categorizes users based on their role or authorization. Users can be active or inactive (in the “activations” table) and can have different roles (editor or viewer) with varying permissions on the database through the web application management system.
The database and the web application are hosted on dedicated server machines provided by the University of Pisa and specifically configured for this project. This institutional hosting solution allows the platform to operate without direct maintenance costs for individual researchers and provides a more stable framework than project- or researcher-dependent storage solutions.
User roles are assigned by the database administrators after registration. By default, newly registered users are assigned a viewer role, allowing data consultation while preventing uncontrolled modifications or imports. When a user intends to contribute new datasets, an exchange with the database administrators is carried out during the account activation or role-upgrading phase, in order to evaluate the user's affiliation, expertise, type of contribution, and consistency of the proposed data with the database structure. Users recognized as data contributors can then be assigned an editor role. This approach is intended to preserve data integrity while keeping the platform open to future collaborations with institutions, research groups, and monitoring agencies.
At the present stage, quality control is mainly implemented as a first-level validation based on data traceability, controlled vocabularies, mandatory metadata fields, and consistency checks before records are written to the database. For historical datasets, the quality of the archived records necessarily depends on the completeness and reliability of the original sources and associated metadata. Therefore, the database does not remove all uncertainties related to past monitoring activities, but makes them explicit and traceable through the relational structure. For newly measured data, the same controlled workflow represents a first level of quality assurance, while the development of more detailed and documented quality-control guidelines is identified as a priority for future updates of the platform.
2.2 Web application
The web application (Fig. 2; https://lca.dst.unipi.it/SedimentTransport, last access: 21 September 2026) was developed to facilitate and control the database population and to provide tools for visualizing the data contained within it. It was built using open-source JavaScript and PHP libraries, primarily based on tools such as Bootstrap and OpenLayer. Access to the web application is granted after completing a registration form, during which the user selects their login credentials. Once the user is created, they must be approved by the database administrators, who will assign a user role (editor or viewer).
The application features a two-section layout (Fig. 2): on the left, there is a menu with various options (Home, Import Data, View Data), while the main screen is displayed in the center. The homepage provides summary information such as the number of records in the database (“Data”), the number of measurement points (“Stations”), the number of rivers with at least one data entry (“Rivers with available data”), the number of active users in the last six months (“Active Users”), and the number of user affiliations (“Affiliations”). It should be noted that the web platform is continuously updated; therefore, the numbers displayed in the interface may differ from those reported in the Results, which refer to the frozen database version used for the analyses presented in this manuscript.
The homepage, which appears as shown in Fig. 2, also displays a map with the measurement points available in the database. Additionally, a table is shown summarizing the data in the database. The maps in the web application are interactive: when clicking on the layers, specific information about the measurement site is displayed.
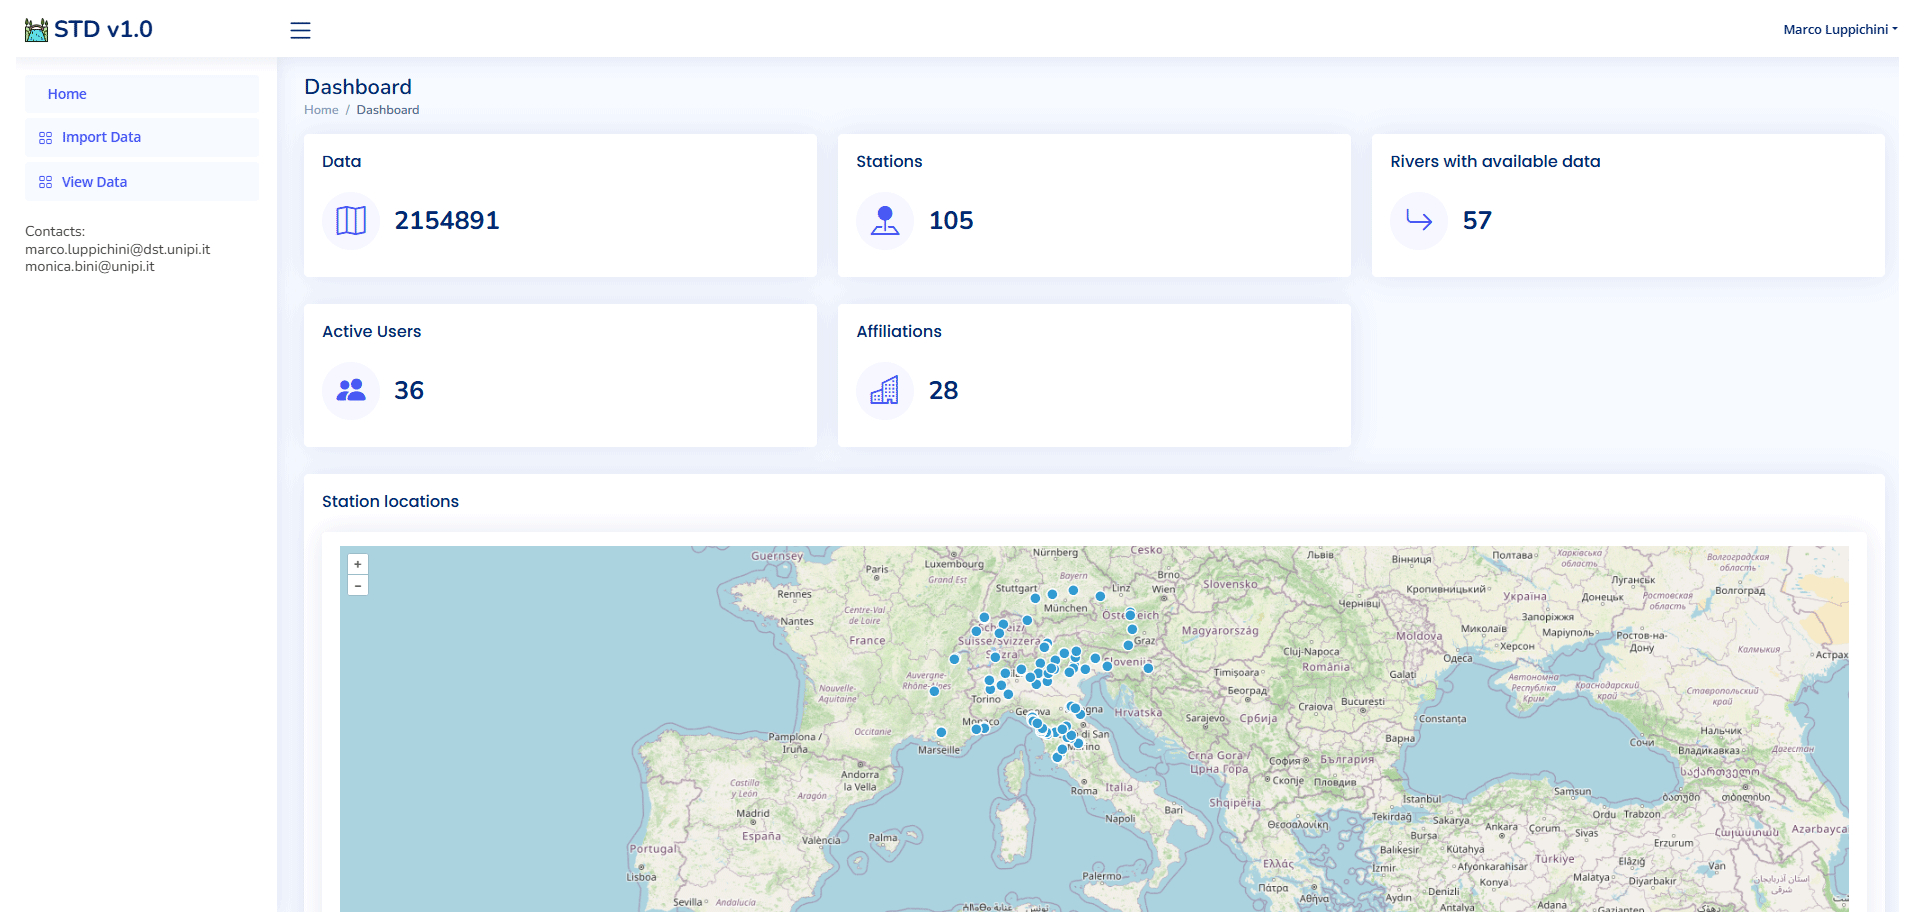
Figure 2Homepage of the web application (https://lca.dst.unipi.it/SedimentTransport/index_dash.html, last access: 21 September 2026). The web platform is continuously updated; therefore, the numbers shown in the interface may differ from those reported in the Results, which refer to the frozen database version used for the analyses presented in this manuscript.
The data entry process is carried out through the “Import Data” page. This feature is visible and accessible only to users with an editor role and consists of an initial form for general information to complete the acquisition table in the database (such as the river, measurement point, measured parameter, etc.). The dropdown menus are interconnected, and the available options change based on previous selections, guiding the user in selecting the correct entries.
The second part of the form consists of a tab with two options: “Insert Single Data” or “Insert Multi Data” (Fig. 3). The “Insert Single Data” (Fig. 3) allows the user to enter one record at a time by selecting the date and entering the corresponding value. The “Insert Multi Data” tab allows multiple values to be entered by uploading a Microsoft Excel file containing a specific template (the Excel file template is provided in the Supplement). The template consists of only two columns: “date” and “value”. A data validation procedure is performed on the Excel file before writing data to the database. Any errors or successful operations are displayed to the user via appropriate alerts. The upload validation includes checks on the structure of the input file, the presence and format of the required fields, the readability of dates, the numeric type of measured values, and the consistency between the uploaded data and the acquisition metadata previously selected by the editor, including parameter, unit, river, monitoring station, and geographic coordinates. The procedure also prevents the upload of records with missing dates or missing values and flags potential duplicated observations based on the combination of acquisition, date, and value. These checks are intended to ensure database consistency and prevent structural errors during data entry.
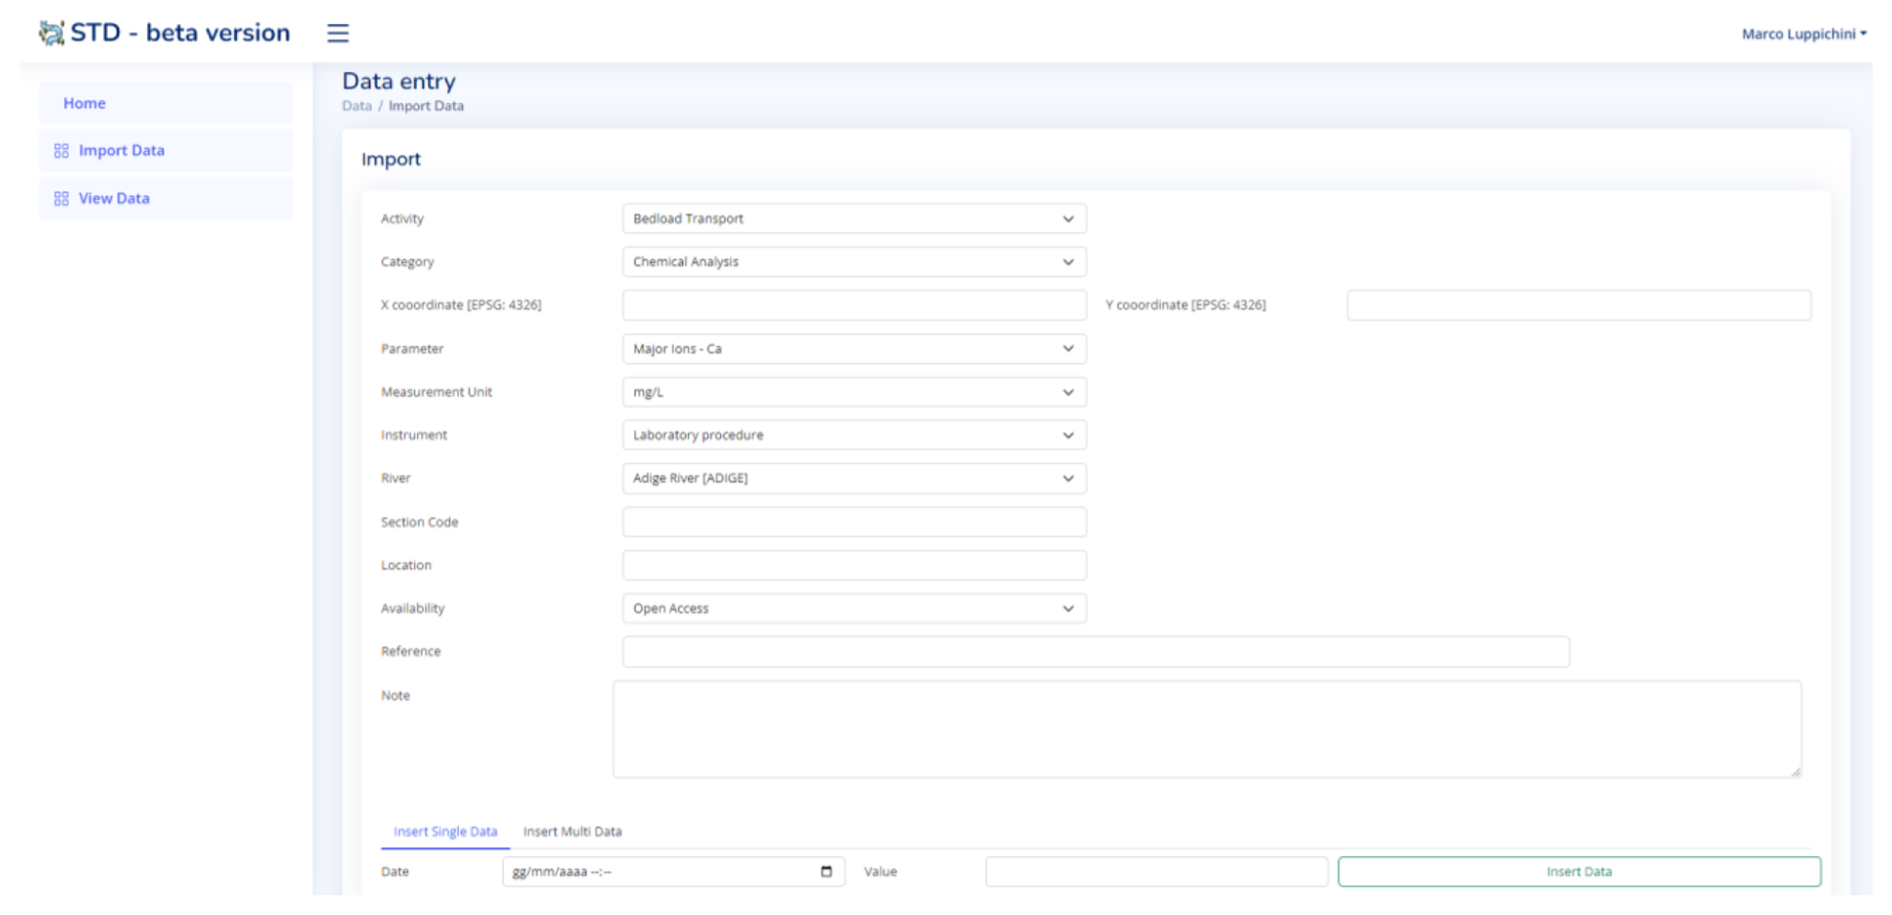
Figure 3Import data page of the web application (https://lca.dst.unipi.it/SedimentTransport/import.html, last access: 24 October 2025).
For data consultation and download, the “View Data” page can be used, accessible from the left-hand menu of the application (Fig. 4). The page contains a map showing the locations of the measurement stations. By clicking on the points, users can access information about the historical time series associated with the selected station.
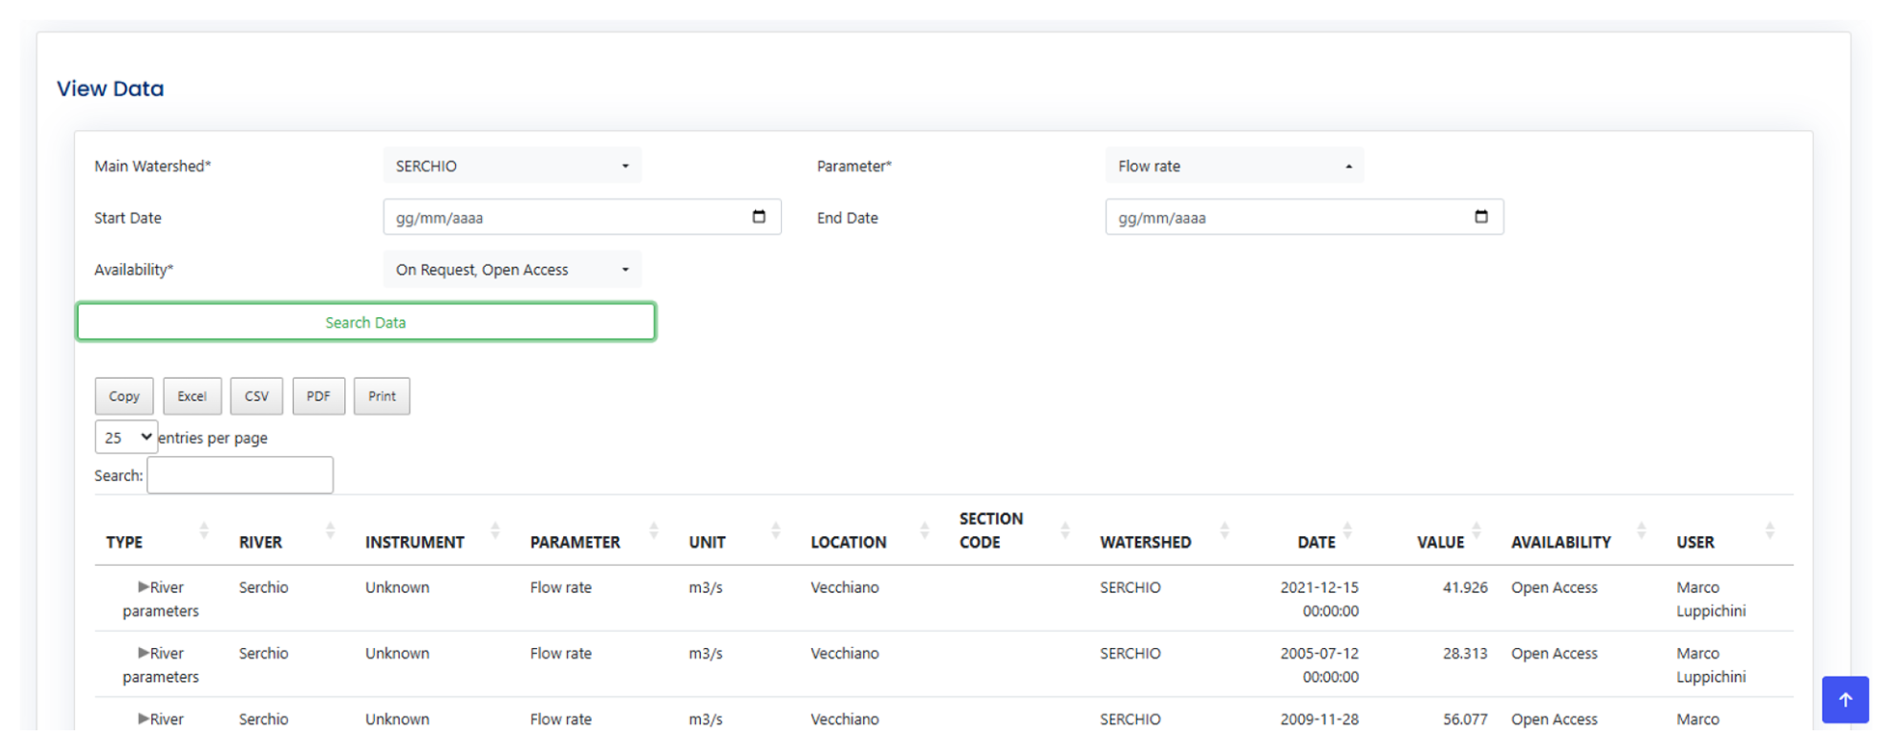
Figure 4View data page of the web application (https://lca.dst.unipi.it/SedimentTransport/view.html, last access: 24 October 2025).
The page also includes a table that lists all the information associated with each data record. Through the provided form, users can query the data by applying filters, and the requested data will be displayed in a table that can be further filtered.
Data in the table can be searched using the “Search” function or by applying column filters in the last row of the table. Data can be exported in various formats using the “Copy”, “Excel”, “CSV”, “PDF”, or “Print” options.
Data imported under a specific availability limit (on request) are only partially visible to users who are not the data owner. However, users can request the full data by contacting the data owner.
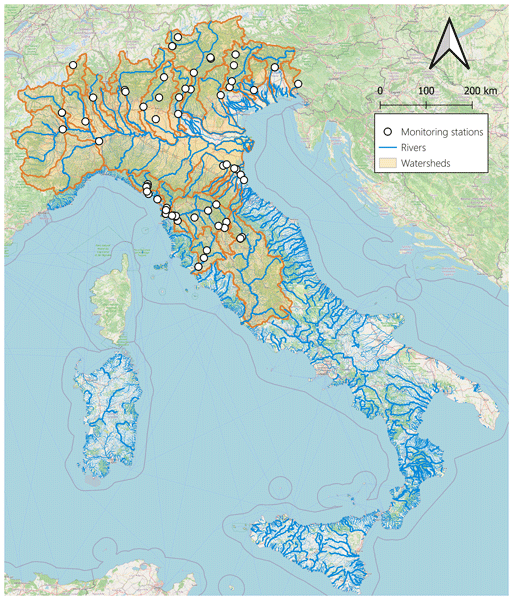
Before describing the content of the data records, we provide a spatial overview of the monitoring network included in the database. Figure 5 shows the location of the monitoring stations together with the corresponding river network and watershed boundaries. This representation allows readers to evaluate the geographical distribution of the available observations and to identify the main monitored river basins across the Italian territory.
The monitoring stations are not uniformly distributed across the country, reflecting both the availability of regional monitoring programs and the heterogeneous development of sediment transport observations in Italy. A higher density of stations is evident in northern and central Italy, particularly in Alpine and Apennine river systems, where several monitored basins are represented. The map also highlights the connection between individual monitoring points and their upstream drainage areas, providing useful spatial context for the interpretation of the database.
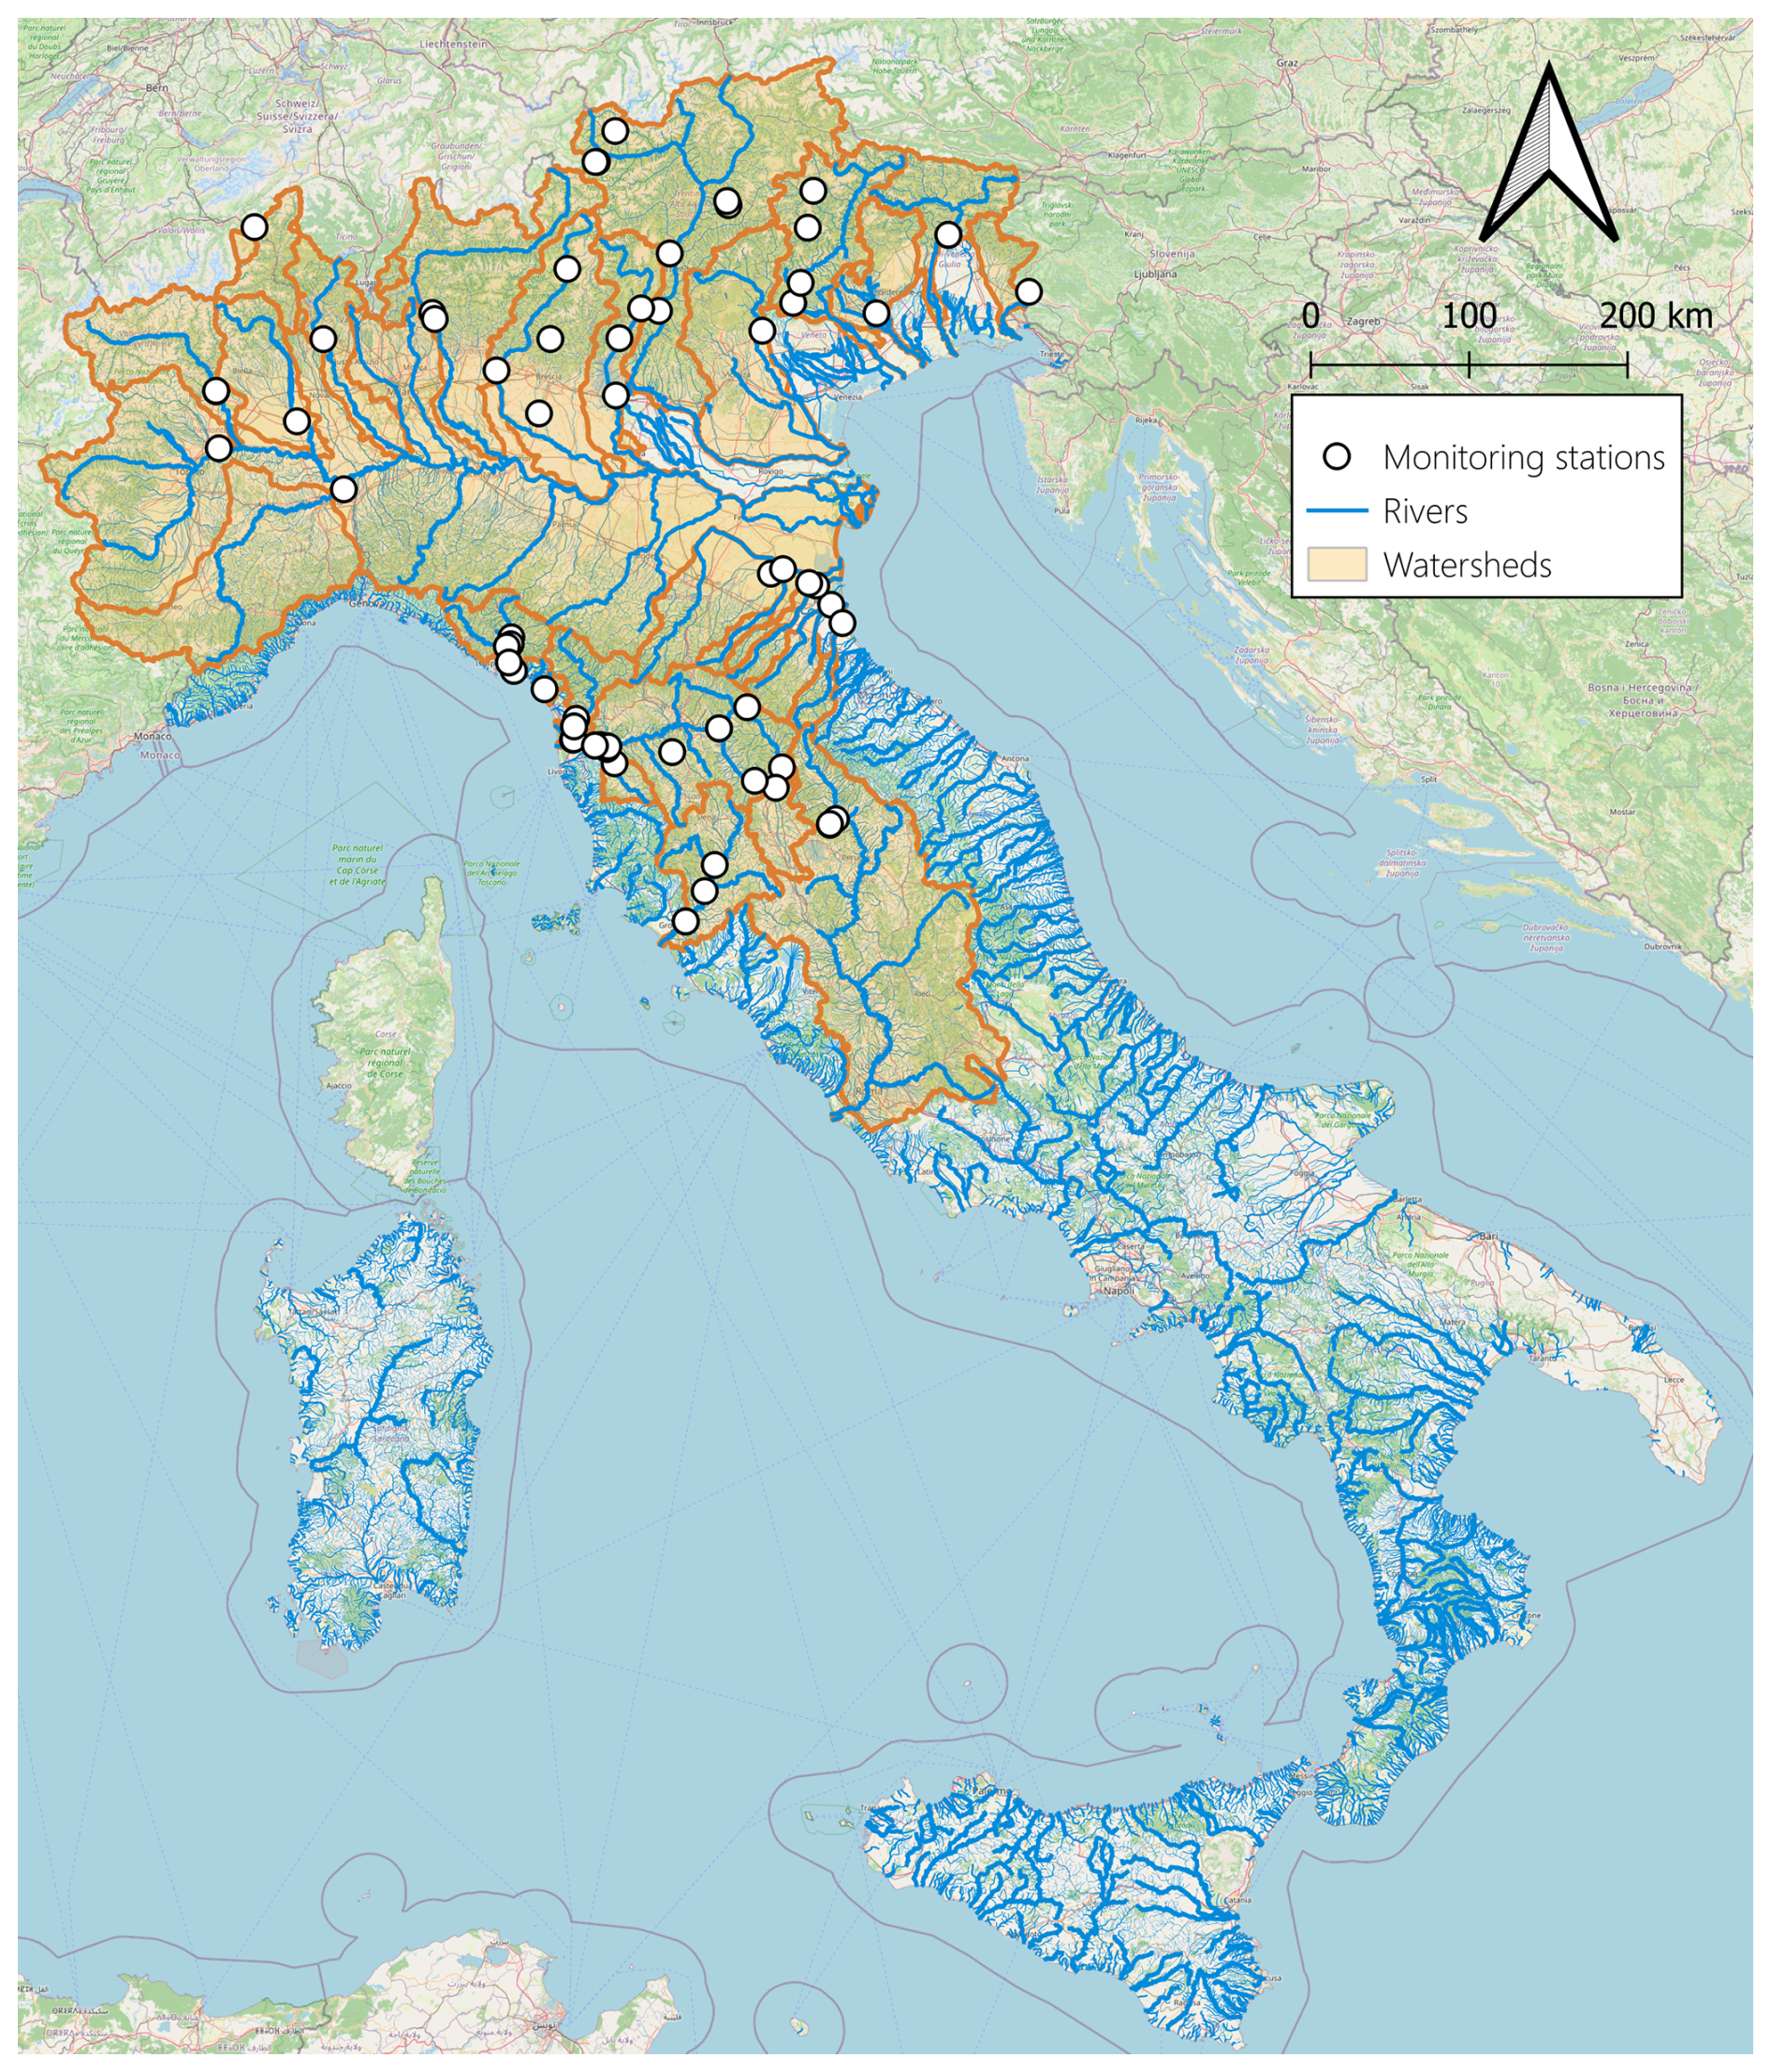
Figure 5Spatial distribution of the monitoring stations included in the database. White circles indicate monitoring stations, blue lines represent the river network, and orange outlines delimit the corresponding watersheds. The map provides an overview of the monitored river basins and their distribution across the Italian territory. The figure was created by the authors. Basemap data © OpenStreetMap contributors, available under the Open Database License (ODbL; https://www.openstreetmap.org/copyright, last access: 21 September 2026).
3.1 Data Records
The data collected within the database amount to 1 988 116 records and are characterized by a high degree of spatial, temporal, and instrumental heterogeneity. The database currently includes information from 29 river basins and 39 rivers, distributed across 76 measurement sites. A total of 386 time series are archived. The dataset covers 21 different parameters, acquired using 19 different types of instruments, highlighting the diversity of monitoring approaches and measurement techniques adopted across different hydrological contexts. To provide a concise overview of the database contents before the detailed analysis of instruments, sampling frequency, temporal coverage, and spatial distribution, Table 1 summarises the parameters currently populated in the database. For each parameter and measurement unit, the table reports the number of available records, the number of time series, the number of rivers and measurement sites represented, and the overall temporal coverage. Table 1 highlights the heterogeneous structure of the database, both in terms of data volume and temporal extent. Some variables, such as flow height, flow rate, temperature, turbidity, and electrical conductivity, are represented by large numbers of records, whereas several sediment-related parameters, including annual bedload discharge, annual suspended sediment load, bedload sediment load, and grain-size descriptors, are represented by smaller datasets. This summary provides a compact reference for interpreting the following figures, which analyse instrumentation, sampling frequency, temporal coverage, and spatial distribution in greater detail.
Figure 6 shows the percentage distribution of the instruments used to acquire each parameter in the database, expressed as the proportion of total records available for that parameter. The analysis highlights that, in some cases, the instrumentation employed appears to be extremely homogeneous, while in others a considerable heterogeneity emerges, related to the nature of the parameter and the different measurement methodologies available.
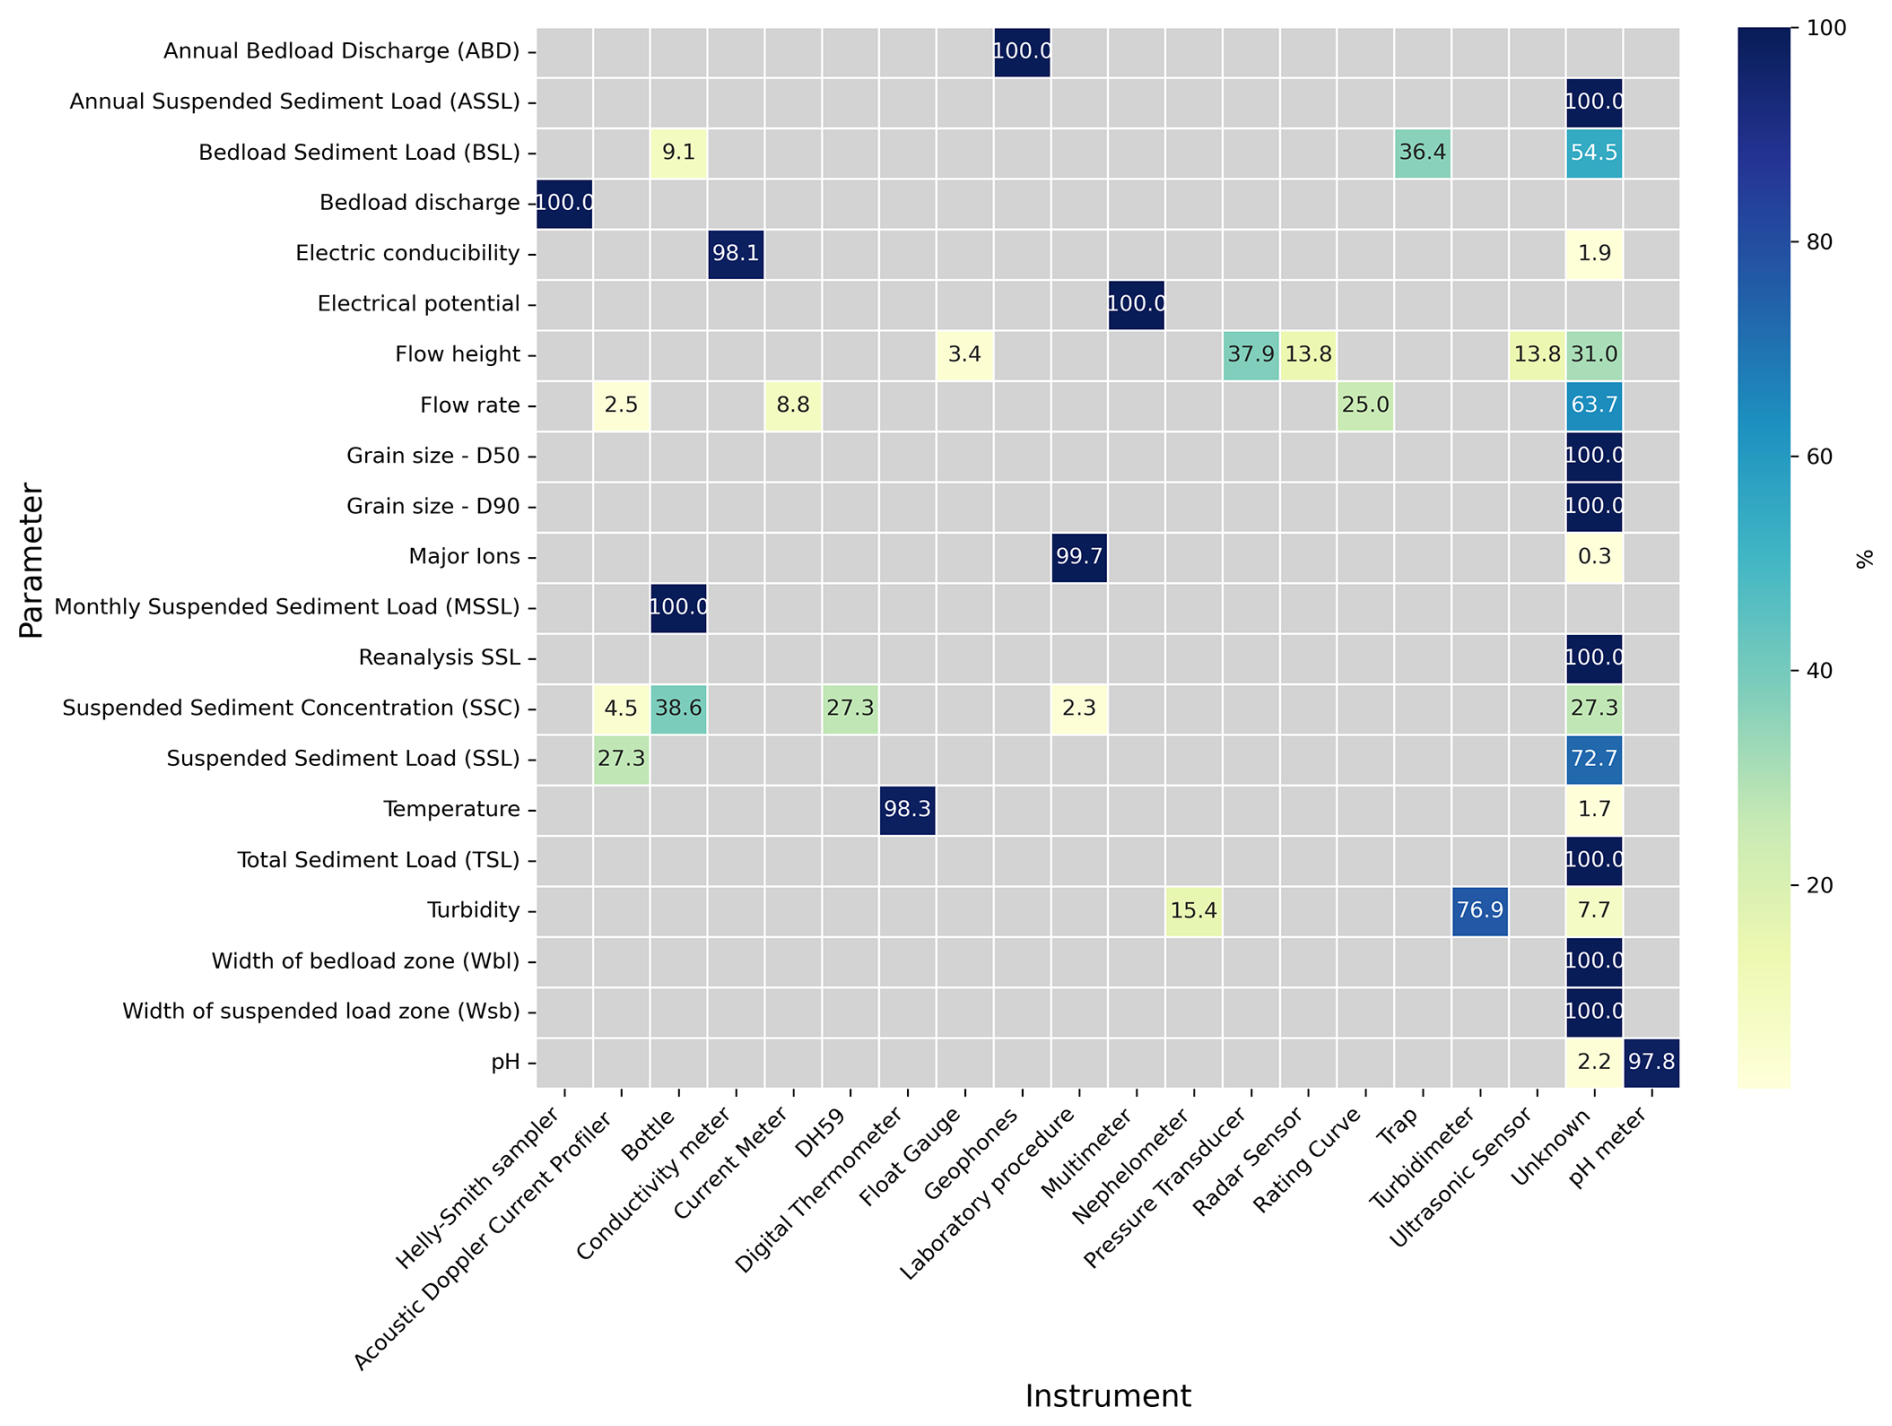
Figure 6Frequency distribution of instruments used for the acquisition of each parameter stored in the database. Grey cells indicate the absence of values (0 %). The figure highlights both homogeneous cases, where a single instrument is dominant, and heterogeneous situations, particularly for sediment transport and hydraulic parameters, where multiple measurement techniques coexist.
Parameters closely linked to basic physico-chemical measurements, such as electrical conductivity and pH, show a clear predominance of a specific instrument (the conductivity meter and the pH meter, respectively), with percentages close to 100 %. A similar pattern can be observed for parameters derived from annual aggregations, such as Annual Bedload Discharge (ABD), which are exclusively associated with specific calculation methods and measuring instruments (e.g., geophones).
Conversely, parameters related to instantaneous or monthly sediment transport and hydraulic flow characteristics show greater variability in the instruments used. In particular, the Suspended Sediment Concentration (SSC) was acquired using four different types of instruments (bottles, DH59, and acoustic doppler current profilers). This heterogeneity reflects the coexistence, within the various monitoring networks, of both direct and indirect approaches to measuring suspended sediment concentration, as well as operational differences between monitoring sites and acquisition periods.
A similar situation can be observed for turbidity, which is measured using optical instruments (e.g., nephelometers and turbidimeters) but with varying percentages, suggesting differences in both the temporal resolution of the observations and the technological availability of the monitoring sites. Hydraulic parameters such as flow height and flow rate also display a more fragmented distribution, with an alternative use of radar sensors, pressure transducers, and float gauges, consistent with the diversity of environmental conditions and the differing operational choices among monitoring stations.
Overall, there is a clear distinction between parameters that benefit from standardized measurement procedures and dedicated instruments and more complex parameters for which the variety of methodological approaches and operational tools constitutes an intrinsic feature of the acquisition process. This differentiation underscores the importance of a database structure capable of accommodating heterogeneous information while retaining details of the instrumental and methodological context associated with each dataset, thereby ensuring traceability and comparability among data derived from different sources.
It is also noteworthy that seven out of the sixteen analyzed parameters show significant percentages of data associated with an instrument classified as “unknown”. Data associated with an “unknown” instrument should therefore be interpreted with caution. This classification does not necessarily indicate low-quality or unreliable measurements, as many of these records may derive from historical sources or previously processed datasets considered valid by the original data providers. However, the absence of information on the measurement instrument limits the possibility of assessing methodological comparability, instrumental uncertainty, and potential biases among datasets. Consequently, these records can still be useful for exploratory analyses, historical reconstructions, and broad assessments of spatial and temporal data availability, but they are less suitable for detailed comparisons among measurement techniques, uncertainty analyses, or model calibration procedures requiring fully documented metadata. In this sense, the database does not eliminate the limitations inherited from the original data sources; rather, it makes them explicit and traceable, providing a basis for future metadata improvement and data-quality refinement.
Table 1Summary of the parameters currently populated in the Italian Fluvial Sediment Transport Database. For each parameter and measurement unit, the table reports the number of records, number of time series, number of rivers, number of measurement sites, and temporal coverage. The table provides a compact overview of the database contents and complements the detailed analyses of instruments, sampling frequency, temporal coverage, and spatial distribution shown in the following figures.
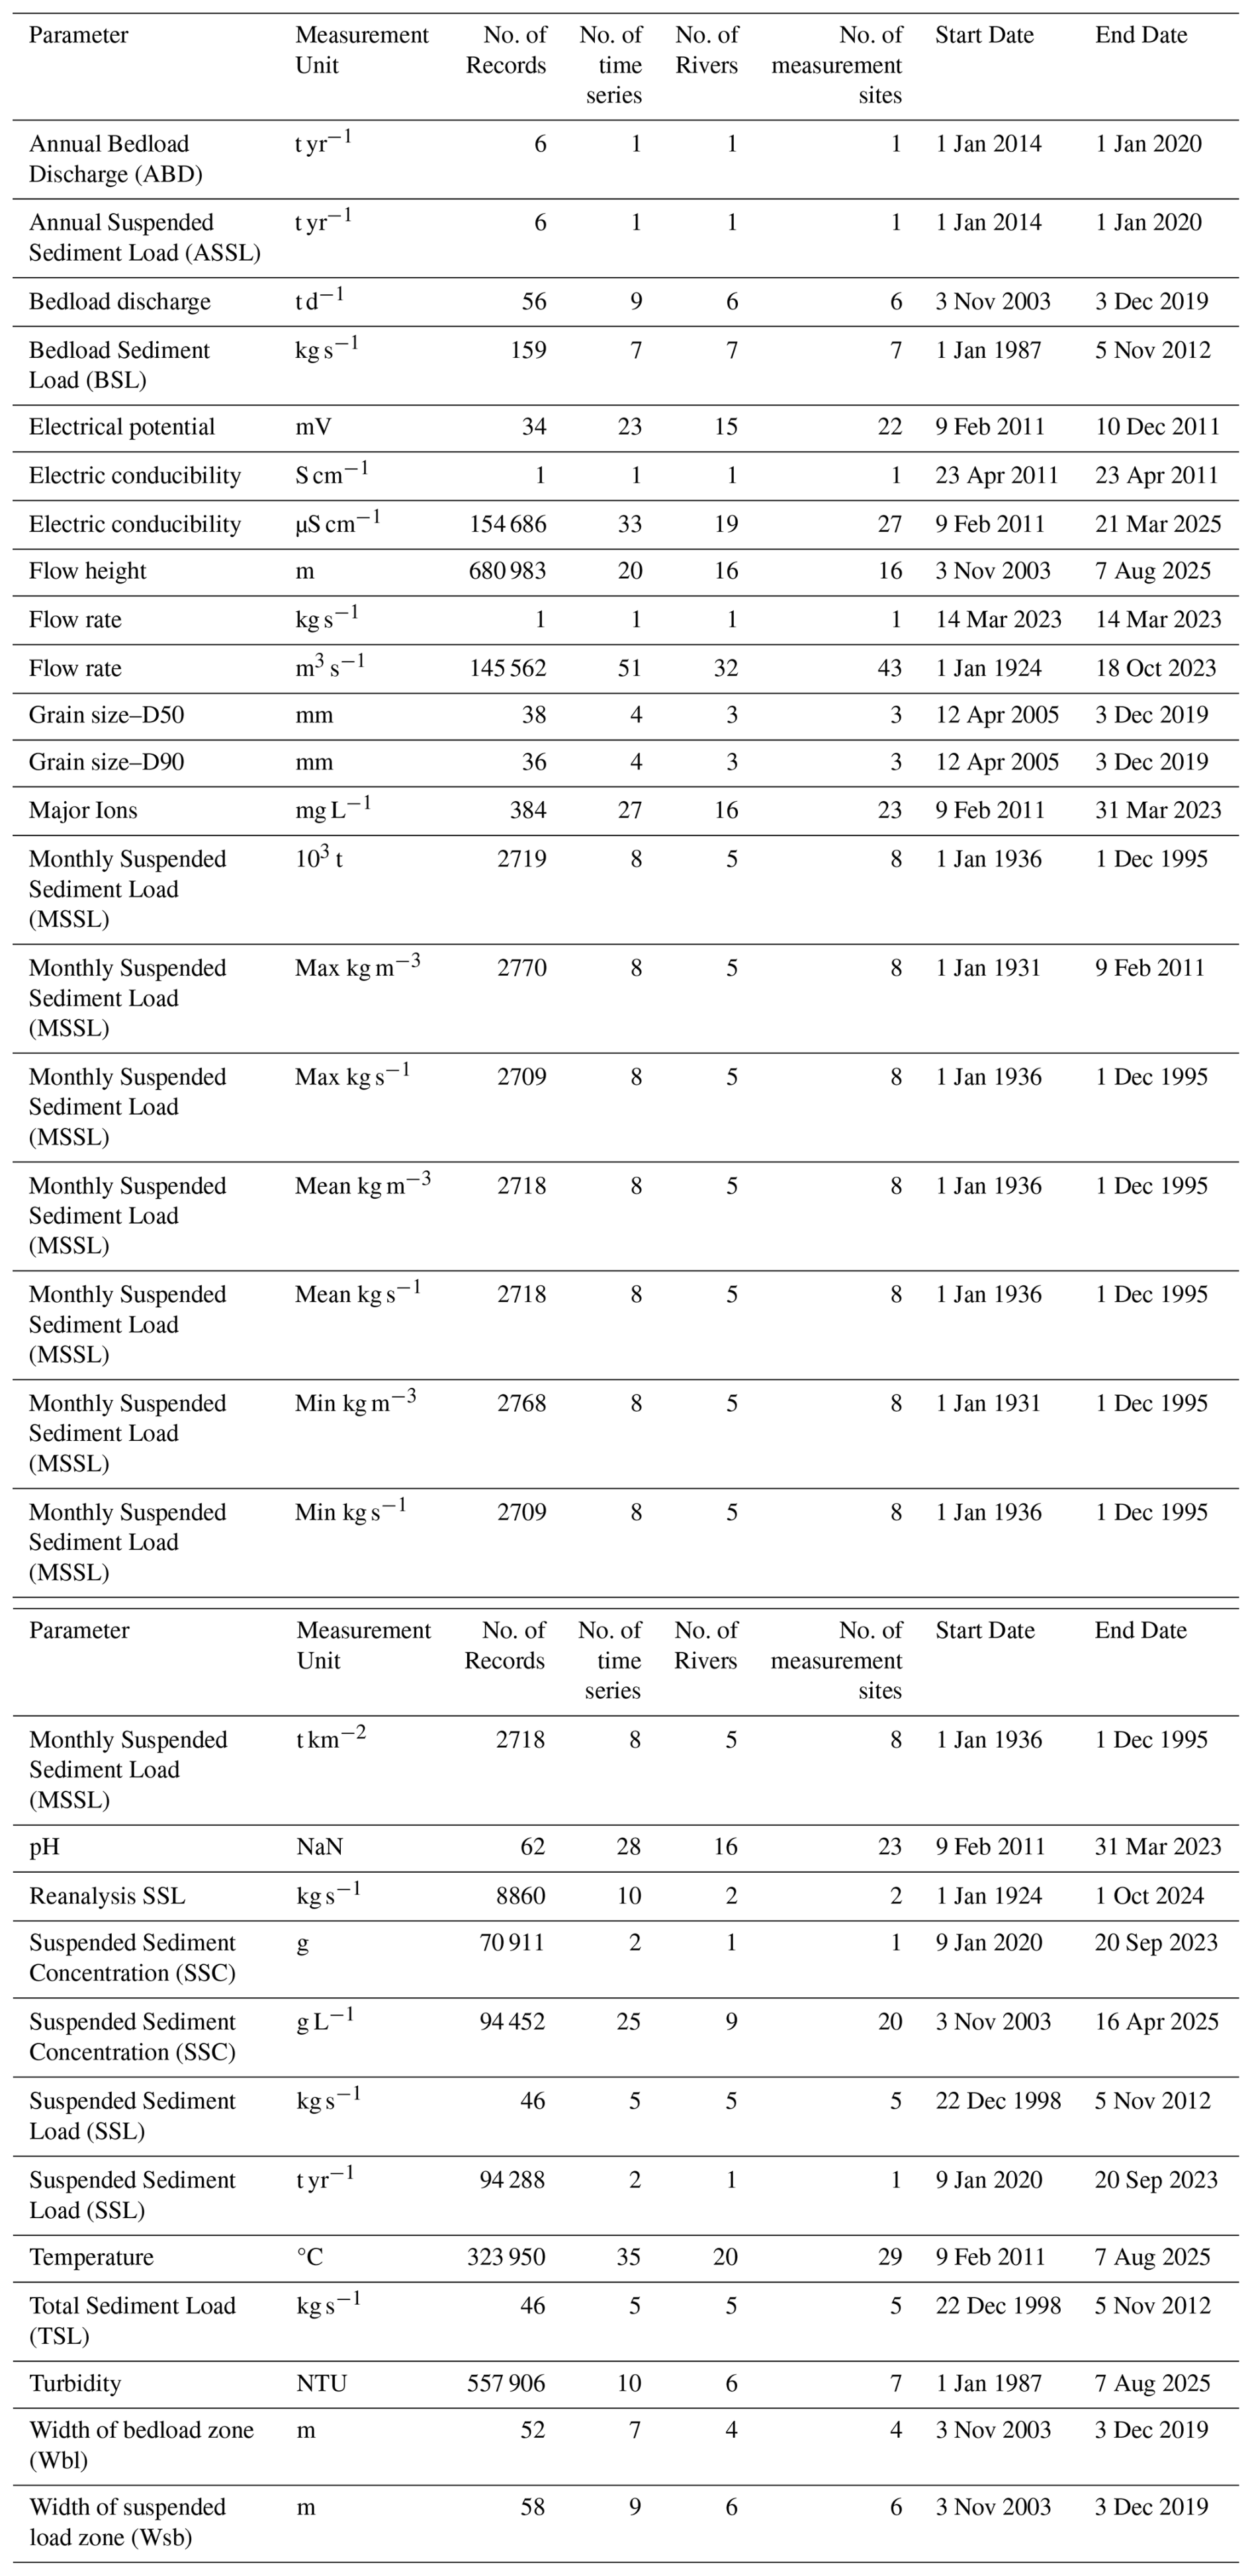
Figure 7 summarizes the typical sampling frequencies of the datasets stored in the database. For each parameter, the modal temporal resolution (i.e., the most frequently observed sampling interval) was identified and compared with the full range of observed frequencies, spanning from minimum to maximum values. The cumulative distribution further quantifies the proportion of records associated with each temporal resolution class.
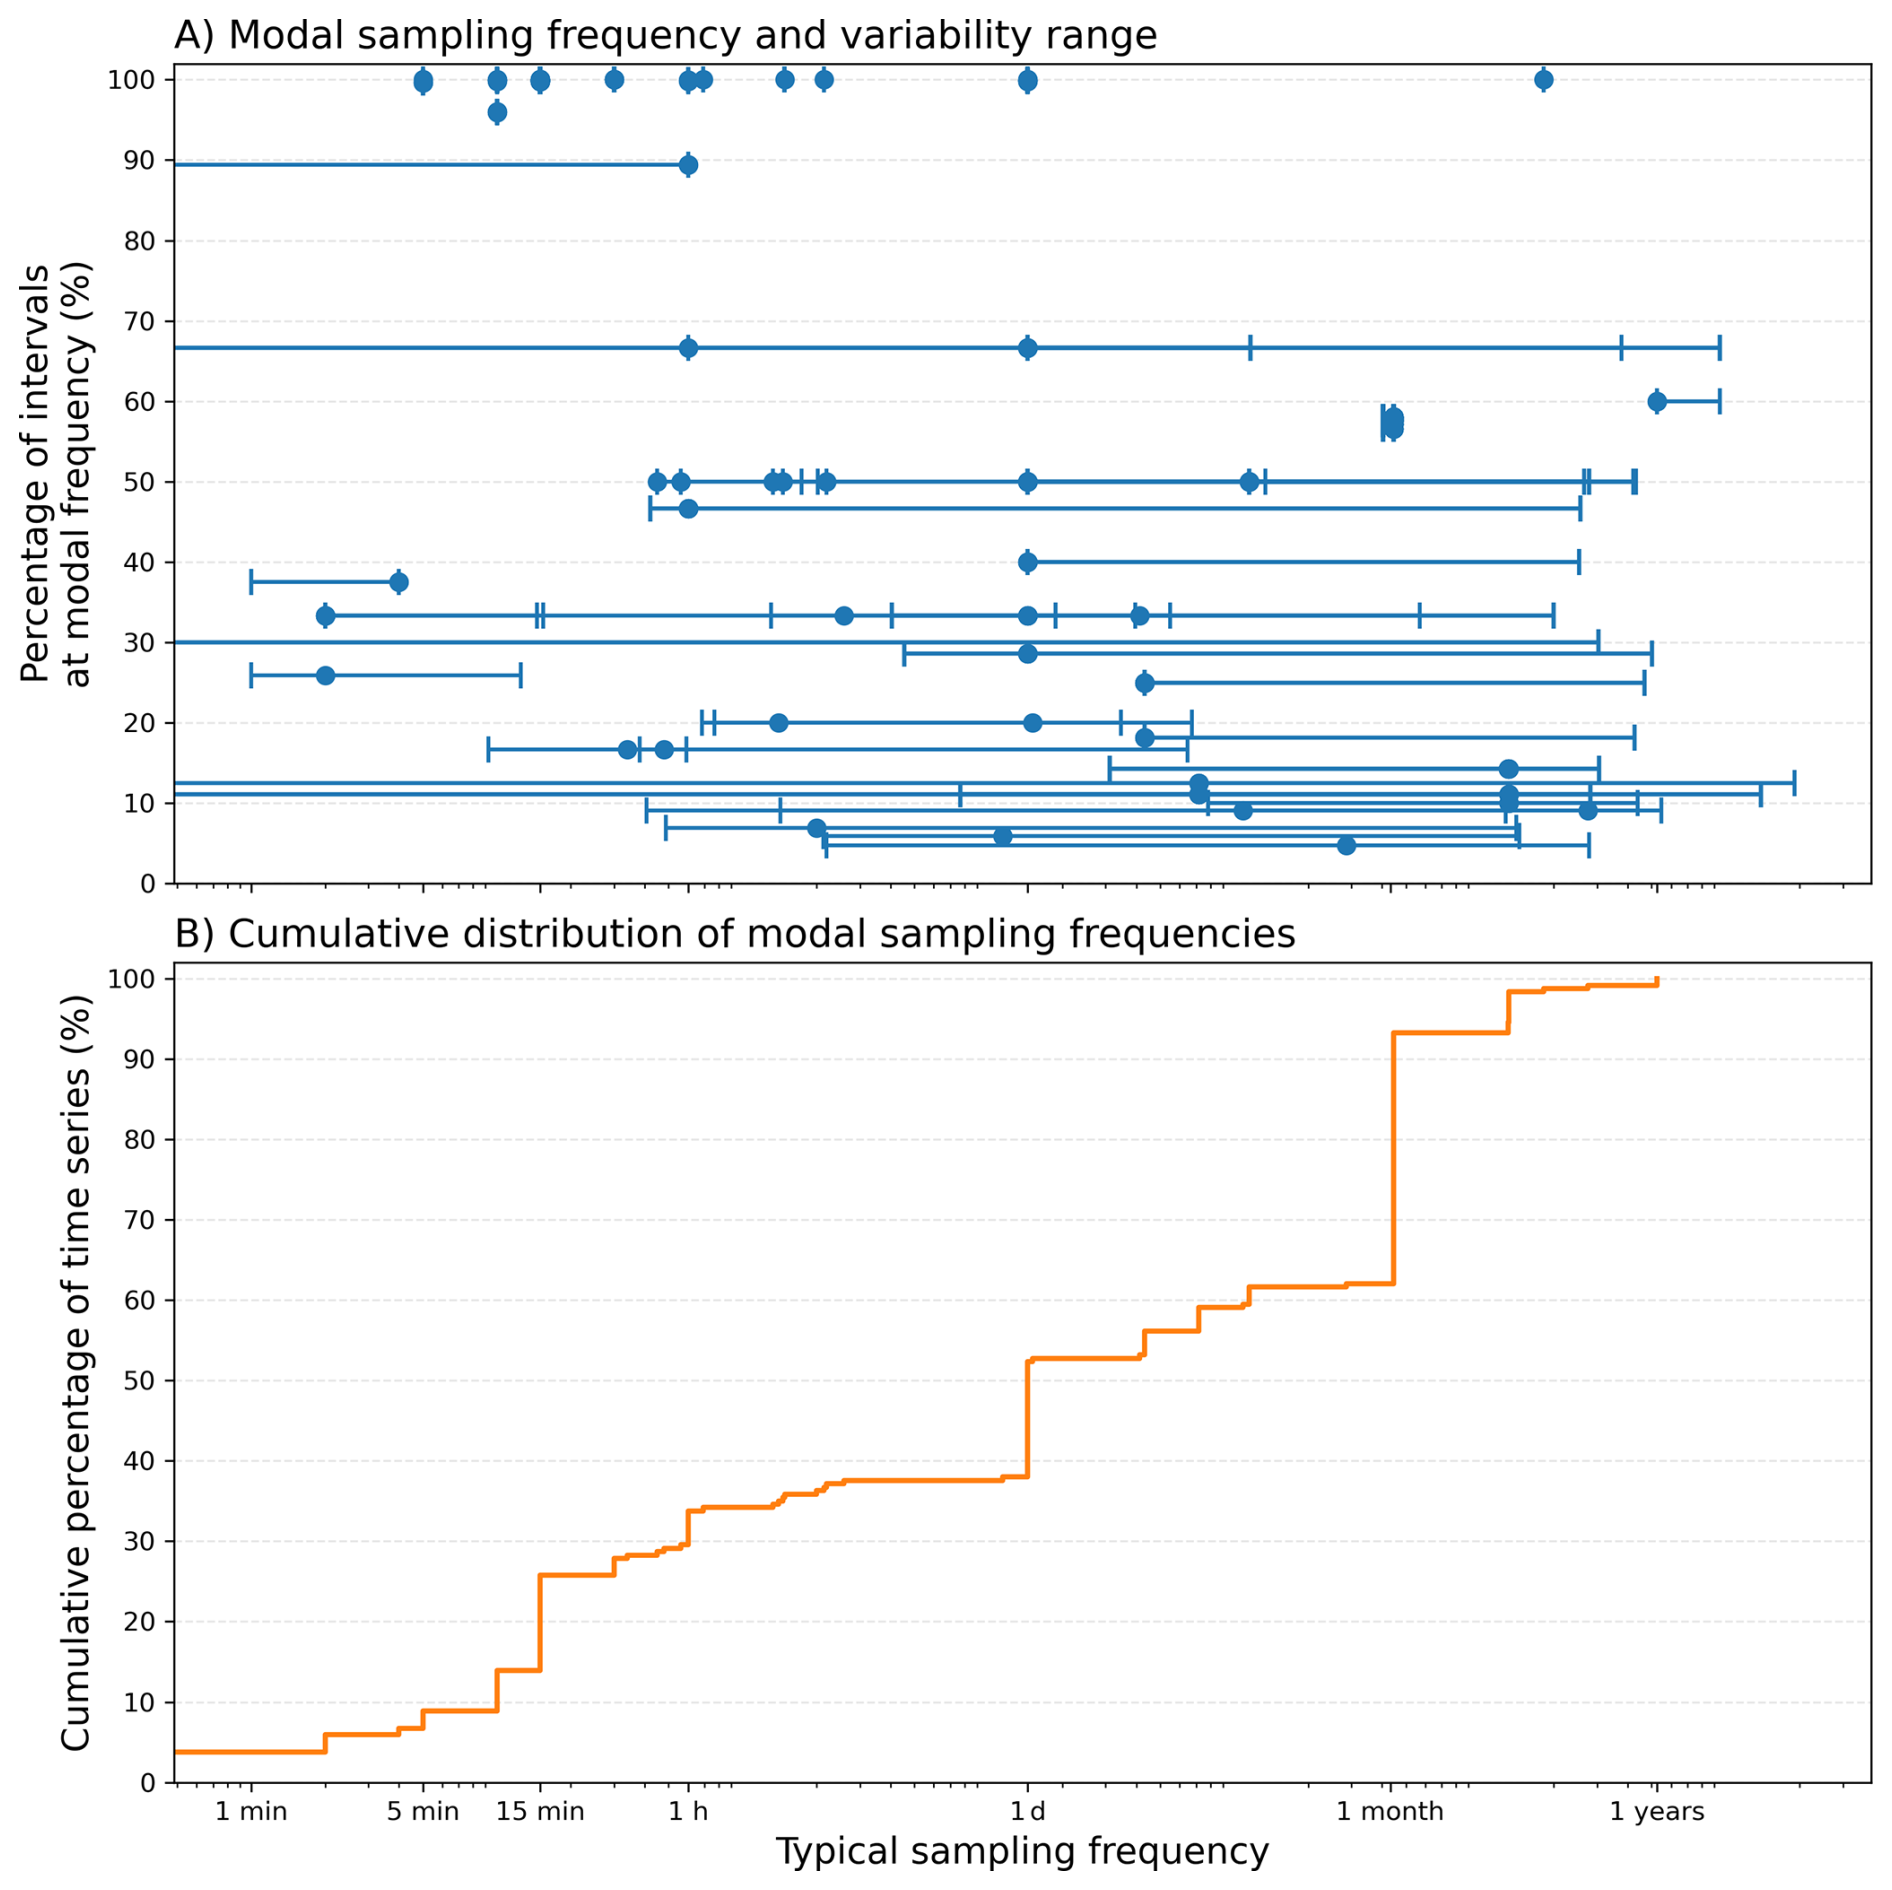
Figure 7Sampling-frequency characteristics of the time series included in the database. (A) Modal sampling frequency of each time series, expressed as the percentage of intervals corresponding to the most frequent temporal resolution; horizontal bars indicate the variability range of observed sampling intervals. (B) Cumulative distribution of modal sampling frequencies, showing the proportion of time series acquired at temporal resolutions equal to or finer than each frequency class. The figure highlights the coexistence of high-frequency, daily, monthly, and lower-frequency records within the database.
The distribution highlights marked heterogeneity in the temporal resolution of the data, spanning sub-hourly to annual frequencies. Some parameters, particularly those of a physical or hydraulic nature (e.g., flow height), are acquired at high frequencies (2 min or 1 h), consistent with continuous or semi-continuous monitoring activities. Other datasets, especially those related to sediment transport or derived parameters, show daily or monthly frequencies, typical of manual field measurements or periodic sampling associated with laboratory procedures.
The cumulative curve reveals five main acquisition regimes, corresponding to frequencies of 10, 15 min, 1 h, 1 d, and 1 month, which represent the prevailing operational scales within the monitoring networks considered. The most pronounced steps in the curve occur at these classes, indicating that a substantial portion of the total data is concentrated in these temporal intervals.
It is also evident that there is a wide variability in the effective acquisition frequency. This behavior reflects the presence of irregular or discontinuous time series, where the nominal frequency does not always correspond to actual data continuity (for example, hourly series characterized by interruptions or inactive periods). This variability underscores the complexity of harmonizing heterogeneous datasets and highlights the importance of a database structure capable of handling both the nominal sampling frequency and its actual temporal regularity.
Overall, the figure illustrates how the collected data integrate multi-temporal information, combining continuous acquisitions with periodic or event-based sampling. This temporal diversity enables a more comprehensive representation of sediment and hydraulic dynamics across different spatial and temporal scales.
Figure 8 represents the annual temporal coverage of the data available for the parameters included in the database. For each parameter, the number of active time series was calculated for each year, where an active time series is defined as a series with at least one available record in that year. The total number of time series available for each parameter is reported in square brackets to contextualise the extent of the dataset. It should be noted that the bars represent annual data availability and do not imply homogeneous monitoring frequency within or among years.
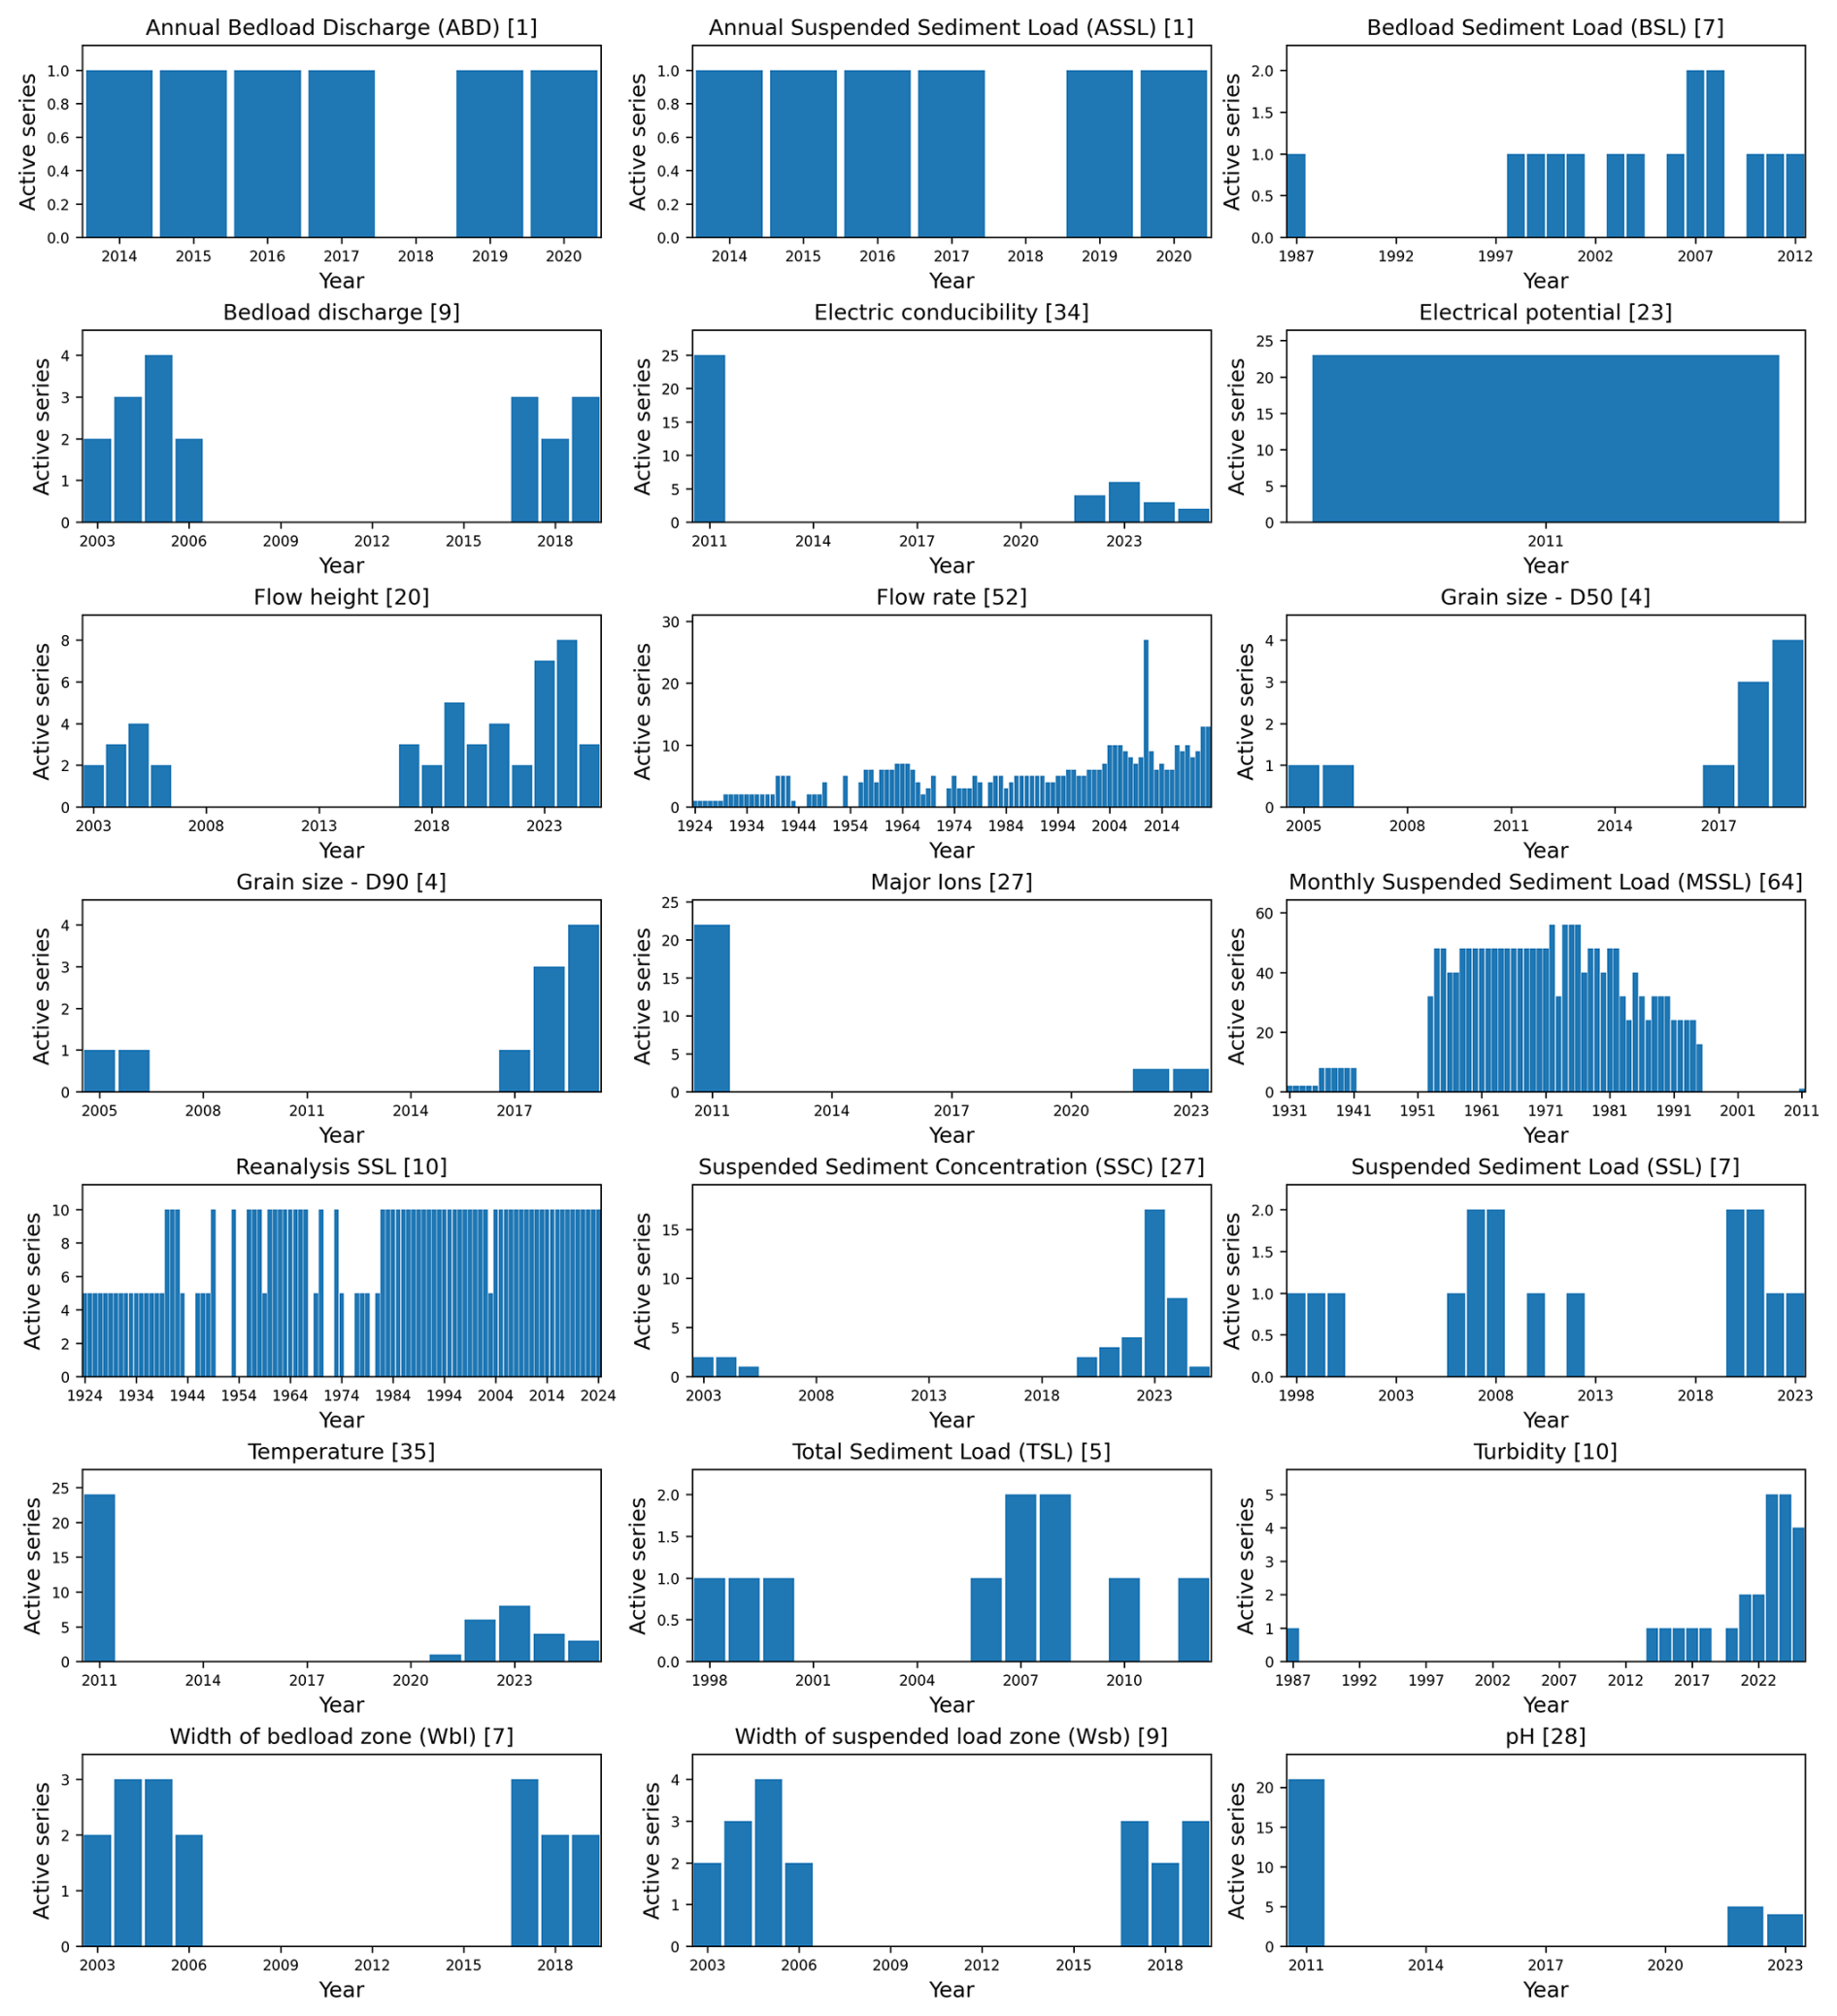
Figure 8Annual temporal coverage of the parameters included in the database. Each panel refers to one parameter, and the bars indicate the number of active time series for each year, defined as time series with at least one available record in that year.
In this sense, Fig. 8 should be interpreted together with the monitoring-frequency analysis reported in Fig. 7, which specifically describes the typical temporal resolution of the records included in the database.
The analysis reveals that the temporal extent of the datasets varies widely across parameters, reflecting the diversity of monitoring networks and measurement techniques adopted over time. Some parameters exhibit very long time series, often beginning in the 1940s or 1950s and continuing up to the present day. This is particularly evident for flow rate, which shows the largest number of series and the longest temporal span, making it one of the most consistently monitored variables in terms of temporal coverage. However, the frequency of observation may vary substantially across stations, parameters, and periods. Older records, in particular, may be less frequent, less regular, or less standardised than more recent datasets, depending on the original monitoring programme and data source. Other hydrological parameters, such as flow height and Monthly Suspended Sediment Load (MSSL), also display extended observation periods and numerous records, partly due to the long-standing tradition of monitoring discharge and sediment dynamics in some of the major Italian river basins (e.g., Arno and Ombrone rivers ).
Conversely, parameters of a more specific nature or associated with newer measurement technologies – such as turbidity, electrical conductivity, pH, and major ions – show shorter and more discontinuous time series, often limited to the past two decades. This reflects both the recent introduction of dedicated automatic sensors and the historical heterogeneity in the availability of physicochemical data.
Parameters related to sediment transport also exhibit significant variability. While annual datasets such as ABD and Annual Suspended Sediment Load (ASSL) are generally shorter and concentrated within specific periods, others – such as Bedload Sediment Load (BSL) and SSC – show more fragmented temporal coverage, alternating between phases of intensive monitoring and intervals without data acquisition. In several high-mountain catchments, suspended sediment monitoring is often seasonal, as sensors are removed during winter months (typically from November to May) due to harsh environmental conditions. This pattern reflects not only logistical constraints but also the strong morphoclimatic contrasts that characterise Italy, where monitoring strategies are necessarily adapted to markedly different environmental settings.
Overall, the figure highlights the heterogeneous temporal coverage among the different types of data: some measurements, such as flow rate or flow height, provide long temporal records, while others, more specialised, offer detailed but discontinuous insights into fluvial dynamics and sediment transport processes. This heterogeneity, and particularly the lack of simultaneous measurements among some parameters and monitoring stations, may limit integrated analyses of hydrological, physicochemical, and sediment transport processes. Therefore, Fig. 8 should be interpreted as an aggregated descriptive overview of temporal data availability rather than as a direct measure of uniform monitoring effort or sampling frequency through time. Differences in temporal coverage and monitoring frequency are an inherent characteristic of the compiled database and are further documented by the monitoring-frequency analysis shown in Fig. 7. These aspects should therefore be considered when using the dataset for comparative, temporal, integrated, or trend-based analyses.
Figure 9 summarizes the spatial distribution of these data across the analyzed river basins. The four panels respectively show: the number of rivers for which observations are available (top left), the total number data records (top right), the number of monitored parameters (bottom left), and the total number of measurement points in each basin (bottom right). The database currently includes data from 29 river basins out of the 272 that cover the entire Italian peninsula. At present, the dataset is primarily populated with basins from northern and central Italy, while southern regions and the major islands remain underrepresented.
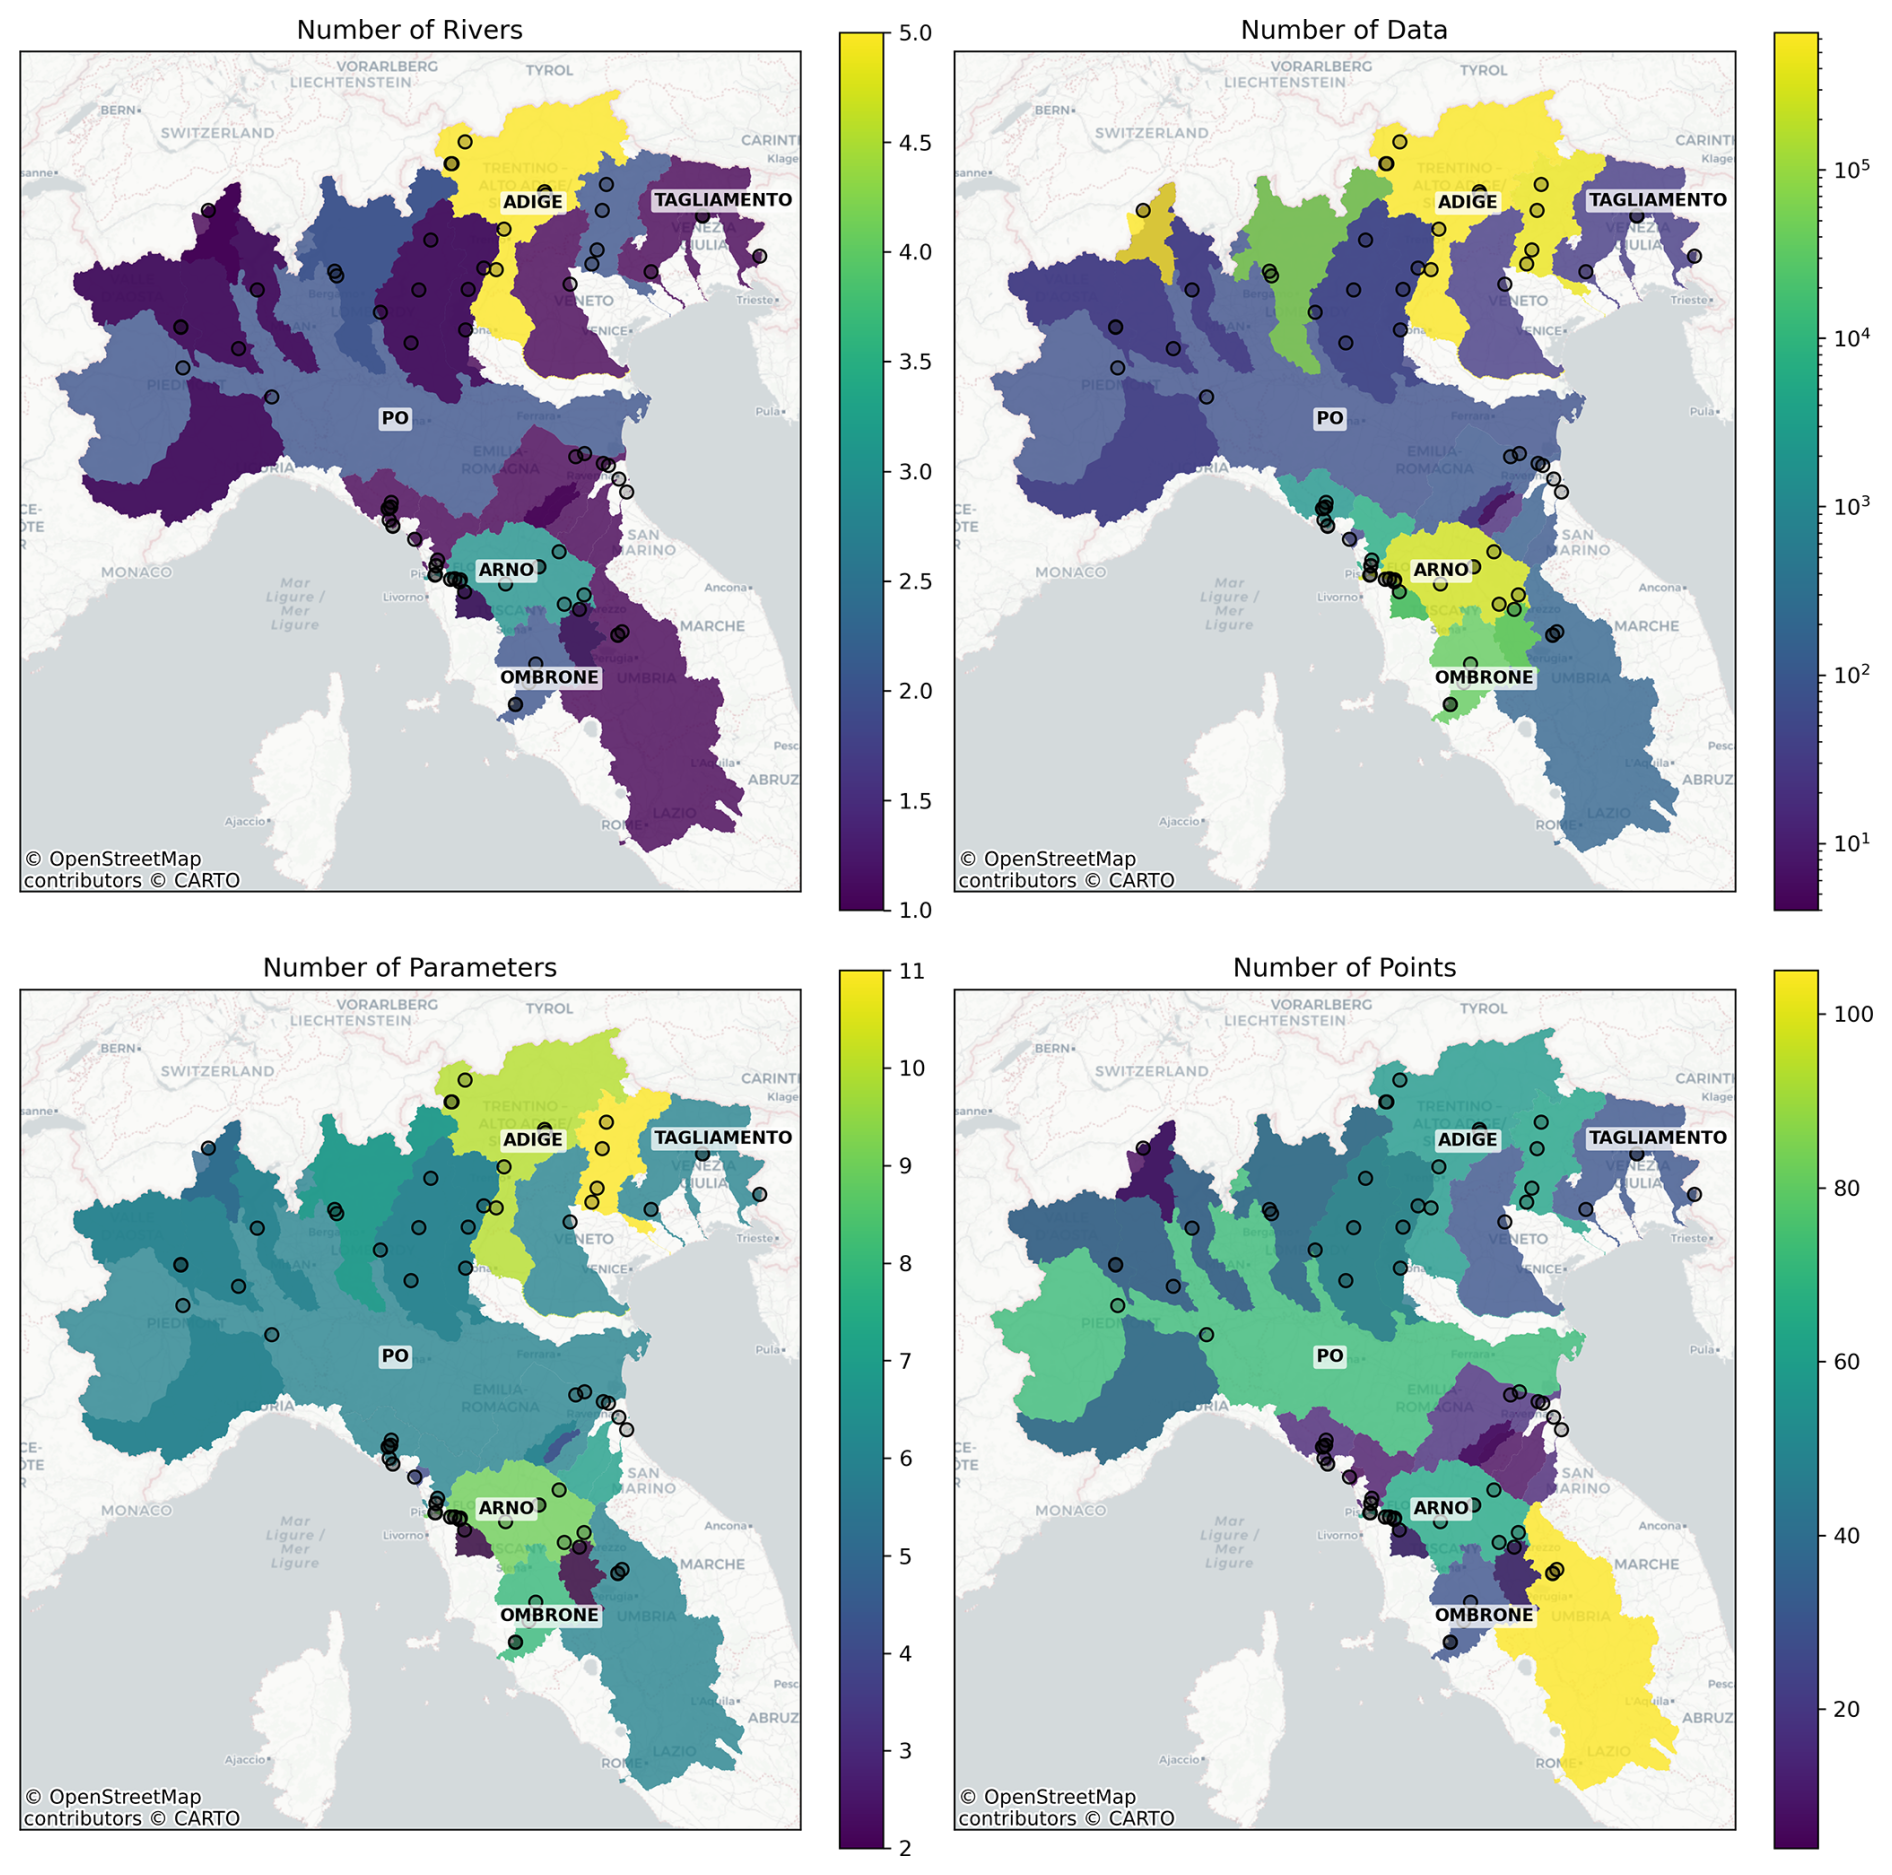
Figure 9Distribution of sediment transport data by river basin. The panels show (clockwise from top left): the number of rivers analyzed, the total number of recorded data, the number of measurement points, and the number of monitored parameters for each basin. The figure highlights the strong spatial variability in data coverage and density, with higher concentrations in northern Italy compared to central and southern basins. The points indicate the location of the measurement sites.
The analysis reveals a notable heterogeneity in spatial coverage and data density. Some basins, particularly those in northern Italy, such as the Po, Adige, and Tagliamento, show a higher concentration of information, both in terms of the number of measurement points and the range of parameters observed. In these cases, monitoring networks are more complex and include several rivers and sub-basins, reflecting a stronger historical and institutional focus on sediment transport and fluvial dynamics monitoring.
Conversely, the basins of central Italy generally have fewer observation points and monitored parameters. In these areas, monitoring activities are more sporadic or limited to short periods, often associated with specific research projects or local management initiatives.
The panel showing the total number of data also highlights that the amount of available information depends not only on the number of monitoring sites but also on the temporal frequency of observations. Basins with fewer stations but high-frequency monitoring can, indeed, provide data volumes comparable to those of larger networks with lower-frequency time series.
3.2 Sediment load parameters: basin-scale analysis
The analysis presented in this section focused exclusively on data related to parameters directly connected to sediment transport, including both suspended and bedload components. Specifically, the following parameters were considered: suspended sediment concentration deviation (SSCD), suspended sediment load (SSL), suspended sediment concentration (SSC), monthly suspended sediment load (MSSL), annual suspended sediment load (ASSL), annual bedload discharge (ABD), bedload sediment load (BSL), total sediment load (TSL), total suspended solids (TSS), turbidity, grain size–D50 and grain size–D90.
Figure 10 shows the actual distribution of sediment transport data, distinguishing between suspended and bedload components. In the top-left panel, river basins highlighted in red correspond to those for which the database contains at least one sediment transport parameter (basins with sediment data), while the remaining basins, outlined in black, are included in the database but associated only with other types of parameters (hydrological, physico-chemical, etc.).
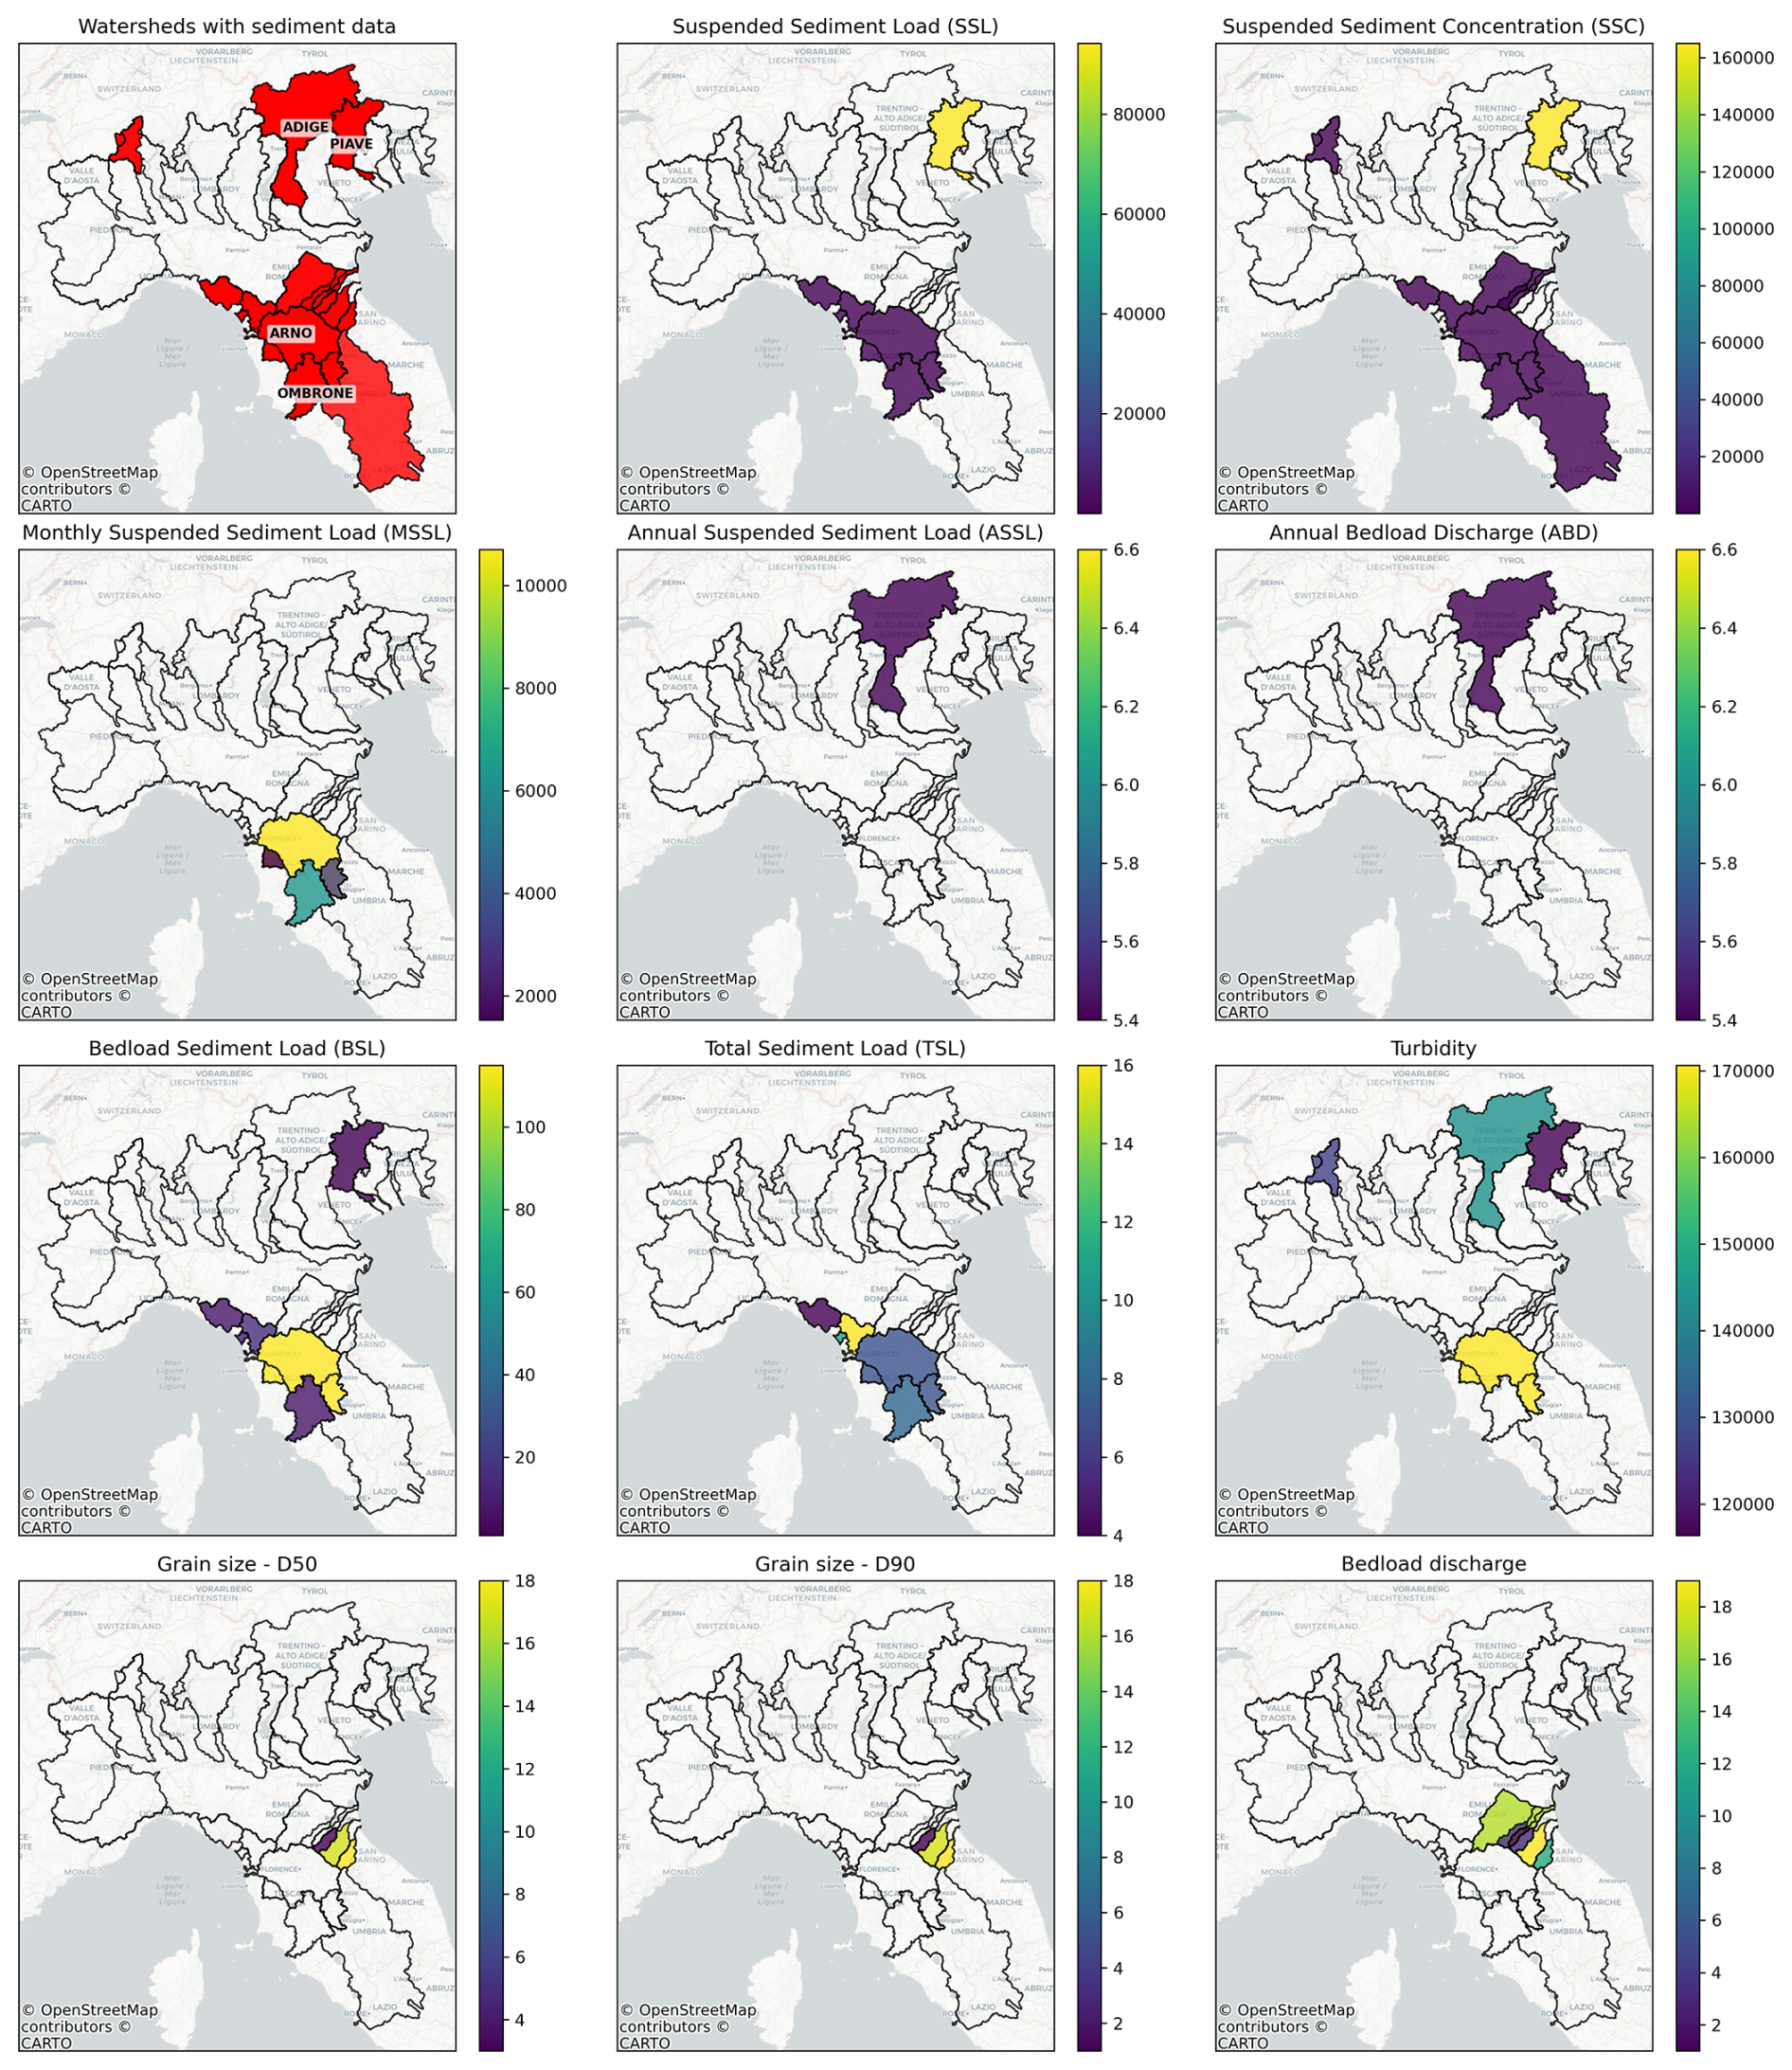
Figure 10Spatial distribution of sediment transport data for each parameter considered. In the top-left panel, red basins indicate watersheds containing at least one sediment transport parameter, while the remaining basins, outlined in black, are included in the database but associated only with other types of parameters. The other panels show, for each sediment-related parameter, the number of available records within each basin. Colour scales are panel-specific and should not be directly compared across parameters; in each panel, colours represent the number of available records for the corresponding parameter.
The other panels provide a detailed view of the number of available data for each specific parameter within every river basin, allowing the identification of the most monitored areas. The SSL and SSC are the most commonly represented parameters, with extensive data in the river basins of northern Italy (particularly the Piave) and central Italy. The MSSL, on the other hand, shows a more localized distribution, with significant values in a few basins, mainly in Tuscany.
Annual parameters such as ASSL and ABD show data concentrated in a single northern basin, reflecting the more complex and resource-demanding nature of these measurements. The BSL shows a similar pattern, with higher values in the Arno basin (central Italy), where direct measurements of bedload transport are available.
The TSL is present only in a limited number of basins, generally derived from the combination of suspended and bedload monitoring data. Finally, turbidity emerges as one of the most widespread parameters in the central and northern basins, due to the greater availability of optical sensors and its direct correlation with suspended sediment concentration.
The Italian Fluvial Sediment Transport Database, described in this paper, is publicly available at Zenodo: https://doi.org/10.5281/zenodo.18799025 (Luppichini et al., 2026). The archived version (v1.0) represents a frozen and citable release of the PostgreSQL relational database and includes the complete dataset and database structure necessary to ensure reproducibility and long-term accessibility. The database can also be explored through a dedicated web application (https://lca.dst.unipi.it/SedimentTransport/, last access: 21 September 2026), which provides dynamic access to the data following a brief registration procedure. While the web interface facilitates data consultation and querying, the Zenodo archive constitutes the reference version for citation and reproducibility purposes.
The aim of this study was to develop a relational database and a web interface dedicated to the storage, consultation, analysis, and export of fluvial sediment transport data. This initiative responds to the growing need in geosciences and environmental management for information systems capable of integrating, standardizing, and making accessible heterogeneous datasets that are historically fragmented and dispersed (Bailo et al., 2023; Parsons and Fox, 2013; Vitolo et al., 2015). This approach is consistent with European directives and policies on environmental and public-sector data sharing, particularly the INSPIRE Directive 2007/2/EC and the Open Data Directive (EU) 2019/1024, as well as with international open data practices. These frameworks emphasise that interoperability, accessibility, reusability, and metadata completeness are fundamental elements for the effective use and enhancement of hydrological and sedimentological data (Cho and Crompvoets, 2019; Jacob et al., 2025; Matthews et al., 2023). The relevance of such an integrated information system also extends to the implementation of the Water Framework Directive (2000/60/EC). The Common Implementation Strategy guidance on integrated sediment management explicitly recognises sediment quantity, continuity, and quality as important components of river basin management and stresses the need for appropriate information to support their assessment within River Basin Management Plans (European Commission, 2022). In this context, a harmonised and accessible sediment transport database can provide a valuable knowledge base for assessing sediment dynamics, identifying monitoring gaps, and supporting integrated sediment management at the river-basin scale.
In this context, the comparison with established hydrological infrastructures such as GRDC (Färber et al., 2025) and GSIM (Do et al., 2018) highlights both the relevance and the current gap in sediment data integration. While streamflow monitoring has progressively evolved toward coordinated international frameworks supported by standardized metadata protocols and long-term institutional cooperation, sediment transport data have not yet reached a comparable level of structural organization. This disparity is not only technical but also institutional, reflecting differences in monitoring continuity, data ownership, and harmonization practices. The database developed in this study contributes to reducing this gap at the national scale by providing a structured environment for data standardization and controlled access. Although it does not yet represent a fully institutionalized infrastructure comparable to large international repositories, it establishes the foundational architecture upon which broader coordination and future integration efforts can be built.
The results, showing the data distribution in the time interval 1924–2025, revealed marked variability in the instrumentation used to measure and monitor the different parameters. Some parameters, such as electrical conductivity or pH, are characterized by nearly uniform instrumentation, reflecting their standardize measurement methods. Conversely, more complex parameters such as Suspended Sediment Concentration (SSC) or Turbidity, show a wide diversification of instruments, indicating the coexistence of direct and indirect measurement approaches. This heterogeneity, while limiting the direct comparability of data, also constitutes an informative resource, as it reflects the diversity of local characteristics and operational contexts in which the monitoring activities were carried out (Fratianni and Acquaotta, 2017; Fredi and Lupia Palmieri, 2017; Wang et al., 2022).
However, the presence of data without information on the measuring instrument (“unknown instrument”) highlights the importance of traceability and metadata completeness, a topic already emphasized in the sediment monitoring literature (Walling, 2006).
The analysis of sampling frequencies and the temporal extent of time series revealed considerable temporal heterogeneity in the datasets. Sampling frequencies range from sub-hourly to annual measurements, while the duration of the series varies from a few years to more than seven decades. This discontinuity limits the possibility of conducting consistent and comparable temporal analyses and represents one of the most common challenges in managing long-term environmental data (Ellingsen et al., 2017; Nejad et al., 2024; Syvitski et al., 2005). It is therefore necessary to distinguish between nominal and effective acquisition frequency, document the actual regularity and completeness of the series, and develop automatic quality control procedures. In this context, the proposed database supports preliminary data-quality assessment by allowing users to rapidly visualise temporal coverage, acquisition frequency, and data gaps. These diagnostics help identify discontinuities, irregular sampling intervals, and periods requiring further verification, thereby providing a basis for documenting the effective completeness of each time series and guiding subsequent quality-control procedures.
From a spatial perspective, the basin-scale analyses showed a high concentration of data in Alpine river basins, particularly the Adige (Bonfrisco et al., 2025) and Piave (Pellegrini et al., 2023; Rainato et al., 2017, 2025). Central Italian basins are less represented, although data are available for some smaller river basins, such as the Versilia River (Francalanci et al., 2013). Southern Italian basins are almost entirely absent from the database (Bonfrisco et al., 2025; Pellegrini et al., 2023; Rainato et al., 2017, 2025; Francalanci et al., 2013). This distribution reflects the historical development of monitoring networks, primarily established in areas with higher anthropogenic pressure and hydrogeological risk, but it also highlights the need for a more balanced territorial coverage. Parameters such as SSC and Turbidity are widespread and well-documented, whereas others, such as BSL or TSL, show limited coverage, being measured only at a few locations. This imbalance highlights the technical and operational complexity of bedload measurements and also suggests the need for strategies that combine direct and indirect approaches to broaden the available dataset. It should be noted, however, that the apparent absence of data in southern Italy may reflect both a lower historical monitoring intensity and a limited response to the present data call. Therefore, the current spatial pattern should not be interpreted as a complete lack of sediment monitoring activities in these regions, but rather as an indication of the present state of data collection within the framework of this database. Further engagement with regional institutions may help improve territorial representativeness in future updates. In addition, the database is currently dominated by datasets derived from research initiatives, while data routinely collected by regional and national environmental agencies are still only partially represented. This likely results in a more fragmented picture than the actual potential availability of sediment monitoring data at the national scale, further underscoring the need for stronger institutional collaboration in future database expansions.
The experience gained in building the database made it possible to identify both the limitations and the potential of the data collection and integration process. Among the main limitations are the difficulty of harmonising pre-existing formats, the lack of uniform metadata, the need for manual data validation procedures, and the dependence on voluntary contributions from individual researchers and institutions conducting monitoring activities. This latter aspect may affect both the completeness and representativeness of the dataset and also raises broader issues related to data responsibility, long-term maintenance, and institutional accountability.
To address these limitations, future development of the database will focus on several practical steps. First, a minimum metadata template will be defined for new contributions, including information on measurement methods, instruments, units, sampling frequency, temporal coverage, uncertainty, and monitoring conditions. Second, semi-automatic validation procedures will be implemented to identify missing metadata, inconsistent units, duplicated records, anomalous values, and temporal gaps before data are integrated into the database. Third, the platform will be progressively used as an operational reference for data producers, helping them identify data gaps and harmonise future monitoring activities before new field campaigns are planned.
However, technical solutions alone are not sufficient. The long-term effectiveness of the database will also depend on clearer governance mechanisms, stable institutional involvement, and agreed procedures for data submission, validation, updating, and citation. Bureaucratic constraints, fragmented responsibilities among agencies, and the absence of formal obligations to share sediment transport data may remain major obstacles to the creation of a fully comprehensive national archive. For this reason, one of the future priorities will be to strengthen collaboration with public authorities, river basin districts, regional agencies, and research institutions, with the aim of moving from voluntary data contributions toward more structured and documented data-sharing workflows.
Nevertheless, the relational structure and the developed platform demonstrate the effectiveness of a scalable system capable of integrating heterogeneous information and providing a coherent overview of hydro-sedimentary observations at the national scale. While historical datasets may inevitably retain some limitations inherited from their original sources, future data collected within or in relation to this framework can achieve higher levels of metadata completeness, traceability, quality control, and reusability.
The results of this study suggest several methodological guidelines for the future management of sediment transport data. First, it is essential to promote the standardization of instrumentation and measurement protocols, ensuring the traceability of procedures and the comparability of results. Second, the systematic recording and preservation of metadata, including metadata related to effective acquisition frequency should become a consolidated practice. Third, spatial coverage of monitoring networks must be rebalanced by strengthening underrepresented areas and promoting the integration of local data into a coordinated national system. Finally, adopting interoperable and open-source data architectures is key to ensuring the scalability and long-term usability of the system.
In conclusion, this work demonstrates that, despite the fragmentation and gaps in the available data, it is possible to build a coherent and functional database capable of enhancing the existing information assets. The gained experience highlights the need to develop dedicated information infrastructures for an integrated management of sediment transport data, supporting both scientific research and environmental planning. This study, therefore, represents a concrete step toward the creation of a national reference system for the monitoring and analysis of fluvial sediment transport. The developed database provides a robust and effective framework for data organization, harmonization, and accessibility, and it is designed as an open and updatable tool, allowing future uploads and continuous integration of new datasets. Its long-term effectiveness, however, will largely depend on the progressive expansion and completion of the dataset through the inclusion of high-quality data, i.e., datasets accompanied by consistent metadata, clear methodological documentation, and adequate temporal and spatial coverage.
Conceptualization: Luppichini, M., Bini, M., Comiti, F.; Methodology: Luppichini, M., Bini, M., Comiti, F.; Software: Luppichini, M.; Data curation: Luppichini, M., Donnini, M., Andreoli, A., Innocenti, L., Picco, L., Chirici, D., Brenna, A., Billi, P.; Longoni, L.; Ciavola, P.; Formal analysis: Luppichini, M., Bini, M.; Investigation: Luppichini, M.; Visualization: Luppichini, M.; Writing – original draft: Luppichini, M., Bini, M.; Writing – review and editing: All authors; Supervision: Comiti, F., Bini, M.; Project administration: Bini, M., Comiti, F.; Funding acquisition: Bini, M.
The contact author has declared that none of the authors has any competing interests.
Publisher's note: Copernicus Publications remains neutral with regard to jurisdictional claims made in the text, published maps, institutional affiliations, or any other geographical representation in this paper. The authors bear the ultimate responsibility for providing appropriate place names. Views expressed in the text are those of the authors and do not necessarily reflect the views of the publisher.
This work is the result of the activities carried out within the working group “Geomorphology and sustainable development of alluvial plains under anthropogenic pressure and climate change (GEOALL)” of the Italian Association of Physical Geography and Geomorphology (AIGeo).
This research was funded by the Autorità di Bacino Distrettuale dell'Appennino Settentrionale – Misure di prevenzione tese a supportare ed ottimizzare la pianificazione di gestione, la programmazione e realizzazione degli interventi di cui al PGRA (grant no. F54J16000020001, Principal Investigator (PI): Monica Bini).
This paper was edited by Achim A. Beylich and reviewed by Michael Nones and one anonymous referee.
Asselman, N. E. M.: The impact of climate change on suspended sediment transport in the river Rhine, in: Studies in Environmental Science, vol. 65, edited by: Zwerver, S., van Rompaey, R. S. A. R., Kok, M. T. J., and Berk, M. M., Elsevier, 937–942, https://doi.org/10.1016/S0166-1116(06)80119-6, 1995.
Bailo, D., Paciello, R., Michálek, J., Cocco, M., Freda, C., Jeffery, K., and Atakan, K.: The EPOS multi-disciplinary Data Portal for integrated access to solid Earth science datasets, Sci. Data, 10, https://doi.org/10.1038/s41597-023-02697-9, 2023.
Battista, G., Molnar, P., and Burlando, P.: Modelling impacts of spatially variable erosion drivers on suspended sediment dynamics, Earth Surf. Dynam., 8, 619–635, https://doi.org/10.5194/esurf-8-619-2020, 2020.
Billi, P. and Spalevic, V.: Suspended sediment yield in Italian rivers, Catena, 212, 106119, https://doi.org/10.1016/j.catena.2022.106119, 2022.
Bonfrisco, M., Coviello, V., Vignoli, G., Miyata, S., Piantini, M., Engel, M., Nadalet, R., Dinale, R., and Comiti, F.: Temporal variability of bedload vs suspended sediment load and respective hysteresis cycles in a glacier-fed Alpine river, J. Hydrol., 660, https://doi.org/10.1016/j.jhydrol.2025.133215, 2025.
Cho, G. and Crompvoets, J.: The INSPIRE directive: some observations on the legal framework and implementation, Surv. Rev., 51, 310–317, https://doi.org/10.1080/00396265.2018.1454686, 2019.
Cox, J., Huismans, Y., Knaake, S., Leuven, J., Vellinga, N., Vegt, M., Hoitink, A., and Kleinhans, M.: Anthropogenic Effects on the Contemporary Sediment Budget of the Lower Rhine‐Meuse Delta Channel Network, Earth's Future, 9, https://doi.org/10.1029/2020ef001869, 2021.
Do, H. X., Gudmundsson, L., Leonard, M., and Westra, S.: The Global Streamflow Indices and Metadata Archive (GSIM) – Part 1: The production of a daily streamflow archive and metadata, Earth Syst. Sci. Data, 10, 765–785, https://doi.org/10.5194/essd-10-765-2018, 2018.
Ellingsen, K., Yoccoz, N., Tveraa, T., Hewitt, J., and Thrush, S.: Long-term environmental monitoring for assessment of change: measurement inconsistencies over time and potential solutions, Environ. Monit. Assess., 189, 1–16, https://doi.org/10.1007/s10661-017-6317-4, 2017.
European Commission: Common Implementation Strategy For The Water Framework Directive (2000/60/EC) Integrated sediment management Guidelines and good practices in the context of the Water Framework Directive, https://environment.ec.europa.eu/system/files/2022-09/CISdocumentsedimentfinalTO_BE_PUBLISHED_1430554724.pdf (last access: 21 September 2026), 2022.
Färber, C., Plessow, H., Mischel, S. A., Kratzert, F., Addor, N., Shalev, G., and Looser, U.: GRDC-Caravan: extending Caravan with data from the Global Runoff Data Centre, Earth Syst. Sci. Data, 17, 4613–4625, https://doi.org/10.5194/essd-17-4613-2025, 2025.
Favaro, E. A. and Lamoureux, S. F.: Downstream patterns of suspended sediment transport in a High Arctic river influenced by permafrost disturbance and recent climate change, Geomorphology, 246, 359–369, https://doi.org/10.1016/j.geomorph.2015.06.038, 2015.
Fortesa, J., Ricci, G., García-Comendador, J., Gentile, F., Estrany, J., Sauquet, E., Datry, T., and De Girolamo, A.: Analysing hydrological and sediment transport regime in two Mediterranean intermittent rivers, Catena, 196, 104865, https://doi.org/10.1016/j.catena.2020.104865, 2021.
Francalanci, S., Paris, E., and Solari, L.: A combined field sampling-modeling approach for computing sediment transport during flash floods in a gravel-bed stream, Water Resour. Res., 49, 6642–6655, https://doi.org/10.1002/wrcr.20544, 2013.
Fratianni, S. and Acquaotta, F.: The Climate of Italy, in: Landscapes and Landforms of Italy, edited by: Soldati, M. and Marchetti, M., Springer International Publishing, Cham, 29–38, https://doi.org/10.1007/978-3-319-26194-2_4, 2017.
Fredi, P. and Lupia Palmieri, E.: Morphological Regions of Italy, in: Landscapes and Landforms of Italy, edited by: Soldati, M. and Marchetti, M., Springer International Publishing, Cham, 39–74, https://doi.org/10.1007/978-3-319-26194-2_5, 2017.
Fryirs, K.: (Dis)Connectivity in catchment sediment cascades: a fresh look at the sediment delivery problem, Earth Surf. Process. Landf., 38, 30–46, https://doi.org/10.1002/esp.3242, 2013.
Gurnell, A. M., Piegay, H., Swanson, F. J., and Gregory, S. V.: Large wood and fluvial processes, Freshw. Biol., 47, 601–619, https://doi.org/10.1046/j.1365-2427.2002.00916.x, 2002.
Hooke, J. M.: Human impacts on fluvial systems in the Mediterranean region, Geomorphology, 79, 311–335, https://doi.org/10.1016/j.geomorph.2006.06.036, 2006.
Jacob, D., Ehrenmann, F., David, R., Tran, J., Mirande-Ney, C., and Chaumeil, P.: An ecosystem for producing and sharing metadata within the web of FAIR Data, Gigascience, 14, https://doi.org/10.1093/gigascience/giae111, 2025.
Jadhav, H., Kandekar, A., and Das, S.: Climatic and Anthropogenic Influences on Long-Term Discharge and Sediment Load Changes in the Second-Largest Peninsular Indian Catchment, Water, https://doi.org/10.3390/w16243648, 2024.
Leatherman, S. P., Zhang, K., and Douglas, B. C.: Sea level rise shown to drive coastal erosion, Eos, Transactions American Geophysical Union, 81, 55–57, https://doi.org/10.1029/00EO00034, 2000.
Luppichini, M. and Bini, M.: 40-Year shoreline evolution in Italy: Critical challenges in river delta regions, Estuar. Coast. Shelf Sci., 315, 109166, https://doi.org/10.1016/j.ecss.2025.109166, 2025.
Luppichini, M., Lazzarotti, M., and Bini, M.: Climate change as main driver of centennial decline in river sediment transport across the Mediterranean region, J. Hydrol., 636, 131266, https://doi.org/10.1016/j.jhydrol.2024.131266, 2024.
Luppichini, M., Comiti, F., Andreoli, A., Aldighieri, B., Billi, P., Bollati, I. M., Brenna, A., Chirici, D., Ciavola, P., Cilli, S., Donnini, M., Francalanci, S., Innocenti, L., Longoni, L., Mao, L., Marchesini, I., Murgia, I., Pellegrini, G., Penna, D., Picco, L., Rainato, R., Schippa, L., Solari, L., Tronti, G., Testa, B., Verdone, M., and Bini, M.: Italian Fluvial Sediment Transport Database (version 1.0), Zenodo [data set], https://doi.org/10.5281/zenodo.18799025, 2026.
Matthews, F., Verstraeten, G., Borrelli, P., Vanmaercke, M., Poesen, J., Steegen, A., Dégre, A., Rodríguez, B., Bielders, C., Franke, C., Alary, C., Zumr, D., Patault, E., Nadal‐Romero, E., Smolska, E., Licciardello, F., Swerts, G., Thodsen, H., Casalí, J., Eslava, J., Richet, J.-B., Ouvry, J., Farguell, J., więchowicz, J., Nunes, J., Pak, L., Liakos, L., Campo-Bescós, M., elazny, M., Delaporte, M., Pineux, N., Henin, N., Bezak, N., Lana-Renault, N., Tzoraki, O., Giménez, R., Li, T., Zuazo, V., Bagarello, V., Pampalone, V., Ferro, V., Úbeda, X., and Panagos, P.: EUSEDcollab: a network of data from European catchments to monitor net soil erosion by water, Sci. Data, 10, https://doi.org/10.1038/s41597-023-02393-8, 2023.
Naik, P. K. and Jay, D. A.: Distinguishing human and climate influences on the Columbia River: Changes in mean flow and sediment transport, J. Hydrol., 404, 259–277, https://doi.org/10.1016/j.jhydrol.2011.04.035, 2011.
Nejad, A. S., Alaiz-Rodríguez, R., McCarthy, G., Kelleher, B., Grey, A., and Parnell, A.: SERT: A transformer based model for multivariate temporal sensor data with missing values for environmental monitoring, Comput. Geosci., 188, 105601, https://doi.org/10.1016/j.cageo.2024.105601, 2024.
Parsons, M. A. and Fox, P. A.: Is Data Publication the Right Metaphor?, Data Sci. J., https://doi.org/10.2481/dsj.WDS-042, 2013.
Pellegrini, G., Mao, L., Rainato, R., and Picco, L.: Surprising suspended sediment dynamics of an alpine basin affected by a large infrequent disturbance, J. Hydrol., 617, 128933, https://doi.org/10.1016/j.jhydrol.2022.128933, 2023.
Rainato, R., Mao, L., García-Rama, A., Picco, L., Cesca, M., Vianello, A., Preciso, E., Scussel, G. R., and Lenzi, M. A.: Three decades of monitoring in the Rio Cordon instrumented basin: Sediment budget and temporal trend of sediment yield, Geomorphology, 291, 45–56, https://doi.org/10.1016/j.geomorph.2016.03.012, 2017.
Rainato, R., Pellegrini, G., Lenzi, M. A., and Picco, L.: Interaction between climatic conditions, water- and sediment-fluxes in an alpine basin: Long-term monthly and seasonal analysis, Geomorphology, 472, 109590, https://doi.org/10.1016/j.geomorph.2024.109590, 2025.
Rodríguez-Blanco, M. L., Arias, R., Taboada-Castro, M. M., Nunes, J. P., Keizer, J. J., and Taboada-Castro, M. T.: Potential impact of climate change on suspended sediment yield in NW Spain: A case study on the corbeira catchment, Water, 8, https://doi.org/10.3390/w8100444, 2016.
Strobl, C.: PostGIS, in: Encyclopedia of GIS, edited by: Shekhar, S. and Xiong, H., Springer US, Boston, MA, 891–898, https://doi.org/10.1007/978-0-387-35973-1_1012, 2008.
Surian, N. and Rinaldi, M.: Channel adjustments in response to human alteration of sediment fluxes: examples from Italian rivers, IAHS-Aish. P., 288, 276–282, 2004.
Syvitski, J. P. M., Vörösmarty, C. J., Kettner, A. J., and Green, P.: Impact of Humans on the Flux of Terrestrial Sediment to the Global Coastal Ocean, Science, 308, 376–380, https://doi.org/10.1126/science.1109454, 2005.
Thodsen, H., Hasholt, B., and Kjærsgaard, J. H.: The influence of climate change on suspended sediment transport in Danish rivers, Hydrol. Process., 22, 764–774, https://doi.org/10.1002/hyp.6652, 2008.
Vercruysse, K., Grabowski, R., and Rickson, R.: Suspended sediment transport dynamics in rivers: Multi-scale drivers of temporal variation, Earth Sci. Rev., 166, 38–52, https://doi.org/10.1016/j.earscirev.2016.12.016, 2017.
Vitolo, C., El-Khatib, Y., Reusser, D., Macleod, C., and Buytaert, W.: Web technologies for environmental Big Data, Environ. Model. Softw., 63, 185–198, https://doi.org/10.1016/j.envsoft.2014.10.007, 2015.
Walling, D. E.: Human impact on land–ocean sediment transfer by the world's rivers, Geomorphology, 79, 192–216, https://doi.org/10.1016/j.geomorph.2006.06.019, 2006.
Walling, D. E. and Fang, D.: Recent trends in the suspended sediment loads of the world's rivers, Glob. Planet. Change, 39, 111–126, https://doi.org/10.1016/S0921-8181(03)00020-1, 2003.
Wang, J., Haining, R., Zhang, T., Xu, C., Hu, M., Yin, Q., Li, L., Zhou, C., Li, G., and Chen, H.: Statistical Modeling of Spatially Stratified Heterogeneous Data, Ann. Am. Assoc. Geogr., 114, 499–519, https://doi.org/10.1080/24694452.2023.2289982, 2022.
Wei, D., Liu, S., Wu, Y., Feng, S., Gao, H., Qin, C., Ren, D., Tang, W., and Zhang, Y.: Impacts of human activities and climate change on water and sediment evolution in four large subtropical river basins in China, Ecol. Indic., https://doi.org/10.1016/j.ecolind.2023.110958, 2023.
Zarfl, C. and Dunn, F.: The delicate balance of river sediments, Science, 376, 1385–1386, https://doi.org/10.1126/science.abq6986, 2022.
Zhang, J., Wang, J., Zhao, N., Shi, J., and Wang, Y.: Analysis of Changes in Runoff and Sediment Load and Their Attribution in the Kuye River Basin of the Middle Yellow River Based on the Slope Change Ratio of Cumulative Quantity Method, Water, https://doi.org/10.3390/w16070944, 2024.
Zhang, K., Douglas, B. C., and Leatherman, S. P.: Global Warming And Coastal Erosion, https://link.springer.com/article/10.1023/B:CLIM.0000024690.32682.48 (last access: 21 September 2026), 2004.