the Creative Commons Attribution 4.0 License.
the Creative Commons Attribution 4.0 License.
 | 23 Sep 2026
Extending daily river discharge records across China using satellite-derived river widths
Yong Wang
Yulin Gong
Yinghong Jing
Xiaojun She

Long-term monitoring of global river discharge has been hindered by the uneven distribution of gauging stations and limited data accessibility, a challenge that is particularly acute in China. Although China contains one of the world's densest river networks, high-frequency in situ discharge observations remain largely unavailable in the international public domain. To address this gap, we compiled daily discharge records from 1196 gauges across China, comprising approximately 2.33 ×10⁶ observations – 39 times as many gauges as are currently available for the region in the Global Runoff Data Centre (GRDC). Leveraging this unprecedented collection of in situ discharge records, along with river width time series derived from Landsat and Sentinel-2 imagery and gauge-specific hydraulic geometry relationships, we reconstructed and extended daily river discharge observations for 310 gauges from 1990 to 2024, resulting in the China Daily River Discharge Records (CDR2) dataset. Compared with existing global satellite-derived discharge products, CDR2 expands the number of available gauges in China by more than fivefold while delivering substantially improved performance, achieving a median Kling–Gupta efficiency of 0.66 during validation. Moreover, uncertainties propagated from the fitted hydraulic geometry parameters remain low, with a median relative uncertainty of only 11.89 % in the reconstructed discharge estimates. Sensitivity analyses further indicate that discharge estimation accuracy increases markedly with greater river width variability and stronger hydraulic sensitivity. Trend analysis reveals that nearly 65 % of gauges exhibit declining discharge over 1990–2024, with a median relative trend of −0.21 % yr−1, most pronounced in the Haihe, Liaohe, Yellow River, and middle Yangtze River basins. As the most extensive satellite-derived, gauge-constrained river discharge dataset currently available for China at daily resolution, CDR2 bridges a critical geographic gap in global river monitoring and provides a valuable benchmark for future discharge estimation, hydrological research, water resources management, and the calibration and evaluation of satellite missions. The CDR2 dataset is publicly available on Zenodo at https://doi.org/10.5281/zenodo.22231453 (Wang and Li, 2026).
- Article
(14766 KB) - Full-text XML
- BibTeX
- EndNote


Despite accounting for only a small fraction of the global freshwater inventory, rivers constitute one of the most dynamic components of the hydrological cycle (Oki and Kanae, 2006; Palmer and Ruhi, 2018). They not only provide the most accessible freshwater resource for human societies but also serve as critical biogeochemical conduits linking terrestrial and marine ecosystems through the transport of sediments, nutrients, and thermal energy (Syvitski et al., 2005; Allen and Pavelsky, 2018; Resplandy et al., 2018). Consequently, the accurate and continuous quantification of river discharge is fundamental for sustainable water resource management, reliable hydroclimatic modeling, and assessments of environmental change.
Traditionally, in situ gauging networks have served as the primary benchmark for river discharge monitoring, providing high-fidelity and temporally continuous observations (Alsdorf et al., 2007; Hannah et al., 2011; Andrews and Grantham, 2024). However, the global distribution of these networks is highly uneven. While North America and Europe maintain relatively dense monitoring systems, extensive regions across Asia, Africa, and South America remain poorly gauged or entirely data-sparse (Do et al., 2018; Krabbenhoft et al., 2022; Collins et al., 2024; Oh and Bartos, 2025; Sun et al., 2026). Moreover, even where gauging infrastructure exists, access to discharge records is often restricted by geopolitical barriers and limited data-sharing policies (Fekete et al., 2015; Famiglietti et al., 2015; Ruhi et al., 2018; Collins et al., 2024). Together, these limitations substantially hinder the global characterization of fluvial dynamics and have motivated the rapid development of satellite-based Earth observation and hydrological modeling to address observational gaps (Gleason and Smith, 2014; Lin et al., 2019; Ghiggi et al., 2019; Hao et al., 2024; Scherer et al., 2024).
Hydrological models can provide spatially and temporally continuous simulations of river discharge, yet their predictive accuracy remains constrained by uncertainties in meteorological forcing data and simplified representations of hydrological processes (Beven, 2007; Zheng et al., 2019; Tang et al., 2023). In contrast, satellite remote sensing has emerged as a promising alternative, owing to its unprecedented global coverage and continually improving spatiotemporal resolutions (Lettenmaier et al., 2015; Sichangi et al., 2016; Hou et al., 2020). Although satellites cannot directly measure river discharge, they can routinely retrieve key hydraulic variables such as water surface elevation, river width, and surface slope (Smith, 1997; Bonnema et al., 2016; Durand et al., 2016). When integrated with historical in situ measurements, these remotely sensed variables can be converted into discharge estimates using empirical hydraulic geometry relationships and rating-based approaches (Pavelsky, 2014; Paris et al., 2016). Conceptually, this framework parallels conventional stage–discharge rating curves employed at gauging stations, with satellite-derived river width or water surface elevation replacing ground-based stage measurements. River width and water surface elevation are complementary hydraulic observables for satellite-based river discharge estimation. Unlike conventional satellite altimetry, which samples rivers only along discrete ground tracks and provides one-dimensional elevation profiles, optical remote sensing acquires spatially continuous two-dimensional observations through wide-swath imaging, enabling much broader spatial coverage of river networks (Alsdorf et al., 2007; Lettenmaier et al., 2015; Tourian et al., 2022). In addition, the long-term continuity of optical satellite archives provides a viable means to reconstruct historical discharge records over multi-decadal periods. Therefore, when aiming to maximize both the spatial density of reconstructible gauges and the temporal coverage of discharge records, river width represents a more suitable remote sensing proxy.
In recent years, satellite earth observations have facilitated substantial progress in extending global river discharge records. Notably, the Satellite Altimetry-based Extension of global-scale in situ river discharge Measurements (SAEM) integrated multi-mission satellite altimetry with existing stream gauging networks to reconstruct discharge at 8730 global stations, representing approximately 88 % of the globally gauged discharge volume (Saemian et al., 2025). Meanwhile, optical remote sensing has demonstrated strong capability for width-based discharge estimation. Riggs et al. (2023) utilized Landsat and Sentinel-2 imagery to extract dynamic river widths and extended discharge records for 2168 gauges globally. Similarly, Lin et al. (2023) conducted a large-sample evaluation of width-based discharge algorithms across 3078 gauges, demonstrating their scalability and sensitivity to hydraulic and geomorphological conditions. More recently, multi-sensor integration has emerged as a promising strategy to maximize observational coverage and reliability. Elmi et al. (2024) combined satellite-derived river widths with altimetry-based water levels and applied a stochastic non-parametric framework to reconstruct monthly discharge time series for 3377 discontinued Global Runoff Data Centre (GRDC) stations, resulting in the Remote Sensing-based Extension for the GRDC (RSEG) dataset with rigorous uncertainty quantification.
Despite these substantial global advances, a critical geographic gap persists in China. China hosts one of the world's largest and most diverse river systems and is undergoing profound hydrological alterations. River discharge regimes across the country are increasingly shaped by the combined influences of climate change – including accelerated glacier retreat over the Tibetan Plateau – and intensified anthropogenic regulation such as land use change and reservoir operation (Yao et al., 2022; Yang et al., 2022; Wang et al., 2025a, b). Nevertheless, due to restrictive data-sharing policies, high-frequency in situ discharge observations from China remain largely inaccessible. This scarcity is particularly evident in the GRDC, the most comprehensive global archive of river discharge observations, which currently contains records for only 31 gauges within China (Färber et al., 2025). In addition, China is severely underrepresented in existing global remote sensing discharge products. For example, the SAEM dataset encompasses only 62 gauges across China, accounting for less than 1 % of its total reconstructed gauges (Saemian et al., 2025). This stark disparity underscores a major deficiency in the global characterization of river discharge dynamics across one of the world's most hydrologically important regions.
To address this gap, this study leverages river width observations derived from Landsat and Sentinel optical imagery to establish station-specific width–discharge relationships and reconstruct daily river discharge records for 310 gauges across China. To our knowledge, this represents the most comprehensive satellite-derived discharge reconstruction for China to date. Compared with existing global datasets, the number of gauge-constrained stations within China has increased by at least fivefold. Across all validation gauges, the reconstructed discharge achieves a median Kling–Gupta Efficiency (KGE) of 0.66, outperforming currently available global products. The resulting dataset, termed the China Daily River Discharge Records (CDR2), substantially expands long-term discharge observations in a hydrologically critical yet data-sparse region. Beyond improving regional hydrological monitoring, CDR2 provides an essential benchmark for assessing riverine responses to climate change and anthropogenic disturbances and contributes valuable observations for future global hydrological modeling and satellite calibration efforts.
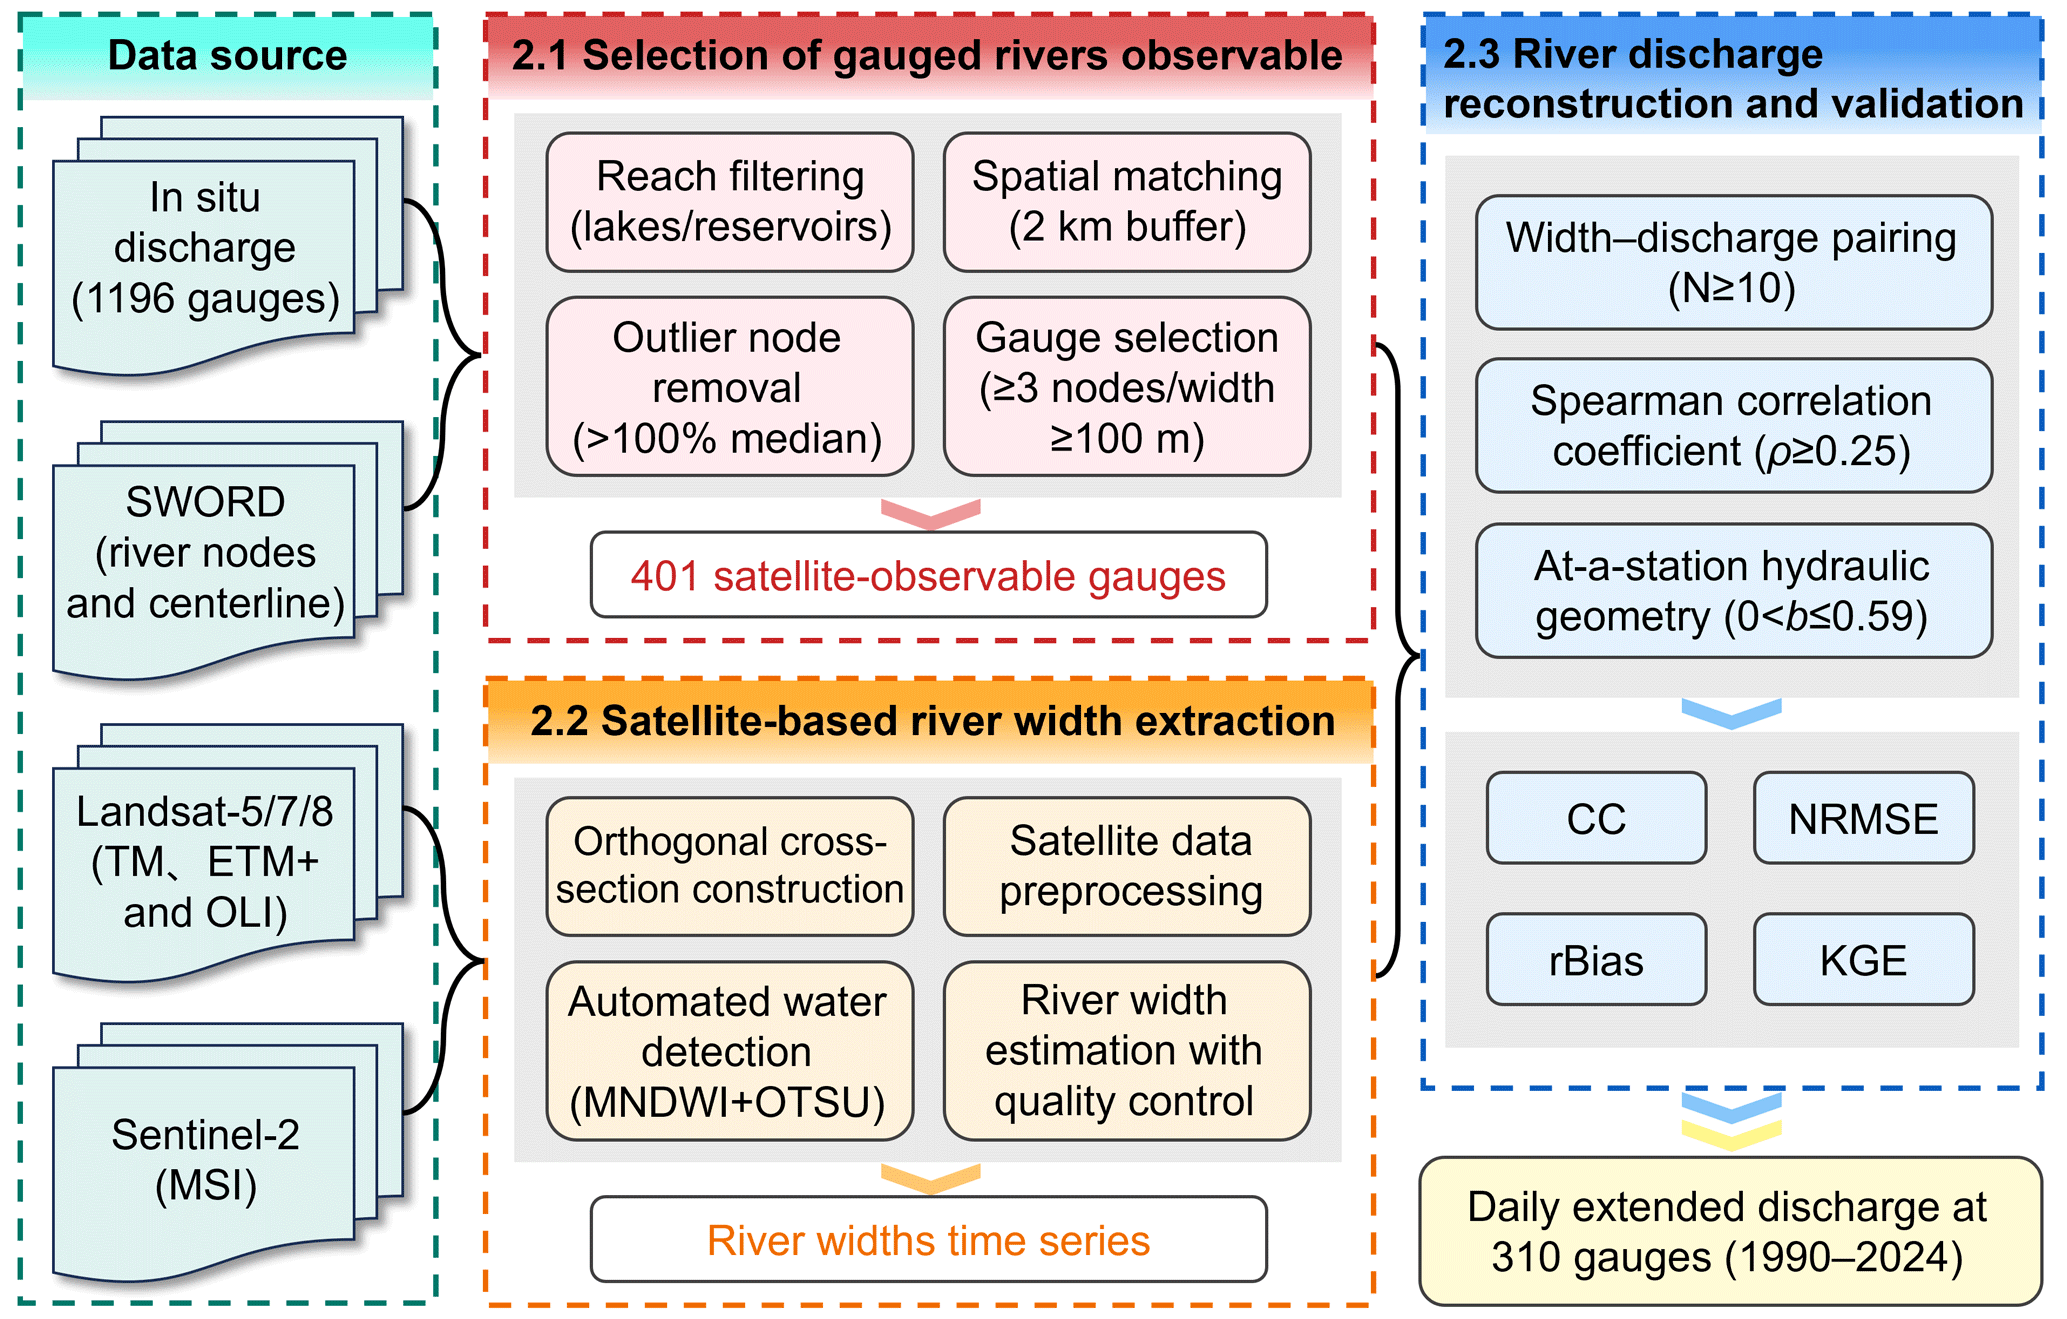
This section describes the datasets, remote sensing products, and methodological framework used to reconstruct and extend river discharge observations across China. The workflow integrates in situ discharge measurements, satellite-derived river width observations from Landsat and Sentinel-2 imagery, and station-specific hydraulic geometry relationships to generate long-term discharge estimates at daily temporal resolution. Figure 1 provides an overview of the technical framework, including data acquisition, river width extraction, construction of width–discharge relationships, discharge reconstruction, and validation procedures. Detailed descriptions of the datasets, preprocessing steps, and reconstruction methods are presented in the following subsections.
2.1 Selection of gauged rivers observable
Daily in situ river discharge observations were obtained from the National Hydrological and Rainfall Information System of the Ministry of Water Resources of China, which integrates national and regional monitoring networks spanning major rivers, lakes, and reservoirs. We compiled daily discharge records from 1196 gauging stations across 2014–2024 to construct the CDR2 dataset (Fig. 2a). To minimize redundancy, when multiple gauges were located within 100 m of one another, only the gauge with the longest observational record was retained. The resulting gauge network spans nearly all major river basins in China, with the Southwest Rivers Basin being the only exception because discharge records were unavailable from the source platform. Mean discharge among the selected gauges ranges from 0.5 to 30 000 m3 s−1, with each gauge containing an average of 1945 observations. In terms of temporal coverage, more than 80 % of the gauges contain observations beginning in or before 2015, while over 90 % include records extending back to 2018 or earlier (Fig. 2c).
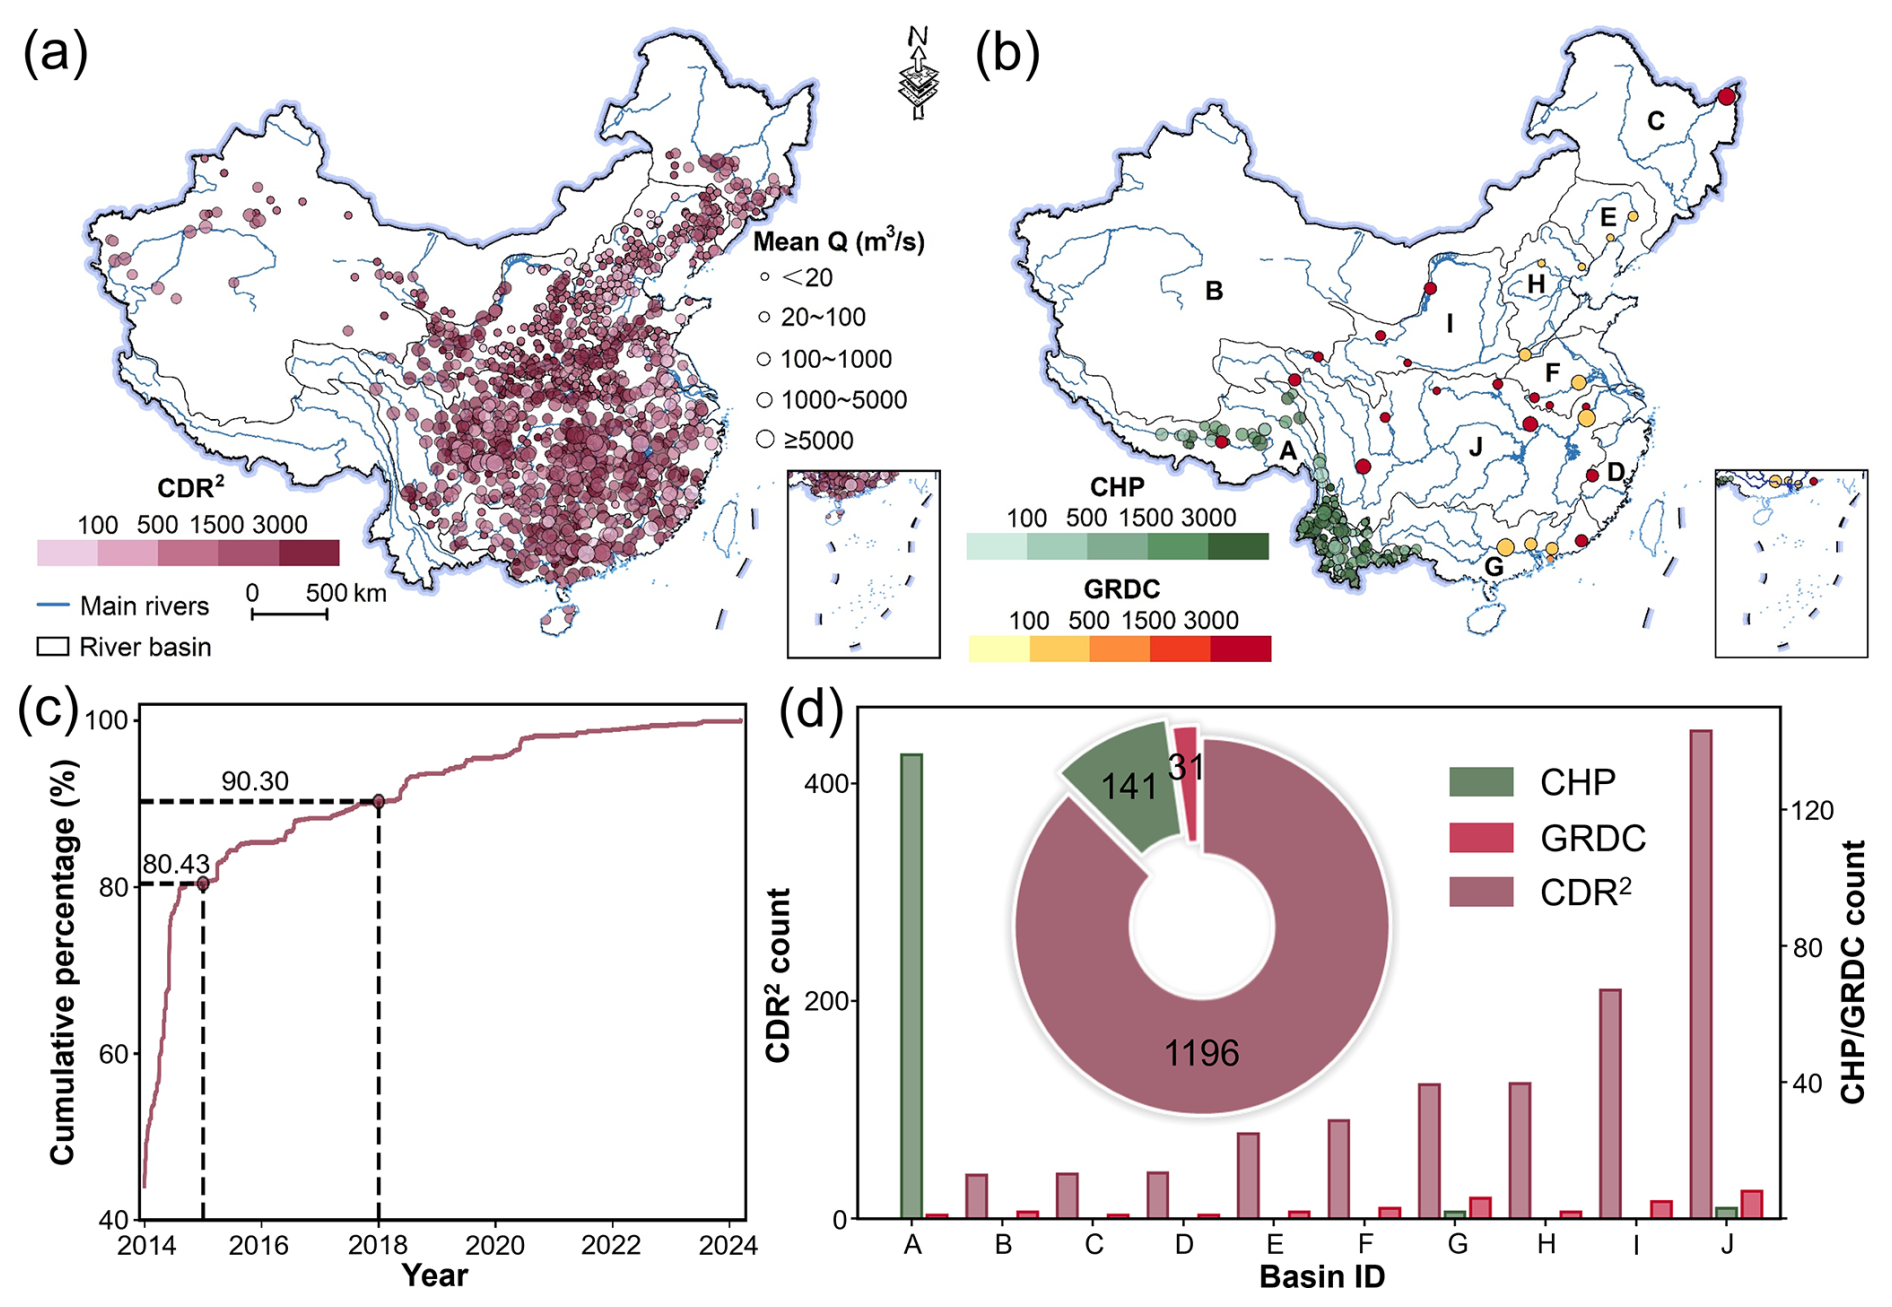
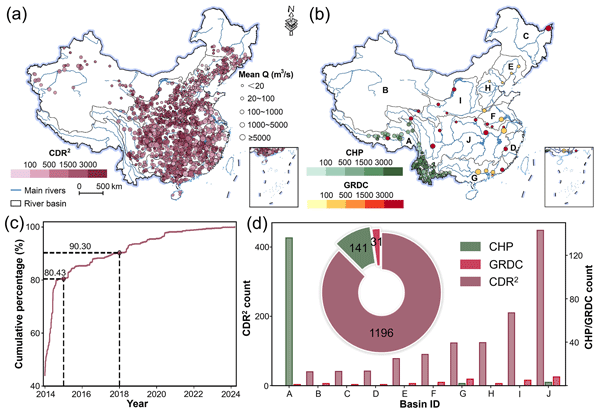
Figure 2Spatial distribution and temporal coverage of in situ river discharge observations across China (2014–2024). (a) Spatial distribution of the 1196 gauges included in the China Daily River Discharge Records (CDR2) dataset, with symbol size representing mean discharge (Q, m3 s−1) and color indicating the number of discharge records at each gauge. (b) Spatial distribution of river gauges available from the Chinese Hydrology Project (CHP) and the Global Runoff Data Centre (GRDC) within China, with symbol size representing mean discharge (Q, m3 s−1) and color indicating the number of discharge records at each gauge. The labeled regions (A–J) denote the ten major river basins: Southwest Rivers (A), Northwest Rivers (B), Songhua River (C), Southeast Rivers (D), Liao River (E), Hai River (F), Pearl River (G), Huai River (H), Yellow River (I), and Yangtze River (J). (c) Cumulative percentage distribution of gauge observation start years in CDR2, indicating that over 80 % of gauges contain records beginning in or before 2015, while more than 90 % begin in or before 2018. (d) Comparison of the number of gauges in the CDR2, CHP, and GRDC datasets across China.
Compared with existing publicly available global discharge datasets, CDR2 substantially improves both the spatial coverage and observational availability of river discharge records across China. The GRDC, currently the most comprehensive global archive of in situ discharge observations, contains records from only 31 gauges in China, many of which predate 2004 and have relatively short observational periods, including some with only a single year of data. Similarly, the Chinese Hydrology Project (CHP) dataset provides discharge records from 141 gauges, primarily spanning 1953–1987 (Henck et al., 2010; Schmidt et al., 2011). In contrast, CDR2 incorporates approximately 8.5 times as many gauges as CHP and 38.6 times as many as GRDC (Fig. 2d), while also offering substantially more recent observations at a daily temporal resolution.
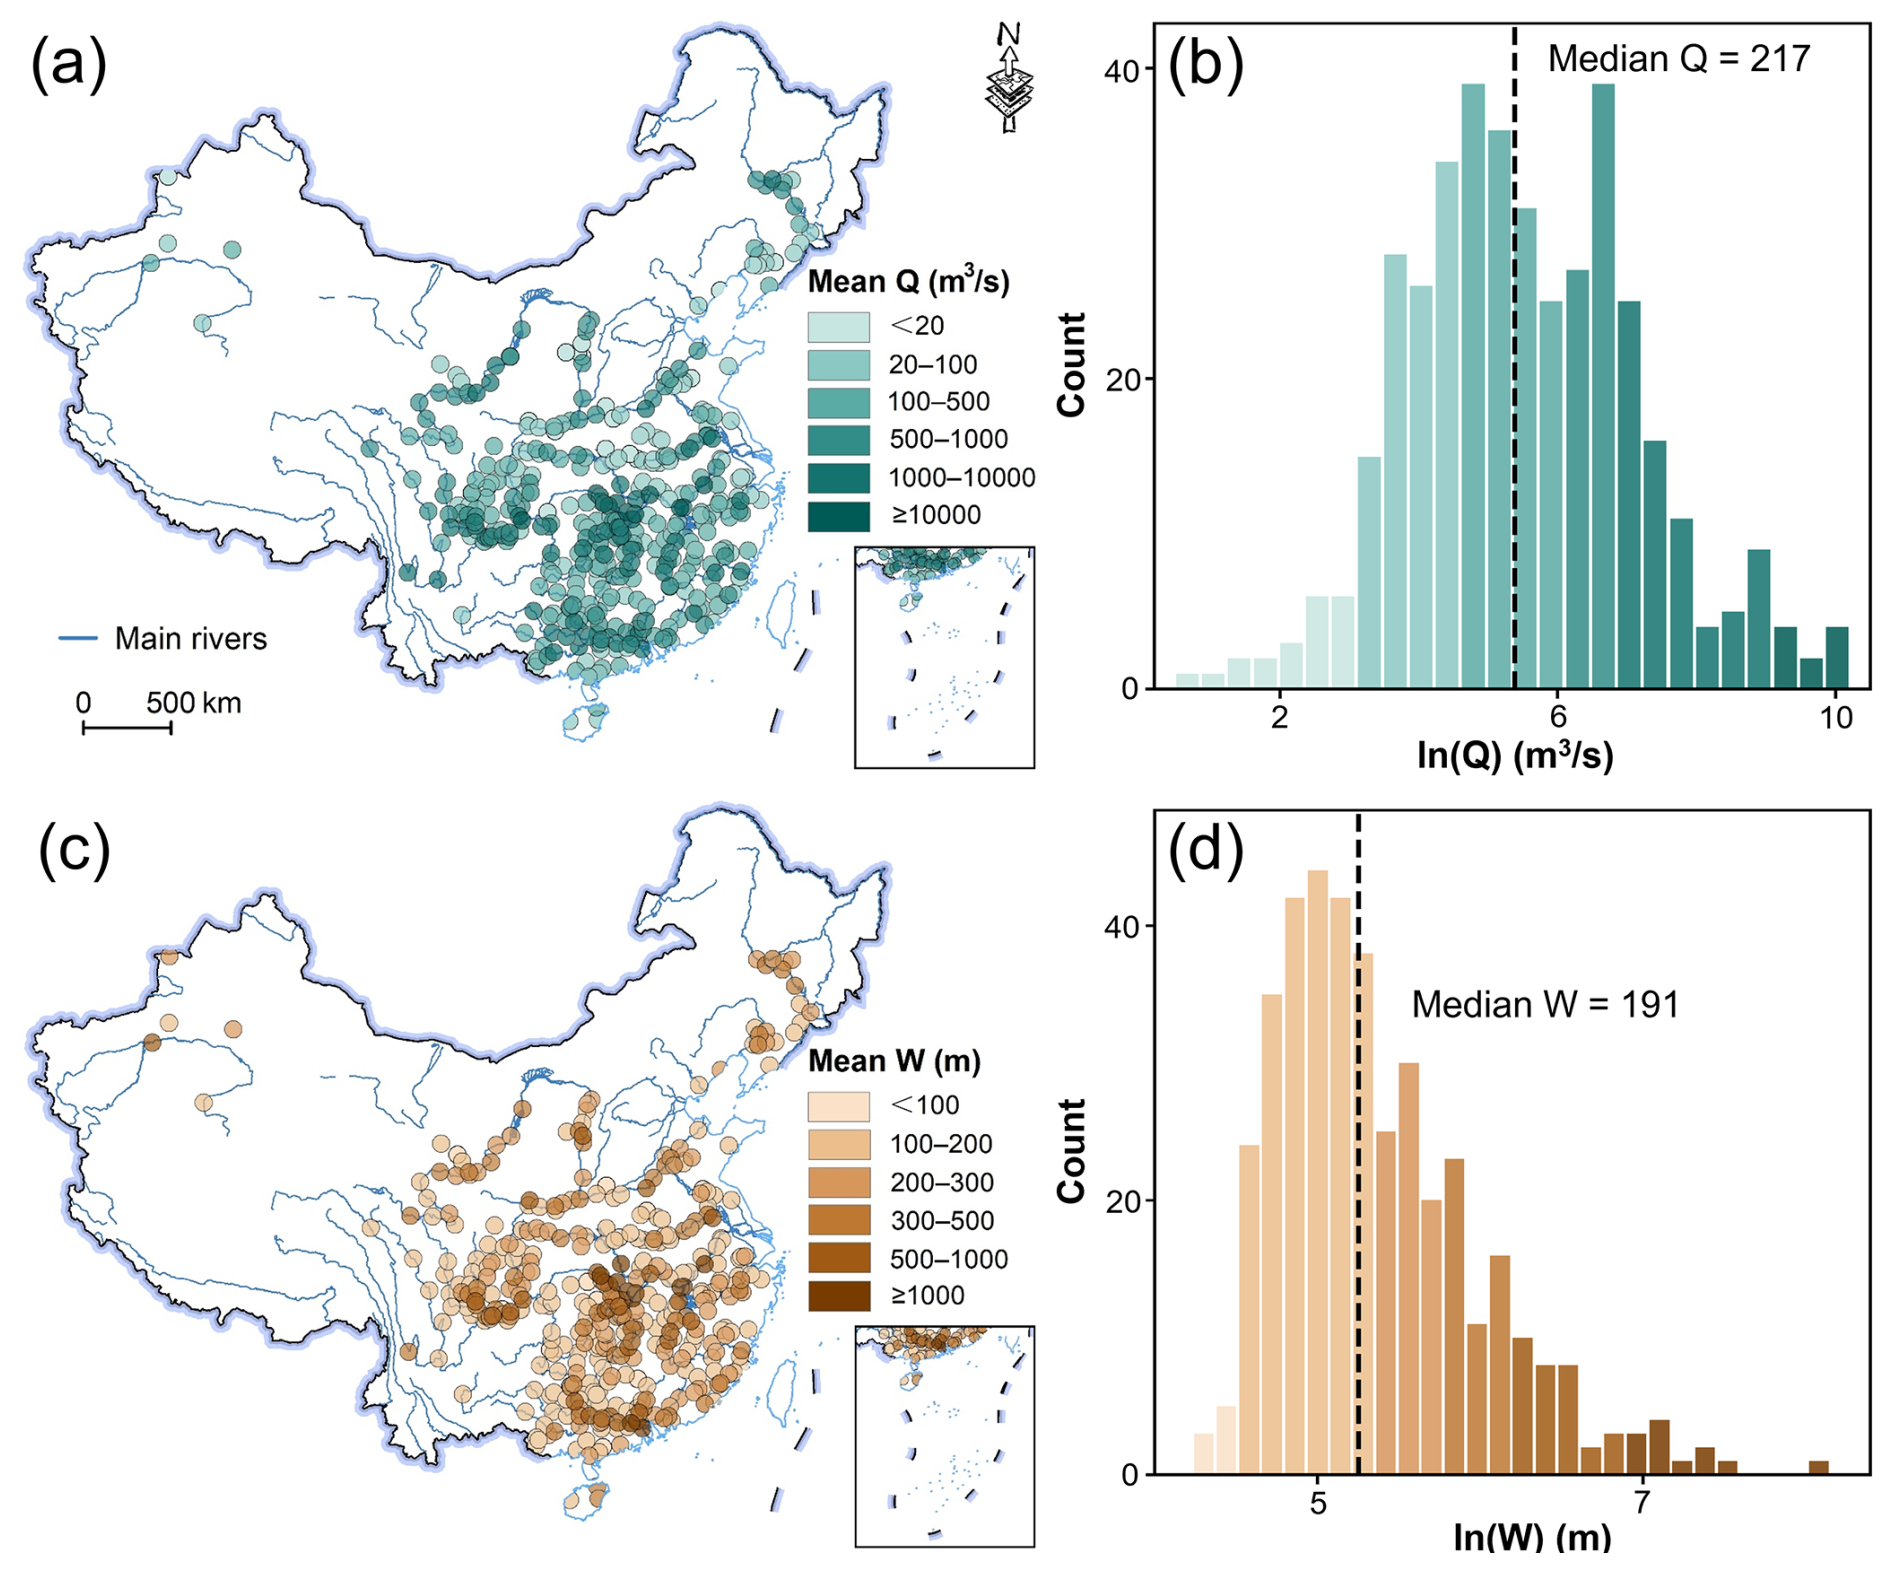
Figure 3Spatial distribution and hydrological characteristics of gauges selected for satellite-based discharge reconstruction. (a) Spatial distribution of the 401 selected gauges, with symbol color representing mean discharge (Q, m3 s−1). (b) Frequency distribution of ln (Q) for the selected gauges, showing a median discharge of 217 m3 s−1. (c) Spatial distribution of the corresponding mean river width (W, m) for the selected gauges. (d) Frequency distribution of ln (W), with a median river width of 191 m.
To identify gauges suitable for satellite-based discharge reconstruction, we employed the Surface Water and Ocean Topography River Database (SWORD) (Altenau et al., 2021) as the reference river network. SWORD provides a globally consistent river centerline dataset with connected topology, in which river systems are segmented into predefined reaches and nodes. To minimize the influence of non-channel water bodies, river reaches linked to lakes and reservoirs were excluded using the SWORD lakeflag attribute. For each gauge, all river nodes located within a 2 km buffer radius were extracted to establish the spatial correspondence between in situ discharge observations and satellite-observed river width. To improve robustness, outlier nodes were removed using a median-based relative deviation criterion, whereby nodes with width deviations exceeding 100 % of the median width were considered anomalous and excluded. A gauge was retained only if it satisfied two conditions: (1) the presence of at least three valid matched nodes, and (2) at least one node with a mean river width of ≥100 m, as defined in SWORD. These criteria ensured that the river channel could be reliably detected by optical satellite imagery and that the extracted width measurements were sufficiently representative for discharge reconstruction. Following the screening procedure, 401 gauges were identified as suitable for satellite-based river discharge reconstruction (Fig. 3). The mean discharge of these gauges ranges from 1.66 to 27 797.46 m3 s−1, with a median of 217 m3 s−1 and a mean of 1090 m3 s−1. The corresponding river widths range from 69 to 3504 m, with a median of 191 m and a mean of 277 m.
2.2 Satellite-based river width extraction
2.2.1 Construction of orthogonal river cross-sections
To retrieve long-term river width time series, we implemented an automated fixed-geometry approach based on predefined orthogonal cross-sections (Fig. 4). Unlike approaches that dynamically determine cross-section orientation for each image, the orthogonal directions in this study were derived once from the river centerline and consistently applied throughout the entire satellite image archive, thereby substantially improving computational efficiency (Pavelsky and Smith, 2008; Yang et al., 2019; Feng et al., 2019). For each matched river node identified in Sect. 2.1, its location was projected onto the river centerline to determine its along-channel position. Local flow direction was then estimated using two control points sampled symmetrically upstream and downstream along the centerline. To ensure directional stability across rivers of varying sizes, the sampling distance was constrained to 1–10 m. The resulting tangent vector was normalized and rotated by 90° to derive the unit normal vector perpendicular to the local flow direction. Orthogonal cross-sections were centered at the projected node location and extended on both sides of the channel centerline, where represents the prior mean river width derived from SWORD, yielding a total transect length of . This proportional design ensures full coverage of the active river channel while minimizing contamination from adjacent floodplains, wetlands, or nearby water bodies. In cases where local centerline curvature or geometric discontinuities prevented reliable tangent estimation, the orthogonal cross-sections were defined using the perpendicular direction of the nearest valid centerline segment.
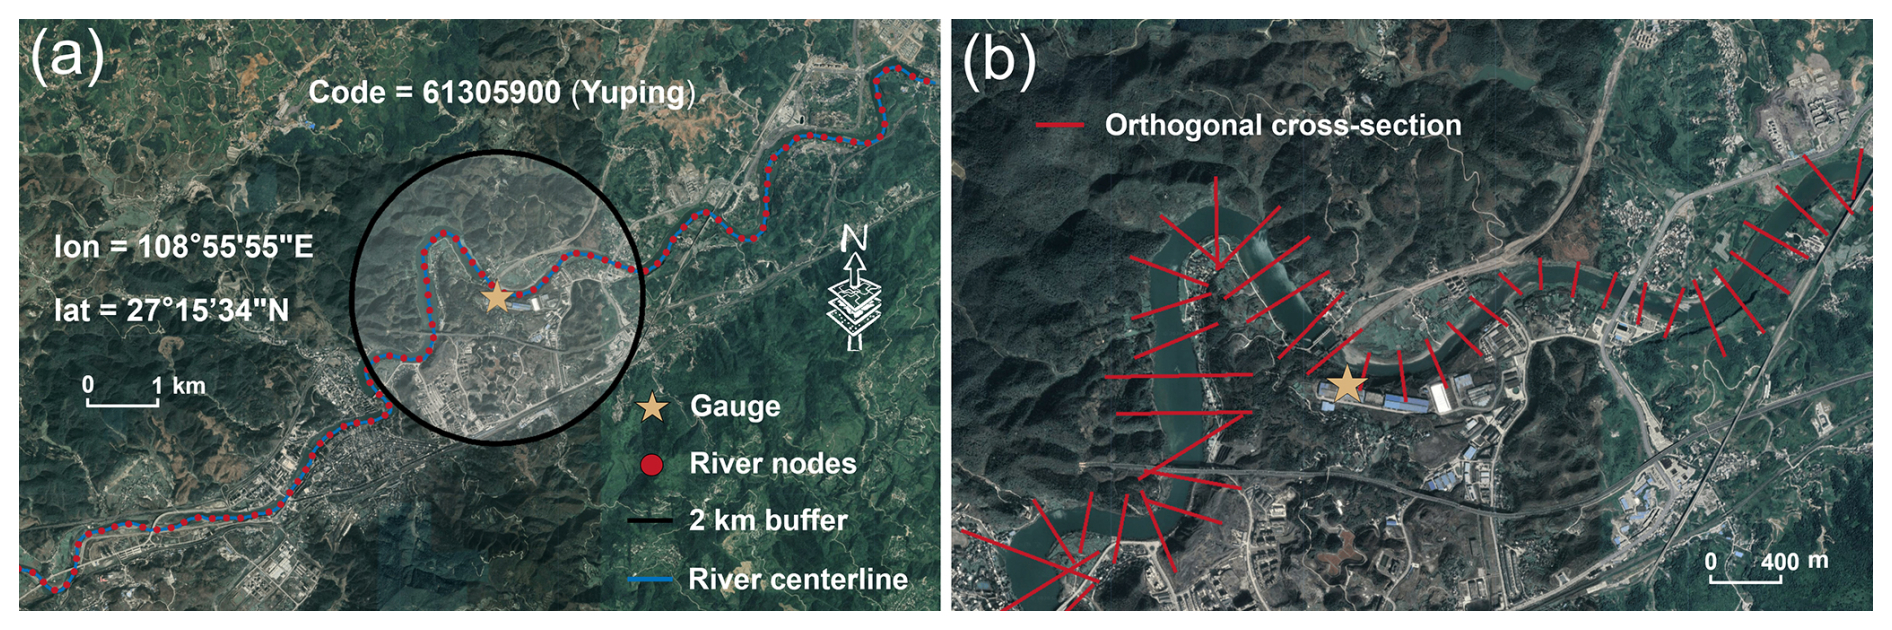
Figure 4Construction of orthogonal cross-sections for satellite-based river width extraction. (a) Example at the Yuping gauge illustrating the gauge location, river centerline, and associated river nodes. (b) Orthogonal cross-sections generated at each river node along the river centerline for extracting river width from satellite imagery. Source: © Google Earth. Imagery © 2026 Airbus, CNES/Airbus, Landsat/Copernicus, Maxar Technologies.
2.2.2 Satellite data preprocessing and surface water detection
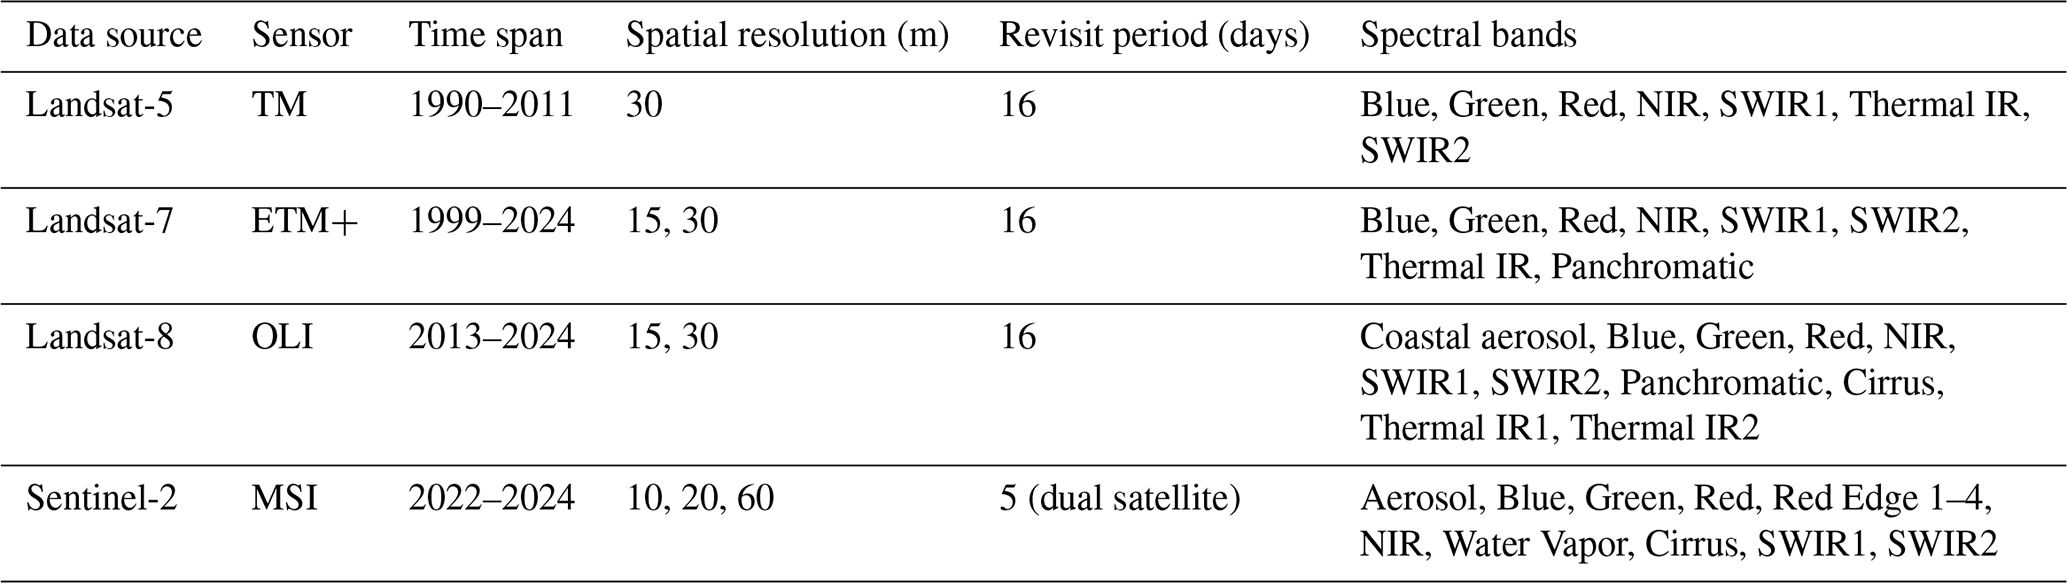
River width was derived from optical satellite imagery acquired from Landsat-5/7/8 and Sentinel-2 during 1990–2024 and processed on the Google Earth Engine (GEE) cloud platform (Table 1). Given the limited spatiotemporal coverage, relatively large geolocation errors, and low signal-to-noise ratios of the early Landsat-5 archive (Roy et al., 2014; Vogelmann et al., 2001; Wulder et al., 2016), which constrain frequent and accurate river width retrieval, we selected 1990 as the starting year of the reconstructed time series. Level-2 surface reflectance products were employed to ensure radiometric consistency and accurate geolocation across sensors. To mitigate the effects of cloud contamination, images with scene-level cloud cover exceeding 25 % were excluded. Additional pixel-level masking was applied using sensor-specific quality assessment (QA) bands to remove clouds, cloud shadows, and cirrus contamination. For each sensor, images acquired on the same day were median-composited to generate daily surface reflectance mosaics while minimizing cloud contamination. When multiple river width estimates from different sensors were available for the same date, they were averaged to obtain a single daily width value. Water bodies were identified using the Modified Normalized Difference Water Index (MNDWI) (Xu, 2006), calculated as:
Compared with the traditional Normalized Difference Water Index (NDWI) (McFeeters, 1996), MNDWI more effectively suppresses signals from built-up land surfaces and improves the delineation of open water bodies. Binary water masks were subsequently generated using the Otsu adaptive thresholding algorithm (Otsu, 1979), which automatically determines the optimal threshold by maximizing inter-class variance. Unlike fixed-threshold approaches, this adaptive method accommodates spatiotemporal variability and has demonstrated robust performance across diverse climatic, hydrological, and land-cover conditions (Chen and Zhao, 2022; Che et al., 2025).
Table 1Summary of optical satellite datasets used in this study.
2.2.3 River width estimation and quality control
River width was measured along each predefined cross-section by sampling the binary water mask at the native spatial resolution of each satellite sensor (30 m for Landsat and 10 m for Sentinel-2). The instantaneous river width, Wt, is calculated as:
where L is the total cross-section length, defined as ; Nw is the number of sampling pixels belonging to the largest connected water body along the cross-section; and Nall is the total number of valid sampling points along the cross-section. To ensure the reliability of river width retrievals, width estimates were retained only when Nall exceeded 80 % of the theoretical maximum number of sampling points (Nmax). Nmax is given by:
where R denotes the spatial resolution of the satellite sensor (m). This quality-control criterion effectively eliminates low-quality observations affected by cloud contamination, data gaps, or geometric distortions. Additionally, river width estimates smaller than the sensor spatial resolution were discarded as noise.
2.3 River discharge reconstruction and validation
The at-a-station hydraulic geometry (AHG), first introduced by Leopold and Maddock (1953), describes the power-law relationship between river width and discharge at a specific cross-section:
where a and b are empirically derived coefficients representing the scaling relationship between river width and discharge. This relationship has been widely applied to characterize the nonlinear response of river width to discharge variations and has demonstrated strong applicability for satellite-based discharge estimation (Gleason and Wang, 2015; Riggs et al., 2023). Accordingly, the instantaneous river widths derived from satellite imagery (Sect. 2.2) were paired with concurrent in situ daily discharge observations at each gauge (Sect. 2.1). Among the 401 candidate gauges, only those with at least ten valid width–discharge pairs (N≥10) were retained, yielding 358 gauges for subsequent evaluation of the width–discharge relationship.
Additional screening procedures were applied to remove gauges exhibiting weak or physically unrealistic width–discharge relationships. First, the Spearman rank correlation coefficient (ρ) was calculated to assess the monotonic association between river width and discharge. Compared with linear correlation metrics, Spearman correlation is less sensitive to outliers and nonlinear behavior and is therefore more suitable for hydraulic geometry analysis (Patidar et al., 2025). Gauges with ρ<0.25 were discarded. Such weak or negative correlations generally indicate that river width does not reliably respond to discharge variability, often due to strong channel confinement, backwater effects, reservoir regulation, or other anthropogenic disturbances (Eggleston et al., 2024; Wang and Smith, 2025). Second, the fitted hydraulic geometry exponent b was evaluated for physical plausibility. In natural river systems, b typically ranges between 0 and 0.59, reflecting realistic channel width adjustments under varying flow conditions (Park, 1977; Yuan et al., 2024). Gauges with fitted exponents outside this range were removed to avoid incorporating unstable or physically implausible hydraulic relationships into the discharge reconstruction framework. After applying all screening criteria, a total of 310 gauges were retained for river discharge reconstruction.
To quantitatively evaluate the performance of the satellite-based discharge reconstruction, four commonly used metrics were employed: the Pearson correlation coefficient (CC), normalized root mean square error (NRMSE), relative bias (rBias), and Kling–Gupta efficiency (KGE). These metrics assess different aspects of model performance, including correlation, error magnitude, systematic bias, and overall hydrological consistency. Their formulations are defined as follows:
where and denote the observed and estimated discharge (m3 s−1) at time step i, respectively. and represent the corresponding mean discharge values, and N is the total number of paired observations.
where σobs and σest represent the standard deviations of the observed and estimated discharge, respectively, while μobs and μest denote their mean values.
2.4 Uncertainty quantification
To quantify uncertainty in the fitted AHG parameters and the reconstructed discharge series, a nonparametric bootstrap procedure was applied independently to each gauge. This approach is well suited to hydrological applications because it does not require prior assumptions about the error distribution of the remote sensing observations (Hesterberg, 2011; Rodrigues et al., 2015). For each bootstrap realization, N pairs of width–discharge observations were sampled with replacement from the original set of N observations, and the AHG relationship in Eq. (4) was refitted using nonlinear least squares. Repeating this procedure 1000 times yielded empirical distributions of the coefficient a and exponent b. Their relative uncertainties, RUa and RUb, were defined as the ratio of the half-width of the 95 % confidence interval to the median of the corresponding bootstrap distribution:
where a2.5, a50, and a97.5 denote the 2.5th, 50th, and 97.5th percentiles of the bootstrap distribution of coefficient a, respectively, with analogous definitions for b2.5, b50, and b97.5 corresponding to exponent b.
For each remotely sensed river width observation (Wt) at time step t, the 1000 bootstrap parameter sets were then used to derive the corresponding discharge distribution:
The 2.5th, 50th, and 97.5th percentiles of this distribution, denoted as Qt,2.5, Qt,50, and Qt,97.5, respectively, were used to calculate the relative discharge uncertainty at time step t:
Finally, the median RUQ(t) across all available time steps was used to represent the overall uncertainty in discharge reconstruction at each gauge. All uncertainty measures are expressed as dimensionless percentages, enabling direct comparison among gauges with different discharge magnitudes and across geographic regions.
3.1 Evaluation of width–discharge relationships
Following the screening criteria, a total of 310 gauges were retained for discharge reconstruction, each with sufficient width–discharge observations (10–529 pairs; median = 108) and a physically consistent hydraulic geometry relationship (Fig. 5). The ρ between river width and discharge ranges from 0.26 to 0.99, with a median value of 0.88 and a mean of 0.84 (Fig. 5a, c). The interquartile range (IQR) spans 0.78–0.92, and approximately 70 % of the gauges exhibit strong correlations (ρ>0.8), whereas only 1.3 % show correlations below 0.5. Additionally, nearly 90 % of gauges fall within the range of 0.59–0.96. Spatially, strong width–discharge correlations are widely distributed across diverse hydroclimatic regions of China, whereas weak correlations show no clear geographic clustering (Fig. 5a). These results indicate that river width at the selected gauges responds sensitively and consistently to discharge variability, thereby satisfying a key prerequisite for satellite-based discharge estimation.
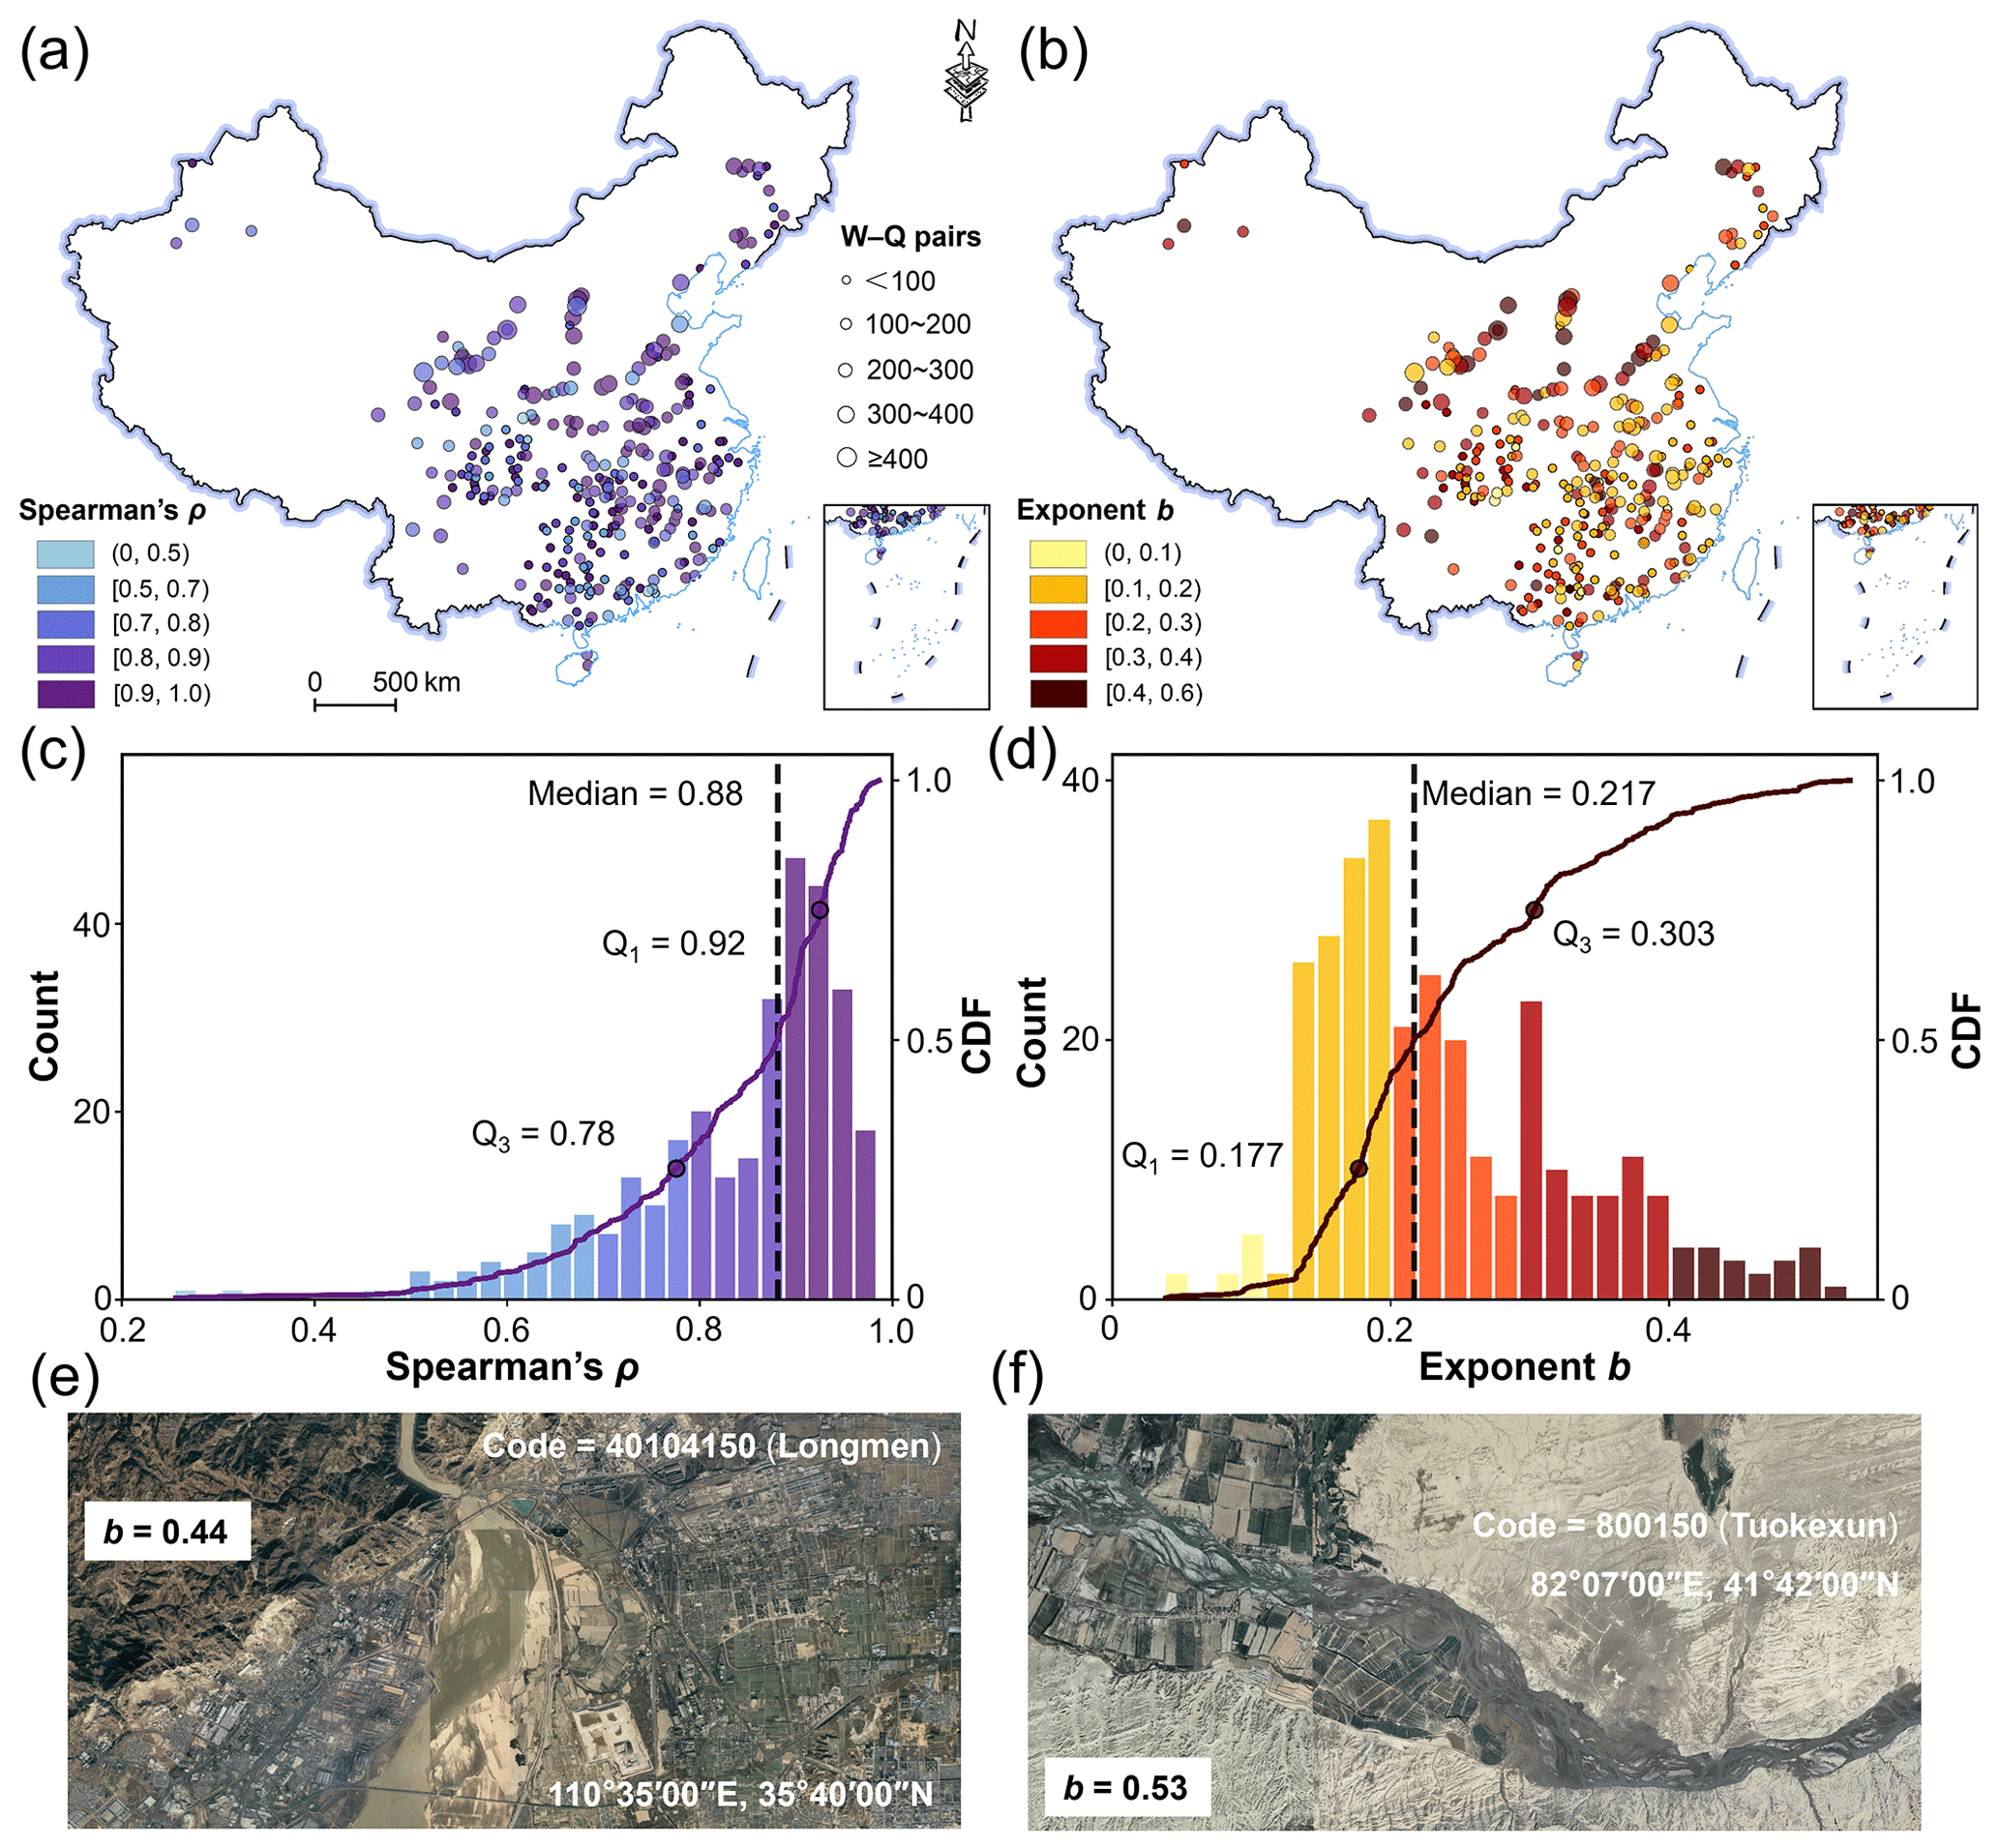
Figure 5Spatial distribution and statistical characteristics of width–discharge relationships across the 310 selected gauges. (a) Spatial distribution of the Spearman rank correlation coefficient (ρ) between river width and discharge, with symbol size representing the number of width–discharge (W–Q) observation pairs at each gauge. (b) Spatial distribution of the power-law exponent (b) derived from the at-a-station hydraulic geometry (AHG) relationship. (c–d) Frequency histograms and cumulative distribution functions (CDFs) of ρ and b, respectively, with median values and interquartile ranges indicated. (e–f) High-resolution satellite imagery of representative river reaches exhibiting high b values and morphologically dynamic channel patterns. Source: © Google Earth. Imagery © 2026 Airbus, CNES/Airbus, Landsat/Copernicus, Maxar Technologies.
The hydraulic geometry exponent b derived from the AHG relationship further supports the physical realism of the width–discharge relationship (Fig. 5b, d). The fitted b values range from 0.039 to 0.530, with a median of 0.217, a mean of 0.243, and an IQR of 0.177–0.303. Approximately 92 % of gauges exhibit b values between 0 and 0.4, consistent with previous large-sample hydraulic geometry studies. For example, Park (1977) reported a median b value of ∼ 0.23 based on 139 gauges, while Yuan et al. (2024) found a median value of 0.213 using 436 global gauges, with 94 % of gauges falling within the 0–0.4 interval. Notably, relatively high b values (e.g., 0.44 and 0.53) are primarily associated with gauges located in multi-threaded or laterally unconfined river systems (Fig. 5e, f). In these environments, increasing discharge often induces substantial lateral inundation across multiple channels, bars, and floodplain surfaces, thereby enhancing the sensitivity of river width to discharge fluctuations. Such amplified width responses are characteristic of braided and morphodynamically active river systems (Ashmore and Sauks, 2006; Yuan et al., 2024). Overall, these results demonstrate that satellite-derived river widths effectively capture river discharge dynamics and provide a physically robust basis for reconstructing discharge records at daily temporal resolution across the selected gauges.
3.2 Performance evaluation of satellite-extended river discharge
Given the limited sample size at individual gauges and the fact that evaluating the predictive capability of the AHG relationships is not the primary objective of this study, the in-sample fitting (ISF) approach was adopted for final parameterization to maximize the calibration sample size and thereby ensure the robustness of the long-term discharge reconstruction. Building upon the robust width–discharge power-law relationships established at 310 gauges, we reconstructed and extended river discharge records at daily temporal resolution for 1990–2024 and evaluated performance using four complementary metrics. The satellite-extended discharge exhibits strong agreement with in situ observations (Fig. 6). The median values of the CC, NRMSE, rBias, and KGE are 0.80, 12.67 %, 6.56 %, and 0.66, respectively. Approximately 73 % of gauges exhibit strong correlation (CC > 0.7), while 79 % achieve NRMSE values below 20 %, indicating that the reconstructed discharge reliably captures both the temporal variability and magnitude of observations across diverse hydrological regimes. Notably, KGE values exceed −0.41 at 96 % of gauges, suggesting that the reconstructed discharge consistently outperforms a simple mean discharge benchmark and retains meaningful predictive skill (Knoben et al., 2019). Moreover, 91 % of gauges show positive KGE values, demonstrating that the reconstructed records generally reproduce observed discharge dynamics with acceptable overall fidelity. Spatially, gauges with high predictive performance are broadly distributed across China's major river basins, with no obvious concentration in any specific hydroclimatic region. This consistent performance across diverse river systems demonstrates the robustness and scalability of the proposed framework and highlights the strong potential of integrating satellite-derived river widths with AHG relationships to reconstruct river discharge records at daily resolution over large spatial domains.
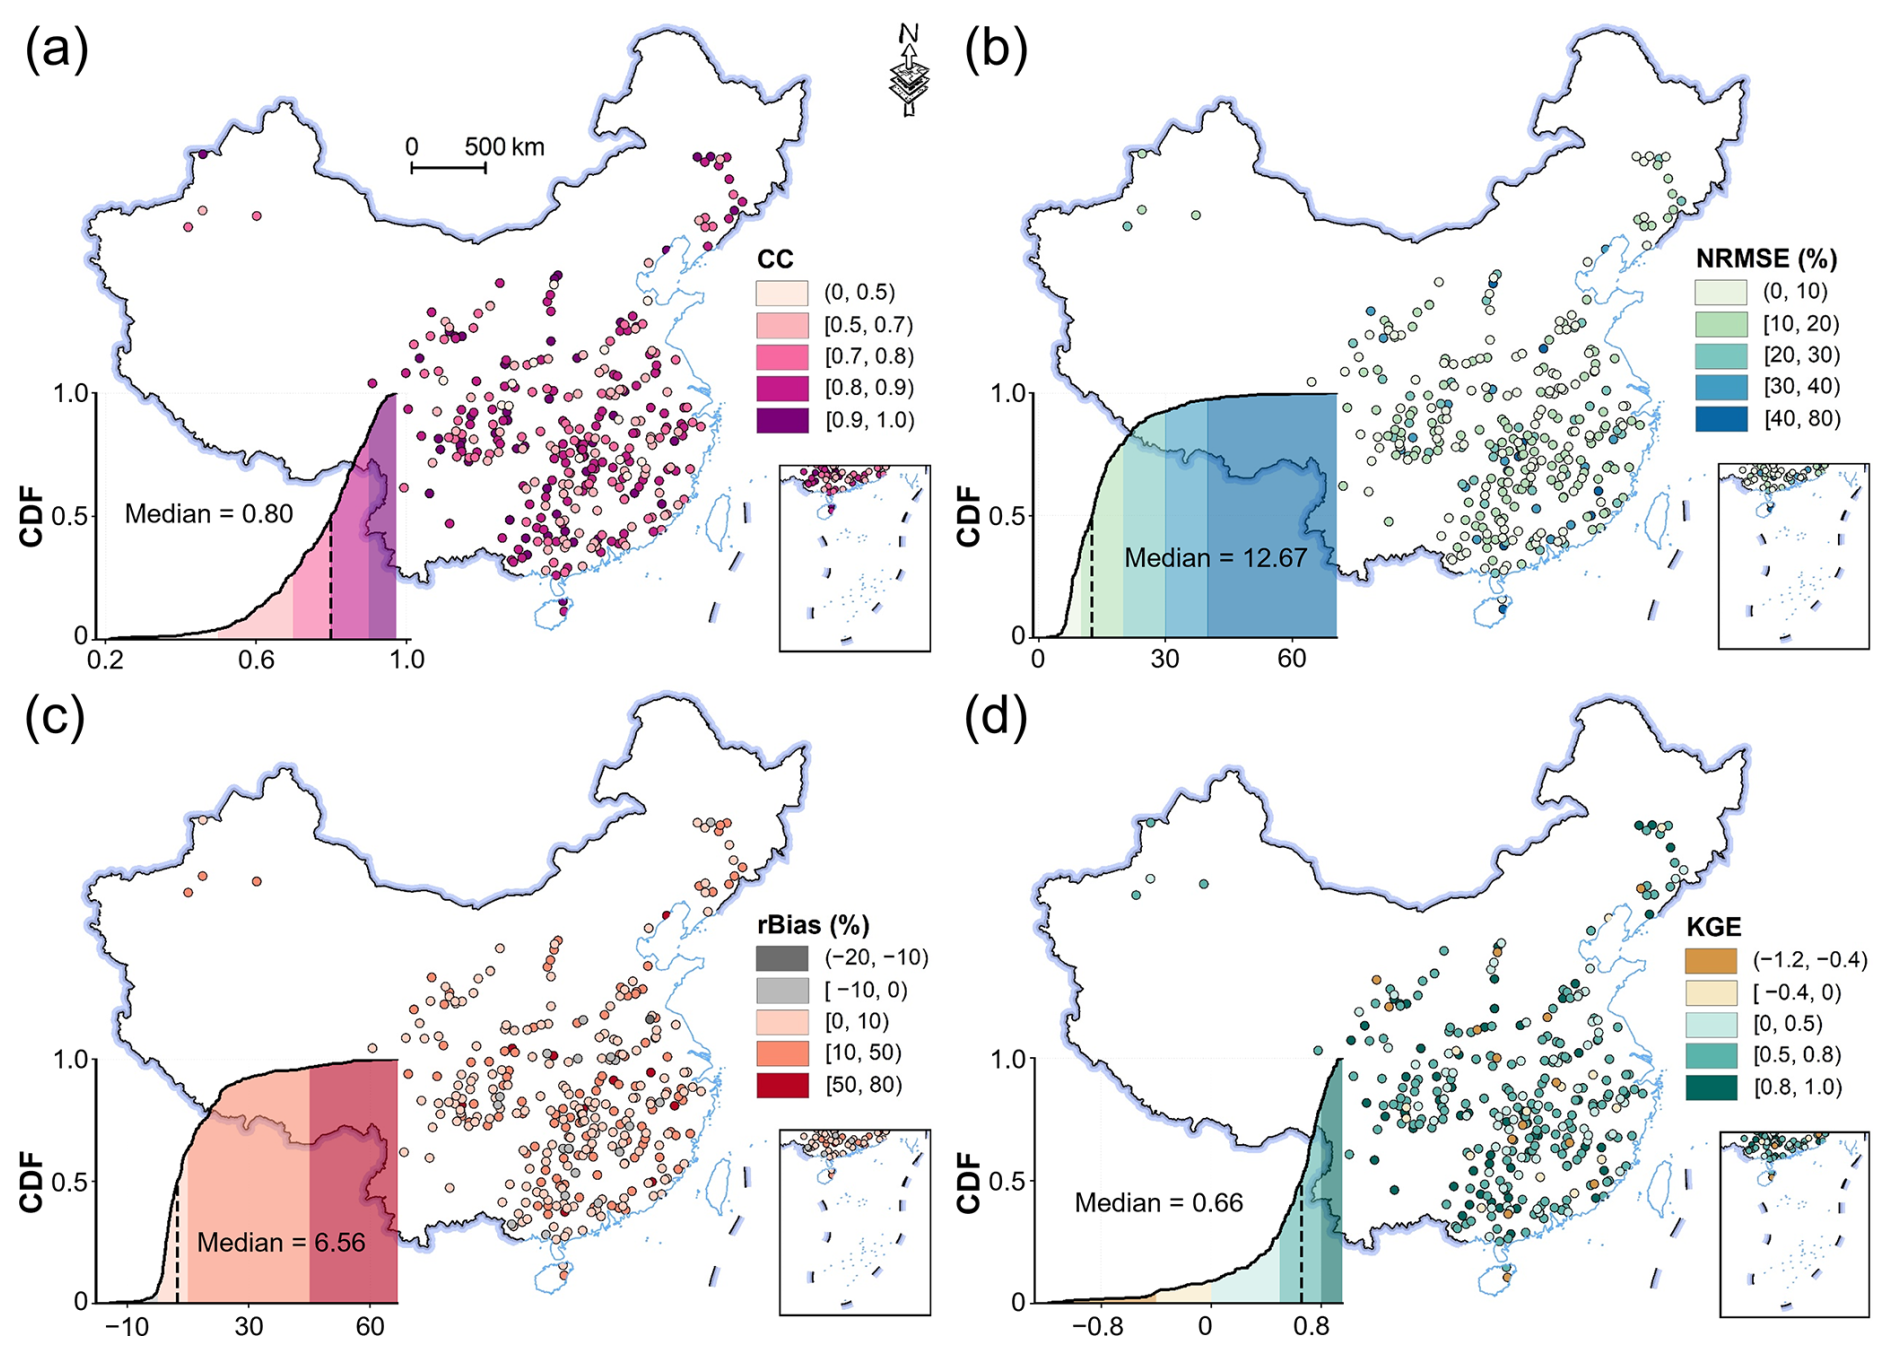
Figure 6Performance evaluation of satellite-extended river discharge across 310 gauges based on the AHG width–discharge power-law relationship. (a–d) Spatial distributions of the Pearson correlation coefficient (CC), normalized root mean square error (NRMSE, %), relative bias (rBias, %), and Kling–Gupta efficiency (KGE), respectively. Insets in each panel show the corresponding cumulative distribution functions (CDFs), with median values indicated.
To assess the robustness of the performance evaluation, a leave-one-out cross-validation (LOOCV) analysis was performed (Kim et al., 2014). Compared with the ISF results, LOOCV exhibited only marginal reductions in performance, with median decreases in CC and KGE of 0.01–0.04, while differences in NRMSE and rBias remained below 0.7 % (Fig. A1 in the Appendix). These minor discrepancies indicate that the ISF approach introduces little overfitting and that the reconstructed discharge estimates are robust to the choice of calibration strategy.
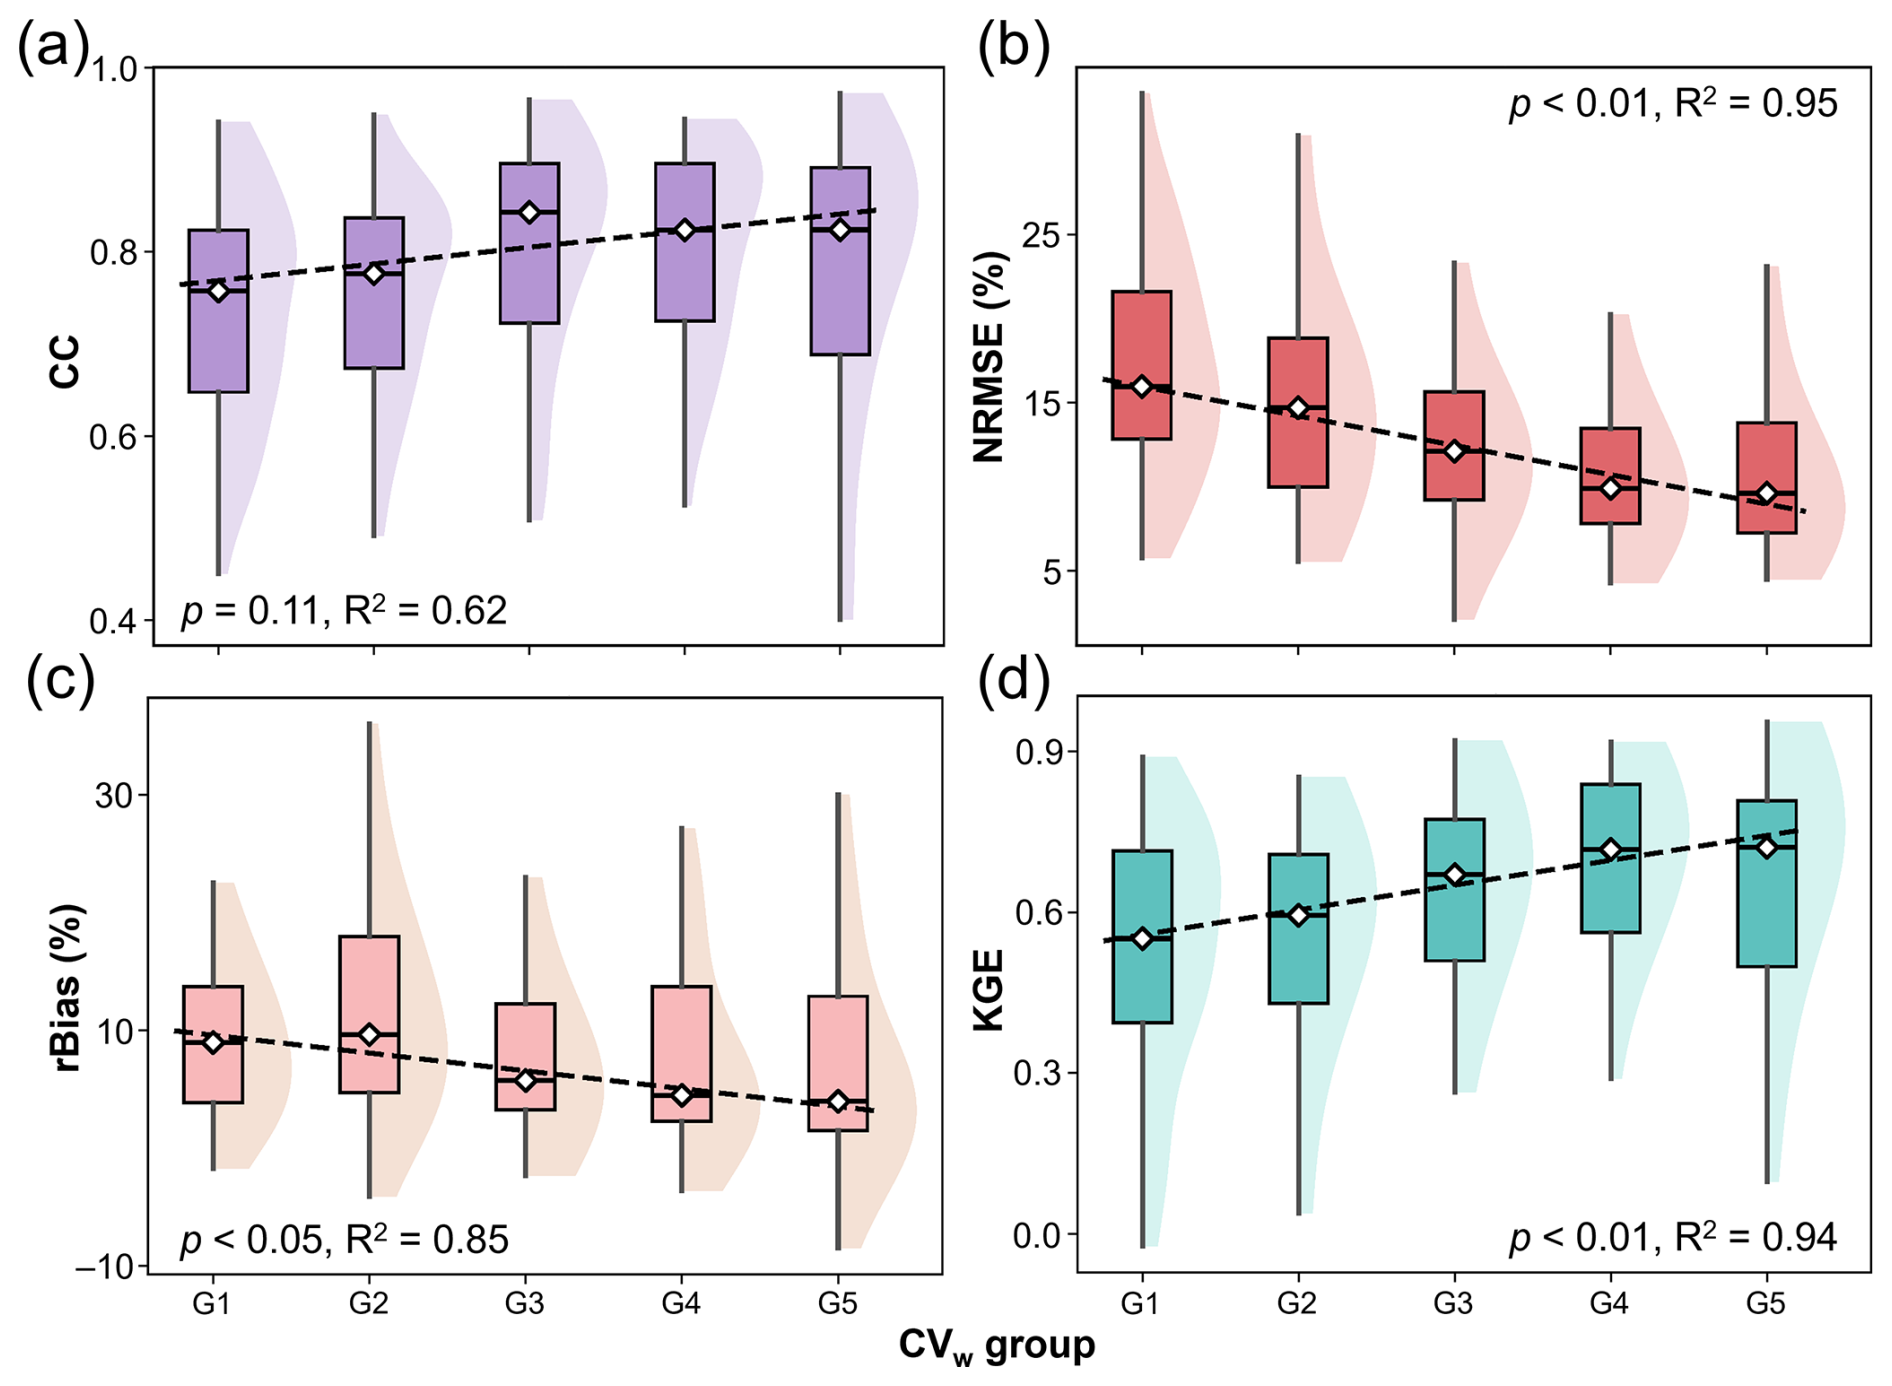
Figure 7Performance evaluation of satellite-extended discharge across gradients of river width variability, quantified by the coefficient of variation of river width (CVw). (a–d) Boxplots of performance metrics, including the Pearson correlation coefficient (CC), normalized root mean square error (NRMSE), relative bias (rBias), and Kling–Gupta efficiency (KGE), for the 310 gauges grouped into five equal-frequency classes according to CVw. Outliers are not shown for clarity. Dashed lines indicate linear regression fits to the group median values, with corresponding significance levels (p) and coefficients of determination (R2) shown in each panel.
To further investigate the influence of river dynamics on reconstruction performance, the selected gauges were stratified into five equal-frequency groups (G1–G5) according to the coefficient of variation of river width (CVw), with group mean values ranging from 6 % to 23 % (Fig. 7). Performance metrics were then compared across the CVw gradient. The results reveal a clear positive relationship between discharge reconstruction performance and river width variability. Specifically, both NRMSE and rBias decrease with increasing CVw (Fig. 7b, c), while KGE increases correspondingly (Fig. 7d), with all trends statistically significant (p<0.05). These findings are physically consistent with expectations, as rivers exhibiting greater morphological variability generally respond more sensitively to discharge fluctuations. Such enhanced hydraulic responsiveness improves the detectability of width changes in satellite observations and strengthens the robustness of width-based discharge estimation (Durand et al., 2023; Lin et al., 2023; Scherer et al., 2024). Although CC does not exhibit a statistically significant monotonic trend (p = 0.11), the relatively high coefficient of determination (R2 = 0.62) still suggests a moderate positive association with CVw (Fig. 7a). However, CC values remain consistently high (>0.75) across all groups, with only limited intergroup variability, indicating that the temporal dynamics of river discharge are effectively captured regardless of river width variability. Notably, even within the low-CVw groups, where predictive performance is comparatively weaker, the reconstruction framework retains satisfactory skill, with median CC, NRMSE, rBias, and KGE values of approximately 0.76, 15.97 %, 9.65 %, and 0.55, respectively. These results demonstrate that reliable discharge reconstruction can still be achieved in rivers with relatively limited width variability, highlighting the robustness and broad applicability of the proposed framework across diverse channel morphologies and hydrological conditions.
3.3 Uncertainty of river discharge estimates
Although the reconstructed discharge records agree well with in situ observations, uncertainties in the parameters fitted from the AHG relationships may accumulate and propagate through the discharge retrieval process. To quantify this effect, we employed bootstrap resampling to estimate the propagation of AHG parameter uncertainty in the reconstructed discharge series across 310 gauges (Fig. 8). The median relative uncertainties of the coefficient a and exponent b (RUa and RUb) were 14.36 % and 13.24 %, respectively (Fig. 8a, b). Approximately 68 % of gauges exhibited RUa below 20 %, and about 80 % showed RUb below 20 %, indicating robust parameter estimation for the majority of gauges, with the half-widths of their 95 % confidence intervals all less than one-fifth of the median parameter estimates. The median relative uncertainty in reconstructed discharge attributable to parameter propagation (RUQ) was 11.89 %, and approximately 83 % of gauges had RUQ below 20 % (Fig. 8c), suggesting that the influence of parameter estimation errors on discharge reconstruction is generally acceptable. Fewer than 2 % of gauges exhibited RUQ exceeding 40 %, all of which had fewer than 25 width–discharge paired samples, implying that limited calibration data are the primary source of elevated discharge uncertainty. Spatially, gauges with higher parameter and discharge uncertainties were mainly located in the Yangtze and Pearl River basins (Fig. 8a–c). Frequent cloud cover in these regions may reduce the availability of effective optical observations and seasonal representativeness, thereby weakening the statistical constraints on AHG parameters and amplifying discharge uncertainty.
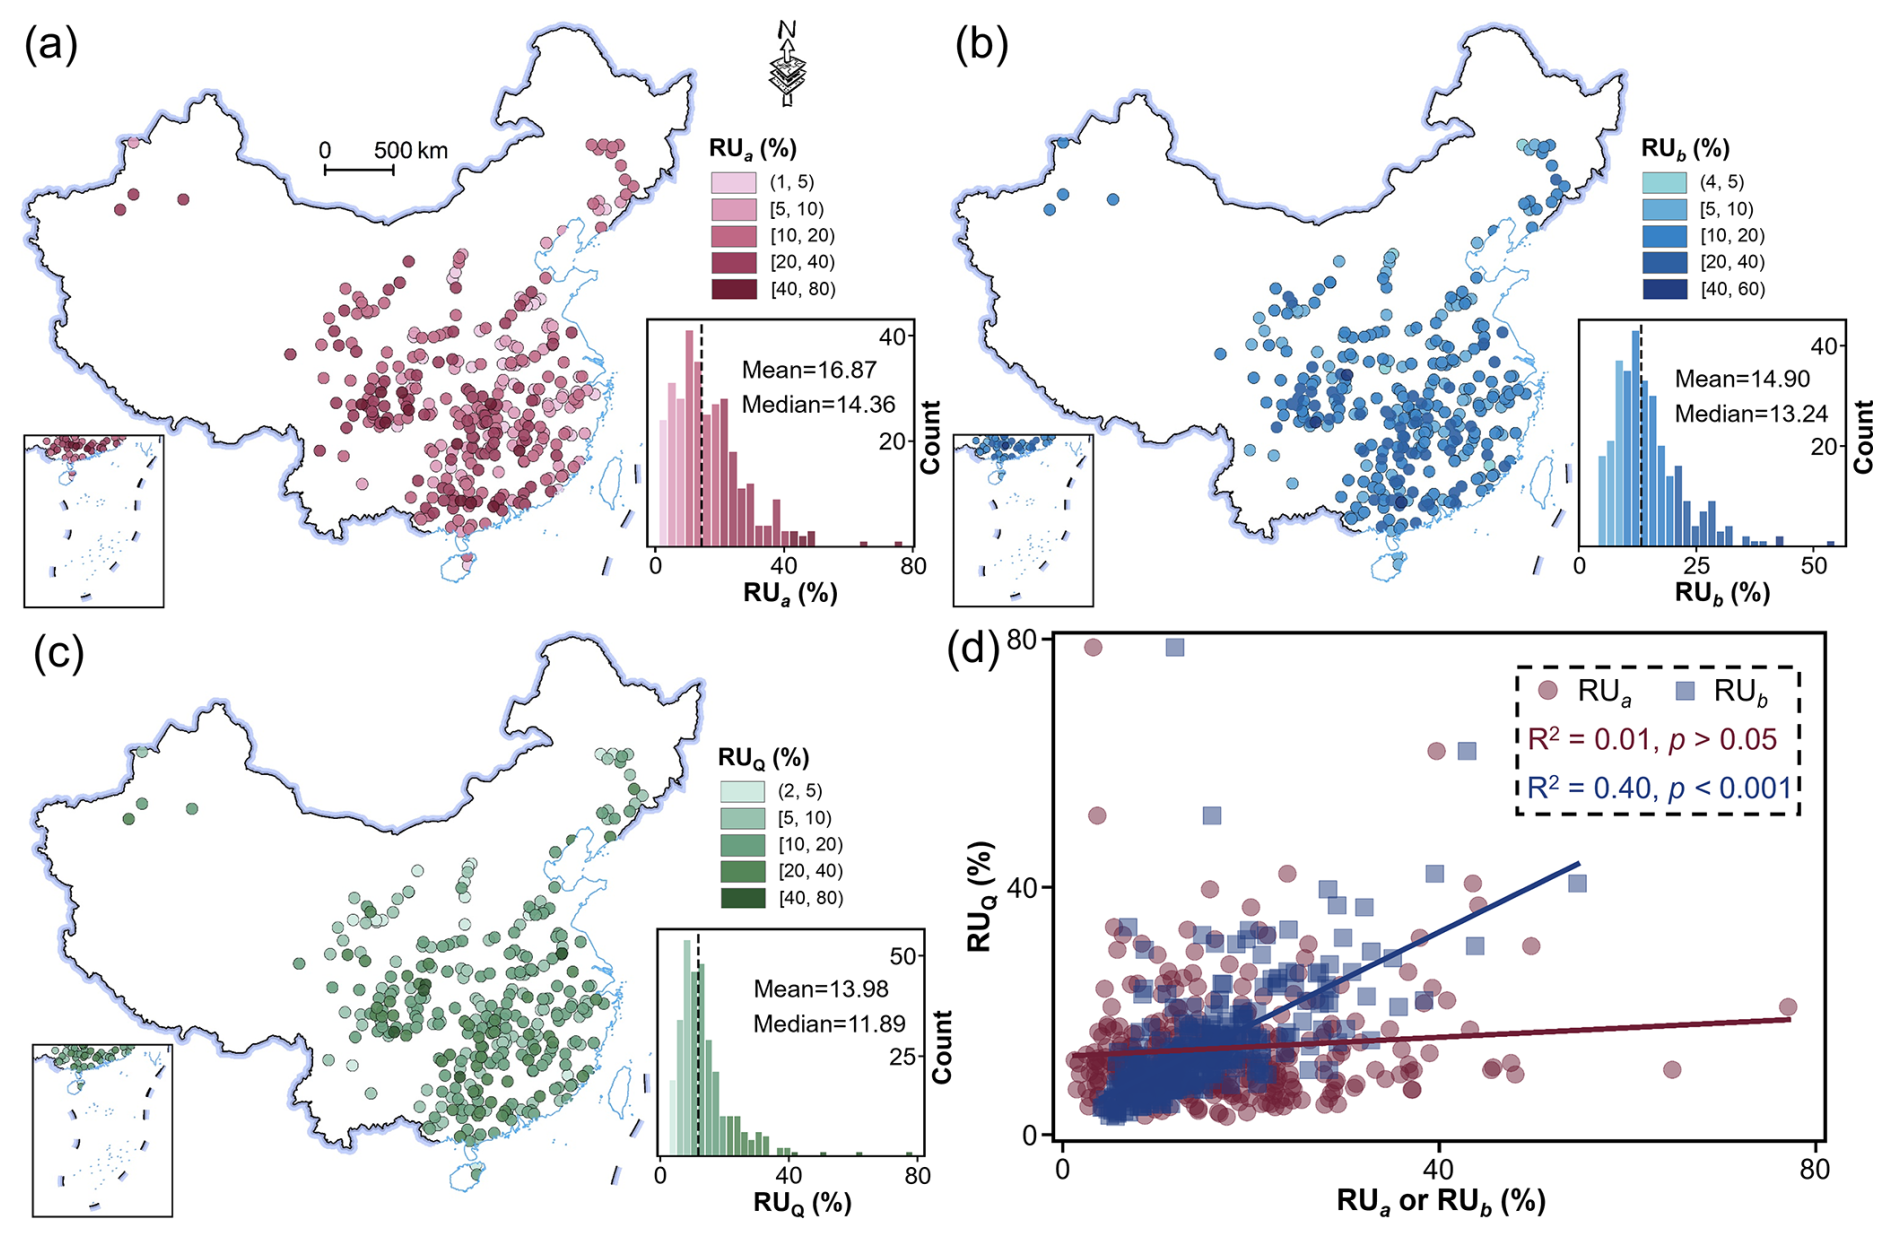
Figure 8Uncertainty assessment of satellite-extended river discharge at 310 gauges based on the bootstrap method. (a–c) Spatial distributions of the relative uncertainties of the width–discharge power-law coefficient a (RUa), exponent b (RUb), and reconstructed discharge (RUQ), respectively. The relative uncertainty is defined as the relative half-width of the 95% confidence interval, determined by the 2.5th and 97.5th percentiles of the bootstrap distribution. Insets in each panel show frequency distribution histograms, with mean and median values indicated. (d) Scatter plots and linear regressions between RUQ and RUa or RUb, demonstrating that uncertainty in discharge reconstruction is primarily controlled by exponent b during error propagation, with the corresponding coefficients of determination (R2) and statistical significance levels (p) indicated.
Moreover, RUQ showed a significant positive correlation with the exponent b (R2 = 0.40, p<0.001), but no significant correlation with coefficient a (R2 = 0.01, p>0.05) (Fig. 8d). This divergence is consistent with the AHG equation, in which uncertainty in the exponent b is amplified through its reciprocal exponent. The exponent b therefore exerts a stronger control on uncertainty propagation, supporting the necessity of filtering out gauges with physically unreasonable b values, as described in Sect. 3.1. Overall, the CDR2 dataset exhibits relatively constrained parameter-induced uncertainty for most gauges, providing a data foundation with quantitative confidence bounds for subsequent analyses of long-term discharge change across China. However, RUQ only characterizes the propagation of AHG parameter uncertainty under given satellite-derived river widths and does not account for other sources of uncertainty, including remote sensing observation errors, model structural errors, or changes in external hydrological processes.
3.4 Long-term trends and observation frequency of satellite-extended river discharge
Using the satellite-extended discharge estimates with daily temporal resolution from 310 gauges spanning 1990–2024, we quantified the long-term trends and observational characteristics of rivers across China (Fig. 9). Trend detection was performed using the non-parametric Mann-Kendall test (Mann, 1945) in combination with Sen's slope estimator (Sen, 1968), applied to annually aggregated discharge series. Relative annual rates of change (% yr−1) were calculated by normalizing Sen's slope with the multi-year mean discharge, thereby facilitating comparison among rivers with varying discharge magnitudes. To improve the robustness of trend estimation, only years containing at least three observations separated by a minimum intra-annual interval of six months were retained. Furthermore, trend analysis was restricted to gauges with more than 15 valid years of records. After quality filtering, 309 gauges were included in the final analysis, with an average effective record length of 32.5 years.
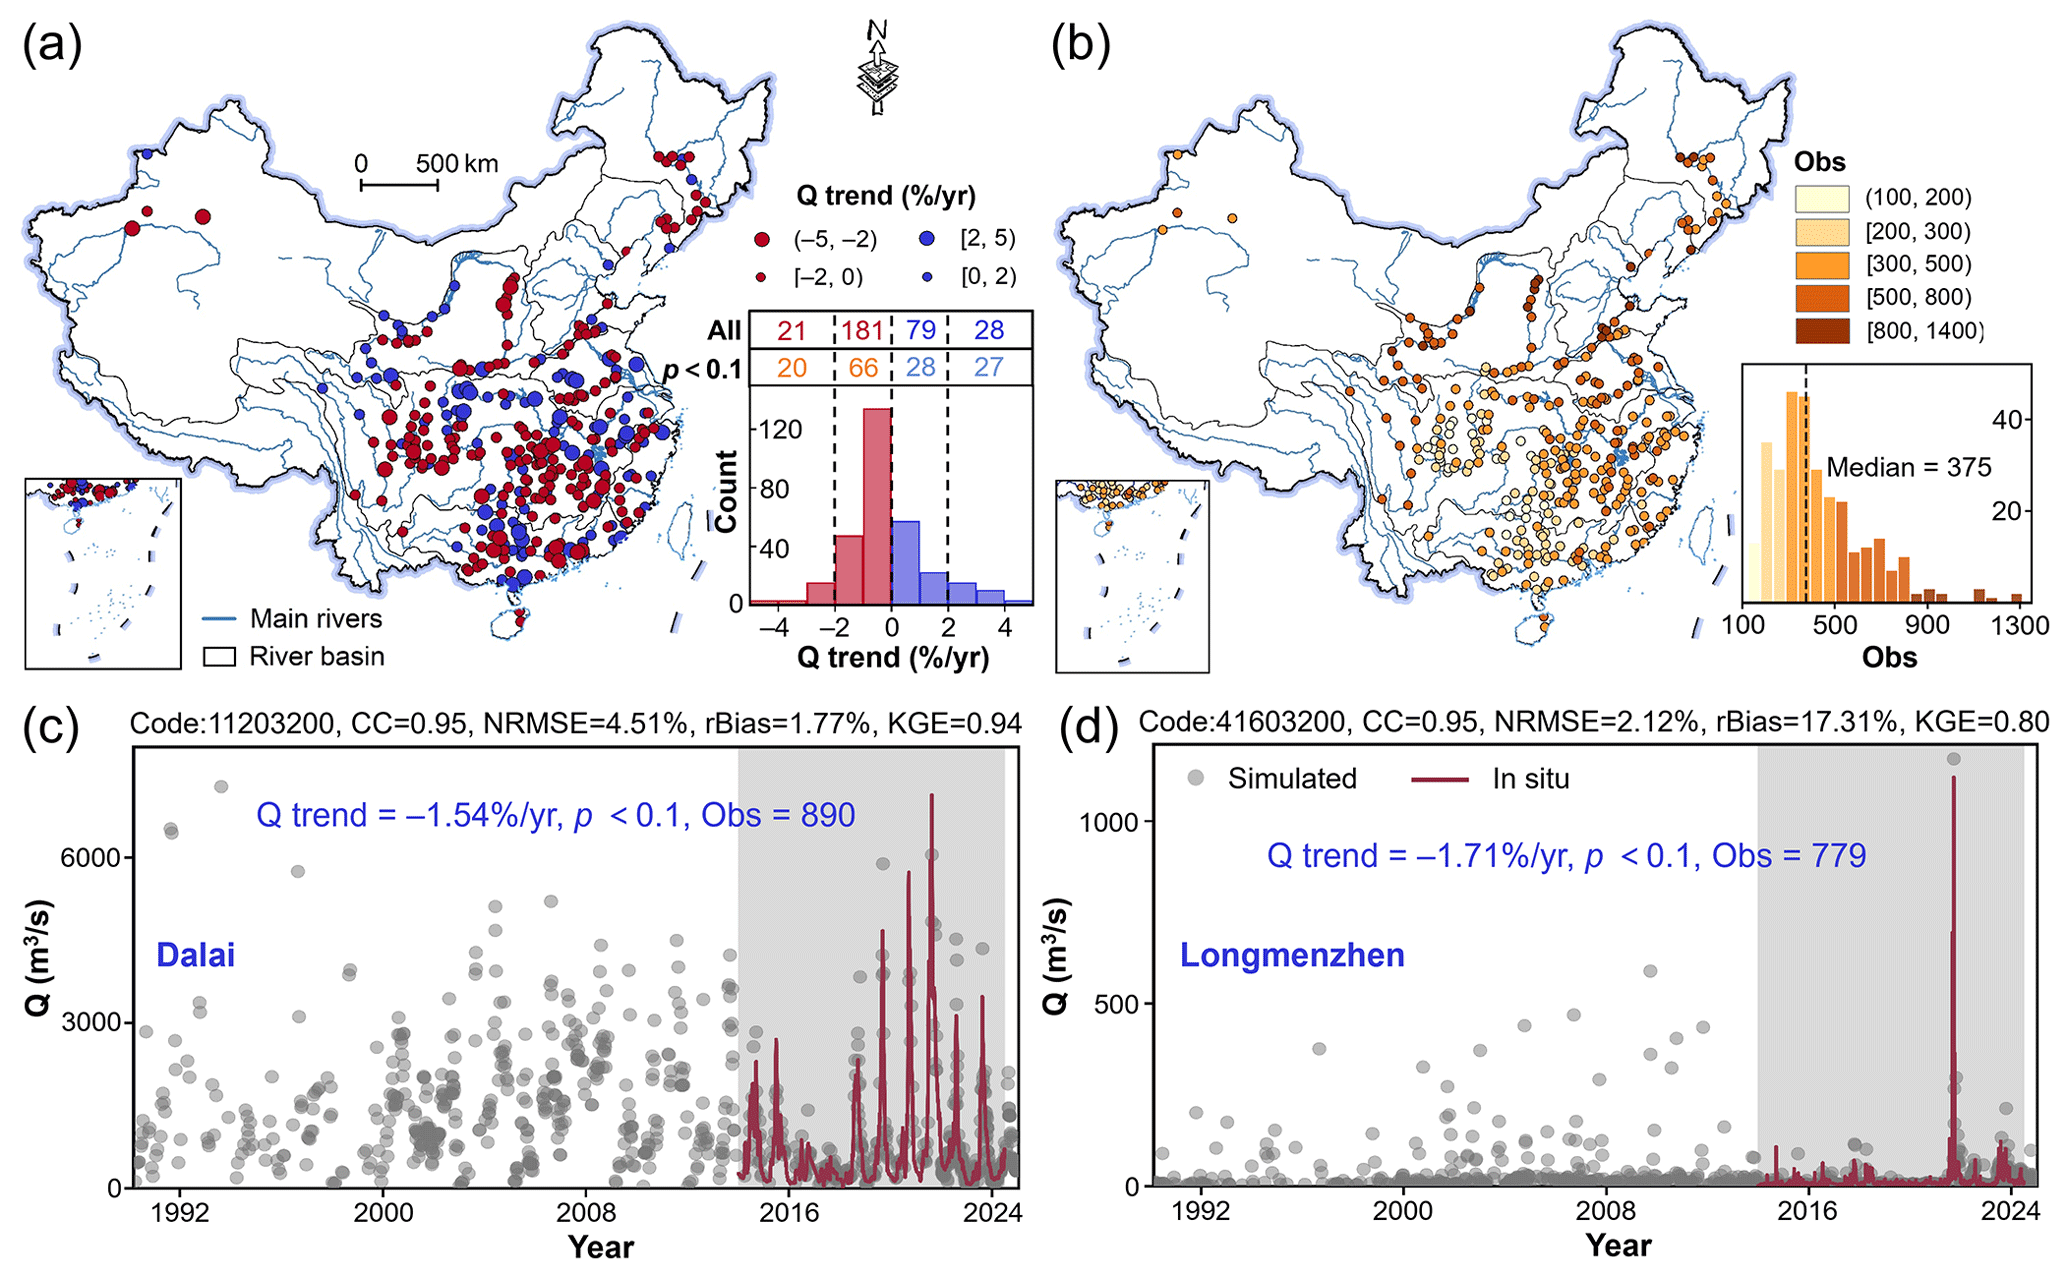
Figure 9Spatial patterns and long-term trends of satellite-extended river discharge across 309 gauges in China (1990–2024). (a) Spatial distribution of relative discharge change rates (Q trend, % yr−1), normalized by multi-year mean discharge, with inset histogram showing the trend distribution and corresponding significance levels (p) across all gauges. (b) Spatial distribution of additional observation (Obs) provided by the satellite-extended discharge records at each gauge. (c–d) Representative time series of reconstructed discharge records at daily temporal resolution for the Dalai and Longmenzhen gauges, respectively, illustrating long-term discharge variability and trends, with the corresponding reconstruction performance metrics indicated.
The results reveal a subtle but widespread decline in river discharge across China, with approximately 65 % (n = 201) of gauges exhibiting negative trends and a median relative change rate of −0.21 % yr−1 (Fig. 9a). Spatially, declining trends are concentrated in northern and central China, particularly within the Haihe, Liaohe, and Yellow River basins, as well as parts of the middle Yangtze River basin. This pattern is consistent with recent assessments, suggesting that discharge reductions in these regions are primarily driven by geomorphological alterations, further intensified by anthropogenic water management activities such as water abstraction, inter-basin diversion, and reservoir regulation (Yang et al., 2022; Wang et al., 2025a). In terms of trend magnitude, most declining gauges (n = 180) exhibit relatively modest decreases of less than 2 % yr−1, whereas 21 gauges show declines exceeding this threshold. Importantly, a persistent decrease greater than 2 % yr−1 corresponds to a cumulative reduction exceeding 40 % over the past three decades, indicating substantial long-term discharge loss at these locations. Statistical significance testing identifies monotonic trends at 141 gauges (46 % of all analyzed gauges, p<0.1), among which 61 % exhibit declining discharge. Within the significantly declining subset, 66 gauges decrease by less than 2 % yr−1, while 20 gauges decline by more than 2 % yr−1. Conversely, 108 gauges exhibit increasing discharge trends, approximately 51 % of which are statistically significant. These increasing trends are primarily concentrated in the northwestern and middle-to-lower Yangtze River basin, the northern Pearl River basin, and the upper Yellow River basin. Overall, the spatial heterogeneity of discharge trends reflects the diverse and complex hydrological responses occurring across China's distinct geographical and hydroclimatic regions.
The temporal sampling characteristics of the satellite-extended discharge dataset were further examined (Fig. 9b). The median number of observations per gauge is 375, corresponding to approximately 11 observations per year, while about 42 % of gauges contain more than 420 observations (≥12 observations per year). Despite this generally dense temporal coverage, observation frequency exhibits substantial spatial heterogeneity across China. Gauges with fewer than 300 observations are predominantly concentrated in the middle Yangtze and Pearl River basins. This reduced sampling density is primarily associated with persistent cloud cover, frequent precipitation, and complex topography, which limit the availability of high-quality optical satellite imagery and consequently reduce the number of usable observations. Nevertheless, even under irregular observational intervals, the reconstructed discharge records preserve key hydrological dynamics. For example, the reconstructed time series at the Dalai (Fig. 9c) and Longmenzhen (Fig. 9d) gauges successfully capture transitions from baseflow to peak-flow conditions while maintaining coherent multidecadal variability and long-term discharge trends. These examples demonstrate that the satellite-based reconstruction framework can resolve both short-term hydrological fluctuations and long-term discharge despite the discontinuous sampling inherent in optical remote sensing observations. Overall, these results indicate that the satellite-extended discharge dataset provides sufficient temporal depth and observational frequency to support robust gauge-scale trend analysis, offering valuable insights into the long-term hydrological evolution of China's major river systems.
4.1 Comparison of reconstructed discharge records with existing datasets
To better contextualize the contribution of the CDR2 dataset, we conducted a comparative assessment against several representative global remotely sensed river discharge products, including RSEG (Elmi et al., 2024), SAEM (Saemian et al., 2025), and the datasets developed by Lin et al. (2023) and Riggs et al. (2023). Although these datasets have substantially expanded the spatial coverage of global river discharge observations, their representation within China remains extremely limited (Fig. 10 and Table 2). Specifically, the number of gauges in China ranges from only one in Riggs et al. (2023) to 62 in SAEM. In all cases, Chinese gauges account for less than 1 % of the total stations included in these global products, reflecting both the scarcity of publicly accessible in situ discharge observations and the challenges of satellite-based discharge retrieval in this region. In contrast, CDR2 expands the number of gauge-constrained discharge records available for China by approximately 5–300 times relative to existing global datasets, providing discharge estimates at daily temporal resolution for 310 gauges distributed across diverse hydroclimatic and geomorphological settings (Fig. 10). The dataset encompasses rivers spanning a wide range of discharge magnitudes and channel sizes, thereby substantially improving the representation of China within global river discharge archives.
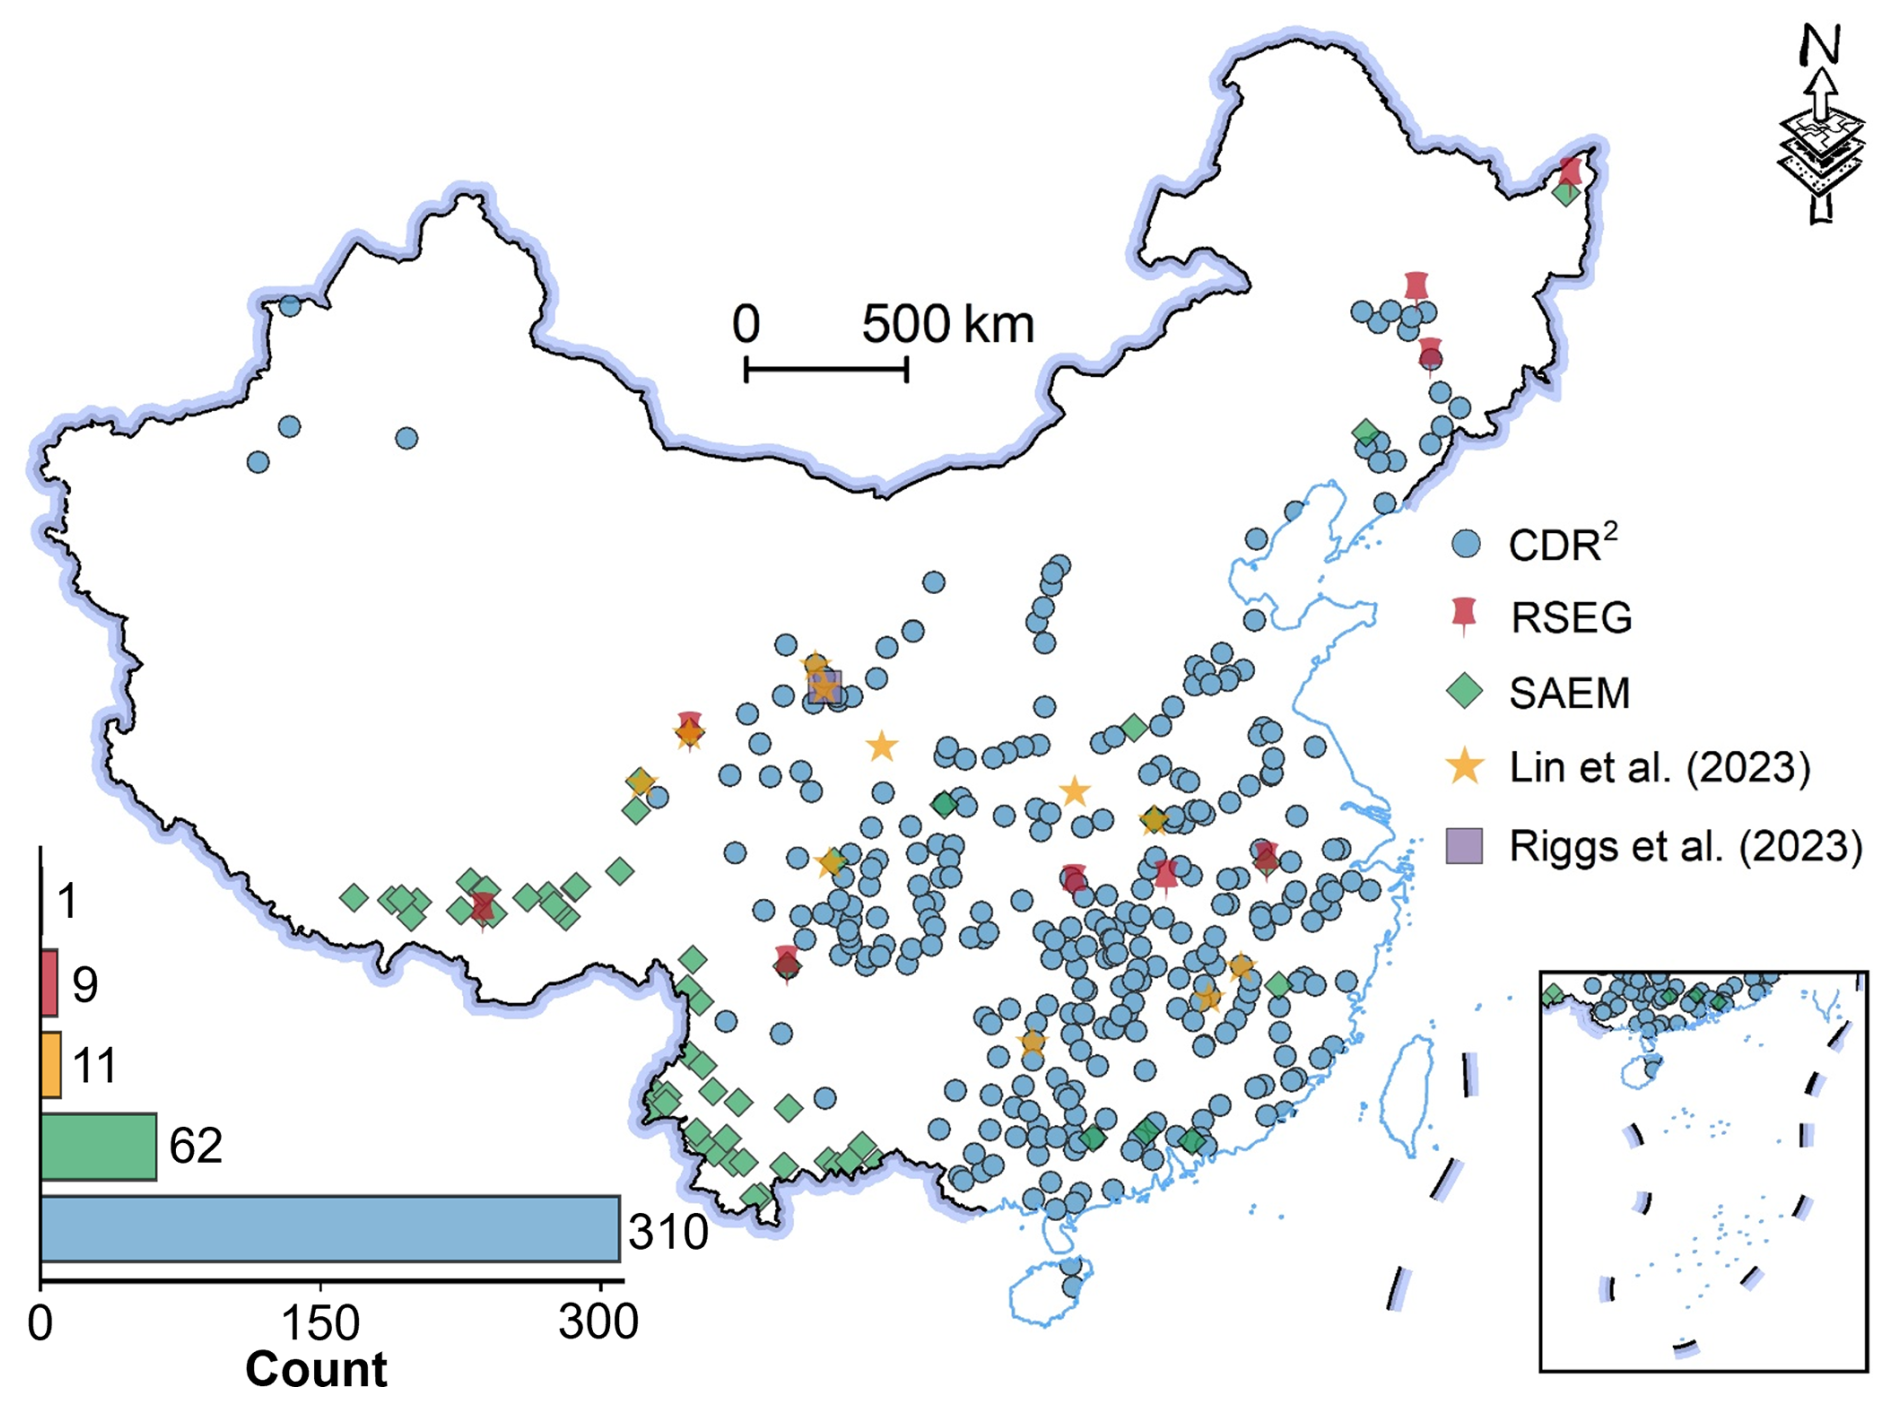
Figure 10Spatial distribution of river discharge gauges included in CDR2, compared with gauges from RSEG (Elmi et al., 2024), SAEM (Saemian et al., 2025), Lin et al. (2023), and Riggs et al. (2023). The inset summarizes the number of gauges contained in each dataset within China.
Table 2Comparison of CDR2 with existing satellite-extended river discharge datasets.
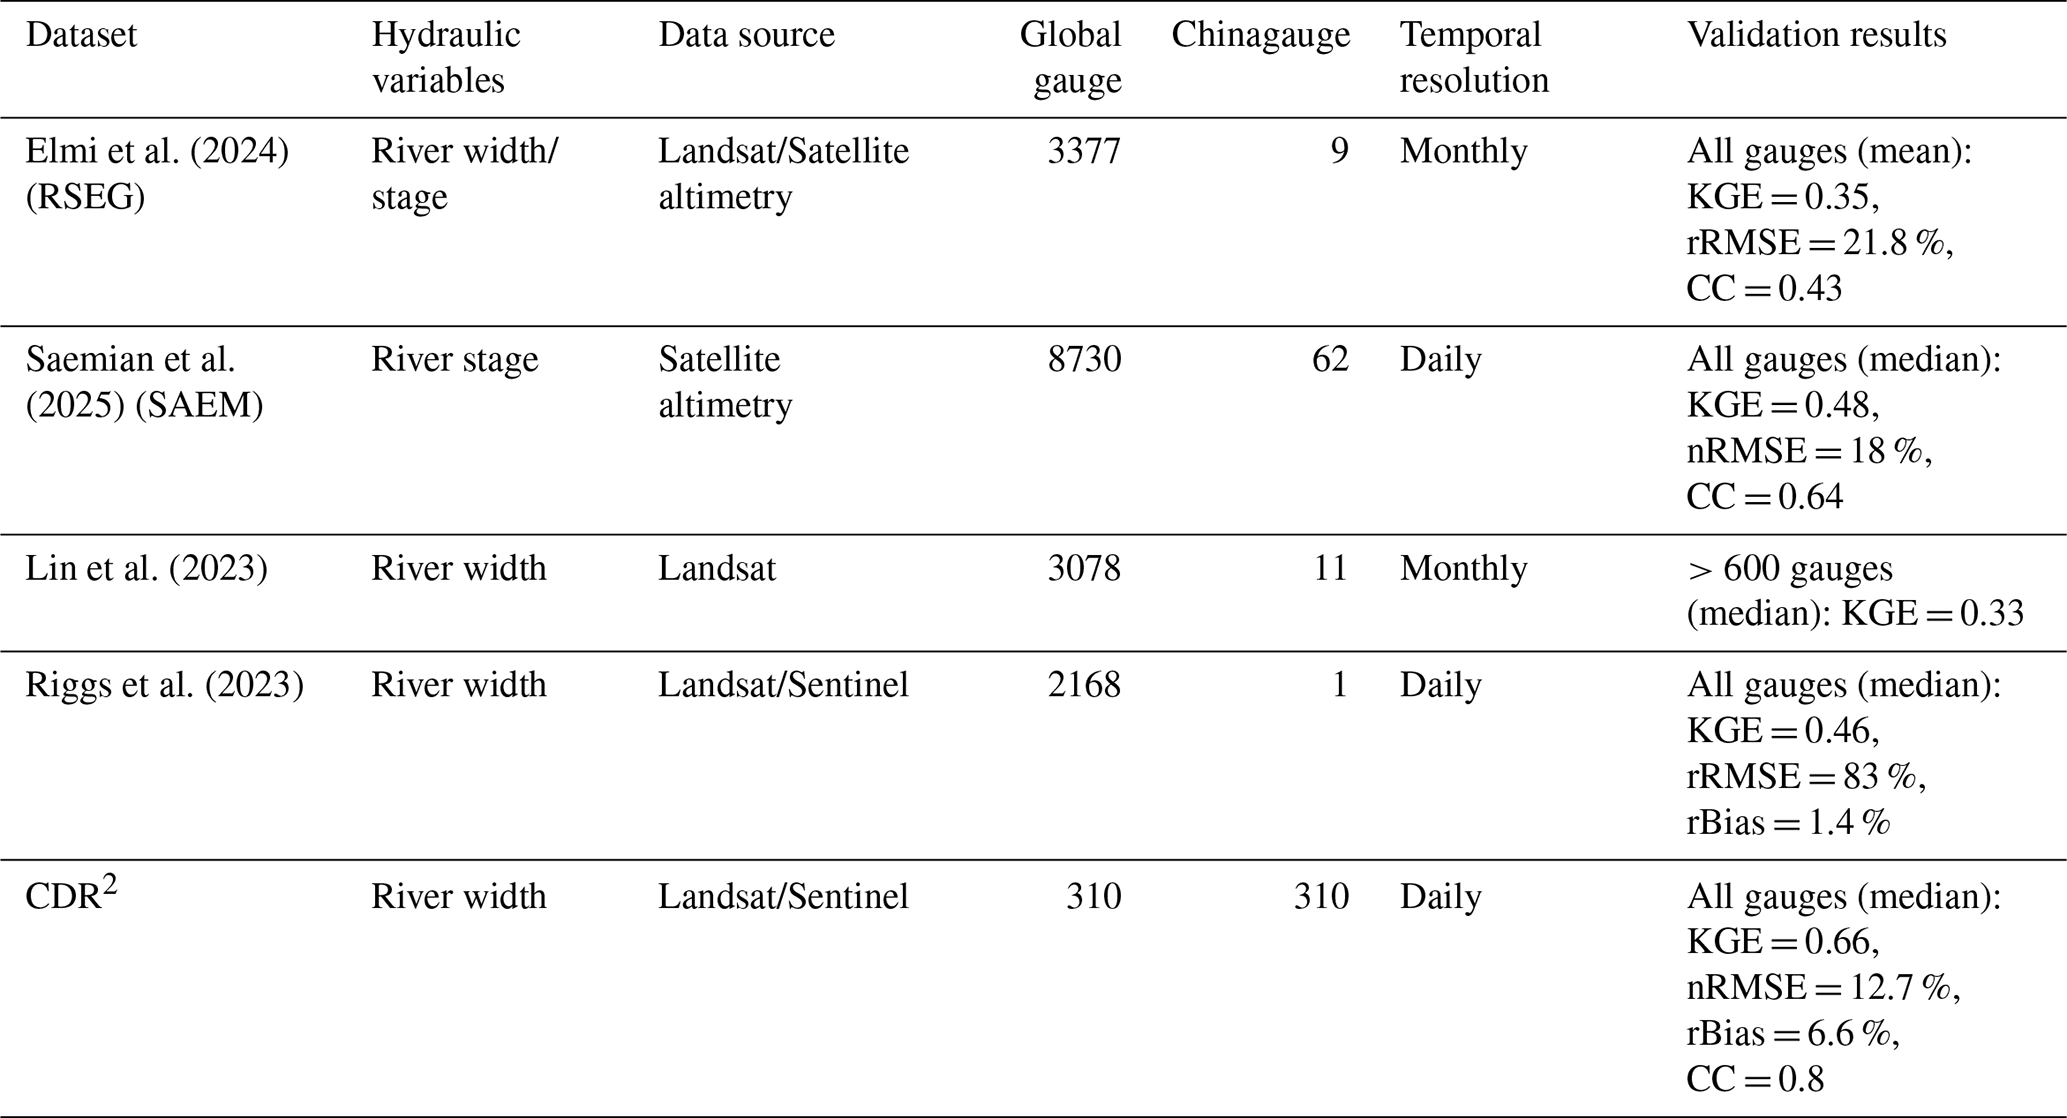
Beyond its improved spatial coverage, CDR2 also demonstrates clear advantages in temporal resolution and predictive performance. While RSEG and Lin et al. (2023) provide monthly discharge estimates, CDR2, SAEM, and Riggs et al. (2023) operate at daily time scales. Notably, CDR2 achieves a median KGE of 0.66, exceeding the reported global median range of 0.33–0.48 among existing products (Table 2), although these comparisons should be interpreted considering differences in gauge selection criteria and river characteristics. Consistent improvements are also evident in other performance metrics, including a lower median NRMSE (12.7 %) and a higher median CC (0.80), indicating enhanced capability in reproducing both the magnitude and temporal variability of observed discharge.
These improvements are partly attributed to the rigorous screening strategy adopted in this study, whereby only gauges exhibiting stable width–discharge relationships and physically consistent hydraulic behavior were retained (Fig. 5). In contrast, global-scale products often face an inherent trade-off between maximizing spatial coverage and maintaining retrieval quality, frequently incorporating gauges with weaker hydraulic relationships or unstable channel responses, thereby introducing greater uncertainty into discharge reconstruction. Moreover, by integrating observations from both Landsat and Sentinel-2 imagery, CDR2 achieves a substantially higher effective sampling frequency than single-sensor approaches. This enhanced temporal sampling improves the detection of short-term discharge fluctuations and mitigates the smoothing effects associated with monthly aggregation, as observed in RSEG and Lin et al. (2023), thereby enabling a more realistic reconstruction of discharge dynamics at daily temporal resolution. Overall, CDR2 provides an expanded and higher-resolution characterization of river discharge across China, a hydrologically critical yet globally underrepresented region. Through its greatly expanded gauge density, discharge records at daily resolution, and enhanced reconstruction performance, CDR2 fills a major geographic gap in existing global river discharge products.
4.2 Sensitivity of reconstruction performance to the width–discharge exponent
To investigate the influence of hydraulic geometry on discharge reconstruction accuracy, we evaluated the sensitivity of reconstruction performance to the width–discharge exponent b (Fig. 11). This exponent characterizes the responsiveness of river width to discharge variability and therefore serves as a key hydraulic link between satellite-observed channel dynamics and river discharge behavior. The analysis reveals statistically significant relationships between b and multiple performance metrics (Fig. 11a–c). Specifically, both NRMSE and rBias exhibit significant negative correlations with b ( and −0.49, respectively; p<0.001), whereas KGE shows a significantly positive correlation (ρ = 0.52, p<0.001). These results indicate that rivers with greater hydraulic sensitivity experience larger width variations under comparable discharge fluctuations, making these changes more readily detectable by satellite observations (Fig. 7) and thereby mitigating the propagation of observational uncertainty into discharge reconstruction.
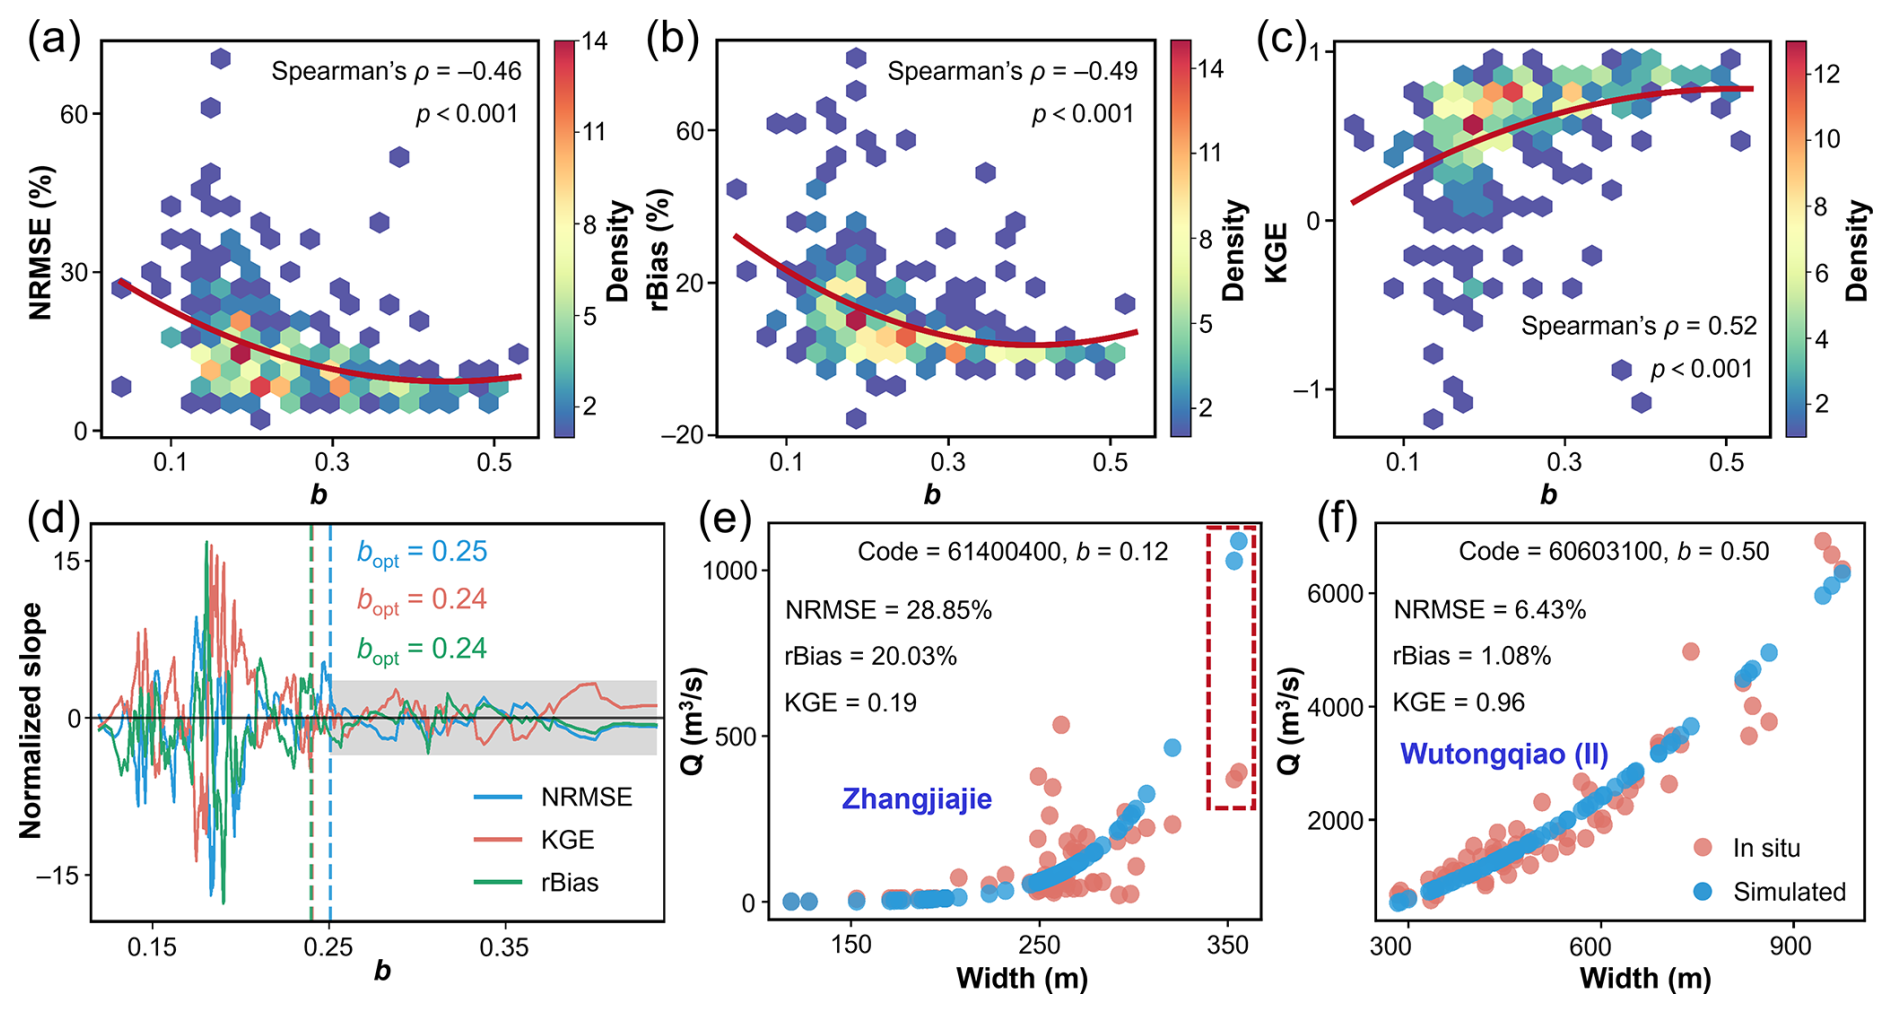
Figure 11Influence of the width–discharge power-law exponent (b) on the performance of satellite-extended discharge reconstruction. (a–c) Relationships between the hydraulic geometry exponent (b) and the performance metrics NRMSE, rBias, and KGE, respectively. Red solid lines indicate fitted relationships, with the corresponding Spearman rank correlation coefficient (ρ) and significance level (p) indicated. (d) Variations in the normalized slope of performance metrics with respect to b, used to identify the optimal threshold (bopt) beyond which reconstruction performance becomes stable and less sensitive to changes in hydraulic responsiveness. (e–f) Comparison between in situ and reconstructed discharge at the Zhangjiajie and Wutongqiao (II) gauges, representing examples of low-b and high-b hydraulic conditions, respectively.
To identify a robust threshold for hydraulic sensitivity, gauges were first sorted according to increasing b values, after which a sliding-window analysis was applied to evaluate local gradients of each performance metric with respect to b. To facilitate comparison across metrics with different numerical ranges, the gradients were normalized to their respective global ranges. The optimal threshold (bopt) is defined as the point at which the absolute normalized gradient consistently declines below 20 % of its global maximum, indicating that performance stabilizes beyond this value. The intersection of these stabilization regions across all metrics yields a global threshold of b = 0.25 (Fig. 11d). Below this threshold, large fluctuations in normalized gradients indicate considerable uncertainty in discharge reconstruction for hydraulically constrained rivers. Once b exceeds 0.25, all gradients converge toward zero, suggesting that width-based discharge estimation becomes substantially more stable and reliable for rivers with stronger hydraulic responsiveness.
The contrasting influence of b on reconstruction performance is clearly illustrated by the Zhangjiajie and Wutongqiao (II) gauges (Fig. 11e, f). At Zhangjiajie, characterized by a low b value, substantial discharge variability corresponds to only marginal changes in river width, often approaching the spatial resolution limit of the satellite sensor (∼30 m). Under such conditions, the inversion from width to discharge becomes mathematically ill-conditioned, whereby small uncertainties in width retrieval propagate into disproportionately large discharge errors, ultimately degrading reconstruction performance (Fig. 11e). In contrast, the Wutongqiao (II) gauge exhibits a high b value, where pronounced width sensitivity to discharge allows satellite observations to effectively resolve discharge variations across the full hydrological spectrum, from low-flow conditions to flood peaks. Together, these findings demonstrate that b provides a physically meaningful and robust criterion for identifying rivers suitable for reliable satellite-based discharge reconstruction, offering important guidance for future large-scale discharge estimation and monitoring efforts.
4.3 Limitations, uncertainties, and future directions
Although the CDR2 dataset substantially expands the availability of gauge-constrained river discharge records for long-term monitoring, the reconstruction framework remains subject to inherent limitations and uncertainties arising from both hydraulic assumptions and the constraints of remote sensing observations. First, a critical source of uncertainty lies in the implicit assumption that the width–discharge relationship remains temporally stationary. Model calibration relies on in situ observations acquired during 2014–2024 and is retrospectively applied to reconstruct discharge over 1990–2024. Extending hydraulic relationships calibrated over a decade of observations to multi-decadal discharge reconstruction is a common simplification adopted in satellite-based discharge retrieval and implicitly assumes temporal invariance of the AHG relationship (Pavelsky, 2014; Paris et al., 2016). To assess the uncertainty associated with temporal extrapolation, we quantified the extrapolation ratio for each gauge, defined as the proportion of remotely sensed river widths during 1990–2024 that fell outside the calibration width range (Fig. 12). Extrapolation ratios were generally low across the 310 reconstructed gauges, with a median of 0.81 % and a mean of 2.62 %. Overall, 86.5 % of gauges exhibited extrapolation rates below 5 % and 55.2 % below 1 %, suggesting that historical discharge reconstruction at most gauges remained within the calibrated hydraulic regime and that uncertainties associated with extrapolating AHG relationships beyond observed river states were limited. Nevertheless, even when reconstructed widths fall within the calibration range, hydraulic geometry may evolve over multi-decadal timescales in response to both anthropogenic and natural disturbances, including dam construction, reservoir regulation, channel engineering, sediment erosion and deposition, and sand mining (Mansanarez et al., 2019; Zhang et al., 2015). Such changes may alter the underlying width–discharge relationship and introduce additional uncertainty into long-term discharge reconstruction. For example, downstream channel incision caused by sediment retention in upstream reservoirs may substantially increase water depth and flow velocity without corresponding changes in channel width.
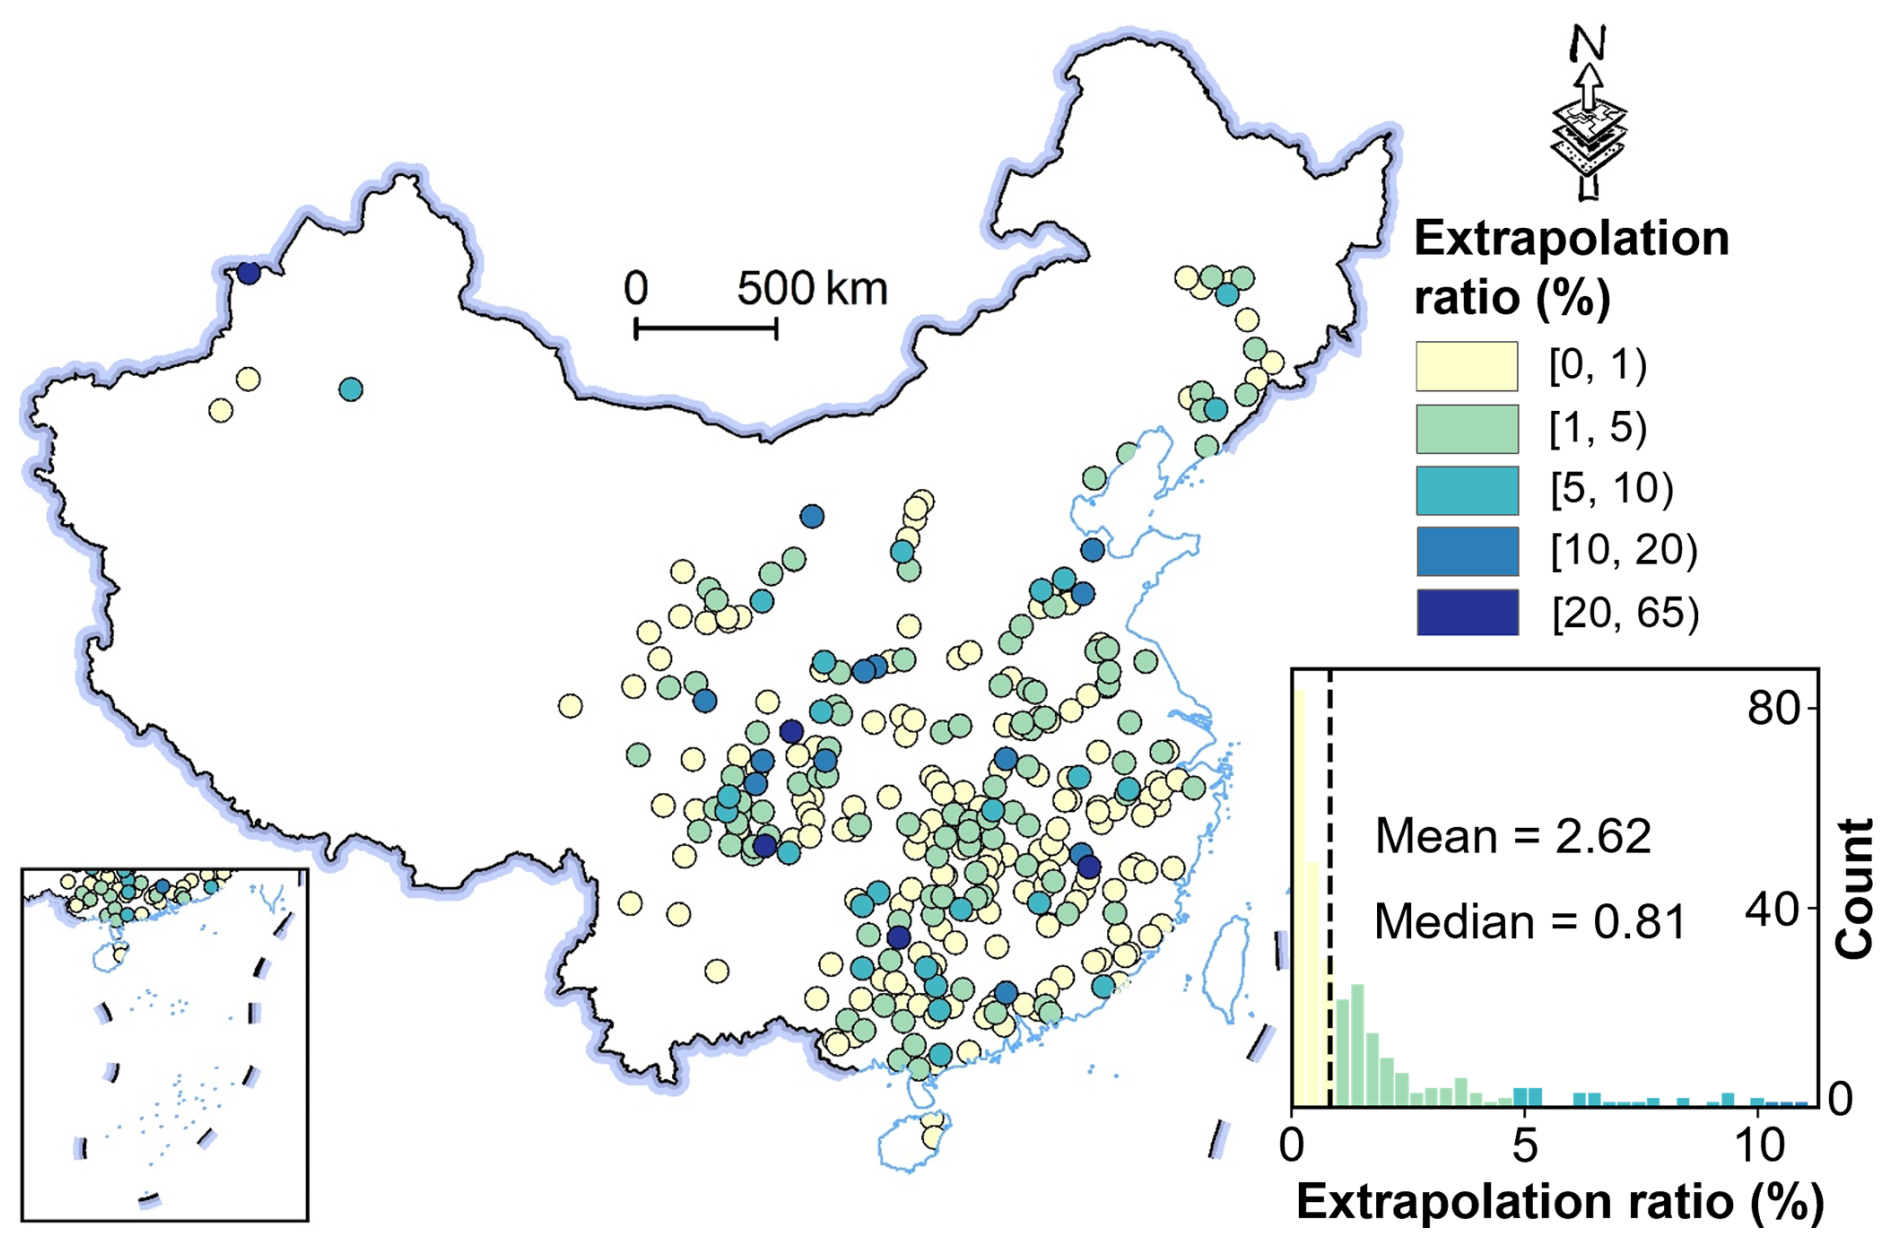
Figure 12Spatial distribution of extrapolation ratios (%) for the 310 gauges included in the CDR2 dataset. The inset shows the frequency distribution of extrapolation ratios across all gauges (mean = 2.62, median = 0.81), truncated at the 95th percentile to improve visualization.
Second, discharge reconstruction relies exclusively on river width as the remotely sensed hydraulic observable. Although river width exhibits strong correlations with discharge across most selected gauges (median ρ = 0.88), river discharge is jointly controlled by channel width, flow velocity, bed slope, and hydraulic roughness (Leopold and Maddock, 1953; Singh et al., 2003). These hydraulic controls are not explicitly represented in the current framework and may become particularly important in rivers where channel width responds weakly to discharge variability. This interpretation is consistent with the sensitivity analysis of the hydraulic geometry exponent b, which demonstrates progressively improved reconstruction performance with increasing hydraulic sensitivity (Fig. 11). Additionally, the inherent limitations of optical remote sensing introduce further uncertainty. The temporal continuity of CDR2 is inevitably affected by cloud cover, atmospheric aerosols, and seasonal snow and ice (Feng et al., 2022; Langhorst et al., 2024), resulting in substantial spatial variability in observation frequency among river basins (Fig. 9b). More importantly, extreme rainfall events are frequently accompanied by persistent cloud cover, causing optical sensors to miss peak-flow conditions and hindering the characterization of rapidly evolving flood hydrographs.
Future improvements should focus on integrating multi-source satellite observations with multi-dimensional hydraulic information. Incorporating channel morphology, sediment dynamics, and anthropogenic regulation into the reconstruction framework would facilitate the identification of temporal variations in width–discharge relationships and improve the robustness of long-term discharge reconstruction. Integrating optical imagery with synthetic aperture radar (SAR) observations would substantially improve temporal sampling under persistent cloud cover while enhancing the monitoring of extreme flood events. Furthermore, combining river width with complementary hydraulic observations, including water surface elevation and slope from emerging satellite missions such as the Surface Water and Ocean Topography (SWOT) mission, through nonlinear multivariate inversion frameworks offers a promising pathway toward more physically constrained and accurate satellite-based river discharge reconstruction.
The China Daily River Discharge Records (CDR2) dataset developed in this study is publicly available on Zenodo at https://doi.org/10.5281/zenodo.22231453 (Wang and Li, 2026). The dataset is distributed in CSV format, with each file named according to its corresponding gauge ID. It contains reconstructed river discharge records with daily temporal resolution for 310 gauges across China from 1990 to 2024, along with the associated width–discharge power-law relationships. In addition, the dataset provides the complete in situ daily river discharge observations for these 310 gauges, which were used to develop and validate the reconstructed discharge records.
The in situ daily river discharge observations were originally obtained from the National Hydrological and Rainfall Information System of the Ministry of Water Resources of China (http://xxfb.mwr.cn/, last access: 3 February 2026), which is accessible only within China. Data from the Global Runoff Data Centre (GRDC) are available at: https://portal.grdc.bafg.de/applications/public.html?publicuser=PublicUser (last access: 8 July 2025). The Chinese Hydrology Project (CHP) dataset was used only for comparison with the in situ observations collected in this study and was not used in the development or validation of the CDR2 dataset. The CHP data are not publicly available and were provided by the original dataset authors (Henck et al., 2010; Schmidt et al., 2011). The Surface Water and Ocean Topography River Database (SWORD, Version v17) is available at: https://doi.org/10.5281/zenodo.14727521 (Altenau et al., 2025). All Landsat-5/7/8 and Sentinel-2 optical remote sensing data were accessed via the Google Earth Engine platform (https://earthengine.google.com/, last access: 1 December 2025). The following publicly available global satellite-based river discharge datasets were used for comparison. Satellite Altimetry-based Extension of global in situ river discharge Measurements (SAEM) is available at: https://doi.org/10.18419/darus-4475 (Saemian et al., 2024). Remote Sensing-based Extension for the GRDC (RSEG) is available at: https://doi.org/10.18419/darus-3558 (Elmi et al., 2023). Datasets developed by Lin et al. (2023) and Riggs et al. (2023) are available at: https://doi.org/10.5281/zenodo.6655532 (Lin et al., 2022) and https://doi.org/10.5281/zenodo.7150168 (Riggs et al., 2022).
This study integrates multi-decadal optical remote sensing observations, a robust at-a-station hydraulic geometry (AHG) width–discharge framework, and in situ daily discharge records from 1196 gauging stations to develop the China Daily River Discharge Records (CDR2), a satellite-extended dataset that provides discharge records at daily temporal resolution for 310 gauges across China over the 1990–2024 period. Validation against in situ observations demonstrates that CDR2 accurately captures both the temporal dynamics and magnitude of river discharge, achieving median values of 0.66 for Kling–Gupta Efficiency (KGE), 0.80 for the Pearson correlation coefficient (CC), 6.56 % for relative bias (rBias), and 12.7 % for normalized root mean square error (NRMSE). Notably, 91 % of gauges exhibit positive KGE values, approximately 73 % achieve CC values greater than 0.7, and 79 % maintain NRMSE below 20 %. Uncertainty analysis further indicates that uncertainties propagated from model parameters remain limited, with a median relative uncertainty of 11.89 % in discharge estimates.
Compared with existing global satellite-based discharge datasets, CDR2 substantially expands the spatial coverage of discharge records at daily temporal resolution across China by more than fivefold while achieving improved reconstruction accuracy. Sensitivity analyses further reveal a strong positive relationship between reconstruction performance and river width variability, indicating that satellite observations more effectively resolve rivers exhibiting greater hydraulic responsiveness to discharge fluctuations. Long-term trend analysis reveals a widespread decline in river discharge across China over the past 35 years, with approximately 65 % of gauges exhibiting decreasing trends. The median relative rate of change is −0.21 % yr−1, corresponding to an estimated cumulative reduction of ∼7 % relative to the long-term mean discharge. These decreases are particularly pronounced in northern and central basins, highlighting increasing spatial disparities in regional hydrological dynamics and underscoring the need for sustained, high-quality discharge monitoring. By substantially expanding gauge-scale discharge observations across China, CDR2 provides a critical empirical foundation for calibrating next-generation satellite missions and advancing large-scale river discharge monitoring in the era of SWOT.
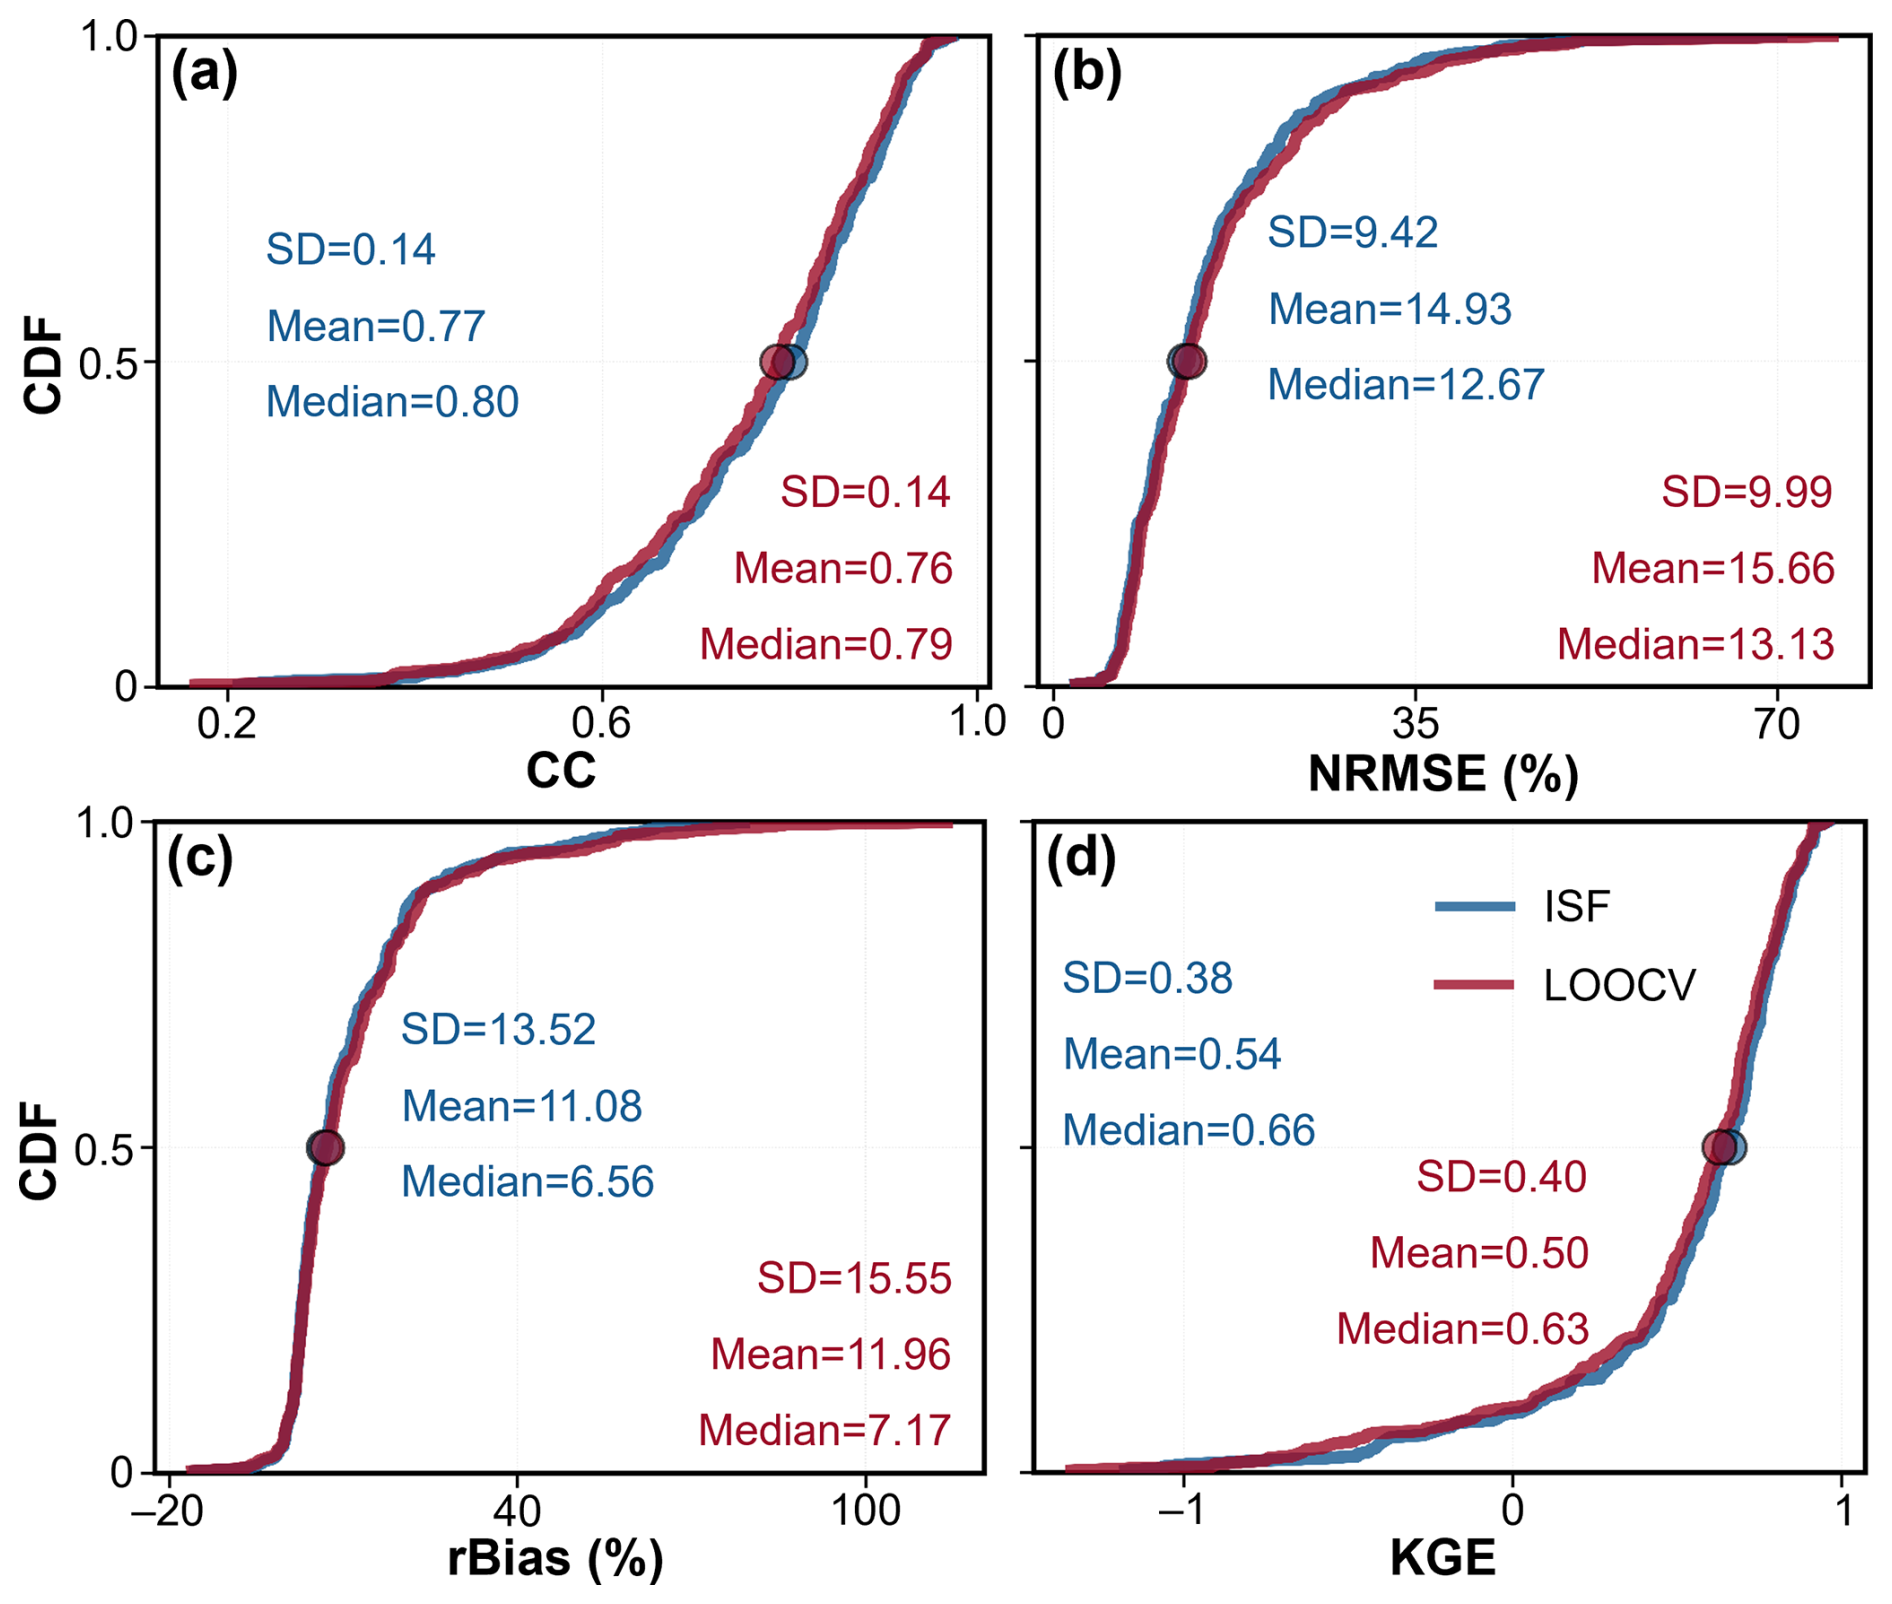
Figure A1Comparison of reconstruction performance for the satellite-extended river discharge dataset across 310 gauges using in-sample fitting (ISF) and leave-one-out cross-validation (LOOCV) based on concurrent river width–discharge observations. (a–d) Cumulative distribution functions (CDFs) of the Pearson correlation coefficient (CC), normalized root mean square error (NRMSE, %), relative bias (rBias, %), and Kling–Gupta efficiency (KGE), respectively. For each metric, the corresponding mean, median, and standard deviation (SD) are annotated for both ISF and LOOCV.
YW performed the investigation, methodology, formal analysis, software, data curation, visualization, and validation, and wrote the original draft. YG curated the data and reviewed and edited the manuscript. YJ performed formal analysis and reviewed and edited the manuscript. XS reviewed and edited the manuscript. YL conceptualized the study, developed the methodology, conducted formal analysis, provided resources, supervised the research, administered the project, acquired funding, and reviewed and edited the manuscript.
The contact author has declared that none of the authors has any competing interests.
Publisher's note: Copernicus Publications remains neutral with regard to jurisdictional claims made in the text, published maps, institutional affiliations, or any other geographical representation in this paper. The authors bear the ultimate responsibility for providing appropriate place names. Views expressed in the text are those of the authors and do not necessarily reflect the views of the publisher.
The authors gratefully acknowledge the data providers whose contributions were essential to this study.
This work was supported by the National Natural Science Foundation of China (grant nos. 42571446 and 42201349), the Chongqing Doctoral Student Research Innovation Project (grant no. CYB240107), and the Chongqing Municipal Science and Technology Bureau (grant nos. CSTB2024YCJH-KYXM0054 and cstc2024ycjh-bgzxm0043).
This paper was edited by Di Tian and reviewed by two anonymous referees.
Allen, G. H. and Pavelsky, T. M.: Global extent of rivers and streams, Science, 361, 585–588, https://doi.org/10.1126/science.aat0636, 2018.
Alsdorf, D. E., Rodríguez, E., and Lettenmaier, D. P.: Measuring surface water from space, Rev. Geophys., 45, RG2002, https://doi.org/10.1029/2006RG000197, 2007.
Altenau, E. H., Pavelsky, T. M., Durand, M. T., Yang, X., Frasson, R. P. M., and Bendezu, L.: The Surface Water and Ocean Topography (SWOT) Mission River Database (SWORD): A global river network for satellite data products, Water Resour. Res., 57, e2021WR030054, https://doi.org/10.1029/2021WR030054, 2021.
Altenau, E. H., Pavelsky, T. M., Durand, M. T., Yang, X., Frasson, R. P. d. M., and Bendezu, L.: SWOT River Database (SWORD) (Version v17), Zenodo [data set], https://doi.org/10.5281/zenodo.14727521, 2025.
Andrews, L. and Grantham, T. E.: Strategic stream gauging network design for sustainable water management, Nat. Sustain., 7, 714–723, https://doi.org/10.1038/s41893-024-01357-z, 2024.
Ashmore, P. and Sauks, E.: Prediction of discharge from water surface width in a braided river with implications for at-a-station hydraulic geometry, Water Resour. Res., 42, W03407, https://doi.org/10.1029/2005WR003993, 2006.
Beven, K.: Towards integrated environmental models of everywhere: uncertainty, data and modelling as a learning process, Hydrol. Earth Syst. Sci., 11, 460–467, https://doi.org/10.5194/hess-11-460-2007, 2007.
Bonnema, M. G., Sikder, S., Hossain, F., Durand, M., Gleason, C. J., and Bjerklie, D. M.: Benchmarking wide swath altimetry-based river discharge estimation algorithms for the Ganges river system, Water Resour. Res., 52, 2439–2461, https://doi.org/10.1002/2015WR017296, 2016.
Che, L., Li, S., and Liu, X.: Improved surface water mapping using satellite remote sensing imagery based on optimization of the Otsu threshold and effective selection of remote-sensing water index, J. Hydrol., 654, 132771, https://doi.org/10.1016/j.jhydrol.2025.132771, 2025.
Chen, Z. and Zhao, S.: Automatic monitoring of surface water dynamics using Sentinel-1 and Sentinel-2 data with Google Earth Engine, Int. J. Appl. Earth Obs., 113, 103010, https://doi.org/10.1016/j.jag.2022.103010, 2022.
Collins, E. L., David, C. H., Riggs, R., Allen, G. H., Pavelsky, T. M., Lin, P., Pan, M., Yamazaki, D., Meentemeyer, R. K., and Sanchez, G. M.: Global patterns in river water storage dependent on residence time, Nat. Geosci., 17, 433–439, https://doi.org/10.1038/s41561-024-01421-5, 2024.
Do, H. X., Gudmundsson, L., Leonard, M., and Westra, S.: The Global Streamflow Indices and Metadata Archive (GSIM) – Part 1: The production of a daily streamflow archive and metadata, Earth Syst. Sci. Data, 10, 765–785, https://doi.org/10.5194/essd-10-765-2018, 2018.
Durand, M., Gleason, C. J., Garambois, P. A., Bjerklie, D., Smith, L. C., Roux, H., Rodriguez, E., Bates, P. D., Pavelsky, T. M., Monnier, J., Chen, X., Di Baldassarre, G., Fiset, J.-M., Flipo, N., Frasson, R. P. d. M., Fulton, J., Goutal, N., Hossain, F., Humphries, E., Minear, J. T., Mukolwe, M. M., Neal, J. C., Ricci, S., Sanders, B. F., Schumann, G., Schubert, J. E., and Vilmin, L.: An intercomparison of remote sensing river discharge estimation algorithms from measurements of river height, width, and slope, Water Resour. Res., 52, 4527–4549, https://doi.org/10.1002/2015WR018434, 2016.
Durand, M., Gleason, C. J., Pavelsky, T. M., Frasson, R. P. M., Turmon, M., David, C. H., Altenau, E. H., Tebaldi, N., Larnier, K., Monnier, J., Malaterre, P. O., Oubanas, H., Allen, G. H., Astifan, B., Brinkerhoff, C., Bates, P. D., Bjerklie, D., Coss, S., Dudley, R., Fenoglio, L., Garambois, P.-A., Getirana, A., Lin, P., Margulis, S. A., Matte, P., Minear, J. T., Muhebwa, A., Pan, M., Peters, D., Riggs, R., Sikder, M. S., Simmons, T., Stuurman, C., Taneja, J., Tarpanelli, A., Schulze, K., Tourian, M. J., and Wang, J.: A framework for estimating global river discharge from the Surface Water and Ocean Topography satellite mission, Water Resour. Res., 59, e2021WR031614, https://doi.org/10.1029/2021WR031614, 2023.
Eggleston, J., Mason, C., Bjerklie, D., Durand, M., Dudley, R., and Harlan, M.: Siting considerations for satellite observation of river discharge, Water Resour. Res., 60, e2023WR034583, https://doi.org/10.1029/2023WR034583, 2024.
Elmi, O., Tourian, M. J., Saemian, P., and Sneeuw, N.: Remote Sensing-Based Extension of GRDC River Discharge Time Series, V4, DaRUS [data set], https://doi.org/10.18419/DARUS-3558, 2023.
Elmi, O., Tourian, M. J., Saemian, P., and Sneeuw, N.: Remote sensing-based extension of GRDC Discharge time series – a monthly product with uncertainty estimates, Sci. Data, 11, 240, https://doi.org/10.1038/s41597-024-03078-6, 2024.
Famiglietti, J. S., Cazenave, A., Eicker, A., Reager, J. T., Rodell, M., and Velicogna, I.: Satellites provide the big picture, Science, 349, 684–685, https://doi.org/10.1126/science.aac9238, 2015.
Färber, C., Plessow, H., Mischel, S. A., Kratzert, F., Addor, N., Shalev, G., and Looser, U.: GRDC-Caravan: extending Caravan with data from the Global Runoff Data Centre, Earth Syst. Sci. Data, 17, 4613–4625, https://doi.org/10.5194/essd-17-4613-2025, 2025.
Fekete, B. M., Robarts, R. D., Kumagai, M., Nachtnebel, H.-P., Odada, E., and Zhulidov, A. V.: Time for in situ renaissance, Science, 349, 685–686, https://doi.org/10.1126/science.aac7358, 2015.
Feng, D., Gleason, C. J., Yang, X., and Pavelsky, T. M.: Comparing discharge estimates made via the BAM algorithm in high-order Arctic rivers derived solely from optical CubeSat, Landsat, and Sentinel-2 data, Water Resour. Res., 55, 7753–7771, https://doi.org/10.1029/2019WR025599, 2019.
Feng, D., Gleason, C. J., Yang, X., Allen, G. H., and Pavelsky, T. M.: How have global river widths changed over time?, Water Resour. Res., 58, e2021WR031712, https://doi.org/10.1029/2021WR031712, 2022.
Ghiggi, G., Humphrey, V., Seneviratne, S. I., and Gudmundsson, L.: GRUN: an observation-based global gridded runoff dataset from 1902 to 2014, Earth Syst. Sci. Data, 11, 1655–1674, https://doi.org/10.5194/essd-11-1655-2019, 2019.
Gleason, C. J. and Smith, L. C.: Toward global mapping of river discharge using satellite images and at-many-stations hydraulic geometry, P. Natl. Acad. Sci. USA, 111, 4788–4791, https://doi.org/10.1073/pnas.1317606111, 2014.
Gleason, C. J. and Wang, J.: Theoretical basis for at-many-stations hydraulic geometry, Geophys. Res. Lett., 42, 7107–7114, https://doi.org/10.1002/2015GL064935, 2015.
Hannah, D. M., Demuth, S., van Lanen, H. A. J., Looser, U., Prudhomme, C., Rees, G., Stahl, K., and Tallaksen, L. M.: Large-scale river flow archives: Importance, current status and future needs, Hydrol. Process., 25, 1191–1200, https://doi.org/10.1002/hyp.7794, 2011.
Hao, Z., Xiang, N., Cai, X., Zhong, M., Jin, J., Du, Y., and Ling, F.: Remote sensing of river discharge from medium-resolution satellite imagery based on deep learning, Water Resour. Res., 60, e2023WR036880, https://doi.org/10.1029/2023WR036880, 2024.
Henck, A. C., Montgomery, D. R., Huntington, K. W., and Liang, C.: Monsoon control of effective discharge, Yunnan and Tibet, Geology, 38, 975–978, https://doi.org/10.1130/G31444.1, 2010.
Hesterberg, T.: Bootstrap, WIREs Comput. Stat., 3, 497–526, https://doi.org/10.1002/wics.182, 2011.
Hou, J., van Dijk, A. I. J. M., and Beck, H. E.: Global satellite-based river gauging and the influence of river morphology on its application, Remote Sens. Environ., 239, 111629, https://doi.org/10.1016/j.rse.2019.111629, 2020.
Kim, Y. H., Im, J., Ha, H. K., Choi, J.-K., and Ha, S.: Machine learning approaches to coastal water quality monitoring using GOCI satellite data, GIScience Remote Sens., 51, 158–174, https://doi.org/10.1080/15481603.2014.900983, 2014.
Knoben, W. J. M., Freer, J. E., and Woods, R. A.: Technical note: Inherent benchmark or not? Comparing Nash–Sutcliffe and Kling–Gupta efficiency scores, Hydrol. Earth Syst. Sci., 23, 4323–4331, https://doi.org/10.5194/hess-23-4323-2019, 2019.
Krabbenhoft, C. A., Allen, G. H., Lin, P., Godsey, S. E., Allen, D. C., Burrows, R. M., DelVecchia, A. G., Fritz, K. M., Shanafield, M., Burgin, A. J., Zimmer, M. A., Datry, T., Dodds, W. K., Jones, C. N., Mims, M. C., Franklin, C., Hammond, J. C., Zipper, S., Ward, A. S., Costigan, K. H., Beck, H. E., and Olden, J. D.: Assessing placement bias of the global river gauge network, Nat. Sustain., 5, 586–592, https://doi.org/10.1038/s41893-022-00873-0, 2022.
Langhorst, T., Andreadis, K. M., and Allen, G. H.: Global cloud biases in optical satellite remote sensing of rivers, Geophys. Res. Lett., 51, e2024GL110085, https://doi.org/10.1029/2024GL110085, 2024.
Leopold, L. B. and Maddock, T.: The hydraulic geometry of stream channels and some physiographic implications, U.S. Government Printing Office, Washington, DC, https://pubs.usgs.gov/pp/0252/report.pdf (last access: 12 March 2026), 1953.
Lettenmaier, D. P., Alsdorf, D., Dozier, J., Huffman, G. J., Pan, M., and Wood, E. F.: Inroads of remote sensing into hydrologic science during the WRR era, Water Resour. Res., 51, 7309–7342, https://doi.org/10.1002/2015WR017616, 2015.
Lin, P., Pan, M., Beck, H. E., Yang, Y., Yamazaki, D., Frasson, R., David, C. H., Durand, M., Pavelsky, T. M., Allen, G. H., Gleason, C. J., and Wood, E. F.: Global reconstruction of naturalized river flows at 2.94 Million reaches, Water Resour. Res., 55, 6499–6516, https://doi.org/10.1029/2019WR025287, 2019.
Lin, P., Feng, D., Gleason, C. J., Pan, M., Brinkerhoff, C. B., Yang, X., Beck, H. E., and Frasson, R. P. d. M.: Remote sensing of river discharge (RSQ) estimates derived from multi-temporal Landsat width observations and BAM/geoBAM discharge inversion algorithms (Version v1), Zenodo [data set], https://doi.org/10.5281/zenodo.6655532, 2022.
Lin, P., Feng, D., Gleason, C. J., Pan, M., Brinkerhoff, C. B., Yang, X., Beck, H. E., and Frasson, R. P. d. M.: Inversion of river discharge from remotely sensed river widths: A critical assessment at three-thousand global river gauges, Remote Sens. Environ., 287, 113489, https://doi.org/10.1016/j.rse.2023.113489, 2023.
Mann, H. B.: Nonparametric tests against trend, Econometrica, 13, 245–259, https://doi.org/10.2307/1907187, 1945.
Mansanarez, V., Renard, B., Le Coz, J., Lang, M., and Darienzo, M.: Shift happens! Adjusting stage-discharge rating curves to morphological changes at known times, Water Resour. Res., 55, 2876–2899, https://doi.org/10.1029/2018WR023389, 2019.
McFeeters, S. K.: The use of the Normalized Difference Water Index (NDWI) in the delineation of open water features, Int. J. Remote Sens., 17, 1425–1432, https://doi.org/10.1080/01431169608948714, 1996.
Oh, J. and Bartos, M.: Scalable, adaptive and risk-informed design of hydrological sensor networks, Nat. Water, 3, 1144–1154, https://doi.org/10.1038/s44221-025-00496-7, 2025.
Oki, T. and Kanae, S.: Global hydrological cycles and world water resources, Science, 313, 1068–1072, https://doi.org/10.1126/science.1128845, 2006.
Otsu, N.: A threshold selection method from gray-level histograms, IEEE T. Syst. Man Cyb., 9, 62–66, https://doi.org/10.1109/TSMC.1979.4310076, 1979.
Palmer, M. and Ruhi, A.: Measuring Earth's rivers, Science, 361, 546–547, https://doi.org/10.1126/science.aau3842, 2018.
Paris, A., Dias de Paiva, R., Santos da Silva, J., Medeiros Moreira, D., Calmant, S., Garambois, P.-A., Collischonn, W., Bonnet, M.-P., and Seyler, F.: Stage-discharge rating curves based on satellite altimetry and modeled discharge in the Amazon basin, Water Resour. Res., 52, 3787–3814, https://doi.org/10.1002/2014WR016618, 2016.
Park, C. C.: World-wide variations in hydraulic geometry exponents of stream channels: An analysis and some observations, J. Hydrol., 33, 133–146, https://doi.org/10.1016/0022-1694(77)90103-2, 1977.
Patidar, G., Indu, J., and Karmakar, S.: Performance assessment of Surface Water and Ocean Topography (SWOT) mission for WSE measurement across India, Geophys. Res. Lett., 52, e2025GL115804, https://doi.org/10.1029/2025GL115804, 2025.
Pavelsky, T. M.: Using width-based rating curves from spatially discontinuous satellite imagery to monitor river discharge, Hydrol. Process., 28, 3035–3040, https://doi.org/10.1002/hyp.10157, 2014.
Pavelsky, T. M. and Smith, L. C.: RivWidth: A software tool for the calculation of river widths from remotely sensed imagery, IEEE Geosci. Remote S., 5, 70–73, https://doi.org/10.1109/LGRS.2007.908305, 2008.
Resplandy, L., Keeling, R. F., Rödenbeck, C., Stephens, B. B., Khatiwala, S., Rodgers, K. B., Long, M. C., Bopp, L., and Tans, P. P.: Revision of global carbon fluxes based on a reassessment of oceanic and riverine carbon transport, Nat. Geosci., 11, 504–509, https://doi.org/10.1038/s41561-018-0151-3, 2018.
Riggs, R. M., Allen, G. H., Wang, J., Pavelsky, T. M., Gleason, C. J., David, C. H., and Durand, M.: Extending Global River Gauge Records Using Satellite Observations, Zenodo [data set], https://doi.org/10.5281/zenodo.7150168, 2022.
Riggs, R. M., Allen, G. H., Wang, J., Pavelsky, T. M., Gleason, C. J., David, C. H., and Durand, M.: Extending global river gauge records using satellite observations, Environ. Res. Lett., 18, 064027, https://doi.org/10.1088/1748-9326/acd407, 2023.
Rodrigues, D. B. B., Gupta, H. V., Mendiondo, E. M., and Oliveira, P. T. S.: Assessing uncertainties in surface water security: An empirical multimodel approach, Water Resour. Res., 51, 9013–9028, https://doi.org/10.1002/2014WR016691, 2015.
Roy, D. P., Wulder, M. A., Loveland, T. R., Woodcock, C. E., Allen, R. G., Anderson, M. C., Helder, D., Irons, J. R., Johnson, D. M., Kennedy, R., Scambos, T. A., Schaaf, C. B., Schott, J. R., Sheng, Y., Vermote, E. F., Belward, A. S., Bindschadler, R., Cohen, W. B., Gao, F., Hipple, J. D., Hostert, P., Huntington, J., Justice, C. O., Kilic, A., Kovalskyy, V., Lee, Z. P., Lymburner, L., Masek, J. G., McCorkel, J., Shuai, Y., Trezza, R., Vogelmann, J., Wynne, R. H., and Zhu, Z.: Landsat-8: Science and product vision for terrestrial global change research, Remote Sens. Environ., 145, 154–172, https://doi.org/10.1016/j.rse.2014.02.001, 2014.
Ruhi, A., Messager, M. L., and Olden, J. D.: Tracking the pulse of the Earth's fresh waters, Nat. Sustain., 1, 198–203, https://doi.org/10.1038/s41893-018-0047-7, 2018.
Saemian, P., Elmi, O., Stroud, M., Riggs, R., Kitambo, B. M., Papa, F., Allen, G. H., and Tourian, M. J.: Satellite Altimetry-based Extension of global-scale in situ river discharge Measurements (SAEM), V2, DaRUS [data set], https://doi.org/10.18419/DARUS-4475, 2024.
Saemian, P., Elmi, O., Stroud, M., Riggs, R., Kitambo, B. M., Papa, F., Allen, G. H., and Tourian, M. J.: Satellite Altimetry-based Extension of global-scale in situ river discharge Measurements (SAEM), Earth Syst. Sci. Data, 17, 2063–2085, https://doi.org/10.5194/essd-17-2063-2025, 2025.
Scherer, D., Schwatke, C., Dettmering, D., and Seitz, F.: Monitoring river discharge from space: An optimization approach with uncertainty quantification for small ungauged rivers, Remote Sens. Environ., 315, 114434, https://doi.org/10.1016/j.rse.2024.114434, 2024.
Schmidt, A. H., Montgomery, D. R., Huntington, K. W., and Liang, C.: The question of communist land degradation: New evidence from local erosion and basin-wide sediment yield in Southwest China and Southeast Tibet, Ann. Assoc. Am. Geogr., 101, 477–496, https://doi.org/10.1080/00045608.2011.560059, 2011.
Sen, P. K.: Estimates of the regression coefficient based on Kendall's tau, J. Am. Stat. Assoc., 63, 1379–1389, https://doi.org/10.1080/01621459.1968.10480934, 1968.
Sichangi, A. W., Wang, L., Yang, K., Chen, D., Wang, Z., Li, X., Zhou, J., Liu, W., and Kuria, D.: Estimating continental river basin discharges using multiple remote sensing data sets, Remote Sens. Environ., 179, 36–53, https://doi.org/10.1016/j.rse.2016.03.019, 2016.
Singh, V. P., Yang, C. T., and Deng, Z. Q.: Downstream hydraulic geometry relations: 1. Theoretical development, Water Resour. Res., 39, 1337, https://doi.org/10.1029/2003WR002484, 2003.
Smith, L. C.: Satellite remote sensing of river inundation area, stage, and discharge: A review, Hydrol. Process., 11, 1427–1439, https://doi.org/10.1002/(SICI)1099-1085(199708)11:10<1427::AID-HYP473>3.0.CO;2-S, 1997.
Sun, M., Tangdamrongsub, N., Sun, Y., Dong, J., Sutanudjaja, E., and Smilovic, M.: Assessing and optimizing high-resolution global river streamflow estimates with triple collocation analysis, J. Hydrol., 646, 135122, https://doi.org/10.1016/j.jhydrol.2026.135122, 2026.
Syvitski, J. P. M., Vörösmarty, C. J., Kettner, A. J., and Green, P.: Impact of humans on the flux of terrestrial sediment to the global coastal ocean, Science, 308, 376–380, https://doi.org/10.1126/science.1109454, 2005.
Tang, G., Clark, M. P., Knoben, W. J. M., Liu, H., Gharari, S., Arnal, L., Beck, H. E., Wood, A. W., Newman, A. J., and Papalexiou, S. M.: The impact of meteorological forcing uncertainty on hydrological modeling: A global analysis of cryosphere basins, Water Resour. Res., 59, e2022WR033767, https://doi.org/10.1029/2022WR033767, 2023.
Tourian, M. J., Elmi, O., Shafaghi, Y., Behnia, S., Saemian, P., Schlesinger, R., and Sneeuw, N.: HydroSat: geometric quantities of the global water cycle from geodetic satellites, Earth Syst. Sci. Data, 14, 2463–2486, https://doi.org/10.5194/essd-14-2463-2022, 2022.
Vogelmann, J. E., Helder, D., Morfitt, R., Choate, M. J., Merchant, J. W., and Bulley, H.: Effects of Landsat 5 Thematic Mapper and Landsat 7 Enhanced Thematic Mapper Plus radiometric and geometric calibrations and corrections on landscape characterization, Remote Sens. Environ., 78, 55–70, https://doi.org/10.1016/S0034-4257(01)00249-8, 2001.
Wang, B. and Smith, L. C.: Remote sensing of discharge ratios at river channel bifurcations, Geophys. Res. Lett., 52, e2024GL114045, https://doi.org/10.1029/2024GL114045, 2025.
Wang, K., Liu, X., Cui, P., Zhang, Y., Xie, J., Liu, C., and Gosling, S. N.: China's nationwide streamflow decline driven by landscape changes and human interventions, Sci. Adv., 11, eadu8032, https://doi.org/10.1126/sciadv.adu8032, 2025a.
Wang, L., Li, X., Lutz, A., Nepal, S., Chen, D., Yao, T., Su, F., Cuo, L., Yao, Z., Zhang, Y., Hu, Z., Huang, J., Hou, M., Liu, R., Long, J., Chai, C., Liu, Z., Bashir, A., Khanal, S., Sun, H., Nie, Y., Zhang, Y., and Wang, T.: Acceleration of diverging runoff trends on the Third Pole, Commun. Earth Environ., 6, 907, https://doi.org/10.1038/s43247-025-02854-5, 2025b.
Wang, Y. and Li, Y.: China Daily River Discharge Records (CDR2) dataset, Zenodo [data set], https://doi.org/10.5281/zenodo.22231453, 2026.
Wulder, M. A., White, J. C., Loveland, T. R., Woodcock, C. E., Belward, A. S., Cohen, W. B., Fosnight, E. A., Shaw, J., Masek, J. G., and Roy, D. P.: The global Landsat archive: Status, consolidation, and direction, Remote Sens. Environ., 185, 271–283, https://doi.org/10.1016/j.rse.2015.11.032, 2016.
Xu, H.: Modification of normalised difference water index (NDWI) to enhance open water features in remotely sensed imagery, Int. J. Remote Sens., 27, 3025–3033, https://doi.org/10.1080/01431160600589179, 2006.
Yang, L., Zhao, G., Tian, P., Mu, X., Tian, X., Feng, J., and Bai, Y.: Runoff changes in the major river basins of China and their responses to potential driving forces, J. Hydrol., 607, 127536, https://doi.org/10.1016/j.jhydrol.2022.127536, 2022.
Yang, X., Pavelsky, T. M., Allen, G. H., and Donchyts, G.: RivWidthCloud: An automated Google Earth Engine algorithm for river width extraction from remotely sensed imagery, IEEE Geosci. Remote S., 17, 217–221, https://doi.org/10.1109/LGRS.2019.2920225, 2019.
Yao, T., Bolch, T., Chen, D., Gao, J., Immerzeel, W., Piao, S., Su, F., Thompson, L., Wada, Y., Wang, L., Wang, T., Wu, G., Xu, B., Yang, W., Zhang, G., and Zhao, P.: The imbalance of the Asian water tower, Nat. Rev. Earth Environ., 3, 618–632, https://doi.org/10.1038/s43017-022-00299-4, 2022.
Yuan, Z., Lin, P., Guo, X., Zhang, K., and Beck, H. E.: Revisiting at-a-station hydraulic geometry using discharge observations and satellite-derived river widths, J. Remote Sens., 4, 0271, https://doi.org/10.34133/remotesensing.0271, 2024.
Zhang, W., Wang, W.-G., Zheng, J.-H., Wang, H.-G., Wang, G., and Zhang, J.-S.: Reconstruction of stage–discharge relationships and analysis of hydraulic geometry variations: The case study of the Pearl River Delta, China, Global Planet. Change, 125, 60–70, https://doi.org/10.1016/j.gloplacha.2014.12.004, 2015.
Zheng, H., Yang, Z.-L., Lin, P., Wei, J., Wu, W.-Y., Li, L., Zhao, L., and Wang, S.: On the sensitivity of the precipitation partitioning into evapotranspiration and runoff in land surface parameterizations, Water Resour. Res., 55, 95–111, https://doi.org/10.1029/2017WR022236, 2019.