the Creative Commons Attribution 4.0 License.
the Creative Commons Attribution 4.0 License.
 | 15 Sep 2026

OceanTACO: a multi-sensor global ocean sea surface state dataset

Cesar Aybar
Ando Shah
Marcello Passaro
Jonathan L. Bamber
We present OceanTACO, a harmonised global collection of sea surface state datasets designed to support reproducible Earth system research. The collection integrates satellite altimetry, sea surface temperature, salinity, surface winds, reanalysis fields, and Argo in situ observations within a unified cloud-optimised specification based on Transparent Access to Cloud-optimised datasets (TACO). It includes Level-3 observations, Level-4 gap-filled products, and reanalysis outputs while preserving native spatial and temporal resolution. The core dataset spans 29 March 2023 to 1 August 2025, covering the Surface Water and Ocean Topography (SWOT) mission, with an extended record from 1 January 2015 until 29 March 2023 for non-SWOT sources.
Datasets are harmonised through standardised metadata, spatial referencing, and temporal indexing, enabling consistent spatiotemporal queries across sensors and processing levels. The contribution is not a new regridding or compression method, but a sample-invariant, provenance-preserving organisation that allows the same data-access routines to be applied across regions, sensors, and studies. This supports Earth system analysis workflows such as validation against in situ observations, comparisons between observation and mapped products, observation system experiments, and multivariate sensor analyses.
Example applications demonstrate cross-product collocation with Argo, analysis of sea surface height variability during extreme events, and relationships between surface variables relevant for data-driven reconstruction. OceanTACO improves accessibility to coordinated multi-source analyses while preserving data provenance and native observation characteristics, and can be extended with new missions without restructuring the dataset. The core and extended dataset are available at https://doi.org/10.57967/hf/8171 (Lehmann and Aybar, 2026a) and https://doi.org/10.57967/hf/8172 (Lehmann and Aybar, 2026b) respectively.
- Article
(10700 KB) - Full-text XML
- BibTeX
- EndNote


Ocean dynamics play a central role in regulating Earth’s climate system, influencing air–sea fluxes, energy transport, and large-scale circulation patterns (Morrow et al., 2019). Mesoscale eddies (50–300 km) and smaller-scale processes contain a large fraction of the ocean’s kinetic energy and strongly impact heat, carbon, and nutrient transport (Klein et al., 2019). Quantifying these dynamics requires accurate and temporally consistent observations of sea surface height (SSH) and related surface variables.
Satellite radar altimetry has provided continuous, high accuracy global SSH observations since 1992 (Le Traon et al., 2025). Because altimeters sample the ocean along sparse ground tracks, spatially complete maps are generated using interpolation and data assimilation systems such as DUACS (Taburet et al., 2019). While these products provide essential large-scale coverage, their effective resolution is limited by sampling constraints and smoothing inherent to mapping procedures (Ballarotta et al., 2019). Complementary datasets, including sea surface temperature (SST), sea surface salinity (SSS), surface winds, wide-swath altimetry from SWOT, and in situ Argo profiles, provide essential ancillary information about ocean surface variability but are distributed across independent archives and formats.
Recent advances in data-driven reconstruction and hybrid data assimilation approaches have demonstrated the scientific value of integrating multi-sensor observations. These approaches range from statistical interpolation to machine learning methods (Martin et al., 2023; Le Guillou et al., 2025; Archambault et al., 2023) and require harmonised, well-documented, and reproducible access to heterogeneous datasets. However, assembling such collections remains technically demanding and time-consuming. Researchers must retrieve data from multiple platforms, reconcile spatial grids and temporal coverage, handle heterogeneous metadata, and define consistent preprocessing pipelines across products distributed in independent archives and formats. As a result, multi-sensor studies often rely on substantial custom preprocessing, undocumented collocation decisions, and varying data handling routines (Johnson et al., 2023; Aouni et al., 2025). This methodological variability limits comparability across studies and complicates efforts to reproduce or extend published analyses. Recent assessments across the geosciences emphasise that data availability alone does not ensure reproducible research and that structured data organisation, transparent provenance, and interoperable access mechanisms are equally critical (Algarabel et al., 2023; Coca-Castro et al., 2025).
To address this gap, we introduce OceanTACO, a globally consistent collection of sea surface state datasets spanning satellite observations, reanalysis products, and in situ measurements (Fig. 1). OceanTACO harmonises Argo profiles, L3 observational data, L4 gap-filled products, and reanalysis outputs within a unified specification based on the TACO framework (Aybar et al., 2025). Its contribution does not lie in the individual preprocessing steps, which are standard, but in providing a sample-invariant, provenance-preserving structure that makes heterogeneous ocean products queryable through a common access pattern. By combining SWOT-era L3 observations, L4 mapped products, reanalysis fields, and Argo profiles within one structure, OceanTACO reduces product-specific preprocessing and supports reproducible multi-source research across oceanography, data assimilation, statistical analysis, and emerging machine learning applications. Figure 1 illustrates a temporal snapshot of the various data included in OceanTACO.
OceanTACO makes the following contributions:
-
A uniformly organised global collection that brings together SWOT-era L3 observations, L4 mapped products, reanalysis fields, and Argo profiles within a single multi-source sea surface state dataset.
-
A sample-invariant and provenance-preserving data specification that enables the same query and loading workflow across heterogeneous ocean products without product-specific restructuring.
-
A reproducible and extensible access pattern for multi-sensor ocean analyses, including validation, cross-processing-level comparison, observation system experiments, and data-driven reconstruction studies.
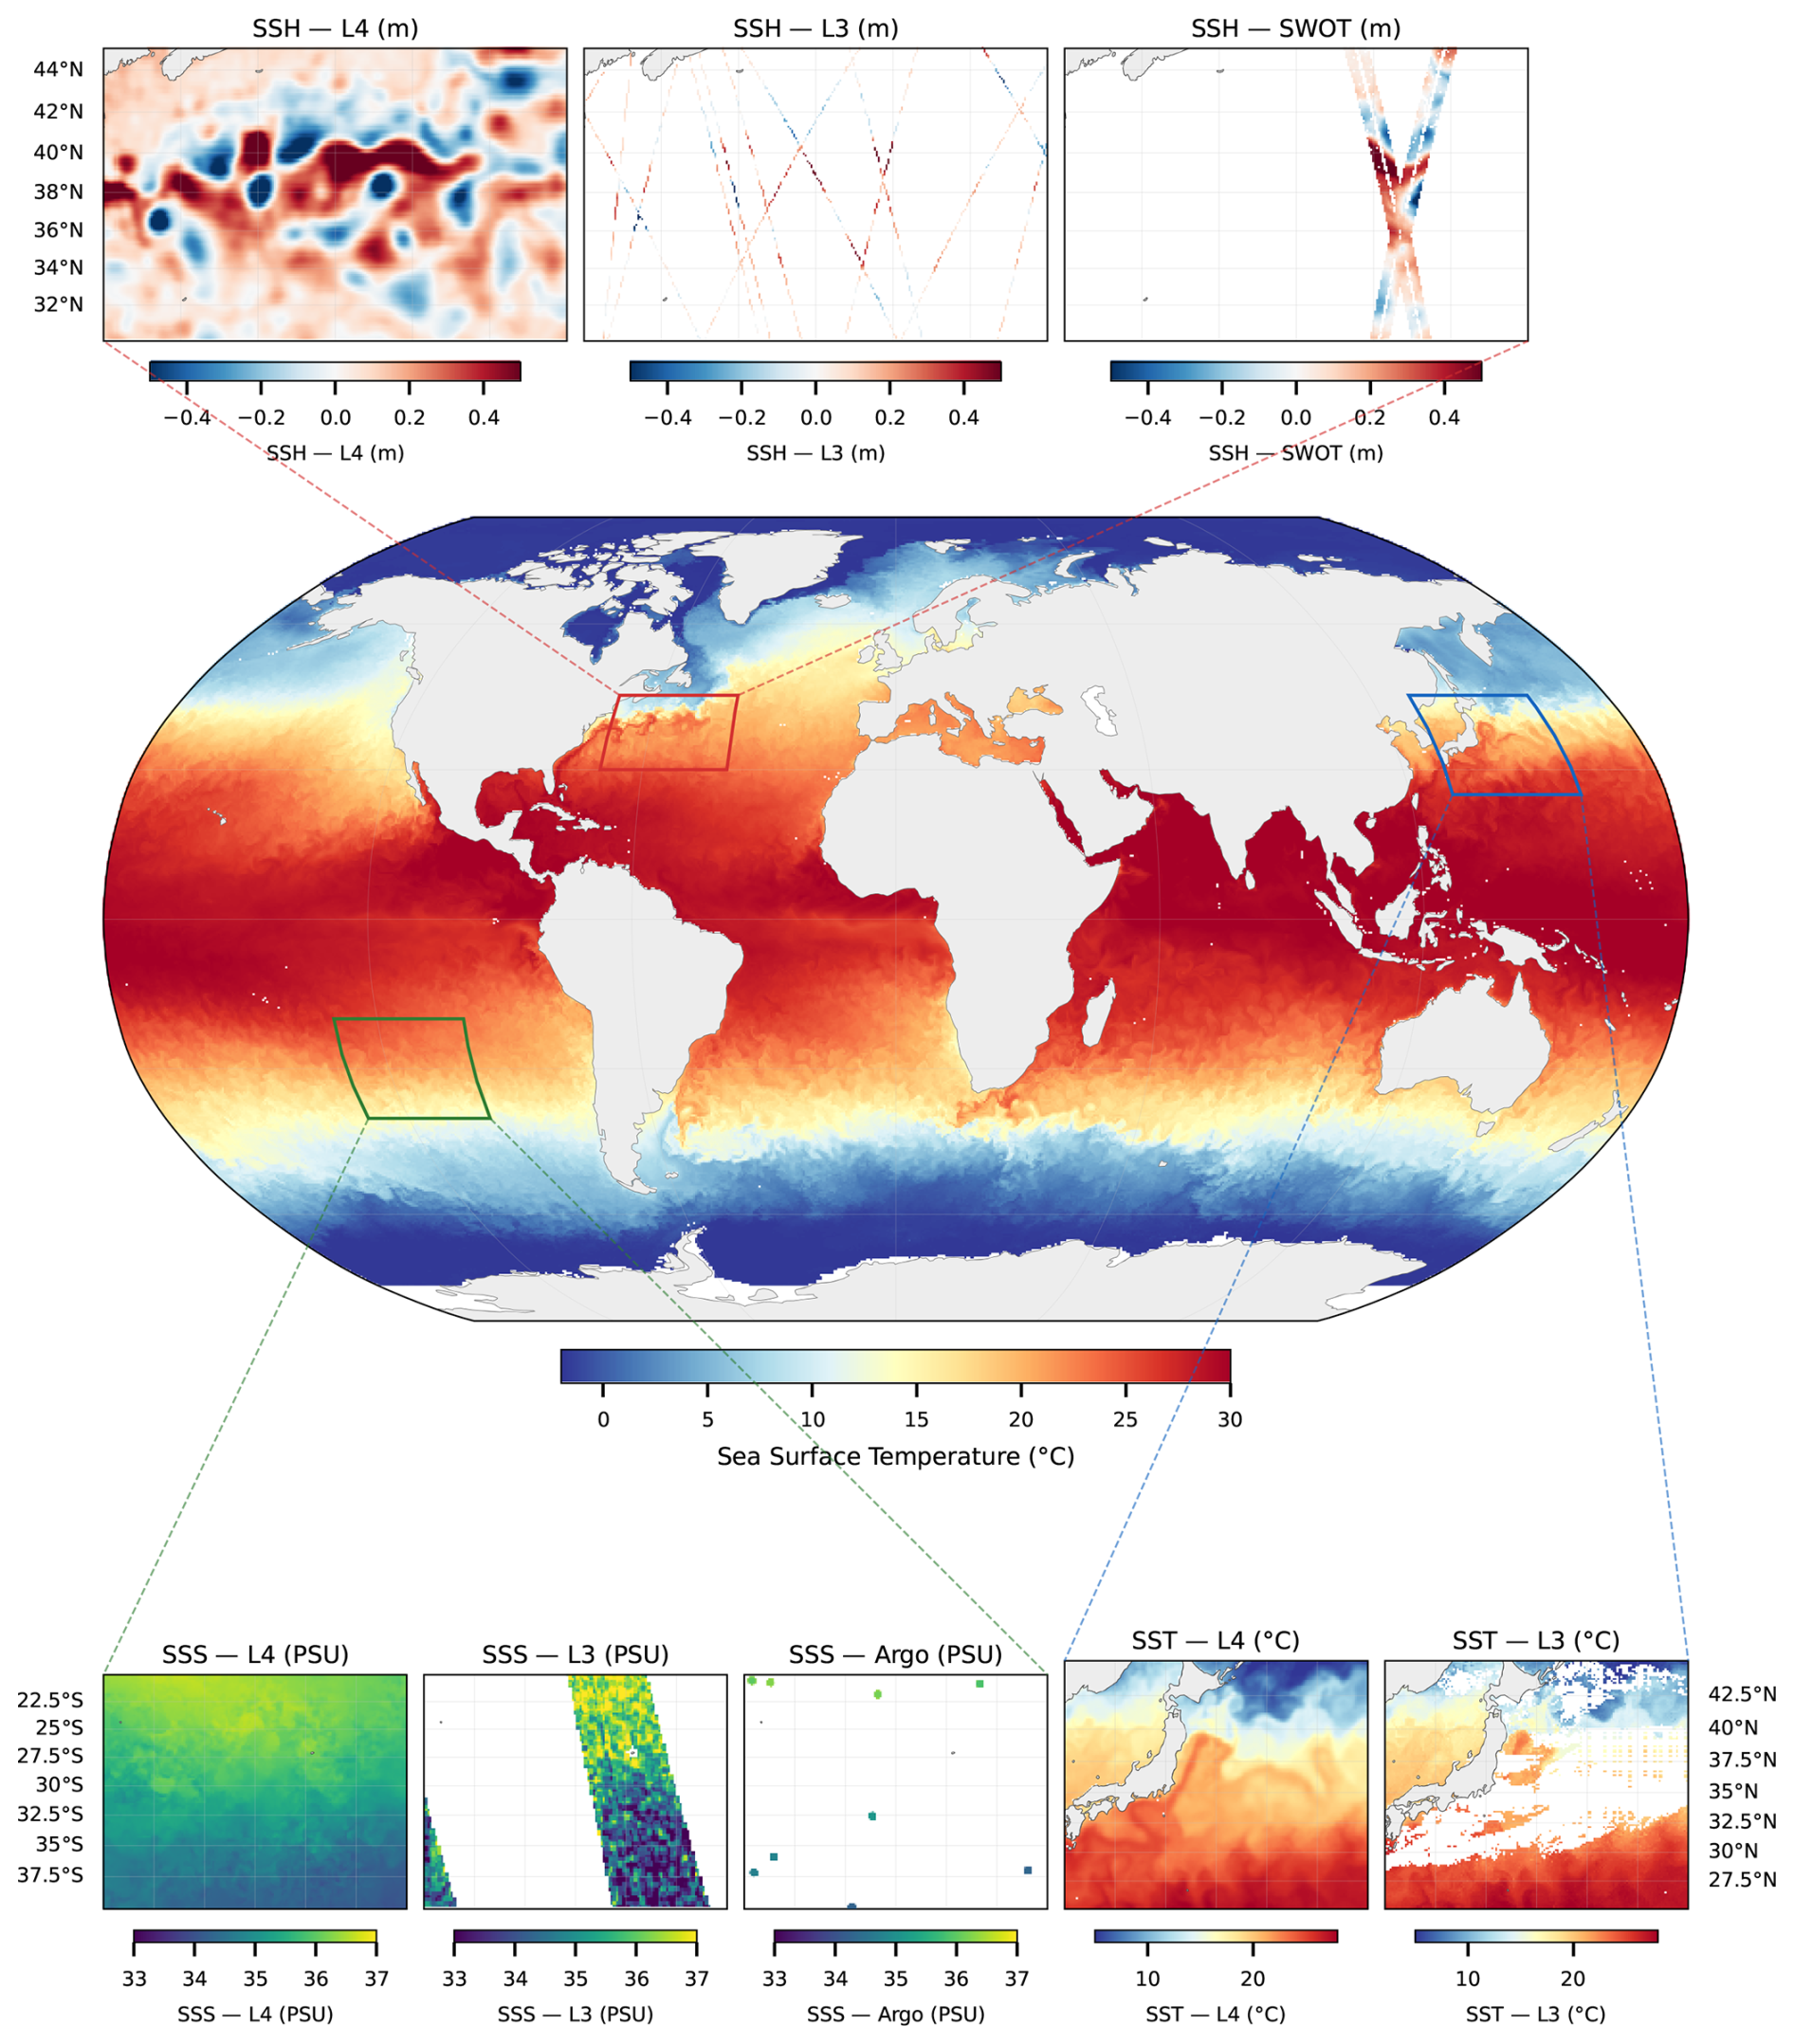
Figure 1Overview of the OceanTACO dataset illustrated for a single snapshot. Centre: Global sea surface temperature from the GLORYS reanalysis (Robinson projection); coloured boxes indicate the three focus regions. Top: Gulf Stream region (70–40° W, 30–45° N) showing the gridded L4 DUACS SSH anomaly, L3 conventional along-track altimetry, and L3 SWOT wide-swath observations on a shared colour scale (m), demonstrating the progressive increase in spatial resolution. Bottom left: South Pacific region (130–100° W, 40–20° S) comparing L4 and L3 sea surface salinity (10−3) with co-located Argo float profiles. Bottom right: Kuroshio Current region (130–160° E, 25–45° N) showing L4 and L3 sea surface temperature (°C). All panels are retrieved via a single spatiotemporal query to the OceanTACO catalogue, illustrating the dataset's ability to collocate heterogeneous observation types within a common regional tiling and storage framework.
1.1 Existing dataset frameworks
Johnson et al. (2023) introduced the OceanBench framework, which provides standardised preprocessing and evaluation procedures for sea surface height (SSH) interpolation tasks. OceanBench aggregates curated datasets derived from high-resolution NATL60 simulations together with simulated and real nadir altimetry observations, and includes benchmarking pipelines for method comparison. The framework has contributed substantially to improving reproducibility in regional SSH reconstruction studies, particularly in the Gulf Stream region. Extending this effort, Aouni et al. (2025) provide a more comprehensive benchmark for evaluating global data-driven ocean forecasting across sea surface height, temperature, salinity, and currents. The framework introduces curated datasets from GLORYS12, GLO12, and ECMWF Integrated Forecasting System (IFS) into three standardised evaluation tracks to ensure physical consistency and reproducibility in deep learning-based ocean modelling (Aouni et al., 2025).
While these frameworks represent important steps toward standardised analyses-ready data collections and benchmarking, they are primarily designed for predefined challenge configurations or focus on specific geographic regions. In contrast, OceanTACO is conceived as a global, multi-source data collection that harmonises observational, reanalysis, and auxiliary surface variables within a unified and queryable specification. Rather than prescribing fixed evaluation tracks, OceanTACO provides flexible spatiotemporal and sensor-level subsetting capabilities, enabling researchers to configure region-specific studies, cross-mission validation experiments, and forecasting setups within a consistent data framework. To our knowledge, no existing framework harmonises SWOT-era L3 observations, L4 gridded products, reanalysis fields, and in situ profiles from diverse ocean missions within a single, uniformly organised specification that preserves per-product provenance while supporting the same query workflow across all modalities.
1.2 Multi-source coordination
When multi-sensor ocean analyses are combined from independently distributed archives, each dataset introduces its own unique processing requirements. These choices must be resolved at the preprocessing stage and, when undocumented, introduce sources of variation between studies. Because such decisions are rarely reported in full in published methods sections, nominally comparable analyses may differ in ways that are not apparent from the description alone (Johnson et al., 2023; Aouni et al., 2025). The resulting methodological variability limits the comparability of results across studies and complicates efforts to reproduce or extend existing analyses.
Format-level standards such as Zarr and NetCDF4/HDF5 eliminate heterogeneity in binary encoding but do not prescribe how variables, coordinates, or metadata are organised within a file or across a collection. Catalogue standards such as STAC address the related but distinct problem of discovery: they specify where data can be found, not how different products are internally organised or how they relate to one another across sensors and processing levels. As a result, multi-source preprocessing workflows remain data product-specific even when all constituent files conform to a common format or are discoverable through a shared catalogue.
The TACO specification addresses this by enforcing a uniform internal organisation at the sample level: every entry in the catalogue replicates an identical subfolder and file-type layout, regardless of which sensors it contains or at which processing level they were acquired (Aybar et al., 2025). Because the internal structure is invariant across products, data access procedures developed for one sample apply without modification to any other sample in the collection.
The naming of the specification reflects two complementary design principles. Transparent refers to data access being explicit and auditable: data are referenced through explicit file paths, so every retrieval operation can be traced, replicated, or independently verified. Cloud-optimised refers to the storage layout: NetCDF4/HDF5 files with internal chunking support partial, byte-range reads from remote object storage, so that the same access procedure operates identically on locally held data or on data hosted in cloud object stores, without requiring full-file retrieval before analysis can begin.
Together, these properties mean that analysis workflows developed for one region or sensor transfer to other regions and sensors without modification to the access procedure, improving reproducibility or extensions by other research groups.
2.1 Data sources
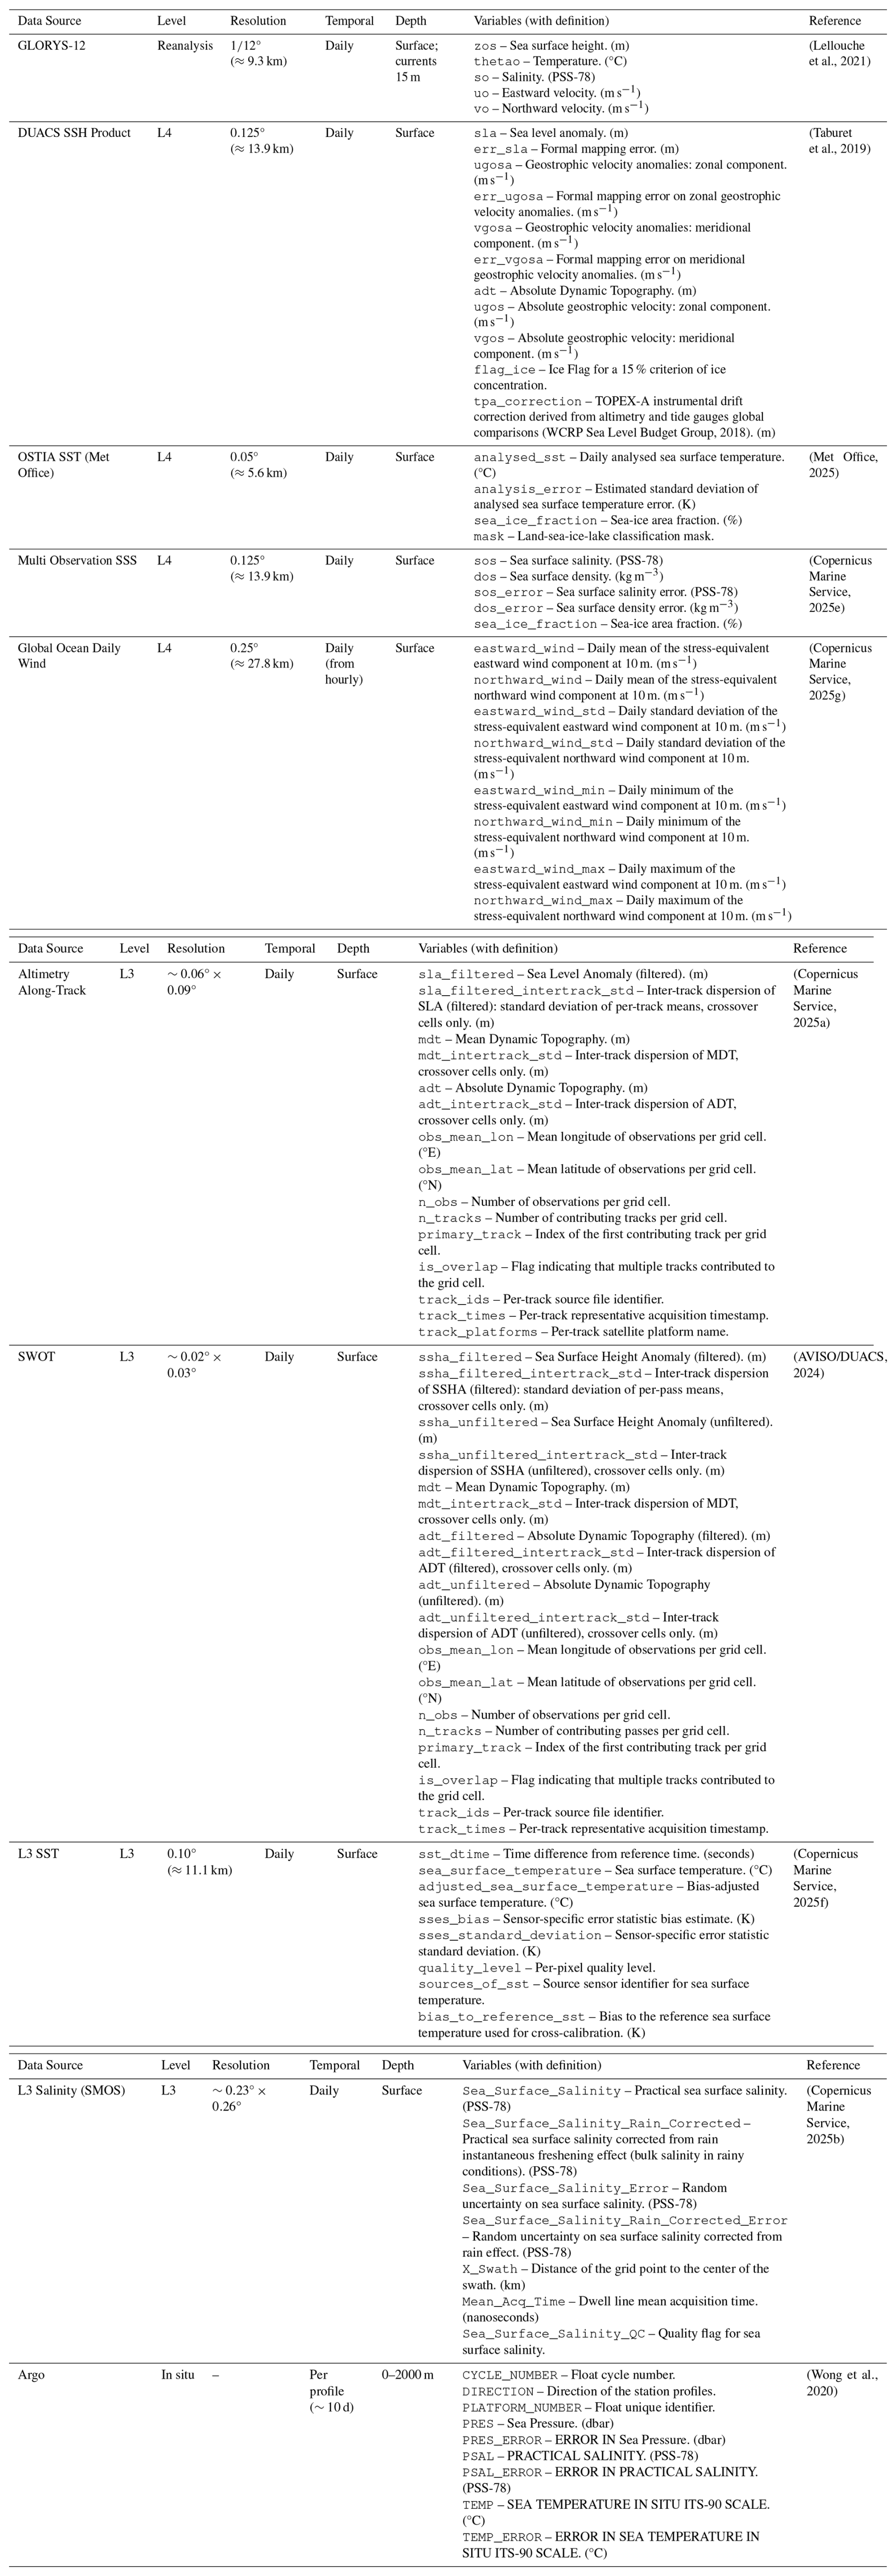
OceanTACO integrates ten data sources spanning satellite altimetry, sea surface temperature, sea surface salinity, surface winds, ocean reanalysis, and in situ Argo profiles (Table 1). The table consolidates the horizontal resolution, stored temporal cadence, vertical coverage, and coverage across the Core and Extended releases for each source in one place.
Table 1Overview of the primary data sources used in OceanTACO. The core dataset spans 29 March 2023 to 1 August 2025, while the extended dataset covers 1 January 2015 to 29 March 2023 preceding the SWOT mission. A full description of all variables can be found in Table A1. Key variables here are shown with simplified aliases for readability. The Temporal column lists the cadence stored in OceanTACO (L4 wind is resampled from native hourly to daily). Depth is surface unless noted: GLORYS is a surface subset with currents at 15 m, and Argo retains full 0–2000 m profiles.
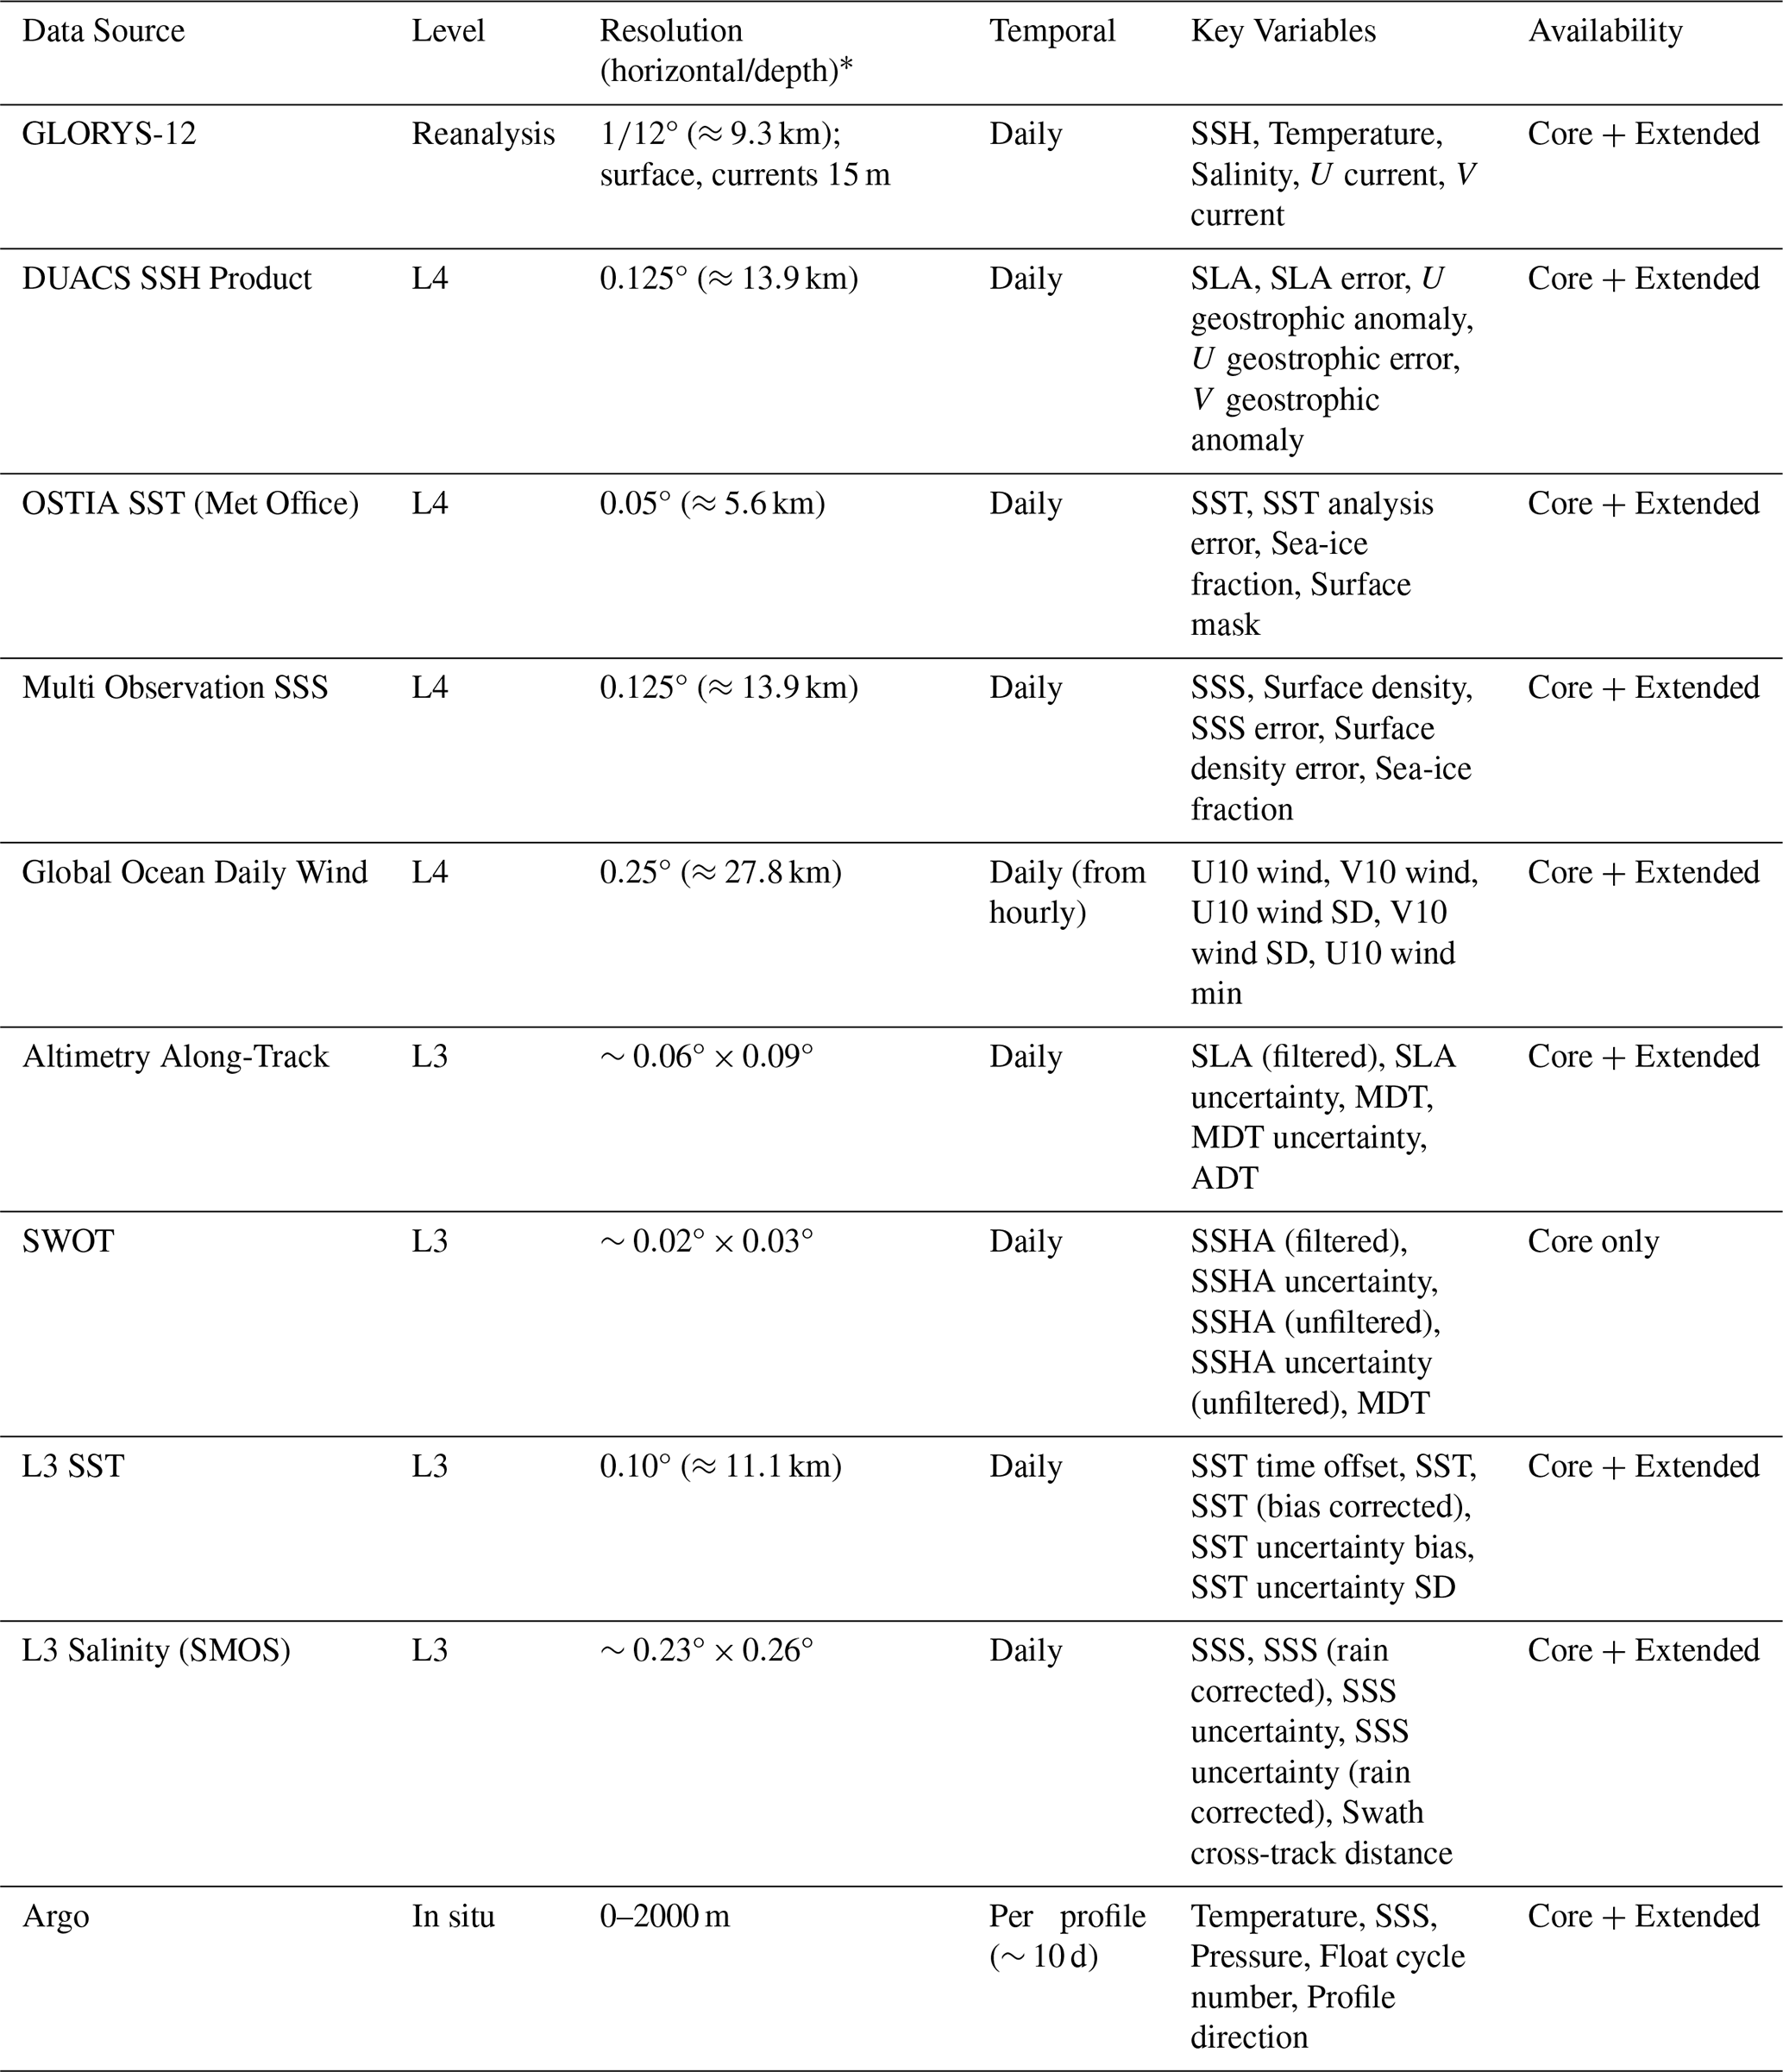
* Horizontal kilometer resolutions are approximate values estimated at the equator.
2.1.1 Reanalysis data
The Global Ocean Reanalysis and Simulation (GLORYS12) data product provides a global ocean reanalysis at horizontal resolution and is available from 1993 to present, covering the full satellite altimetry era (Lellouche et al., 2021). GLORYS12 assimilates satellite and in situ observations into the NEMO ocean ice model using a hybrid Kalman filter combined with a three-dimensional variational (3D-Var) bias correction scheme (Lellouche et al., 2021).
At its native resolution, GLORYS12 resolves large-scale and mesoscale circulation features but does not fully capture submesoscale variability. Reanalysis products may exhibit regional discrepancies relative to direct satellite observations, particularly in dynamically active mesoscale regions (Martin et al., 2025). Nevertheless, they provide physically consistent, dynamically balanced fields that are valuable for multi-sensor analyses and data-driven studies (Martin et al., 2025).
Although GLORYS12 provides three-dimensional fields with depth, OceanTACO includes a subset of surface variables to maintain consistency with the other sea surface datasets in the collection. Specifically, we include sea surface height, sea surface temperature, sea surface salinity, and surface currents at 15 m depth, following Martin et al. (2025). This selection facilitates joint analyses of surface state variability while preserving the physical coherence of the reanalysis product.
2.1.2 Level 4 data
L4 products provide spatially and temporally complete surface fields derived through data assimilation and optimal interpolation of satellite and in situ observations. In contrast to L3 observations, which retain native sampling characteristics, L4 products represent gap-filled, gridded estimates of ocean surface variables. OceanTACO includes L4 datasets for sea surface height (SSH), sea surface temperature (SST), sea surface salinity (SSS), and surface winds. All L4 products were obtained from the Copernicus Marine Service using the Copernicus Marine Toolbox (Mercator Ocean/Copernicus Marine Service, 2025).
Sea surface height (SSH)
We include the DUACS L4 gridded sea level product (Taburet et al., 2019; Copernicus Marine Service, 2025c), provided at 0.125°×0.125° resolution. DUACS merges multi-mission L3 along-track altimetry observations using optimal interpolation. Its full mission heritage includes Sentinel-3A/B, Sentinel-6A, Jason-3, SARAL/AltiKa, CryoSat-2, OSTM/Jason-2, Jason-1, TOPEX/Poseidon, Envisat, GFO, ERS-1/2, and Haiyang-2A/B, although not all of these missions contribute throughout the OceanTACO period. Within OceanTACO, we include the gridded sea level anomaly (SLA) and associated standard variables provided in the product.
Sea surface temperature (SST)
Sea surface temperature is dynamically linked to sea surface height in many regions, particularly in western boundary currents such as the Gulf Stream (Martin et al., 2023; Le Guillou et al., 2025). To provide a spatially complete SST field, we include the OSTIA L4 SST product (Met Office, 2025). This dataset provides global daily mean SST on a 0.05°×0.05° grid. It merges observations from multiple infrared and microwave satellite sensors (AVHRR, ATSR, SLSTR, AMSR-E, AMSR2; Embury et al., 2024) using the OSTIA optimal interpolation system.
Sea surface salinity (SSS)
Sea surface salinity contributes to regional sea level variability through halosteric effects (Llovel and Lee, 2015). We include the Copernicus Marine multi-observation L4 salinity product (Copernicus Marine Service, 2025e), provided at 0.125°×0.125° resolution. This dataset combines measurements from NASA's Soil Moisture Active Passive (SMAP) mission and ESA’s Soil Moisture and Ocean Salinity (SMOS) mission, together with satellite SST and in situ salinity observations. The fields are generated using a multivariate optimal interpolation framework (Droghei et al., 2016; Buongiorno Nardelli et al., 2016; Droghei et al., 2018) to produce gap-free global maps.
Surface winds
Surface wind stress influences short-term variability in upper ocean dynamics (Li et al., 2022). We incorporate the Global Ocean Hourly Sea Surface Wind L4 product (Copernicus Marine Service, 2025g), provided at 0.25°×0.25° resolution. The dataset is based on the ECMWF ERA5 reanalysis and is bias-corrected using scatterometer observations from multiple satellite platforms. For consistency with the daily temporal resolution adopted in OceanTACO, hourly wind fields are aggregated to daily means, while also computing daily minimum, maximum, and standard deviation values.
2.1.3 Level 3 data
In contrast to reanalysis and L4 products, L3 datasets retain the native sampling characteristics of satellite and in situ observations without gap filling or large-scale interpolation. As such, they provide observation-based constraints that are essential for evaluating gridded products, assessing sampling effects, and supporting data assimilation studies.
Along-track altimetry
We include multi-mission L3 sea surface height (SSH) along-track altimetry data from the Copernicus Marine Service (Copernicus Marine Service, 2025d, a). These datasets provide geophysical corrections and cross-calibrated measurements at an effective spatial sampling of approximately 7 km along track.
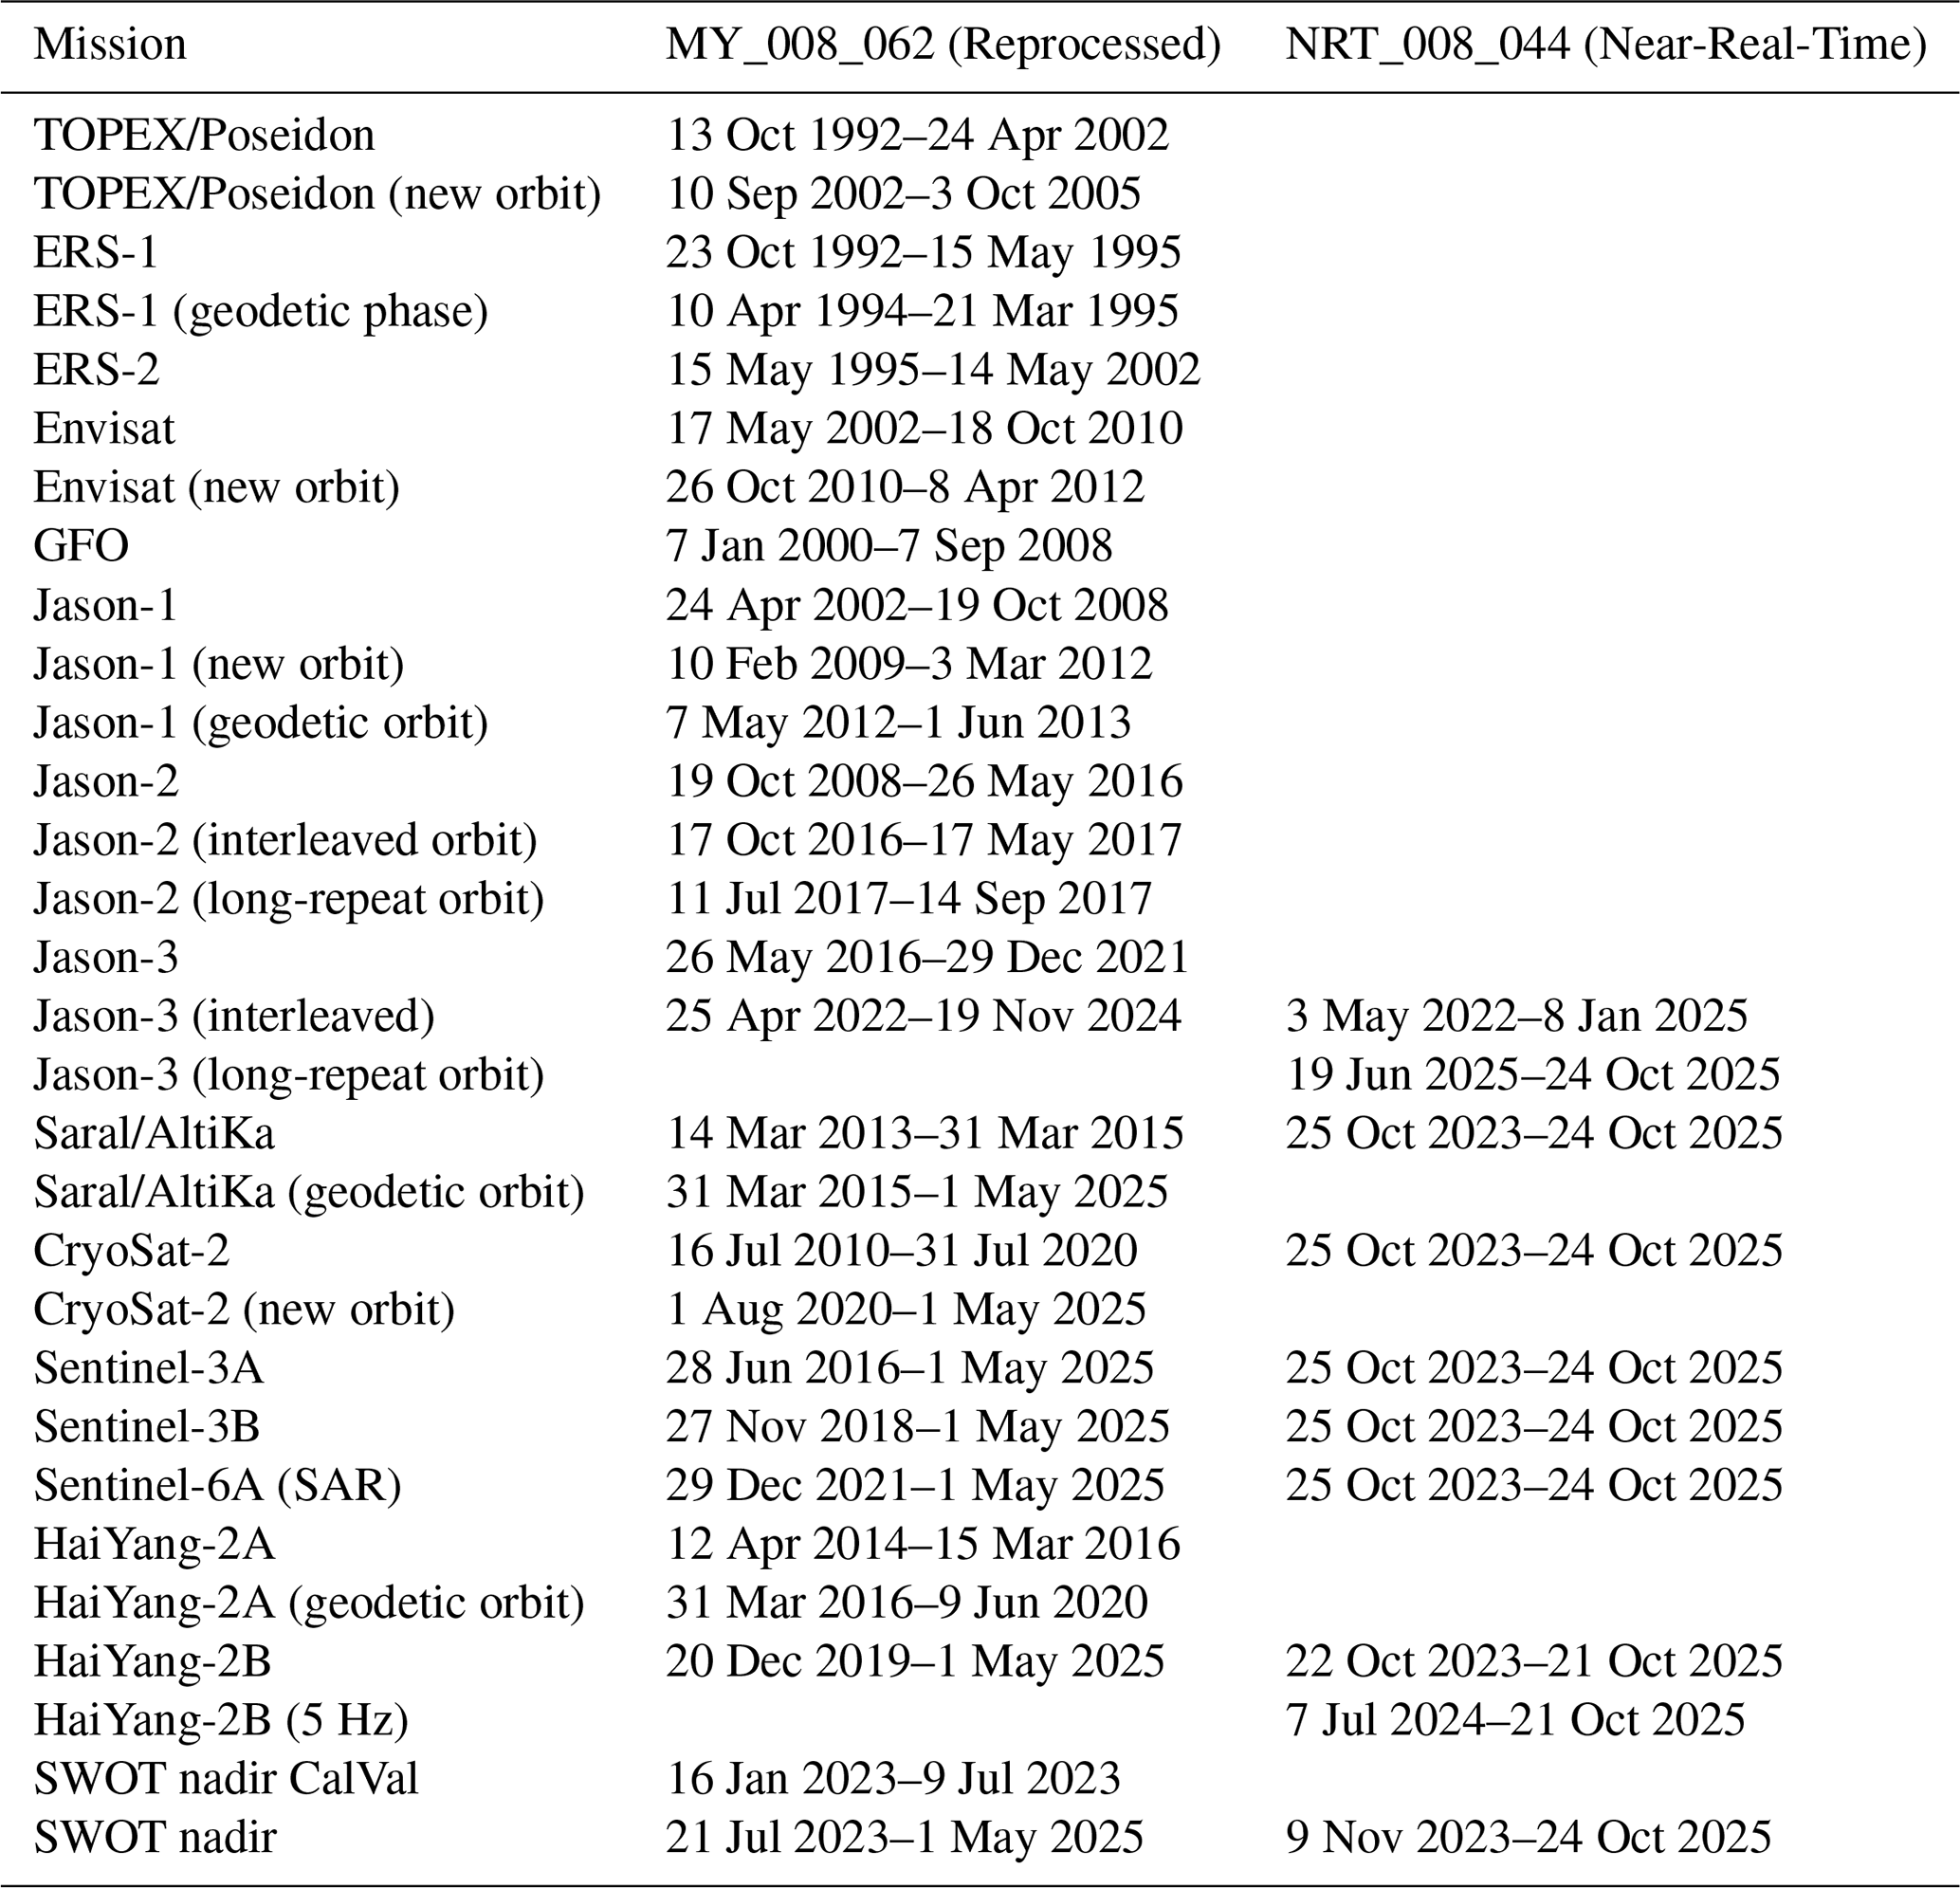
Where available, we prioritise the reprocessed (multi-year) product tailored for data assimilation applications (Copernicus Marine Service, 2025a), which ensures improved cross-mission consistency relative to near-real-time products. For periods not covered by the reprocessed archive, near-real-time products (Copernicus Marine Service, 2025d) are incorporated to maintain temporal continuity. The temporal coverage of each contributing mission across both products is listed in Table A2 in the Appendix.
Mission identifiers are preserved within OceanTACO, enabling filtering by individual satellite platforms. This facilitates cross-mission consistency studies and controlled validation experiments based on sensor-level subsetting.
Wide-swath altimetry (SWOT)
The Surface Water and Ocean Topography (SWOT) mission (Fu et al., 2024) represents a major advancement in satellite altimetry by providing two-dimensional wide-swath sea surface height observations at an approximate resolution of 2 km (Morrow et al., 2019). Using the Ka-band Radar Interferometer (KaRIn), SWOT measures sea surface height across a ∼120 km swath by estimating phase differences between two spatially separated antennas. This configuration resolves fine-scale ocean variability beyond the reach of conventional nadir altimeters. We include the L3 SWOT Low Rate SSH product distributed by AVISO (AVISO/DUACS, 2024).
L3 sea surface temperature and salinity
To complement the gridded L4 surface products, OceanTACO incorporates observation-based L3 SST and SSS datasets. The L3 SST product (Copernicus Marine Service, 2025f) provides intercalibrated measurements from multiple polar orbiting and geostationary satellites. The L3 SSS dataset (Copernicus Marine Service, 2025b; Boutin et al., 2018) is derived primarily from SMOS observations and includes quality-controlled retrievals prior to spatial interpolation.
Together, these L3 datasets preserve the native sampling structure and measurement characteristics of the underlying observing systems. Including them lets researchers distinguish observation-driven variability from mapping-induced smoothing.
In situ data
To complement satellite-based surface observations, OceanTACO includes in situ measurements from the Argo programme. Argo is a global array of autonomous profiling floats that measure temperature, salinity, and pressure throughout the upper 2000 m of the ocean (Wong et al., 2020). Since its establishment in the early 2000s, the program has collected more than two million high-quality profiles, substantially improving observational coverage of the subsurface ocean, which cannot be directly observed from space (Wong et al., 2020). Argo data are accessed and processed using the argopy Python library version 1.4 (Maze and Balem, 2020). We use the research-quality data access mode, which automatically applies quality control filters and excludes profiles that do not meet delayed-mode or real-time quality standards. Within OceanTACO, temperature, salinity, and pressure profiles are retained in their original vertical resolution and linked to the corresponding temporal and spatial indices of the dataset. The inclusion of Argo observations provides an independent in situ reference for evaluating surface products and enables analyses that connect surface variability with subsurface structure.
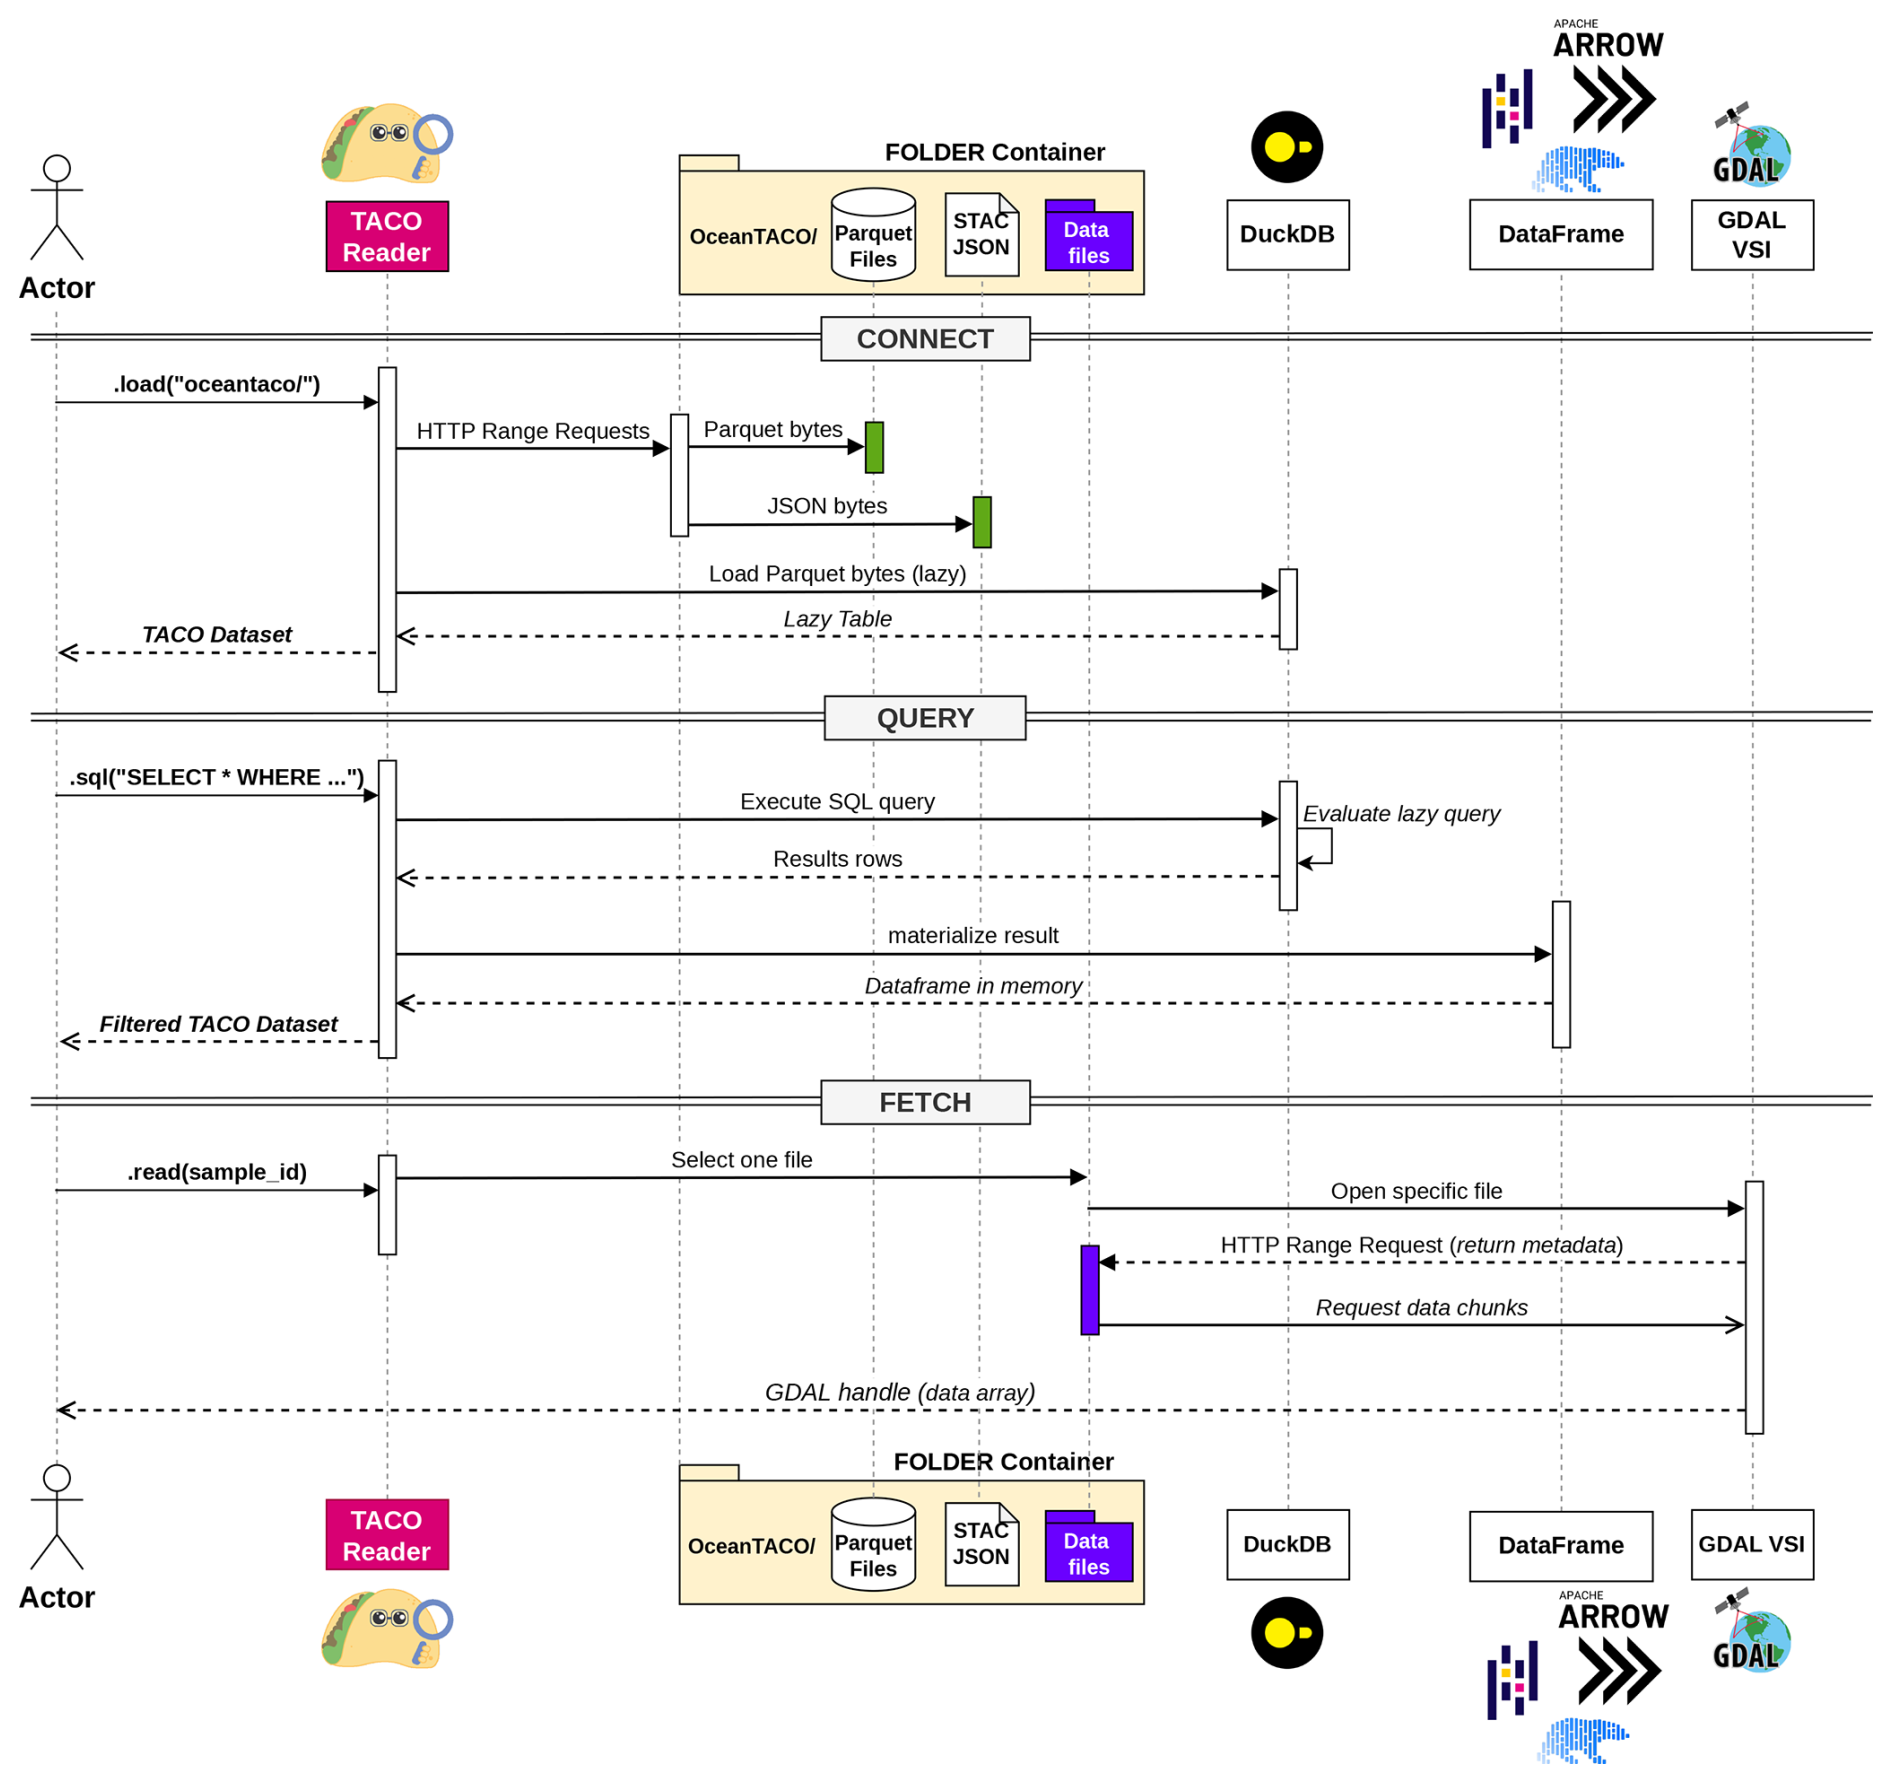
Figure 2TACO architecture showing the three-phase data access workflow for the OceanTACO folder container. The CONNECT phase retrieves the Parquet metadata files and STAC-compliant JSON collection descriptor from the dataset root, then lazily loads the Parquet tables into DuckDB for evaluation. The QUERY phase filters these tables by geographic extent, observation period, or data source via SQL, materializing results as in-memory DataFrames. The FETCH phase retrieves individual data files on demand through GDAL VSI, which issues HTTP range requests to read only the requested portions of remote files without downloading the complete dataset.
2.2 Temporal and spatial coverage
OceanTACO is released in two contiguous temporal segments. The core dataset spans 29 March 2023 to 1 August 2025, covering the currently available SWOT period, including the calibration phase. We additionally provide an extended pre-SWOT segment spanning 1 January 2015 to 29 March 2023 for all non-SWOT sources. The 2015 start follows the salinity record. The multi-observation salinity product included here combines SMAP, SMOS, satellite SST, and in situ salinity through multivariate optimal interpolation, and reaches this configuration in 2015 when SMAP becomes available. From 2015 the sensor constellation underlying the collection stays constant, with the L3 SSH missions and, from 2023, SWOT adding sampling without removing any modality. Several constituent products extend further back in time, and earlier years can be appended for backward-compatible sources through the same folder-mode organisation and public processing pipeline without restructuring the dataset. Spatially, OceanTACO provides global coverage between 90° S and 90° N in a WGS 84 (EPSG:4326) projection, with variable-specific native spatial resolutions ranging from approximately 2 km (SWOT) to 0.25° (surface winds). While the WGS 84 projection is not area-preserving, and will lead to significant distortions towards the poles, it is the native projection of both GLORYS and L4 data and was therefore used as the basis for regridding of altimetry track and SWOT data. The extended and core datasets share the boundary date of 29 March 2023, allowing seamless concatenation.
The complete core dataset comprises 857 daily temporal indices, subdivided into eight regional tiles per day. The extended dataset comprises 3010 daily temporal indices. The total storage volume is approximately 311 GB for the core period and 581 GB for the extended period in compressed form, accounting for all stored variables across modalities; Table A3 reports the storage for the primary variable of each modality as a representative indicator of compression performance. OceanTACO is publicly accessible through Hugging Face for direct cloud access.
2.3 Processing methods
Because OceanTACO integrates heterogeneous data products with differing spatial resolutions, sampling geometries, and file formats, we implemented a standardised processing workflow to harmonise the collection while preserving native observation characteristics.
The processing pipeline consists of three primary steps:
-
Regional tiling. Global daily data files are partitioned into eight equally sized geographic regions in their native WGS 84 projection to facilitate efficient storage and selective retrieval as depicted in Fig. 3.
-
Observation binning. L3 along-track altimetry and wide-swath SWOT observations are projected onto regular grids at their native spatial resolutions using binning procedures.
-
Numerical compression. Dense gridded fields are encoded using scaled
int16representations combined with losslesszlibcompression to reduce storage volume while preserving information. The sparse L3 along-track and SWOT products are instead retained at fullfloat32precision: they reside on irregular, largely empty track grids whereint16packing yields little gain, and they bundle heterogeneous computed quantities (per-cell inter-track dispersion, observation counts, and track identifiers) whose differing dynamic ranges are not reliably captured by a single fixed scale factor.
Gridded L4 and reanalysis products retain their native grids, L3 nadir and SWOT observations are conservatively binned rather than interpolated, and Argo profiles retain their original sampling coordinates and timestamps. Each product is ingested at its published, quality-controlled processing level, and OceanTACO performs no additional filtering or outlier removal; the data therefore retain the quality of their authoritative source, and application-specific quality decisions are left to the user.
2.3.1 Regional processing
We process the global data into eight separate regions per day, as shown in Fig. 3. Through the streaming and query possibilities, users can download or interact with a specific region if requested. This reduces memory requirements for regional studies, and also improves data access speeds for smaller patches, since only a regional file has to be opened to extract a geospatial patch. A bounding-box query can overlap up to four regions, for example where region corners meet; it is served transparently across all of them, so the regional tiling does not limit the user in any way.
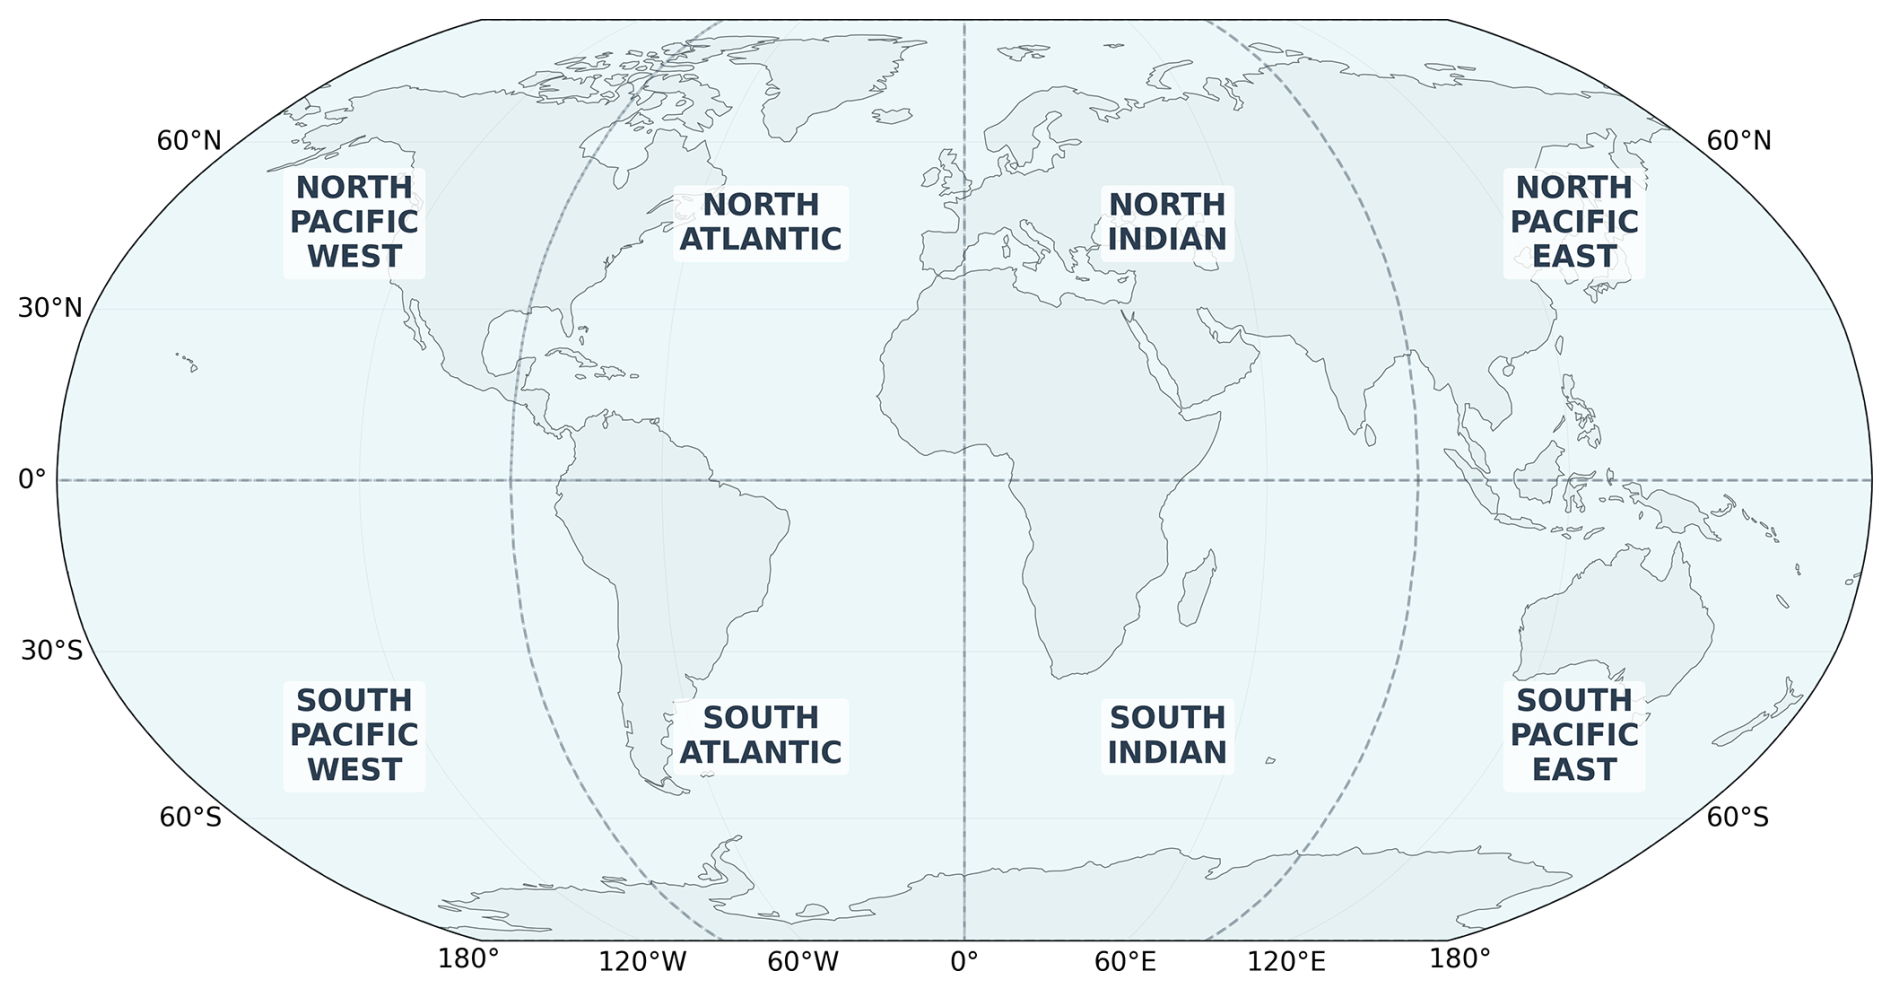
Figure 3The eight spatial regions provided in OceanTACO for region-specific data access. Each region is stored as an independent subset of all data sources, enabling efficient spatially targeted queries without loading the global dataset.
2.3.2 Regridding
Along-track altimetry L3
L3 along-track sea surface height (SSH) observations from multiple satellite missions are mapped onto a regular 7 km grid using a conservative binning approach. Grid cell boundaries are placed at the midpoints between adjacent cell centres, and each observation is assigned to the cell whose boundaries contain its geographic coordinates.
For each contributing satellite track k, the per-cell arithmetic mean is computed, where zi denotes a sea level anomaly observation (in metres) falling in the cell from track k, and nk is the number of such observations. Across the K tracks that contribute to a cell, the observation-weighted mean is
Where two or more tracks overlap a cell (K≥2), we quantify the disagreement between the independent crossing passes by the observation-weighted standard deviation of the per-track means,
This inter-track dispersion is stored only for multi-track (crossover) cells and is left undefined elsewhere. Because the 7 km grid spacing is comparable to the 1 Hz along-track sampling, each pass typically contributes a single observation per cell, so σtrack isolates the consistency between missions at crossovers rather than within-track noise, providing a direct diagnostic of inter-mission calibration differences. Cells containing no observations are masked as missing. No spatial smoothing, interpolation, or gap filling is applied beyond this cell-based aggregation.
To further preserve sampling information and data provenance, auxiliary metadata layers are retained for each grid cell: (i) the total number of contributing observations n, (ii) the number of contributing tracks, (iii) a primary track identifier, (iv) an overlap mask indicating multi-track intersections, and (v) the observation-mean geographic position within each cell. This structure enables per-mission separation and assessment of sampling density.
Wide-swath altimetry (SWOT) L3
The L3 SWOT product is regridded onto a 2 km regional grid that maintains the native resolution of the KaRIn instrument, using the same conservative binning procedure described above for along-track altimetry. No spatial smoothing is applied; cells without observations remain masked. The swath geometry is projected with identical cell-boundary conventions, and the observation-weighted mean, inter-track dispersion (σtrack, defined as above for multi-pass cells), and auxiliary metadata layers (primary pass identifiers, overlap indicators, observation counts, and mean observation positions) are retained to support analyses of crossover regions and temporal sampling offsets. Redistribution of native SWOT L3 files in their original form is restricted under the AVISO+ data licence (Issue 19, February 2024); however, that licence explicitly permits the creation and redistribution of Derivative Works for any purpose. Confirmed by the AVISO team, OceanTACO's regridding constitutes such a Derivative Work: the irreversible coordinate transformation and spatial binning remove the original swath/pixel structure, so the native AVISO+ files cannot be reconstructed from this dataset. Full licensing details, including the specific AVISO+ clauses relied upon, are provided in the dataset card accompanying the Hugging Face repository.
2.3.3 Compression
OceanTACO applies scaled int16 encoding combined with zlib compression to reduce storage requirements while preserving numerical fidelity. To quantify the impact of this transformation, we evaluate reconstruction errors relative to the original float32 source fields prior to encoding. For each variable and data source, we decode the stored representation and compute the absolute difference with respect to the original floating point data. We report the 99th-percentile error (P99), root-mean-square error (RMSE), and mean bias over the full spatial domain and representative time period, which can be found in Table A4 in the Appendix. Fig. 4 demonstrates that the encoding introduces negligible reconstruction error relative to the original float32 representation. Because the absolute error is bounded by the int16 quantisation step, we additionally report the error normalised by the local field variability (Fig. 4b), which confirms that the relative error remains small even in low-variability regions, where it is largest. The overall compression factor results from two components: (i) the deterministic packing ratio from float32 to int16, and (ii) the zlib deflation ratio, which depends on spatial sparsity and field smoothness. Figure A1 shows an example compression analysis for a fully gridded L4 product.
To distinguish archive design from codec benchmarking, we separate the deployed OceanTACO representation from a controlled compression comparison. The released archive uses scaled int16 encoding with zlib for the dense gridded fields and retains the sparse L3 along-track and SWOT products at full float32 precision, because this preserves a simple, transparent, and directly readable representation that remains consistent with the TACO access model. By contrast, the storage factors reported in Table A3 describe the released OceanTACO product and therefore include product-specific restructuring effects in addition to numerical encoding; for example, the large reduction for L4 wind partly reflects consolidation of native hourly input fields into daily OceanTACO variables, while the high L3 along-track and SWOT factors partly reflect the consolidation of many individual native track files into a single regridded product rather than numerical compression alone. We additionally carried out a ClimateBenchPress-style benchmark on the five gridded products using a broader set of safeguarded and error-bounded codecs, including SZ3, SPERR, ZFP, EBCC, and bitround-based variants. Under matched strict bounds, these methods achieved higher compression ratios than the deployed OceanTACO representation (Table A5). For L4 SST, the benchmark configuration was chosen to respect the native int16 quantization of the source product, so sub-quantization error bounds were not used.
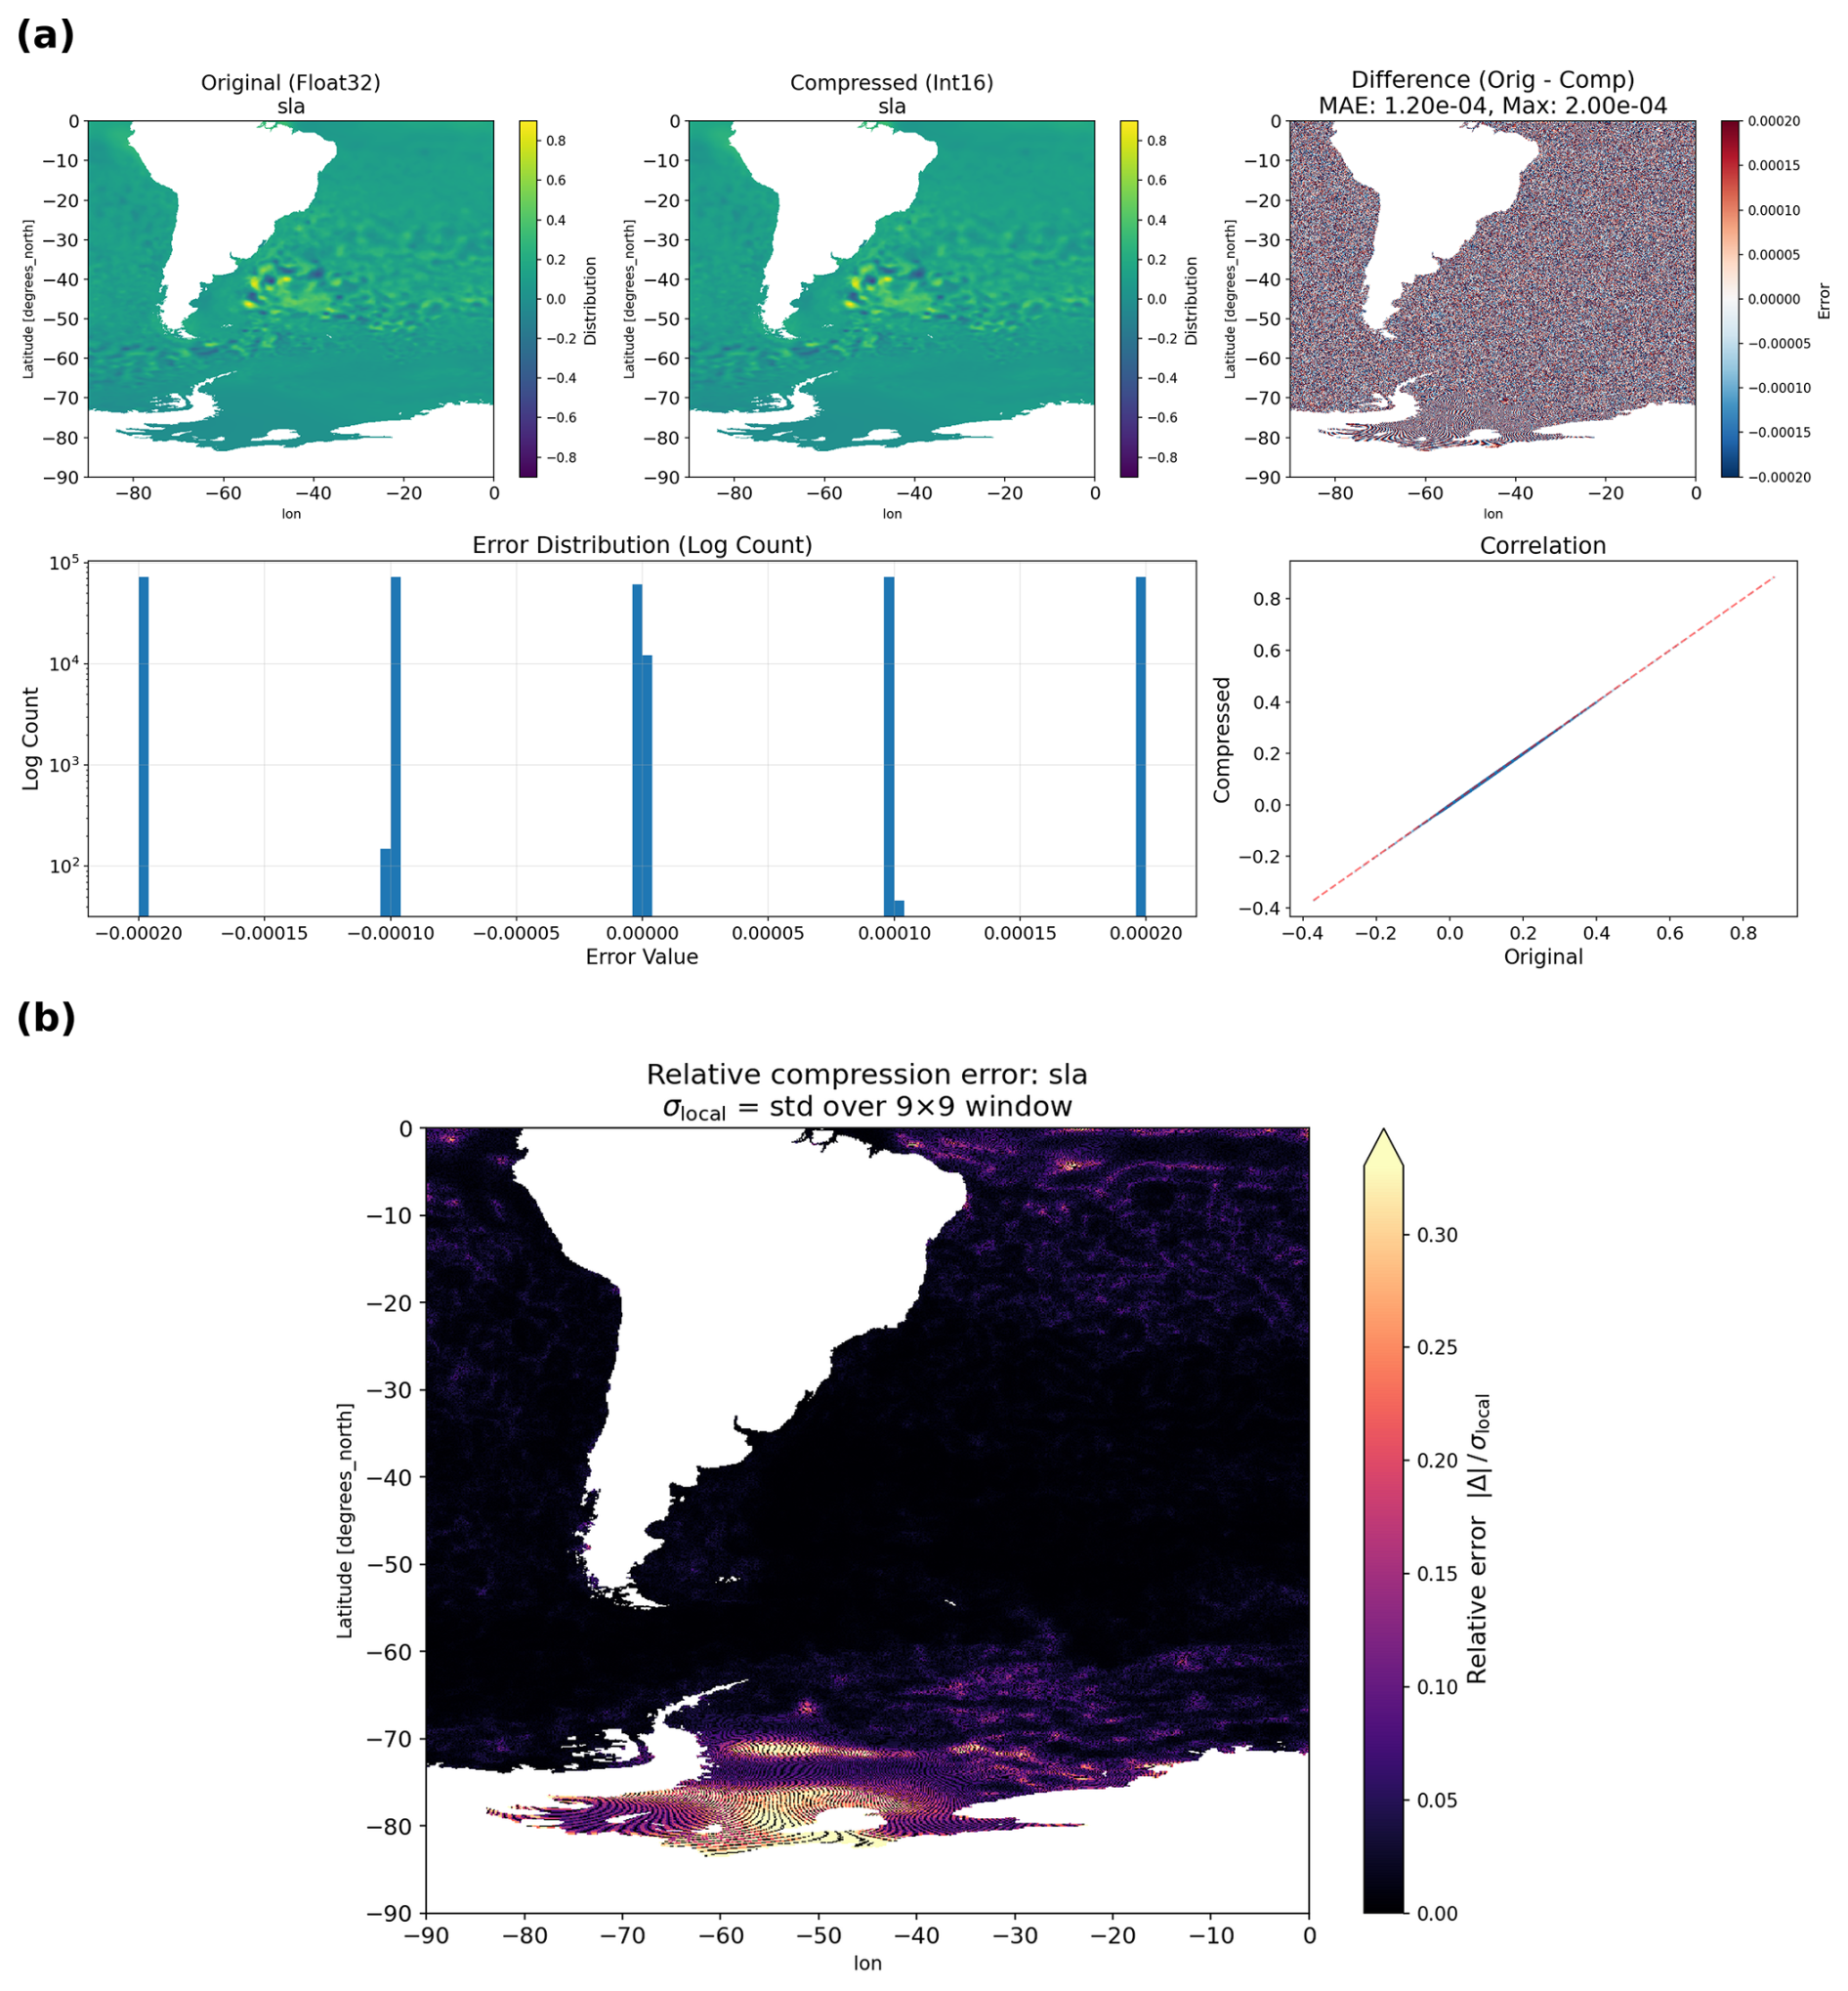
Figure 4Encoding quality of the int16+zlib compression scheme applied to the L4 SSH sea level anomaly (SLA) over the South Atlantic on 2 April 2023, representative of the compression quality across all gridded products. (a) Top row, left to right: original float32 SLA field (m), int16-decoded field (m), and their absolute difference (m); bottom row: error distribution across all valid ocean pixels (log-scaled counts) and a scatter of compressed versus original values about the identity line. The visible reconstruction-error floor is set by the int16 representation. (b) The same error normalised by the local field variability, , with σlocal computed over a 9×9 pixel window. Although the absolute error is bounded by the int16 step, the relative error is largest in low-variability regions, while remaining small relative to the natural field variability overall.
2.4 TACO dataset access and interaction
Building reproducible workflows from independently archived ocean datasets demands substantial custom preprocessing. The SpatioTemporal Asset Catalog (STAC) standard is widely used for geospatial dataset discovery and cataloguing; however, it addresses data discovery rather than the internal organisation of samples. As a result, each dataset still requires product-specific loading code and inspection before common data access routines can be written. This is especially challenging when combining heterogeneous data types, including satellite altimetry, sea surface temperature, salinity, winds, and in situ profiles, each of which originates from distinct archives and formats.
OceanTACO implements the TACO (Transparent Access to Cloud-optimised) specification (Aybar et al., 2025) to resolve this. TACO is fully compliant with STAC, and any TACO dataset can be mapped to a valid STAC catalog without information loss. Additionally, TACO directly follows the FAIR principles proposed by Wilkinson et al. (2016). The contribution of OceanTACO is therefore not a new catalog standard, but the application of a sample-invariant TACO organisation to a heterogeneous ocean collection spanning L3 observations, L4 products, reanalysis fields, and Argo profiles. Beyond cataloging, TACO enforces consistent internal organisation across all samples within a dataset. For example, if one sample contains folders GLORYS/, SWOT/, and ARGO/ with specific file types, every other sample replicates this exact structure. TACO references data through GDAL Virtual File System (VSI) paths rather than HTTP URLs. VSI provides a unified file access abstraction, so the same reading code operates transparently on local filesystems, cloud object stores such as S3 or GCS, and compressed archives, with only the path prefix varying between backends. Consequently, a data loading pipeline developed for a local copy of OceanTACO functions without modification when the dataset is hosted remotely, and partial reads of large files are managed natively by the GDAL driver, eliminating the need for full downloads. TACO supports two storage modes: ZIP mode, which packages the dataset as a single archive for static distribution, and folder mode, which stores data as a directory tree on disk or cloud object storage. OceanTACO utilises folder mode, which allows the dataset to be extended with new satellite passes, reprocessed products, or additional variables by simply writing files into the directory tree and appending rows to the metadata catalog, without modifying existing components.
Access is structured in three phases (Fig. 2). The CONNECT phase loads Parquet metadata into DuckDB for lazy evaluation and presents the catalog as relational tables. The QUERY phase filters these tables by geographic extent, observation period, or data source, and materializes results as DataFrames. The FETCH phase retrieves individual files on demand through GDAL VSI handlers, which read from local paths or cloud object storage. Both the core (https://doi.org/10.57967/hf/8171, Lehmann and Aybar, 2026a) and extended (https://doi.org/10.57967/hf/8172, Lehmann and Aybar, 2026b) dataset are available on Hugging Face.
OceanTACO is designed to support reproducible analysis workflows that combine heterogeneous ocean observations, gridded products, and in situ measurements within a consistent spatiotemporal framework. The following subsections illustrate several representative workflow categories enabled by the dataset. The examples are organised into four broad categories that frequently arise in Earth system research: (i) validation using independent observations, (ii) comparisons across data processing levels, (iii) observation system experiments evaluating the contribution of individual sensors, and (iv) data-driven reconstruction workflows that integrate multiple surface variables. In addition, we include a short case study demonstrating how OceanTACO can facilitate rapid analysis of extreme ocean events. These examples illustrate reproducible usage patterns rather than provide a comprehensive scientific evaluation of the underlying datasets. Example workflows and tutorials can be accessed and recreated in Jupyter notebooks (Perez and Granger, 2015) on the dataset documentation page (https://oceantaco.readthedocs.io/en/latest/index.html, last access: 24 August 2026).
3.1 Data validation workflows
Systematic validation of gridded products against independent observations is essential for quantifying structural biases, effective resolution, and regional uncertainty characteristics. Such analyses require reproducible collocation procedures, consistent temporal matching, and transparent spatial aggregation strategies.
Because all OceanTACO components share a common temporal index and regional tiling scheme, data retrieval operations are reproducible across studies. L3 observations, L4 products, reanalysis fields, and Argo profiles can be queried under identical spatial and temporal constraints, reducing ambiguity in matching procedures and methodological variability between studies.
3.1.1 Example workflow: in situ validation of gridded SST products
As a representative application, L4 SST products and reanalysis fields are collocated with Argo profiles over a one-year period. For each Argo profile, we select the shallowest valid measurement within the upper 5 m to approximate near-surface conditions. Satellite and gridded fields are retrieved using same-day temporal matching and nearest-neighbor spatial selection at their native grid resolution. For each matchup, the bias is defined as
where Mi and Oi denote the gridded product and Argo value, respectively. Spatially aggregated bias fields are computed on a 2°×2° grid, masking cells with fewer than three observations. Seasonal and latitudinal variability is examined using monthly latitude-band averages:
where ϕ denotes latitude, t time, and nϕ,t is the number of matches in latitude band ϕ at time t. Latitude-dependent mean bias and temporal variability are calculated as
where T is the total number of monthly time steps.
Figure 5 shows the spatial bias of L4 SST fields against matched Argo observations, with latitude-band mean bias and temporal variability. Across 333 842 near-surface matchups, the gridded L4 SST product exhibits a small consistent cool bias of −0.082 K, an RMSE of 0.374 K, and a correlation of 0.999 with the Argo reference; the GLORYS reanalysis shows comparable agreement (bias +0.038 K, RMSE 0.457 K, r=0.999). The bias is spatially structured, with markedly elevated variability in the Gulf Stream region, where the standard deviation of the L4 SST bias rises to 1.03 K (and 1.48 K for GLORYS), reflecting the difficulty of resolving sharp frontal gradients in mapped products.
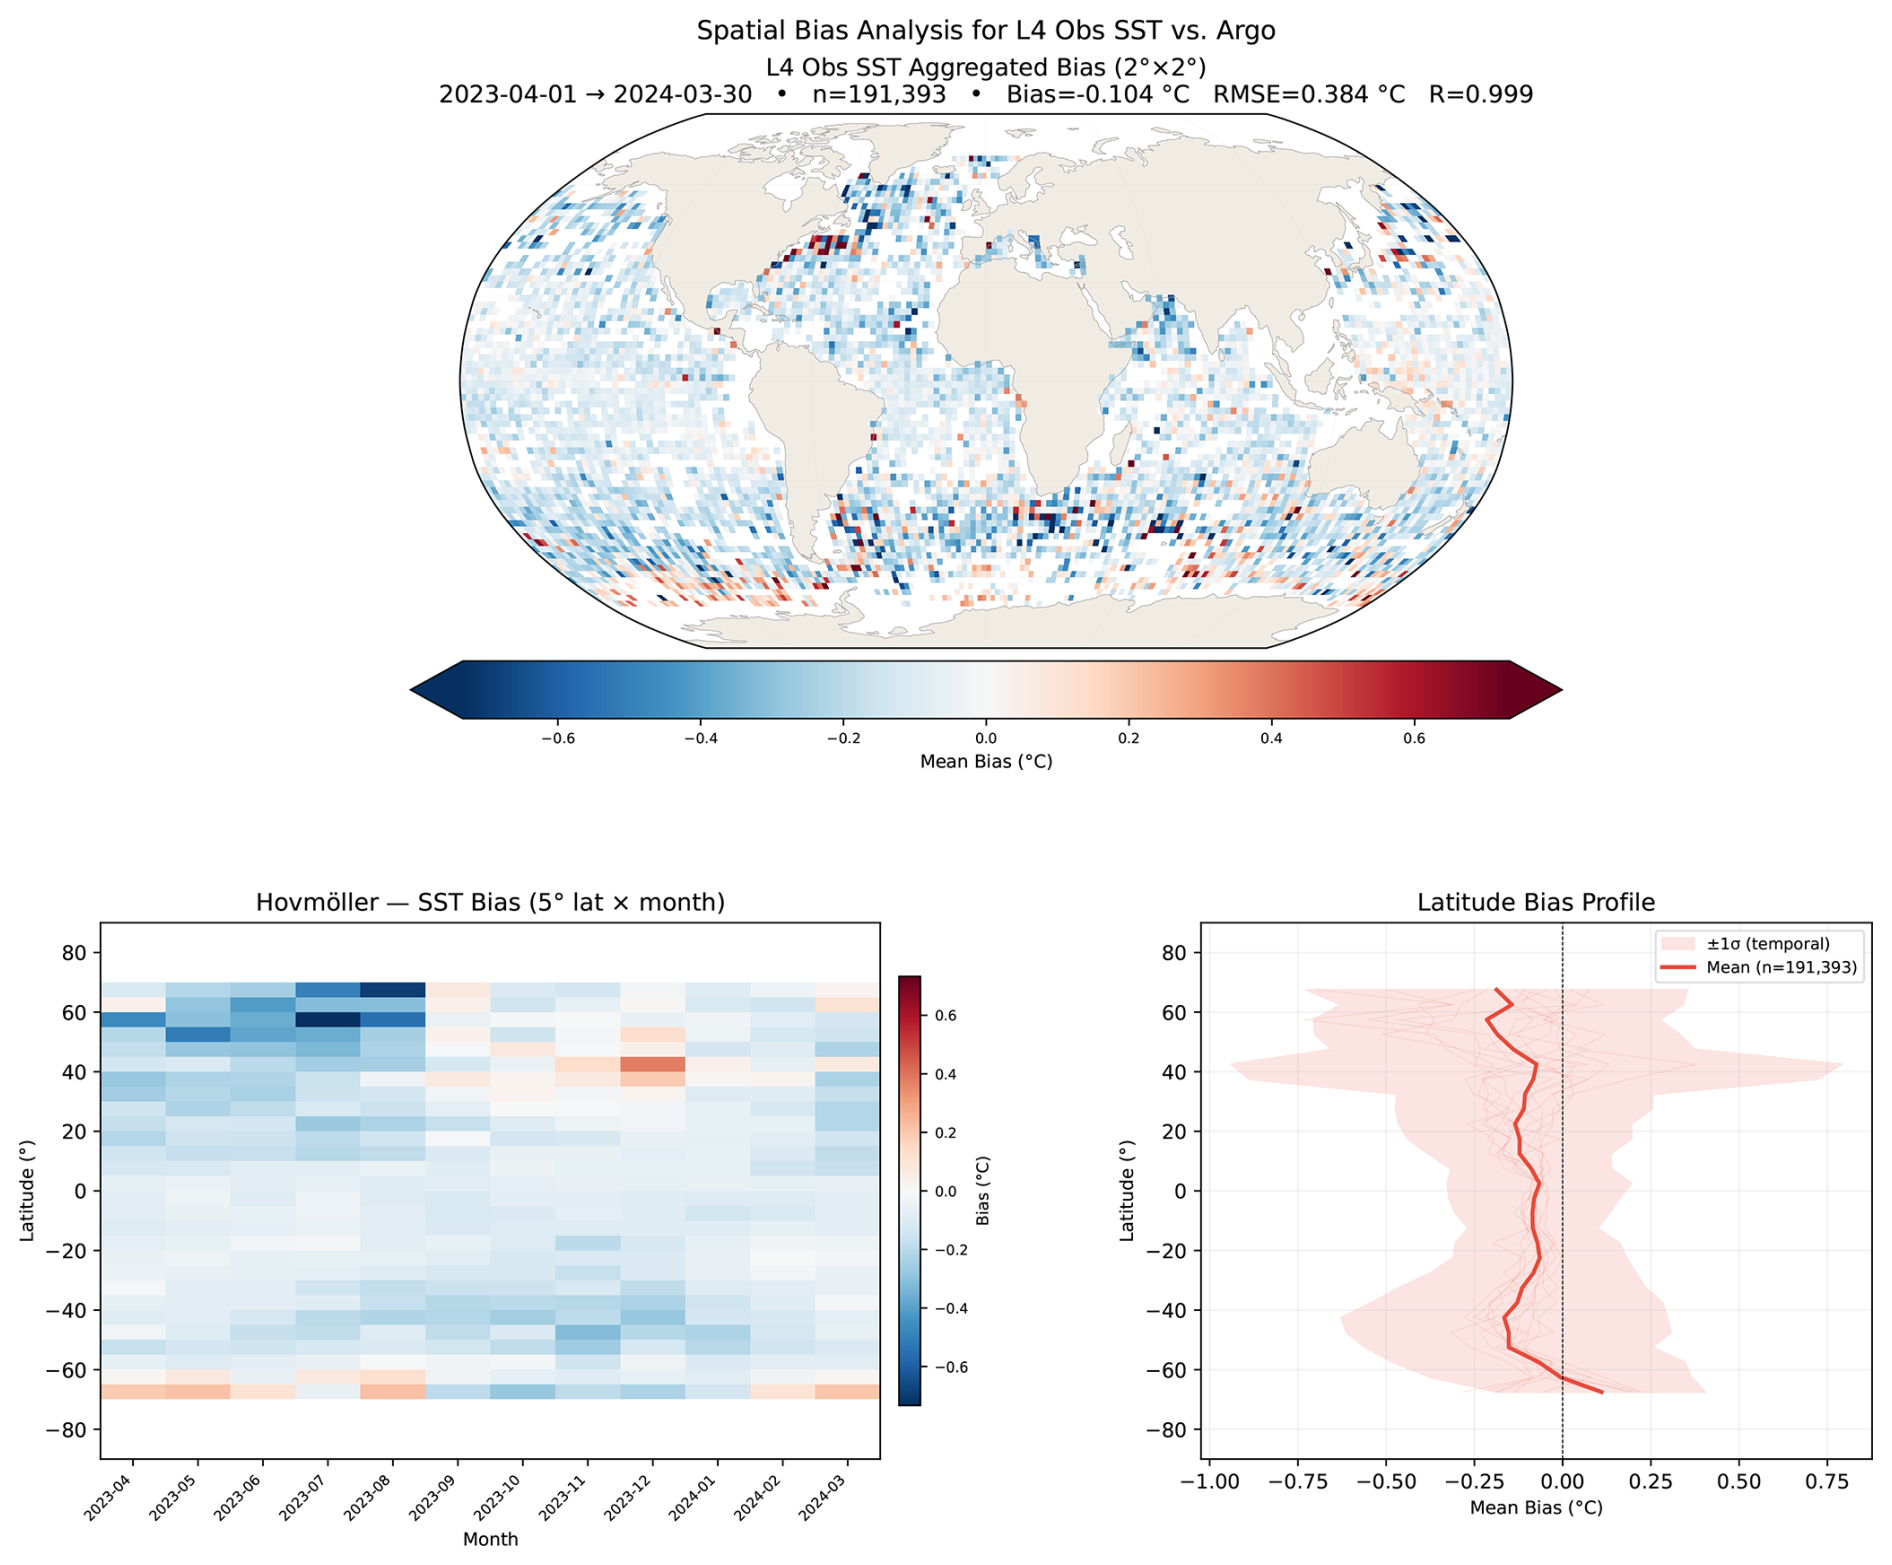
Figure 5Spatial bias of the Met Office OSTIA Level-4 SST product against co-located Argo in situ observations, computed as the mean difference (OSTIA minus Argo) on a 2°×2° grid over the period 1 April 2023 to 30 March 2024. Units are °C; the colour scale uses a diverging palette normalised to the 95th percentile of absolute bias to highlight spatial structure while limiting the influence of outliers.
3.2 Analyses across processing levels
OceanTACO preserves the native sampling geometry and spatial resolution of each product, enabling controlled comparisons across processing levels without introducing additional harmonisation artifacts. Such comparisons are particularly useful when evaluating differences between L3 observations, which retain native measurement characteristics, and L4 mapped or assimilated products, which introduce spatial smoothing and model-based constraints.
As a representative workflow, OceanTACO enables computation of wavenumber power spectral density (PSD) diagnostics across processing levels. A robust cross-level comparison requires that the spectra be evaluated over identical spatial sampling; otherwise differences in ground-track geometry, coverage, and segment length introduce artifacts that are easily mistaken for resolution differences. OceanTACO makes this matching straightforward: for dynamically active regions such as the Gulf Stream (80–40° W, 25–45° N) or the Kuroshio Current (130–160° E, 25–45° N), users compute the L3 SWOT spectrum from its native 2 km observations and bilinearly sample the L4 DUACS mapped field at the identical SWOT track positions, so both spectra share the same along-track segments. Figure 6 illustrates this matched comparison produced using OceanTACO from 1 March to 29 May 2025. The comparison is intended as an illustrative diagnostic rather than a comprehensive spectral analysis.
Because the two products are sampled along common track segments, their spectra coincide at large scales (≳100–150 km), where both resolve the dominant geostrophic signal, and diverge only toward shorter wavelengths. There, the optimal-interpolation mapping underlying the L4 product suppresses mesoscale and submesoscale variance, whereas the denoised L3 SWOT observations retain substantially more energy down to a few tens of kilometers, before the spectrum flattens near the effective-resolution limit of the L3 product. The separation over roughly 30 to 150 km isolates the genuine effective-resolution difference between an L3 observation product and an L4 mapped product, rather than a sampling artifact. Independent analyses similarly indicate that SWOT observations resolve ocean variability at spatial scales on the order of tens of kilometers, a substantial improvement over the effective resolution of mapped altimetry products (Krishna and Sreejith, 2025; Wang et al., 2025; Ballarotta et al., 2019).
This example illustrates how OceanTACO enables reproducible cross-product comparisons under identical spatiotemporal constraints. Such workflows are increasingly relevant in the SWOT era for evaluating scale-dependent variance and interpreting differences between observation-level measurements and mapped products, and apply equally to other eddy-rich regions such as the Antarctic Circumpolar Current in the Southern Ocean.
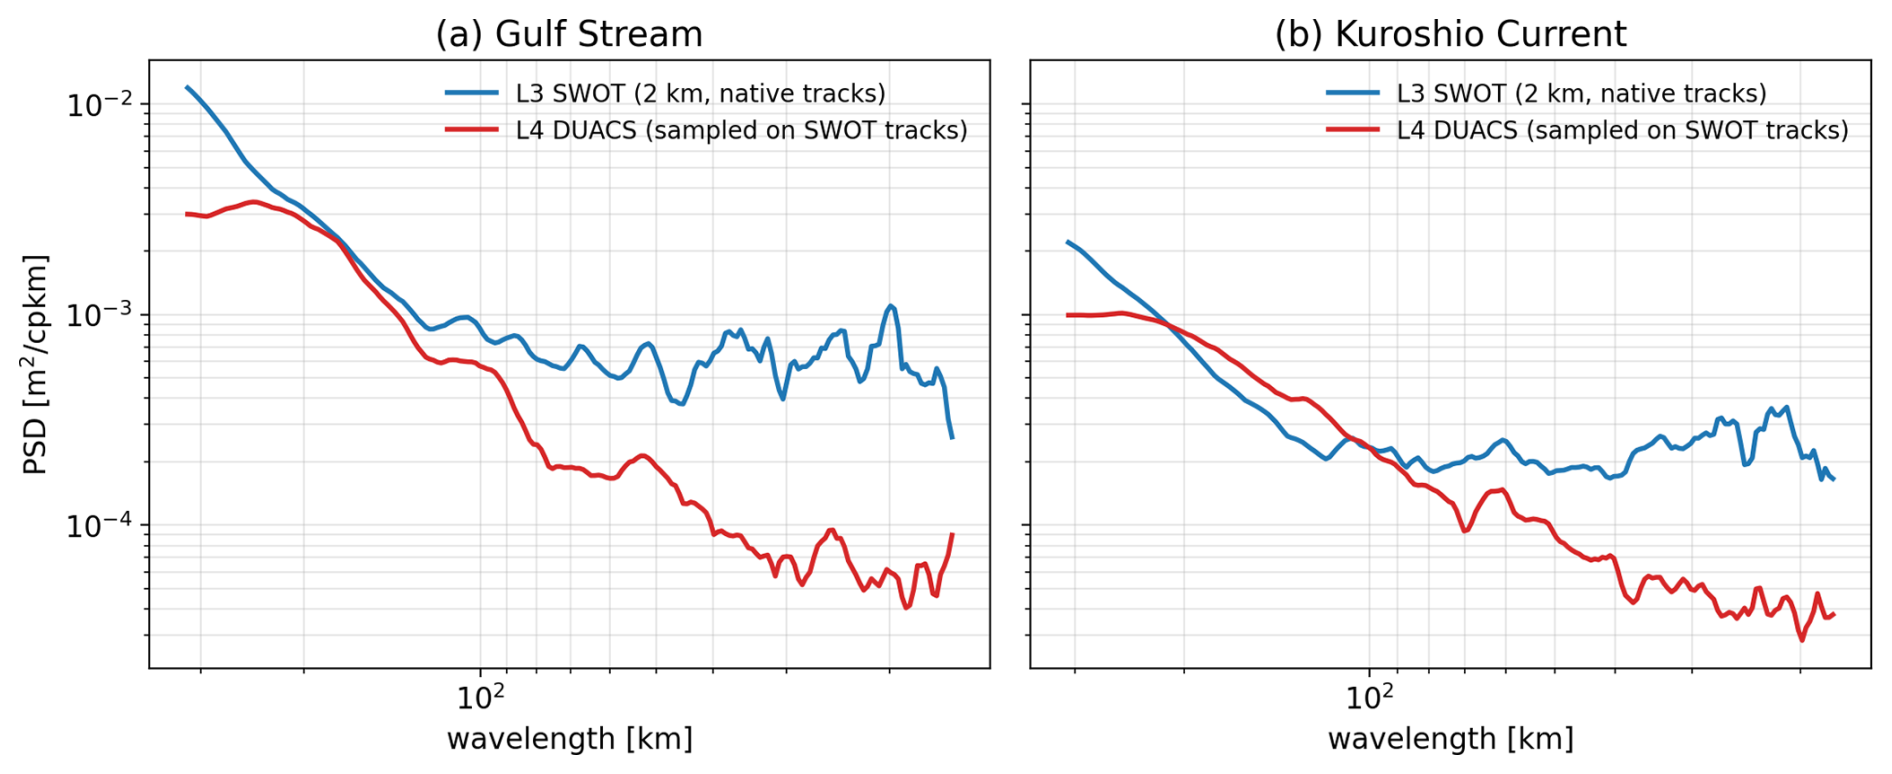
Figure 6Wavenumber power spectral density (PSD) of sea surface height for the Gulf Stream (a) and Kuroshio Current (b) regions. To ensure a fair comparison, both products are evaluated along the same SWOT ground-track segments: the L3 SWOT spectrum is computed from its native 2 km observations, and the L4 DUACS mapped field is bilinearly sampled at the identical track positions. Spectra are accumulated over daily passes from 1 March to 29 May 2025. The curves coincide at large scales (∼100–150 km) and diverge toward shorter wavelengths: the L4 spectrum rolls off steeply as the optimal-interpolation mapping suppresses small-scale variance, whereas the denoised L3 SWOT spectrum retains substantially more energy down to a few tens of kilometers before flattening near the effective-resolution limit of the L3 product.
Beyond comparisons across processing levels, many studies seek to quantify the contribution of individual observing systems to reconstructed ocean fields.
3.3 Observation system experiments and mission impact studies
The introduction of new observing systems, such as the Surface Water and Ocean Topography (SWOT) mission, enables new assessments of their incremental contribution relative to established nadir altimetry and assimilated products. Early SWOT analyses emphasise its capability to resolve fine-scale ocean variability and improve characterization of mesoscale and submesoscale dynamics relative to nadir altimetry, while also highlighting the need for careful cross-comparison with existing mapping systems and climate data records (Ballarotta et al., 2025; Fouchet et al., 2025; Archer et al., 2025).
Observation system experiments (OSEs) and mission impact studies are therefore essential for studying how new sensors improve resolved spatial scales, dynamical consistency and downstream reconstruction performance. These studies typically require selective inclusion or exclusion of specific sensors, consistent regional subsetting, and reproducible definition of validation datasets across multiple processing levels.
OceanTACO preserves mission identifiers and full product provenance within a unified indexing framework. Researchers can configure controlled experiments that isolate nadir-only configurations, incorporate wide-swath SWOT observations, or evaluate L4 fields with and without specific observational inputs. The per-mission temporal coverage that determines which sensors are available for a given experiment is documented in Table A2, and the matched SWOT-versus-mapped spectral comparison in Sect. 3.2 (Fig. 6) already illustrates the kind of resolved-scale diagnostic that such configurations support. Because these configurations are defined through explicit spatiotemporal queries rather than bespoke preprocessing pipelines, mission impact assessments can be reproduced consistently across regions and time periods. Because the eight-region partition is a storage-and-retrieval optimisation rather than an analysis unit, experiments are defined on arbitrary user-specified bounding boxes at each product's native resolution, so subregional and fine-scale phenomena remain fully accessible.
3.4 Extreme events: case study of Hurricane Milton
In addition to structured workflow categories such as validation or observation system experiments, OceanTACO can facilitate rapid exploratory analyses of individual oceanographic events. The common temporal index means multi-sensor data of any event can be retrieved with a single spatiotemporal query. As an illustrative example, we examine sea surface height variability during Hurricane Milton, a major hurricane that occurred in the Gulf of Mexico during October 2024.
Satellite altimetry has been widely used to investigate extreme sea-level events, including storm surges, by measuring sea surface height (SSH) anomalies along satellite ground tracks. Previous studies have used along-track altimetry to detect and analyse storm surges across large ocean regions (Ji et al., 2019; Li et al., 2018). However, the narrow sampling geometry of traditional nadir altimeters limits their ability to resolve the full spatial structure of these events (Abdalla et al., 2021). The wide-swath measurements from the SWOT mission provide two-dimensional SSH fields at high spatial resolution, enabling more detailed observation of the spatial variability associated with extreme sea-level signals (Srinivasan and Tsontos, 2023).
Vega-Gimenez et al. (2025) used SWOT observations to examine SSH anomalies during Hurricane Milton, one of the strongest and most destructive hurricanes recorded in the Gulf of Mexico, which subsequently tracked across central Florida into the Atlantic Ocean (Smith, 2025). Figure 7 shows snapshots of L3 Altimetry and SWOT data, as well as L4 wind data along the hurricane track. On 9 October 2024, SWOT directly overpassed the hurricane eye, allowing Vega-Gimenez et al. (2025) to analyse the spatial structure of the observed anomaly. Figure 8 presents a cross-product comparison and correlations between SWOT and conventional altimetry with the L4 DUACS product. For each L3 observation within the domain, the collocated L4 DUACS value was obtained by bilinear interpolation of the gridded field onto the along-track measurement position, and Pearson correlation coefficients and root-mean-square errors were computed over all valid collocation pairs.
While the previous examples focus on observational analysis and product intercomparison, an increasing number of Earth system studies rely on data-driven models that learn relationships between multiple surface variables. These approaches require consistent collocation of heterogeneous datasets across space and time, which can be technically challenging when data originate from independent archives. OceanTACO directly supports such workflows by providing aligned multi-variable samples across observations, gridded products, and reanalysis fields.
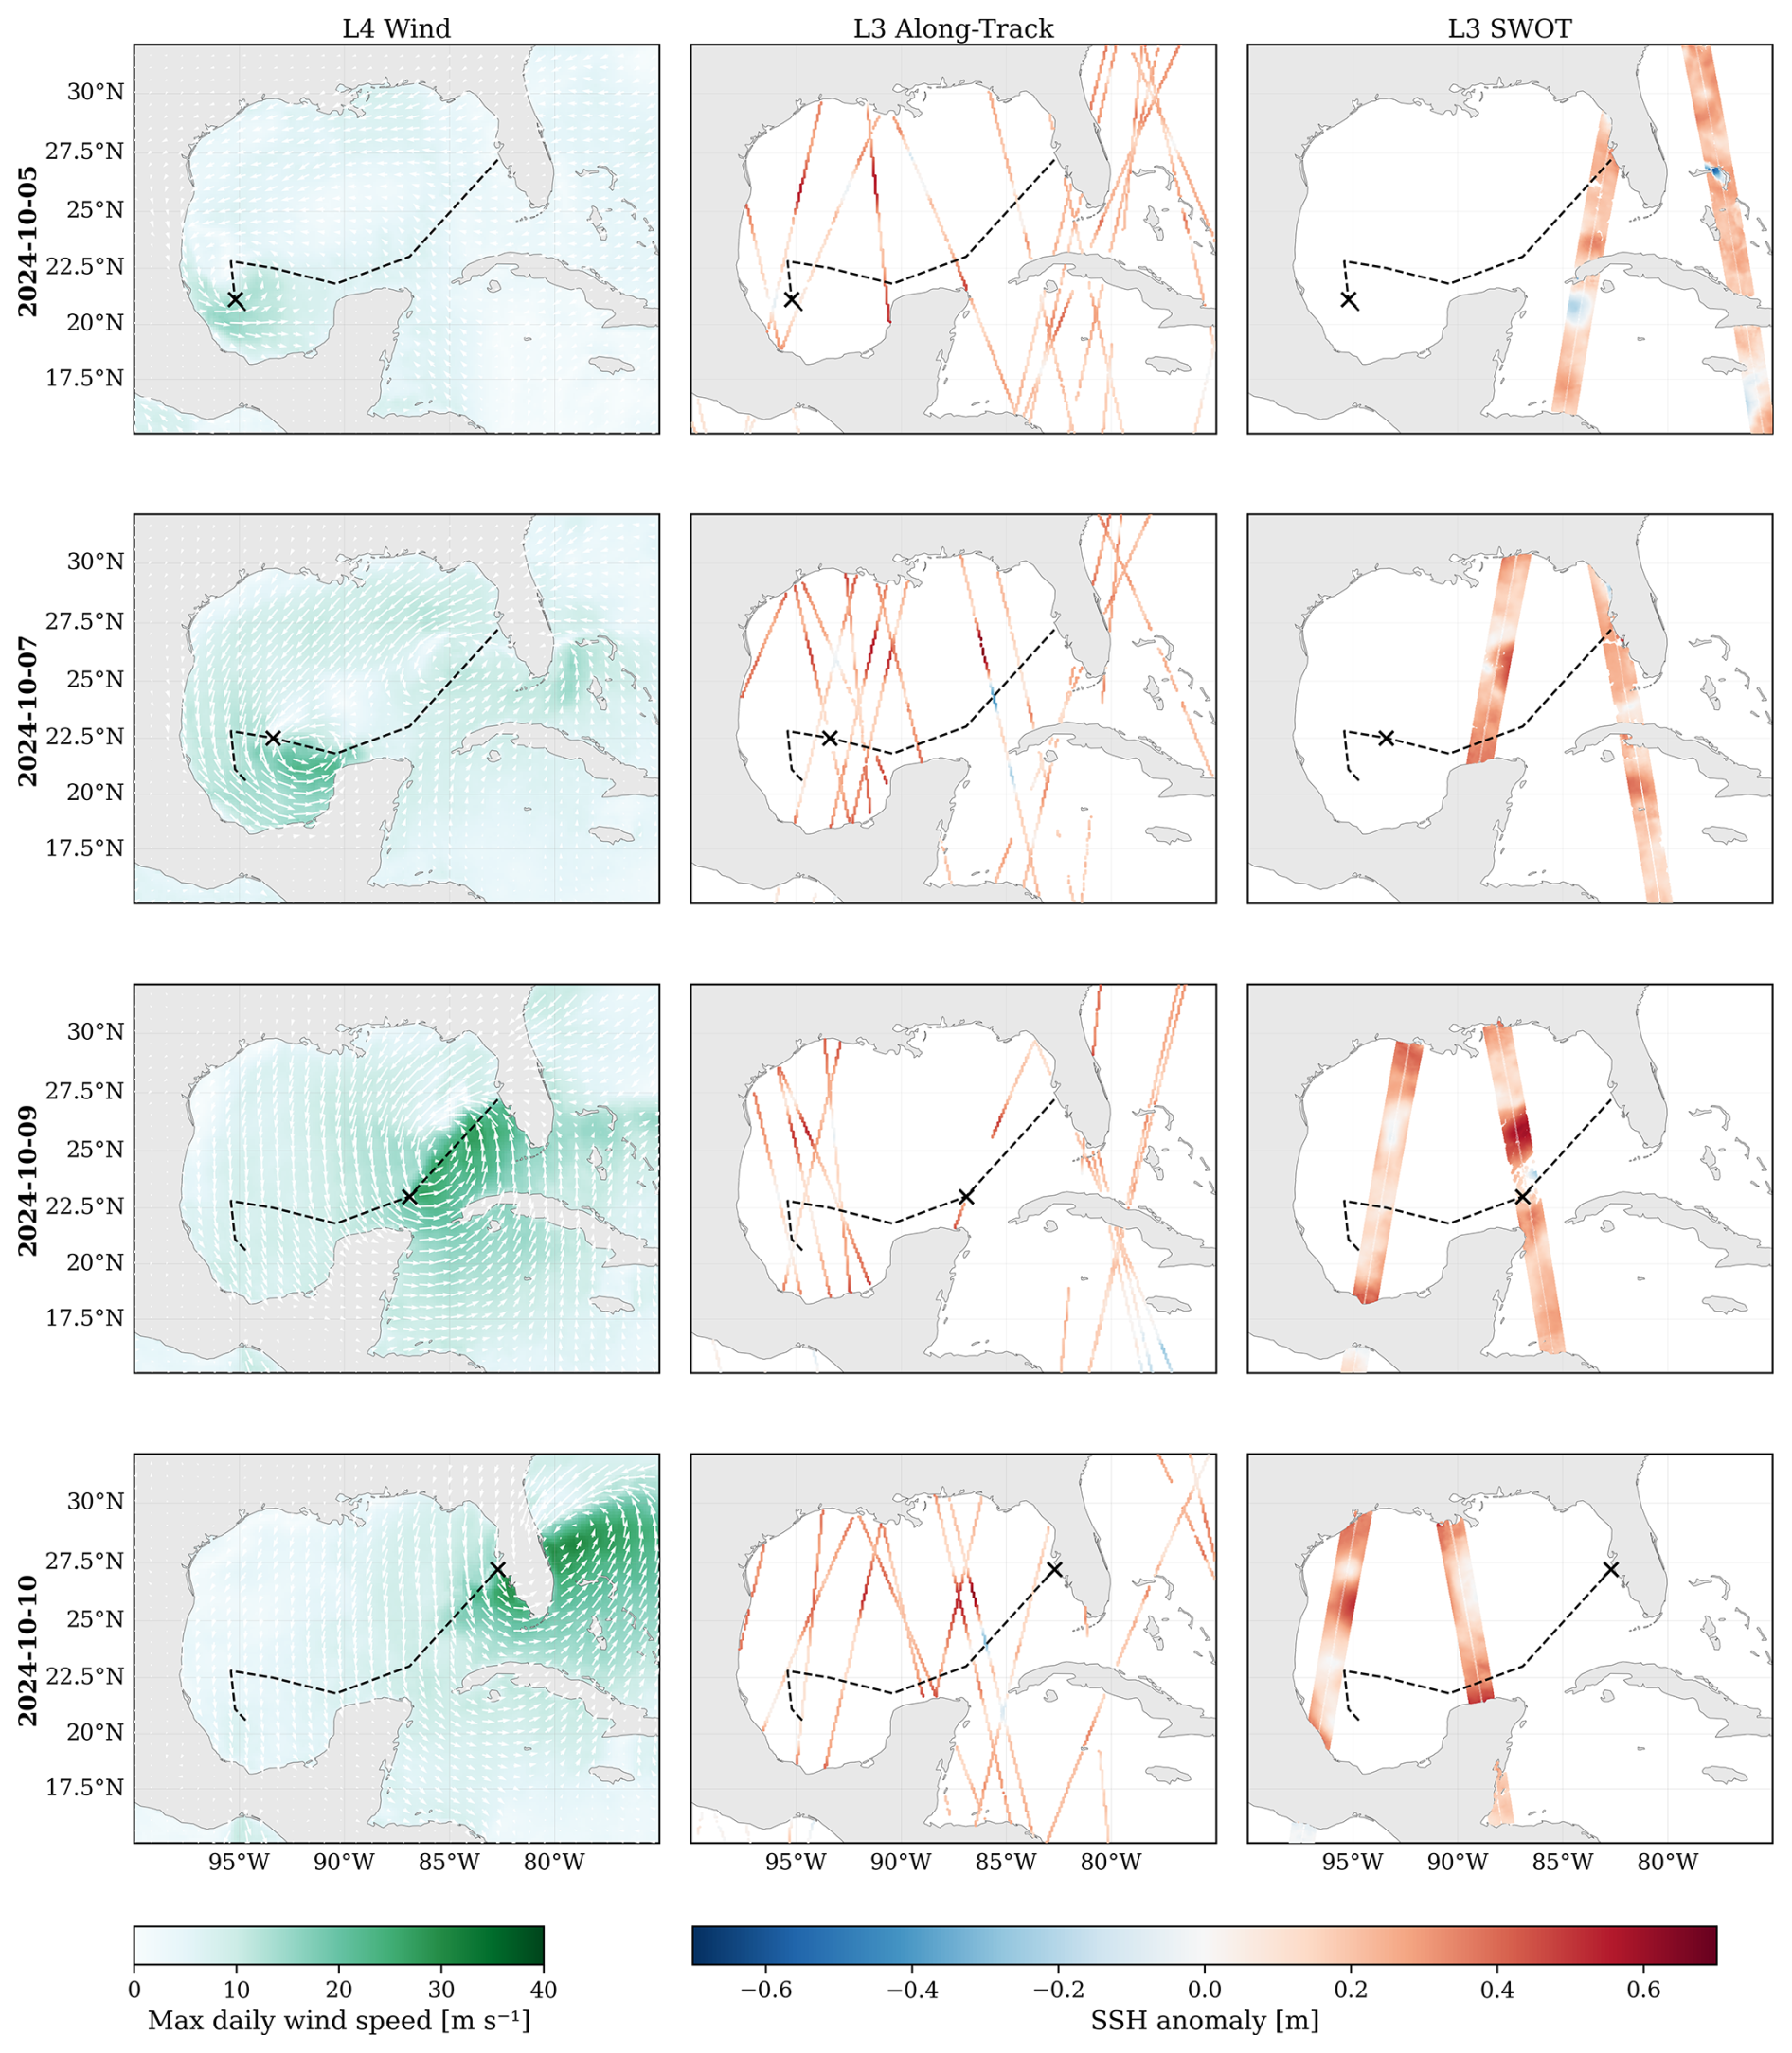
Figure 7SSH anomaly snapshots during Hurricane Milton (Gulf of Mexico, 100–75° W, 15–32° N) for four dates between 5–10 October 2024. Columns show the gridded L4 Wind product with wind direction components and maximum daily wind speed, L3 conventional along-track altimetry (7 km), and L3 SWOT wide-swath observations (2 km). The dashed line and cross marker indicate the IBTrACS (Knapp et al., 2010) best-track hurricane path and the daily eye position, respectively. Example code that produces this figure is available in this notebook (https://oceantaco.readthedocs.io/en/latest/tutorials/plot_hurricane_milton.html, last access: 24 August 2026).
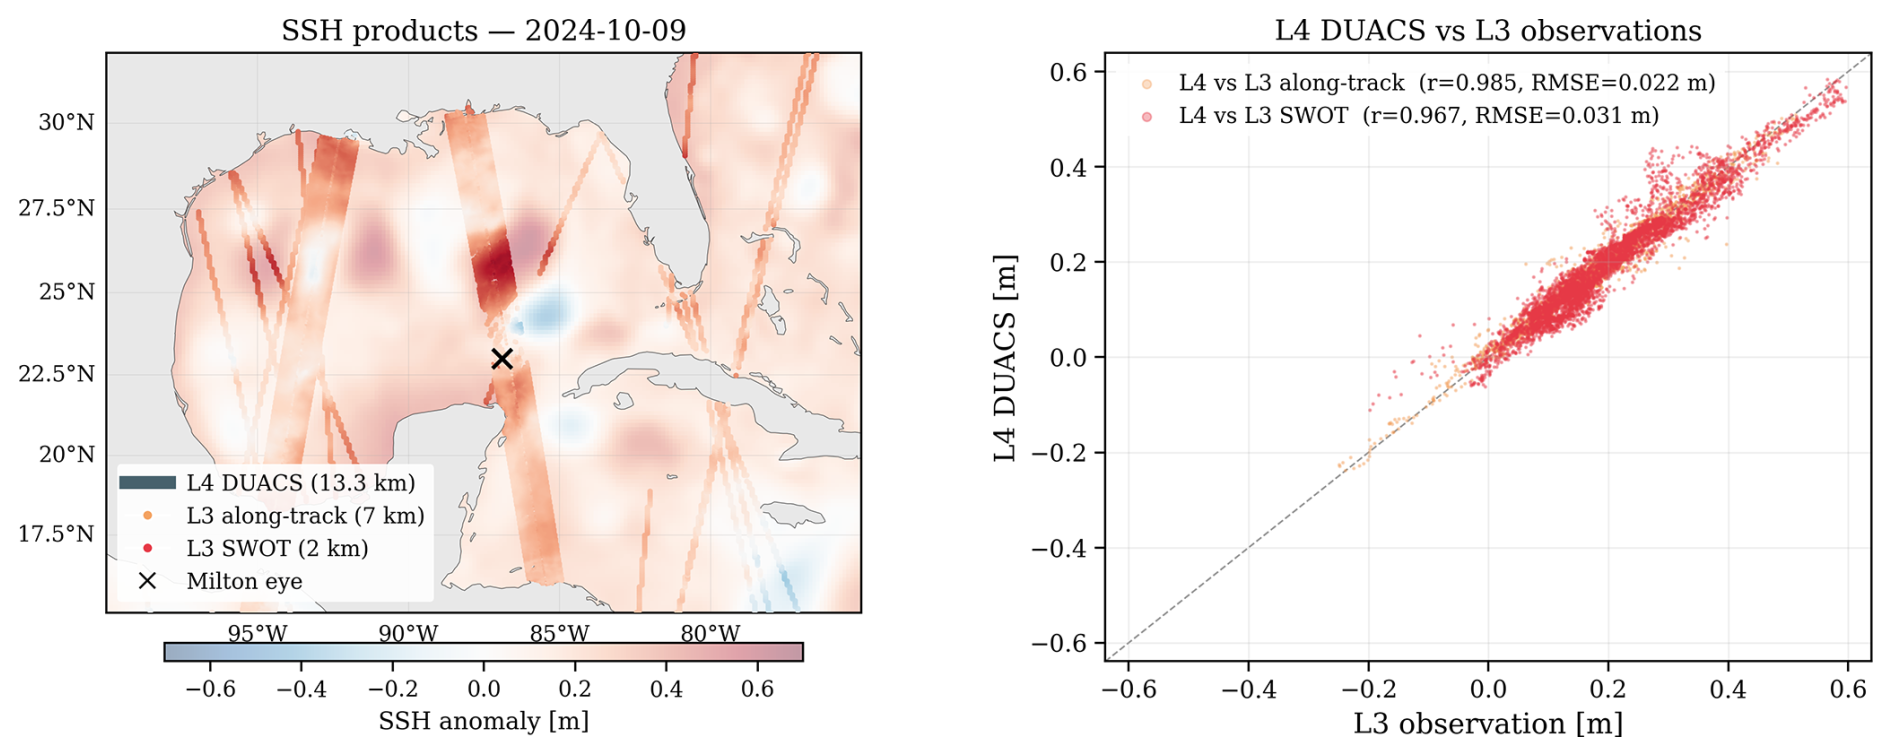
Figure 8Cross-product SSH comparison over the Gulf of Mexico on 9 October 2024, when SWOT passed directly over the Hurricane Milton eye. Left: L4 DUACS field (semi-transparent background) with L3 along-track and L3 SWOT observations overlaid; the cross marks the hurricane eye position. Right: Collocated scatter of L3 observations (m) against the bilinearly interpolated L4 DUACS value (m) at each valid measurement location; Pearson R and RMSE are computed over all collocation pairs.
3.5 Data-driven and machine learning reconstruction workflows
Reconstruction of spatially complete ocean surface fields from sparse and irregular observations is a core challenge in Earth system science. For sea surface height (SSH), operational optimal interpolation approaches provide global coverage but may not capture mesoscale variability and reduce effective resolution below that of the observational inputs (Taburet et al., 2019; Ballarotta et al., 2019). In response, a range of learning-based methods has been developed to improve spatiotemporal reconstruction skill: supervised networks that fuse multiple satellite variables into improved gridded SSH (Martin et al., 2023; Archambault et al., 2024), end-to-end learned variational assimilation schemes for nadir and wide-swath altimetry (Beauchamp et al., 2023), dynamically constrained joint reconstruction of SSH and temperature from multi-sensor observations (Le Guillou et al., 2025), generative assimilation of multi-modal satellite observations (Martin et al., 2025), and unsupervised spatio-temporal interpolation of altimetry maps (Archambault et al., 2023).
Similar developments have emerged for other ocean surface variables. Deep learning approaches have demonstrated improved gap filling and super-resolution for sea surface temperature (Fanelli et al., 2024; Zou et al., 2023; Zhao et al., 2025), while analogous strategies have been proposed for sea surface salinity (Liang et al., 2025). These approaches increasingly rely on multi-variable learning, where relationships between ocean surface variables provide additional constraints for reconstruction and forecasting. However, building such datasets requires coordinated access to heterogeneous observations and gridded products that must be consistently collocated in space and time.
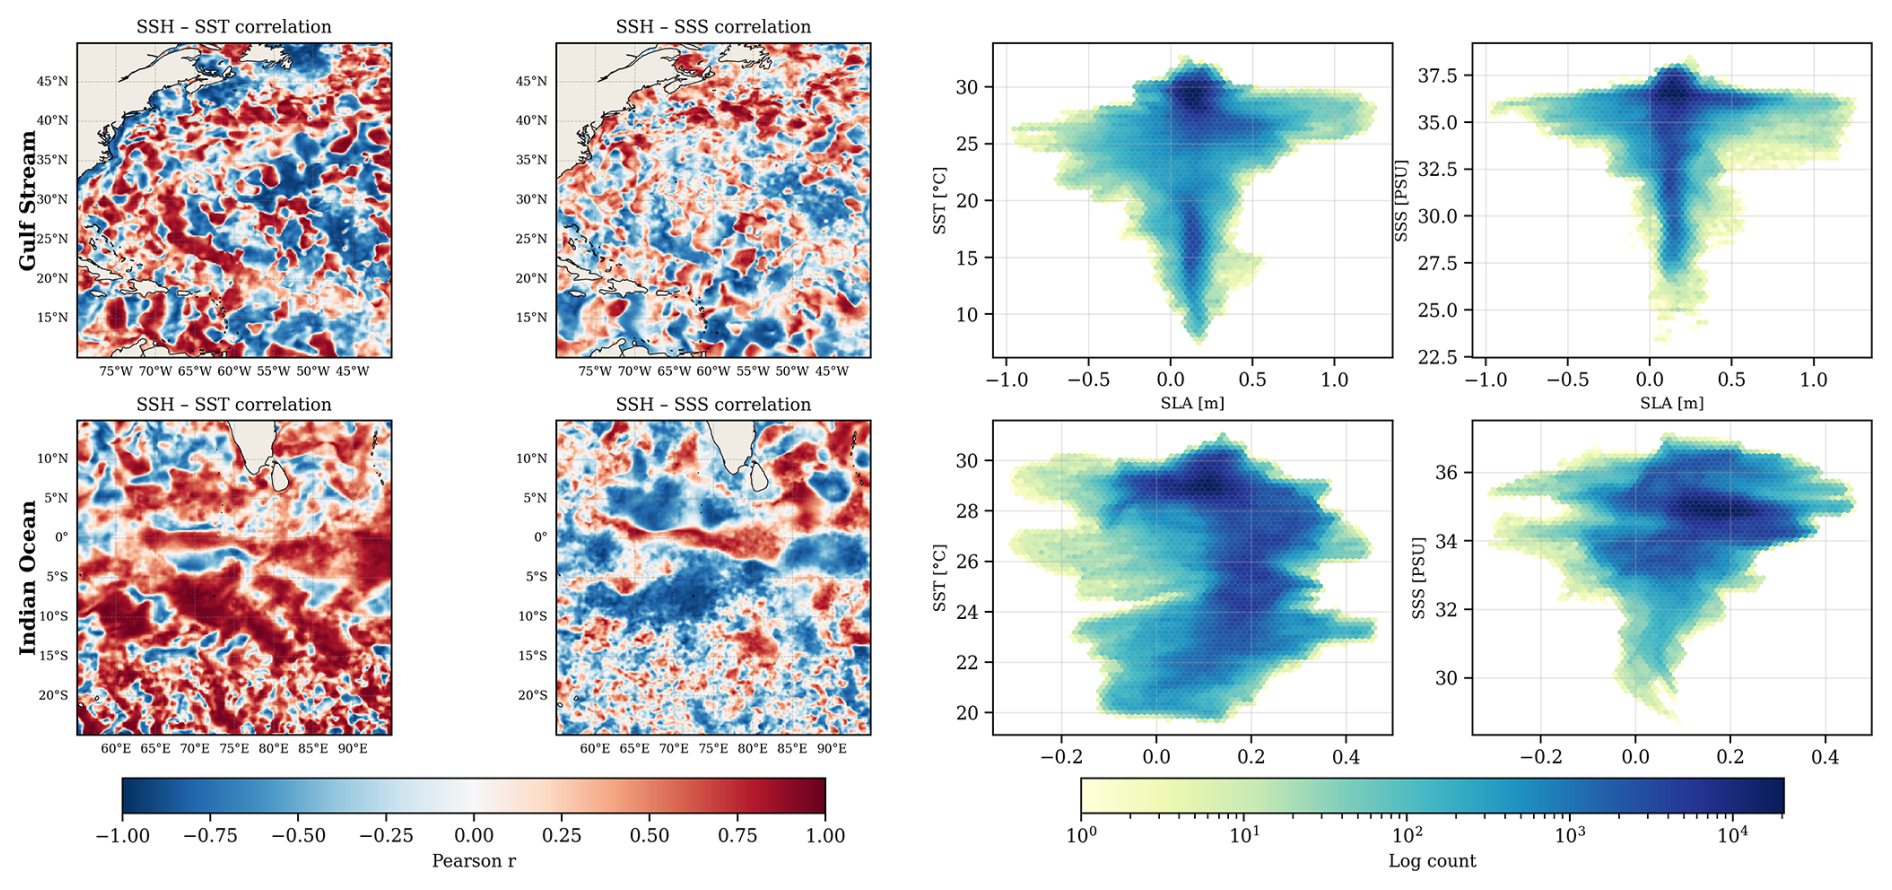
Figure 9Pixel-wise Pearson correlation between Level 4 SSH anomaly (SLA; m) and sea surface temperature (SST, °C; columns 1 and 3) and sea surface salinity (SSS, PSU; columns 2 and 4) over the Gulf Stream (top row) and North Indian Ocean (bottom row), computed from daily L4 DUACS, OSTIA, and CMEMS SSS fields over all 30 d of September 2023. Correlation maps use a diverging colour scale centred at zero. SST and SSS grids were interpolated to the SSH grid prior to computing per-pixel correlations. Scatter panels show the full distribution of daily SLA–SST and SLA–SSS pairs at all valid pixels, displayed as log-scaled density plots.
OceanTACO directly supports such analyses by enabling consistent retrieval of L3 observations (e.g., nadir altimetry, SWOT, SST, and SSS), L4 gridded products, reanalysis fields, and in situ measurements under identical spatial and temporal constraints. As an illustrative example, Fig. 9 shows the spatial correlation between L4 SSH and both SST and SSS in two dynamically distinct regions: the Gulf Stream and the North Indian Ocean. The analysis, performed for September 2023, highlights strong spatial variability and region-dependent relationships between surface variables. Such nonlinear and spatially heterogeneous coupling suggests that data-driven approaches are well suited to exploiting correlated information in reconstruction tasks.
Beyond exploratory analysis, OceanTACO also supports the generation of machine learning–ready training and evaluation datasets. Based on the same spatiotemporal queries used in the correlation analysis, the accompanying documentation (https://oceantaco.readthedocs.io/en/latest/tutorials/ml_dataset.html, last access: 24 August 2026) demonstrates how OceanTACO can be used to retrieve aligned multi-variable samples and construct PyTorch (Paszke et al., 2019) dataloaders for model training. Because input-target configurations are defined through the spatiotemporal queries used throughout the collection, training and evaluation schemes of data-driven reconstruction experiments become more reproducible.
The complete code to generate the dataset and all included figures can be found at https://github.com/nilsleh/oceanTACO (last access: 24 August 2026). Additionally, we provided a documentation page at https://oceantaco.readthedocs.io/en/latest/index.html (last access: 24 August 2026), with installation instructions, dataset descriptions and tutorial notebooks for mentioned workflows. The core dataset is hosted on Hugging Face with DOI https://doi.org/10.57967/hf/8171 (Lehmann and Aybar, 2026a) and released under CC-BY-4.0 License with complete license information in the dataset card. The extended dataset version is also available on Hugging Face under the same license with DOI https://doi.org/10.57967/hf/8172 (Lehmann and Aybar, 2026b).
We have presented OceanTACO, a harmonised global collection of sea surface state datasets structured under the TACO specification. The dataset integrates L3 observations, L4 gridded products, reanalysis fields, and in situ Argo profiles within a unified spatiotemporal indexing and storage framework while preserving native sampling characteristics and full data provenance.
OceanTACO addresses a persistent challenge in Earth system research: the technical fragmentation of multi-sensor ocean datasets across independent archives, formats, and preprocessing conventions. Its contribution is not a new regridding or compression algorithm, but a harmonised, sample-invariant organisation that makes multi-product analyses deterministic without product-specific restructuring. This supports validation studies, scale-dependent diagnostics, observation system experiments, and multivariate surface state investigations across dynamically diverse ocean regions.
The core dataset spans the SWOT calibration and science phase from 29 March 2023 until 1 August 2025. For longer analyses we additionally provide an extended pre-SWOT segment beginning on 1 January 2015, the year SMAP joins the optimal interpolation behind the multi-observation salinity product and from which the sensor constellation underlying the collection stays constant. The record remains backward extensible through the same folder-mode organisation and processing pipeline, so additional time periods, reprocessed products, and future satellite missions can be incorporated without restructuring existing components. By combining harmonised data organisation with cloud-native access mechanisms, OceanTACO provides a structured analytical foundation for reproducible ocean surface research within the broader Earth system context.
A1 Data variables
(Lellouche et al., 2021)(Taburet et al., 2019)(Met Office, 2025)(Copernicus Marine Service, 2025e)(Copernicus Marine Service, 2025g)(Copernicus Marine Service, 2025a)(AVISO/DUACS, 2024)(Copernicus Marine Service, 2025f)(Copernicus Marine Service, 2025b)(Wong et al., 2020)Table A1OceanTACO full variable dictionary across Core and Extended releases. Time coverage is 1 January 2015 to 1 August 2025 (Extended: 1 January 2015 to 29 March 2023; Core: 29 March 2023 to 1 August 2025). Only the Core dataset includes L3-SWOT data. All datasets are time-stamped. Time is stored as coordinate metadata and is not listed as a data variable. The Temporal column lists the cadence stored in OceanTACO (L4 wind is resampled from native hourly to daily); the Depth column indicates vertical coverage (GLORYS is a surface subset with currents at 15 m; Argo retains full 0–2000 m profiles; all other sources are surface). Units follow NetCDF/CF metadata as stored in the files.
A2 L3 SSH mission temporal coverage
Table A2Comparison of mission temporal coverage between reprocessed (MY_008_062) and near-real-time (NRT_008_044) sea level products.
A3 Disk space compression
For all processed region files we choose one of the primary variables stored as int16 with zlib compression (level 4) applied via the NetCDF4/HDF5 layer. To quantify the resulting storage savings we compared, for each data source, (i) the uncompressed baseline size against (ii) the actual on-disk compressed size, measured directly from the HDF5 chunk storage via h5py's get_storage_size(). For gridded L4 products and GLORYS, the uncompressed baseline is the size of the raw source files read at their native floating-point precision (dtype.itemsize × number of elements); for the along-track swath products L3 SWOT and L3 SSH, whose raw files are individual track files, we choose a conservative float32 estimate (4 bytes per element). Sizes were accumulated over all eight ocean regions and the core dataset period, then averaged per day. Sizes are reported for the primary variable of each modality; modalities with multiple stored variables (e.g., GLORYS: SSH, SST, SSS, uo, vo; L4 Wind: eastward and northward components plus standard deviations) have correspondingly larger per-day footprints in the full dataset.
Table A3Per-modality storage footprint of the OceanTACO dataset. For each data source the table lists the primary variable stored, the average daily uncompressed size, the average daily on-disk size after numerical encoding (scaled int16 for the dense gridded fields, full float32 for the sparse L3 along-track and SWOT products) and lossless zlib compression, and the resulting compression ratio. Sizes are averaged over the full dataset period across all eight ocean regions. The TOTAL row sums compressed sizes for the listed primary variables only; the full dataset footprint (all variables per modality) is approximately 311 GB for the combined core and 581 GB for the extended periods.
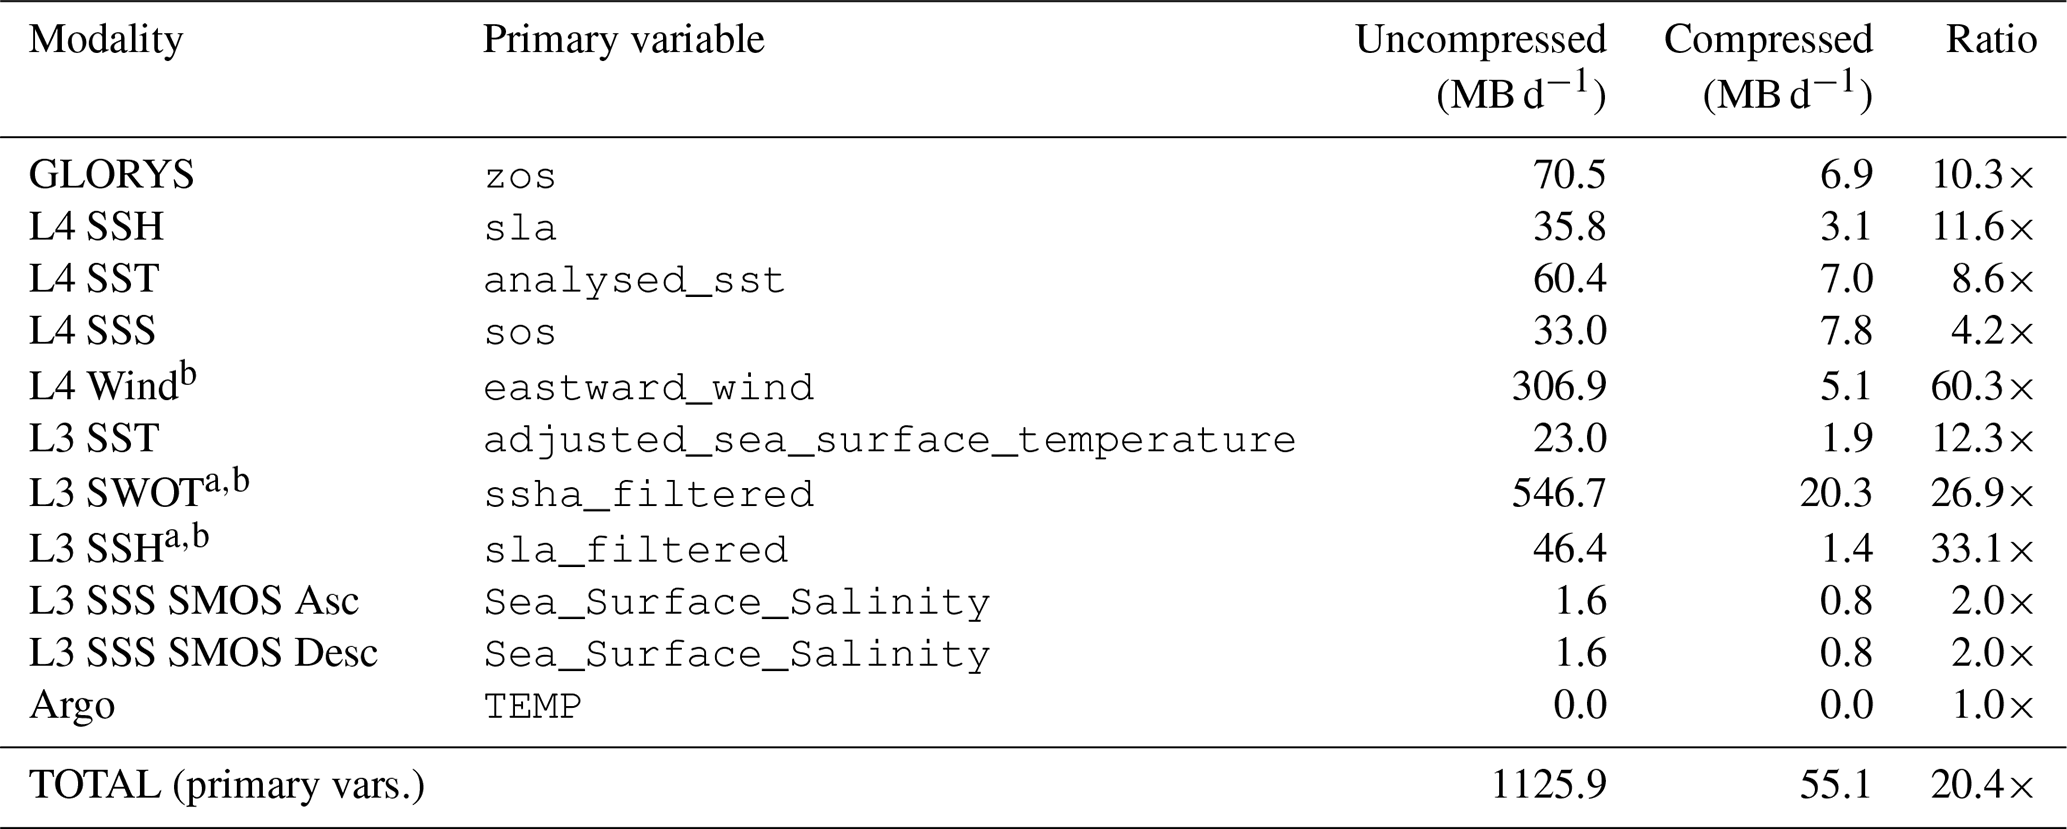
a Uncompressed size estimated as float32 (4 bytes per element) because raw L3 SWOT and L3 SSH source files contain overlapping swath segments that are not directly comparable to the gridded region files. All other modalities use the actual raw-file size at native floating-point precision (dtype.itemsize × number of elements). b The ratio includes product restructuring in addition to numerical encoding: temporal aggregation from native hourly to daily fields for L4 Wind, and consolidation of many individual native track files into a single regridded product for L3 SWOT and L3 SSH.
Across all ten data sources the OceanTACO format achieves an overall compression ratio of 20.4×. Individual ratios range from 2.0× for the sparse L3 SSS SMOS ascending/descending passes to 60.3× for L4 Wind, which contains large homogeneous low-wind regions that compress extremely well. Gridded L4 SSH, L4 SST, and GLORYS records yield ratios of 8.6–11.6×, while the along-track SWOT and L3 SSH products achieve 26.9× and 33.1×, respectively, owing to the prevalence of fill values outside the narrow swath. The full per-source breakdown is given in Table A3.
Table A4Compression-loss statistics for the int16+zlib encoded data sources. Errors are computed against a pre-encoding regional reference produced by the same formatting pipeline; for the swath-based L3 SSS product, source swaths are conservatively binned to the target grid (no smoothing) and compared on overlapping valid cells only. The sparse L3 along-track and L3 SWOT products are retained at full float32 precision, and the L3 SST product is delivered natively as scaled int16 (step 0.001 °C) and preserved without additional re-encoding; these products therefore incur no lossy-encoding error beyond their source representation and are not listed here. Values report mean ± SD across all dates and ocean regions. RMSE/field SD denotes the compression RMSE divided by the spatial standard deviation of the reference field, indicating the compression error relative to the natural variability of each variable.
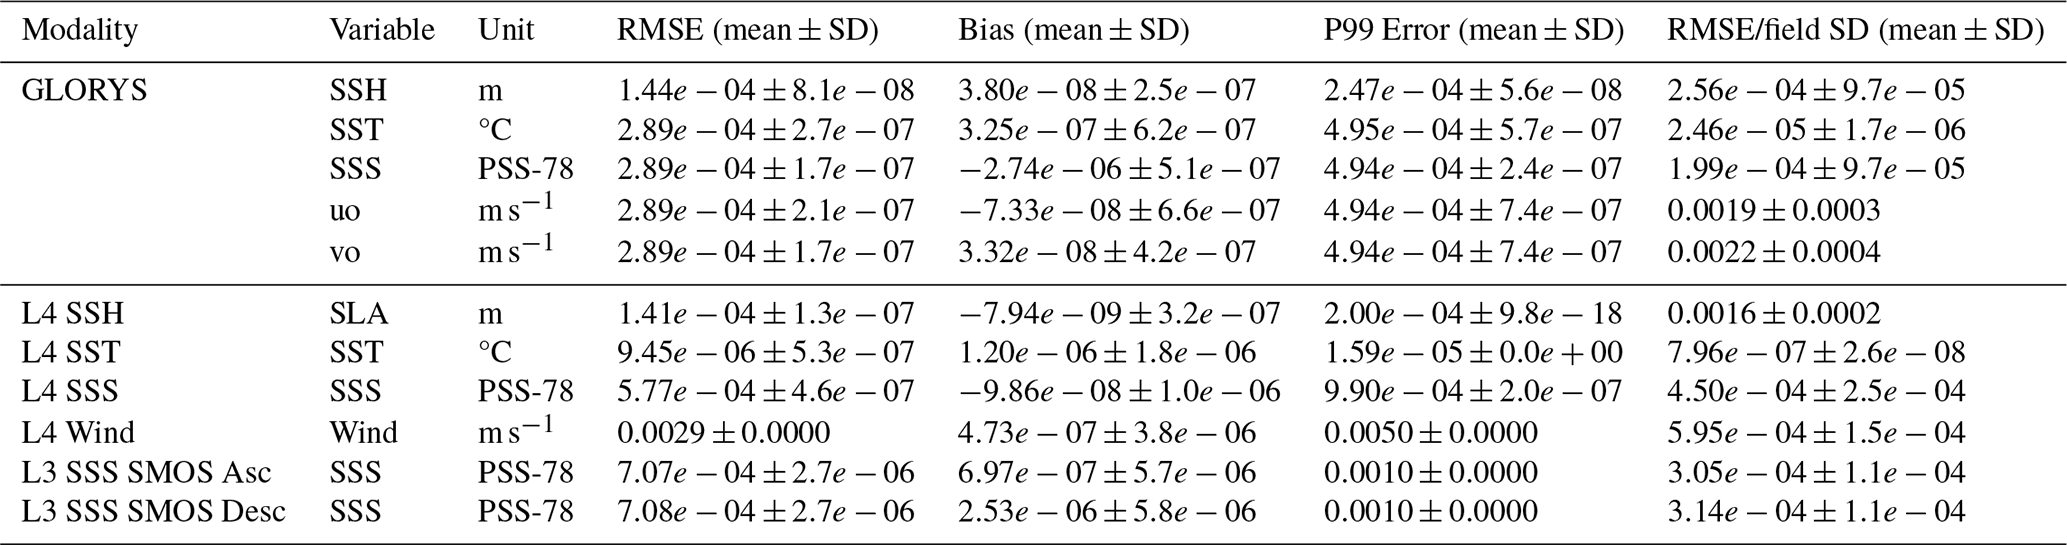
Table A5Benchmark comparison of the deployed OceanTACO encoding against the best passing codec from a ClimateBenchPress-style strict-bound evaluation for the five gridded products. Compression ratios are reported as raw bytes divided by encoded bytes. This benchmark is distinct from Table A3, which describes the released OceanTACO archive and may also reflect product restructuring effects such as temporal aggregation. For L4 SST, the benchmark configuration respects the native int16 quantization of the source product.
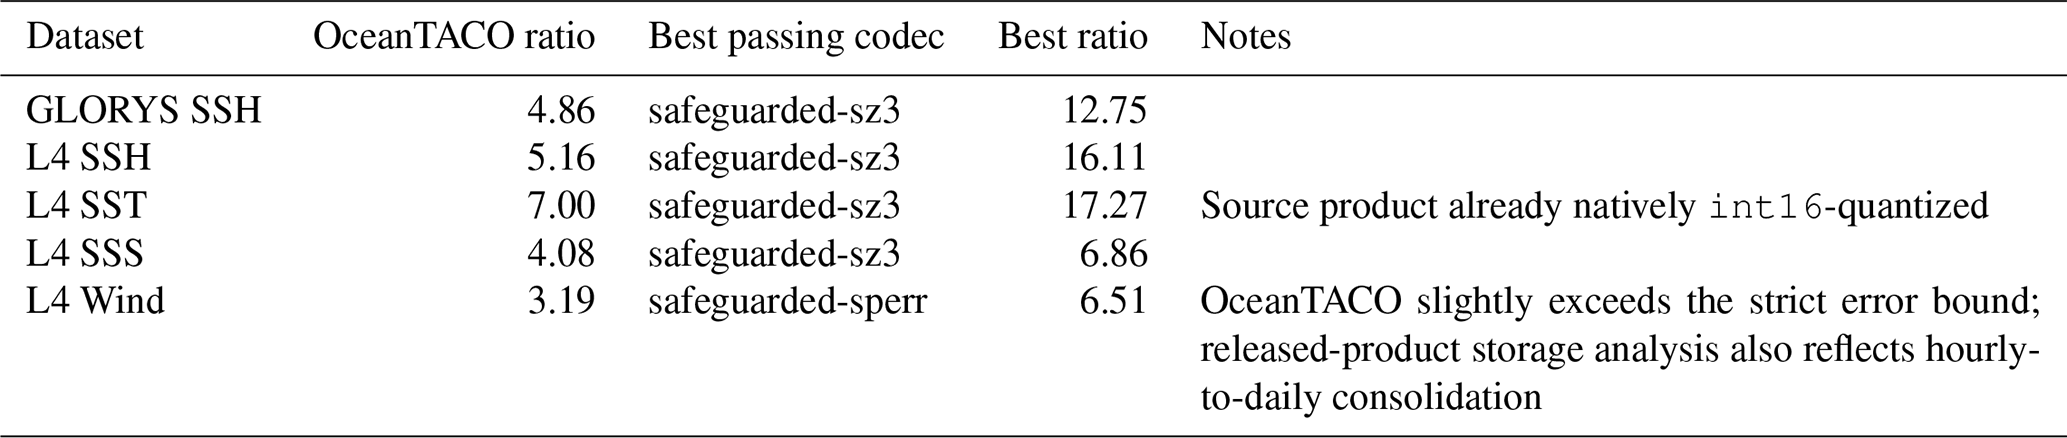
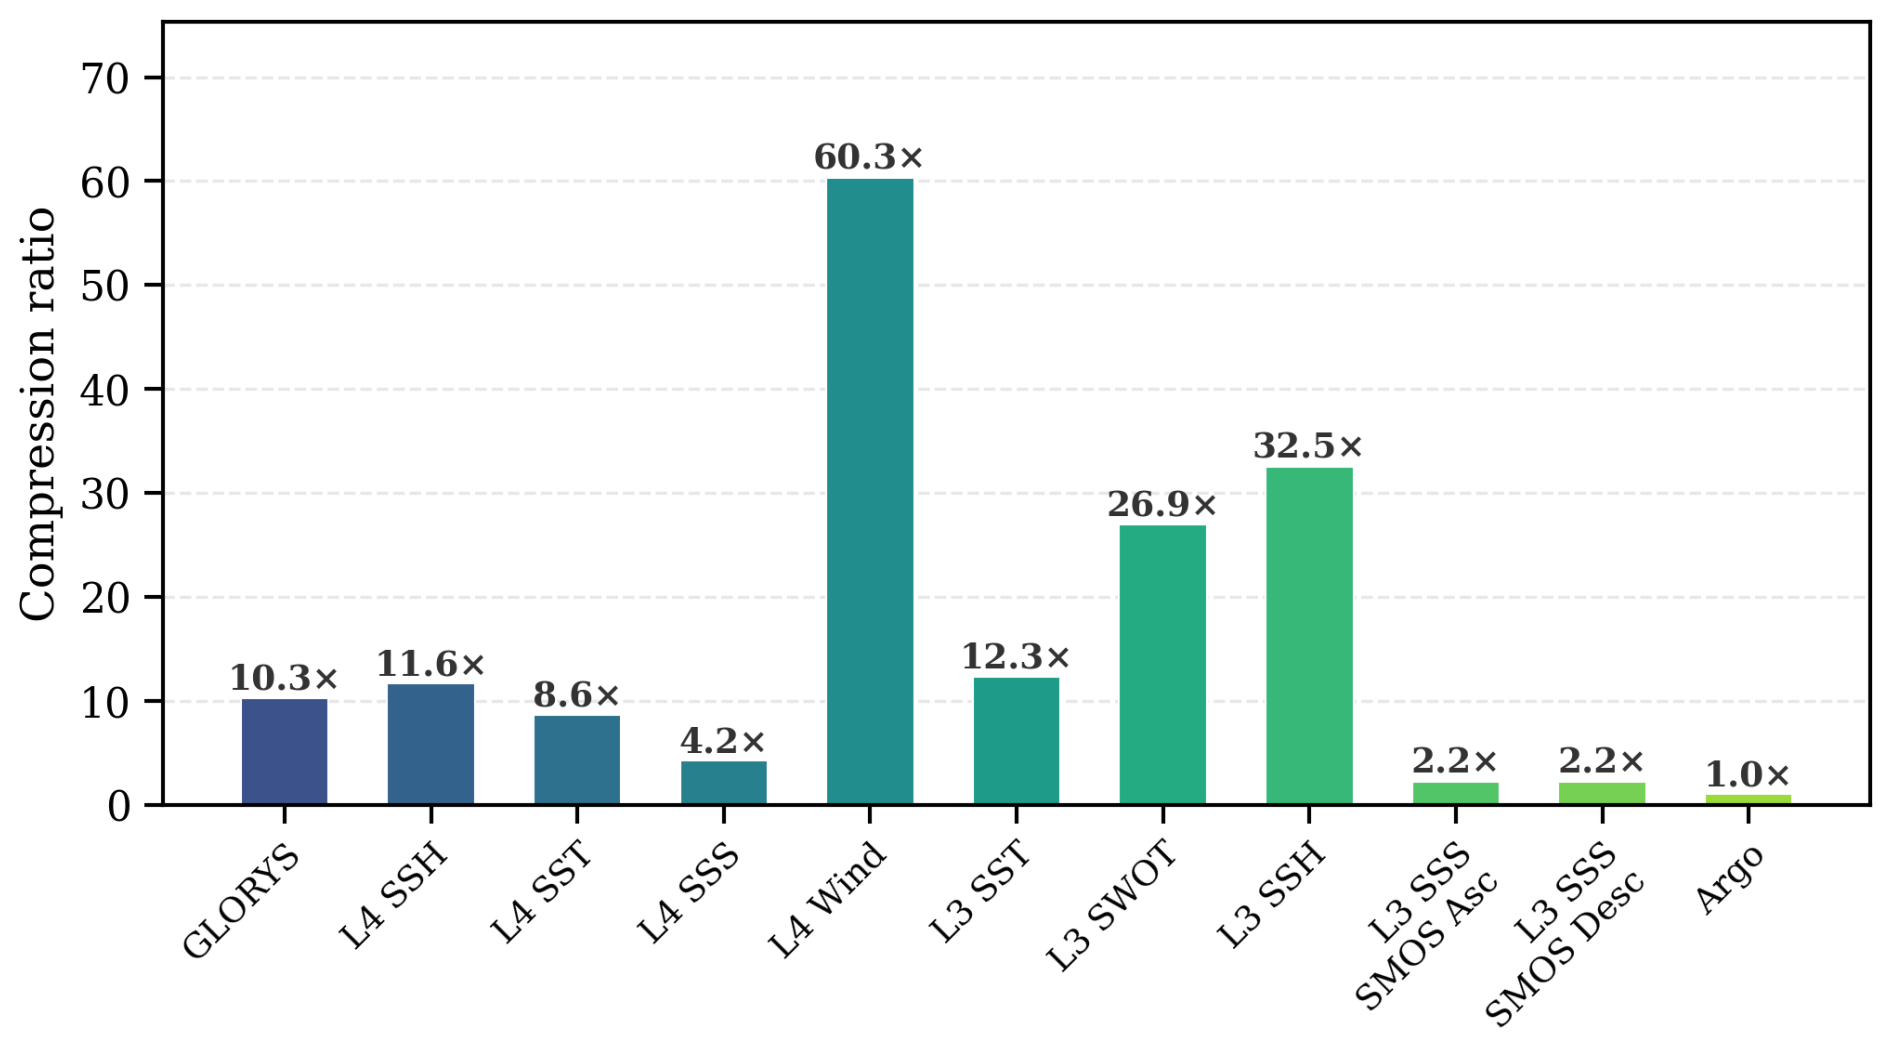
Figure A1Compression ratios achieved by the OceanTACO processing pipeline for each of the ten data sources. Each bar shows the ratio of the uncompressed source-file size to the on-disk size of the corresponding processed region files (int16+zlib). The ratio for L3 SWOT and L3 SSH is computed relative to a float32 element-count estimate rather than the raw swath files (see Table A3).
The dataset was conceptualized by NL and CA. The curation, construction, and corresponding figures were also carried out by NL and CA. The initial manuscript was drafted by NL with inputs and subsequent revisions by all authors.
The contact author has declared that none of the authors has any competing interests.
Publisher's note: Copernicus Publications remains neutral with regard to jurisdictional claims made in the text, published maps, institutional affiliations, or any other geographical representation in this paper. The authors bear the ultimate responsibility for providing appropriate place names. Views expressed in the text are those of the authors and do not necessarily reflect the views of the publisher.
The OceanTACO dataset is generated using E.U. Copernicus Marine Service Information and AVISO+ Products. Argo data were collected and made freely available by the International Argo Program and the national programs that contribute to it. The Argo Program is part of the Global Ocean Observing System. NL and XXZ were supported by German Federal Ministry for Economic Affairs and Climate Action in the framework of the “national center of excellence ML4Earth” (grant number: 50EE2201C) and by Munich Center for Machine Learning. JLB was supported by the Technical University of Munich – Institute for Advanced Study, Germany. We also acknowledge Claude Code, the AI tool developed by Anthropic, for coding, writing revision, and research assistance.
This research has been supported by the German Federal Ministry for Economic Affairs and Climate Action (BMWK), grant no. 50EE2201C.
This paper was edited by Alberto Ribotti and reviewed by Giuseppe M. R. Manzella and one anonymous referee.
Abdalla, S., Kolahchi, A. A., Ablain, M., Adusumilli, S., Bhowmick, S. A., Alou-Font, E., Amarouche, L., Andersen, O. B., Antich, H., Aouf, L., et al.: Altimetry for the future: Building on 25 years of progress, Adv. Space Res., 68, 319–363, https://doi.org/10.1016/j.asr.2021.01.022, 2021. a
Algarabel, G., Steventon, M., Munafò, M., and Ireland, M.: How reproducible and reliable is geophysical research? A review of the availability and accessibility of data and software for research published in journals, Seismica, 2, https://doi.org/10.26443/seismica.v2i1.278, 2023. a
Aouni, A. E., Gaudel, Q., Johnson, J. E., Charly, R., Sommer, J. L., van Gennip, S., Fablet, R., Drevillon, M., Drillet, Y., and Traon, P. Y. L.: OceanBench: A Benchmark for Data-Driven Global Ocean Forecasting systems, in: The Thirty-ninth Annual Conference on Neural Information Processing Systems Datasets and Benchmarks Track, https://openreview.net/forum?id=wZGe1Kqs8G (last access: 24 August 2026), 2025. a, b, c, d
Archambault, T., Filoche, A., Charantonis, A. A., and Béréziat, D.: Multimodal Unsupervised Spatio-Temporal Interpolation of satellite ocean altimetry maps, in: VISAPP, 159–167, https://doi.org/10.5220/0011620100003417, 2023. a, b
Archambault, T., Filoche, A., Charantonis, A., Béréziat, D., and Thiria, S.: Learning sea surface height interpolation from multi-variate simulated satellite observations, J. Adv. Model. Earth Sy., 16, e2023MS004047, https://doi.org/10.1029/2023ms004047, 2024. a
Archer, M., Wang, J., Klein, P., Dibarboure, G., and Fu, L.-L.: Wide-swath satellite altimetry unveils global submesoscale ocean dynamics, Nature, 640, 691–696, 2025. a
AVISO/DUACS: The SWOT L3 LR SSH product, derived from the L2 SWOT KaRIn low rate ocean data products (NASA/JPL and CNES), is produced and made freely available by AVISO and DUACS teams as part of the DESMOS Science Team project, AVISO/DUACS [data set], https://doi.org/10.24400/527896/A01-2023.017, 2024. a, b
Aybar, C., Contreras, J., Ma, C., Pellicer-Valero, O. J., Mateo-García, G., Gómez-Chova, L., Camps-Valls, G., Lehmann, N., Czerkawski, M., Montero, D., and Mahecha, M. D.: The Missing Piece: Standardising for AI-ready Earth Observation Datasets, in: TerraBytes-ICML 2025 workshop, https://openreview.net/forum?id=HV6F0dsGLK (last access: 24 August 2026), 2025. a, b, c
Ballarotta, M., Ubelmann, C., Pujol, M.-I., Taburet, G., Fournier, F., Legeais, J.-F., Faugère, Y., Delepoulle, A., Chelton, D., Dibarboure, G., and Picot, N.: On the resolutions of ocean altimetry maps, Ocean Sci., 15, 1091–1109, https://doi.org/10.5194/os-15-1091-2019, 2019. a, b, c
Ballarotta, M., Ubelmann, C., Bellemin-Laponnaz, V., Le Guillou, F., Meda, G., Anadon, C., Laloue, A., Delepoulle, A., Faugère, Y., Pujol, M.-I., Fablet, R., and Dibarboure, G.: Integrating wide-swath altimetry data into Level-4 multi-mission maps, Ocean Sci., 21, 63–80, https://doi.org/10.5194/os-21-63-2025, 2025. a
Beauchamp, M., Febvre, Q., Georgenthum, H., and Fablet, R.: 4DVarNet-SSH: end-to-end learning of variational interpolation schemes for nadir and wide-swath satellite altimetry, Geosci. Model Dev., 16, 2119–2147, https://doi.org/10.5194/gmd-16-2119-2023, 2023. a
Boutin, J., Vergely, J.-L., Marchand, S., d'Amico, F., Hasson, A., Kolodziejczyk, N., Reul, N., Reverdin, G., and Vialard, J.: New SMOS Sea Surface Salinity with reduced systematic errors and improved variability, Remote Sens. Environ., 214, 115–134, 2018. a
Buongiorno Nardelli, B., Droghei, R., and Santoleri, R.: Multi-dimensional interpolation of SMOS sea surface salinity with surface temperature and in situ salinity data, Remote Sens. Environ., 180, 392–402, https://doi.org/10.1016/j.rse.2015.12.052, 2016. a
Coca-Castro, A., Fouilloux, A., Barros Lourenço, R., McDonald, A., Rao, Y., and Hosking, J. S.: Improving the reproducibility in geoscientific papers: lessons learned from a Hackathon in climate science, Environ. Data Sci., 4, e6, https://doi.org/10.1017/eds.2024.35, 2025. a
Copernicus Marine Service: Global Ocean Along Track L3 Sea Surface Heights Reprocessed 1993 Ongoing Tailored For Data Assimilation, Marine Data Store (MDS) [data set], https://doi.org/10.48670/moi-00146, 2025a. a, b, c
Copernicus Marine Service: SMOS CATDS Qualified (L2Q) Sea Surface Salinity, https://doi.org/10.48670/mds-00368, 2025b. a, b
Copernicus Marine Service: Global Ocean Gridded L4 Sea Surface Heights and Derived Variables Reprocessed 1993 Ongoing, Copernicus Marine Service, Marine Data Store (MDS) [data set], https://doi.org/10.48670/moi-00148, 2025c. a
Copernicus Marine Service: Global Ocean Along Track L3 Sea Surface Heights NRT, Marine Data Store (MDS) [data set], https://doi.org/10.48670/moi-00153, 2025d. a, b
Copernicus Marine Service: Multi Observation Global Ocean Sea Surface Salinity and Sea Surface Density, Marine Data Store (MDS) [data set], https://doi.org/10.48670/moi-00150, 2025e. a, b
Copernicus Marine Service: Sea Surface Temperature Multi-sensor L3 Observations, Marine Data Store (MDS) [data set], https://doi.org/10.48670/moi-00151, 2025f. a, b
Copernicus Marine Service: Global Ocean Hourly Reprocessed Sea Surface Wind and Stress, Marine Data Store (MDS) [data set], https://doi.org/10.48670/moi-00152, 2025g. a, b
Droghei, R., Buongiorno Nardelli, B., and Santoleri, R.: Combining in-situ and satellite observations to retrieve salinity and density at the ocean surface, J. Atmos. Ocean. Tech., 33, 1211–1223, https://doi.org/10.1175/JTECH-D-15-0194.1, 2016. a
Droghei, R., Buongiorno Nardelli, B., and Santoleri, R.: A New Global Sea Surface Salinity and Density Dataset From Multivariate Observations (1993–2016), Front. Mar. Sci., 5, 84, https://doi.org/10.3389/fmars.2018.00084, 2018. a
Embury, O., Merchant, C. J., Good, S. A., Rayner, N. A., Høyer, J. L., Atkinson, C., Block, T., Alerskans, E., Pearson, K. J., Worsfold, M., McCarroll, N., and Donlon, C.: Satellite-based time-series of sea-surface temperature since 1980 for climate applications, Sci. Data, 11, 326, https://doi.org/10.1038/s41597-024-03147-w, 2024. a
Fanelli, C., Ciani, D., Pisano, A., and Buongiorno Nardelli, B.: Deep learning for the super resolution of Mediterranean sea surface temperature fields, Ocean Sci., 20, 1035–1050, https://doi.org/10.5194/os-20-1035-2024, 2024. a
Fouchet, E., Benkiran, M., Le Traon, P.-Y., and Remy, E.: Comparison of a global high-resolution ocean data assimilation system with SWOT observations, Front. Mar. Sci., 12, 1563934, https://doi.org/10.3389/fmars.2025.1563934, 2025. a
Fu, L.-L., Pavelsky, T., Cretaux, J.-F., Morrow, R., Farrar, J. T., Vaze, P., Sengenes, P., Vinogradova-Shiffer, N., Sylvestre-Baron, A., Picot, N., and Dibarboure, G.: The surface water and ocean topography mission: A breakthrough in radar remote sensing of the ocean and land surface water, Geophys. Res. Lett., 51, e2023GL107652, https://doi.org/10.1029/2023gl107652, 2024. a
Ji, T., Li, G., and Zhang, Y.: Observing storm surges in China's coastal areas by integrating multi-source satellite altimeters, Estuarine, Coast. Shelf S., 225, 106224, https://doi.org/10.1016/j.ecss.2019.05.006, 2019. a
Johnson, J. E., Febvre, Q., Gorbunova, A., Metref, S., Ballarotta, M., Le Sommer, J., and Fablet, R.: OceanBench: the sea surface height edition, Adv. Neural Inf., 36, 78275–78295, https://doi.org/10.52202/075280-3422, 2023. a, b, c
Klein, P., Lapeyre, G., Siegelman, L., Qiu, B., Fu, L.-L., Torres, H., Su, Z., Menemenlis, D., and Le Gentil, S.: Ocean-scale interactions from space, Earth Space Sci., 6, 795–817, 2019. a
Knapp, K. R., Kruk, M. C., Levinson, D. H., Diamond, H. J., and Neumann, C. J.: The international best track archive for climate stewardship (IBTrACS) unifying tropical cyclone data, B. Am. Meteorol. Soc., 91, 363–376, 2010. a
Krishna, D. and Sreejith, K.: Resolution of SWOT altimetry: Improvements along continental margins, Earth Space Sci., 12, e2025EA004312, https://doi.org/10.1029/2025ea004312, 2025. a
Le Guillou, F., Chapron, B., and Rio, M.-H.: VarDyn: Dynamical joint-reconstructions of sea surface height and temperature from multi-sensor satellite observations, J. Adv. Model. Earth Sy., 17, e2024MS004689, https://doi.org/10.1029/2024ms004689, 2025. a, b, c
Lehmann, N. and Aybar, C.: OceanTACO Extended, Hugging Face [code], https://doi.org/10.57967/hf/8172, 2026b. a, b, c
Lehmann, N. and Aybar, C.: OceanTACO, Hugging Face [code], https://doi.org/10.57967/hf/8171, 2026a. a, b, c
Lellouche, J.-M., Greiner, E., Bourdallé-Badie, R., Garric, G., Melet, A., Drévillon, M., Bricaud, C., Hamon, M., Le Galloudec, O., Regnier, C., Candela, T., Testut, C.-E., Gasparin, F., Ruggiero, G., Benkiran, M., Drillet, Y., and Le Traon, P.-Y.: The Copernicus global 1/12 oceanic and sea ice GLORYS12 reanalysis, Front. Earth Sci., 9, 698876, https://doi.org/10.3389/feart.2021.698876, 2021. a, b, c
Le Traon, P.-Y., Dibarboure, G., Lellouche, J.-M., Pujol, M.-I., Benkiran, M., Drevillon, M., Drillet, Y., Faugère, Y., and Remy, E.: Satellite altimetry and operational oceanography: from Jason-1 to SWOT, Ocean Sci., 21, 1329–1347, https://doi.org/10.5194/os-21-1329-2025, 2025. a
Li, J.-L. F., Tsai, Y.-C., Xu, K.-M., Lee, W.-L., Jiang, J. H., Yu, J.-Y., Fetzer, E. J., and Stephens, G.: Inferring the linkage of sea surface height anomalies, surface wind stress and sea surface temperature with the falling ice radiative effects using satellite data and global climate models, Environ. Res. Commun., 4, 125004, https://doi.org/10.1088/2515-7620/aca3fe, 2022. a
Li, X., Han, G., Yang, J., Chen, D., Zheng, G., and Chen, N.: Using satellite altimetry to calibrate the simulation of typhoon Seth storm surge off Southeast China, Remote Sens., 10, 657, https://doi.org/10.3390/rs10040657, 2018. a
Liang, Z., Bao, S., Zhang, W., Yan, H., Duan, B., and Wang, H.: Super-resolution reconstruction of SMOS sea surface salinity from multivariate satellite observations based on deep learning, IEEE J. Select. Top. Appl. Earth, 18, 24251–24266, https://doi.org/10.1109/jstars.2025.3602684, 2025. a
Llovel, W. and Lee, T.: Importance and origin of halosteric contribution to sea level change in the southeast Indian Ocean during 2005–2013, Geophys. Res. Lett., 42, 1148–1157, 2015. a
Martin, S. A., Manucharyan, G. E., and Klein, P.: Synthesizing sea surface temperature and satellite altimetry observations using deep learning improves the accuracy and resolution of gridded sea surface height anomalies, J. Adv. Model. Earth Sy., 15, e2022MS003589, https://doi.org/10.1029/2022ms003589, 2023. a, b, c
Martin, S. A., Manucharyan, G. E., and Klein, P.: Generative data assimilation for surface ocean state estimation from multi-modal satellite observations, J. Adv. Model. Earth Sy., 17, e2025MS005063, https://doi.org/10.1029/2025ms005063, 2025. a, b, c, d
Maze, G. and Balem, K.: argopy: A Python library for Argo ocean data analysis, J. Open Source Softw., 5, https://doi.org/10.21105/joss.02425, 2020. a
Mercator Ocean/Copernicus Marine Service: Copernicus Marine Toolbox (CLI & Python) [software], version 2.2.3; licensed under EUPL-1.2., https://github.com/mercator-ocean/copernicus-marine-toolbox (last access: 24 August 2026), 2025. a
Met Office: Global Ocean OSTIA Sea Surface Temperature and Sea Ice Reprocessed, Marine Data Store (MDS) [data set], https://doi.org/10.48670/moi-00168, 2025. a, b
Morrow, R., Fu, L.-L., Ardhuin, F., Benkiran, M., Chapron, B., Cosme, E., d'Ovidio, F., Farrar, J. T., Gille, S. T., Lapeyre, G., Le Traon, P.-Y., Pascual, A., Ponte, A., Qiu, B., Rascle, N., Ubelmann, C., Wang, J., and Zaron, E. D.: Global observations of fine-scale ocean surface topography with the surface water and ocean topography (SWOT) mission, Front. Mar. Sci., 6, 232, https://doi.org/10.3389/fmars.2019.00232, 2019. a, b
Paszke, A., Gross, S., Massa, F., Lerer, A., Bradbury, J., Chanan, G., Killeen, T., Lin, Z., Gimelshein, N., Antiga, L., Desmaison, A., Köpf, A., Yang, E., DeVito, Z., Raison, M., Tejani, A., Chilamkurthy, S., Steiner, B., Fang, L., Bai, J., and Chintala, S.: Pytorch: An imperative style, high-performance deep learning library, Adv. Neur. Inf., 32, https://doi.org/10.48550/arXiv.1912.01703, 2019. a
Perez, F. and Granger, B. E.: Project Jupyter: Computational narratives as the engine of collaborative data science, UC Berkeley and Cal Poly, http://archive.ipython.org/JupyterGrantNarrative-2015.pdf (last access: 24 August 2026), 2015. a
Smith, A. B.: US Billion-dollar weather and climate disasters, 1980–present, https://www.ncei.noaa.gov/access/billions/ (last access: 24 August 2026), 2025. a
Srinivasan, M. and Tsontos, V.: Satellite altimetry for ocean and coastal applications: A review, Remote Sens., 15, 3939, https://doi.org/10.3390/rs15163939, 2023. a
Taburet, G., Sanchez-Roman, A., Ballarotta, M., Pujol, M.-I., Legeais, J.-F., Fournier, F., Faugere, Y., and Dibarboure, G.: DUACS DT2018: 25 years of reprocessed sea level altimetry products, Ocean Sci., 15, 1207–1224, https://doi.org/10.5194/os-15-1207-2019, 2019. a, b, c, d
Vega-Gimenez, D., Amores, A., Paris, A., and Pascual, A.: Expanding the coastal observation frontier: SWOT reveals the spatial footprint of storm surges, Geophys. Res. Lett., 52, e2025GL117299, https://doi.org/10.1029/2025gl117299, 2025. a, b
Wang, Y., Zhang, S., and Jia, Y.: Enhanced resolution capability of SWOT sea surface height measurements and their application in monitoring ocean dynamics variability, Ocean Sci., 21, 931–944, https://doi.org/10.5194/os-21-931-2025, 2025. a
Wilkinson, M. D., Dumontier, M., Aalbersberg, I. J., Appleton, G., Axton, M., Baak, A., Blomberg, N., Boiten, J.-W., da Silva Santos, L. B., Bourne, P. E., et al.: The FAIR Guiding Principles for scientific data management and stewardship, Sci. Data, 3, 1–9, https://doi.org/10.1038/sdata.2016.18, 2016. a
Wong, A. P. S., Wijffels, S. E., Riser, S. C., et al.: Argo Data 1999–2019: Two Million Temperature-Salinity Profiles and Subsurface Velocity Observations From a Global Array of Profiling Floats, Front. Mar. Sci., 7, 700, https://doi.org/10.3389/fmars.2020.00700, 2020. a, b, c
Zhao, E., Goh, E., Yepremyan, A., Wang, J., and Wilson, B.: Multi-satellite U-Net for high-resolution sea surface temperature reconstruction, EGUsphere [preprint], https://doi.org/10.5194/egusphere-2025-4847, 2025. a
Zou, R., Wei, L., and Guan, L.: Super resolution of satellite-derived sea surface temperature using a transformer-based model, Remote Sens., 15, 5376, https://doi.org/10.3390/rs15225376, 2023. a