the Creative Commons Attribution 4.0 License.
the Creative Commons Attribution 4.0 License.
 | 15 Sep 2026

FAO estimates of net forest emissions and removals, 1990–2025
Francesco N. Tubiello

Anne Branthomme
Griffiths Obli-Laryea
Michelle Piccoli
Nidal Ramadan
Rocio Danica Condor
Nathan Wanner
Rachele Brivio
Örjan Jonsson
Giulia Conchedda
Anssi Pekkarinen
FAO officially collects, analyzes and disseminates forest data by country via the Forest Resources Assessment (FRA) program since the late 1950s. Since 2015, FAO uses a subset of the FRA data, namely forest area and carbon stocks, to compute and disseminate in FAOSTAT net forest emissions/removals estimates, as part of its efforts to assess emissions from agrifood systems. This paper presents the most recent update of the FAO net emission/removal estimates, based on estimates of carbon stock change from all pools, i.e., above- and below-ground living biomass, litter, dead wood and soils, covering over 200 countries and territories for the period 1990–2025. Results show that forests acted globally as net carbon sinks since the 2000s, on average ranging from −1.0 to over the most recent decade 2015–2025. This net flux was a result of substantial carbon removals on forest land over the same period, ranging from −3.8 to , only partially counterbalanced by emissions from net forest loss of 2.8–3.8 Gt CO2 yr−1 – used herein as a proxy of deforestation. Annex I (AI) and non-Annex I (NAI) countries contributed equally to the estimated forest removals, whereas 90 % of emissions from net forest loss were generated in NAI countries. Comparisons of the FAO estimates with data submitted independently by countries to the United Nations Framework Convention (UNFCCC), as well as with output from the Global Carbon Budget, showed good agreement at global, AI and NAI levels, including for major forest countries. At the same time, important discrepancies between FAO, UNFCCC and global carbon model data were identified in about a dozen countries. Improved convergence of evidence is achievable through dedicated statistical development programs in specific countries, to support international implementation and monitoring of effective climate mitigation actions. The FAO estimates and country data collected from UNFCCC were disseminated in FAOSTAT for 194 countries and 42 territories, with regional and global aggregates, in annual time-series covering the period 1990–2025. They were made available as open access at https://doi.org/10.5281/zenodo.20085666 (Tubiello and Obli-Laryea, 2026).
- Article
(1285 KB) - Full-text XML
-
Supplement
(397 KB) - BibTeX
- EndNote


The United Nations Food and Agriculture Organization (FAO) officially collects, analyzes and disseminates forest data by country via its signature Forest Resources Assessment (FRA) program (FAO, 2025a). The FRA is the longest standing official international forest data collection process in existence today. It provides information on a wide range of forest variables since the 1950s, making it one of the most authoritative sources of official national forest data, useful for tracking long-term trends in forest resources. As such, FRA data are regularly used as key inputs in assessments of the state of the planet, for instance in relation to the world's climate and forests (IPCC, 2019a; FAO, 2024), relevant sustainable development goals (FAO, 2017) and the global carbon cycle (Friedlingstein et al., 2026).
Since 2015, FAO uses a subset of the FRA data, namely forest area and carbon stocks, to estimate and disseminate in FAOSTAT net forest emissions/removals data (Federici et al., 2015; Tubiello et al., 2021), as part of its effort to assess and document agrifood systems emissions worldwide (FAO, 2025b, c). The FAOSTAT forest net emissions/removals dataset is a global knowledge product, providing relevant information to users worldwide for over 200 countries and territories and a long time-series.
In parallel with the FRA process, with the establishment of the UN Framework Convention on Climate Change (UNFCCC) in 1992, countries began reporting forest data (mainly area and carbon stocks) independently of FAO to the UNFCCC, as part of their national greenhouse gas (GHG) inventory (NGHGI) submissions. Within this separate reporting, the FAO data provide a useful benchmark in support of country reporting to UNFCCC, for example in technical expert reviews and as a reference for NGHGI compilation (IPCC, FAO, IFAD, 2015). Within this context and more generally, the FAO data have been used widely to identify, contextualize, and better characterize differences across published global datasets of land use, land-use change and forestry (LULUCF), including within IPCC Assessment Reports (e.g., Lamb et al., 2026; Grassi et al., 2023; Nabuurs et al., 2022; Mbow et al., 2019).
Recent work had however suggested limitations to the applicability of FAO estimates to both country and global assessments, citing boundary and definitional issues related to the IPCC managed land use proxy (Grassi et al., 2023), FRA data quality (Grassi et al., 2022) and completeness of carbon pools, previously limited to above- and below-ground living biomass (Tubiello et al., 2021). We address all three issues in this paper by presenting more detailed analyses based on the new FRA 2025 input data, by including more detailed comparisons with UNFCCC data, and by extending the FAO carbon stock approach to all carbon pools covered by the FRA, i.e., above- and below-ground living biomass, litter, dead wood and soil.
The main goal of this paper was therefore to present the new FAO net forest emissions/removals statistics 1990–2025 and to demonstrate their usefulness as an international data source to usefully complement UNFCCC country data and the scientific results published by the Global Carbon Budget (Friedlingstein et al., 2026). In doing so, we identified important areas of improvement needed to further align the existing international efforts on forest emissions and removals data, highlighting the need for coordinated statistical capacity development programs in countries, aimed at supporting evidence-based decision making for effective climate action.
We discuss below the input data on forest area and carbon stocks sourced from the FRA, as well as the methods for collection and re-dissemination by FAO of UNFCCC emission/removal data (Sect. 1.1). We then describe the equations used to estimate the FAO net forest emissions and removals (Sect. 2.2), closing with a detailed list of limitations and associated uncertainty (Sect. 2.3).
2.1 Input data
The FRA input data considered herein are those submitted to FAO by its member countries, following a standardized methodology aimed at data transparency, consistency and comparability (FAO, 2025a). FRA data sources may include national forest inventories, remote sensing, administrative data, academic and specialized studies and, in the lack of other data, expert opinion. Data quality improvements across successive data collection cycles are often the result of relevant capacity development efforts, and may lead to revisions of entire time series, based on the most recent national forest monitoring data. The FRA 2025 data coverage was substantially higher compared to previous data collection cycles. It saw the highest country participation (197 national correspondents, up from 187 in 2020), with increased numbers of official data submitted, thus reducing the need for FAO imputations. Furthermore, since the FRA 2015 cycle, more countries have monitored their forests using increasingly sophisticated data collection approaches, including more frequent national forest inventories and remote sensing analyses. The FRA 2025 data used in this work to estimate the FAO net forest emission/removal fluxes included: (i) Forest area and its two components: Naturally Regenerating Forest area and Planted Forest area; and (ii) Forest Carbon Stock and Forest Carbon Density for the following carbon pools: above-ground biomass; below-ground living biomass; litter; dead wood; and soil (FAO, 2025a).
In terms of UNFCCC data, independent country information was collected from publicly available official submissions to the UNFCCC, such as Biennial Transparency Reports, Common Reporting Tables and National Communications, including National Inventory Reports/ National Inventory Documents (UNFCCC, 2026). The UNFCCC data, disseminated together with the FAO estimates in FAOSTAT (FAO, 2025b), were collected from available submissions to the UNFCCC, with a cut-off time of 15 March 2026. They included: (i) Forest Land area and, where available, Managed Forest area; (ii) Area of forest conversion to non-forest land use; (iii) Emissions/removals on Forest Land; and (iv) Emissions from forest conversion. We mapped UNFCCC data to the relevant FAO forest categories for dissemination in FAOSTAT (https://files-faostat.fao.org/production/GF/GF_map.pdf, last access: 19 August 2026), similarly to the mapping used by the European Commission Joint Research Center (JRC) for the JRC NGHGI dataset (Melo et al., 2026). We note to this end that FAOSTAT only disseminates official UNFCCC country data, whereas the JRC NGHGI also disseminates gap-filled information produced either via linear interpolation and carry-forward and backward, or through additional imputations (e.g., using LULUCF data as a proxy for forest data). Hence the FAOSTAT UNFCCC dataset has generally less data points and country coverage than the JRC NGHGI.
2.2 Computing carbon stock change and net forest emissions/removals
The FAO net forest emission/removal fluxes were estimated using carbon stock data from the FRA 2025. Whereas previous FAO estimates were limited to carbon stock change in the above- and below-ground living biomass pool, this update also included changes in the litter, dead wood and soil pools. This important extension allowed for a better alignment in scope with NGHGI submissions by countries, which are expected to include as many carbon pools as possible, depending on their national capacity, to increase completeness of their emission inventories. Importantly, the application herein of concepts, methods and, where relevant, coefficients from IPCC (2006, 2019b) contributed to increasing consistency between FAO estimates and NGHGI data.
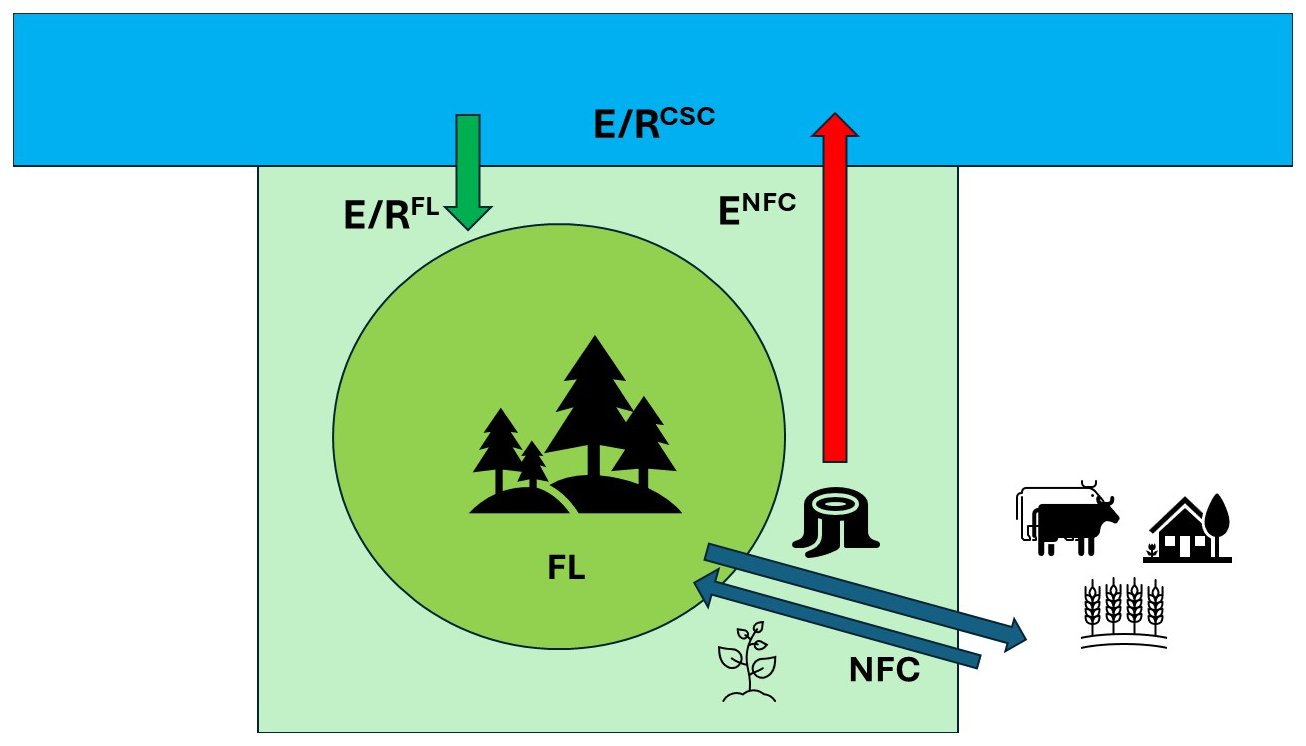
In terms of FRA inputs, let A, Anr, Apl be the total area of forest land and of its two strata, i.e., naturally regenerating forest and planted forest; Bp and be the total carbon stock and carbon density of reservoir p, i.e., above and below-ground living biomass, litter and dead wood, soil. Let furthermore Δt be the time interval between two subsequent FRA periods, equal to 5 or 10 years depending on the FRA time-series. Let then ΔAnr, ΔApl be the net area change of each forest strata occurred during Δt. Let CSCp be the overall forest carbon stock change in pool p, occurred during the time interval Δt. For each pool, CSC was split into two distinct components, following Tubiello et al. (2021). Specifically, let NFC, or carbon stock change net forest conversion, be the negative portion of CSC associated with net forest area loss in either of the two forest strata, ANFC. Additionally, let FL, or carbon stock change on forest land, be the portion of CSC on the forest area present at the end of the time interval Δt. With the above definitions, the equations to compute carbon stock change and its two components for each carbon pool p, country c, FRA year t and time interval Δt, were as follows:
Where A, Anr, Apl were expressed in hectares (ha); CSC, NFC and FL in kilotonne of carbon (kt C).
Equation (1) computes the overall forest carbon stock change occurred during the time interval Δt. Of this total, Eq. (2) represents the portion of carbon losses associated with net forest area decreases. Equation (3) captures the remainder carbon stock change on forest land, due to all relevant processes such as afforestation/reforestation, natural and managed forest growth, forest disturbances and harvest losses. Equation (2) follows approach 1 of the IPCC (2006, 2019b) guidelines for estimating net deforestation fluxes. Unlike simpler equations based only on total net forest area change, however, by tracking two separate strata NFC captures emissions even when the overall net forest area may be increasing – for instance, losses in naturally regenerating forest area masked by larger area increases in plantation forests during the same time interval.
Net forest carbon stock changes computed via Eqs. (1)–(3) were the basis for estimating net forest CO2 emissions and removals, occurred during the same interval Δt, expressed here conventionally as positive for CO2 fluxes from the forest to the atmosphere (net emissions) and vice-versa (net removals) for fluxes from the atmosphere into the forest. Specifically, let be the net overall forest emissions/removals associated with CSC in Eq. (1); the emissions from net area losses, associated with NFC in Eq. (2); and the emissions/removals on forest land associated with FL in Eq. (3). fluxes will also be referred to, in the results section, as the overall net forest carbon sources and sinks. For , in line with the IPCC (2006, 2019b) guidelines, we assumed complete oxidation of carbon in the forest biomass, litter and dead wood pools in the transition to non-forest land classes. Conversely, a portion of the forest soil carbon was assumed to be retained in the transition to non-forest classes. To this end, let αp be the coefficient describing the portion of forest carbon in pool p remaining in the new non-forest class after a land use change. We assigned αp=0 for p=above- and below-ground living biomass, litter, dead wood, representing complete carbon oxidation, whereas we set for p=soil, to describe soil carbon retention in the new non-forest classes, with reference to default IPCC coefficients provided in Table 5.5 and Table 6.2 of the IPCC (2006) guidelines. Note that the forest to non-forest transitions considered herein occur over a time interval Δt of 5–10 years, i.e., intermediate between instant oxidation and the 20 year period recommended by IPCC for soil carbon stock change calculations.
With the above definitions, the FAO net annual forest emission/removal fluxes () for country c, FRA period t and time interval Δt, were computed as follows:
where: , and were expressed in million tonnes of CO2 (Mt CO2 yr−1). A factor of was used to convert from kt C in Eqs. (1)–(3) to Mt CO2. Quantities in Eqs. (4)–(6) represented mean annual fluxes over the time interval Δt occurring between two successive FRA periods (5 or 10 years).
Based on the above equations, three FAO estimation models were defined based on the number of carbon pools used for the carbon stock change calculations: FAO 1, limited to above and below-ground living biomass; FAO 2, including in addition litter and dead wood; and FAO 3, including all carbon pools, i.e., above- and below-ground living biomass, litter and dead wood, and soil carbon. Data for all the three FAO models, as well as relevant UNFCCC country data, were provided as open source at https://doi.org/10.5281/zenodo.20085666 (Tubiello and Obli-Laryea, 2026).
2.3 Comparisons with UNFCCC and Global Carbon Budget
As discussed in the results section below, we used the range of estimates from the three FAO models for comparisons to UNFCCC data, considering that countries may include one or more carbon pool in NGHGI, depending on their national capacity and methodological choices for reporting (Melo et al., 2026). Conversely, FAO 3 output was used for comparisons to the Global Carbon Budget models, which tend to include all carbon pools. A subset of the most recent Global Carbon Budget (GCB2025; Friedlingstein et al., 2026) data was selected for comparison to the FAO estimates. Specifically, FAO NFC estimates were compared to GCB2025 deforestation data, which, based on bookkeeping models, quantify the contribution of deforestation emissions to the net GCB emissions from land use change (ELUC). Further, FAO FL emissions/removals were compared to the sum of all GCB net forest fluxes, also based on bookkeeping models, due to afforestation/reforestation, shifting cultivation and wood harvest, complemented by the anthropogenic portion of the GCB2025 natural land sink (SLAND), computed with Dynamic Global Vegetation Models (DGVMs), but adjusted to the boundaries of managed forest land to ensure alignment with NGHGI data (Grassi et al., 2023). The GCB2025 fluxes considered herein do not include peat drainage and fires. The components of the GCB2025 fluxes used herein were kindly provided by the GCB land use change subgroup (C. Schwingshackl, personal communications).
2.4 Limitations and uncertainty
Several limitations to the FAO methodology exist and were in part highlighted in previous work (Tubiello et al., 2021; Grassi et al., 2022). The first set refers to forest area boundaries, which determine whether the estimated net forest emission/removal fluxes can be considered anthropogenic or not, in the sense of the IPCC (2006, 2019b) managed land proxy. Accordingly, we considered all emission/removal fluxes estimated on managed land as anthropogenic, irrespective of direct and indirect climatic and CO2 effects. The critical issue was that the FRA area statistics employed in this work referred to total forest area, of which managed forest area is generally understood as a subset, leading to the criticism that the FAO estimates may contain natural components, i.e., beyond those occurring on managed forest area (Grassi et al., 2022). We show in the results section below, however, that for most countries analyzed in this work, the opposite in fact held, i.e., the UNFCCC reported managed area was equal to or even greater than the FAO forest area. In all such cases therefore, the FAO estimates were considered anthropogenic.
More generally, we had previously noted that only a subset of estimated forest fluxes will depend on the managed land use proxy for attribution as anthropogenic (Federici et al., 2015; Tubiello et al., 2021). For example, FAO NFC estimates of emissions from net forest area losses can be considered anthropogenic regardless of their occurring on managed or unmanaged forest land, including their indirect climate and CO2 components, whenever the corresponding land use change was caused by human action – which is very often the case. A similar consideration applies to forest land removals from the establishment of plantations – which are, by definition, anthropogenic. It follows that, limited to those countries reporting managed forest areas smaller than the total forest area, only a portion of the FAO emission/removal estimates on forest land, FL, will have non-anthropogenic components, directly linked to natural forest processes occurring on non-managed land.
Even when the underlying forest area boundaries may coincide between FAO and UNFCCC, the coverage of forest fluxes included in the NGHGI may nonetheless complicate comparisons of FAO and UNFCCC data. An important example is represented by carbon fluxes from peatlands drainage and peat fires, which are included in our estimates but reported separately in FAOSTAT (Conchedda and Tubiello, 2020; Prosperi et al., 2020), may conversely be reported by some countries within their forest emissions, without distinction. In conclusion, although differences in forest area boundaries remain important drivers of possible misalignment between FAO and UNFCCC data, we suggest that this was a much smaller concern than previously suggested in the literature, and as we show in the next result section, limited in practice to a small number of countries.
A second set of limitations in the FAO estimates presented here is their “Tier 1” national -level approach. We recognize that higher tiers approaches, driven by the recent tremendous progress in remote sensing and machine learning, make already possible today the production of increasingly accurate forest estimates at increasingly fine scales, including recent efforts by FAO (e.g., Araza et al., 2023; FAO, 2024). At the same time, we emphasize that the value of the FAO net forest/emissions dataset precisely lies in providing a robust and transparent Tier 1 reference for assessing higher-Tier estimates. Its straightforward, reproducible equations, grounded in official national statistics, make it a practical tool for both national compilers, expert reviewers of NGHGIs and modelers (FAO, IFAD, IPCC, 2015). At the same time, we recognize that using national statistics as input and constant national coefficients has limitations and carries uncertainty. First, estimates of net forest area change may systematically underestimate gross forest area changes and associated emissions or removals. We have noted however in the previous section that the FAO equations limit such bias, by approximating important gross components, i.e., by tracking independently area changes in naturally regenerating forest and planted forest area. Second, the use of national-level biomass stock density data may lead to underestimates of net forest conversion emissions, for example in cases when the forest being lost is primary or old-growth forest or anyway characterized by biomass densities higher than the national average. Third, net emission/removal estimates on forest land depend strongly on the quality of the underlying carbon density data. As noted by Grassi et al. (2022), missing information on changes over time may generate underestimates of removals in countries with increasing carbon stock densities, while leading to overestimates in countries with decreasing forest biomass densities. Furthermore, in relation to newly established forest areas, the use of national biomass stock density values may overestimate removals in countries with new forests of lower carbon density than the national average, and vice versa. A final limitation of the FAO estimates was related to the inclusion of additional carbon pools; while adding biophysical detail improves completeness, the dependence on more input data tends to increase uncertainty. In particular, the FRA 2025 soil carbon data submitted by countries had limited coverage and consistency compared to the other pools and were gap-filled with published soil organic carbon maps (FAO, 2025a). In relation to the soil carbon pool, we furthermore note, as discussed in the previous section, that the FAO equations for NFC used a constant coefficient to approximate soil carbon retention for non-forest transitions. This value was considered a good balance with respect to the available IPCC default coefficients, including forest conversion to annual cropland in temperate zones (; 20 % uncertainty); forest conversion to annual cropland in tropical zones (; 60 % uncertainty); and forest conversion to either grassland (αsoil=1; 15 % uncertainty) or permanent crops (αsoil=1; 50 % uncertainty). If anything, we suggest that our coefficient may lead to overestimates of related emissions, considering that the FAO land use change data available in FAOSTAT (FAO, 2025d) show a substantial portion of forest conversion in the tropics going to either grassland (Latin America) or permanent crops (West Africa and Southeast Asia), for which the IPCC defaults generally imply no soil carbon loss. Finally, we note that the use of the FRA dataset as direct input into the FAO emission/removal estimates may affect the timeliness of the resulting FAO data, specifically because new information depends on the FRA update cycle, performed only every 5 years currently – while also recognizing that in some countries forest data collection cycles may still be in the order of a decade. Recent provisions implemented by FAO will nonetheless increasingly allow countries to perform FRA updates annually, in fact as often as new national data became available, thus greatly improving the timeliness of future FAO emission/removal estimates. For this version depending on the FRA 2025 data, the most important issue related to the above was that the FRA carbon stocks submitted for the year 2025 were estimated by countries, rather than based on direct measurements – due to the temporal mismatch between national data production and the FAO data collection cycle. This introduced additional uncertainty specific to the FAO emission/removal estimates for 2020–2025. For instance, the USA carbon stock data submitted to FRA for the year 2025 were produced by the country via carry forward of the 2022 value. This implies for specific countries a FAO underestimate of 2020–2025 mean removals, had national carbon stock kept increasing past 2022 – and an overestimate in the opposite case. A second, more obvious issue may arise from potential errors in the FRA input data. We found only one country for which corrections to the original data submitted to the FRA 2025 were necessary, specifically Italy, whose submitted values for forest carbon stock in 2025 were found to be inconsistent with the previous time series. Pending future country submissions, we carried forward the forestland removals data for the year 2020–2025. This revision resulted in net forest removals of about for 2025, compared to emissions of 50 Mt CO2 yr−1 that would have been estimated using the original country submission for 2025. These changes were likewise documented in Zenodo (https://doi.org/10.5281/zenodo.20085666, Tubiello and Obli-Laryea, 2026) the relevant FAOSTAT country notes. In either case, the 2025 reporting issues were minimized when reporting trends over the longer period 2001–2023, the standard used in this work for comparisons of FAO/UNFCCC data.
The long list of limitations discussed above implied that the FAO estimates were characterized by substantial uncertainty. Tubiello et al. (2021) indicated a generic uncertainty of 50 % (95 % CI) for all FAO emission/removal components, consistently with established literature on LULUCF (e.g., Nabuurs et al., 2022; Friedlingstein et al., 2026). In this work, we used instead the output of the three FAO models as a practical and heuristic, if imperfect approach to quantify uncertainty, indicating a range of about ±30 % around FAO 2 values. To this end, we followed recommendations of the relevant guidelines of the International Bureau of Weights and Measures (BIPM et al., 2008), with respect to the need to align the number of significant figures (or digits) of results to their underlying uncertainty. For high uncertainty, such as the case for LULUCF fluxes, the BIPM guidelines suggest that results be communicated with one, at most two significant figures. We have applied this rule in presenting results throughout this manuscript.
2.5 Data Availability: Structure of FAOSTAT dataset
The FAOSTAT dataset covers the period 1990–2025 for 194 countries and 42 territories. Aggregates were computed for 5 regions, 22 sub-regions and 8 special aggregates, including UNFCCC Annex and non-Annex I, OECD, least-developed countries, small island developing states. The FAO dataset further included available UNFCCC data, disseminated without interpolation of missing values, resulting in nearly 9000 data points for a combined total of 137 countries over the period 1990–2023. The FAO 2025 net forest emission/removal estimates and corresponding UNFCCC data are available as open data via Zenodo (Tubiello and Obli-Laryea, 2026), at https://doi.org/10.5281/zenodo.20085666. They are also available via FAOSTAT (FAO, 2025b). Finally, the data used for the figures can be found in the Supplement.
We provide below a wide synthesis of results from the new FAO net forest emission/removal estimates dataset, comprised of FAO estimates and relevant UNFCCC country data. Results were organized in three main sections. In Sect. 3.1, we analyze differences in input forest data statistics, by comparing country data independently submitted to FAO via the FRA and to UNFCCC. In this section we also highlight data quality improvements arising from the use of the most recent FRA data compared to the previous data cycle. In Sect. 3.2, we focus on presenting global, regional and country trends of the new FAO estimates, with comparisons to UNFCCC country-reported emissions and removals data. Global and regional trends were discussed in terms of World, AI and NAI aggregates, as well as by main FAO region. We used the range of estimates from three FAO models for comparisons to UNFCCC data, and from FAO 3 for comparisons to Global Carbon Budget data.
3.1 Comparison of FAO and UNFCCC input data
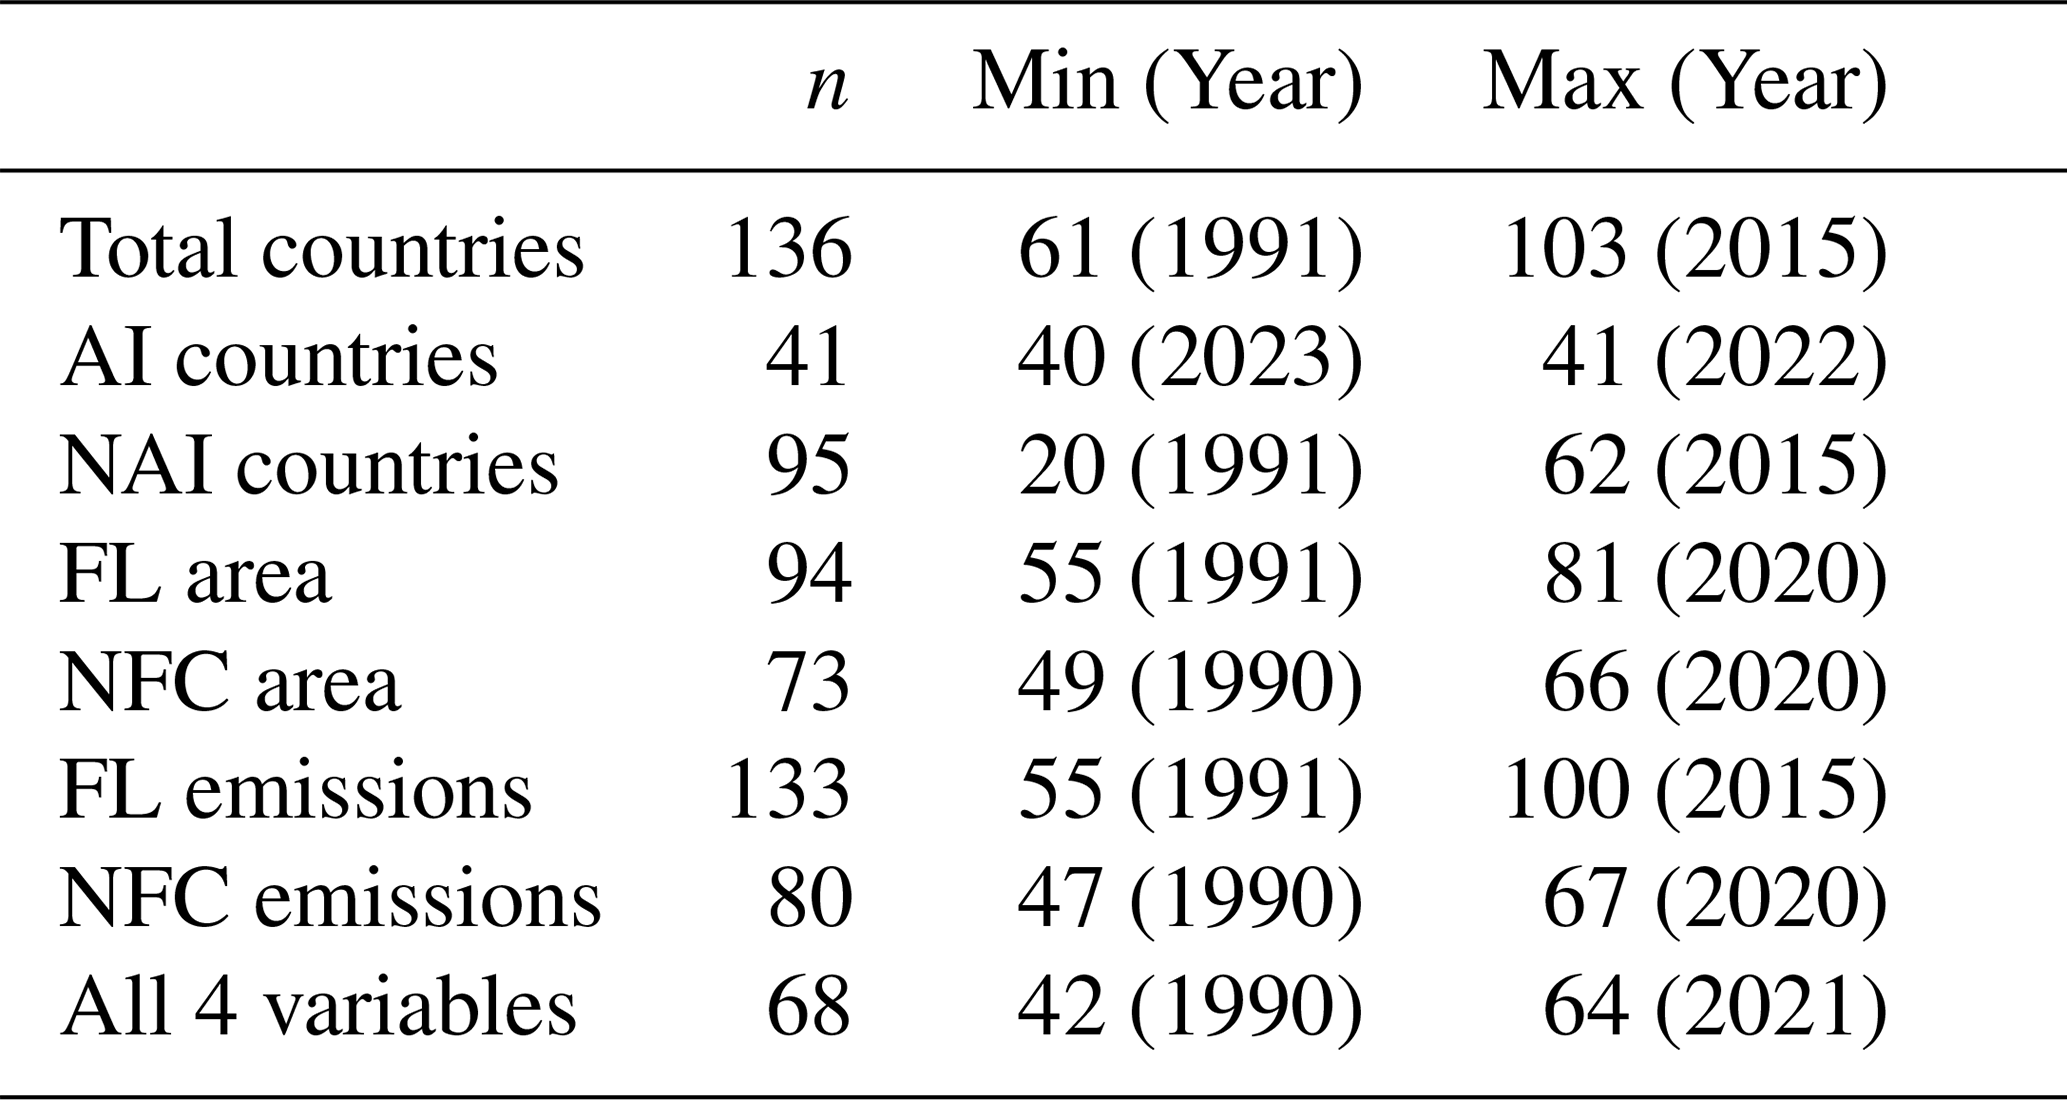
The FRA 2025 data (FAO, 2025a) used as input into the emission/removal calculations had complete coverage of forest area and carbon stock variables for 194 countries and 42 territories, for the 1990–2025 period considered herein. Conversely, the UNFCCC data collected for this work and re-disseminated alongside the FAO estimates in FAOSTAT (FAO, 2025b), were characterized by sparser country and thematic coverage, albeit over a similarly long time-series, i.e., 1990–2023 (Table 1).
Table 1Country coverage of collected UNFCCC data (1990–2023), with a cut-off date of March 2026.
3.1.1 Forest area
Trends in world total forest area of the 194 countries and 42 territories covered by the FAO (2025a) and disseminated in FAOSTAT (FAO, 2025b) was 4.2 Gha in 2025. The same data showed net world forest area loss of nearly 200 Mha over the period 1990–2025 (FAO, 2025c), due to predominance of forest area loss over forest area increase. Specifically, the FAO data showed that the area of naturally regenerating forest decreased by 300 Mha (−5 %) from 1990–2025, while planted forest area increased by about 100 Mha (+60 %). In terms of FRA data cycles, we found that FRA 2025 and FRA 2020 (FAO, 2020) data were in close numerical agreement. Limiting the analysis to the subset of countries also reporting forest area data to UNFCCC for the year 2020, we found that the FRA 2025 data were very well aligned to UNFCCC data (R2=0.9473, Fig. 2), improving from the FRA 2020 data cycle. Note that in line with Grassi et al. (2022) and Melo et al. (2026), we interpreted the UNFCCC forest area data to refer to managed forest area, unless specified otherwise in the relevant country submissions. To this end, the most important of these improvements in forest area data was Argentina, updated to 47 Mha in FRA 2025 from 29 Mha in FRA 2020 – and very close to the 48 Mha reported by the country to UNFCCC. Similar improvements were found for South Africa (which revised its forest area upwards in FRA 2025, from 17–22 Mha; 26 Mha reported to UNFCCC); and Nigeria (revised downwards in FRA 2025, from 22–18 Mha; 14 Mha reported to UNFCCC). Even in cases of convergence of information such as those reported above, residual differences in country values may remain, reflecting reporting to FAO or UNFCCC by different national agencies.
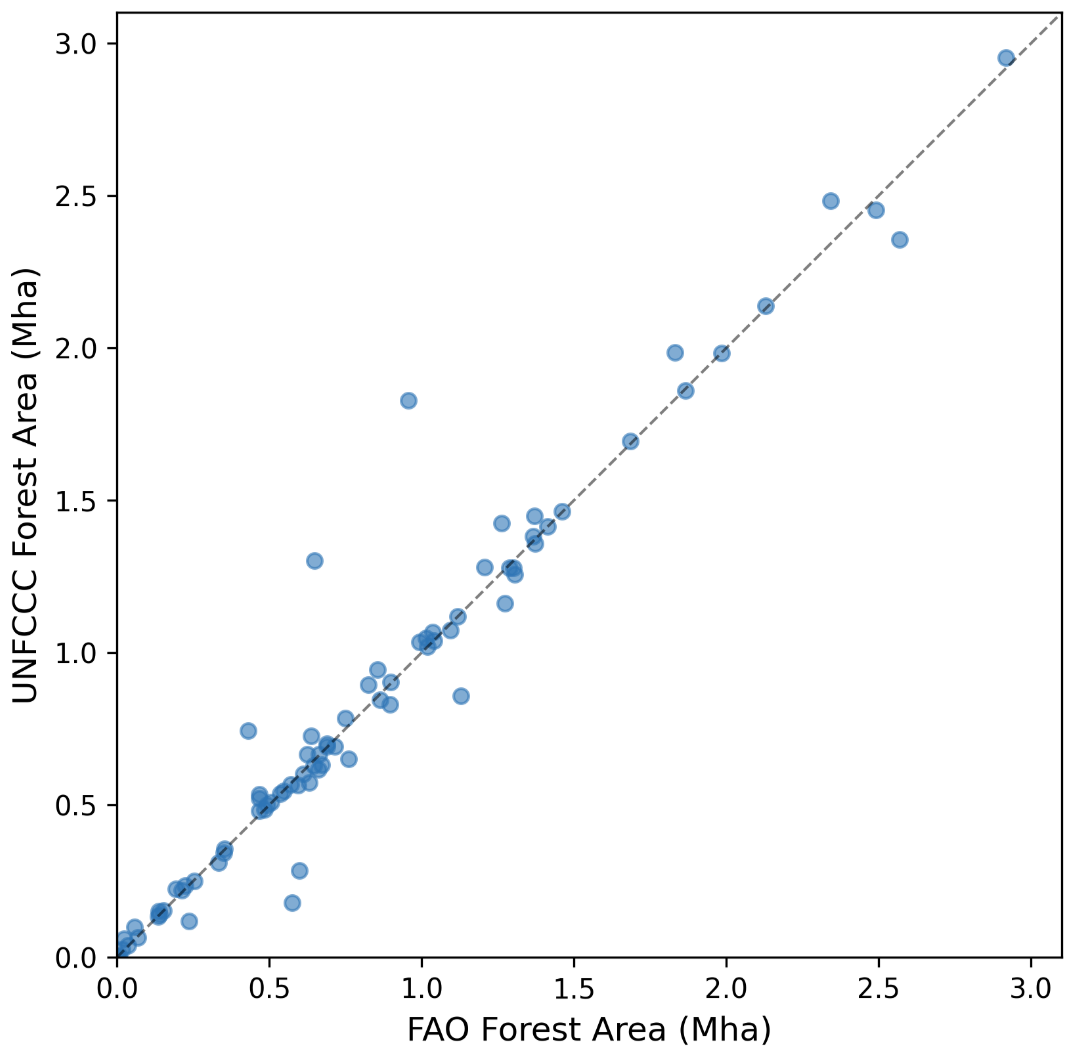
Figure 2Correlation of log-transformed forest area data reported by countries to FAO and the UNFCCC.
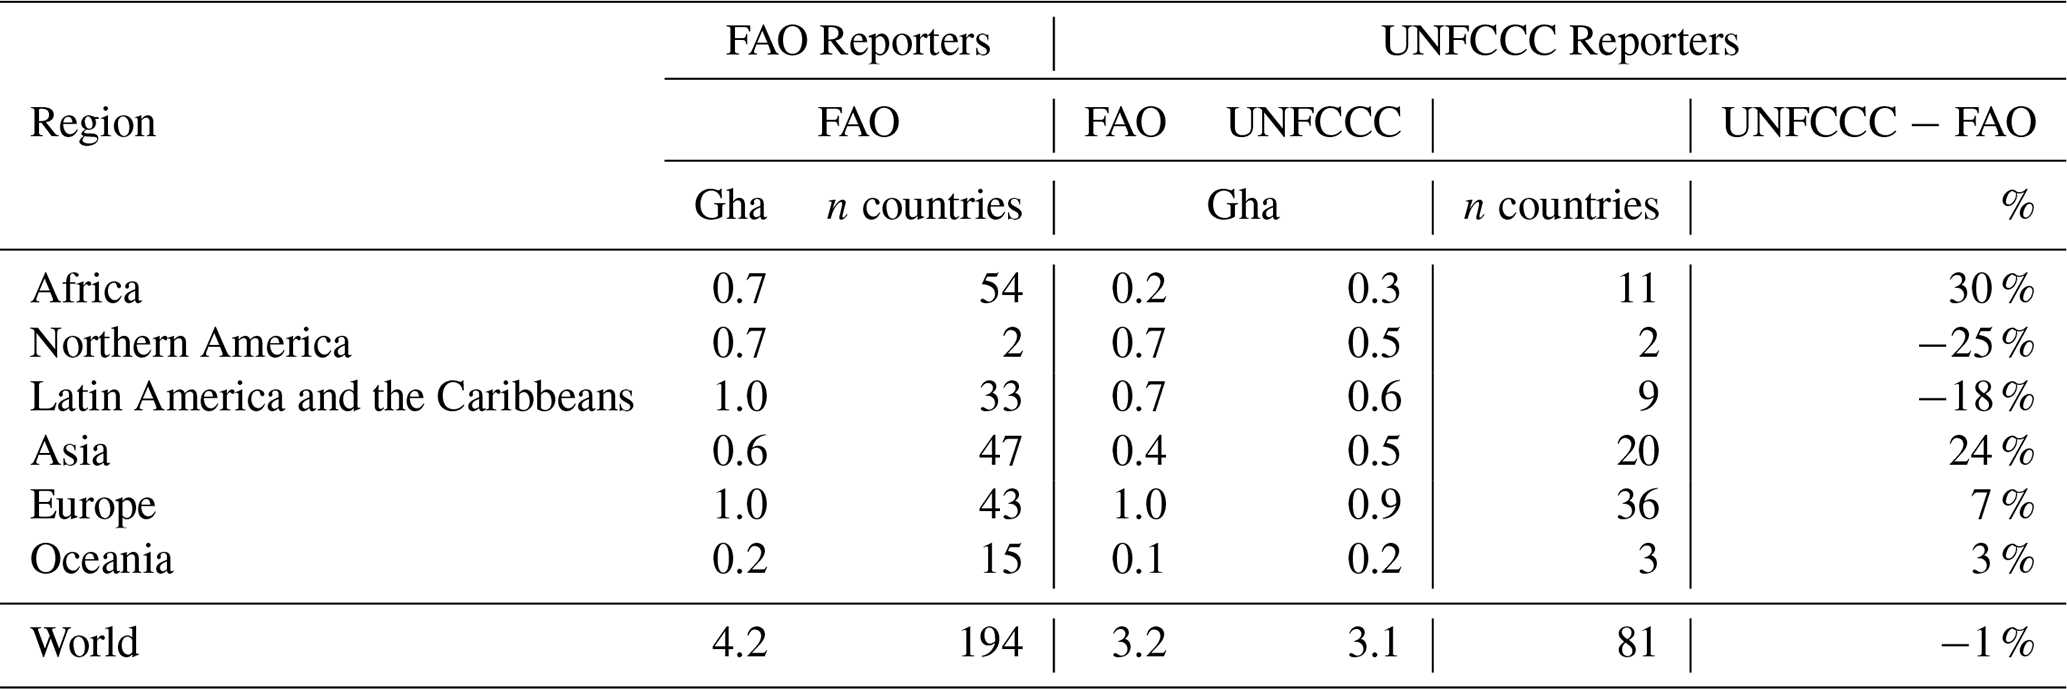
Limited to the 81 countries reporting forest area to UNFCCC for the year 2020, the FAO world total forest area was 3.2 Gha, virtually the same as the corresponding UNFCCC world total. At the same time, the agreement at global level between the FAO and UNFCCC data masked important regional trends. For instance, UNFCCC forest land area was smaller than the corresponding FAO statistics for the Americas, while for the other regions, it was larger than the FAO forest area data (Table 2).
Table 2Comparison of forest area statistics based on country data reported to FAO and UNFCCC (year 2020), globally and by world region. “FAO Reporters”=world and regional aggregates of FAO statistics of forest area corresponding to complete country reporting to FAO (194 countries). “UNFCCC country reporters”=world and regional aggregates of forest area (FAO) and managed forest area (UNFCCC), limited to the 81 countries reporting to UNFCCC.
At country level, the FRA 2025 and UNFCCC forest area data were strongly correlated (R2=0.9827, log-normalized) (Fig. 1), with six countries largely driving the observed regional differences (Table 3). Specifically, Brazil (−150 Mha), Canada (−140 Mha) and the USA (−25 Mha) alone explained the UNFCCC world total forest area being smaller than FAO, in agreement with previous findings (Grassi et al., 2022; Melo et al., 2026). Conversely, China (+85 Mha), Russian Federation (+70 Mha) and Namibia (+60 Mha) largely drove the discussed regional trends, showing UNFCCC-reported world total forest areas larger than the corresponding FAO values. The latter suggested inclusion, within the UNFCCC country-reported forest area, of additional land area, for instance tree covered areas such as wooded savannah or tundra, that under FAO land use classification are not included in forest land, but rather are reported under “other wooded land”. Indeed, additional analyses of the relevant FRA country profiles for the top three countries mentioned above confirmed this situation. Adding the FAO-reported area of other wooded land, to the FAO forest area by Namibia, increased this country's forest area by roughly 9 times, coinciding with the “forest land area” it reported to UNFCCC (Table 3). These findings suggest that forest area boundary issues, albeit remaining a critical factor when comparing national data, are limited in practice to a small number of countries, rather than representing a structural feature in the differences between FAO and UNFCCC data.
Table 3Largest absolute differences between FRA and UNFCCC forest area data for the year 2020.
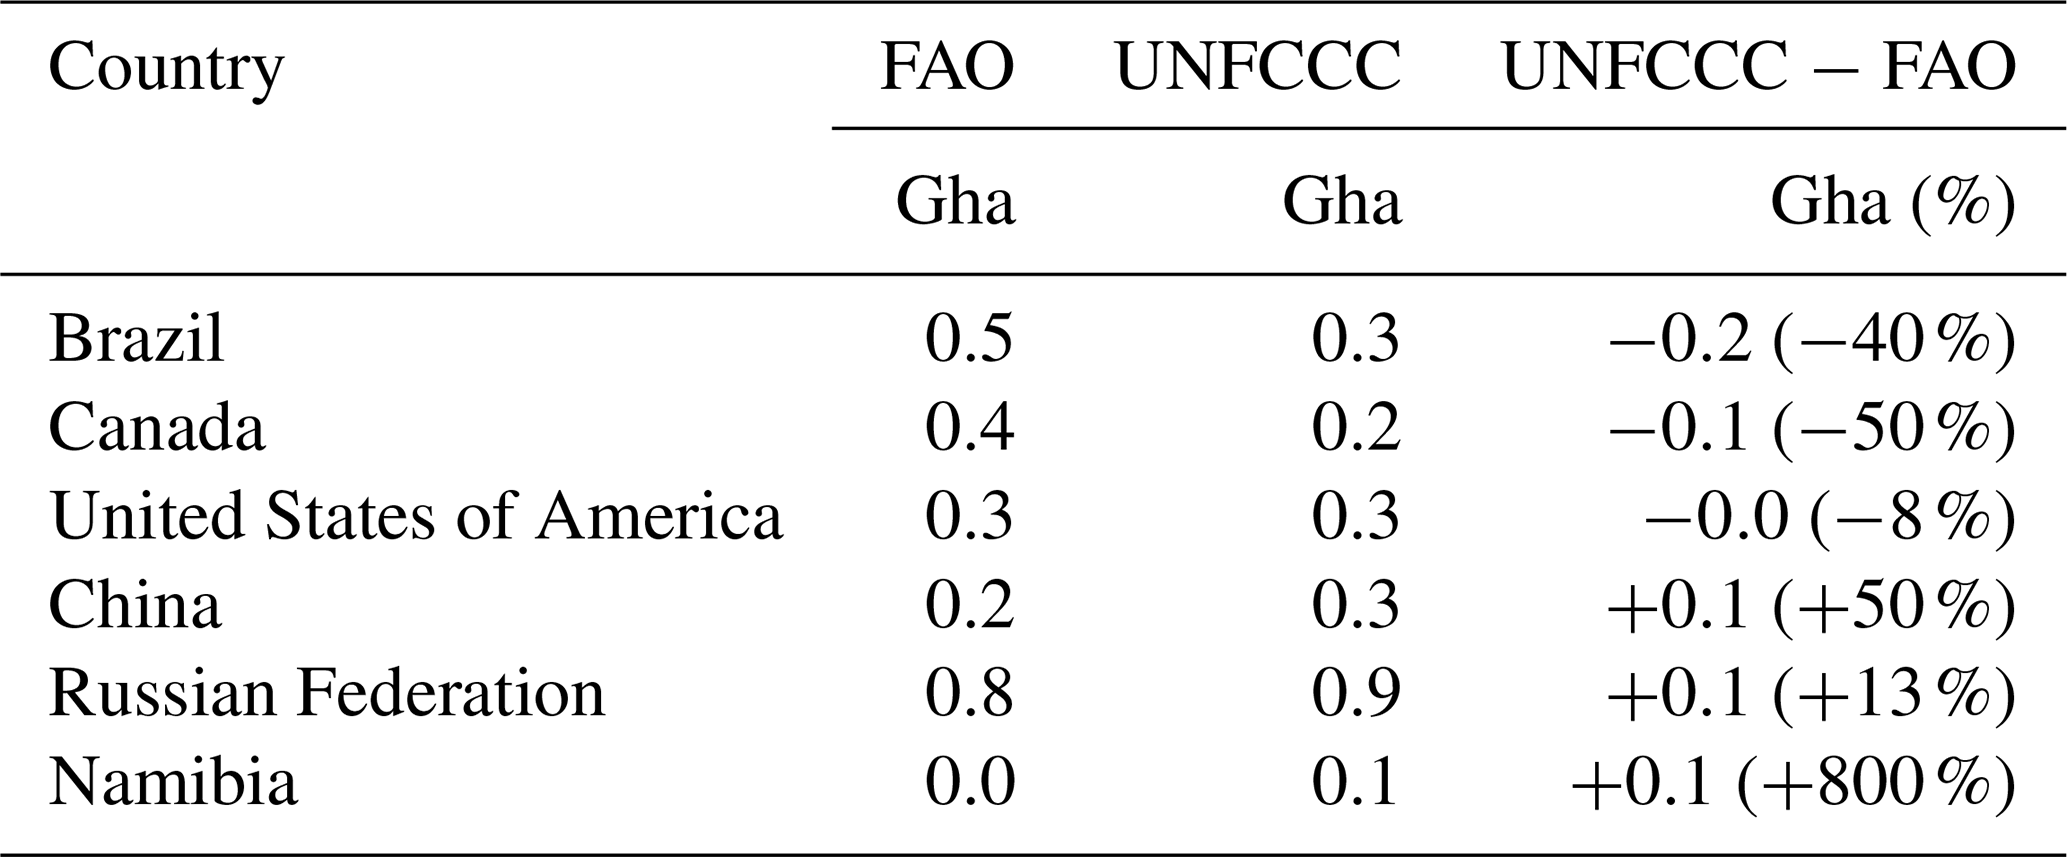
Note: Brazil's UNFCCC managed forest area was estimated based on the FRA country profile. Results were in line with Melo et al. (2026).
3.1.2 Forest biomass and carbon stock change
The FRA 2025 carbon stock data showed overall increases in world total above and below-ground living biomass from 2000–2025, on average by 260 Mt C yr−1, whereas the FRA 2020 data had shown decreases up to 2020 of . For the other carbon pools considered in this work, the FRA 2025 data showed that litter and dead wood increased by 130 Mt C yr−1 on average over the same 2000–2025 period, while the soil pool decreased by . We did not evaluate FRA 2020 results for the additional pools, because those data were more uncertain.
Of specific interest to this update, the changes in carbon biomass between the FRA 2025 and FRA 2020 were driven by substantial updates of country biomass stock density values – driven by Russia, USA and China – which substantially improved the alignment of the corresponding FAO net removals with UNFCCC data, as detailed in the next section, resulting in a stronger forest sink compared to earlier estimates, by about 2 Gt CO2 yr−1. At the same time, the number of countries reporting constant carbon density values over the entire dataset timeseries, a data quality issue highlighted previously in relation to the FRA 2020 (Grassi et al., 2022), did not decrease in the FRA 2025, applying to nearly 90 countries and territories for a total forest land area of 900 Mha (although driven by 20 countries covering nearly 90 % of that area). As discussed in more detail in the next section, most countries reporting constant biomass density values in FRA also reported significant forest removals to UNFCCC, resulting in a discrepancy between FAO and UNFCCC estimates of up to 1.3 Gt CO2 yr−1.
Finally, we note that the use of three FAO models allows, within the discussed uncertainty of each estimate, to evaluate the contribution of different carbon pools to the overall estimates. Specifically, we found that compared to computations limited to carbon biomass pools, the inclusion of litter and dead wood carbon generally increased net forest removals by 20 % in both AI and NAI countries across FRA periods. Including the carbon soil pool further increased removals on forest land by another 30 %–40 % in both AI and NAI countries and across FRA periods. These results underscored the critical importance of the soil carbon pool in our estimates and thus the importance of ensuring their good data quality.
3.2 Net forest emissions and removals
3.2.1 FAO estimates
The FAO data showed increasing carbon stocks in forests for all FRA periods except for 1990–2000. Hence since the year 2000, the data suggested that forests acted globally as overall net sinks of atmospheric CO2, sequestering up to on average in 2020–2025 – the most recent period in the FAO estimates (see complete range of FAO estimates in Table 4). This sink was the result of substantial removals on forest land, up to , only partially counterbalanced by emissions from net forest conversion of up to 3.8 Gt CO2 yr−1. Forests acted overall as carbon sinks in AI countries over the entire period 1990–2025 but were carbon sources in NAI countries. Regional values showed opposite trends (not shown, available in Tubiello and Obli-Laryea, 2026), with CSC in the Americas and Africa, indicating a net source over the entire period, about on average for 2020–2025. Conversely, Europe and Asia were net overall sinks, about in the most recent period. Forests in Oceania switched from small net sources in 2010–2020 to net sinks in 2020–2025.
Over the time-series 1990–2025, the FAO data showed that NFC emissions substantially decreased over time, globally from 5–7 Gt CO2 yr−1 on average during 1990–2000 to 3–4 Gt CO2 yr−1 in 2020–2025 (Fig. 3). This trend was almost entirely driven by NAI countries, which were responsible for about 90 % of world total emissions. Regionally, the Americas (2.4 Gt CO2 yr−1 during 2020–2025) and Asia (0.4 Gt CO2 yr−1) were the main drivers of the global trends in NFC, each showing reductions in deforestation emissions greater than 1 Gt CO2 yr−1. The FAO data furthermore showed that in Africa, NFC increased over time, reaching a peak of about 1.8 Gt CO2 yr−1 during 2010–2015, then decreasing to less than 1.0 Gt CO2 yr−1 in 2020–2025. Europe and Oceania were minor global contributors.
Over the time-series 1990–2025, FAO results showed large net removals on forest land, with FL as strong as on average during 2000–2010 and decreasing to on average during 2020–2025 (Table 4 and Fig. 3). These removals were equally divided between AI and NAI aggregates in the most recent period, about −2 to on average over 2020–2025 (Table 4), whereas in earlier periods they were stronger in AI countries. Results showed consistent net forest removals for all regions except for Africa. Specifically, Europe, Asia and the Americas had large net removals on forest land, with Europe being the most substantial at about in 2020–2025. Additionally, the FAO data suggested opposite regional trends in removal strength, with decreases of 15 % in Europe and by nearly 40 % in the Americas from 2000–2025 but increases of 30 % in Asia. Africa and Oceania had comparatively small net fluxes on forest land, with less notable trends.
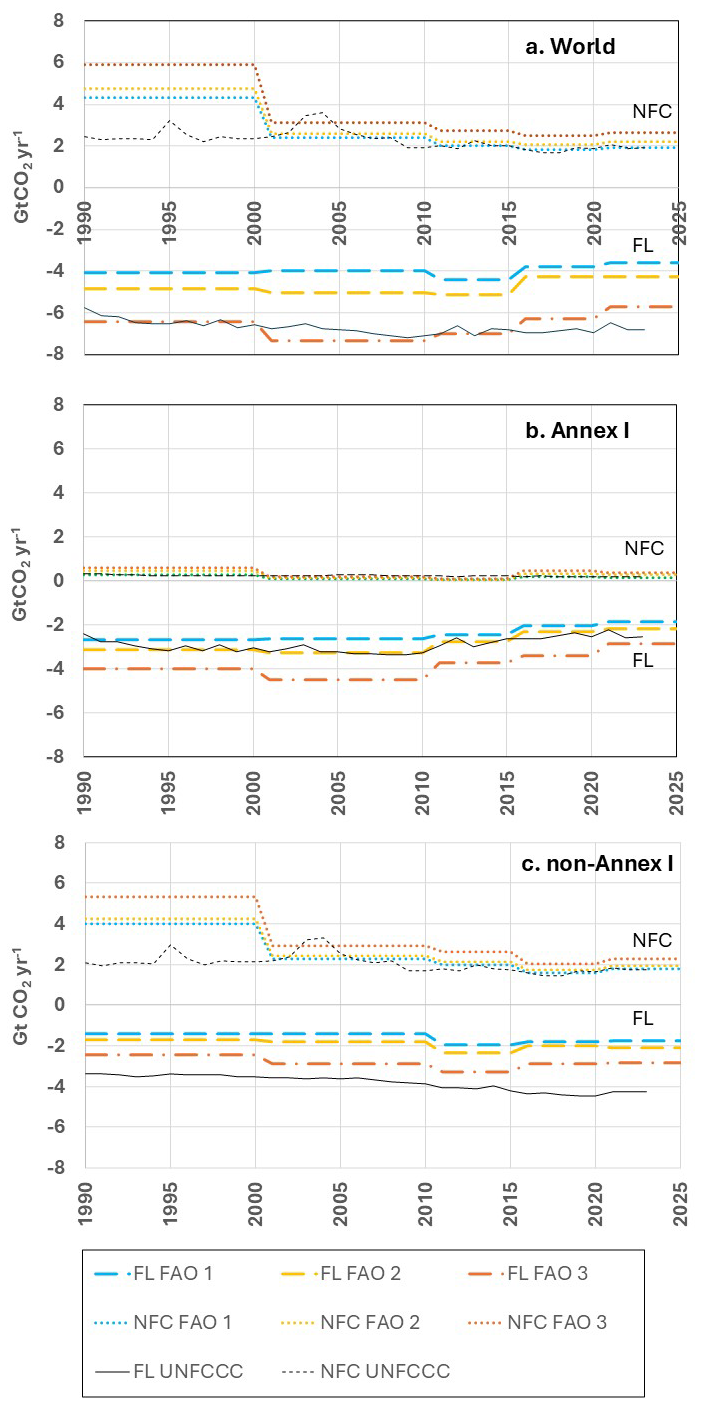
Figure 3Net forest emission/removal estimates, 1990–2025 for FL, NFC, for three FAO models and UNFCCC data. (a) World total; (b) AI; and (c) NAI.
3.2.2 Comparisons of FAO and UNFCCC emission/removal fluxes
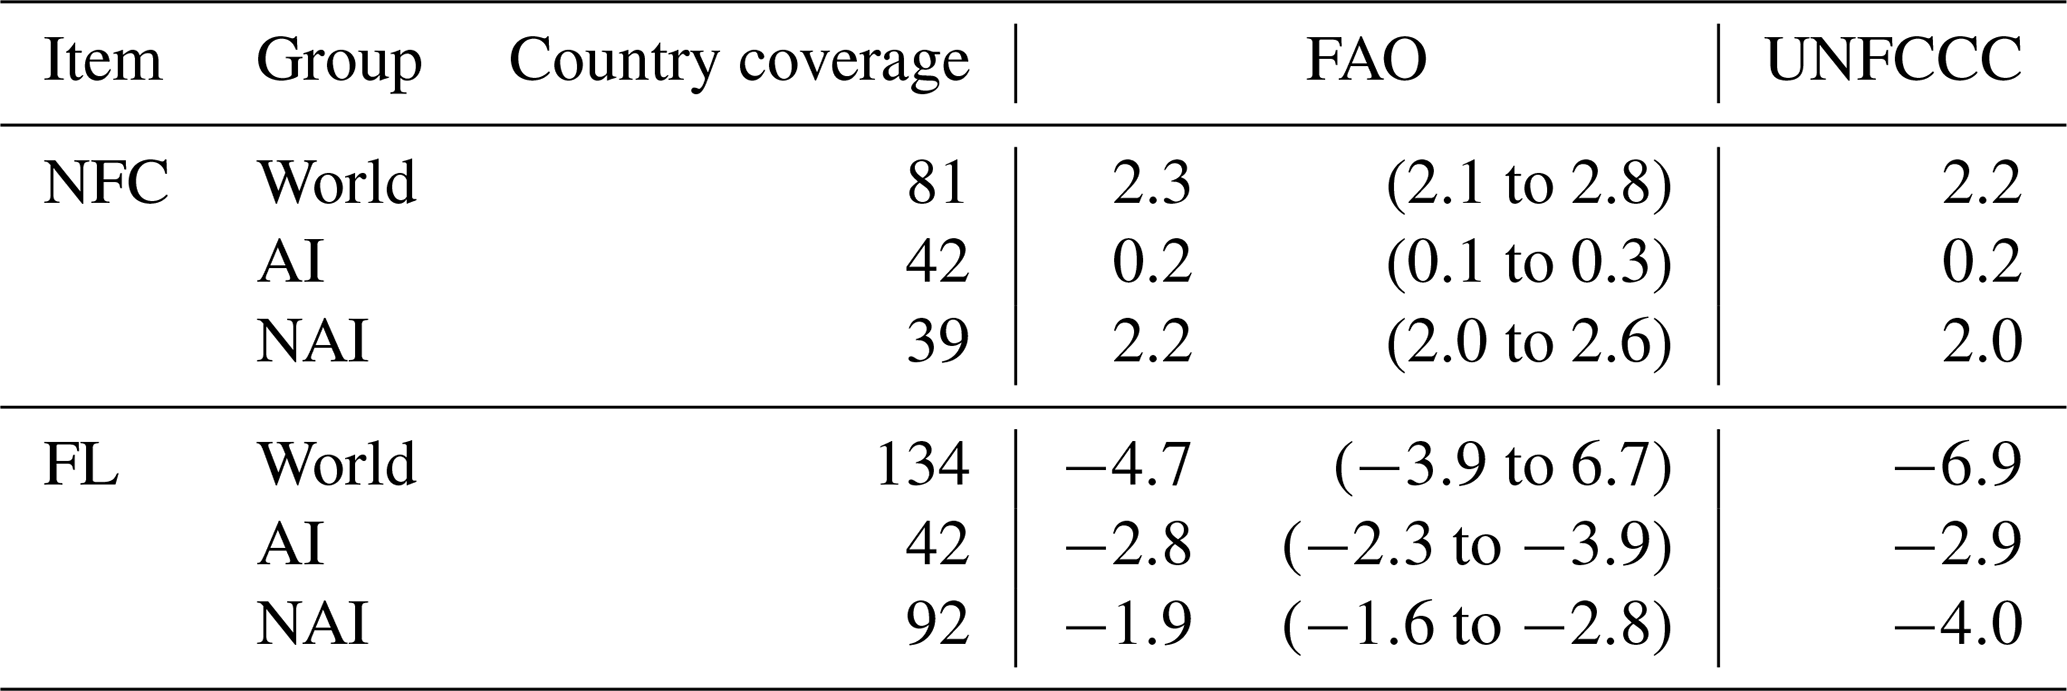
We compared FAO NFC and FL results to the UNFCCC data collected and re-disseminated within FAOSTAT. To this end, we computed new World, AI and NAI aggregates, limited to the countries present in the UNFCCC dataset. We performed such comparisons over the entire time series 1990–2025 (Fig. 3a–c), as well as in terms of long-term 2001–2023 averages (Table 5), consistently with published analyses (Grassi et al., 2022; Melo et al., 2026). Results of both timeseries comparison and long-term averages indicated good agreement of FAO estimates with UNFCCC data – with the range of FAO models consistently including the corresponding UNFCCC values – across flux category (NFC, FL) and regional aggregate (World, AI, NAI) combinations, except for FL fluxes for the NAI aggregate. Within the underlying uncertainties implied that results presented herein were not statistically different, our findings highlighted, at least qualitatively, a “sink gap” in NAI countries, i.e., stronger forest removals in UNFCCC data vs FAO estimates, ranging between 1.2–2.4 Gt CO2 yr−1 – with the smaller gap corresponding to FAO 3 model estimates (Table 5). As discussed in more detail in the next section, this gap was largely generated in countries reporting zero carbon stock density change to FAO via the FRA, but conversely strong removals on forest land to UNFCCC. Furthermore, it is worth noting that the decline of the global FL sink seen in the FAO data, while also supported by recent independent work (Rossi et al., 2026), could at least in part be attributed to incomplete reporting of C stocks for the year 2025 period, as discussed previously.
Table 4FAO 2025 net forest emission/removal estimates (Gt CO2 yr−1) corresponding to FRA periods, by FAO model. Fluxes categories include carbon stock change (CSC) and its two components, emission/removal fluxes on forest land (FL) and emissions from net forest conversion (NFC). FAO models include different carbon pools. FAO 1: above- and below-ground living biomass; FAO 2: above- and below-ground living biomass, litter and dead wood; FAO 3: above- and below-ground living biomass, litter, dead wood and soils.
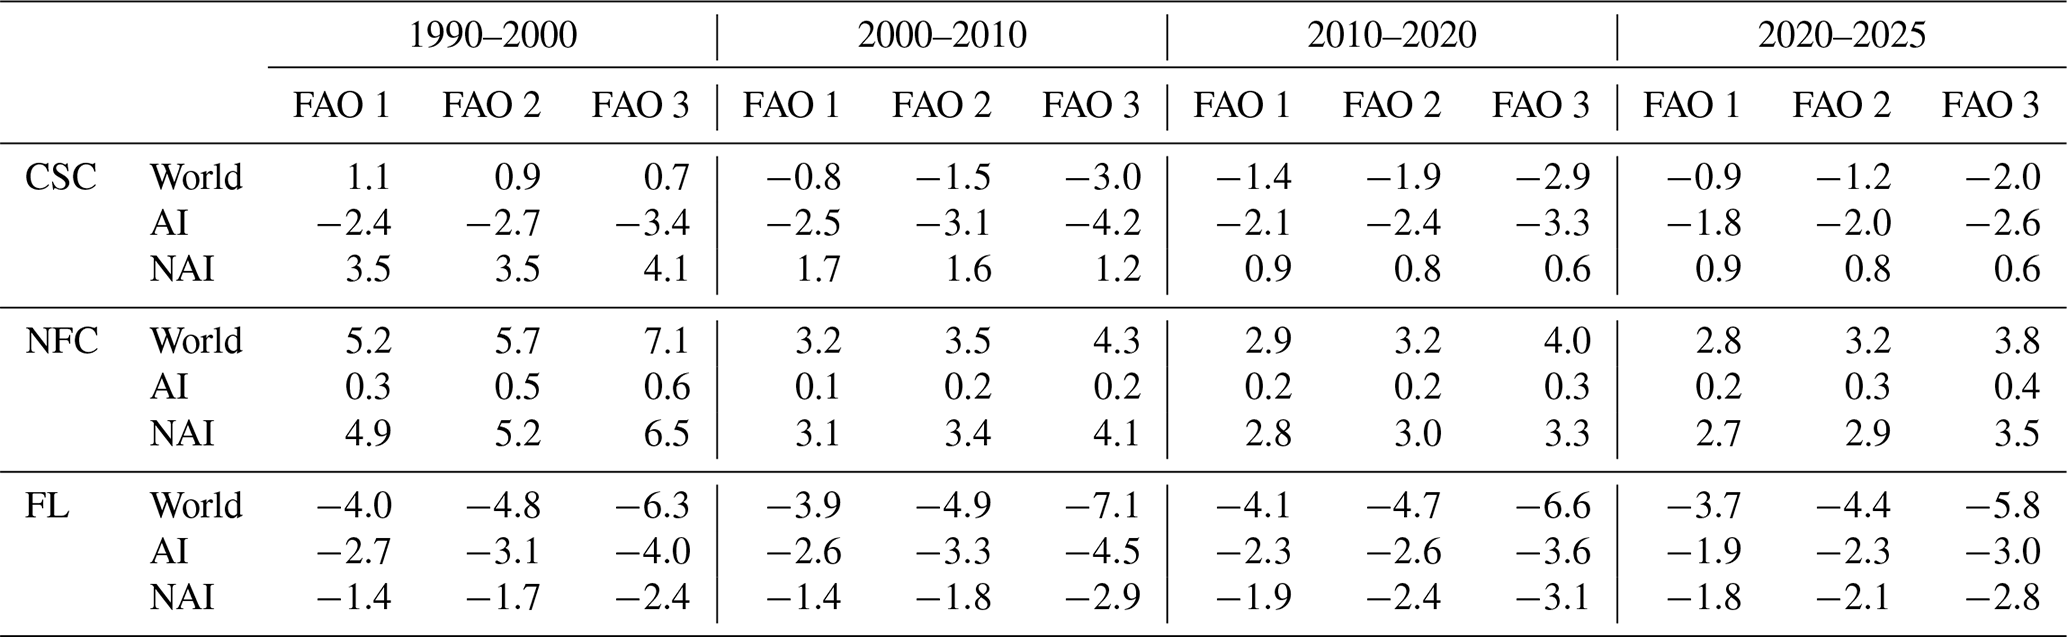
Table 5Average 2001–2023 FAO and UNFCCC fluxes (Gt CO2 yr−1). World, Annex I (AI) and non-Annex I (NAI) regional aggregates, limited to countries reporting to UNFCCC. FAO 2 estimates provided with the range defined by FAO 1, FAO 3 models.
3.2.3 Country results
Country-level analyses were performed over the same long-term 2001–2023 average used above. Results underscored that the observed global and regional differences between FAO and UNFCCC were driven by a relatively small number of countries, typically no more than 10–15, most of them countries with large forest area. Specifically, world total NFC emissions were mainly driven by just two countries, Brazil and the Democratic Republic of Congo (DRC), which were responsible for roughly 70 % of the world total according to both FAO and UNFCCC data, with the top ten countries covering about 90 % (Table 6).
Table 6Top ten NFC fluxes, 2001–2023 averages (Gt CO2 yr−1), ordered by UNFCCC values. FAO 2 estimates provided with the range defined by FAO 1, FAO 3 models.
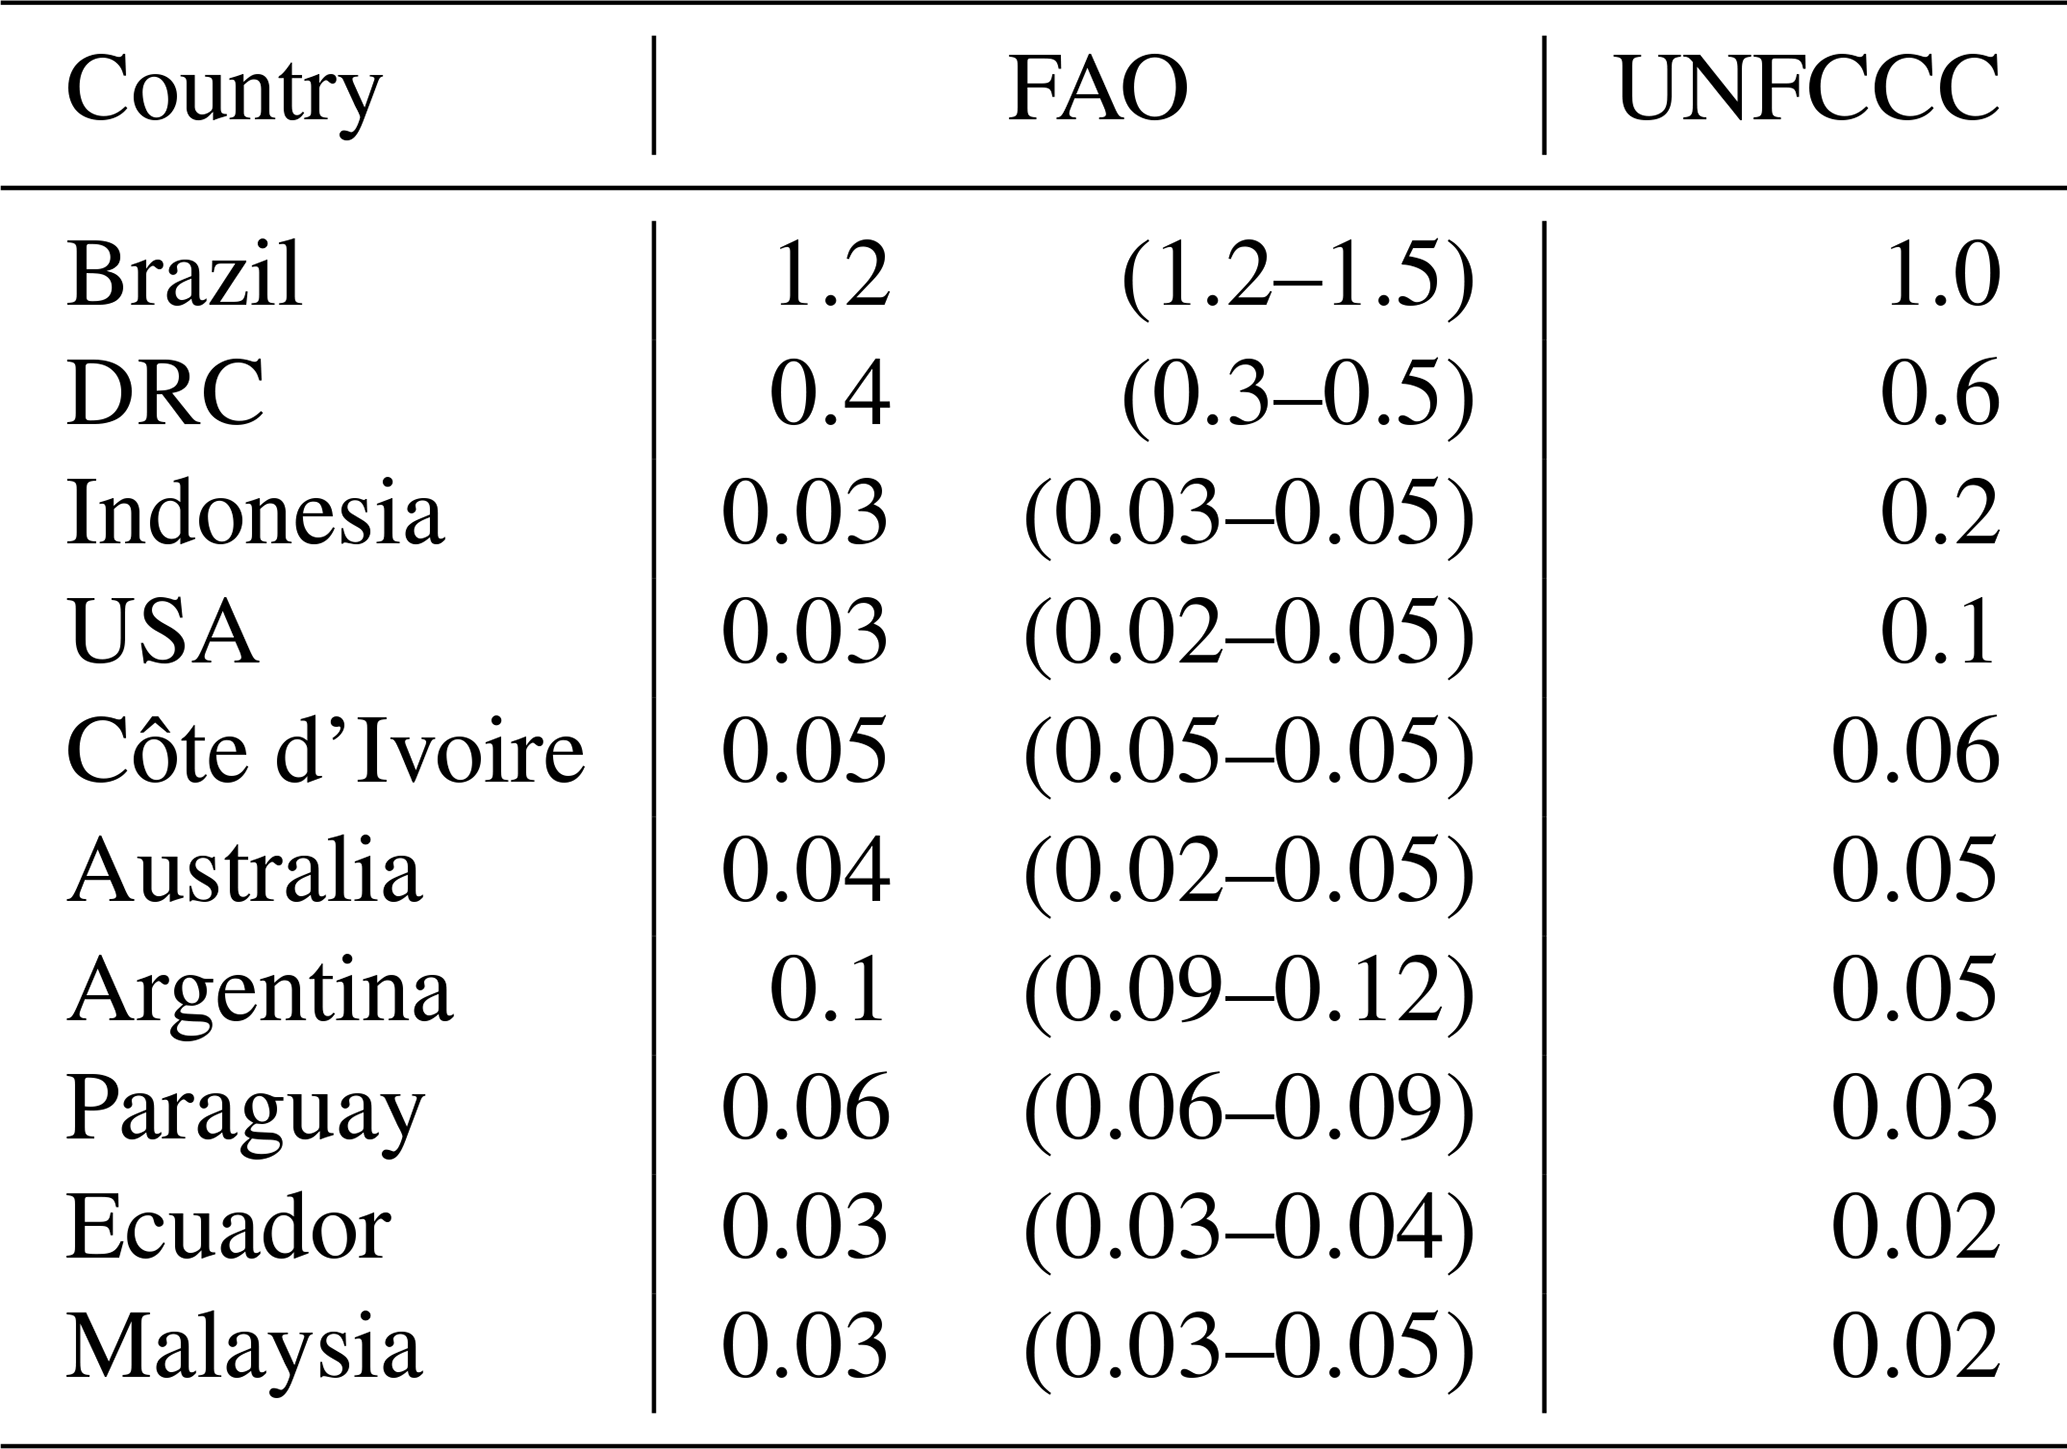
FAO NFC estimates were consistent with UNFCCC data for Brazil, Cote d'Ivoire, Australia and Ecuador. Conversely, they were smaller than UNFCCC for DRC, Indonesia and United States of America (USA), while they were larger for Argentina, Paraguay and Malaysia. Additionally, the FAO dataset included several countries that either had UNFCCC data but did not appear within the UNFCCC top ten (Fig. 4), such as Canada (0.06–0.15 Gt CO2 yr−1), or did not appear in the UNFCCC dataset collected for this work, such as Peru (0.1–0.2 Gt CO2 yr−1), Myanmar (0.07–0.09 Gt CO2 yr−1), Colombia (0.08–0.09 Gt CO2 yr−1), Tanzania (0.05–0.08 Gt CO2 yr−1), Bolivia (0.06–0.08 Gt CO2 yr−1) and Cameroon (0.05–0.06 Gt CO2 yr−1).
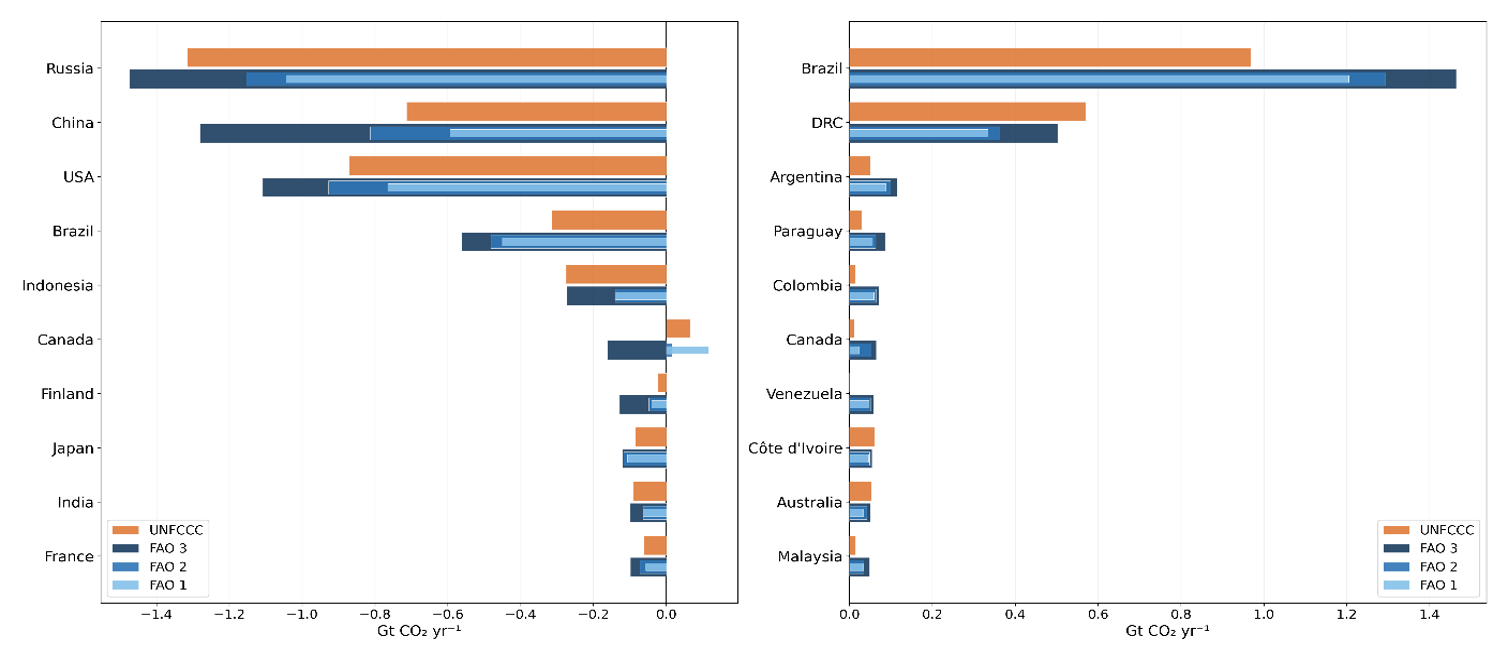
Figure 4Comparison of FAO and UNFCCC country data for top 10 NFC emissions and FL removals, 2001–2023 averages. FAO estimates include all three carbon stock change models, with FAO 2 representing the central value and FAO 1 and FAO 3 providing the range of FAO estimates.
With regards to FL fluxes, both FAO and UNFCCC data showed that just three countries, Russian Federation, USA and China, were responsible for 40 %–60 % of world total removals, with the top ten countries representing 70 %–80 % of the total (Table 7). Within the top ten countries, FAO estimates were consistent with UNFCCC data for the Russian Federation, USA, and China. They were substantially smaller than UNFCCC for DRC, Mali, Venezuela, Malaysia and Mexico, and substantially larger for Brazil. The drivers of these country-level discrepancies were further investigated and presented in the discussion section below. Finally, FAO identified possible forest sinks that did not appear within the UNFCCC top ten (Fig. 4), albeit with a large noise across FAO models. These included Canada (), India (), Belarus (), France () and Vietnam ().
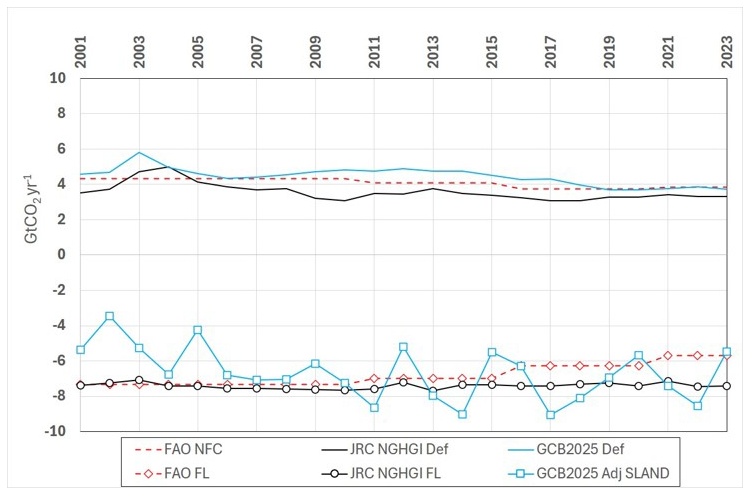
Figure 5Comparison of FAO net forest emission/removal estimates (all carbon pools), 2001–2023, to GB2025. FAO NFC: Net forest conversion (this work); FAO FL: Forest land (this work); JRC NGHGI Def: country deforestation emissions compiled by the Joint Research Center; JRC NGHGI FL: country forest land removals compiled by the Joint Research Center; GCB2025 def: deforestation component of the GCB2025 ELUC flux; GCB2025 SLAND: forest component of the GCB2025 SLAND (net fluxes from afforestation/reforestation, shifting cultivation, wood harvest, plus net land sink adjusted to align to NGHGI).
3.3 Discrepancies in forest land removals
Notwithstanding the uncertainty discussed earlier, which makes most of the differences highlighted above not statistically significant, we performed additional country-level analyses to better characterize, at least qualitatively, the “sink gap” between the FAO and UNFCCC data on forest removals, amounting globally to roughly 2 (−3.0 to −0.2) Gt CO2 yr−1 (Table 5). Extending the country-level discrepancies identified in Table 7, our analysis showed that in NAI countries the discrepancy was driven by a dozen countries (Table 8), concentrated in tropical Africa (Mali, DRC, Madagascar, Cameroon, Gabon and Namibia), Latin America and the Caribbean (Venezuela, Guyana and Mexico) and Southeast Asia (Indonesia and Malaysia). Additionally, Brazil, USA and Nigeria represented opposite trends, i.e., cases in which the FAO removals on forest land were larger than UNFCCC. Remarkably, the “outlier” countries in Table 8 were virtually the same identified in recent similar comparisons developed in the context of the LULUCF data hub (Melo et al., 2026). This suggested that this list of countries was likely not random, making it sensible to investigate reasons for the observed discrepancy. While this is a topic deserving its own independent effort, we note that certain data typologies could be readily identified, building on previous work (Grassi et al., 2022; Melo et al., 2026). For instance, our analysis showed that all six outlier countries in tropical Africa had reported to FAO zero carbon stock density change to FAO via the FRA, while reporting strong net forest removals to UNFCCC, corresponding to a cumulative FAO/UNFCCC discrepancy of 1.3 Gt CO2 yr−1. To this end, Melo et al. (2026) have suggested that UNFCCC-reported forest removals for Mali, Malaysia and Namibia might be “not plausible.” We currently lack complete observations, however, to conclude whether FAO or the UNFCCC data are closer to a true value. Thus, a first typology characterizing the differences observed between FAO and UNFCCC identified herein relates to data quality issues. This could be usefully addressed by FAO in coordination with UNFCCC and interested partners, through dedicated statistical capacity development programs in identified countries, aimed at improving the accuracy and the alignment of forest activity data used in multiple reporting.
Table 7Top ten FL fluxes, 2001–2023 averages (Gt CO2 yr−1), ordered by UNFCCC values. FAO 2 estimates provided with the range defined by FAO 1, FAO 3 models.
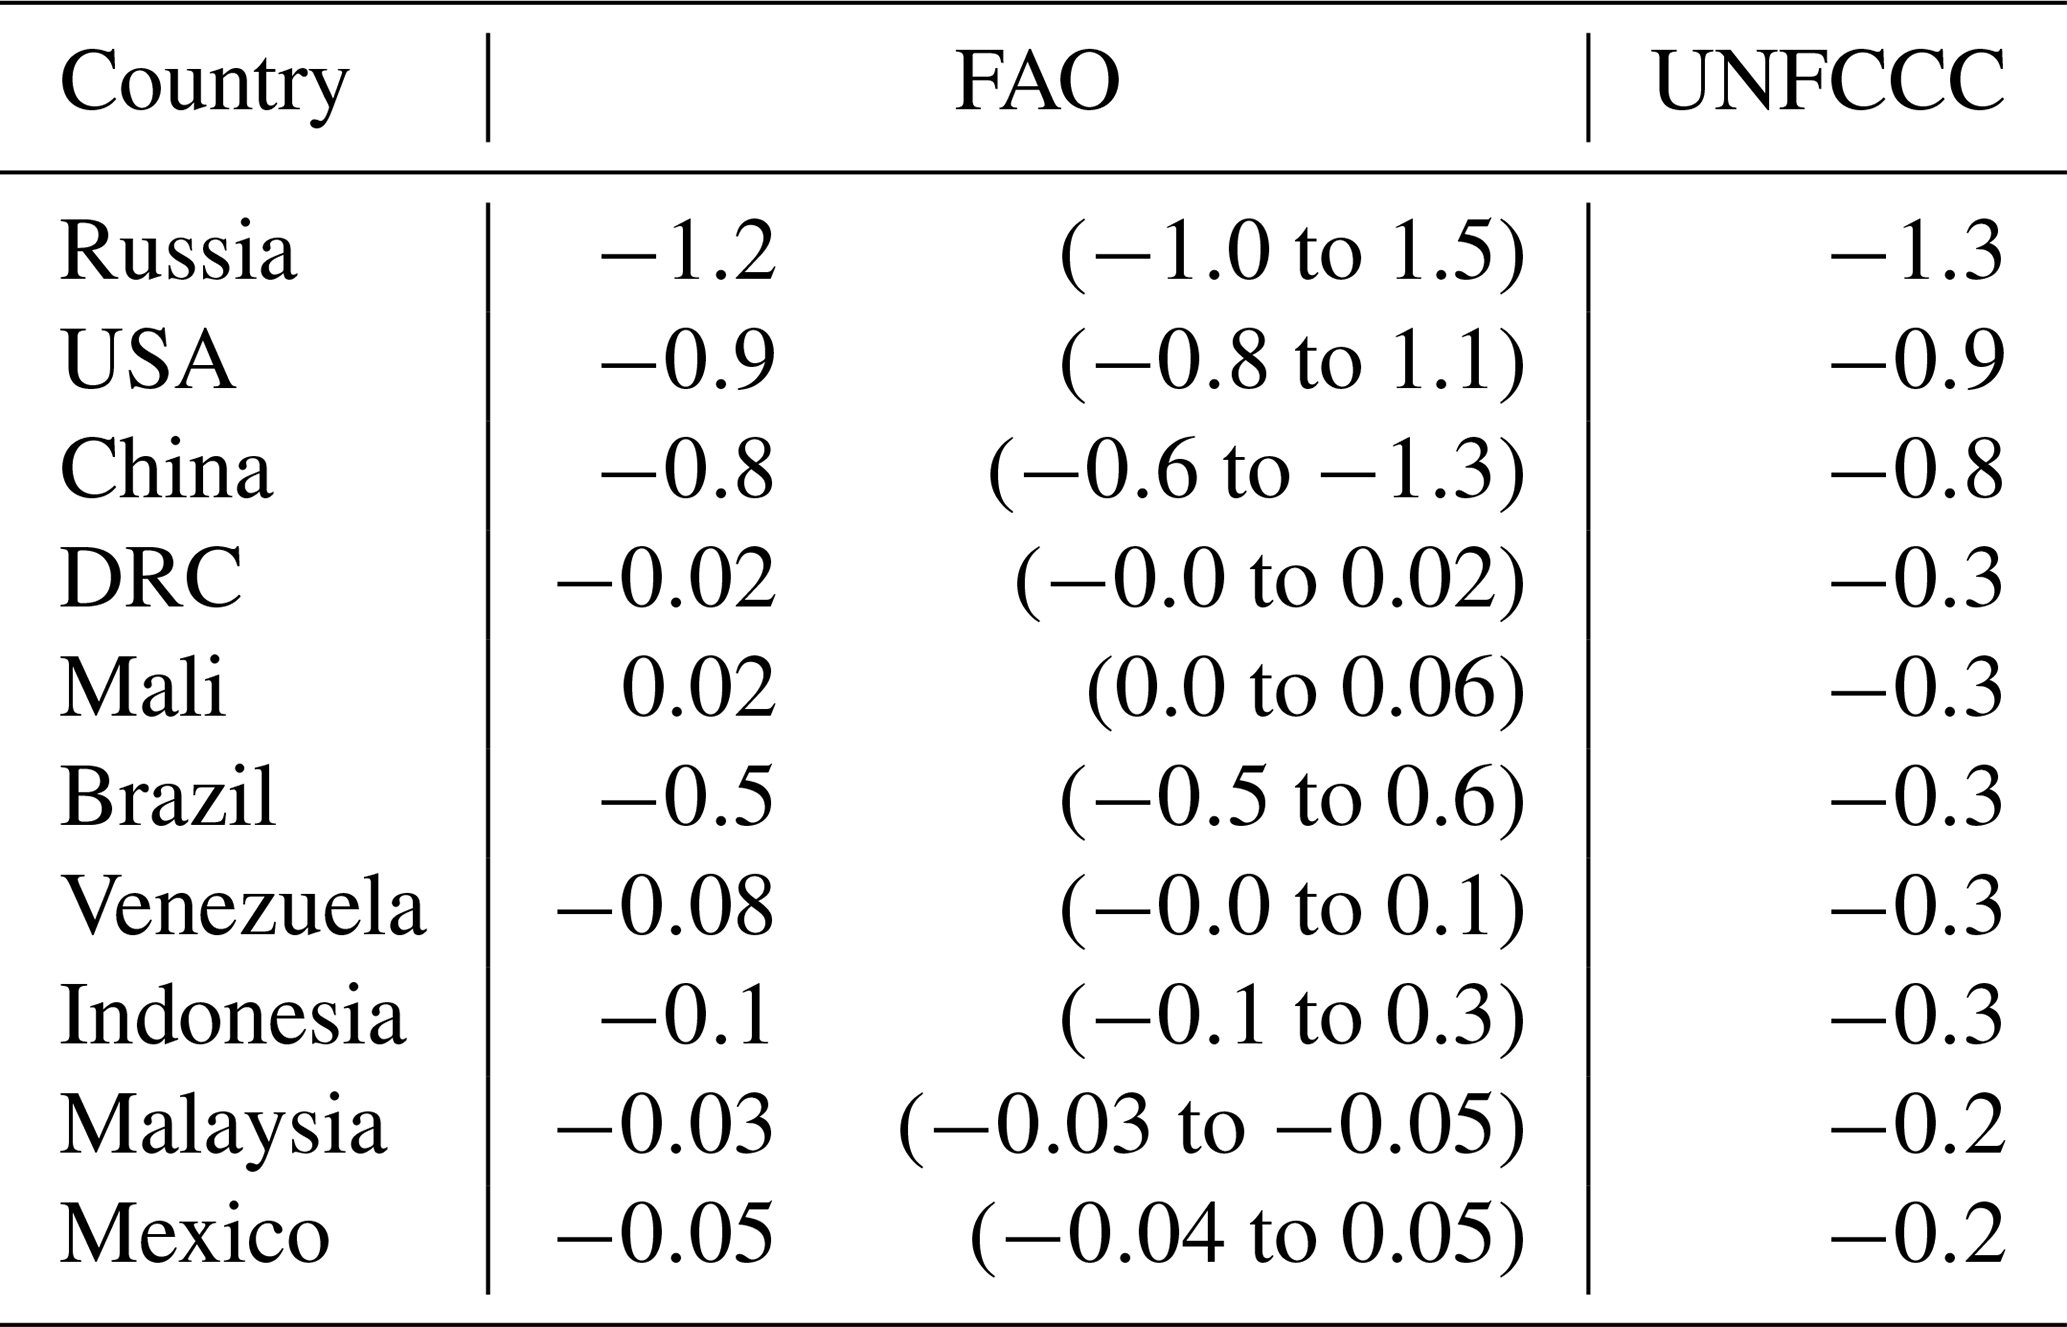
Table 8Comparison of FAO 2 and UNFCCC FL fluxes (2001–2023 average), ordered by FAO-UNFCCC difference, for countries with removals greater than 0.1 Gt CO2 yr−1.
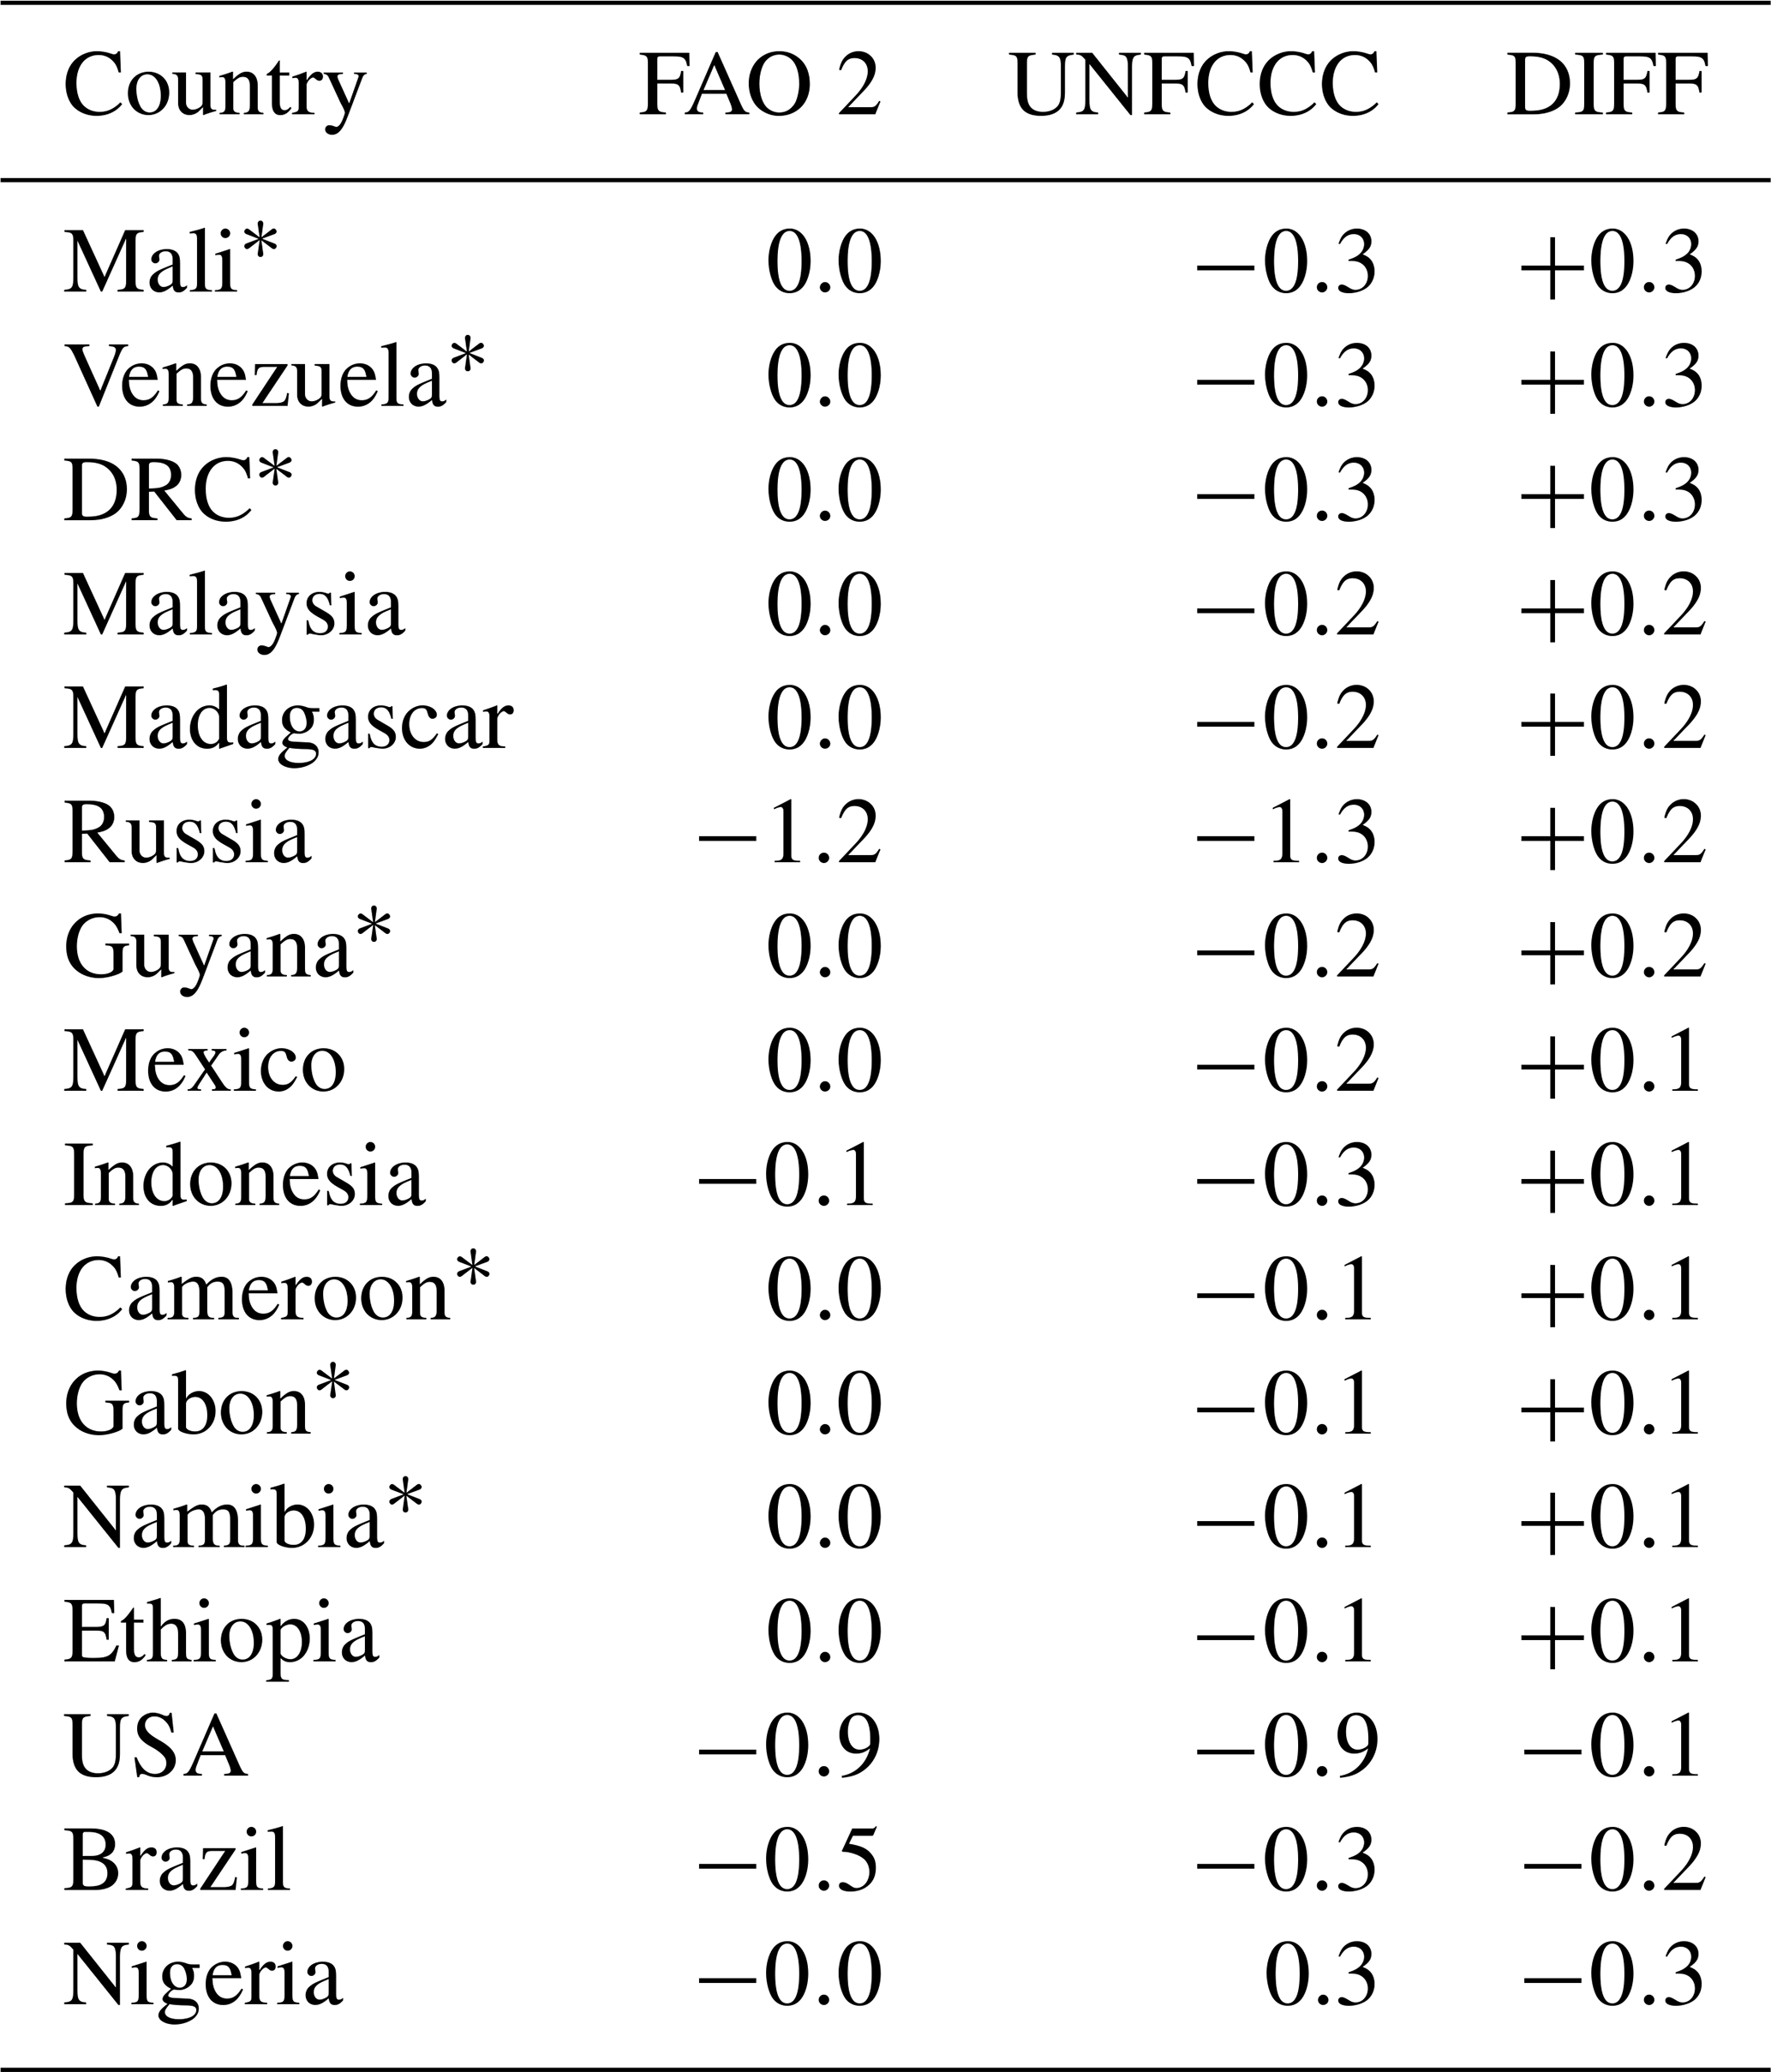
* Constant carbon stock density data in FRA.
A second typology in the observed FAO/UNFCCC discrepancies was related to land use coverage, specifically when UNFCCC country-reported managed forest area was either smaller or larger than the corresponding FAO forest area. Namibia exemplified the latter case, perhaps in the extreme. In this country, as discussed previously, the UNFCCC managed forest area was nearly 10 times larger than the FAO value, allowing for carbon accounting in woody savannah encroachments areas (Stevens et al., 2017; IPCC, 2022). This led to much larger UNFCCC removals on forest land than could be estimated by FAO on much smaller forest areas. Conversely, the former case, i.e., UNFCCC-reported managed forest area smaller than FAO forest area, has been discussed in detail in the literature (Grassi et al., 2022). We found that only a few, albeit very large forest area countries, fit this typology. Among them, Brazil was the most extreme case, reporting to UNFCCC managed land areas that were only about 60 % the FAO-reported forest area. Adjusting the much larger FAO removal estimates by this proportion was in fact sufficient to align FAO and UNFCCC forest removal data for this country.
We conclude from the above analysis that the discrepancies between FAO and UNFCCC data, albeit important, were concentrated in a handful of countries, suggesting that the underlying FAO and UNFCCC forest activity data were already well aligned overall.
3.4 FAO estimates and the Global Carbon Budget
In addition to comparisons to UNFCCC, we compared the FAO net forest emission/removal estimates to the most recent Global Carbon Budget 2025 data (GCB20205; Friedlingstein et al., 2026), as described earlier in the methods section. Results showed that FAO estimates of world total NFC and FL fluxes were in very close agreement with the GCB2025 (Fig. 5). The latter dataset indicated world total deforestation emissions of roughly 4 Gt CO2 yr−1, counterbalanced by forest removals of −6 to .
Full dataset is available on Zenodo (Tubiello and Obli-Laryea, 2026) at https://doi.org/10.5281/zenodo.20085666.
Our detailed analysis based on the most recent FRA 2025 data showed that the FAO net forest emissions and removals dataset 1990–2025 represents a useful reference in support of country reporting processes and a solid contributor to global assessments. First, we found that land use boundary issues, though important in interpreting differences in FAO and UNFCCC at country level, were not a major driver of discrepancy globally. Specifically, apart from a small set of countries for which either smaller or larger managed forest areas made a difference in the UNFCCC FAO comparisons, most countries reported managed forest areas to UNFCCC that were equal to the total forest land area they reported to FAO. Hence flux estimates made on the FAO forest land area could be considered anthropogenic in the sense of the IPCC managed land use proxy, considering the overall consistency of FAO and UNFCCC reported area values. At the same time, we found that country-level differences continue to limit the comparability of FAO and UNFCCC emission estimates in a limited but important set of countries – particularly Brazil, Canada, China, Russia, and Namibia – for which future reconciliation is needed.
Secondly, we found a substantial agreement of the new FAO estimates with recent NGHGI-adjusted Global Carbon Budget data, following inclusion of all relevant carbon pools in the FAO calculations. Finally, we argued that while the knowledge gained through the comparison of multiple independent approaches was extremely useful in highlighting areas of agreement and disagreement – and therefore in providing insight into necessary future work to improve national, regional and global assessments – the large and specific uncertainties underlying FAO, NGHGI and GCB data need to be acknowledged in country data comparisons. We nonetheless strongly support the recommendations that are emerging in the current literature, recently outlined in the context of the JRC LULUCF data hub (Melo et al., 2026), towards the development of internationally coordinated capacity development programs. To this end, we underline that FAO is uniquely positioned to contribute to such efforts, as the UN agency with the official mandate to collect, analyze and disseminate forest and land use statistics from its member countries and to support national experts via dedicated capacity development activities. Our main goal was and remains to improve the quality, comparability and consistency of country data submitted to relevant international processes, in support of improved evidence-based decision making for effective action on climate change and forests.
The supplement related to this article is available online at https://doi.org/10.5194/essd-18-6799-2026-supplement.
FNT led the development and analysis of the FAOSTAT data. AP, ÖJ and AB provided the FRA 2025 data and contributed to data analysis. GO-L, NR, MP, NW, RB, RDC and GC contributed data analysis and helped develop the FAOSTAT database. FNT and GO led comparisons of FAO, UNFCCC and GCB data.
At least one of the (co-)authors is a member of the editorial board of Earth System Science Data. The peer-review process was guided by an independent editor, and the authors also have no other competing interests to declare.
The views expressed in this publication are those of the authors and do not necessarily reflect the views or policies of FAO.
Publisher's note: Copernicus Publications remains neutral with regard to jurisdictional claims made in the text, published maps, institutional affiliations, or any other geographical representation in this paper. The authors bear the ultimate responsibility for providing appropriate place names. Views expressed in the text are those of the authors and do not necessarily reflect the views of the publisher.
This work was made possible by the FAO regular budget.
This paper was edited by Hanqin Tian and reviewed by Giacomo Grassi and one anonymous referee.
Araza, A., Herold, M., de Bruin, S., Ciais, P., Gibbs, D. A., Harris, N., Santoro, M., Wigneron, J.-P., Yang, H., Málaga, N., Nesha, K., Rodriguez-Veiga, P., Brovkina, O., Brown, H. C. A., Chanev, M., Dimitrov, Z., Filchev, L., Fridman, J., Garcia, A., GikovLeen Govaere, A., Dimitrov, P., Moradi, F., Esquivel Muelbert, A., Novotny, J., Pugh, T. A. M., Schelhaas, M.-J., Schepaschenko, D., Sterenczak, K., and Hein, L.: Past decade above-ground biomass change comparisons from four multi-temporal global maps, Int. J. Appl. Earth Obs., 118, 103274, https://doi.org/10.1016/j.jag.2023.103274, 2023.
BIPM, IEC, IFCC, ILAC, ISO, IUPAC, IUPAP, and OIML: Guide to the expression of uncertainty in measurement. Joint Committee for Guides in Metrology, JCGM 100, https://www.bipm.org/documents/20126/2071204/JCGM_100_2008_E.pdf (last access: 19 August 2026), 2008.
Conchedda, G. and Tubiello, F. N.: Drainage of organic soils and GHG emissions: validation with country data, Earth Syst. Sci. Data, 12, 3113–3137, https://doi.org/10.5194/essd-12-3113-2020, 2020.
FAO: Keeping an eye on SDG 15, Rome, FAO, https://openknowledge.fao.org/handle/20.500.14283/i7334en (last access: 19 August 2026), 2017.
FAO: Global Forest Resources Assessment 2020: Main report, Rome, https://doi.org/10.4060/ca9825en, 2020.
FAO: The State of the World's Forests 2024 – Forest-sector innovations towards a more sustainable future, Rome, FAO, https://doi.org/10.4060/cd1211en, 2024.
FAO: Global Forest Resources Assessment 2025, Rome, https://doi.org/10.4060/cd6709en, 2025a.
FAO: FAOSTAT Emissions from Forests, http://www.fao.org/faostat/en/#data/GF (last access: 19 August 2026), FAO, Rome, Italy, 2025b.
FAO: Greenhouse gas emissions from agrifood systems – Global, regional and country trends, 2001–2023, FAOSTAT, Analytical Brief Series, 115, Rome, https://doi.org/10.4060/cd7300en, 2025c.
FAO: Land statistics 2001–2023: Global, regional and country trends. FAOSTAT Analytical Brief Series 107, Rome, https://doi.org/10.4060/cd5765en, 2025d.
Federici, S., Tubiello, F. N., Salvatore, M., Jacobs, H., and Schmidhuber, J.: New estimates of CO2 forest emissions and removals: 1990–2015, Forest Ecol. Manag., 352, 89–98, 2015.
Friedlingstein, P., O'Sullivan, M., Jones, M. W., Andrew, R. M., Bakker, D. C. E., Hauck, J., Landschützer, P., Le Quéré, C., Li, H., Luijkx, I. T., Peters, G. P., Peters, W., Pongratz, J., Schwingshackl, C., Sitch, S., Canadell, J. G., Ciais, P., Aas, K., Alin, S. R., Anthoni, P., Barbero, L., Bates, N. R., Bellouin, N., Benoit-Cattin, A., Berghoff, C. F., Bernardello, R., Bopp, L., Brasika, I. B. M., Chamberlain, M. A., Chandra, N., Chevallier, F., Chini, L. P., Collier, N. O., Colligan, T. H., Cronin, M., Djeutchouang, L. M., Dou, X., Enright, M. P., Enyo, K., Erb, M., Evans, W., Feely, R. A., Feng, L., Ford, D. J., Foster, A., Fransner, F., Gasser, T., Gehlen, M., Gkritzalis, T., Goncalves De Souza, J., Grassi, G., Gregor, L., Gruber, N., Guenet, B., Gürses, Ö., Harrington, K., Harris, I., Heinke, J., Hurtt, G. C., Iida, Y., Ilyina, T., Ito, A., Jacobson, A. R., Jain, A. K., Jarníková, T., Jersild, A., Jiang, F., Jones, S. D., Kato, E., Keeling, R. F., Klein Goldewijk, K., Knauer, J., Kong, Y., Korsbakken, J. I., Koven, C., Kunimitsu, T., Lan, X., Liu, J., Liu, Z., Liu, Z., Lo Monaco, C., Ma, L., Marland, G., McGuire, P. C., McKinley, G. A., Melton, J. R., Monacci, N., Monier, E., Morgan, E. J., Munro, D. R., Müller, J. D., Nakaoka, S.-I., Nayagam, L. R., Niwa, Y., Nutzel, T., Olsen, A., Omar, A. M., Pan, N., Pandey, S., Pierrot, D., Qin, Z., Regnier, P., Rehder, G., Resplandy, L., Roobaert, A., Rosan, T. M., Rödenbeck, C., Schwinger, J., Skjelvan, I., Smallman, T. L., Spada, V., Sreeush, M. G., Sun, Q., Sutton, A. J., Sweeney, C., Swingedouw, D., Séférian, R., Takao, S., Tatebe, H., Tian, H., Tian, X., Tilbrook, B., Tsujino, H., Tubiello, F., van Ooijen, E., van der Werf, G. R., van de Velde, S. J., Walker, A. P., Wanninkhof, R., Yang, X., Yuan, W., Yue, X., and Zeng, J.: Global Carbon Budget 2025, Earth Syst. Sci. Data, 18, 3211–3288, https://doi.org/10.5194/essd-18-3211-2026, 2026.
Grassi, G., Conchedda, G., Federici, S., Abad Viñas, R., Korosuo, A., Melo, J., Rossi, S., Sandker, M., Somogyi, Z., Vizzarri, M., and Tubiello, F. N.: Carbon fluxes from land 2000–2020: bringing clarity to countries' reporting, Earth Syst. Sci. Data, 14, 4643–4666, https://doi.org/10.5194/essd-14-4643-2022, 2022.
Grassi, G., Schwingshackl, C., Gasser, T., Houghton, R. A., Sitch, S., Canadell, J. G., Cescatti, A., Ciais, P., Federici, S., Friedlingstein, P., Kurz, W. A., Sanz Sanchez, M. J., Abad Viñas, R., Alkama, R., Bultan, S., Ceccherini, G., Falk, S., Kato, E., Kennedy, D., Knauer, J., Korosuo, A., Melo, J., McGrath, M. J., Nabel, J. E. M. S., Poulter, B., Romanovskaya, A. A., Rossi, S., Tian, H., Walker, A. P., Yuan, W., Yue, X., and Pongratz, J.: Harmonising the land-use flux estimates of global models and national inventories for 2000–2020, Earth Syst. Sci. Data, 15, 1093–1114, https://doi.org/10.5194/essd-15-1093-2023, 2023.
IPCC: 2006 IPCC Guidelines for National Greenhouse Gas Inventories, Prepared by the National Greenhouse Gas Inventories Programme, edited by: Eggleston, H. S., Buendia, L., Miwa, K., Ngara, T., and Tanabe, K., IGES, Japan, ISBN 4-88788-032-4, 2006.
IPCC: Summary for Policymakers, in: Climate Change and Land: an IPCC special report on climate change, desertification, land degradation, sustainable land management, food security, and greenhouse gas fluxes in terrestrial ecosystems, edited by: Shukla, P. R., Skea, J., Calvo Buendia, E., Masson-Delmotte, V., Pörtner, H.-O., Roberts, D. C., Zhai, P., Slade, R., Connors, S., van Diemen, R., Ferrat, M., Haughey, E., Luz, S., Neogi, S., Pathak, M., Petzold, J., Portugal Pereira, J., Vyas, P., Huntley, E., Kissick, K., Belkacemi, M., and Malley, J., IPCC, https://doi.org/10.1017/9781009157988.001, 2019a.
IPCC: Refinement to the 2006 IPCC Guidelines for National Greenhouse Gas Inventories, edited by: Calvo Buendia, E., Tanabe, K., Kranjc, A., Baasansuren, J., Fukuda, M., Ngarize, S., Osako, A., Pyrozhenko, Y., Shermanau, P., and Federici, S., IPCC, Switzerland, https://www.ipcc.ch/report/2019-refinement-to-the-2006-ipcc-guidelines-for-national-greenhouse-gas-inventories/ (last access: 19 August 2026), 2019b.
IPCC, FAO, IFAD: Emerging activities to combat climate change – use of FAO data and IPCC GHG Inventory Guidelines for Agriculture and Land Use, edited by: Tubiello, F. N., Neeff, T., Tanabe, K., Baasansuren, J., and Fukuda, M., Report of the joint FAO-IPCC-IFAD Expert Meeting, Pub. IGES, Japan, ISBN 978-4-88788-188-4 2015.
Lamb, W. F., Andrew, R. M., Jones, M., Nicholls, Z., Peters, G. P., Smith, C., Saunois, M., Grassi, G., Pongratz, J., Smith, S. J., Tubiello, F. N., Crippa, M., Gidden, M., Friedlingstein, P., Minx, J., and Forster, P. M.: Differences in anthropogenic greenhouse gas emissions estimates explained, Earth Syst. Sci. Data, 18, 2549–2572, https://doi.org/10.5194/essd-18-2549-2026, 2026.
Mbow, C., Rosenzweig, C., Barioni, L. G., Benton, T. G., Herrero, M., Krishnapillai, M., Liwenga, E., Pradhan, P., Rivera Ferre, M. G., Sapkota, T., Tubiello, F. N., and Xu, Y.: Food Security, in: Climate Change and Land: an IPCC special report on climate change, desertification, land degradation, sustainable land management, food security, and greenhouse gas fluxes in terrestrial ecosystems, edited by: Shukla, P. R., Skea, J., Calvo Buendia, E., Masson Delmotte, V., Pörtner, H.-O., Roberts, D. C., Zhai, P., Slade, R., Connors, S., van Diemen, R., Ferrat, M., Haughey, E., Luz, S., Neogi, S., Pathak, M., Petzold, J., Portugal Pereira, J., Vyas, P., Huntley, E., Kissick, K., Belkacemi, M., and Malley, J., https://doi.org/10.1017/9781009157988.007, 2019.
Melo, J., Rossi, S., Achard, F., Alkama, R., Canadell, J. G., Federici, S., Friedlingstein, P., Gibbs, D., Harris, N., Heinrich, V., O’Sullivan, M., Peters, G. P., Pongratz, J., Rose, M., Roman-Cuesta, R., Sanz, M. J., Schwingshackl, C., Sitch, S., and Grassi, G.: The LULUCF Data Hub: translating global land use emissions estimates into the national GHG inventory framework, Earth Syst. Sci. Data Discuss. [preprint], https://doi.org/10.5194/essd-2025-631, in review, 2026.
Nabuurs, G.-J., Mrabet, R., Abu Hatab, A., Bustamante, M., Clark, H., Havlík, P., House, J., Mbow, C., Ninan, K. N., Popp, A., Roe, S., Sohngen, B., and Towprayoon, S.: Agriculture, Forestry and Other Land Uses (AFOLU), in: IPCC, 2022: Climate Change 2022: Mitigation of Climate Change. Contribution of Working Group III to the Sixth Assessment Report of the Intergovernmental Panel on Climate Change, edited by: Shukla, P. R., Skea, J., Slade, R., Al Khourdajie, A., van Diemen, R., McCollum, D., Pathak, M., Some, S., Vyas, P., Fradera, R., Belkacemi, M., Hasija, A., Lisboa, G., Luz, S., and Malley, J., Cambridge University Press, Cambridge, UK, New York, NY, USA, https://doi.org/10.1017/9781009157926.009, 2022.
Prosperi, P., Bloise, M., Tubiello, F. N., Conchedda, G., Rossi, S., Boschetti, L., Salvatore, M., and Bernoux, M.: New estimates of greenhouse gas emissions from biomass burning and peat fires using MODIS Collection 6 burned areas, Climatic Change, 161, 415–432, https://doi.org/10.1007/s10584-020-02654-0, 2020.
Rossi, S., Bourgoin, C., Melo, J., Ceccherini, G., Federici, S., Crippa, M., Achard, F., Colditz, R., Tubiello, F. N., Janssens-Maenhout, G., and Grassi, G.: The EDGAR-LULUCF Dataset of forest-related carbon emissions and removals, Earth Syst. Sci. Data Discuss. [preprint], https://doi.org/10.5194/essd-2026-454, in review, 2026.
Stevens, N., Lehmann, C. E. R., Murphy, B. P., and Bond, W. J.: Savanna woody encroachment is widespread across three continents, Glob. Change Biol., 23, 235–244, https://doi.org/10.1111/gcb.13409, 2017.
Tubiello, F. N. and Obli-Laryea, G.: FAO net forest emissions/removals 1990–2025, Zenodo [data set], https://doi.org/10.5281/zenodo.20085666, 2026.
Tubiello, F. N., Conchedda, G., Wanner, N., Federici, S., Rossi, S., and Grassi, G.: Carbon emissions and removals from forests: new estimates, 1990–2020, Earth Syst. Sci. Data, 13, 1681–1691, https://doi.org/10.5194/essd-13-1681-2021, 2021.
UNFCCC: GHG data from UNFCCC, https://unfccc.int/topics/mitigation/resources/registry-and-data/ghg-data-from-unfccc, last access: 15 March 2026.