the Creative Commons Attribution 4.0 License.
the Creative Commons Attribution 4.0 License.
 | 27 Jan 2026
The global Deep-time Sediment Nitrogen Isotopes in Marine Systems (DSMS-NI) database
Huyue Song
Thomas J. Algeo
Hui Zhang
Jianwei Peng
Yuyang Wu
Jiankang Lai
Xiang Shu
Hanchen Song
Lai Wei
Jincheng Zhang
Eva E. Stüeken
Stephen E. Grasby
Jacopo Dal Corso
Xiaokang Liu
Daoliang Chu
Li Tian
Qingzhong Liang
Xinchuan Li
Haijun Song
Stable nitrogen isotope records preserved in marine sediments provide critical insights into Earth's climate history and biospheric evolution. Although numerous studies have documented nitrogen isotope (δ15N) records for various geological systems (Archean to Recent) and paleogeographic settings, the scientific community remains constrained by the absence of a standardized database to systematically investigate their spatiotemporal evolution. Here, we present the database of Deep-time Sediment Nitrogen Isotopes in Marine Systems (DSMS-NI), a comprehensive global compilation of δ15N data and associated geochemical parameters, spanning a vast collection of sediment samples dating from the Recent to the Archean. This database encompasses 70 854 δ15N records derived from 417 publications, systematically organized with 31 metadata fields categories (e.g., chronostratigraphic ages, coordinates, lithology, metamorphic grade, sedimentary facies, references) encompassing 1 999 226 metadata. This repository further incorporates 130 proxy data fields, including 281 215 geochemical data spanning total organic carbon (TOC), total nitrogen (TN), and organic carbon isotopes (δ13Corg), major and trace elements and iron species. These integrated parameters enable evaluation of sample fidelity and factors influencing δ15N signatures. The DSMS-NI database will facilitate research for key geological intervals such as the Permian/Triassic boundary and the Cretaceous oceanic anoxic events (OAEs). Researchers can leverage temporal and paleogeographic information, alongside geochemical data, to conduct spatiotemporal analyses, thereby uncovering changes in deep-time marine nitrogen cycles and paleoenvironmental conditions. The database is open-access via the Geobiology portal (https://geobiologydata.cug.edu.cn/, last access: 30 April 2025), allowing users to access data and submit new entries to ensure continuous updates and expansion. This resource represents a vital foundation for studies in paleoclimate, paleoenvironment, and geochemistry, offering essential data for understanding long-term Earth-system processes. The data files described in this paper are available at https://doi.org/10.5281/zenodo.15117375 (Du et al., 2025a).
- Article
(4138 KB) - Full-text XML
- BibTeX
- EndNote


Nitrogen, as an essential nutrient and redox-sensitive element, plays a crucial role in biological evolution and environmental climate changes (Ader et al., 2016; Pellerin et al., 2024). Typically, nitrogen isotope compositions are reported as a relative deviation of sample's isotopic ratio relative to that of atmospheric N2, expressed in per mille (‰) as δ15N = () × 1000 ‰, where R=15N 14N. The δ15N record has become one of the primary tools for tracing the evolution of the nitrogen cycle and reconstructing redox conditions through deep time (Algeo et al., 2014; Sahoo et al., 2023; Du et al., 2024; Moretti et al., 2024). Advances in analytical techniques have facilitated rapid growth in the application of δ15N for paleoenvironmental studies in recent decades (Fig. 1; Zhong et al., 2023). Given nitrogen's short marine residence time of approximately 3000 years, which leads to regionally variable and rapidly shifting patterns (Gruber and Galloway, 2008), high-resolution δ15N datasets with detailed temporal and spatial coverage are critical for elucidating nitrogen cycle dynamics through Earth history.
Existing compilations of deep-time marine δ15N records exhibit significant limitations in term of temporal coverage and metadata compliance. Previous efforts have focused specifically on Precambrian to investigate the origins of microbial nitrogen metabolism and redox evolution during the Great Oxygenation Event (Thomazo et al., 2011; Stüeken et al., 2016, 2024; Kipp et al., 2018; Uveges et al., 2025). Other studies have targeted Phanerozoic systems (Algeo et al., 2014) or specific intervals such as the Paleozoic (Koehler et al., 2019), Cambrian (Wang et al., 2018; Liu et al., 2020), Carboniferous (Algeo et al., 2008), Triassic (Sun, 2024), and Cenozoic (Tesdal et al., 2013) to analyze key biological and environmental events. The largest compilation of data from pre-Cenozoic records contains fewer than 8000 δ15N entries (Stüeken et al., 2024). In contrast, Tesdal et al. (2013) compiled up to 33 352 entries, but all of these records are from the past 6 million years. Moreover, these repositories often fail to adhere systematically to the FAIR (Findable, Accessible, Interoperable, Reusable) data principles (Wilkinson et al., 2016) and offer limited metadata categories. Typically, they provide only broad geologic ages, lithology, and metamorphic grades, while lacking essential metadata such as paleogeographic coordinates, depositional environments, and high-resolution chronostratigraphy (Table 1). Current metadata-rich databases that follow FAIR principles remain limited to fewer than 3000 δ15N entries (e.g., Farrell et al., 2021; Lai et al., 2025), highlighting the urgent need for a rigorously standardized, spatiotemporally comprehensive δ15N database.
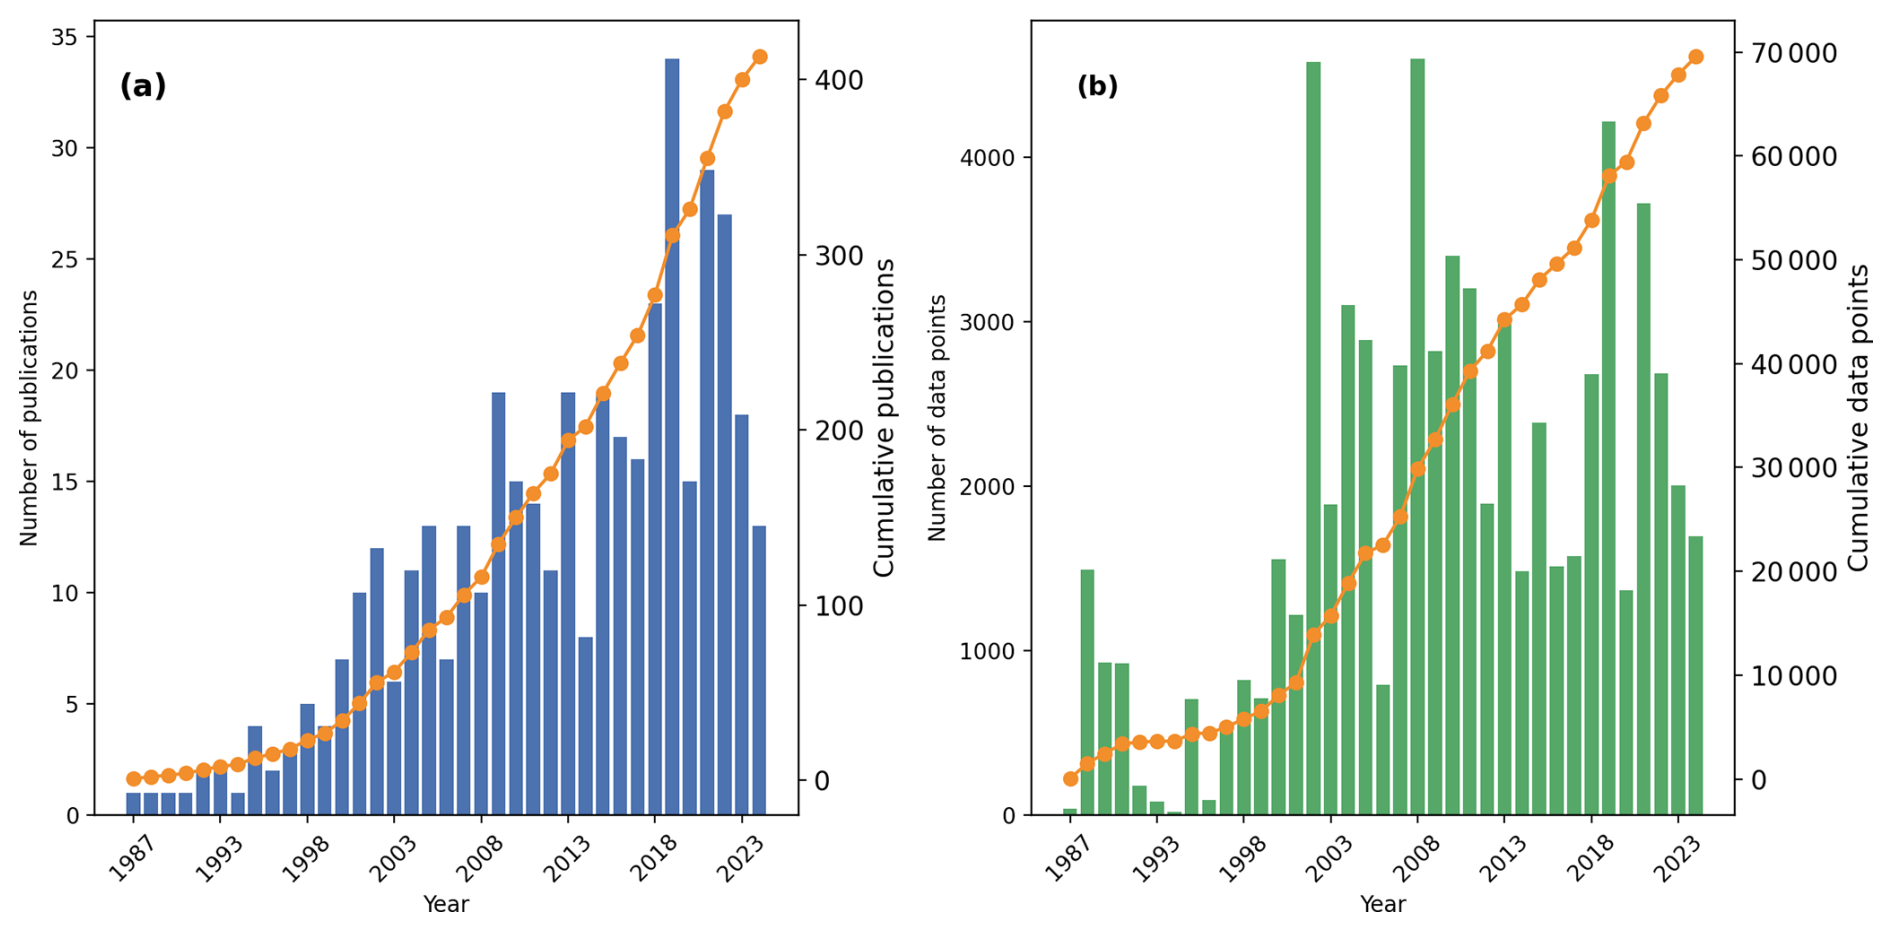
Figure 1Temporal trends in (a) nitrogen isotope publications and (b) δ15N data entries in the DSMS-NI database. Vertical bars denote annual publication/dataset counts, while dots connected by lines represent cumulative totals over the years.
The DSMS-NI database, a repository of deep-time sediment nitrogen isotopes in marine systems spanning Earth history, aims to address this need. The DSMS-NI database is a part of the broader GBDB (Geobiology Database) project, which aims to build a comprehensive database of biotic and biogeochemical evolution throughout time and to explore the mechanisms driving these evolutionary processes. By integrating detailed metadata, DSMS-NI provides a valuable resource for studying nitrogen cycle evolution and paleoenvironmental conditions at a range of temporal and spatial scales. This compilation provides an extensive survey of δ15N records on bulk sediments and specific phases in sediments deposited within marine environments, with a particular emphasis on data predating the Cenozoic Era. Derived from 417 peer-reviewed publications and publicly available datasets, it currently encompasses 70 854 discrete δ15N measurements for various components (e.g., bulk rock, shell-bound, kerogen). In addition, it includes roughly 281 215 associated data points for carbon, sulfur isotopes, and major and trace element concentrations reported alongside the δ15N values. Each entry is linked to a comprehensive set of standardized metadata, ensuring consistency and facilitating robust data analyses. Our goal is to make DSMS-NI a dynamic, evolving database that improves over time, with data visualizations updated concurrently on the Geobiology Data website (https://geobiologydata.cug.edu.cn/, last access: 30 April 2025).
Table 1Overview of deep-time δ15N complication.
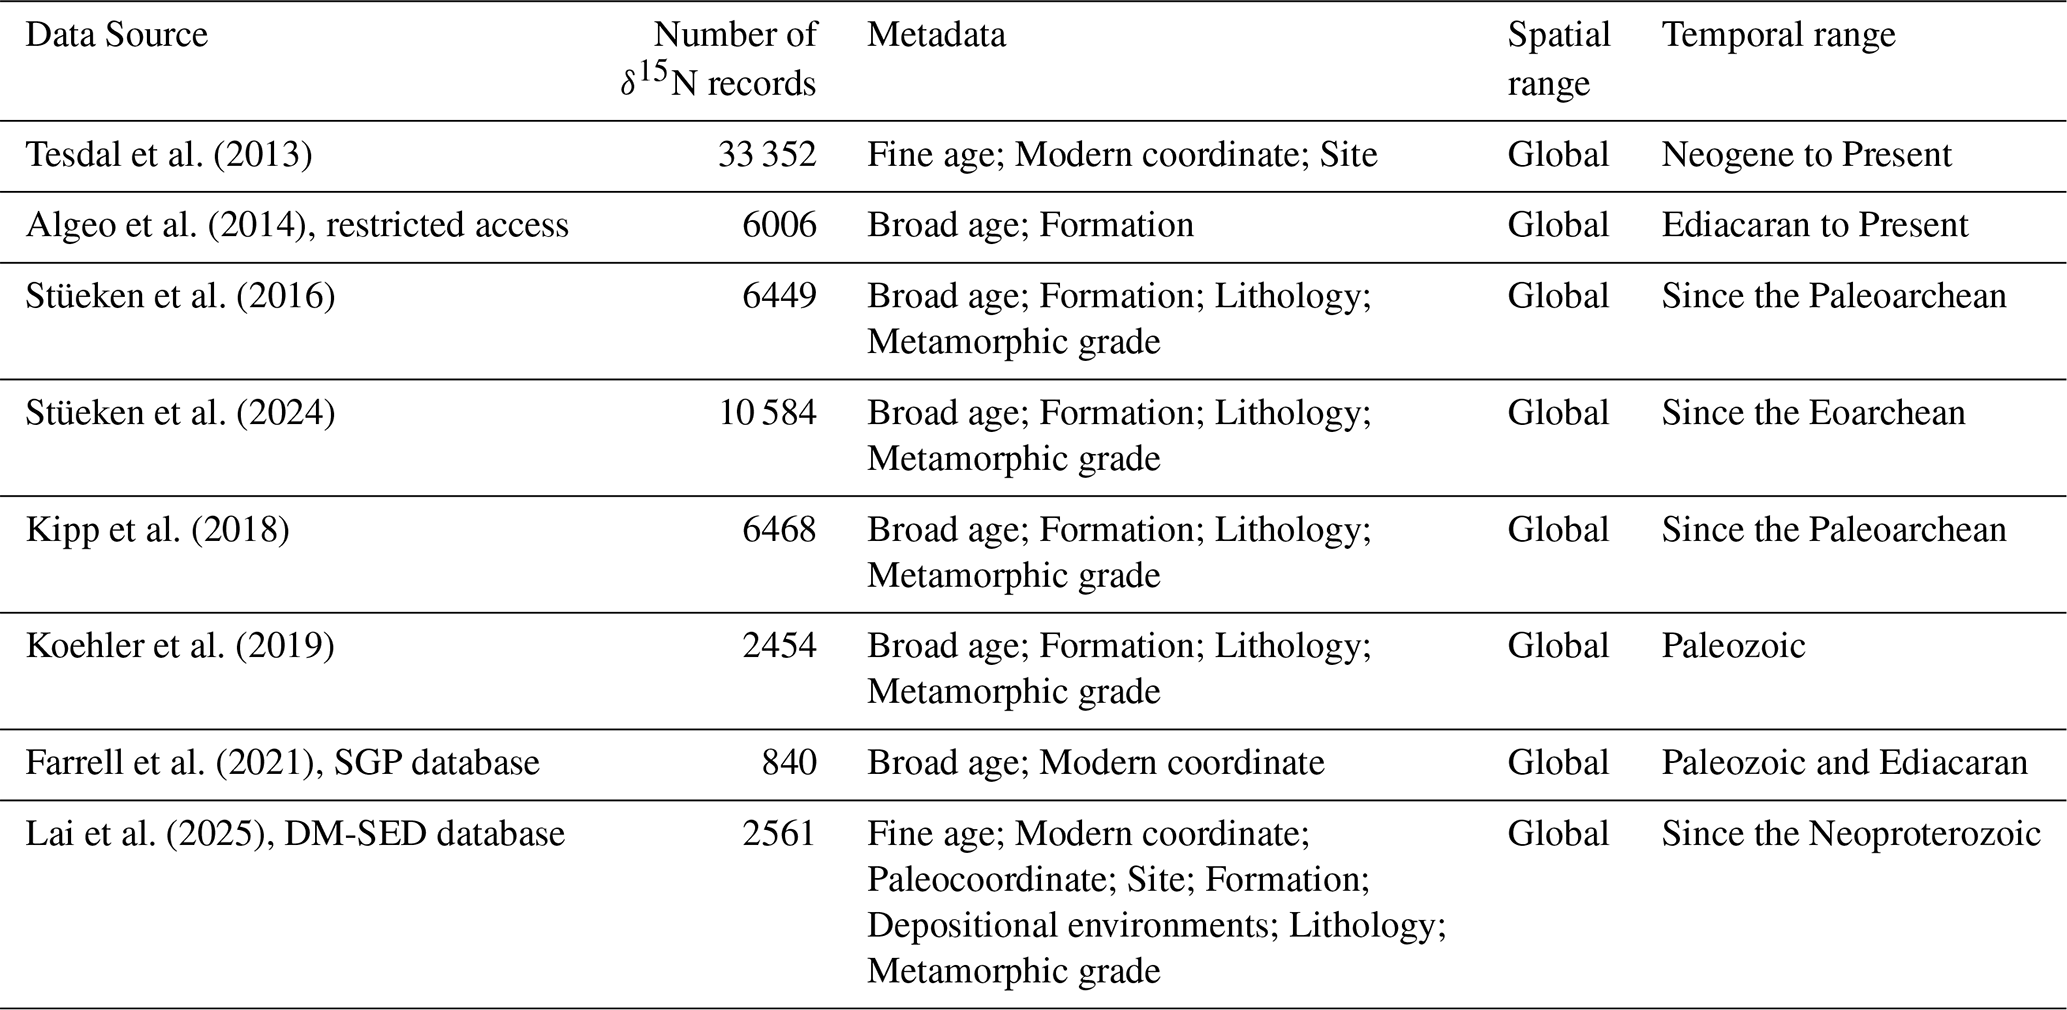
Note. The classification of age resolution in the metadata is as follows:
– Broad age: Age estimates assigned uniformly to data from multiple stratigraphic levels within the same geological formation, indicating no resolved internal chronological order.
– Fine age: Sequentially ordered ages calculated for individual samples, derived from an established age-depth model.
Version 0.0.1 of the DSMS-NI database is available in CSV format on Zenodo (https://doi.org/10.5281/zenodo.15117375, Du et al., 2025a), and dynamic updates will be maintained on the GeoBiology website. The following sections provide a comprehensive overview of the database compilation methods, data structure, and details of the dataset, including data sources, selection criteria, and definitions of metadata fields. Additionally, we analyze the temporal and spatial trends of δ15N within the dataset, discuss potential applications and limitations, and outline the foundation for the database's continuous development and scientific utility.
2.1 Data compilation
An extensive search was conducted based on published articles, reports, theses, and datasets to gather all available literature on deep-time nitrogen isotopes. Initially, a keyword-based search combining geological period and nitrogen isotope was performed on Google Scholar, yielding over 3000 relevant literature sources after removing duplicates. A significant portion of the articles, however, only discussed previously published δ15N data, rather than presenting newly measured data, which were manually excluded from the data compilation. Additionally, geochemical databases such as PANGAEA (https://www.pangaea.de/, last access: 1 April 2025), EarthChem (https://www.earthchem.org/, last access: 1 April 2025), SGP (https://sgp-search.io/, last access: 1 April 2025), and NOAA (https://www.ncei.noaa.gov/, last access: 1 April 2025) were queried to ensure comprehensive coverage of dataset sources (Diepenbroek et al., 2002; Gard et al., 2019; Farrell et al., 2021). Where overlaps existed between datasets and publications, journal articles were prioritized as the primary data sources. Further filtering excluded studies on non-marine sediments, entries lacking essential metadata (e.g., geological age, latitude and longitude), and a limited number of Cenozoic records with inaccessible data. Ultimately, the curated dataset includes 417 valid sources published between 1983 and 2024, representing a comprehensive compilation of nitrogen isotope records for deep-time marine sediments.
Data from each publication were stored in various formats, including tables within the main text, supplementary files, or shared databases. Data extracted from tables and supplementary files were initially processed by computer algorithms, followed by manual verification and supplementation. For databases, data files were downloaded manually. In cases where publications did not provide direct data, data points were extracted from figures using GetData Graph Digitizer (ver. 2.24), and these entries were labeled as “plot” in the Notes section. Each publication was then organized into an individual data file with clear labeling of sources and unique site identifiers. These files were subsequently merged into a master dataset based on standardized column headers. In the final master dataset, additional metadata were curated, including geological age, latitude and longitude, lithology, depositional facies, and metamorphic grade. High-resolution ages and paleocoordinates were calculated and converted, where applicable.
2.2 Data selection and quality control
Given that biogeochemical and paleoenvironmental studies based on nitrogen isotopes require the assessment of the depositional environment and post-depositional alteration, geochemical data apart from δ15N are crucial (Tribovillard et al., 2006; Robinson et al., 2012). Therefore, we collected other contemporaneously published geochemical data of the same samples as δ15N from the literature relevant to the formations in our database. All available data from each research site were included as comprehensively as possible, rather than excluding entries solely due to the absence of δ15N values. This approach allows for the potential interpolation of the time-series data. However, geochemistry fields with fewer than 100 data points in the final compilation were excluded due to their limited analytical utility, such as Mo and Fe isotopes.
To ensure the reliability and applicability of the data, each entry underwent a rigorous screening and evaluation process. Initially, we assessed the data source and its spatiotemporal context. All studies included in the database were required to report verified δ15N values with clear data provenance and well-defined spatiotemporal information. Data entries lacking traceable sources were excluded. Similarly, entries without precise geographic or temporal information were not considered. Data from geological settings representing highly localized environments or with high metamorphic grades, such as samples affected by hydrothermal activity (Martin and Stüeken, 2024) or highly metamorphosed minerals (e.g., mica; Jia and Kerrich, 2000; Busigny et al., 2003), were also excluded given that their δ15N compositions likely record alteration processes rather than seawater signatures. This filtering criterion was applied based on descriptions in the original literature rather than a fixed metamorphic grade threshold. The δ15N values for bulk rock and decarbonated rock were classified as primary entries (δ15Nbulk), while values for specific phases, such as fossil shells, kerogen, clay-bound nitrogen, and porphyrins, were categorized solely as secondary entries (δ15Nsp). Only primary entries were analyzed in the data visualizations presented later in this study.
Only δ15N obtained through standardized, widely accepted techniques were included in the database. These primarily consist of elemental analyzer-isotope ratio mass spectrometry methods applied to bulk rock, decarbonated fractions, or kerogen (Song et al., 2023), as well as denitrifier-based mass spectrometry methods for microfossils (Ren et al., 2012; Smart et al., 2018). Studies employing non-standard or unvalidated methods, such as stepwise combustion (Ishida et al., 2017), were excluded. Data from highly metamorphosed settings (e.g., hydrothermal alteration), terrestrial lakes and rivers, modern organisms and their metabolic products, and liquid phases were flagged and omitted from the database (e.g., Bebout et al., 1999; Chase et al., 2019; Xia et al., 2022). For data from the same site but at different depths or lithologies, or for measurements of different components in the same layer (e.g., bulk sediment and decarbonated sediment), or replicate analyses of the same homogenized sample, each entry was recorded separately to accurately capture variability.
Metadata on paleocoordinates, depositional setting, lithology, and metamorphic grade are included, wherever available. Entries were not excluded due to missing such metadata, as these can potentially be supplemented in future research. When such metadata were not directly reported in the literature, we attempted to estimate them using supplementary data or external sources, such as paleogeographic reconstructions. For entries for which metadata could not be determined, blank values were assigned.
Since nitrogen isotope studies in sediments began in the late 1980s, the number of published studies has shown an accelerating growth trend, doubling approximately every decade. This trend is mirrored by a steady increase in data volume, with an average annual addition of around 2720 data points over the past two decades (Fig. 1). However, the rate of data growth slightly lags behind that of publications, largely because early Ocean Drilling Program (ODP) and Integrated Ocean Drilling Program (IODP) projects contributed substantial datasets within individual publications (e.g., Liu et al., 2008). Ocean drilling remains a vital component of the database, covering geological intervals since the Cretaceous. Some early drilling data were not initially publicly accessible and have been supplemented through existing literature compilations, particularly the substantial dataset from Tesdal et al. (2013), along with enriched metadata.
The DSMS-NI database comprises a total of 31 metadata fields and 130 proxy data fields, organized into five primary categories (Table 2): (1) sampling location, (2) age information, (3) geochemical data, (4) lithological characteristics, (5) analytical methods and (6) references. For clarity and consistency throughout this data descriptor, the term ”entries” refers to individual proxy values and their associated metadata (i.e., rows), while “fields” denote the metadata attributes recorded for each entry (i.e., columns).
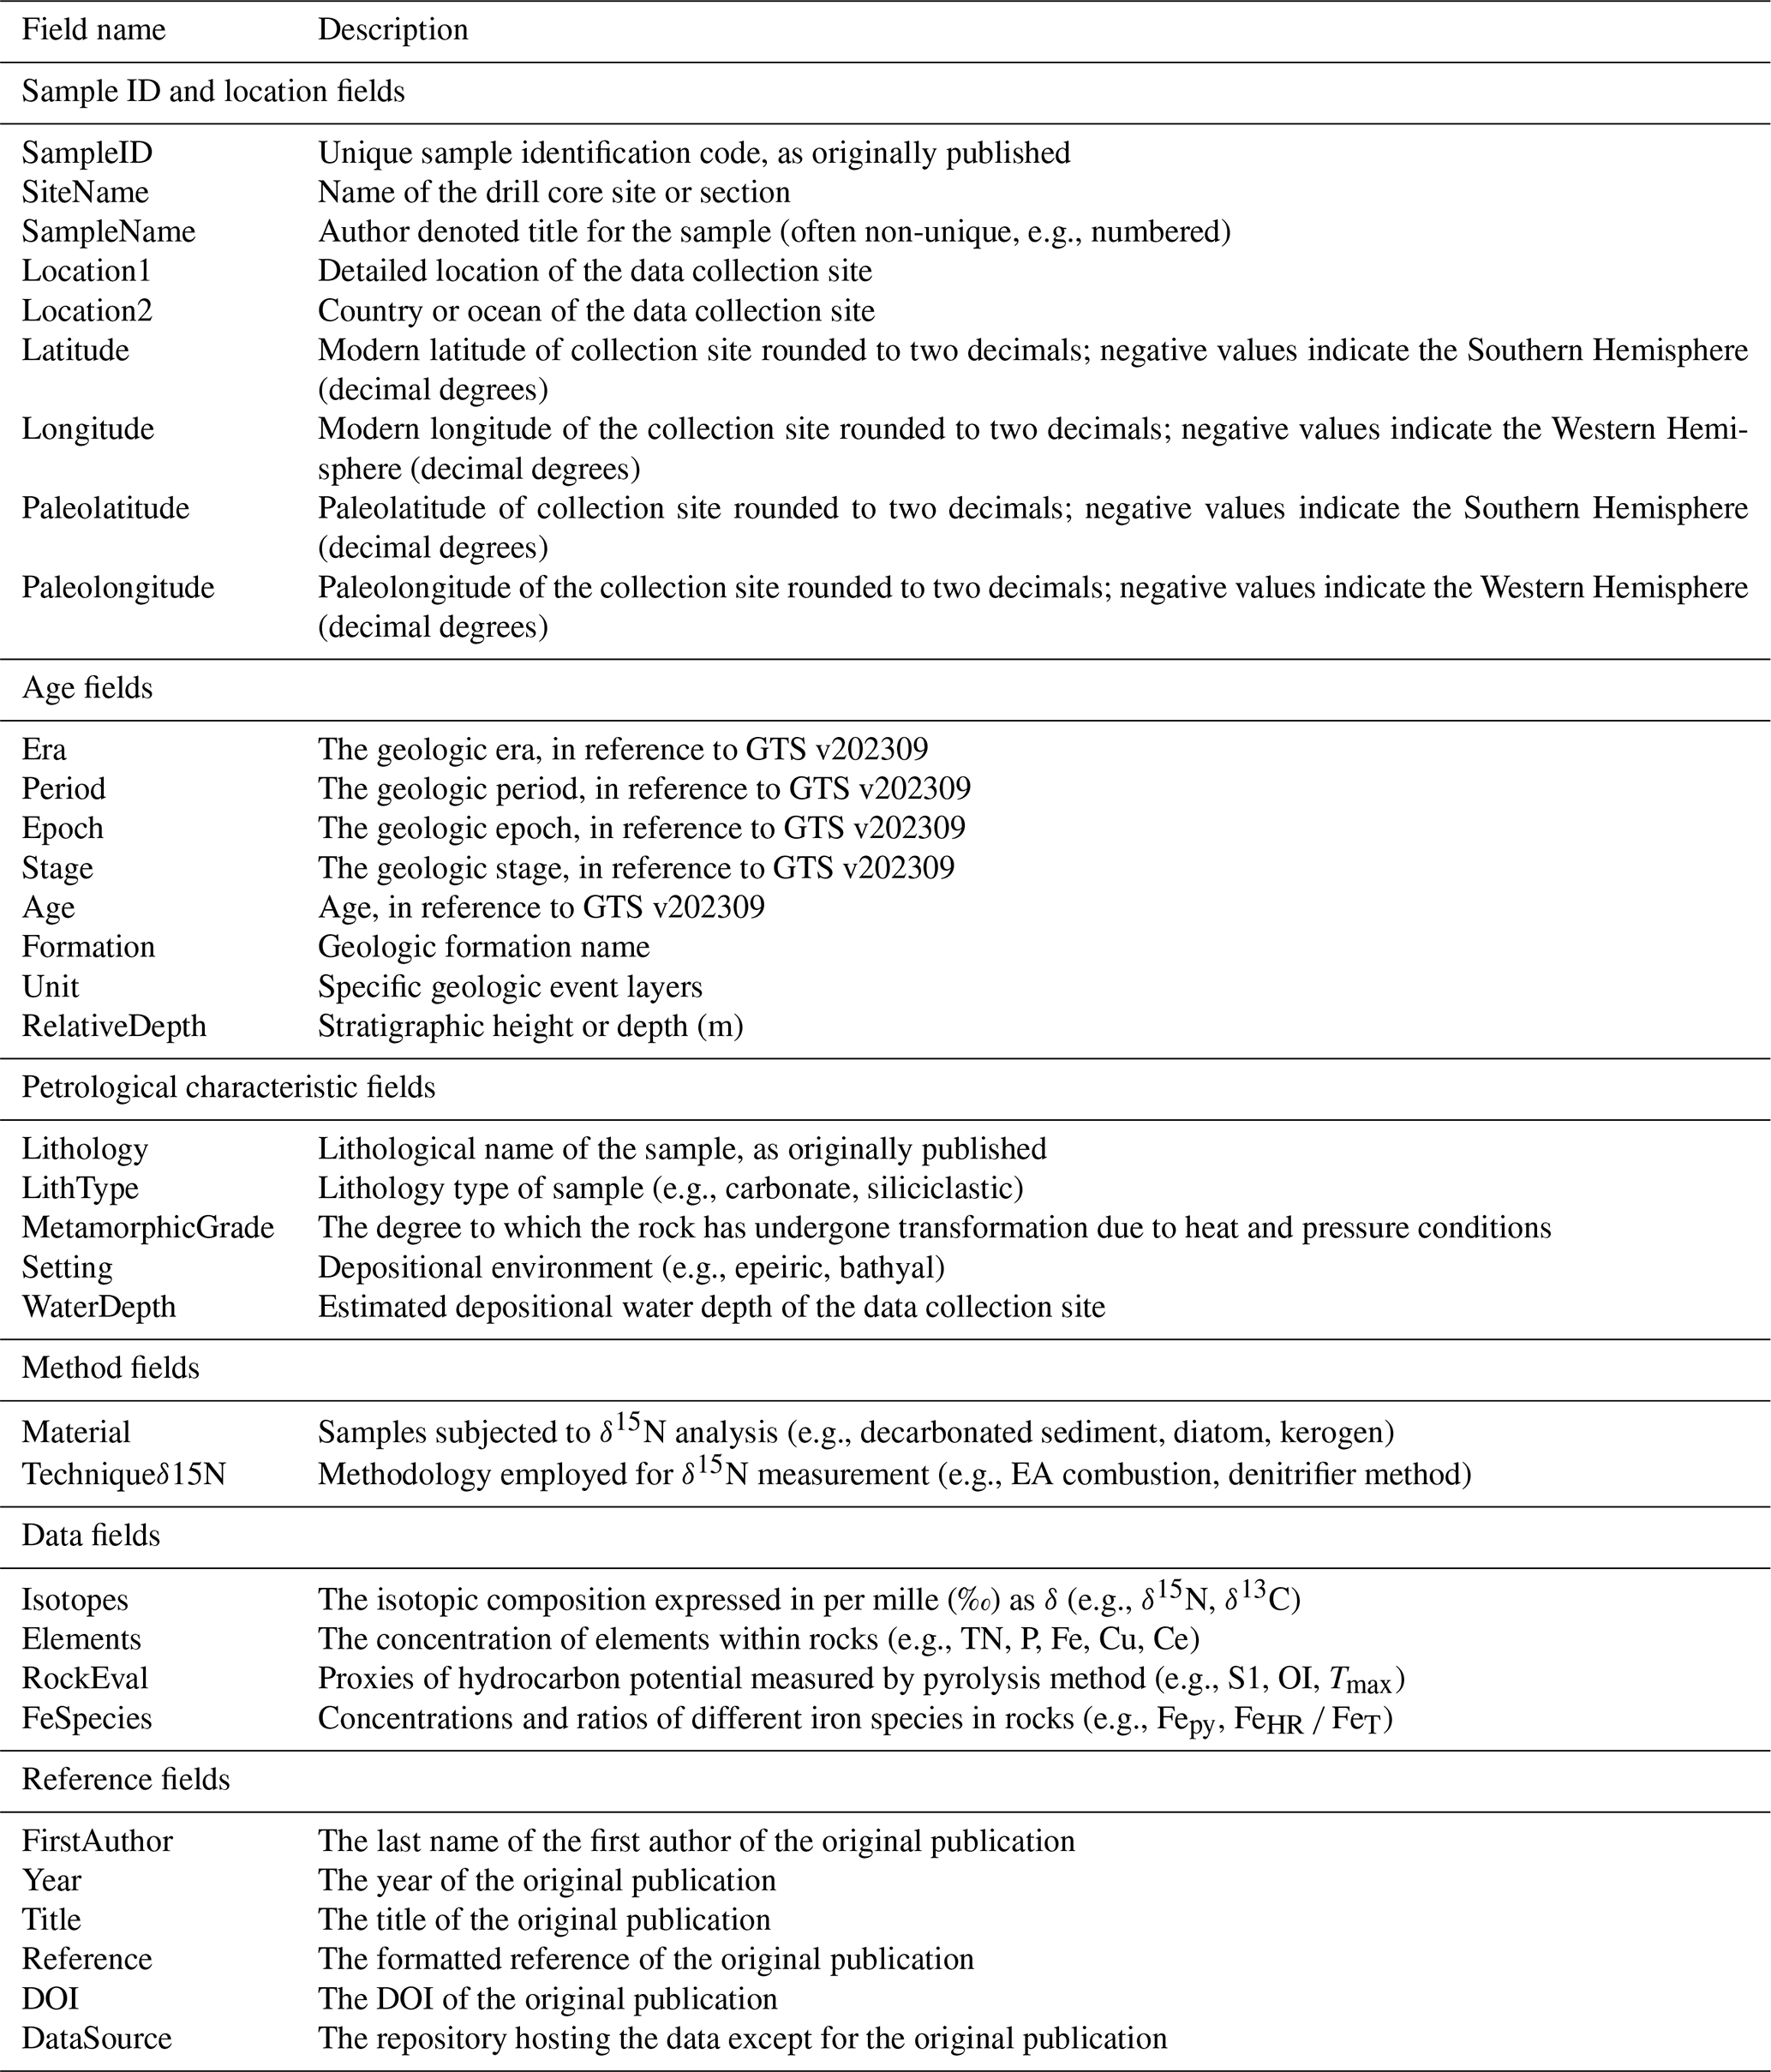
3.1 Sample ID and location fields
Each data entry was assigned a unique Sample ID to distinguish it from other data entries. Geographic location information includes the modern latitude and longitude (Latitude and Longitude) referencing WGS84 (World Geodetic System 1984), obtained directly from original literature or external sources whenever possible. For studies that do not provide exact coordinates, approximate locations are estimated based on geographic descriptions or accompanying maps, using tools such as Google Maps. Additionally, we record the broader sampling region (e.g., country or oceanic region) and specific sampling site details (such as province, county, or uplift names). The location fields also include the name of the drilling site or outcrop section (SiteName), which identifies the precise drilling location or outcrop at which samples were collected, providing valuable geographic context. Certain SiteNames are uniquely associated with major drilling projects (e.g., ODP, IODP), which is important for subsequent data supplementation and analysis. Some samples also have a SampleName, as designated by the original authors – typically a code or non-unique label reflecting the naming format in the primary literature. Although multiple samples in the database may share the same SampleName, each entry has a distinct Sample ID to ensure the uniqueness of each record.
We also provide paleolatitude and paleolongitude (PaleoLatitude and PaleoLongitude), calculated based on the geological age of each sample and using paleogeographic reconstruction tools such as PointTracker v7.0, built on the plate rotation model of Scotese and Wright (2018). Paleocoordinate data are crucial for understanding the historical shifts in sample locations and their relationship to depositional environments (Percival et al., 2022; Li et al., 2025). To maintain consistency, all geographic coordinates are standardized to two decimal places.
3.2 Age fields
Each entry includes not only absolute age data but also a series of geologic age-related fields to provide precise temporal context. These fields enable targeted data retrieval at a range of geological timescales, facilitating comparisons with newly added data. The GeologicalAge field captures broad temporal frameworks, recorded as Epoch for the Phanerozoic (e.g., Early Triassic) and Era for the Precambrian (e.g., Neoproterozoic). For more refined stratigraphic resolution, the Stage field (e.g, Induan) is used, with the System as a substitute for Precambrian samples (e.g., Ediacaran). The Age field records the absolute age of each sample, following the International Chronostratigraphic Chart, GTS v202309. The Formation field notes the geological unit (formation or member) from which the sample was collected, aiding in understanding its depositional context and relation to surrounding strata (Murphy and Salvador, 1999). However, Formation data are generally limited to outcrop sections, as ocean drilling samples lack specific formation designations. The Unit field identifies particular stratigraphic units or geologic event layers, such as the Cretaceous pre-OAE2 or OAE2 (Jenkyns, 2010), which aids in correlating samples within recognized geological events. The RelativeDepth field records the sample's relative depth in the section or drill core, which is essential for high-resolution age analyses and sedimentation rate calculations.
When precise ages and geological age information for each sample were provided in the original source, these values are prioritized. However, for data from the Common Era (i.e., negative ages), they are uniformly assigned a value of 0 Ma, meaning that all such data are treated as reference values for modern top sediments. Otherwise, age assignments follow two methods based on data availability. (1) For records with at least two samples or stratigraphic horizons of known age (e.g., radiometrically dated layers or well-defined stage boundaries), we constructed an age-depth model. This model linearly interpolates ages between these tie-points along the RelativeDepth axis, assuming a constant sedimentation rate within each interval between stratigraphic age tie-points. While this assumption is effective for establishing the relative temporal sequence of samples, which is critical for capturing first-order stratigraphic trends, it necessarily introduces uncertainties in absolute age determination due to potential variability in sedimentation rates or local stratigraphic features. (2) For records lacking sufficient data for an age-depth model, a single age was assigned to all samples. When only one age constraint (e.g., a radiometric date from a nearby stratum) is available, that specific age is applied. In the absence of any direct age control, the median age of the corresponding geologic stage is used as a default. It should be noted that assigning a uniform age to a suite of samples, particularly using the median stage age, carries significant uncertainty, theoretically on the order of the duration of the entire geologic interval (which can approach 100 Myr for long stages of the Precambrian). Profiles constrained by a single radiometric date, which is the predominant method for dating sequences older than 600 Ma, are generally more reliable than those relying solely on a median stage age.
3.3 Data fields
The dataset includes analyses of isotopic compositions, elemental concentrations, and specific components. To maintain consistency, all units were standardized during data collection, as original publications sometimes report these data in varying units. (1) Isotopic data include δ15N, δ13C, δ18O, and δ34S, all expressed in ‰ relative to international standards. Nitrogen isotopes are reported relative to atmospheric nitrogen (Air N2), carbon and oxygen isotopes relative to the Vienna Pee Dee Belemnite (VPDB) standard, and sulfur isotopes relative to the Vienna Canyon Diablo Troilite (VCDT) standard (Hoefs, 2021). (2) Elemental concentrations include TN (total nitrogen), TOC (total organic carbon), TS (total sulfur), CaCO3, TC (total carbon), TIC (total inorganic carbon), P, Al, K, Si, Ca, Ti, Na, Mg, Fe, as well as iron species data and LOI (loss-on-ignition), and they are reported in weight percent (wt %). Concentrations of other trace elements are standardized to parts per million (ppm). (3) Some data originally reported as oxide concentrations were converted to elemental concentrations based on stoichiometric ratios, such as P2O5. (4) Additional derived values include ratios of iron species, dry bulk density, and rock eval indices (Peters, 1986; Poulton and Canfield, 2005). These indices comprise alkenone content (C37, in nmol g−1), oxygen index (OI, mg CO2 g TOC−1), hydrogen index (HI, mg HC g TOC−1), maximum pyrolysis temperature (Tmax, °C), free hydrocarbons (S1, mg HC g−1), hydrocarbons generated from rock pyrolysis (S2, mg HC g−1, and CO2 released from organic matter pyrolysis (S3, mg CO2 g−1). Some inaccessible data points were visually extracted from figures using scatterplot recognition techniques, which are marked as “plot” in the Notes field. Data with values exceeding detection limits or those erroneous (e.g., negative values for element concentration) were excluded from the dataset.
3.4 Petrological characteristic field
The petrological characteristic fields encompass information on lithology, depositional facies, and metamorphic grade, which provide essential contextual support for subsequent isotopic geochemistry analyses. (1) Lithology: The Lithology field records the original descriptions provided by authors, using terms such as “black shale”, “mudstone”, “limestone” and “breccia”. The LithType field classifies these lithologies into broader categories, primarily as carbonate and siliciclastic (Tucker and Wright, 2009), with minor entries for phosphorite and iron formations. (2) Metamorphic Grade: The metamorphic grade field reflects the extent of metamorphism the samples have undergone, based on original terminology whenever possible. Common terms include specific metamorphic facies (e.g., amphibolite, greenschist) as well as general descriptors like “unmetamorphosed” and “low grade”. For Cenozoic samples, which are generally assumed to have undergone minimal metamorphic alteration (Winter, 2014), any entries lacking detailed descriptions are uniformly designated as “unmetamorphosed”. (3) Depositional Setting: This field records the depositional environment of each sample, with terms like “neritic”, “peritidal”, “slope” and “abyssal” preserved from the original literature. For many ocean drilling samples, depositional settings are inferred from WaterDepth: depths of 500–2000 m are classified as “bathyal” and depths exceeding 2000 m are designated as “abyssal”.
3.5 Data collection sources
Data in the database primarily originate from published literature and are traceable via DOI. Some data come from public databases such as PANGAEA, SGP, and NOAA. Each record includes multiple fields for source information, such as first author, publication year, article title, reference, DOI, and data source. Metadata fields have been standardized and cleaned via code to ensure consistency and machine readability, removing special characters while retaining complete citation formats. This structure allows users to trace data provenance, with DOI or Reference fields facilitating direct searches on Crossref for verification.
The DSMS-NI database has undergone meticulous curation and quality control (QC) to ensure data accuracy, consistency, and scientific value. Each record includes comprehensive metadata to support traceability and verification. While each entry and significant metadata contain a simple remarks field (excluded from the main database to prevent clutter), it notes the source or reason for inclusion, facilitating validation and cross-checking by the data management team. We implemented several QC measures to verify database accuracy.
4.1 Geographic coordinate verification
Latitude and longitude values were checked to confirm they fall within the valid ranges of −90 to 90 and −180 to 180, respectively. Sample coordinates were cross-referenced with country names and public national boundaries to ensure geographic accuracy. Modern sample coordinates were projected onto a global map with administrative boundaries (Figs. 2–3) to verify logical placements. If coordinates appeared on land or in other unexpected locations, each entry was manually reviewed and corrected as needed.
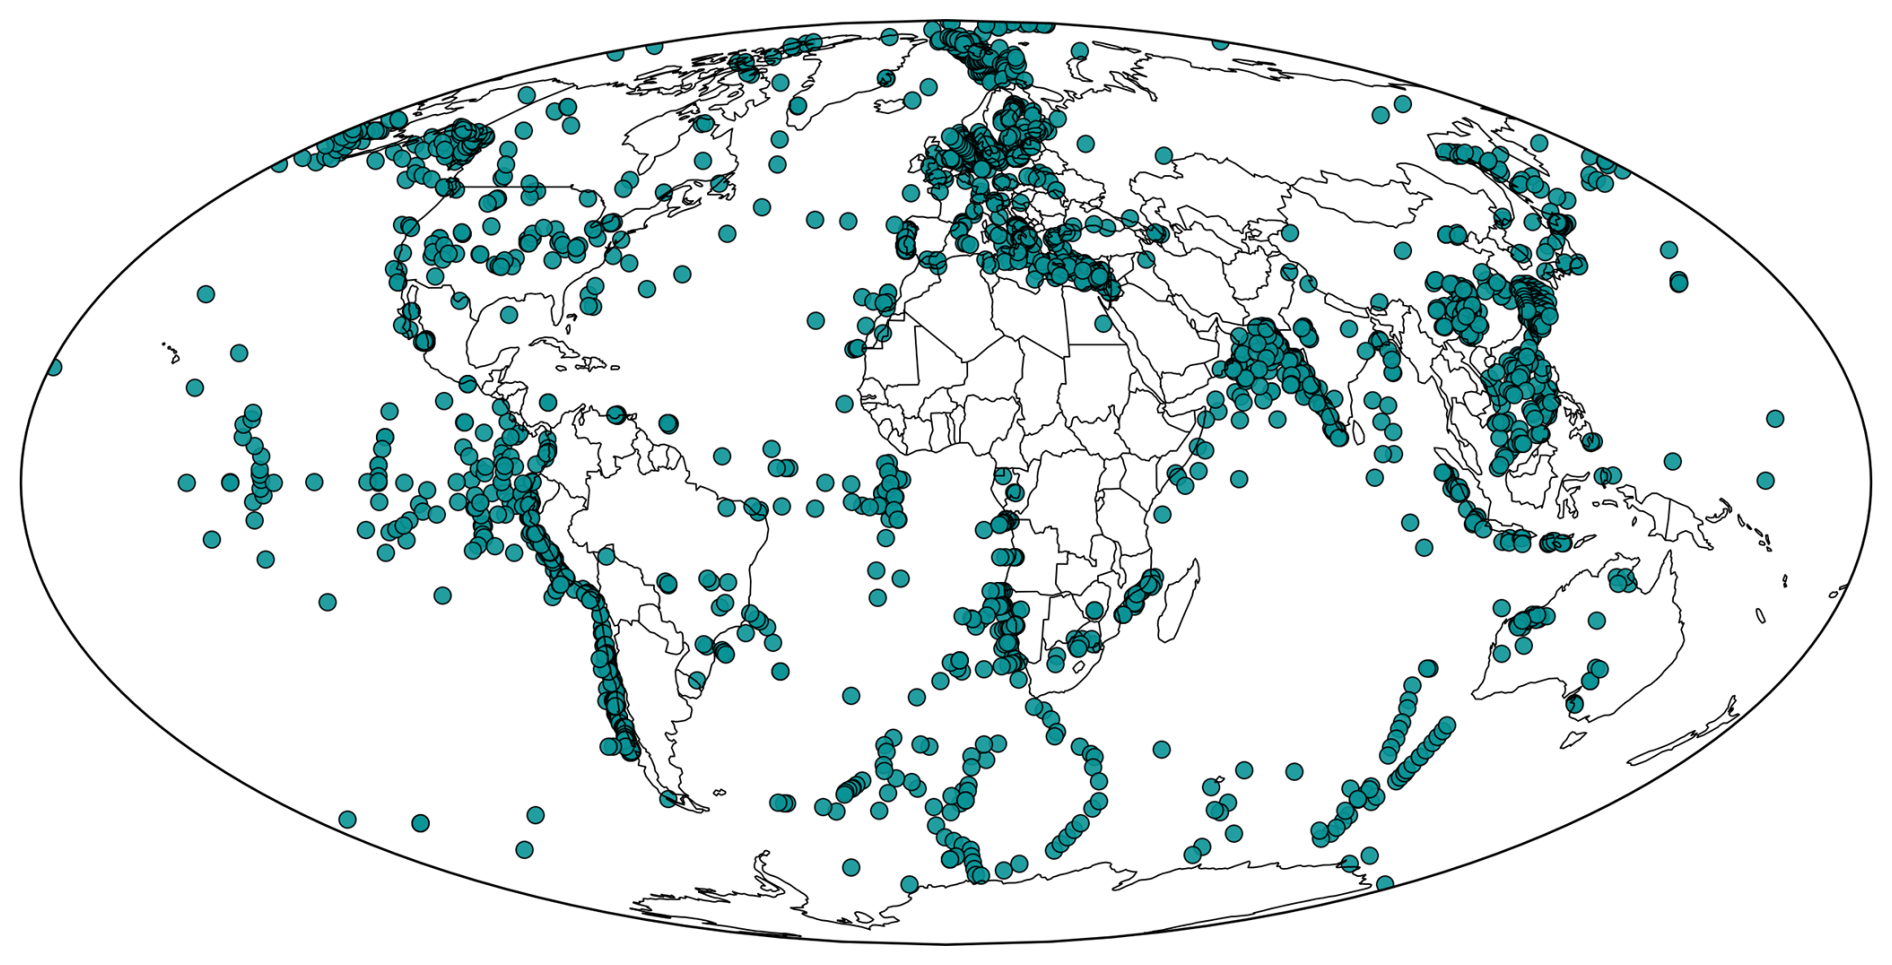
Figure 2Distribution of sample sites on modern global map.
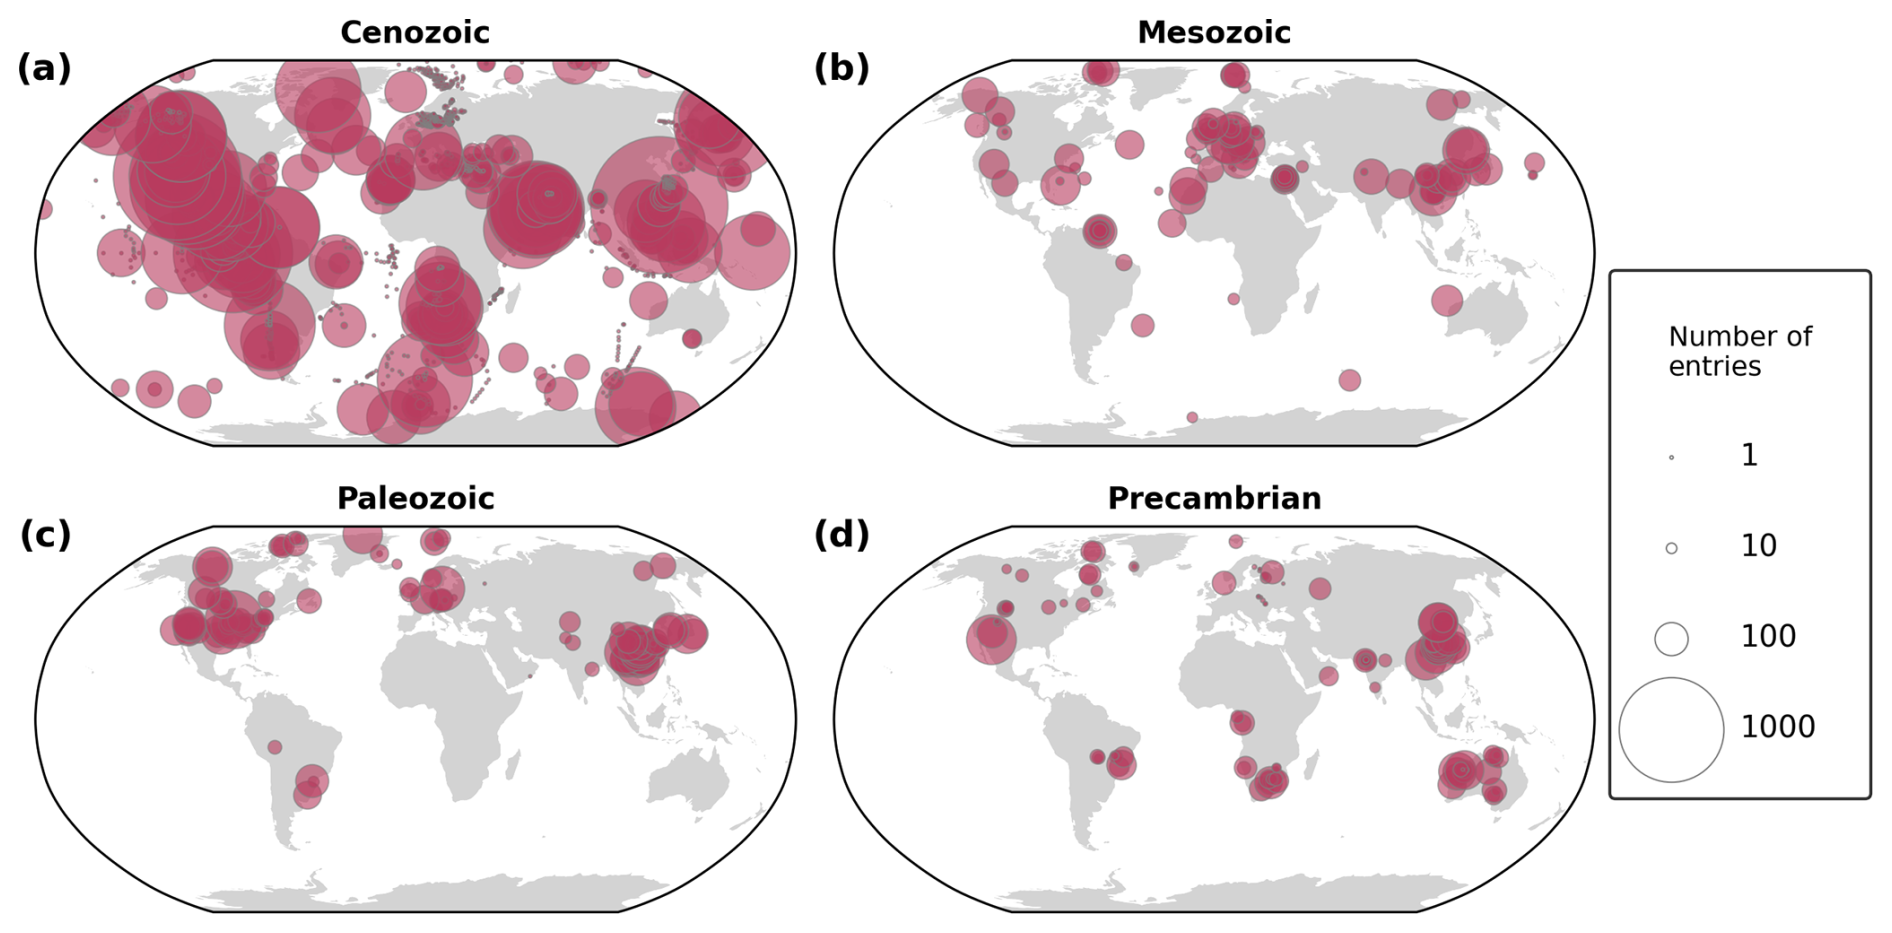
Figure 3Spatial distribution of sampling sites and sample quantities by geological era in a modern geographic reference frame. The base map is adapted from Kocsis and Scotese (2021). The term “entries” refers to individual proxy values and their associated metadata (i.e., rows in the DSMS-NI database).
4.2 Paleocoordinate validation
Paleolatitudes and paleolongitudes were calculated using the G-Plates model (Scotese and Wright, 2018) and PointTracker v7.0 software, ensuring alignment with each sample's geological age and geographical context. Site locations were plotted on paleogeographic maps (Fig. 4) for further evaluation; any inconsistencies in paleocoordinates were flagged, reviewed, and adjusted accordingly.
4.3 Outlier detection
Frequency histograms and time-series scatter plots were generated to identify potential outliers in the dataset. All flagged extreme values underwent secondary validation against their original sources to confirm the accuracy. This process led to the correction of erroneous entries introduced during unit conversions and the removal of invalid data points that fell outside instrumental detection limits. Extreme δ15N values falling outside a conservative range (10 ‰ or 40 ‰) were excluded from the final compilation (e.g., Thomazo et al., 2011; Hammarlund et al., 2019). This decision was based not on the validity of the individual measurements, but on the need to prioritize data representativeness for global-scale analysis. The excluded values, even if explained within their original publicational context, are statistical outliers that have not been corroborated and could unduly influence broad interpretations.
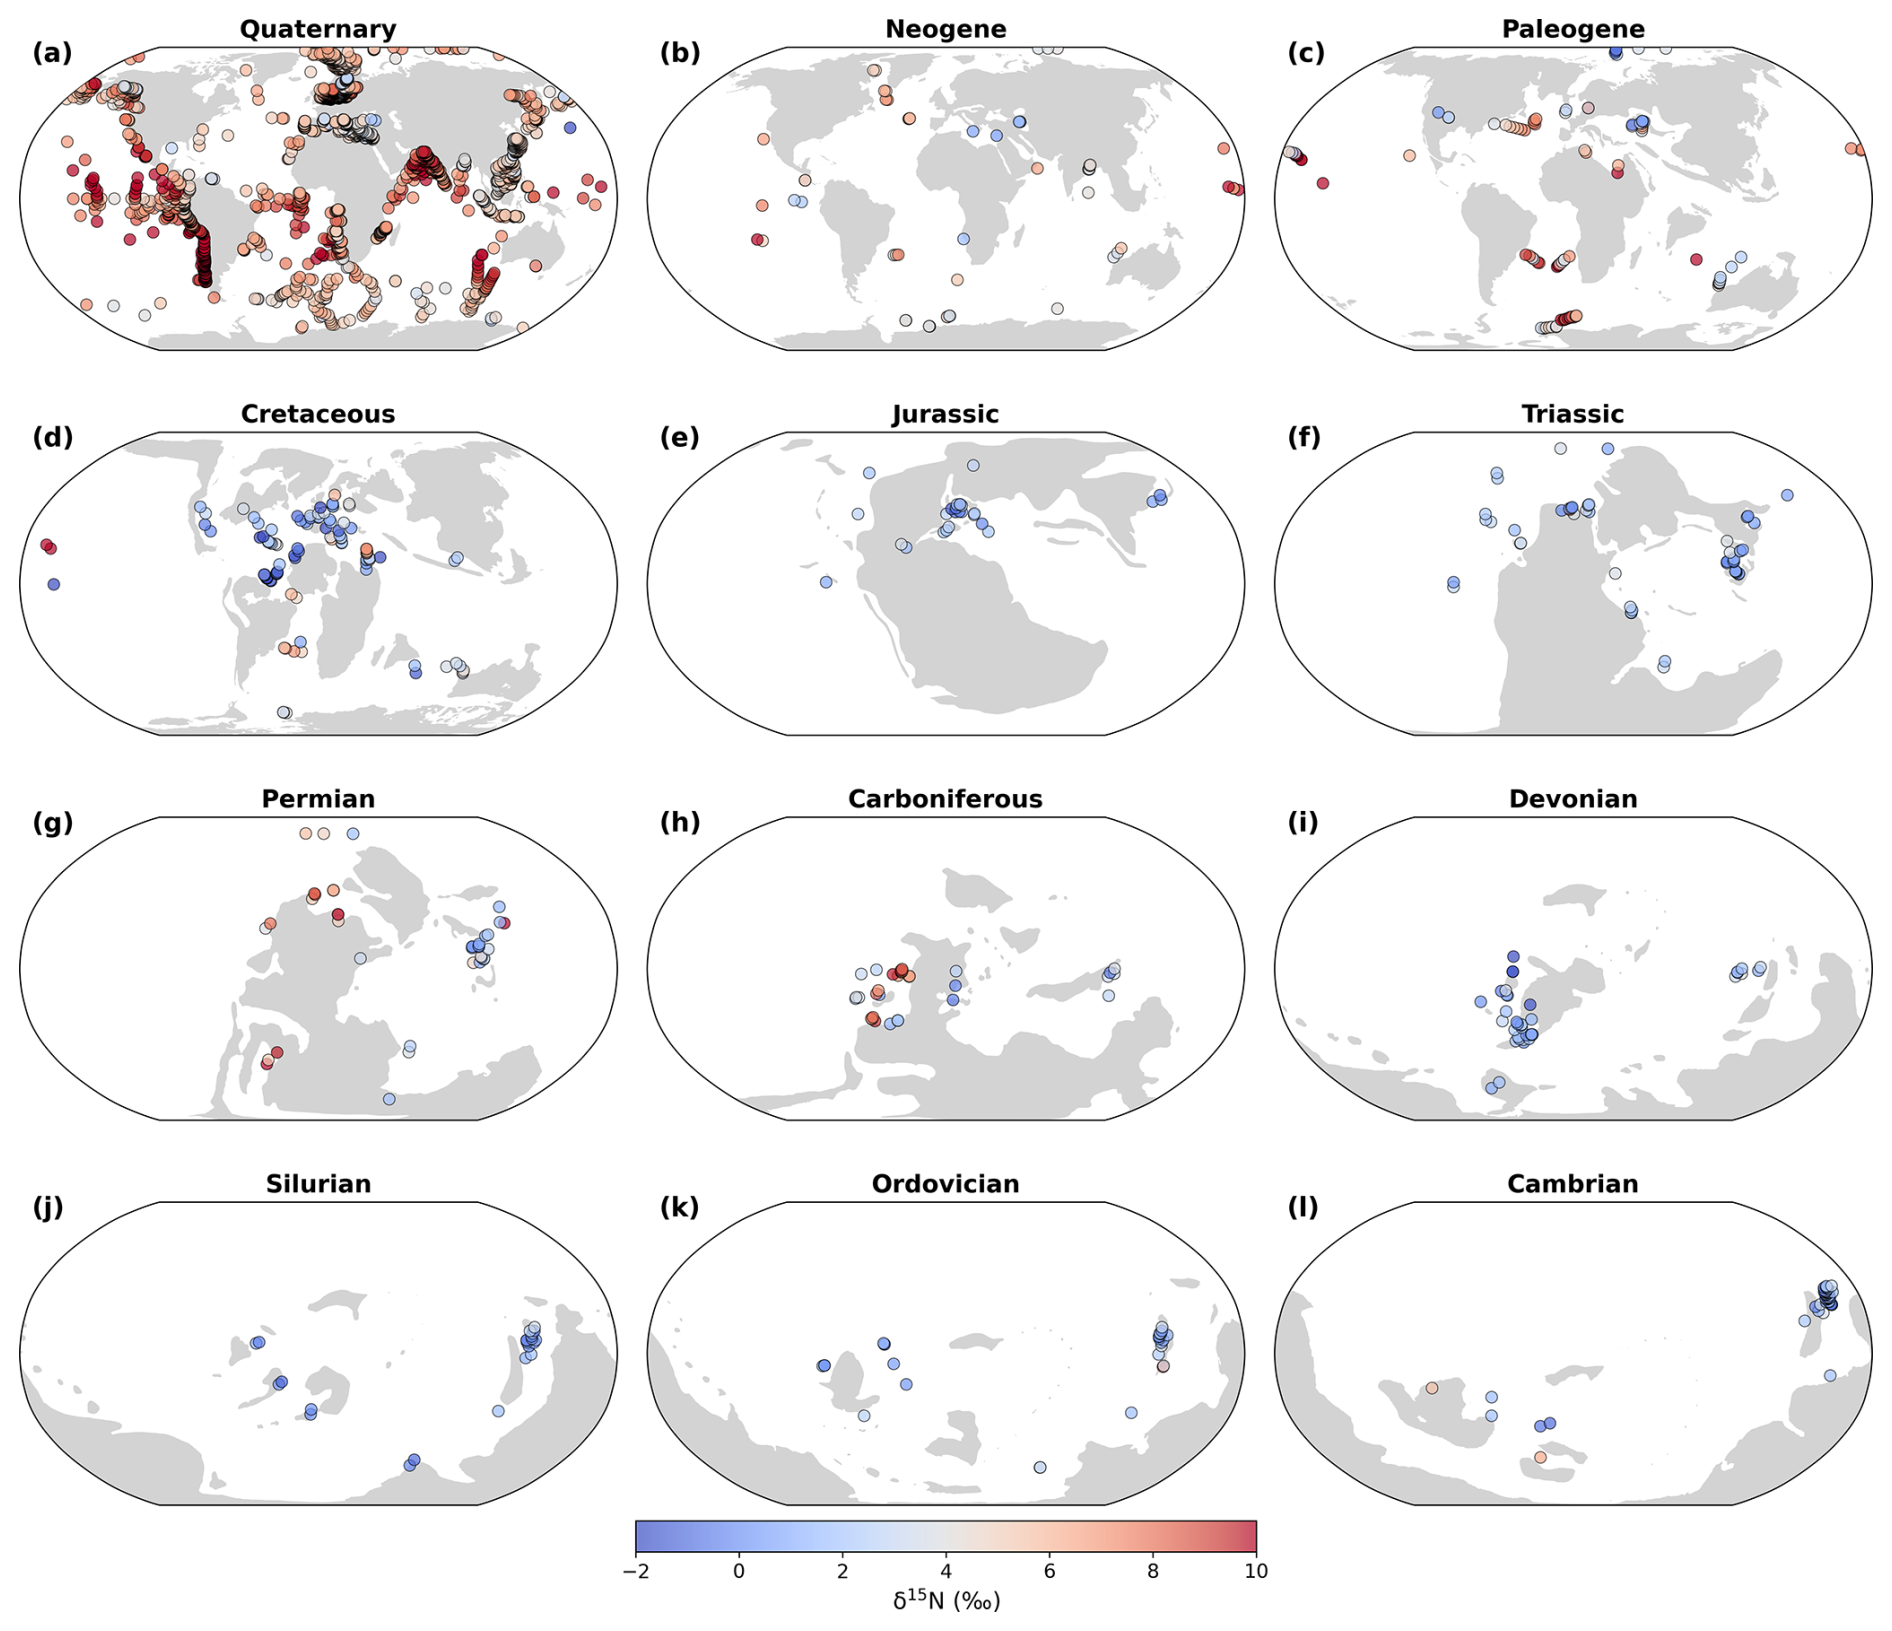
Figure 4Paleogeographic distribution of δ15N values by geological period. The base map is adapted from Kocsis and Scotese (2021).
4.4 Duplicate check
We conducted a comprehensive check for duplicate entries, especially for samples with similar GPS coordinates. All suspected duplicates were carefully compared, and necessary corrections were made to eliminate redundancy.
4.5 Age model calibration
To minimize errors, geological age data were entered using a standardized template to prevent typos, inconsistencies, or incorrect values. Automated analyses and cross-verification ensured that numerical ages corresponded accurately with designated eras and geological stages. A mismatch between a numerical age and its geological stage often indicates an outdated age in the original reference (e.g., Wang et al., 2013). To address this, we recalibrated the outdated estimations by building new age-depth models based on the current geologic stage boundaries from the International Chronostratigraphic Chart (GTS v202309).
4.6 Data collection sources
Citation information within the reference field was obtained through automated methods from the CrossRef platform, ensuring uniformity in citation formatting (Hendricks et al., 2020). We used scripts to extract comprehensive bibliographic details for each publication, including author names, title, publication year, journal name, volume, page numbers, and DOI. This automation significantly reduced potential spelling errors and inconsistencies that may arise in manual entry. Extracted citation data were cross-checked against original entries in the database, and any discrepancies or errors were corrected manually by the data management team to maintain source accuracy and completeness.
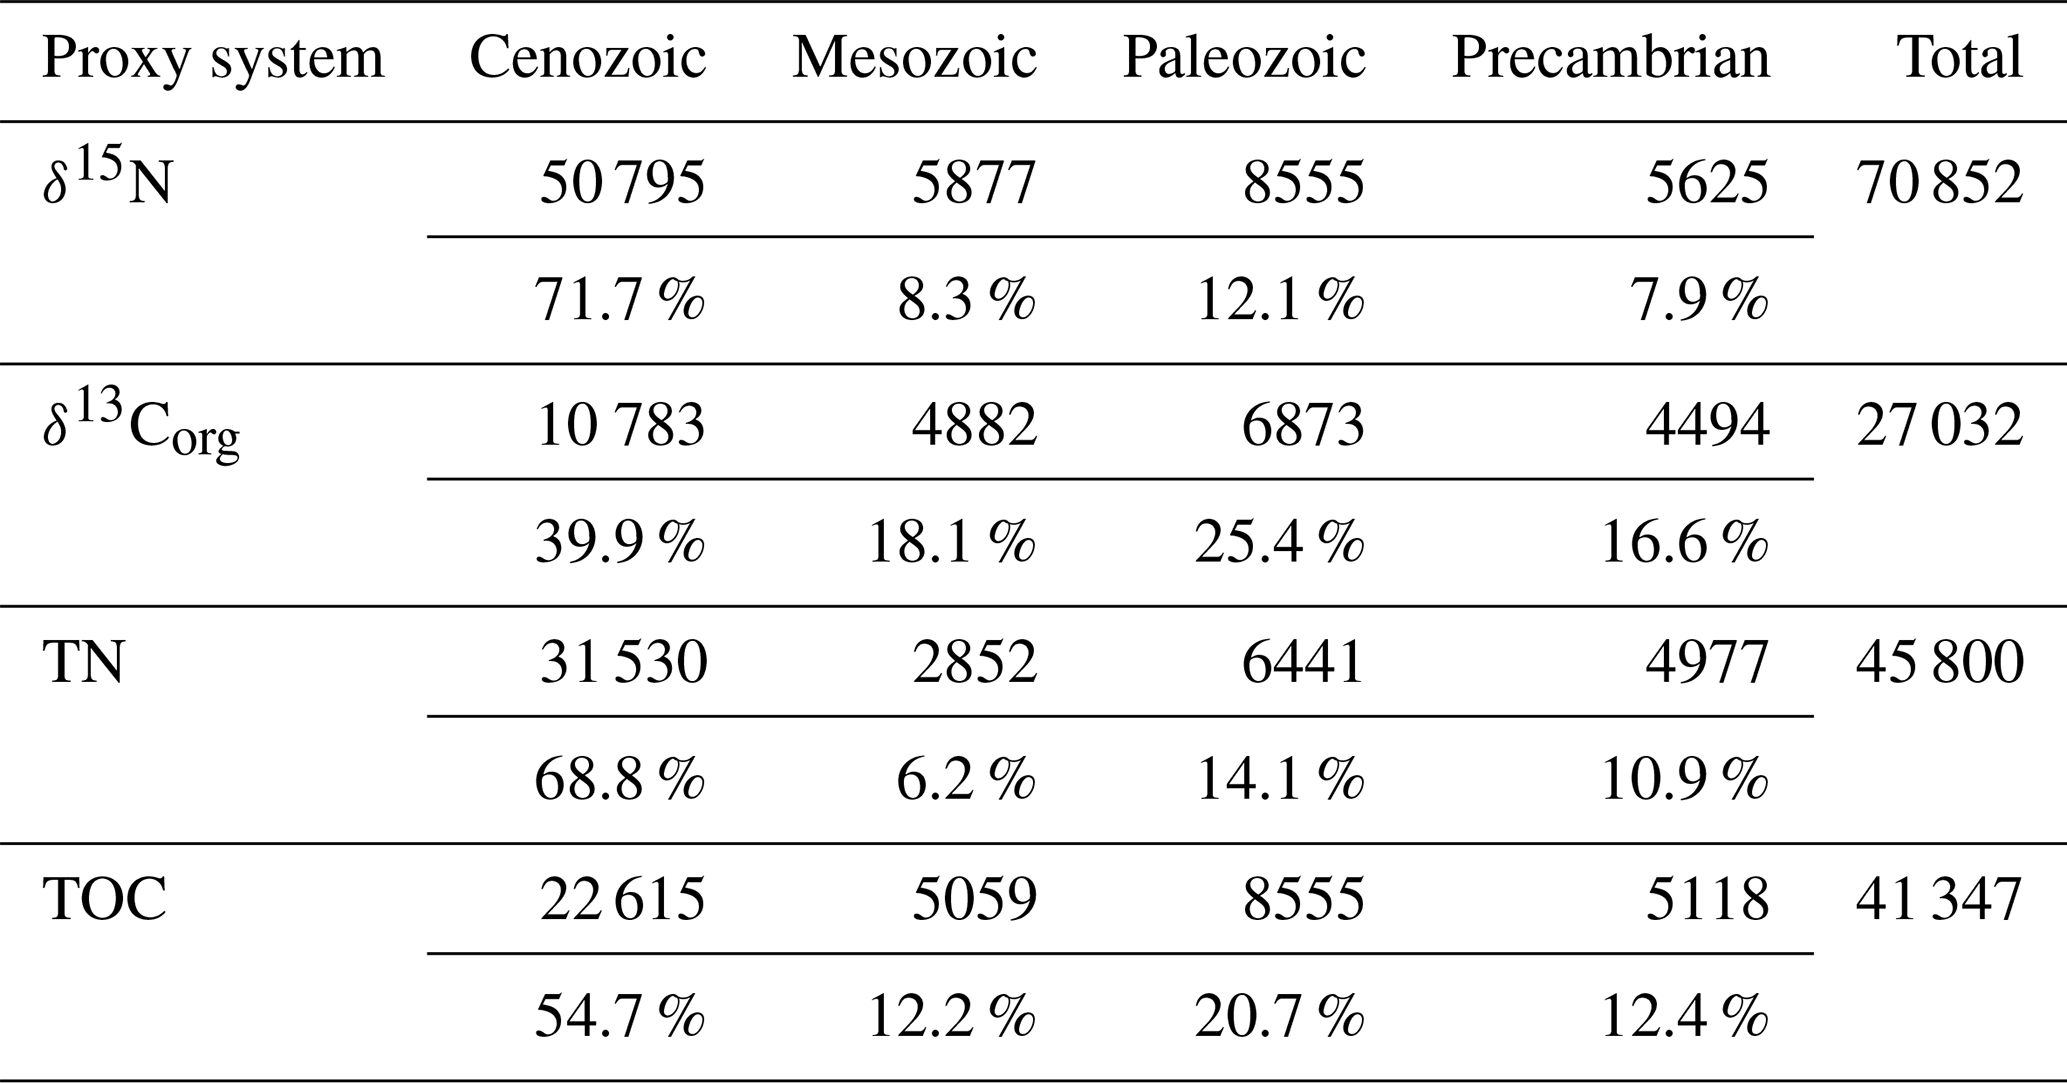
The latest version of the DSMS-NI database comprises approximately 320 000 data entries, including 70 854 δ15N records, spanning all geological periods from the Eoarchean (∼ 3800 Ma) onward. These records originate from a diverse array of unique sampling sites, encompassing ocean drilling cores and outcrop sections. The δ15N data are predominantly concentrated in the Phanerozoic, comprising 92.1 % of the total database, with further breakdowns showing 71.7 % in the Cenozoic, 8.3 % in the Mesozoic, and 12.1 % in the Paleozoic (Table 3 and Fig. 3). The following sections focus on first-order spatial and temporal trends in δ15N data density, sampling locations, and values within DSMS-NI. The provided figures illustrate only a subset of the spatial-temporal patterns uniquely revealed by this extensive compilation, demonstrating the database's potential to advance research in paleoclimate, geochemistry, and paleoecology.
Table 3The quantities and proportions for δ15N, δ13Corg, TN, and TOC of each geological era.
5.1 Temporal density and evolution of δ15N
Given that the data are concentrated in the Phanerozoic, for which ages are more precisely constrained, we performed a detailed stratigraphic breakdown of age distribution by stage within the Phanerozoic (Fig. 5). The distribution is uneven, with the highest data densities in recent periods, particularly the Holocene (0–12 ka), Late Pleistocene (12–129 ka), and Chibanian (129–770 ka). The high data density in the Quaternary primarily reflects the abundance of high-resolution records from various ocean drilling projects, whose individual cores contributed large and densely sampled datasets. In contrast, older geological periods exhibit data clusters around key events, such as biotic radiations, mass extinctions, and oceanic anoxic events (Bush and Payne, 2021). Notable gaps or low-density intervals occur in the mid-Cambrian to Early Ordovician, Silurian to Early Devonian, mid-Carboniferous to Early Permian, mid-Triassic to Early Jurassic, and Late Jurassic to Early Cretaceous.
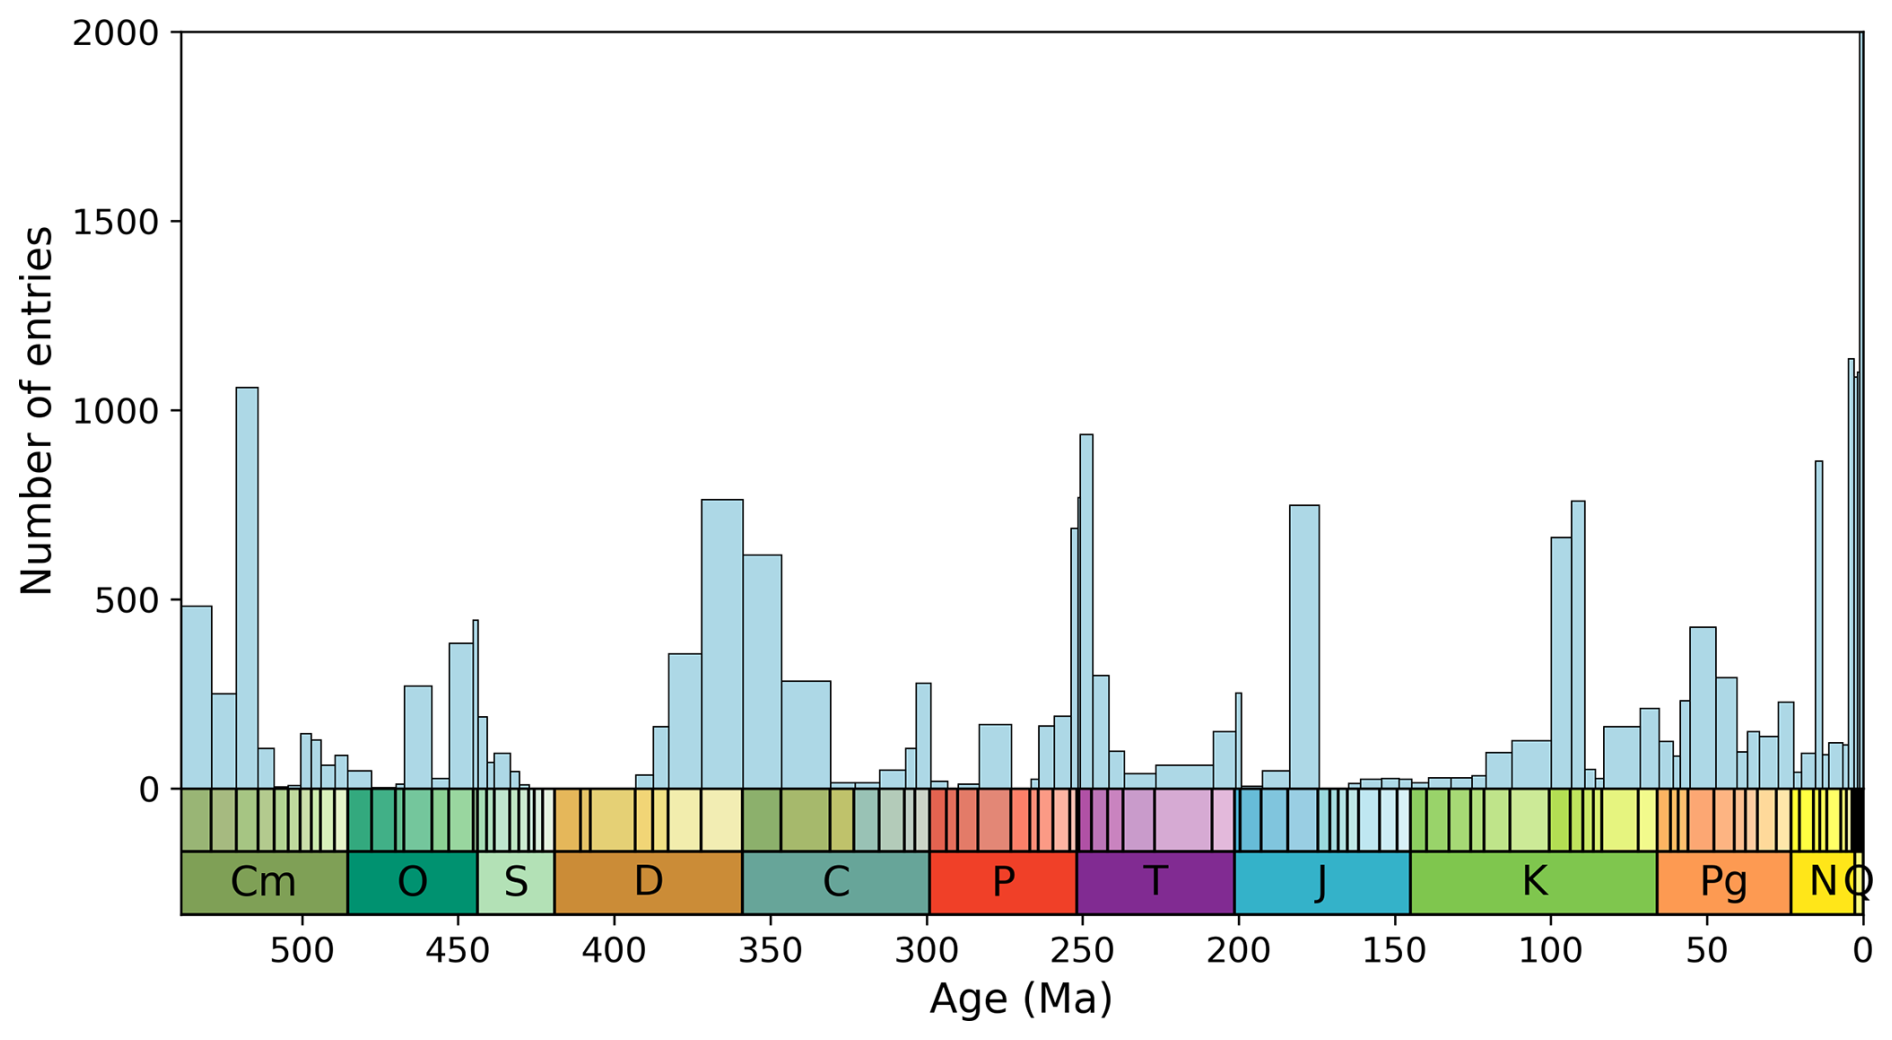
Figure 5Number of data points binned by geologic stage. Data counts for the Holocene (0–12 ka), Late Pleistocene (12–129 ka), and Chibanian (129–770 ka) stages are 10 640, 21 754, and 8378, respectively; these counts are not displayed in the figure due to narrow column width. The Precambrian has only 5646 data points, accounting for 7.9 %, and is not shown. Cm: Cambrian; O: Ordovician; S: Silurian; D: Devonian; C: Carboniferous; P: Permian; T: Triassic; J: Jurassic; K: Cretaceous; Pg: Paleogene; N: Neogene; Q: Quaternary.
Overall, δ15N values exhibit a unimodal distribution centered around +5 ‰, with a mean of 5.1 ± 9.1 ‰ (1σ; Fig. 6a). When examining the modal values of the era-specific kernel density distributions, the Cenozoic exhibits the highest mode, followed by the Precambrian, with significantly lower modal densities in the Paleozoic and Mesozoic (Fig. 6b). The Precambrian data, which have a dispersed distribution (Fig. 7), indicate an unstable nitrogen cycle, a state potentially driven by the evolution of microbial metabolisms and later overprinted by metamorphism (see Ader et al., 2016; Stüeken et al., 2024 for further discussion). LOWESS smoothing results reveal δ15N peaks in the Neoarchean, Paleoproterozoic, and Ediacaran, i.e., periods closely associated with significant oxygenation events (Kipp et al., 2018; Koehler et al., 2019; Pellerin et al., 2024).
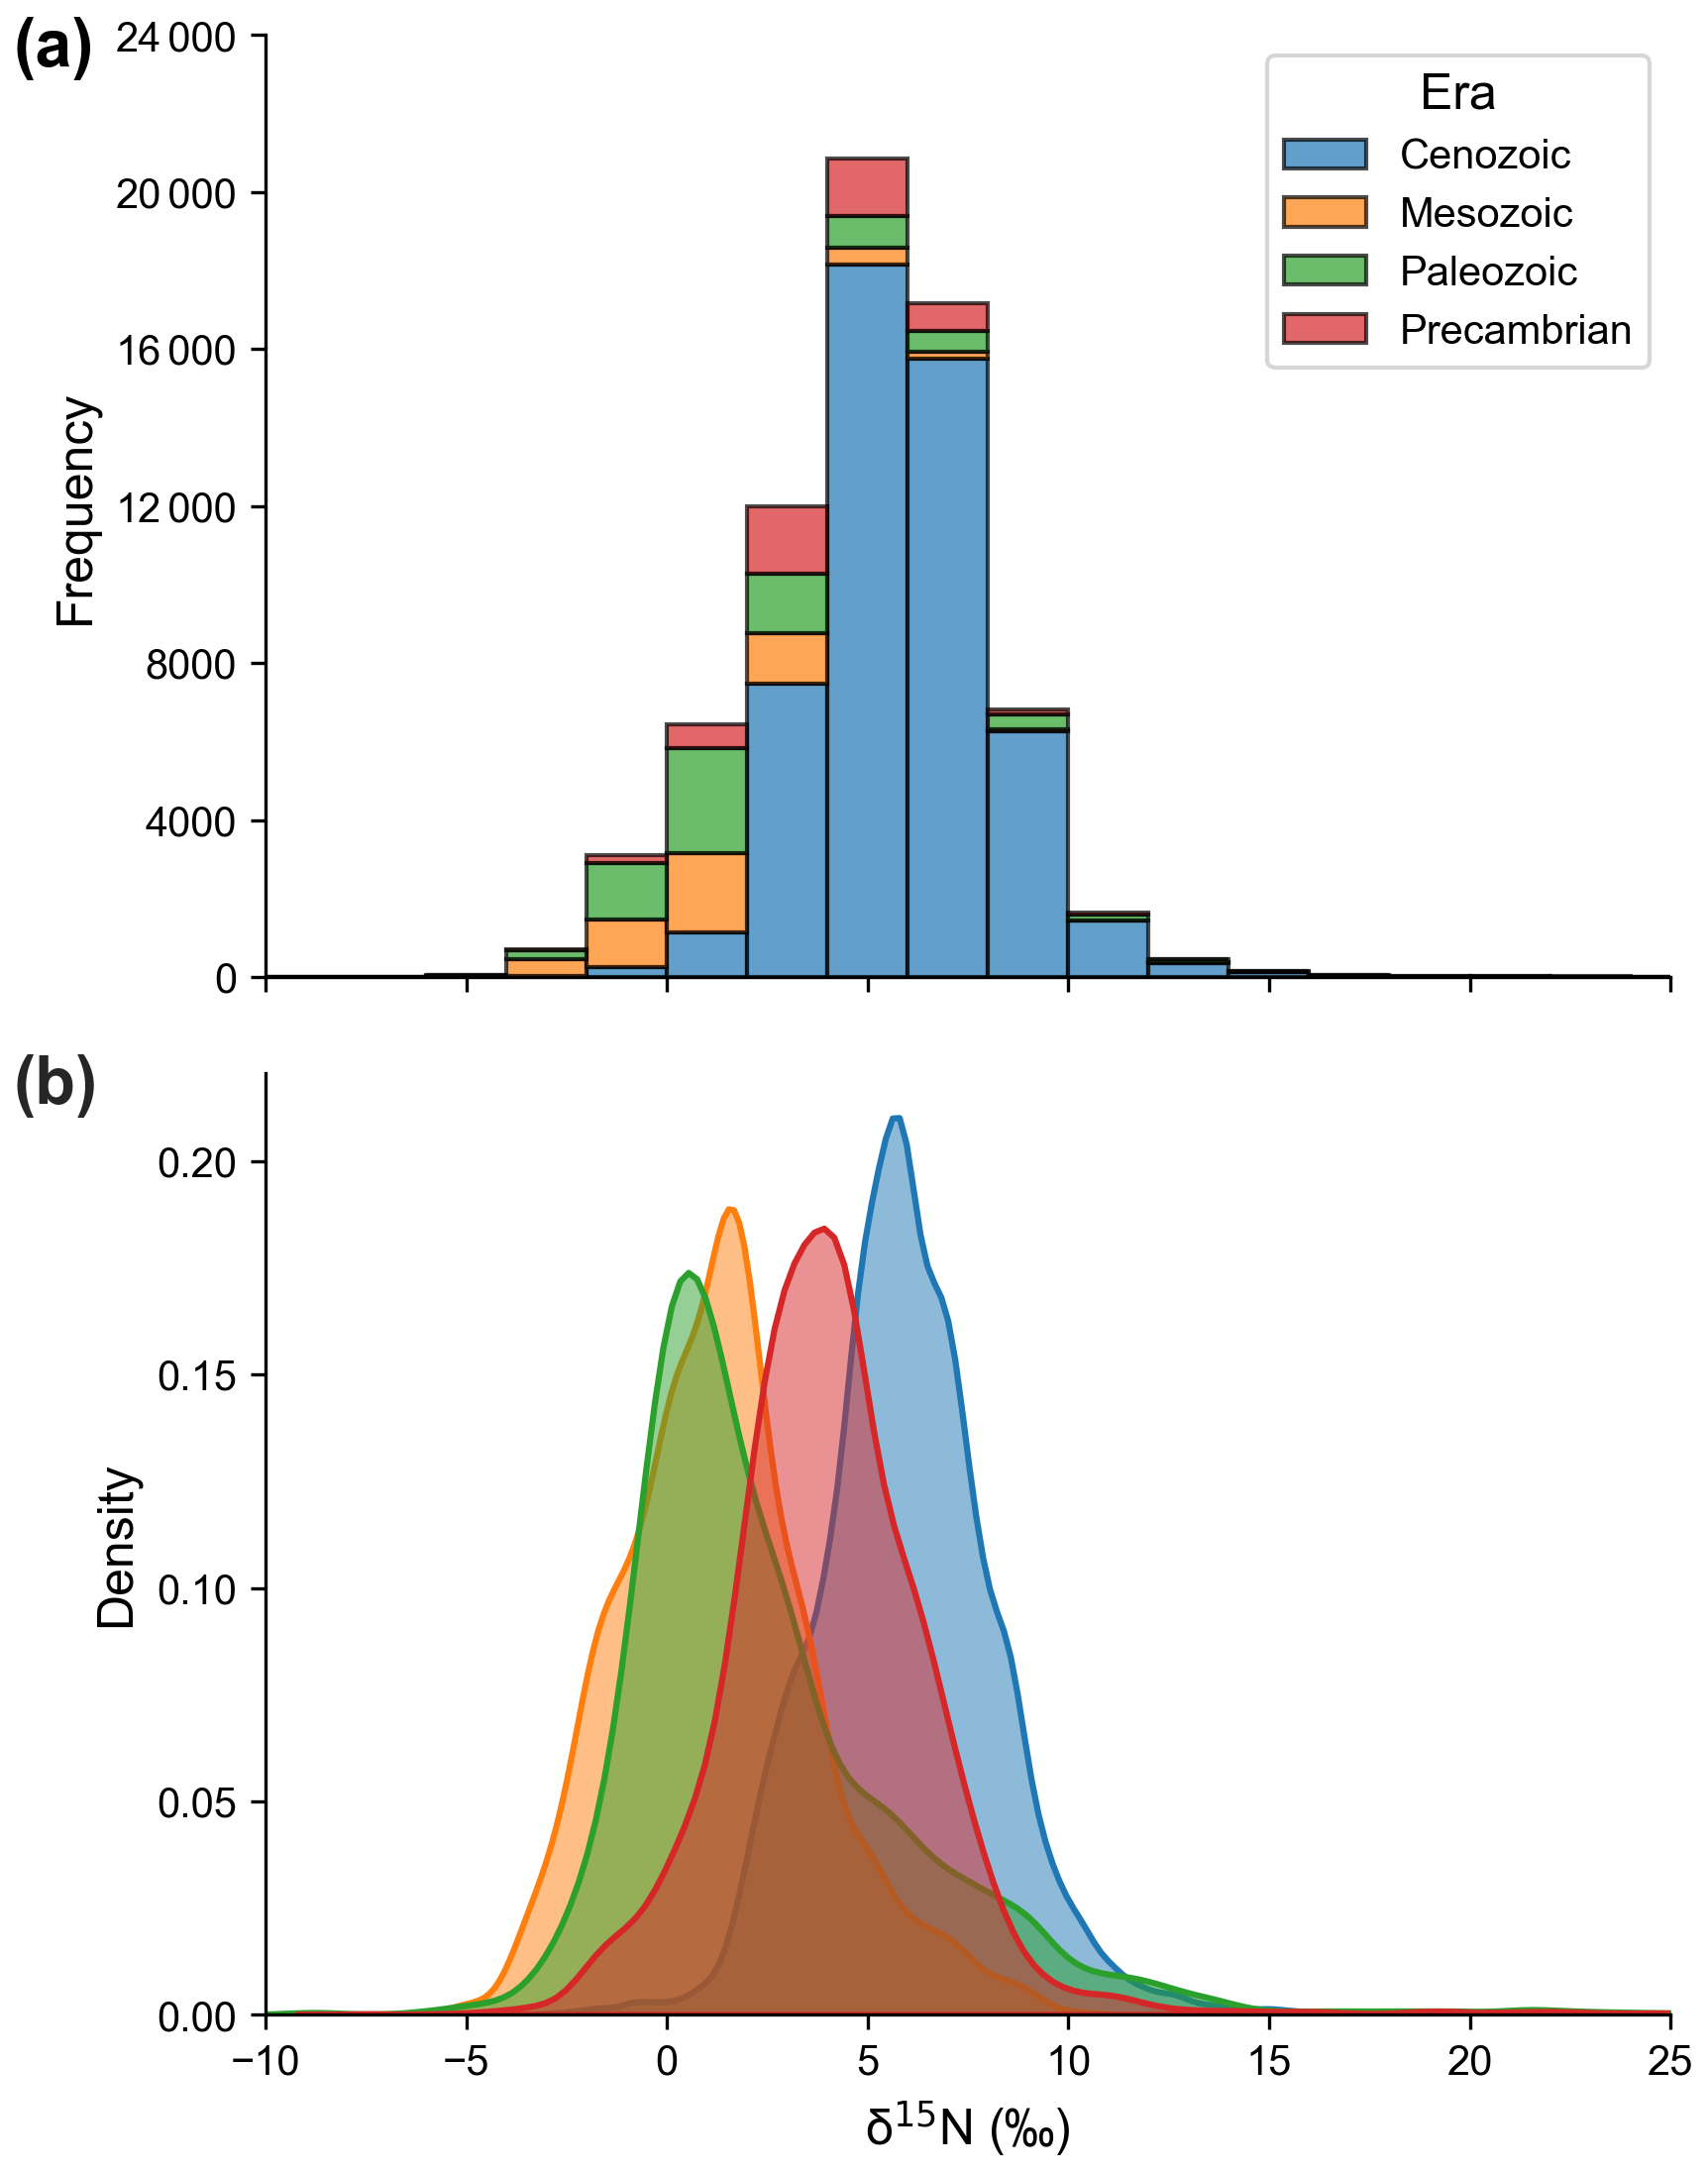
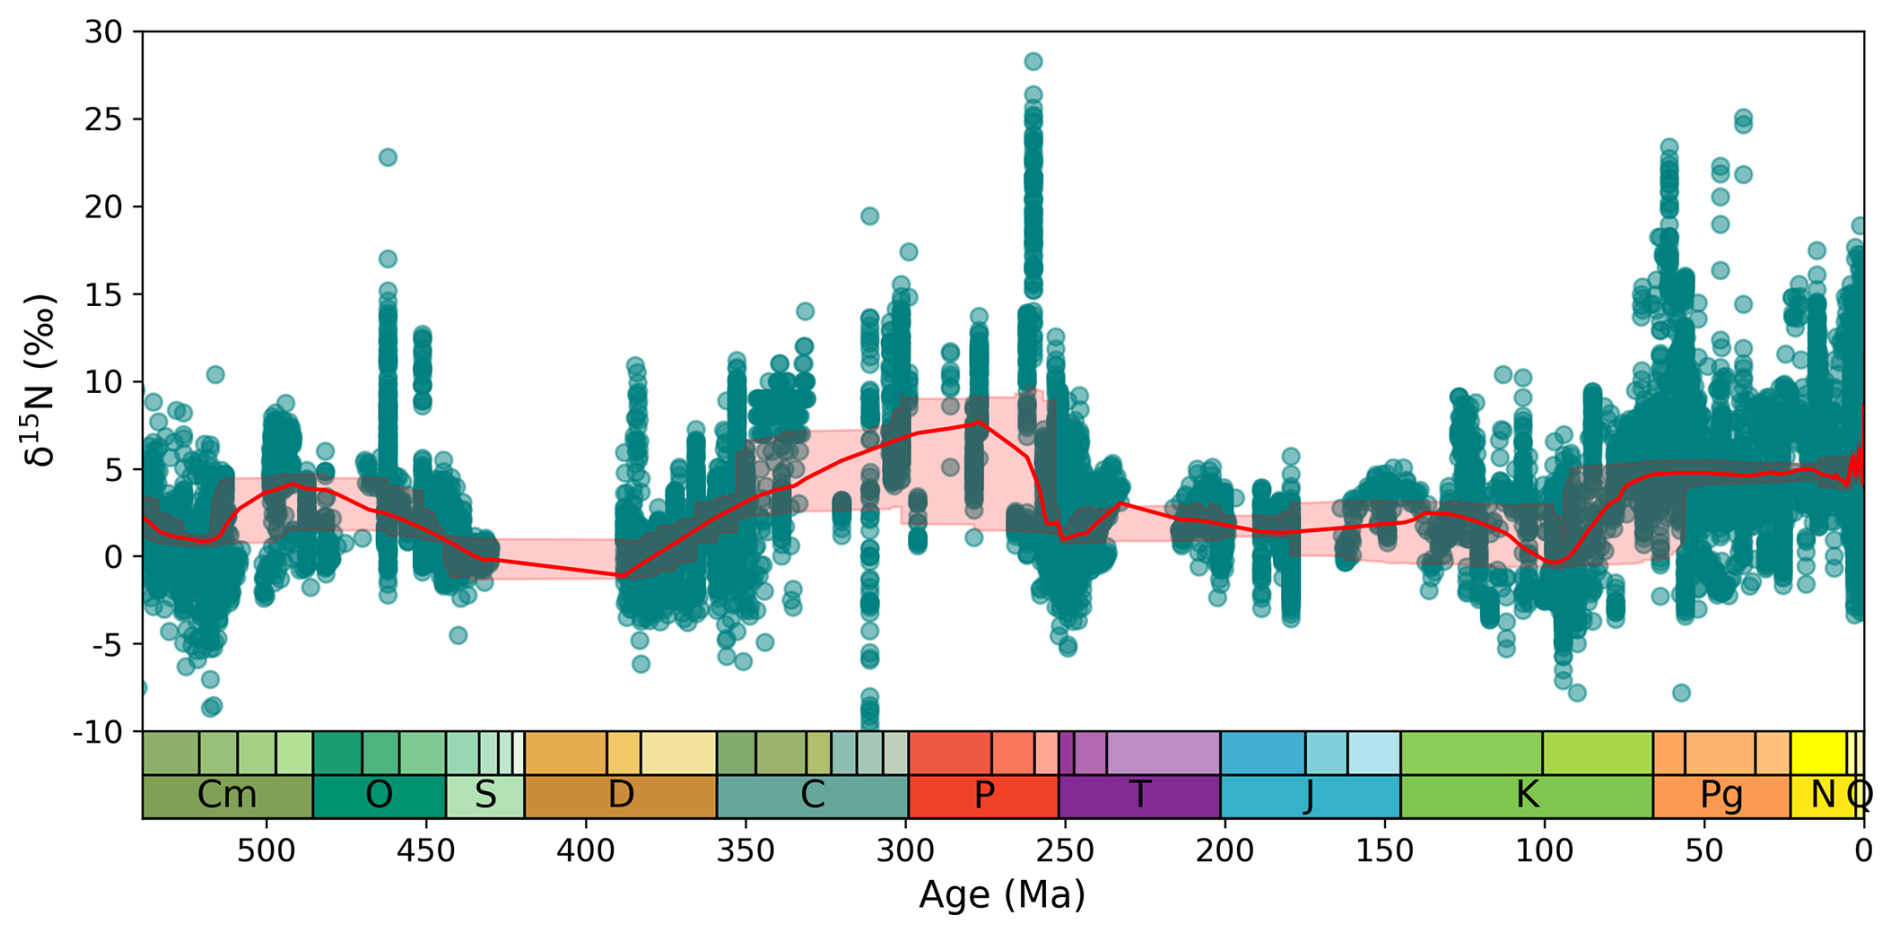
Figure 7δ15N data and LOWESS curve through Precambrian. A LOWESS factor of 0.01 and a confidence interval of 2.5 %–97.5 % were applied. EAr: Eoarchean; PAr: Paleoarchean; MAr: Mesoarchean; NAr: Neoarchean; PPr: Paleoproterozoic; MPr: Mesoproterozoic; NPr: Neoproterozoic.
An examination of δ15N record reveals first-order variations on multi-million-year timescales since the Cryogenian. The LOWESS curve shows extended intervals of relatively elevated δ15N (> +5 ‰) during the Cambrian/Ordovician transition, the Carboniferous–Permian, and the late Cretaceous–Cenozoic (Fig. 7). These broad peaks are separated by periods of lower δ15N values during the Ediacaran–Cambrian, Ordovician–Devonian, and Triassic–Cretaceous. The prolonged intervals (except for the Cambrian/Ordovician transition) of elevated δ15N broadly coincide with known periods of sustained cool climates or major glaciations (i.e., the Sturtian–Marinoan glaciations, the Late Paleozoic Ice Age, and the Cenozoic Icehouse), whereas the low δ15N intervals generally align with warmer greenhouse periods (i.e., most of the late Ediacaran–early Carboniferous and the Mesozoic) (Montañez et al., 2011; Macdonald et al., 2019). This tectonic-scale pattern mirrors observations from orbital-scale glacial-interglacial cycles (Ren et al., 2017) and transient hyperthermal events like the Paleocene/Eocene Thermal Maximum (Junium et al., 2018), suggesting that climate exerts a first-order influence on the marine nitrogen cycle. The underlying mechanisms may involve variations in ice sheet extent and sea level, which affect the distribution of oxygen-minimum zones (OMZs) and the proportion of water-column denitrification versus sedimentary denitrification (Algeo et al., 2014; Wang et al., 2022). However, the correlation is not straightforward; for instance, the increase in δ15N began in the Late Cretaceous, coinciding with the onset of global cooling but preceding the major expansion of Antarctic ice sheets in the Cenozoic (Judd et al., 2024). Therefore, the exact mechanisms coupling climate and nitrogen cycle evolution remain an unsolved question for future research, ideally integrating Earth system models with the spatial δ15N data presented here.
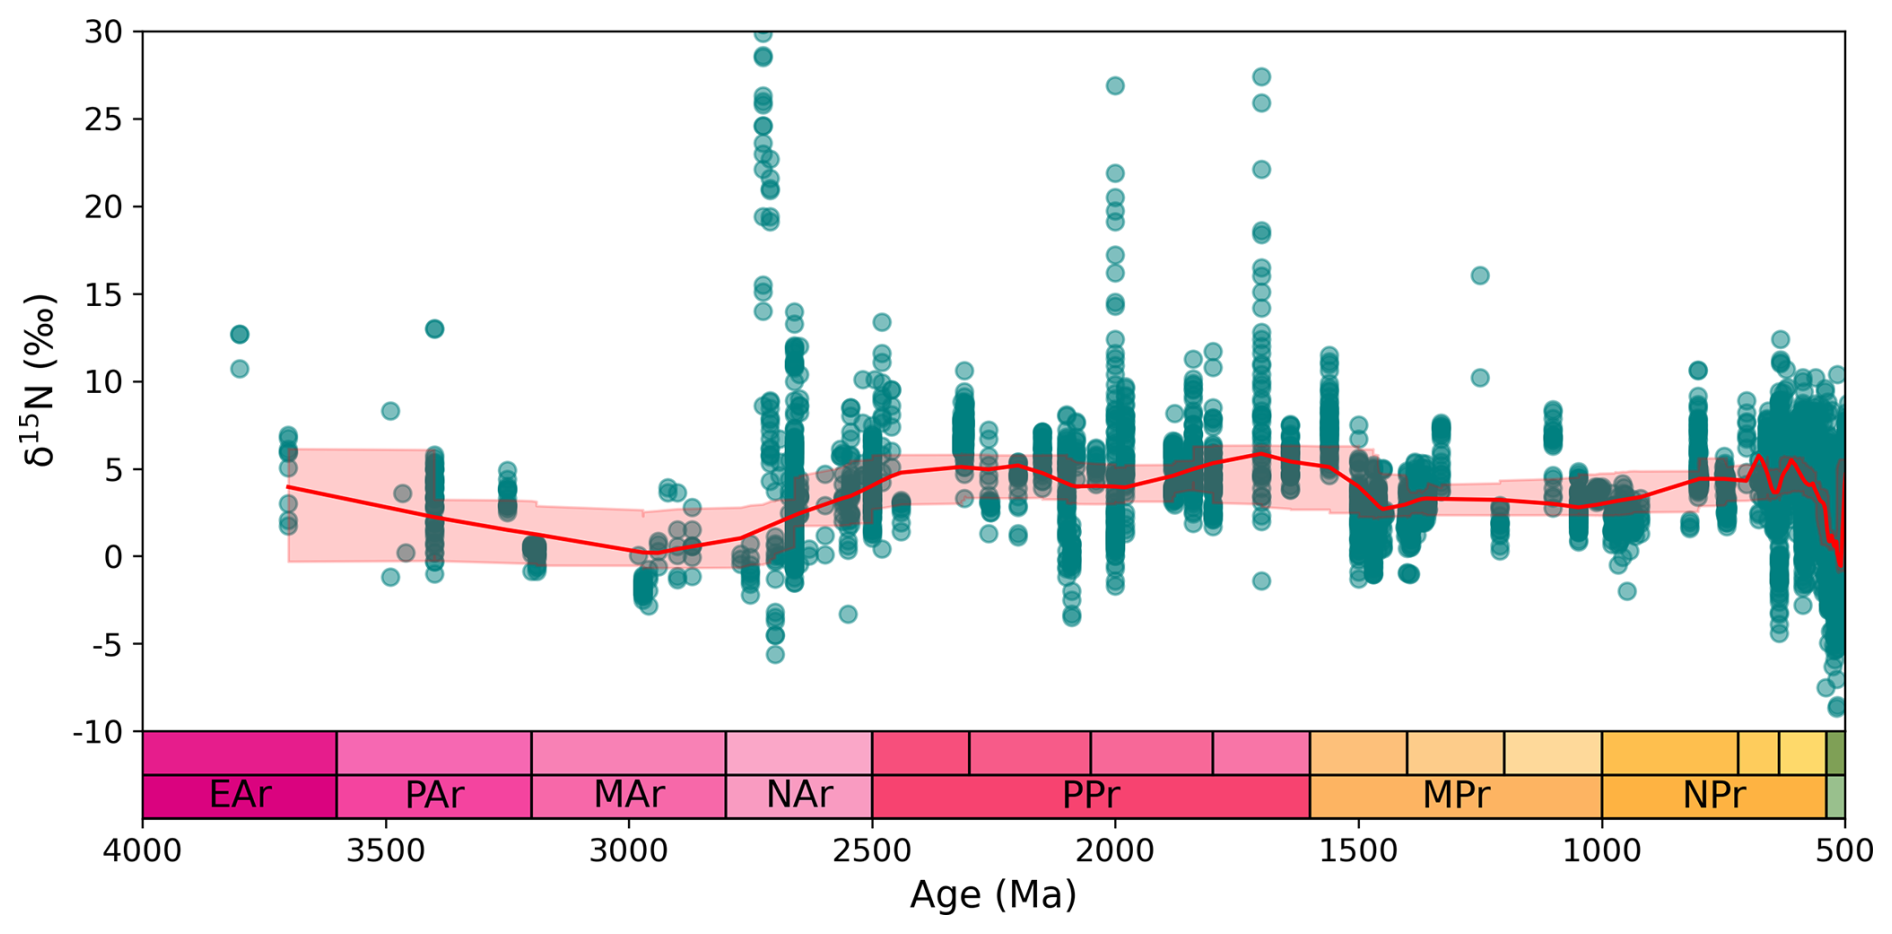
Figure 8δ15N data and LOWESS curve through the Phanerozoic. A LOWESS factor of 0.03 and a confidence interval of 2.5 %–97.5 % were applied.
5.2 Spatial density and characteristics of δ15N
Spatial trends in data density within the DSMS-NI database reveal substantial variability in both modern (Fig. 2) and paleogeographic distributions (Fig. 4). Ocean drilling sites are primarily concentrated along continental margins and deep-sea basins, with significant gaps in central oceanic regions (National Research Council, 2011). For older strata (pre-Cretaceous), sampling sites are clustered in North America, Europe, China, and South Africa (Fig. 2). In terms of latitude, δ15N sampling in older strata is sparse in the modern equatorial region and the mid- to high-latitude areas of the Southern Hemisphere, aside from some Southern Hemisphere samples collected from Cenozoic ocean drilling sites (Fig. 3). When modern coordinates are converted to paleolatitudes and mapped onto paleogeographic reconstructions, the Cenozoic Era provides the most extensive latitudinal coverage, with the Quaternary period contributing the highest number of sites, followed by the Cretaceous (Figs. 4 and 9). In terms of marine spatial distribution, δ15N data since the Cretaceous reflects global patterns to a certain degree (Fig. 4). However, pre-Jurassic data remain spatially concentrated, with Paleozoic sites limited to just two or three main areas. High-latitude sampling is generally scarce, with Paleozoic sites predominantly in the Southern Hemisphere and Mesozoic sites mainly in the Northern Hemisphere (Fig. 4).
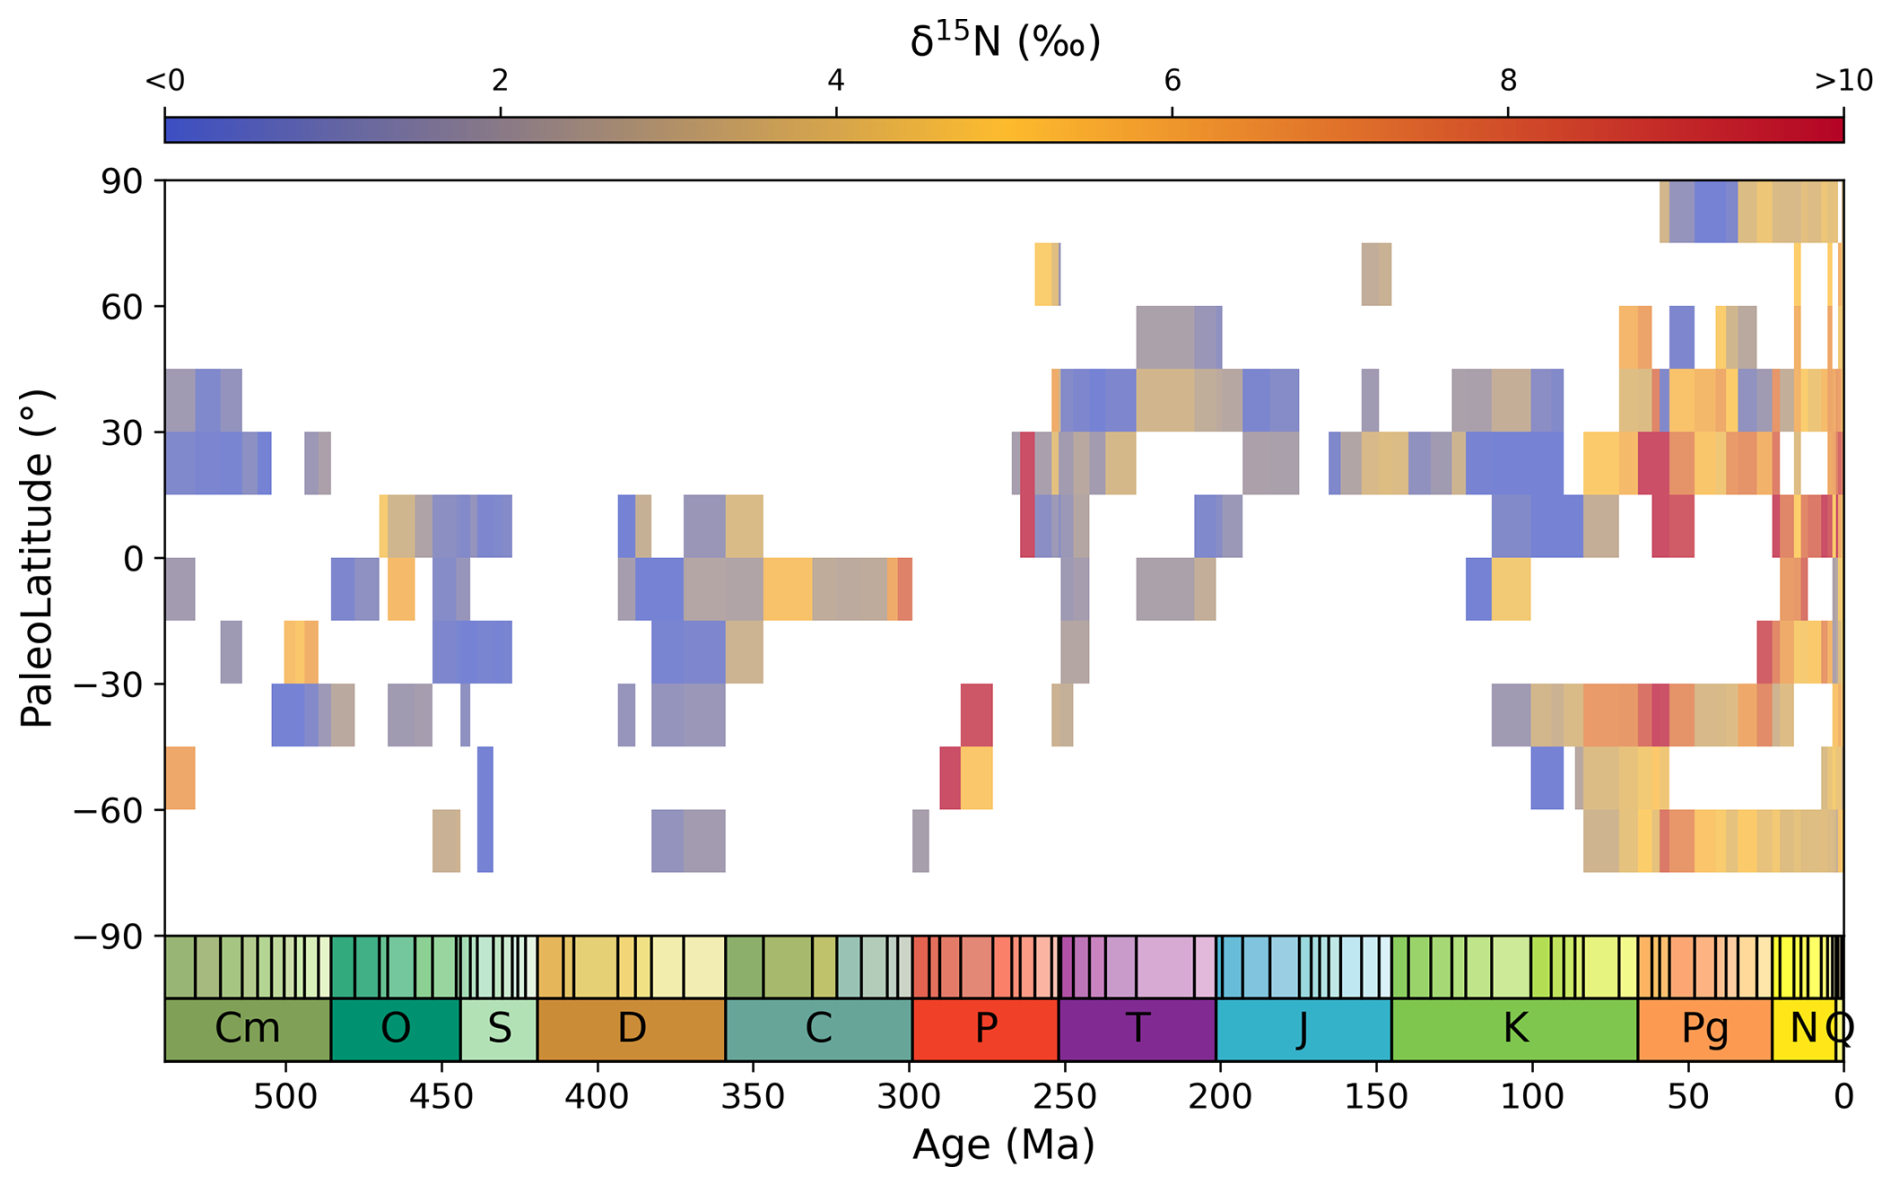
Figure 9Spatio-temporal trends in δ15N values through the Phanerozoic, binned and averaged temporally by stage and spatially by 15° paleolatitudinal bins.
To visualize spatial trends, average δ15N values from each Phanerozoic period were mapped onto paleogeographic reconstructions for the respective period (Fig. 4). Significant spatial differences exist in δ15N distribution for different geological periods. In modern ocean sediments, elevated δ15N values (notably > +5 ‰) are concentrated in regions influenced by upwelling, such as the Arabian Sea, southeastern Indian Ocean, eastern equatorial Pacific, southwestern South America, and the western coast of Mexico (Fig. 4a; Tesdal et al., 2013; Du et al., 2025b). In contrast, lower δ15N values (significantly < +5 ‰) are typically found in restricted basins or broad continental shelves, such as the Black Sea, the Mediterranean Sea, the Baltic Sea, and the South China Sea. The global mean δ15N (approximately +5 ‰, as observed in open ocean like the Southern Ocean) lies between these extremes. The modern spatial distribution of δ15N can provide a valuable framework for interpreting past marine conditions, as δ15N serves as an indicator of nutrient supply, upwelling intensity, and the extent of oceanic oxygen minimum zones (Altabet et al., 1999; Godfrey et al., 2025). However, analyzing spatial patterns in deep-time δ15N records is inherently limited by the scarcity of data, particularly from open-ocean settings, making it difficult to estimate global mean values and relative spatial gradients. For the Paleogene and Neogene, δ15N values were generally higher in the open ocean than in continental margin and restricted basins (Fig. 4b–c). In the Paleozoic and Mesozoic, δ15N values are generally negative, lacking prominent hotspots except in the Carboniferous and Permian. This pattern may reflect a systematic bias, as available data are predominantly derived from continental shelf environments (Judd et al., 2020), which tend to exhibit lower δ15N values compared to the open ocean. Despite differences in paleogeographic position and absolute δ15N values, rapid shifts in δ15N exhibit consistent directional changes (increase or decrease) during key Phanerozoic transition events, such as the Permian-Triassic boundary (Knies et al., 2013; Du et al., 2021, 2023) and the Late Cretaceous (Meyers et al., 2009; Junium et al., 2018; Du et al., 2025b). Given the current uneven distribution of sampling sites, further δ15N studies of multiple regions are crucial for enhancing our understanding of the spatial characteristics of nitrogen cycle evolution in deep time.
The DSMS-NI version 0.3 can be accessed via Zenodo at https://doi.org/10.5281/zenodo.15117375 (Du et al., 2025a) and via the GeoBiology website at https://geobiologydata.cug.edu.cn/ (last access: 30 April 2025, Lai et al., 2025).
The code used to validate the dataset, make the figures in this manuscript, and the heatmap tool is available on Zenodo (https://doi.org/10.5281/zenodo.15758073, Du, 2025). The paleocoordinates were estimated using the PointTracker v7 tool published by the PALEOMAP Project, which can be found at http://www.paleogis.com (last access: 1 April 2025; https://www.earthbyte.org/paleodem-resource-scotese-and-wright-2018/, Scotese and Wright, 2018).
8.1 Informed user notice
Each record (row) in the database includes detailed temporal and spatial metadata, along with lithology, metamorphic grade, and depositional facies information, where available. These metadata are essential for evaluating the geological context and fidelity of nitrogen isotope data. However, this version of the database has certain limitations: it may not capture all possible geological age uncertainties or precise depositional environment details for some records; significant gaps remain in the compilation of data for certain materials and time intervals (e.g. Quaternary). Consequently, users may need to independently assess and refine the metadata (e.g., chronological constraints) and supplement missing data (e.g., coral-bound δ15N records) as necessary for their specific applications. Despite our extensive efforts to accurately identify and quality-control each entry, given the vast dataset, some overlooked errors or data inconsistencies may remain. Users are encouraged to report any issues or omissions to the authors, as corrections will be incorporated into future database versions. We plan to release a new version of the dataset annually on Zenodo and update it on the Geobiology Database website. Each version will incorporate corrections to identified errors and integrate newly published data from the previous year to the fullest extent possible. This systematic update cycle is designed to ensure the dataset's accuracy, relevance, and long-term value for the research community.
In addition to δ15N data, the database provides geochemical information such as TOC, total TN, δ13Corg, and major and trace element concentrations. These supplementary data are valuable for assessing factors that may influence nitrogen isotopes, such as organic matter preservation and redox conditions. Even when not directly paired with δ15N values, we retain all relevant data to enable users to conduct correlation analyses via interpolation or other methods. Researchers are welcome to contribute additional geochemical data from the same sites or samples as they become available, allowing for updates and refinements in subsequent database releases.
8.2 Applying the database to deep-time studies
When applying the database to deep-time studies, certain filtering criteria can be used. For instance, samples may be selected based on lithology, metamorphic grade, and other metadata to ensure that the data aligns with specific geological research contexts. Temporal, paleolatitude, and paleodepth information are critical for paleogeographic reconstructions and spatiotemporal distribution analyses, particularly when investigating paleoclimate change and global biogeochemical cycles. Further analysis of variations in latitude, basin characteristics, and water depth has the potential to yield significant insights. Given the rapid variability of nitrogen isotopes and their pronounced regional characteristics, filling temporal and spatial gaps and enhancing resolution are of great value – particularly for pivotal periods like the Ordovician-Silurian mass extinction, the Early Devonian terrestrial plant radiation, and the Late Jurassic-Early Cretaceous supercontinent breakup. The database is also especially suited for comparative studies of key geological periods, such as the Permian-Triassic boundary extinction and the Cretaceous OAE2. Given the inherent limitations of our simplified age-depth models, we recommend that users seeking higher chronological precision for time-series analysis incorporate additional stratigraphic constraints (e.g., paleomagnetic or cyclostratigraphic data) to develop finer-scale age models, where necessary. To support these applications, we have also provided a software tool on Zenodo, allowing users to generate heatmaps of δ15N data distributions for specific time intervals. These heatmaps visualize the average spatial distribution of δ15N for any selected geological interval, offering preliminary validation for user hypotheses and aiding in uncovering the evolution of the global nitrogen cycle.
YD, HYS and HJS designed the study and secured funding. TJA, EES, SEG, JDC, YD, HZ, XKL, JP, YW, JK, XS, HS, DC and LT conducted data acquisition, curation and validation. YD, LW, JZ, QL, XCL and HY developed computational methodologies and provided technical support. YD prepared the paper with contribution from all co-authors.
The contact author has declared that none of the authors has any competing interests.
Publisher's note: Copernicus Publications remains neutral with regard to jurisdictional claims made in the text, published maps, institutional affiliations, or any other geographical representation in this paper. The authors bear the ultimate responsibility for providing appropriate place names. Views expressed in the text are those of the authors and do not necessarily reflect the views of the publisher.
This work has benefited from previous δ15N datasets compiled by Jan-Erik Tesdal, Christophe Thomazo, Thomas J. Algeo, Eva E. Stüeken, Magali Ader, Xinqiang Wang, and Michael A. Kipp.
This work has been funded by the State Key R&D Project of China (grant nos. 2024YFF0810300, 2023YFF0804000), the National Natural Science Foundation of China (grant nos. U25A20779, 42172032, 42325202, 42402316), the China Postdoctoral Science Foundation (grant no. 2025T180107), the Postdoctoral Fellowship Program of CPSF (grant no. GZB20230679), the Postdoctor Project of Hubei Province (grant no. 2024HBBHCXB087), the Natural Science Foundation of Hubei Province (grant no. 2023AFA006).
This paper was edited by Xingchen (Tony) Wang and reviewed by two anonymous referees.
Ader, M., Thomazo, C., Sansjofre, P., Busigny, V., Papineau, D., Laffont, R., Cartigny, P., and Halverson, G. P.: Interpretation of the nitrogen isotopic composition of Precambrian sedimentary rocks: Assumptions and perspectives, Chem. Geol., 429, 93–110, https://doi.org/10.1016/j.chemgeo.2016.02.010, 2016.
Algeo, T. J., Rowe, H., Hower, J. C., Schwark, L., Herrmann, A., and Heckel, P.: Changes in ocean denitrification during Late Carboniferous glacial–interglacial cycles, Nat. Geosci., 1, 709–714, https://doi.org/10.1038/ngeo307, 2008.
Algeo, T. J., Meyers, P. A., Robinson, R. S., Rowe, H., and Jiang, G. Q.: Icehouse–greenhouse variations in marine denitrification, Biogeosciences, 11, 1273–1295, https://doi.org/10.5194/bg-11-1273-2014, 2014.
Altabet, M. A., Murray, D. W., and Prell, W. L.: Climatically linked oscillations in Arabian Sea denitrification over the past 1 m.y.: Implications for the marine N cycle, Paleoceanography, 14, 732–743, https://doi.org/10.1029/1999PA900035, 1999.
Bebout, G. E., Cooper, D. C., Bradley, A. D., and Sadofsky, S. J.: Nitrogen-isotope record of fluid-rock interactions in the Skiddaw aureole and granite, English Lake District, Am. Mineral., 84, 1495–1505, https://doi.org/10.2138/am-1999-1002, 1999.
Bush, A. M. and Payne, J. L.: Biotic and Abiotic Controls on the Phanerozoic History of Marine Animal Biodiversity, Annu. Rev. Ecol. Evol. Syst., 52, 269–289, https://doi.org/10.1146/annurev-ecolsys-012021-035131, 2021.
Busigny, V., Cartigny, P., Philippot, P., Ader, M., and Javoy, M.: Massive recycling of nitrogen and other fluid-mobile elements (K, Rb, Cs, H) in a cold slab environment: evidence from HP to UHP oceanic metasediments of the Schistes Lustrés nappe (western Alps, Europe), Earth Planet. Sc. Lett., 215, 27–42, https://doi.org/10.1016/S0012-821X(03)00453-9, 2003.
Chase, B. M., Niedermeyer, E. M., Boom, A., Carr, A. S., Chevalier, M., He, F., Meadows, M. E., Ogle, N., and Reimer, P. J.: Orbital controls on Namib Desert hydroclimate over the past 50,000 years, Geology, 47, 867–871, https://doi.org/10.1130/G46334.1, 2019.
Diepenbroek, M., Grobe, H., Reinke, M., Schindler, U., Schlitzer, R., Sieger, R., and Wefer, G.: PANGAEA – an information system for environmental sciences, Comput. Geosci., 28, 1201–1210, https://doi.org/10.1016/S0098-3004(02)00039-0, 2002.
Du, Y.: Python Code for Figures of the Global Deep-Time Marine Nitrogen Isotope Database, Zenodo [code], https://doi.org/10.5281/zenodo.15758073, 2025.
Du, Y., Song, H. Y., Tong, J., Algeo, T. J., Li, Z., Song, H.J., and Huang, J.: Changes in productivity associated with algal-microbial shifts during the Early Triassic recovery of marine ecosystems, Geol. Soc. Am. Bull., 133, 362–378, https://doi.org/10.1130/B35510.1, 2021.
Du, Y., Song, H.Y., Grasby, S. E., Xing, T., Song, H.J., Tian, L., Chu, D., Wu, Y., Dal Corso, J., Algeo, T. J., and Tong, J.: Recovery from persistent nutrient-N limitation following the Permian–Triassic mass extinction, Earth Planet. Sci. Lett., 602, 117944, https://doi.org/10.1016/j.epsl.2022.117944, 2023.
Du, Y., Song, H. Y., Stüeken, E. E., Grasby, S. E., Song, H.J., Tian, L., Chu, D., Dal Corso, J., Li, Z., and Tong, J.: Large nitrogen cycle perturbations during the Early Triassic hyperthermal, Geochim. Cosmochim. Acta, 382, 13–25, https://doi.org/10.1016/j.gca.2024.08.009, 2024.
Du, Y., Song, H. Y., Algeo, T. J., Zhang, H., Peng, J., Wu, Y., Lai, J., Shu, X., Song, H. J., Wei, L., Zhang, J., Stüeken, E. E., Grasby, S. E., Dal Corso, J., Dai, X., Chu, D., Tian, L., Liang, Q., Li, X., Yao, H., and Song, H.: The global database of deep-time marine nitrogen isotope data, Zenodo [data set], https://doi.org/10.5281/zenodo.15117375, 2025a.
Du, Y., Song, H. Y., Algeo, T. J., Zhong, L., Li, J., and Song, H. J.: Tectonic controls on nitrogen cycling and ocean ventilation dynamics in the Late Cretaceous equatorial Atlantic, Earth Planet. Sc. Lett., 667, 119517, https://doi.org/10.1016/j.epsl.2025.119517, 2025b.
Farrell, Ú. C., Samawi, R., Anjanappa, S., Klykov, R., Adeboye, O. O., Agic, H., Ahm, A.-S. C., Boag, T. H., Bowyer, F., Brocks, J. J., Brunoir, T. N., Canfield, D. E., Chen, X., Cheng, M., Clarkson, M. O., Cole, D. B., Cordie, D. R., Crockford, P. W., Cui, H., Dahl, T. W., Mouro, L. D., Dewing, K., Dornbos, S. Q., Drabon, N., Dumoulin, J. A., Emmings, J. F., Endriga, C. R., Fraser, T. A., Gaines, R. R., Gaschnig, R. M., Gibson, T. M., Gilleaudeau, G. J., Gill, B. C., Goldberg, K., Guilbaud, R., Halverson, G. P., Hammarlund, E. U., Hantsoo, K. G., Henderson, M. A., Hodgskiss, M. S. W., Horner, T. J., Husson, J. M., Johnson, B., Kabanov, P., Brenhin Keller, C., Kimmig, J., Kipp, M. A., Knoll, A. H., Kreitsmann, T., Kunzmann, M., Kurzweil, F., LeRoy, M. A., Li, C., Lipp, A. G., Loydell, D. K., Lu, X., Macdonald, F. A., Magnall, J. M., Mänd, K., Mehra, A., Melchin, M. J., Miller, A. J., Mills, N. T., Mwinde, C. N., O'Connell, B., Och, L. M., Ossa Ossa, F., Pagès, A., Paiste, K., Partin, C. A., Peters, S. E., Petrov, P., Playter, T. L., Plaza-Torres, S., Porter, S. M., Poulton, S. W., Pruss, S. B., Richoz, S., Ritzer, S. R., Rooney, A. D., Sahoo, S. K., Schoepfer, S. D., Sclafani, J. A., Shen, Y., Shorttle, O., Slotznick, S. P., Smith, E. F., Spinks, S., Stockey, R. G., Strauss, J. V., Stüeken, E. E., Tecklenburg, S., Thomson, D., Tosca, N. J., Uhlein, G. J., Vizcaíno, M. N., Wang, H., White, T., Wilby, P. R., Woltz, C. R., Wood, R. A., Xiang, L., Yurchenko, I. A., Zhang, T., Planavsky, N. J., Lau, K. V., Johnston, D. T., and Sperling, E. A.: The Sedimentary Geochemistry and Paleoenvironments Project, Geobiology, 19, 545–556, https://doi.org/10.1111/gbi.12462, 2021.
Gard, M., Hasterok, D., and Halpin, J. A.: Global whole-rock geochemical database compilation, Earth Syst. Sci. Data, 11, 1553–1566, https://doi.org/10.5194/essd-11-1553-2019, 2019.
Godfrey, L. V., Omta, A. W., Tziperman, E., Li, X., Hu, Y., and Falkowski, P. G.: Stability of the marine nitrogen cycle over the past 165 million years, Nat. Commun., 16, 8982, https://doi.org/10.1038/s41467-025-63604-x, 2025.
Gruber, N. and Galloway, J. N.: An Earth-system perspective of the global nitrogen cycle, Nature, 451, 293–296, https://doi.org/10.1038/nature06592, 2008.
Hammarlund, E. U., Smith, M. P., Rasmussen, J. A., Nielsen, A. T., Canfield, D. E., and Harper, D. A. T.: The Sirius Passet Lagerstätte of North Greenland-A geochemical window on early Cambrian low-oxygen environments and ecosystems, Geobiology, 17, 12–26, https://doi.org/10.1111/gbi.12315, 2019.
Hendricks, G., Tkaczyk, D., Lin, J., and Feeney, P.: Crossref: The sustainable source of community-owned scholarly metadata, Quant. Sci. Stud., 1, 414–427, https://doi.org/10.1162/qss_a_00022, 2020.
Hoefs, J.: Stable Isotope Geochemistry, Springer International Publishing, Berlin, https://doi.org/10.1007/978-3-030-77692-3, 2021.
Ishida, A., Hashizume, K., and Kakegawa, T.: Microbial nitrogen cycle enhanced by continental input recorded in the Gunflint Formation, Geochem. Persp. Let., 13–18, https://doi.org/10.7185/geochemlet.1729, 2017.
Jia, Y. and Kerrich, R.: Giant quartz vein systems in accretionary orogenic belts: the evidence for a metamorphic fluid origin from δ15N and δ13C studies, Earth Planet. Sc. Lett., 184, 211–224, https://doi.org/10.1016/S0012-821X(00)00320-4, 2000.
Jenkyns, H. C.: Geochemistry of oceanic anoxic events, Geochem. Geophys. Geosyst., 11, Q03004, https://doi.org/10.1029/2009GC002788, 2010.
Judd, E. J., Bhattacharya, T., and Ivany, L. C.: A Dynamical Framework for Interpreting Ancient Sea Surface Temperatures, Geophys. Res. Lett., 47, e2020GL089044, https://doi.org/10.1029/2020GL089044, 2020.
Judd, E. J., Tierney, J. E., Lunt, D. J., Montañez, I. P., Huber, B. T., Wing, S. L., and Valdes, P. J.: A 485-million-year history of Earth's surface temperature, Science, 385, eadk3705, https://doi.org/10.1126/science.adk3705, 2024.
Junium, C. K., Meyers, S. R., and Arthur, M. A.: Nitrogen cycle dynamics in the Late Cretaceous Greenhouse, Earth Planet. Sc. Lett., 481, 404–411, https://doi.org/10.1016/j.epsl.2017.10.006, 2018.
Kipp, M. A., Stüeken, E. E., Yun, M., Bekker, A., and Buick, R.: Pervasive aerobic nitrogen cycling in the surface ocean across the Paleoproterozoic Era, Earth Planet. Sc. Lett., 500, 117–126, https://doi.org/10.1016/j.epsl.2018.08.007, 2018.
Knies, J., Grasby, S. E., Beauchamp, B., and Schubert, C. J.: Water mass denitrification during the latest Permian extinction in the Sverdrup Basin, Arctic Canada, Geology, 41, 167–170, https://doi.org/10.1130/G33816.1, 2013.
Kocsis, Á. T. and Scotese, C. R.: Mapping paleocoastlines and continental flooding during the Phanerozoic, Earth Sci. Rev., 213, 103463, https://doi.org/10.1016/j.earscirev.2020.103463, 2021.
Koehler, M. C., Stüeken, E. E., Hillier, S., and Prave, A. R.: Limitation of fixed nitrogen and deepening of the carbonate-compensation depth through the Hirnantian at Dob's Linn, Scotland, Palaeogeogr. Palaeoclimatol. Palaeoecol., 534, 109321, https://doi.org/10.1016/j.palaeo.2019.109321, 2019.
Lai, J., Song, H., Chu, D., Dal Corso, J., Sperling, E. A., Wu, Y., Liu, X., Wei, L., Li, M., Song, H., Du, Y., Jia, E., Feng, Y., Song, H., Yu, W., Liang, Q., Li, X., and Yao, H.: Deep-Time Marine Sedimentary Element Database, Earth Syst. Sci. Data, 17, 1613–1626, https://doi.org/10.5194/essd-17-1613-2025, 2025.
Li, J., Song, H. Y., Du, Y., Wignall, P. B., Bond, D. P. G., Grasby, S. E., Song, H. J., Dal Corso, J., Tian, L., and Chu, D.: Spatial and temporal heterogeneity of the marine nitrogen cycle during the end-Triassic mass extinction, Chem. Geol., 682, 122752, https://doi.org/10.1016/j.chemgeo.2025.122752, 2025.
Liu, Y., Magnall, J. M., Gleeson, S. A., Bowyer, F., Poulton, S. W., and Zhang, J.: Spatio-temporal evolution of ocean redox and nitrogen cycling in the early Cambrian Yangtze ocean, Chem. Geol., 554, 119803, https://doi.org/10.1016/j.chemgeo.2020.119803, 2020.
Liu, Z., Altabet, M. A., and Herbert, T. D.: Plio-Pleistocene denitrification in the eastern tropical North Pacific: Intensification at 2.1 Ma, Chem. Geol., 9, 2008GC002044, https://doi.org/10.1029/2008GC002044, 2008.
Macdonald, F. A., Swanson-Hysell, N. L., Park, Y., Lisiecki, L., and Jagoutz, O.: Arc-continent collisions in the tropics set earth's climate state, Science, 364, 181–184, https://doi.org/10.1126/science.aav5300, 2019.
Martin, A. N. and Stüeken, E. E.: Mechanisms of nitrogen isotope fractionation at an ancient black smoker in the 2.7 Ga Abitibi greenstone belt, Canada, Geology, 52, https://doi.org/10.1130/G51689.1, 2024.
Meyers, P. A., Yum, J.-G., and Wise, S. W.: Origins and maturity of organic matter in mid-Cretaceous black shales from ODP Site 1138 on the Kerguelen Plateau, Mar. Pet. Geol., 26, 909–915, https://doi.org/10.1016/j.marpetgeo.2008.09.003, 2009.
Montañez, I., Norris, R., Ma, C., Johnson, K., Mj, K., Kiehl, J., Kump, L., Ravelo, A., and Kk, T.: Understanding Earth’s Deep Past: Lessons for Our Climate Future, National Academies Press, Washington, DC, 208 pp., ISBN 13 978-0-309-20915-1, 2011.
Moretti, S., Auderset, A., Deutsch, C., Schmitz, R., Gerber, L., Thomas, E., Luciani, V., Petrizzo, M. R., Schiebel, R., Tripati, A., Sexton, P., Norris, R., D'Onofrio, R., Zachos, J., Sigman, D. M., Haug, G. H., and Martínez-García, A.: Oxygen rise in the tropical upper ocean during the Paleocene-Eocene Thermal Maximum, Science, 383, 727–731, https://doi.org/10.1126/science.adh4893, 2024.
Murphy, E. M. A. and Salvador, A.: International Subcommission on Stratigraphic Classification of IUGS International Commission on Stratigraphy, Episodes, 22, 255–271, https://doi.org/10.18814/epiiugs/1999/v22i4/002, 1999.
National Research Council: Scientific Ocean Drilling: Accomplishments and Challenges, National Academies Press, Washington, D.C., https://doi.org/10.17226/13232, 2011.
Pellerin, A., Thomazo, C., Ader, M., Rossignol, C., Rego, E. S., Busigny, V., and Philippot, P.: Neoarchaean oxygen-based nitrogen cycle en route to the Great Oxidation Event, Nature, https://doi.org/10.1038/s41586-024-07842-x, 2024.
Percival, L. M. E., Marynowski, L., Baudin, F., Goderis, S., De Vleeschouwer, D., Rakociński, M., Narkiewicz, K., Corradini, C., Da Silva, A.-C., and Claeys, P.: Combined Nitrogen-Isotope and Cyclostratigraphy Evidence for Temporal and Spatial Variability in Frasnian–Famennian Environmental Change, Geochem. Geophys. Geosyst., 23, e2021GC010308, https://doi.org/10.1029/2021GC010308, 2022.
Peters, K. E.: Guidelines for Evaluating Petroleum Source Rock Using Programmed Pyrolysis, AAPG Bull., 70, 318–329, https://doi.org/10.1306/94885688-1704-11D7-8645000102C1865D, 1986.
Poulton, S. W. and Canfield, D. E.: Development of a sequential extraction procedure for iron: implications for iron partitioning in continentally derived particulates, Chem. Geol., 214, 209–221, https://doi.org/10.1016/j.chemgeo.2004.09.003, 2005.
Ren, H., Sigman, D. M., Thunell, R. C., and Prokopenko, M. G.: Nitrogen isotopic composition of planktonic foraminifera from the modern ocean and recent sediments, Limnol. Oceanogr., 57, 1011–1024, https://doi.org/10.4319/lo.2012.57.4.1011, 2012.
Ren, H., Sigman, D. M., Martínez-García, A., Anderson, R. F., Chen, M.-T., Ravelo, A. C., Straub, M., Wong, G. T. F., and Haug, G. H.: Impact of glacial/interglacial sea level change on the ocean nitrogen cycle, P. Natl. Acad. Sci. USA, 114, https://doi.org/10.1073/pnas.1701315114, 2017.
Robinson, R. S., Kienast, M., Luiza Albuquerque, A., Altabet, M., Contreras, S., De Pol Holz, R., Dubois, N., Francois, R., Galbraith, E., Hsu, T.-C., Ivanochko, T., Jaccard, S., Kao, S.-J., Kiefer, T., Kienast, S., Lehmann, M., Martinez, P., McCarthy, M., Möbius, J., Pedersen, T., Quan, T. M., Ryabenko, E., Schmittner, A., Schneider, R., Schneider-Mor, A., Shigemitsu, M., Sinclair, D., Somes, C., Studer, A., Thunell, R., and Yang, J.-Y.: A review of nitrogen isotopic alteration in marine sediments, Paleoceanography, 27, https://doi.org/10.1029/2012PA002321, 2012.
Sahoo, S. K., Gilleaudeau, G. J., Wilson, K., Hart, B., Barnes, B. D., Faison, T., Bowman, A. R., Larson, T. E., and Kaufman, A. J.: Basin-scale reconstruction of euxinia and Late Devonian mass extinctions, Nature, 615, 640–645, https://doi.org/10.1038/s41586-023-05716-2, 2023.
Scotese, C. R. and Wright, N.: PALEOMAP Paleodigital Elevation Models (PaleoDEMS) for the Phanerozoic PALEOMAP Project, https://www.earthbyte.org/paleodem-resource-scotese-and-wright-2018/ (last access: 1 April 2025), 2018.
Smart, S. M., Ren, H., Fawcett, S. E., Schiebel, R., Conte, M., Rafter, P. A., Ellis, K. K., Weigand, M. A., Oleynik, S., Haug, G. H., and Sigman, D. M.: Ground-truthing the planktic foraminifer-bound nitrogen isotope paleo-proxy in the Sargasso Sea, Geochim. Cosmochim. Acta, 235, 463–482, https://doi.org/10.1016/j.gca.2018.05.023, 2018.
Song, H. Y., Xing, T., Stüeken, E. E., Du, Y., Zhu, Y., Tao, X., Ni, Q., and Song, H. J.: Isotopic differences and paleoenvironmental significance of nitrogen contained in bulk sedimentary rocks, decarbonated aliquots and kerogen extracts, Chem. Geol., 631, 121522, https://doi.org/10.1016/j.chemgeo.2023.121522, 2023.
Stüeken, E. E., Kipp, M. A., Koehler, M. C., and Buick, R.: The evolution of Earth's biogeochemical nitrogen cycle, Earth Sci. Rev., 160, 220–239, https://doi.org/10.1016/j.earscirev.2016.07.007, 2016.
Stüeken, E. E., Pellerin, A., Thomazo, C., Johnson, B. W., Duncanson, S., and Schoepfer, S. D.: Marine biogeochemical nitrogen cycling through Earth's history, Nat. Rev. Earth Environ., https://doi.org/10.1038/s43017-024-00591-5, 2024.
Sun, Y.: Dynamics of nutrient cycles in the Permian–Triassic oceans, Earth Sci. Rev., 258, 104914, https://doi.org/10.1016/j.earscirev.2024.104914, 2024.
Tesdal, J.-E., Galbraith, E. D., and Kienast, M.: Nitrogen isotopes in bulk marine sediment: linking seafloor observations with subseafloor records, Biogeosciences, 10, 101–118, https://doi.org/10.5194/bg-10-101-2013, 2013.
Thomazo, C., Ader, M., and Philippot, P.: Extreme 15 N-enrichments in 2.72-Gyr-old sediments: evidence for a turning point in the nitrogen cycle, Geobiology, 9, 107–120, https://doi.org/10.1111/j.1472-4669.2011.00271.x, 2011.
Tribovillard, N., Algeo, T. J., Lyons, T., and Riboulleau, A.: Trace metals as paleoredox and paleoproductivity proxies: An update, Chem. Geol., 232, 12–32, https://doi.org/10.1016/j.chemgeo.2006.02.012, 2006.
Tucker, M. E. and Wright, V. P.: Carbonate Sedimentology, John Wiley & Sons, Hoboken, New Jersey, U.S., 482 pp., ISBN 1-4443-1416-5, 2009.
Uveges, B. T., Izon, G., Junium, C. K., Ono, S., and Summons, R. E.: Aerobic nitrogen cycle 100 My before permanent atmospheric oxygenation, P. Natl. Acad. Sci. USA, 122, e2423481122, https://doi.org/10.1073/pnas.2423481122, 2025.
Wang, D., Ling, H.-F., Struck, U., Zhu, X.-K., Zhu, M., He, T., Yang, B., Gamper, A., and Shields, G. A.: Coupling of ocean redox and animal evolution during the Ediacaran-Cambrian transition, Nat. Commun., 9, 2575, https://doi.org/10.1038/s41467-018-04980-5, 2018.
Wang, X., Shi, X., Tang, D., and Zhang, W.: Nitrogen isotope evidence for redox variations at the Ediacaran-Cambrian Transition in South China, J. Geol., 121, 489–502, https://doi.org/10.1086/671396, 2013.
Wang, X. T., Wang, Y., Auderset, A., Sigman, D. M., Ren, H., Martínez-García, A., Haug, G. H., Su, Z., Zhang, Y. G., Rasmussen, B., Sessions, A. L., and Fischer, W. W.: Oceanic nutrient rise and the late Miocene inception of Pacific oxygen-deficient zones, P. Natl. Acad. Sci. USA, 119, e2204986119, https://doi.org/10.1073/pnas.2204986119, 2022.
Wilkinson, M. D., Dumontier, M., Aalbersberg, Ij. J., Appleton, G., Axton, M., Baak, A., Blomberg, N., Boiten, J.-W., Da Silva Santos, L. B., Bourne, P. E., Bouwman, J., Brookes, A. J., Clark, T., Crosas, M., Dillo, I., Dumon, O., Edmunds, S., Evelo, C. T., Finkers, R., Gonzalez-Beltran, A., Gray, A. J. G., Groth, P., Goble, C., Grethe, J. S., Heringa, J., ’T Hoen, P. A. C., Hooft, R., Kuhn, T., Kok, R., Kok, J., Lusher, S. J., Martone, M. E., Mons, A., Packer, A. L., Persson, B., Rocca-Serra, P., Roos, M., Van Schaik, R., Sansone, S.-A., Schultes, E., Sengstag, T., Slater, T., Strawn, G., Swertz, M. A., Thompson, M., Van Der Lei, J., Van Mulligen, E., Velterop, J., Waagmeester, A., Wittenburg, P., Wolstencroft, K., Zhao, J., and Mons, B.: The FAIR Guiding Principles for scientific data management and stewardship, Sci. Data, 3, 160018, https://doi.org/10.1038/sdata.2016.18, 2016.
Winter, J. D.: Principles of igneous and metamorphic petrology, Pearson education Harlow, UK, Pearson Education, Harlow, U.K., 740 pp., ISBN 978-1-292-02153-9, 2014.
Xia, L., Cao, J., Stüeken, E. E., Hu, W., and Zhi, D.: Linkages between nitrogen cycling, nitrogen isotopes, and environmental properties in paleo-lake basins, GSA Bull., 134, 2359–2372, https://doi.org/10.1130/B36290.1, 2022.
Zhong, L., Peng, J., He, J., Du, Y., Xing, T., Li, J., Guo, W., Ni, Q., Hu, J., and Song, H. Y.: Optimizations of the EA-IRMS system for δ15N analysis of trace nitrogen, Appl. Geochem., 159, 105832, https://doi.org/10.1016/j.apgeochem.2023.105832, 2023.