the Creative Commons Attribution 4.0 License.
the Creative Commons Attribution 4.0 License.
 | 10 Sep 2026

A 19-year record of atmospheric sulphur dioxide (SO2) derived from IASI measurements

Lorenzo Fabris
Nicolas Theys
Juliette Hadji-Lazaro
Daniel Hurtmans
Cathy Clerbaux
Pierre Coheur
Over the past decades, satellite measurements of atmospheric sulphur dioxide (SO2) have served a wide range of applications, from volcanology to air quality monitoring and climate assessment. In this paper, we present a 2007–2026 record of twice-daily global SO2 vertical column abundances and SO2 plume altitudes derived from measurements by the three Infrared Atmospheric Sounding Interferometer (IASI) instruments onboard the Metop platforms. Building upon earlier work, the algorithm has been refined and complemented with several new components. Most notably, the sensitivity of the algorithm to low SO2 abundances and low-altitude plumes has been improved and the plume altitude retrieval now features enhanced performance for large SO2 columns. Special care was taken to maximize consistency of the product over time and across the IASI instruments. In addition to SO2 at the retrieved altitude, the dataset also includes SO2 column retrievals assuming plume altitudes ranging from 1 to 60 km. These allow the construction of averaging kernels that can be used in model assimilation or to obtain more accurate column estimates when the plume altitude is constrained by independent information. The first part of the paper details the retrieval methodology and presents sensitivity and uncertainty analyses. The latter indicate that the retrieval uncertainty is smallest for plumes above 8 km and increases gradually toward lower altitudes, particularly within the first few kilometres and in atmospheres with a high water vapour content. Detailed comparisons with measurements from the CALIOP lidar indicate that plume altitudes are generally accurate to within 1–2 km. Column comparisons with TROPOMI in fresh volcanic plumes indicate reasonable agreement. In the second part of the paper, we present an overview of the 19-year dataset, providing detailed time series of SO2 column abundances and mass-altitude profiles, with a focus on volcanic SO2. For each eruption with a plume mass exceeding 30 kt, we report the maximum atmospheric SO2 mass, the mass below and above 8 km altitude, the peak plume altitude, and the altitude range containing 75 % of the mass. When available, the maximum mass is compared with estimates reported in the literature. The SO2 altitude and column data from IASI/Metop-A, -B, and -C are available at https://doi.org/10.25326/870 (Clarisse and Franco, 2026a), https://doi.org/10.25326/869 (Clarisse and Franco, 2026b), and https://doi.org/10.25326/868 (Clarisse and Franco, 2026c), respectively.
- Article
(32928 KB) - Full-text XML
- BibTeX
- EndNote


Atmospheric sulphur dioxide (SO2) is a key pollutant released by human activities and volcanoes, with annual emissions respectively on the order of 60–100 Tg (Guizzardi et al., 2025) and 13–30 Tg (Fischer et al., 2019; Fioletov et al., 2023). It contributes to the formation of fine particulate matter and sulphuric acid aerosols, affecting air quality, human health, and the Earth's radiative balance (Lelieveld et al., 2015; Kremser et al., 2016). Dry and wet deposition of SO2 cause acidification of soil and surface water, with harmful effects on plants, aquatic life, and soil microorganisms (Fowler et al., 2009).
For several decades, global SO2 total column abundances (and more recently plume heights) have been routinely measured by nadir-viewing high-resolution spectrometers onboard satellites, building on the pioneering ultraviolet (UV) volcanic SO2 detections by the Total Ozone Mapping Spectrometer (TOMS; Krueger, 1983; Krueger et al., 1995). The most commonly used long-term SO2 datasets are derived from UV measurements by OMI (Yang et al., 2007; Fioletov et al., 2013; Li et al., 2020), OMPS (Zhang et al., 2017; Li et al., 2024) and TROPOMI (Theys et al., 2022) and infrared (IR) measurements by AIRS (Prata and Bernardo, 2007; Carn et al., 2016) and IASI (Clarisse et al., 2012; Carboni et al., 2016). The satellite-derived SO2 datasets support a wide range of scientific and operational applications, including volcanological studies (e.g., Pardini et al., 2018; D’Aleo et al., 2019), early warning systems of volcanic unrest and aviation hazard avoidance (e.g., Surono et al., 2012; Brenot et al., 2021; Krotkov et al., 2021), investigations of volcanic plume dispersion and dynamics (e.g., Prata et al., 2017; Khaykin et al., 2022), assimilation into atmospheric transport models to improve forecasting (e.g., Boichu et al., 2014; Inness et al., 2022; Bacles et al., 2025), climate studies (e.g., Haywood et al., 2010; Malavelle et al., 2017), data-driven quantification of volcanic emissions and anthropogenic point sources (e.g., Theys et al., 2013; Carboni et al., 2019; Fioletov et al., 2023), estimation of SO2 atmospheric lifetimes (e.g., Beirle et al., 2014; Fioletov et al., 2015), derivation of vertical emission profiles of eruptions through model inversion (e.g., Eckhardt et al., 2008; Sadeghi et al., 2025), and estimation of regional and global top-down emissions through model assimilation (e.g., Wang et al., 2020; Qu et al., 2022).
IASI, short for Infrared Atmospheric Sounding Interferometer, is the hyperspectral infrared sounder onboard the polar-orbiting European Metop satellite series. IASI measures the outgoing infrared radiation between 645 and 2760 cm−1 at a resolution of 0.5 cm−1. It provides global coverage twice daily, with equatorial morning and evening overpasses at 09:30 and 21:30 local solar time and a circular ground footprint of 12 km at nadir. The first IASI instrument was launched onboard Metop-A in October 2006 (Clerbaux et al., 2009), followed by the launch of Metop-B in September 2012 and Metop-C in November 2018. IASI/Metop-A was decommissioned in late 2021, while the other two instruments are still fully operational. Together, the three IASI instruments provide a uniquely consistent measurement record spanning more than 19 years.
In this paper, we present a reanalysed SO2 total column and plume height dataset derived from IASI observations covering the period 2007–2026. The algorithm builds upon earlier retrieval schemes (Clarisse et al., 2012, 2014) with improved performance in retrieving altitudes of fresh SO2 plumes and in quantifying low SO2 abundances and low-altitude plumes. In addition, significant effort was made to ensure that the product is fully consistent in time and across the different IASI instruments. For each IASI observation, the dataset also provides SO2 total column estimates for assumed altitudes ranging from 1 to 60 km. These can be used to obtain a total column estimate corresponding to an SO2 altitude or an SO2 altitude profile derived from an independent source (i.e., model or other measurement).
In the next section (Sect. 2), we present the plume altitude retrieval and illustrate it with a series of volcanic plumes. Comparisons are made with altitudes derived from the CALIOP lidar. Section 3 details the algorithm used for the derivation of SO2 total columns. Here, comparisons are presented with SO2 abundances retrieved from TROPOMI. In Sect. 3.4, we discuss retrieval uncertainties. The remainder of the paper is dedicated to the presentation and analysis of the 19-year dataset (Sect. 4). This includes an overview of the twice-daily total retrieved masses and vertical profiles, and a detailed catalogue of the maximum masses observed for all major volcanic eruptions since July 2007.
SO2 plumes, whether emitted by volcanoes or anthropogenically, are typically confined to a relatively narrow vertical layer less than a few kilometres thick. The layer height at which SO2 peaks is a useful quantity on its own, but it is also a key input parameter for total column retrievals. Measurements from high-resolution UV (Yang et al., 2010; Hedelt et al., 2019; Fedkin et al., 2021; Theys et al., 2022) and IR spectrometers (Clerbaux et al., 2008; Carboni et al., 2012; Clarisse et al., 2014; Carboni et al., 2016) can both be used to derive information about the SO2 layer height. In this section, we present two complementary methods for retrieving the layer height from IASI observations. The first method serves a dual purpose: identifying those observations with detectable quantities of SO2 and retrieving the plume height. The second method is used to constrain the height of saturated plumes.
2.1 Hyperspectral range index method
The hyperspectral range index (HRI) or matched filter method is a widely adopted technique for the detection of weakly absorbing species (Walker et al., 2011; Manolakis et al., 2016; Noppen et al., 2025). It assigns to each observed spectrum y a value
with and S the mean spectrum and covariance matrix of a representative set of spectra containing only background concentrations of the species of interest (in this case, SO2). The vector is a Jacobian with respect to a variation in the total column of SO2 (typically a small amount, such as 5 DU, where DU stands for Dobson Unit and equals 2.69×10¹⁶ molec cm−2). The HRI, as a weighted projection of the observed spectrum onto this Jacobian, quantitatively expresses the presence of the spectral signature K in the observed spectrum. On the set of spectra from which and S were calculated, the HRI follows approximately a Gaussian distribution with a mean of zero and a standard deviation of one. For this reason, its value can be interpreted in probabilistic terms, e.g., a value above 5 occurs in less than 0.00003 % of the background spectra; a spectrum with an HRI of 5 is therefore expected to contain the spectral signature of SO2.
Focusing on the ν3 absorption band of SO2 between 1310 and 1400 cm−1, it was shown in Clarisse et al. (2014) that the SO2 Jacobians Kh, calculated with respect to SO2 variations at a given altitude h, depend largely on the chosen altitude. The main reason is the interference of the ν3 SO2 band with the ν2 water vapour absorption band. For a given IASI observation, HRIs calculated for different Jacobians Kh will therefore vary and reach a maximum when the altitude h matches the actual altitude of the SO2 plume. Therefore, an estimate of the SO2 altitude can be obtained as
with the functions HRI(y,h) defined as in Eq. (1) with K=Kh. This is the method explained in detail in Clarisse et al. (2014). We refer to Hyman and Pavolonis (2020) for a probabilistic extension of the method. By means of a theoretical simulation for a tropical atmosphere, it was shown in Clarisse et al. (2014) that the method achieves an accuracy to within 1500 m for SO2 plumes between 5 and 30 km altitude. This was also shown to be the case in a detailed case study of the 2011 Nabro eruption using CALIOP measurements.
The main weakness of the method described above is its dependence on ΔSO2. In particular, for large columns, the SO2 spectral signature saturates and is no longer a good match for the Kh calculated with small variations of SO2. Here, this problem is addressed by considering Jacobians both for different altitudes h and for different SO2 abundances:
with y0 a spectrum calculated in the same way as y(SO2,h), but without SO2. The altitude estimate becomes:
Note that with this change we also obtain a rough estimate of the column abundance . This is not used for the actual column retrieval detailed in Sect. 3, but serves as a sanity check, as we illustrate below. The Jacobians were calculated for altitudes between 1 and 30 km (in 1 km steps), 32–40 km (in 2 km steps), and 45–60 km (in 5 km steps), and for SO2 total columns from 1 to 1024 DU in powers of two.
For the calculation of the Jacobians, a reference atmosphere is required. To account for spatio-temporal variations, a climatology of humidity, pressure, and temperature profiles was built from ERA5 data (Hersbach et al., 2020) on a monthly basis and on a 20° longitude × 10° latitude grid. Likewise, a climatology of surface temperatures was obtained on the same grid from IASI L2 data (EUMETSAT, 2022). For each of these 18×18 grid cells, 39 layer heights, and 11 SO2 columns, Jacobians were calculated using the Atmosphit radiative transfer model (Coheur et al., 2005) and Eq. (3). The spectral range was set to 1320–1410 cm−1. To allow for a smooth transition between the different grid cells, new Jacobians are constructed, for each specific IASI observation, via bilinear spatial interpolation of the Jacobians associated with the centres of the four nearest grid cells.
We now detail how the pair was determined. As in Franco et al. (2018), we calculate these in an iterative way. Starting from an area-weighted random selection of IASI spectra (such that each equal surface area element of the Earth is equally represented), a first pair is calculated. This pair is used to calculate SO2 HRIs. Subsequently, we remove from the initial selection of spectra all those with an HRI above 3, and recalculate . This procedure is repeated five times. Calculated in this way, the pair is built from spectra containing very little to no spectral signature related to SO2. The inverse S−1 is calculated as a pseudo-inverse as in Clarisse et al. (2023), making the HRI more robust against the (minor) instrumental changes that occurred over time for each IASI instrument. Despite this, it was found that the resulting SO2 HRI time series still exhibited small discontinuities coinciding with instrumental changes. In addition, small offsets between the different IASI instruments were found in the average HRIs. For this reason, it was decided to calculate and use different for each month of the time series and for each IASI instrument. As we show in Sect. 4.1, the resulting SO2 time series are fully consistent between the three instruments.
The altitude retrieval is applied to observations with a maximum HRI above 3.25. This and other thresholds defined below were determined empirically based on a few days of observations to maximize sensitivity while limiting spurious detections. The 3.25 threshold allows the detection of very weak enhancements of SO2 and of SO2 at plume edges, but comes at the cost of a significant number of false detections. The majority of these are caused by random noise in the spectra and are distributed at random locations globally. To remove these false detections, we set a stricter threshold of 5 for isolated observations (i.e., those observations with no other detections within a distance of 0.75°), a threshold of 4.6 for isolated pairs of observations, and a threshold of 4 for isolated groups of three observations. Due to surface emissivity features, frequent false detections occur at low altitude over the Sahara Desert and desert areas of the Middle East and the United States. For this reason, when the retrieved altitude is below 3 km, we apply an HRI threshold of 7.15 over these areas. The same HRI thresholds are used to select the observations for which columns are retrieved (see Sect. 3).
To reduce noise at the edge of large plumes, each retrieved altitude is replaced by the median of all retrieved altitudes within a distance of 0.75°, including the altitude from the pixel under consideration. This is applied to observations with an HRI below 36. There are two cases where the retrieved altitude is not used but replaced by the median of neighbouring observations instead. The first is when is large (above 64 DU), but the corresponding HRI is low (below 29). The second is when the retrieved altitude exceeds 23 km with an HRI below 36. Such retrievals are almost always erroneous, and since the vast majority of detected SO2 is at altitudes below this, these altitudes are also replaced by the median of neighbouring altitudes. For some pixels associated with the 2022 Hunga Tonga eruption, HRI(y,h) exhibits two competing local maxima, one below and one above roughly 23 km, making the altitude solution non-unique for these pixels (see Fig. 7). In such cases, the exceptionally high altitude of the plume was confirmed using CALIOP measurements (Sect. 2.3.6).
2.2 Brightness temperature difference method
For very large SO2 columns, there is a simple alternative method for constraining the altitude. In such cases, the channels most sensitive to SO2 saturate and their brightness temperature (BT) tends towards the local air temperature of the SO2 plume. This is valid when absorption by water vapour above the plume can be neglected, which is the case for plumes above 7 km. The lowest altitude whose temperature matches immediately provides a lower bound on the altitude. Here, we used the 1371.50 cm−1 channel, which is also used for the SO2 retrieval (see Sect. 3.1). The altitude retrieved by this method is used in the final product when it is higher than the altitude retrieved by the main HRI-based altitude retrieval algorithm.
2.3 Examples and comparison with CALIOP
In this section, we present several examples of the SO2 detection and layer height retrievals. For each example, shown in Figs. 1–6, we present the maximum HRI (panel a), the retrieved SO2 heights () (panel b), the retrieved SO2 vertical column density (VCD) estimates (panel c), and an SO2 detection map (panel d) also showing which altitude retrieval method was used (HRI or BT-based). For each case, we compared the IASI-retrieved SO2 altitudes with coincident measurements from the Cloud–Aerosol Lidar with Orthogonal Polarization (CALIOP) instrument onboard the Cloud–Aerosol Lidar and Infrared Pathfinder Satellite Observation (CALIPSO) platform (Winker et al., 2009, 2013). Specifically, we used version 4.51 of the Lidar L2 5 km Vertical Feature Mask (VFM) product, which provides the vertical and horizontal distribution of cloud and aerosol layers (Kim et al., 2018), and is available from June 2006 until June 2023. While not sensitive to SO2, the CALIOP measurements are sensitive to sulphate aerosols, which are a good proxy for the presence of SO2. CALIOP is also sensitive to volcanic ash, which often (but not always) indicates the presence of volcanic SO2 (Prata et al., 2017). For all examples, we selected one CALIOP overpass intersecting an IASI SO2 plume (shown in magenta in panel b). The VFM product is shown in panel (e) of Figs. 1–6 together with collocated average IASI SO2 altitudes (open circles with error bars). The latter were calculated as follows. First, due to the different overpass times of IASI and CALIOP (∼ 09:30/21:30 and ∼ 01:30/13:30 local solar time at the equator, respectively), we discarded all IASI observations acquired more than 7 h from the nearest CALIOP measurements. Then, at regular intervals along the CALIOP track, we computed an average IASI SO2 altitude and its associated ±1σ standard deviation from the IASI measurements located within 0.5° of the interval centre.

Figure 1(a) SO2 HRI calculated from IASI/Metop-A observations on 23 April 2015 (morning overpasses) during the Calbuco eruption (magenta triangle). (b) Retrieved SO2 plume altitude (in km) and (c) corresponding estimate of the SO2 vertical column density (VCD; in DU). (d) SO2 detection and method used to retrieve the SO2 altitude. (e) Comparison between the CALIOP VFM product along the track shown in (b) and the collocated IASI SO2 altitudes. Error bars indicate the ±1σ standard deviation. Time difference denotes the average time difference between CALIOP and the collocated IASI measurements.
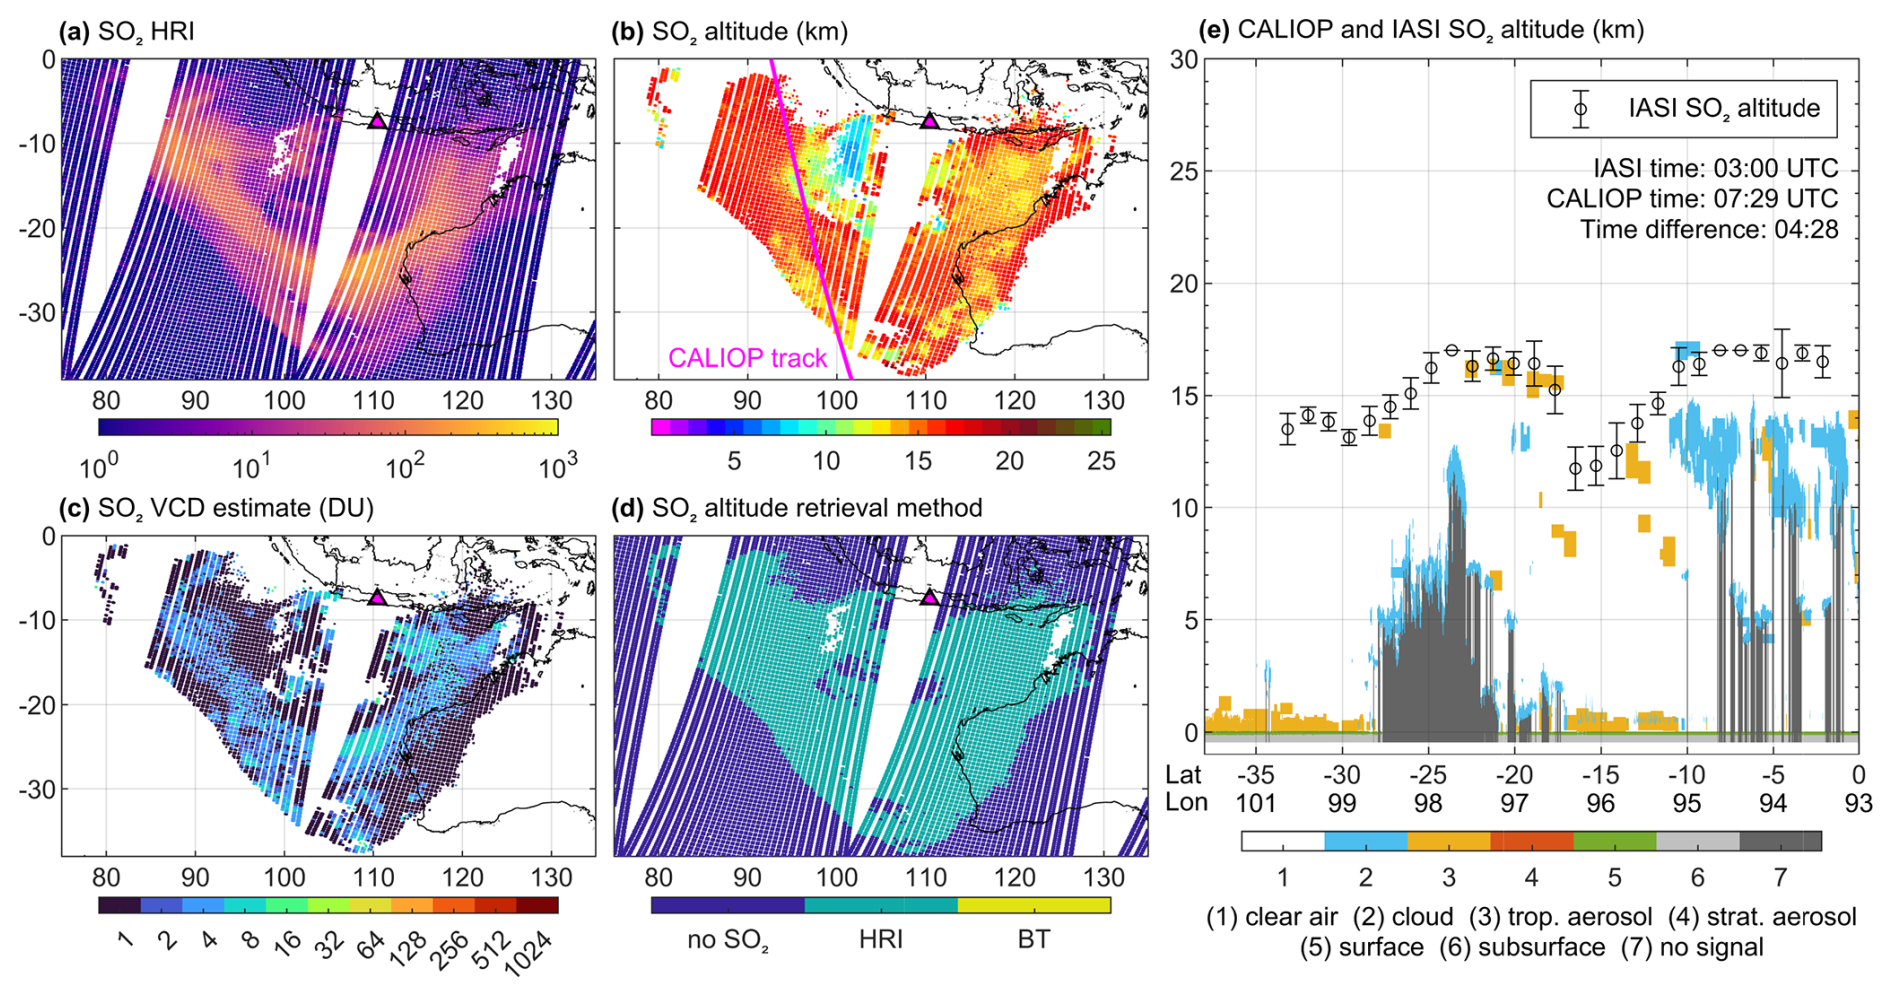
Figure 2Same as Fig. 1, but for IASI/Metop-A observations on 8 November 2010 (morning overpasses) during the Merapi eruption.
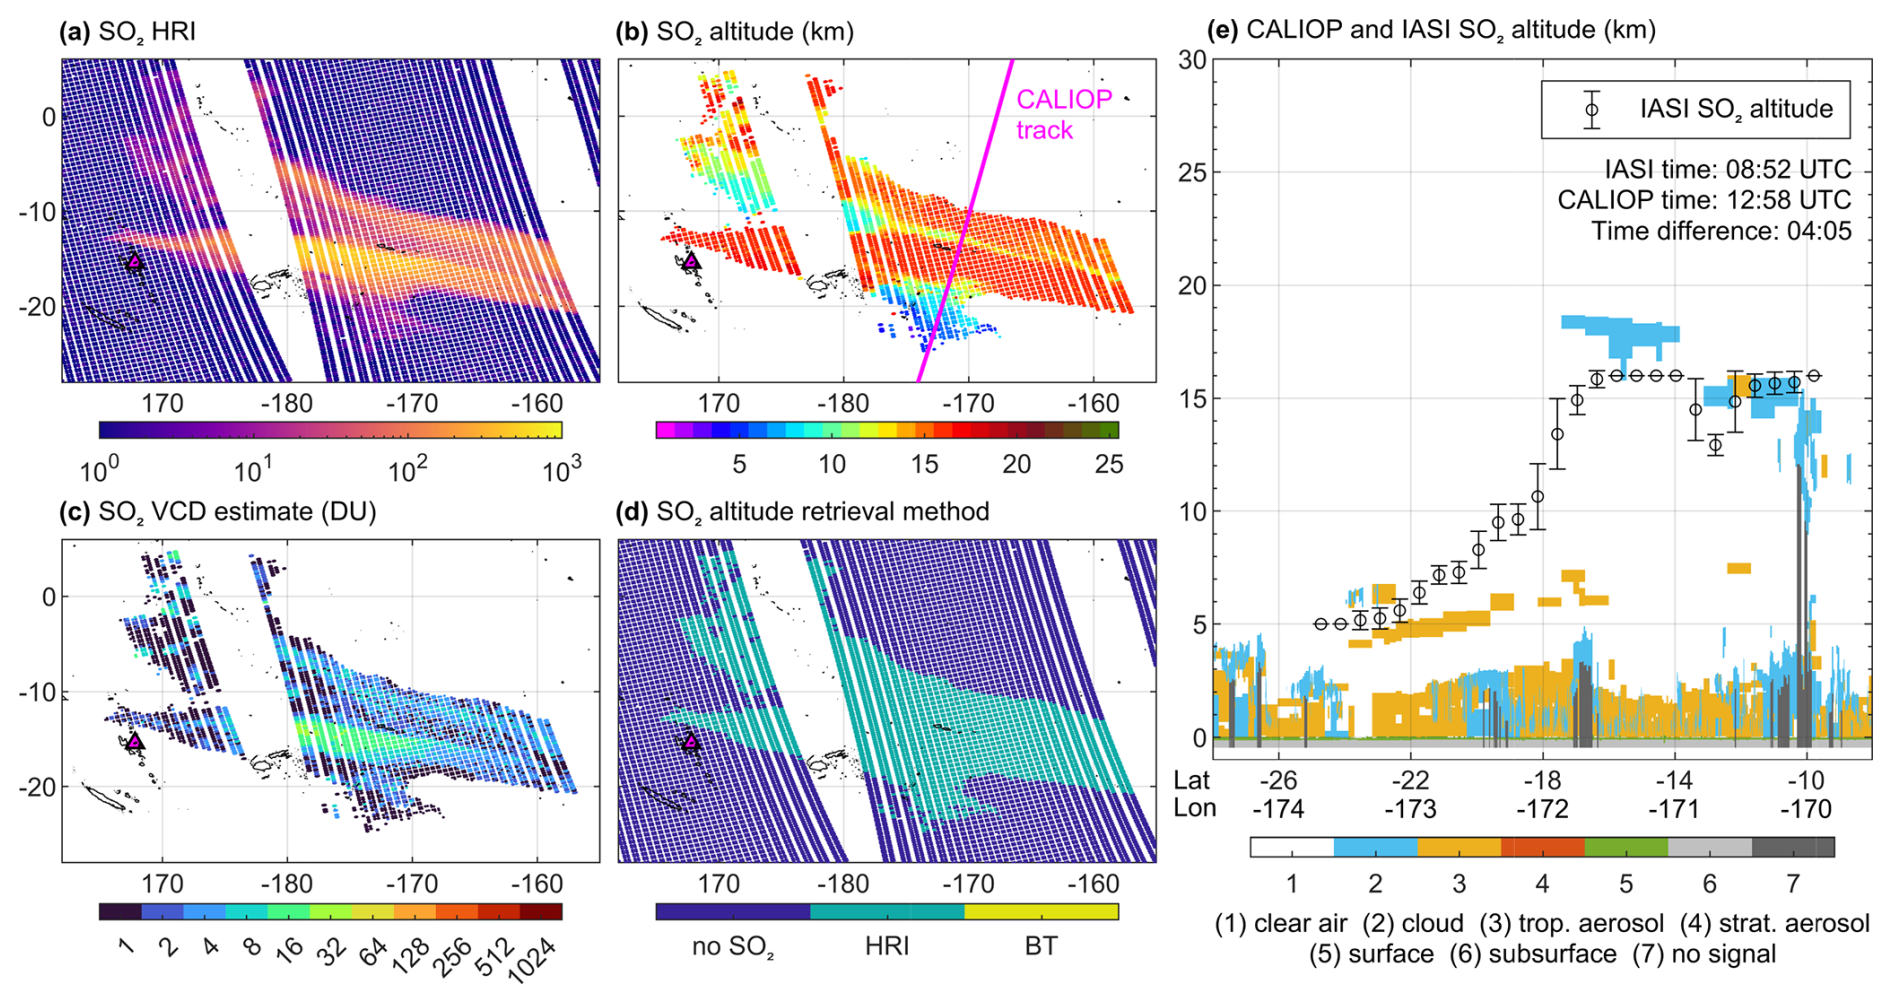
Figure 3Same as Fig. 1, but for IASI/Metop-B observations on 29 July 2018 (evening overpasses) during the Ambae eruption.

Figure 4Same as Fig. 1, but for IASI/Metop-A observations on 23 May 2011 (morning overpasses) during the Grímsvötn eruption.

Figure 5Same as Fig. 1, but for IASI/Metop-B observations on 23 June 2019 (evening overpasses) during the Raikoke eruption.
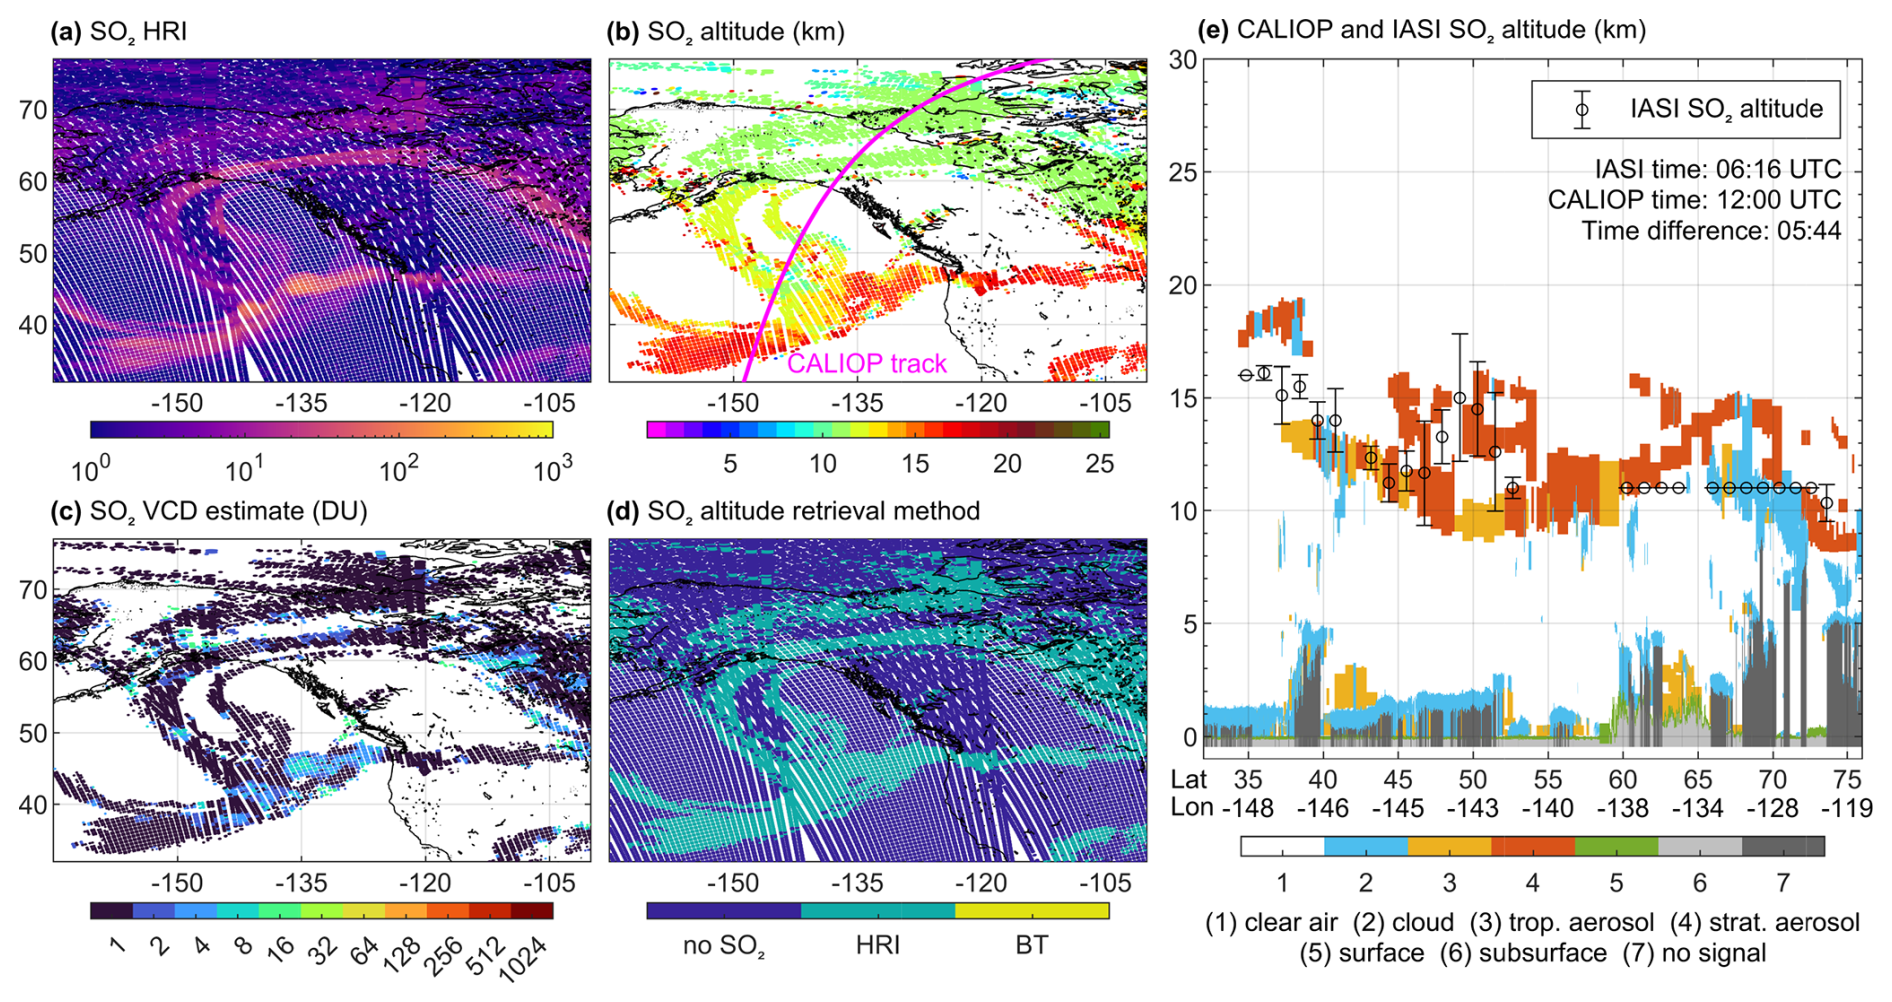
Figure 6Same as Fig. 1, but for IASI/Metop-B observations on 22 July 2019 (evening overpasses) in the wake of the Raikoke eruption.
2.3.1 Calbuco, 23 April 2015
The April 2015 Calbuco eruption featured two main eruption pulses, one on 22 April at 21:04 UTC that lasted 1.5 h, and a second on 23 April at 03:54 UTC that lasted 6 h (Eaton et al., 2016; Romero et al., 2016). The IASI observations shown in Fig. 1 are from the morning overpass on 23 April, approximately 17 h after the eruption started. Consistent with the evolution of the eruption, two main plumes are seen by IASI both reaching 16–17 km high. The distribution shows good consistency with the HRI distribution, with the largest values seen in the centre of the plumes, which demonstrates a clear dependence of the Jacobians on the total column abundance. Panel (d) shows that the BT-based altitude retrieval method is only used for a few observations in the second plume. The CALIOP observations at 15–18 km largely confirm the retrieved IASI altitudes. Both CALIOP and IASI also see a smaller plume at 41° S, 66° W at an altitude of 4 km. Note that this particular example motivated the inclusion of variable SO2 abundances for the Jacobians in the HRI-based altitude retrieval method. The previous version of the algorithm, which used a fixed column of 5 DU for the Jacobians, was retrieving plume heights as low as 9 km in the most saturated part of the plume.
2.3.2 Merapi, 8 November 2010
In late October and early November 2010, Merapi produced a series of explosive eruptions, with the largest SO2 emissions occurring on 3–5 November (Surono et al., 2012). The selected IASI overpass on 8 November (Fig. 2) already shows a somewhat diluted plume mainly present between 13 and 17 km. This is consistent with CALIOP zonal averages between 5 and 11 November, which show that the bulk of the volcanic sulphate aerosols were located between 14 and 17 km (Shibata and Kinoshita, 2016). The CALIOP track shown here indicates a good agreement for latitudes below 17° S. Between 17 and 10° S, aerosols are seen between 8 and 12 km, whereas collocated IASI SO2 altitudes are above 11 km. This discrepancy is likely the result of the ∼4.5 h time difference between the IASI and CALIOP measurements. Indeed, directly west-southwest of the volcano, we derive with IASI SO2 altitudes between 6 and 12 km for a plume that had drifted further westwards in the hours separating the overpass of the two sounders (panel b). For the same reason, the part of the plume north of 8° S was likely no longer present at the time of the CALIOP overpass.
2.3.3 Ambae, 29 July 2018
The 2017–2018 eruptions of Ambae volcano in Vanuatu featured several major degassing periods, with the most intense one occurring in July 2018 and the largest SO2 emissions on 28 July 2018 (Bani et al., 2025). Figure 3 shows an IASI/Metop-B overpass on the day after. The CALIOP track shows three altitude ranges: the northernmost part is between 15 and 16 km in good agreement with IASI. The next part between 17° S and 14° S is located between 17 and 19 km; our retrievals slightly underestimate it, placing it at 16 km. Finally, below 17° S, there is a large tropospheric plume extending from 4 to 7 km high. IASI altitudes range from 5 to 10 km below 18° S. Between 16 and 17° S, the low- and high-altitude plume layers are seen to overlap in the CALIOP data. For this part, IASI SO2 altitudes are derived between 10 and 15 km, positioned midway between the two layers.
2.3.4 Grímsvötn, 23 May 2011
The next example is that of the Grímsvötn eruption that started on 21 May 2011. The well-documented eruption plume featured a high-altitude SO2-rich part that drifted north and northwest and a low-altitude ash-rich part that was transported south and southeast (Moxnes et al., 2014; Prata et al., 2017). A fortunate CALIOP overpass on 23 May intersected both parts, as shown in Fig. 4. The same overpass was analysed in Carboni et al. (2016) and Prata et al. (2017). The lowest part of the plume is seen by IASI at 4 km, whereas CALIOP indicates ash altitudes between 1 and 5 km. Given that this plume was mostly ash, with only trace amounts of SO2, this represents a satisfactory level of agreement. Further along the CALIOP track, IASI altitudes range between 7 and 10 km, consistent with the layer top heights seen by CALIOP, even though these are classified as clouds. Over Greenland, IASI retrieves altitudes between 8 and 12 km, slightly below the CALIOP features seen between 10 and 12 km.
2.3.5 Raikoke, 23 June and 22 July 2019
The 21–22 June 2019 Raikoke eruption consisted of a series of large explosive events that took place in a period of about 12 h (starting at 17:50 UTC), followed in the subsequent days by minor low-altitude emissions (Horváth et al., 2021; Bruckert et al., 2022; Vernier et al., 2024). The eruptions were rich in both ash and SO2. The chosen IASI overpass on 23 June 2019, approximately 39 h after the start of the eruption, shows an extensive plume reaching 15 km high (Fig. 5). The IASI altitude retrievals are largely confirmed by CALIOP: the northern part of the plume reaches 11 km for IASI and 8–11 km for CALIOP, while the central part reaches 13–16 km for IASI and 15 km for CALIOP. The freshest part of the plume, originating from post-eruptive degassing, is slightly overestimated by IASI at 4–5 km compared to 0–4 km for CALIOP. The almost 6 h overpass time difference could be in part responsible for the height difference, given that the plume is moving eastward and that the retrieved altitudes are lower closer to the volcano.
Figure 6 shows the IASI SO2 altitude retrievals one month after the eruption (22 July). As confirmed by the column retrievals presented in the next section, most of the identified SO2 is below 1 DU, except for those observations with elevated HRI (>100) observed around 45° N, 140° W. Overall, and as expected, the SO2 altitude distribution of these aged plumes is noisier than that of the fresh plumes shown earlier. At high latitudes (>60° N), the retrieved altitudes are around 11 km, whereas at lower latitudes the retrieved heights reach around 17–18 km. The CALIOP data show multiple thick aerosol layers at altitudes between 9 and 19 km. Overall, the agreement is reasonably good, especially given the low SO2 levels and the multi-layered nature of the plumes. However, it should be noted that the highest altitudes seen by CALIOP are rarely reproduced by IASI. This is seen here for the plume at 18–19 km, but also for other CALIOP–IASI comparisons of the aged Raikoke plumes. It is also the case for the long-lived volcanic air masses trapped in persistent anticyclones, which are documented in detail in Khaykin et al. (2022) and Fromm et al. (2025). Between 4 and 8 August, when IASI still easily detects the SO2 within the anticyclone moving below 40° N, we retrieve altitudes typically below 20 km compared to 22–23 km seen by CALIOP.
2.3.6 Hunga Tonga, 17 January 2022
After smaller eruptions in December 2021, Hunga Tonga erupted on 13 January 2022, forming a large umbrella cloud near the tropopause at 16–18 km. This event served as a precursor to the Plinian eruption that began at approximately 04:00 UTC on 15 January. Two umbrella clouds developed: a lower one at 15–19 km and an upper one at about 28–34 km, with a small overshoot reaching 55–58 km (Carn et al., 2022; Carr et al., 2022; Gupta et al., 2022).
Figure 7a shows the SO2 altitudes retrieved from IASI measurements on 16 January from 19:47 to 23:14 UTC. Retrieved altitudes are mostly in the range 10–36 km, with the highest altitudes seen furthest west and downwind, consistent with transport by stronger mid-stratospheric winds relative to those lower down (Baron et al., 2023; Li et al., 2023). In the southern part of the plume west of 155° E, altitudes below 17 km are also seen, but these are implausible given the aforementioned transport. In fact, in this part of the plume, SO2 altitudes are seen to be located either above or below 18 km, with few observations in the range 17–19 km. Upon investigation, this appears to result from the presence of two local competing maxima in the HRI(h), above and below the tropopause. This is illustrated in panels (b)–(e) of Fig. 7, which show the normalized HRI profiles for selected locations in the plume. Panels (b) and (c) show examples of the dual maximum. Note also that by design, altitudes above 23 km are never selected for HRIs below 36 (see Sect. 2.1), explaining the lower retrieved altitudes at the plume edges. This condition negatively affects the altitude retrieval for the Hunga Tonga plume, but was imposed to improve the overall performance of the algorithm for the rest of the IASI time series.

Figure 7(a) Retrieved SO2 altitude from IASI/Metop-B observations on 16 January 2022 during the Hunga Tonga (triangle) eruption. (b–e) Normalized HRI profiles for four IASI observations indicated by the diamond markers in (a). In each profile, the diamond marks the altitude of the maximum HRI value, corresponding to the SO2 altitude.
The CALIOP overpasses for 16 January are unfortunately not well collocated with respect to the IASI observations. For this reason, we show in Fig. 8 the comparison with CALIOP for 17 January, from 09:59 to 13:23 UTC. Consistent with what is observed for IASI, the CALIOP measurements reveal aerosol layers between 17 and 30 km (the upper limit of the VFM product), with the altitudes increasing from east to west. For the easternmost part of the plume, the retrieved IASI SO2 altitudes between 16 and 18 km are in good agreement with CALIOP (track 3 in Fig. 8). The part west of 160° E again displays competing altitude estimates below and above 18 km. To facilitate comparison with CALIOP, these two groups of observations are averaged separately in Fig. 8b. As the CALIOP–IASI comparison of the middle section (track 2) shows, when the higher altitude is selected, the match is very good, with altitudes of 20–27 km for CALIOP compared to 19–25 km for IASI. At first sight, the westernmost CALIOP transect (track 1), with altitudes above 28 km, appears to have almost entirely missed the volcanic plume detected by IASI. However, considering the ∼4.5 h time difference between the observations and the westward transport, CALIOP intersected the westernmost part of the plume where IASI retrieves maximum altitudes in the range of 28–32 km, again in good agreement with CALIOP. Even though the generic IASI altitude retrieval clearly has its limitations for stratospheric plumes, the agreement for the layers at 19–25 and 28–32 km is remarkable, and to our knowledge, has not been demonstrated by any other SO2 layer altitude algorithm. For instance, for the CrIS retrievals presented in Sadeghi et al. (2025), the altitudes are mainly centred around 15 ± 2 km for observations between 16 and 21 January. A recent TROPOMI/OMPS-based height retrieval of the co-located sulfate aerosol layer (Spurr et al., 2026) similarly aligns well with both IASI and CALIOP, providing independent, complementary support for the altitude structure reported here.
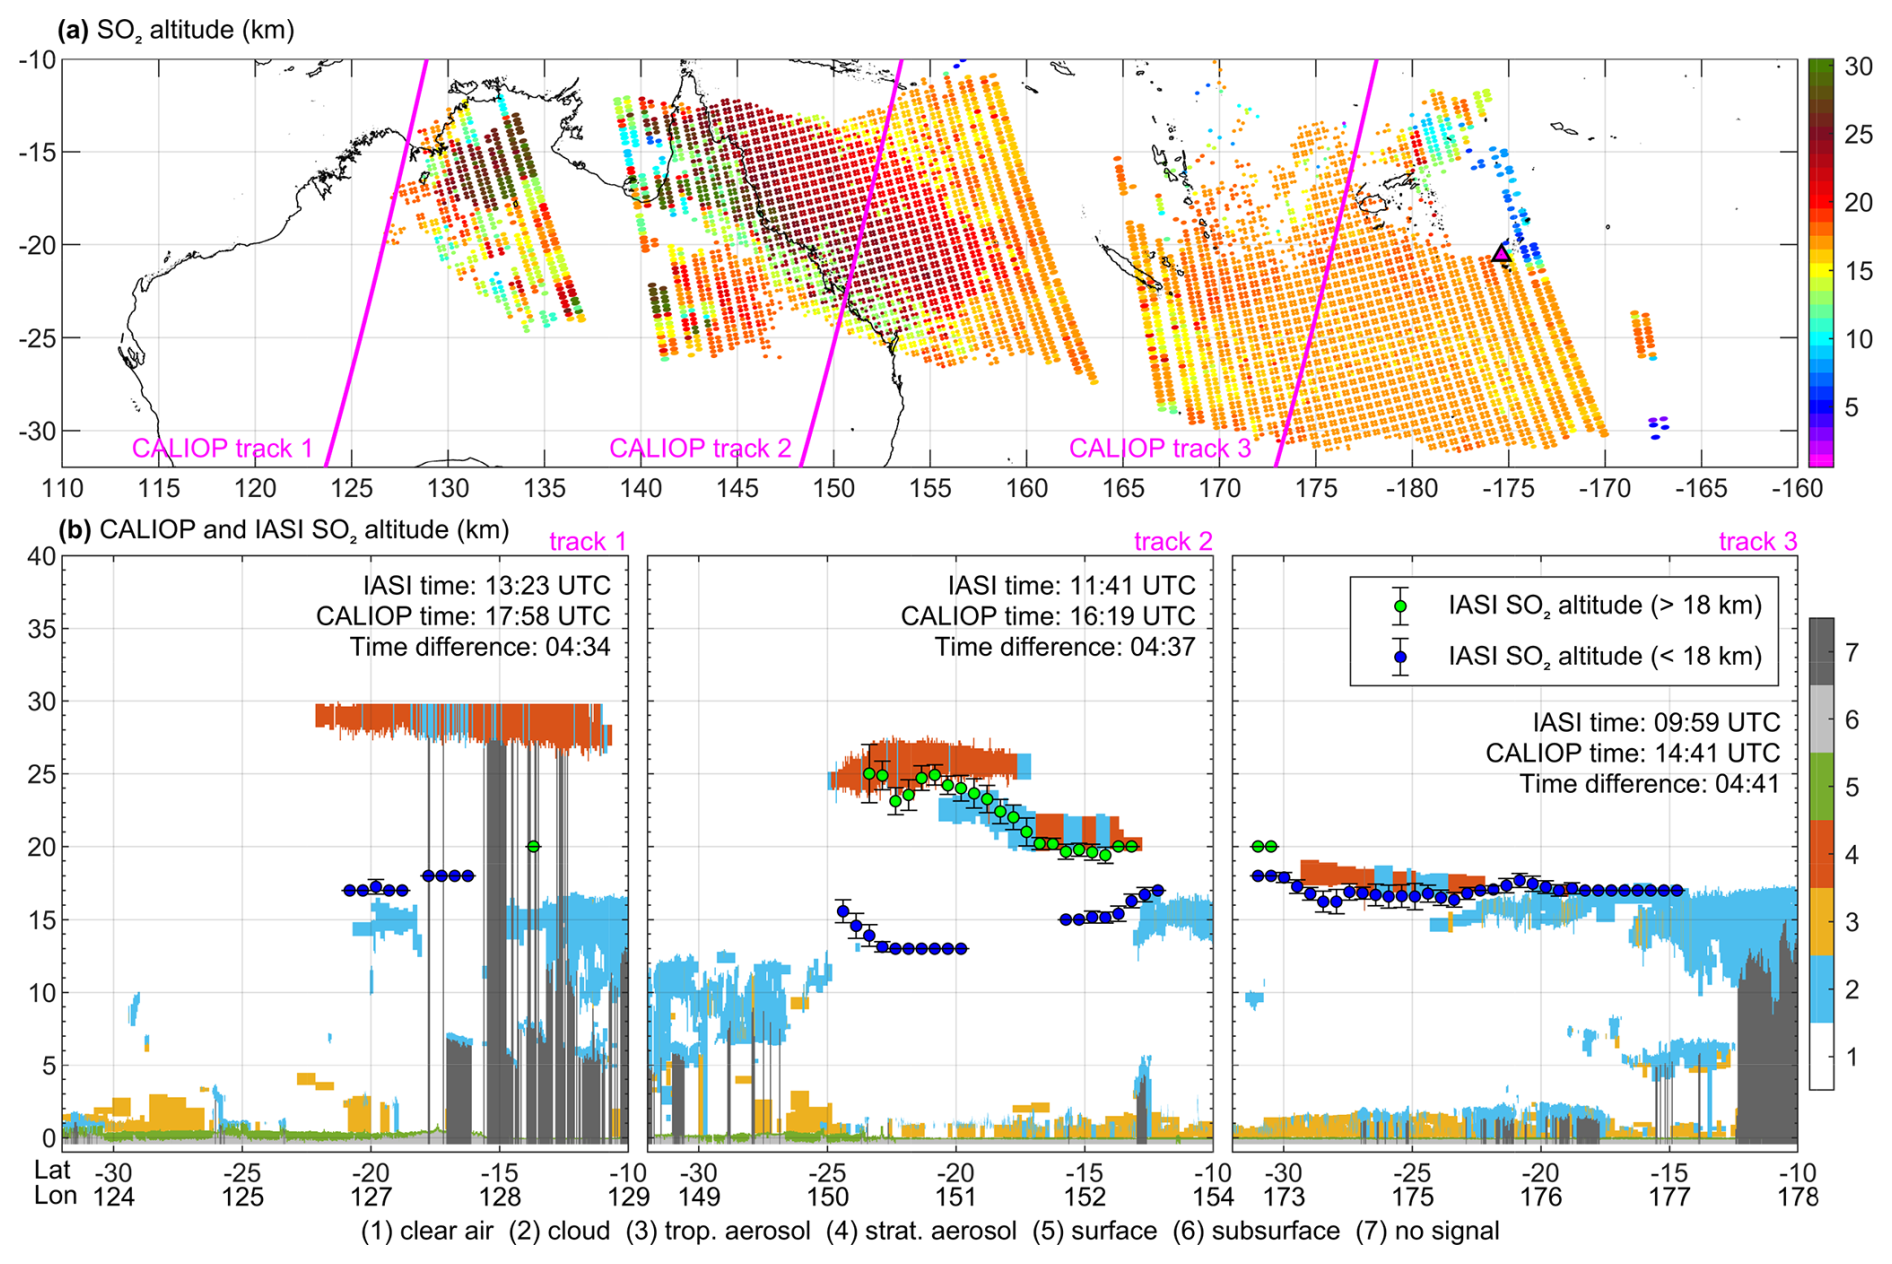
Figure 8(a) Retrieved SO2 plume altitude from IASI/Metop-B observations on 17 January 2022 during the Hunga Tonga (triangle) eruption. (b) Comparison between the CALIOP VFM product along three successive tracks shown in (a) and the collocated IASI measurements, with retrieved SO2 altitudes below and above 18 km shown as blue and green dots, respectively. Error bars indicate the ±1σ standard deviation. Time difference denotes the average time difference between CALIOP and the collocated IASI measurements.
There are several methods available for retrieving SO2 column abundances from measurements by high-resolution IR sounders. These include approaches relying on fitting the observed spectra with a forward model (Clarisse et al., 2008; Clerbaux et al., 2008; Carboni et al., 2012; Zeng et al., 2025), look-up-tables of simulated spectra (Prata and Bernardo, 2007), HRI-type indices (Walker et al., 2012; Bauduin et al., 2016; Taylor et al., 2018; Hyman and Pavolonis, 2020) and look-up-tables of differences of brightness temperature (DBTs) between selected channels (Clarisse et al., 2012). Our retrieval scheme combines a DBT-based method for high SO2 loadings with an HRI-based method for low loadings. Columns are retrieved assuming all SO2 is located in a narrow layer at a certain altitude. For each IASI observation, this is done for the altitude obtained by the SO2 altitude retrieval algorithm, and for all other altitudes between 1 and 60 km.
3.1 Brightness temperature difference method
For large SO2 columns, and when the plume altitude is above 7 km, the retrieval algorithm is based on brightness temperatures of selected IASI channels. The algorithm is detailed below, but we refer to Clarisse et al. (2012) for additional justifications and illustrations. In what follows, we write spectral radiances L(ν) in terms of brightness temperatures T using Planck's law L(ν)=Bν(T), with ν the wavenumber. Given a homogeneous SO2 layer at temperature , the upwelling radiance Lout(ν) above the layer satisfies
with Lin(ν)=Bν(Tin) the upwelling radiance below the layer and t the layer transmittance. For now, we neglect atmospheric absorption due to other atmospheric constituents in and above the SO2 plume. Considering Eq. (5) and the Beer–Bouguer–Lambert law , where SO2 is the column abundance, c is an absorption cross section, and cos (θ) is a correction factor that accounts for the satellite zenith angle θ of the observation, one obtains
The different quantities in Eq. (6) are determined as follows. The temperature is calculated from the atmospheric temperature profile from ERA5 (Hersbach et al., 2020) and the assumed or estimated SO2 altitude. Two neighbouring channels (“absorption channels”) inside the ν3 band are used to calculate Tout, while two other channels (“background channels”) outside the ν3 band of SO2 are used to estimate Tin. These are carefully chosen so that Tin≈Tout in the absence of SO2.
Two separate sets of background and absorption channels are used (see Table 1), which were chosen respectively for the retrieval of moderate and large SO2 columns, as explained below. Table 1 also lists the standard deviation σT of on spectra without observable SO2 quantities. The first set targets channels most sensitive to high-altitude SO2. Figure 9a shows the behaviour of the signal-to-noise ratio (SNR) as a function of SO2 column for a 16 km high plume in a tropical atmosphere and an 8 km high plume at mid-latitude. The SNR exceeds one for columns above ∼0.5 DU and increases approximately linearly up to about 50 DU. For columns above 200 DU, the first set of absorption channels saturates and can no longer be used to retrieve SO2 columns accurately. This is illustrated in Fig. 9b, which shows the effect of a perturbation ΔBT+σT on the retrieved column. The second set of channels is less sensitive and only saturates for columns above 1000–5000 DU.
Table 1Channels used for the DBT-based column retrieval approach. The standard deviation σT was estimated on one day of spectra without observable SO2 quantities.

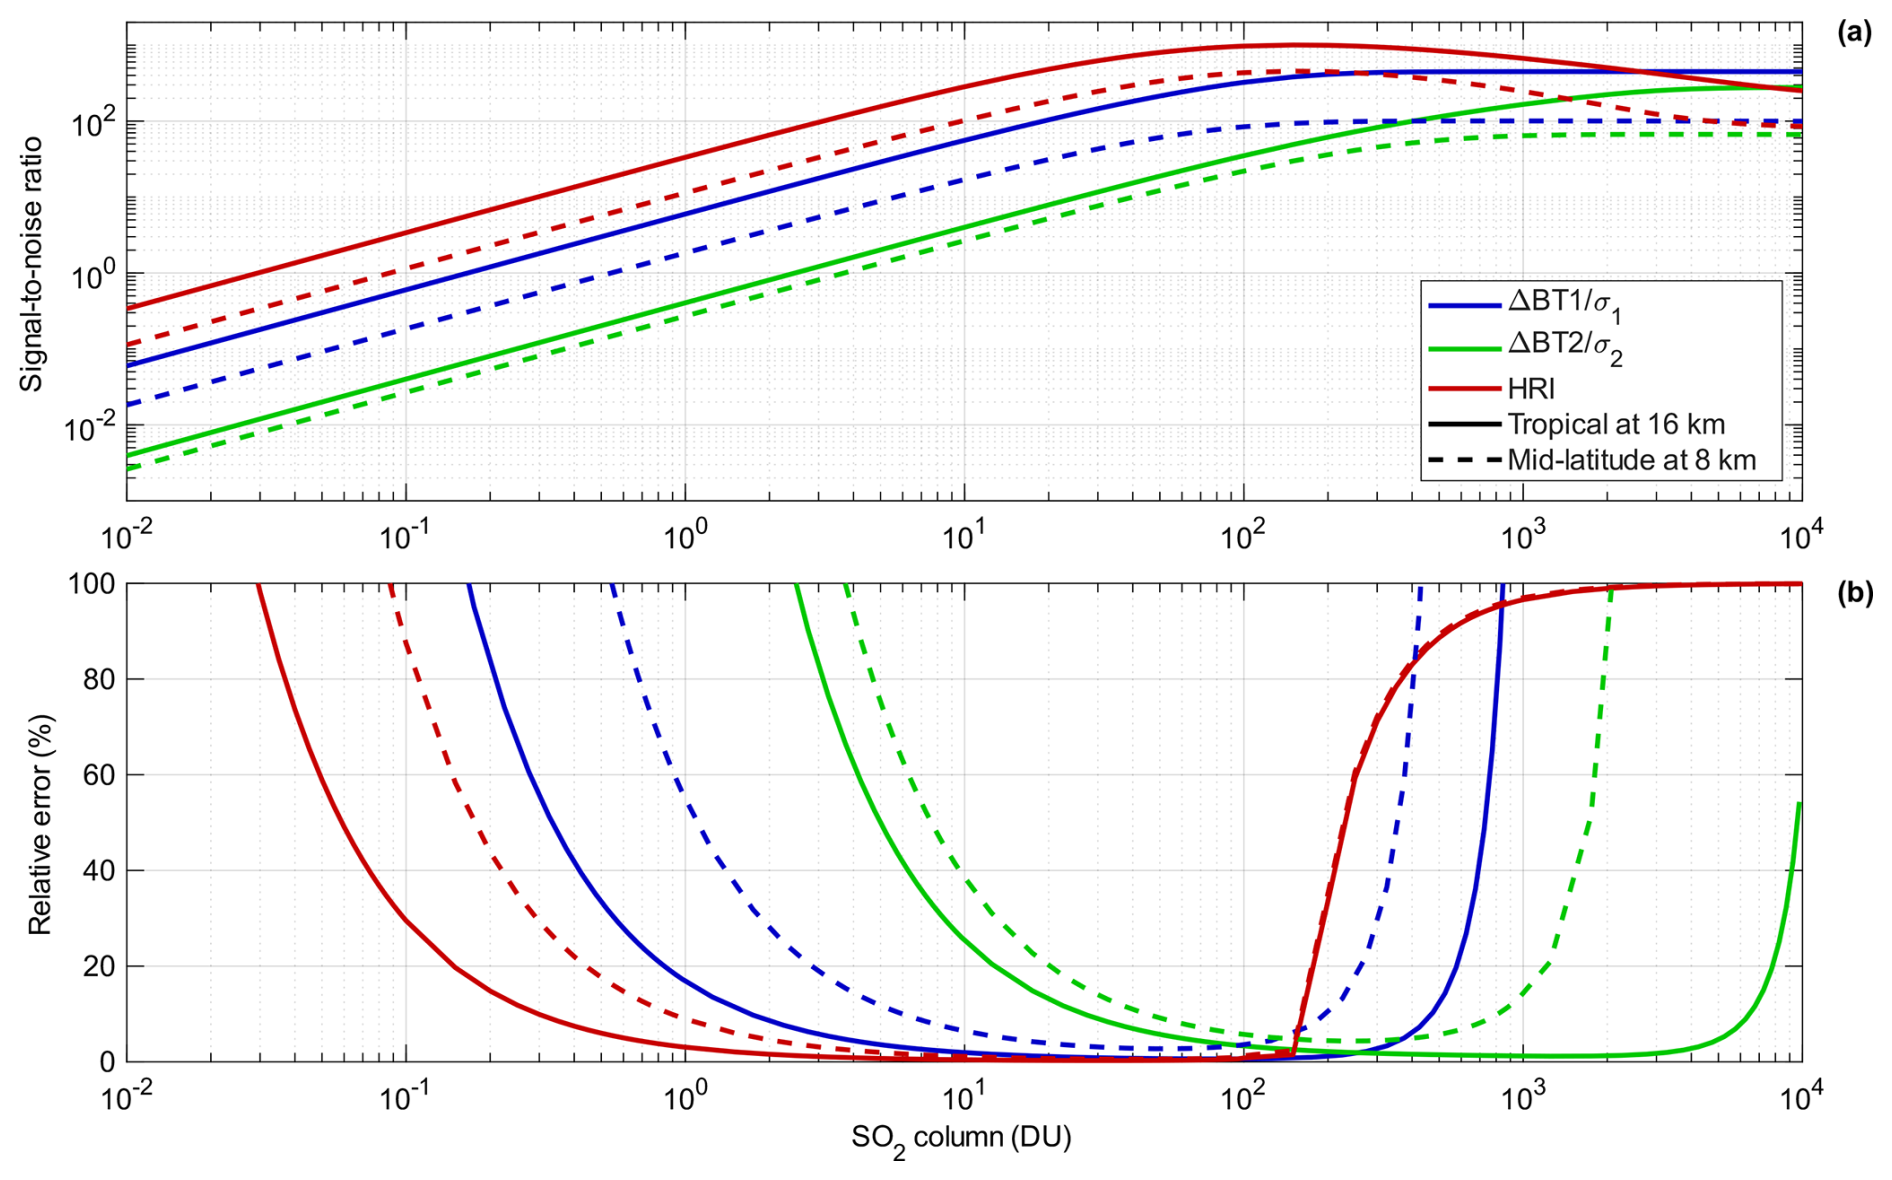
Figure 9(a) Signal-to-noise ratio as a function of SO2 column for the different column retrieval approaches (brightness temperature and HRI-based) for a tropical high-altitude SO2 plume. ΔBT1 and ΔBT2 are the brightness temperature differences for the first and second set of channels from Table 1, and σ1 and σ2 their respective standard deviations. (b) Corresponding relative retrieval error as function of SO2 column. These quantities were calculated for a tropical atmosphere with an SO2 layer located at 16 km with corresponding atmospheric temperature of 195 K and pressure of 113 hPa (solid lines), and a mid-latitude with an SO2 layer located at 8 km with corresponding atmospheric temperature of 250 K and pressure of 386 hPa (dashed lines).
While in the absence of SO2 Tin≈Tout for both sets, small biases were observed in the median values of Tin−Tout as a function of time, location, and IASI instrument: (i) The global median values for IASI/Metop-A measurements underwent an abrupt change on 13 April 2015 from −0.05 to −0.1 K, only to return to normal on 7 October 2015. These dates coincide with changes to the IASI-A instrument (see Boynard et al. (2018) and references therein). (ii) While the values of IASI-A and IASI-C match closely, those of IASI-B exhibit a small offset of 0.05–0.06 K compared to those of the other two instruments. (iii) Finally, the distributions of the median values show slight regional biases of the order of −0.1 to 0 K and −0.2 to 0.3 K for the first and second set of channels, respectively. In each case, fixed offset corrections were applied to the brightness temperatures to counter the observed biases. In particular, regional biases were removed based on a monthly median climatology calculated over the entire 2008–2024 period.
The remaining unknown in Eq. (6) is the absorption cross section c. This coefficient not only depends on the pressure and temperature of the SO2 layer, but also on the SO2 abundance (see Clarisse et al., 2012). Forward simulations were used to construct look-up-tables of for both sets of channels on a grid of 553 temperature–pressure pairs and 17 SO2 columns ranging from 1 to 10 000 DU. For this new version of the SO2 product, the look-up-tables have been re-generated on a finer grid compared to Clarisse et al. (2012), who used 82 temperature–pressure pairs. Pressure and temperature pairs were selected based on those found in the 13 495 well-sampled atmospheric profiles from the ECMWF ERA-40 reanalysis (Chevallier, 2001). Pressures range from 0.1 to 600 hPa on 41 levels, covering altitudes from 5 to 60 km. The temperature varies in steps of 5 K between a minimum and maximum that depend on the pressure. For each temperature–pressure pair, 10 corresponding ERA-40 profiles were selected for which the temperature and pressure match the specified pair at some altitudes. The absorption cross section c was then calculated as the median over these 10 simulations using Eq. (6), for each of the 17 different SO2 column abundances. With these look-up-tables and Eq. (6), SO2 columns can be retrieved. Pressures and temperatures are obtained from the retrieved SO2 altitudes and collocated ERA5 profiles. Because of the dependence of c on SO2 abundance, SO2 is calculated in an iterative way. Starting from a constant value of c, a first estimate of SO2 is obtained, which then yields a better estimate of and subsequently SO2. This procedure is repeated ten times, even though convergence is usually obtained after a few iterations.
A final subtlety arises for cases where there is non-negligible absorption by water vapour above the SO2 layer. Based on the simulations presented above, it was found that on average, and to a good approximation, a partial H2O column above the SO2 layer in units of 1021 molec cm−2 leads to a temperature decrease of
in both absorption and baseline channels. This effect is taken into account by subtracting this value from before applying Eq. (6). The correction is mostly below 2 K. The above-plume H2O column is derived from ERA5 humidity profiles collocated with the retrieved IASI altitudes.
3.2 Hyperspectral range index
Just like the brightness temperature difference ΔBT introduced in the previous section, the quantity is proportional to the SO2 abundance in the observed spectrum y, as illustrated in Fig. 9a. For this example, an HRI of one (the noise level) is reached for a column as low as 0.03 DU. We also observe that the relationship is linear for columns up to about 10 DU, and that for columns above 100–200 DU the HRI actually decreases with increasing columns. However, below 100 DU, there is a 1-to-1 correspondence between column and HRI, which forms the basis for the HRI-based column retrieval.
Using the same climatology and latitude-longitude grid as presented in Sect. 2.1, a monthly look-up table was built for HRI values as a function of SO2 abundance, for each altitude h. For a given IASI observation, an SO2 estimate is obtained for each assumed altitude h by one-dimensional interpolation of from the monotonic part of the look-up table. Note that we extrapolate linearly for HRI values below zero to also obtain a retrieval for negative HRIs that typically represent noise. In this way, a column is obtained for each observation. Allowing negative columns results in theoretically unbiased averages (Clarisse et al., 2019). Indeed, for observations with background levels of SO2, HRIs are normally distributed around 0, and because of the linearity, the retrieved columns are distributed around 0 DU. The bottom panel of Fig. 9b shows the relative retrieval error of this approach. This method clearly outperforms the DBT-based methods for low columns, achieving for these examples a relative error below 20 % in the range of 0.15–175 DU. For larger columns, the DBT approach performs better, allowing meaningful results up to 10 000 DU.
3.3 The combined product
The HRI-based column retrieval method is applied to all observations and for all altitudes from 1 to 60 km. For all observations with a valid altitude estimate, an SO2 value is also retrieved using the DBT method. For the latter, we additionally require that the observed temperature Tin is larger than and that there is sufficient thermal contrast, with . When , an SO2 column is retrieved using the first set of channels, whereas the second set of channels is used only when and . In this way, up to three SO2 columns are obtained, two based on DBTs and one on the HRI. These are combined into one product as follows. First, for altitudes below 8 km, only the HRI method is used. Above this altitude, and when the DBT method with the first set of channels (DBT1) retrieves an SO2 column larger than 32 DU, that value is used, except when any of the DBT-retrieved columns exceeds 128 DU. In this case, the estimate from the DBT method with the second set of channels (DBT2) is used. In this way, an SO2(z) column is retrieved for each observation, and for each assumed plume altitude z from 1 to 60 km. A combined IASI-derived altitude-column dataset is obtained from this and consists of the SO2 columns at the retrieved altitude, with the columns set to 0 DU when no altitude is retrieved. For morning and evening overpasses separately, gridded versions of the SO2 columns and retrieved altitudes are also available, which allow the calculation of total mass over a geographical area. This combined altitude-column dataset will be discussed in the rest of this paper.
The altitude-dependent columns SO2(z) that are available for all IASI observations can be used when the SO2 altitude is known from independent measurements or model simulations. In addition, they allow constructing total column averaging kernels (AVKs) Az with
with SO2 the retrieved column at an arbitrary reference altitude. The AVKs can be used to simulate what would be retrieved if modelled SO2 partial columns Mz were observed (Clarisse et al., 2023):
Alternatively, AVKs can be used to obtain columns that are consistent with a prescribed normalized SO2 profile :
i.e., as a weighted harmonic mean of SO2(z). Note that these equations are only exact in the linear regime.
The first examples, presented in Figs. 10 and 11, show the fresh and one-week-old volcanic plumes after the August 2008 Kasatochi eruption (Waythomas et al., 2010). Both figures show: (a) the retrieved SO2 heights, (b) the retrieved SO2 columns (combined product) at the retrieved altitudes, (c) the SO2 retrieval method used for the combined product, (d) the HRI-based SO2 columns, (e) the DBT-based SO2 columns, (f) a scatter plot between the columns shown in (d) and (e). The fresh Kasatochi plume (Fig. 10) features altitudes between 5 and 17 km, with the largest columns seen at the highest altitudes. As expected, the largest SO2 columns are retrieved with the DBT2 approach, the smallest and lowest columns with the HRI approach, and everything in between with the DBT1 method. Panels (d)–(f) illustrate well that the HRI method fails to retrieve columns above 100 DU, while the DBT-based method fails to retrieve the plume edges below 1 DU. For columns between 1 and 100 DU, both methods agree well with each other despite an altitude-dependent bias. The one-week-old plume, shown in Fig. 11, is almost entirely retrieved with the HRI-based approach, even though both retrieval approaches are seen to agree reasonably well. Columns below 10 DU exhibit a larger scatter.

Figure 10IASI/Metop-A retrievals from 8 August 2008 (morning overpasses) during the Kasatochi eruption. (a) Retrieved SO2 altitude. (b) SO2 VCDs. (c) Retrieval approach. (d) HRI-based SO2 VCDs. (e) DBT-based SO2 VCDs. (f) Comparison between HRI-based and DBT-based SO2 VCDs, colour-coded by the retrieved SO2 altitude. All VCDs and altitudes are in DU and km, respectively.

Figure 11Same as Fig. 10, but for the IASI/Metop-A observations on 15 August 2008, in the wake of the Kasatochi eruption.
3.4 Retrieval errors
There are four main sources of error in the retrieved SO2 columns, which are discussed below.
3.4.1 Instrumental noise (L1)
Instrumental noise affects the calculated DBTs and HRIs, and these errors propagate to the retrieved columns. Here, we provide estimates of the magnitude of such errors, first considering SO2 columns above 32 DU. For high-altitude plumes, the DBT-based product is used. Referring to Fig. 9b, we see that relative errors below 5 % are attained for columns in the range of 32–300 DU. A relative error below 20 % is attained for columns between 1000 and 8000 DU, depending on the atmosphere considered. For altitudes below 8 km, the HRI-based product is used, with relative errors at 5 km typically below 5 % for columns up to 150 DU (not shown in Fig. 9b).
Then, we consider SO2 columns below 32 DU for which the HRI-based product is used exclusively. Figure 12a shows the retrieval error as a function of altitude and latitude. These were calculated from the corresponding SO2 Jacobians from Sect. 2.1 as the SO2 columns corresponding to an HRI of one. We see that the highest sensitivity is for plume altitudes above 10 km, reaching a minimum of 0.025 DU for a tropical atmosphere and 0.05 DU at higher latitudes. Below 10 km, the situation reverses, and the tropical atmosphere becomes significantly less sensitive to SO2 because of interfering H2O absorption. At 5 km, the uncertainties are in the range of 0.1–0.5 DU, further increasing to 1–100 DU at 1 km. We also see that winter, with its drier atmosphere, provides more favourable conditions for retrieving SO2.

Figure 12(a) SO2 retrieval uncertainty due to instrumental noise, as a function of altitude, for three different latitudes and for two different periods of the year. These were calculated as the columns corresponding to an HRI of one. (b) SO2 retrieval uncertainty due to a 1 km error in the retrieved altitude. The data were calculated from the median of 100–1000 actual observations from six different plumes (winter and summer each at three different latitudes).
The sensitivity estimates above are derived from a climatology of typical atmospheric conditions, in which water vapour is essentially absent at the high altitudes reached by most volcanic plumes. This assumption is nonetheless violated for the 2022 Hunga Tonga eruption, which injected an unprecedented ∼146 Tg of water vapour directly into the stratosphere, co-located with the SO2 and sulfate aerosol plume at altitudes of 28–30 km (Legras et al., 2022; Millán et al., 2022). This anomalous high-altitude hydration is a plausible additional source of interference for this specific event, unaccounted for by the standard sensitivity analysis presented here.
Taken together, we conclude that for plumes above 8 km, a conservative estimate of the retrieval uncertainty due to the instrumental noise is 0.1 DU+5 % for columns from 0.1 to 300 DU. For low-altitude columns, the retrieval uncertainty varies significantly as a function of the atmosphere and altitude. At 5 km, the uncertainty is below 0.5 DU+5 % for columns in the range of 0.5–150 DU, further increasing at lower altitudes.
3.4.2 Retrieved altitude
Thermal IR retrievals are significantly affected by thermal contrast (TC), which here corresponds to the temperature difference between the SO2 plume and the brightness temperature of the upwelling radiation from beneath it. Since the altitude of SO2 is not known exactly, errors in the retrieved altitude propagate into the retrieved column. Figure 12b shows the change in retrieved SO2 corresponding to a change of 1 km in the assumed plume height. The data were calculated from six different plumes located at approximately 5° N, 45° N, and 65° N latitude, in both winter and summer. For each observation, an error profile was obtained and the median over the entire plume was computed, resulting in the six error profiles shown in Fig. 12b. In the upper troposphere and lower and mid-stratosphere, the retrieval errors are below 5 % km−1 for the tropical plumes and below 1 % km−1 for extratropical atmospheres. Errors increase rapidly at lower altitudes, reaching about 50 % at 5 km, and increasing further at lower altitudes. At low altitudes, as the TC is lower, an error in the assumed height translates into a large relative error in the TC and thus in the column. It should be emphasized that errors related to the retrieved altitude can be largely mitigated if accurate third-party information on the altitude or SO2 profile is available (see discussion related to Eq. 10 in Sect. 3.3).
3.4.3 Other input data
We briefly list here the principal sources of error related to other input data. The DBT algorithm relies on look-up tables of averaged absorption cross sections, which Clarisse et al. (2012) estimated to have an uncertainty of the order of 5 %. In addition, the algorithm relies on the temperature of the SO2 layer from ERA5, which can deviate from the true layer temperature. This type of error has the same effect as an error in the retrieved altitude, and its magnitude will therefore be modest, except for highly saturated plumes where the temperature of the SO2 layer approaches that of the absorption channels used in the DBT algorithm. The HRI-based algorithm uses a gridded monthly climatology of averaged atmospheres, and local and day-to-day variability of temperature and humidity profiles can induce errors in the retrieved SO2. The largest errors will be incurred for near-surface SO2, since temperatures vary the most in the lower troposphere.
3.4.4 Clouds and volcanic ash
As discussed in Clarisse et al. (2012) and Carboni et al. (2019), the presence of clouds and volcanic ash can strongly affect retrieved SO2. They will mostly cause an attenuation of the SO2 spectral signature, whether located below or above the SO2 plume. The HRI algorithm, which is based solely on the magnitude of the spectral signature, will therefore tend to underestimate the retrieved abundances in the presence of clouds or ash. The DBT algorithm accounts explicitly for the magnitude of the upwelling radiance below the SO2 plume and should therefore be unaffected by underlying clouds. Overlying clouds on the other hand will affect both the absorption and background channels, and depending on the specific conditions will lead to under- or overestimations of the SO2 abundances (Clarisse et al., 2012).
A statistical analysis was performed to estimate the order of magnitude of this type of error. Considering columns between 1 and 50 DU, daily median columns were calculated separately for cloud-free scenes and scenes with 100 % cloud cover, for altitudes between 1 and 20 km. The ratios of these daily values were then averaged for the entire IASI dataset. For the HRI-based algorithm, the SO2 columns in cloudy scenes were found to be 5 %–20 % lower, depending on the altitude bin, while for the DBT-based algorithm differences were smaller (0 %–10 %). As a complementary test, daily regression slopes were calculated between HRI and DBT-based columns, per altitude bin. The median of these daily values for the entire IASI dataset shows a good consistency between the two approaches for cloud-free scenes, with differences mostly between −5 % and 5 % depending on the altitude. For cloudy scenes, the HRI-based approach gives on average between 15 % and 30 % lower columns. These numbers are consistent with the other statistical assessment showing that the HRI-based columns are more affected by clouds.
3.4.5 Sulfate aerosols
Volcanic SO2 is progressively oxidized into sulfate aerosols, which are therefore, to some extent, co-located with the SO2 plume, in particular for aged plumes. Unlike clouds and ash (Sect. 3.4.4), however, sulfate aerosols exhibit their strongest absorption/scattering features around 1100 cm−1, while their optical effect within the 1320–1410 cm−1 spectral range used for the SO2 retrieval is comparatively weak and spectrally flat. A large interference on the retrieved SO2 columns is therefore not expected. Sulfate aerosol optical depth and mass can nonetheless also be retrieved from IASI radiances, simultaneously with SO2 (Karagulian et al., 2010; Sellitto et al., 2024), offering a promising avenue for jointly characterizing this co-located aerosol and potential interference in future work.
3.5 Comparisons with TROPOMI
The TROPOspheric Monitoring Instrument (TROPOMI) onboard the Sentinel-5 Precursor (S-5P) platform (Veefkind et al., 2012) provides UV SO2 measurements in the early afternoon (13:30 local solar time) that complement the morning and evening IASI observations, thereby offering additional temporal coverage for tracking volcanic gas plumes. This is illustrated below using SO2 column and altitude measurements from consecutive IASI–TROPOMI–IASI overpasses for three fresh volcanic plumes (Figs. 13–15). The TROPOMI SO2 VCDs and layer heights used here were retrieved from its second UV spectral band (BD2; 305–326 nm) with the Look-Up Table – COvariance-Based Retrieval Algorithm (LUT-COBRA; Theys et al., 2021, 2022), as described in detail by Fabris et al. (2026). Compared with TROPOMI's third UV band (BD3), BD2 allows the detection of lower SO2 quantities and the reduction of uncertainties on the retrieved SO2 columns and layer heights, owing to the stronger SO2 absorption features and the higher signal-to-noise ratio in BD2. In the following examples, the IASI data are gridded at a 0.125°×0.125° resolution, whereas the TROPOMI pixels are displayed after excluding negative VCDs and applying a running 3×3 median filter.

Figure 13(a–c) SO2 VCD (in DU) and (d–f) SO2 altitude (in km) from three consecutive overpasses of IASI and TROPOMI during the eruption of Ulawun in June 2019. Histograms in inset show the corresponding normalized mass profiles.

Figure 14Same as Fig. 13, but during the eruption of Etna in December 2018.

Figure 15Same as Fig. 13, but during the eruption of Raikoke in June 2019. The eastern portion of the plume, captured by TROPOMI during a separate overpass, is not shown here, as the resulting time offset would make it appear disconnected from the plume displayed here.
The 2019 Ulawun (Papua New Guinea) eruption began on 24 June with detectable precursor gas activity, followed by a Plinian phase characterized by gas-dominated emissions on 26 June, 04:20 UTC (Kloss et al., 2021; McKee et al., 2021b). Later that day (∼22:30 UTC), IASI/Metop-A detected a large SO2 plume from Ulawun, extending both westward and eastward from the volcano, with column values up to 10–20 DU in its central part and a mass largely confined between 16 and 17 km altitude (Fig. 13). Five hours later (27 June, ∼03:40 UTC), TROPOMI retrieved a plume consistent with the IASI observations, with comparable column values. While the SO2 layer heights retrieved by IASI are relatively homogeneous across the plume, those derived from TROPOMI exhibit greater variability, with a larger fraction of the SO2 mass assigned to lower altitudes. On 27 June, ∼11:00 UTC, the second IASI overpass shows the plume transported eastward, with SO2 confined at the tropical tropopause. A notable difference is the detection by TROPOMI of a low-altitude (<10 km) portion of the plume over Papua New Guinea. Although the first IASI/Metop-A overpass does not fully sample this region (Fig. 13), the other IASI sounders also do not detect this low-altitude component of the plume. This is attributable to the limited sensitivity of IASI to low-altitude tropical SO2 (see Fig. 12a).
The second example presents an SO2 plume from Etna during the “Christmas” eruption of December 2018, transported southward over the Mediterranean Sea (Fig. 14). Following the major explosive phase on 24 December 2018, Etna continuously ejected gas and ash until 30 December (Corradini et al., 2020, 2021). On 28 December, the SO2 columns retrieved from both IASI/Metop-B and TROPOMI peak between 50 and 100 DU near the volcano and decrease to values not exceeding 20–30 DU toward the North African coastline. The two sounders show good agreement in terms of SO2 columns and layer heights. However, plume portions characterized by low SO2 columns (below 1–2 DU) exhibit noisier altitude retrievals in the TROPOMI data. Moreover, TROPOMI detected a low-altitude SO2 plume (1–2 km) over North Africa, which corresponds to the remnant of an earlier plume emitted by Etna 24–48 h before the analysed overpasses. The absence of this low-altitude plume component in the IASI/Metop-B observations is explained by IASI's reduced sensitivity to near-surface layers, particularly over land during winter (Di Gioacchino et al., 2024).
The large SO2 plume produced by the June 2019 Raikoke eruption presented a complex vertical structure, as discussed in Sect. 2.3.5. On 22 and 23 June, IASI/Metop-C retrievals revealed three distinct altitude features (Fig. 15): a northern branch of the plume located at 10–11 km, a central branch containing the bulk of the SO2 mass injected above the tropopause (>13 km and reaching 17–18 km), and a southern, low-altitude feature at 4–5 km corresponding to post-eruptive SO2 degassing (Horváth et al., 2021; Bruckert et al., 2022; Vernier et al., 2024). Both IASI and TROPOMI retrieved broadly consistent SO2 columns, exceeding 100 DU in the northern branch and largely surpassing 300–400 DU in the central plume. Peak values even exceeded 900 DU in the IASI overpass on 22 June, in agreement with Hedelt et al. (2019). However, while TROPOMI detected the same vertical plume structure as IASI, the retrieved layer heights are systematically lower by ∼2 km, which complicates a direct comparison between the two sounders. For example, higher columns retrieved by TROPOMI in the degassing plume may result from lower retrieved layer heights relative to IASI. While IASI-derived altitudes showed good agreement with CALIOP observations (Sect. 2.3.5), the lower altitudes retrieved from TROPOMI could result from the particularly high volcanic ash content of the Raikoke plume (McKee et al., 2021a; Bruckert et al., 2022; Vernier et al., 2024).
The new IASI SO2 retrievals presented in this study have allowed us to construct a consistent 19-year global record (July 2007–July 2026) of SO2 measurements, using observations from a single type of IR satellite sounder. To this end, we combined measurements from the entire time series of IASI/Metop-A, -B, and -C. Owing to the twice-daily overpasses of each IASI sounder, this SO2 product enables detailed monitoring of volcanic emissions and the day-to-day evolution of volcanic plumes.
As an illustration, Fig. 16 presents the twice-daily SO2 column distributions retrieved from IASI/Metop-B over Etna during 21 consecutive days in March 2021. Etna, one of the most active and best-monitored volcanoes worldwide (Carn et al., 2017; Giammanco et al., 2024), is characterized by frequent degassing and eruptive phases during which SO2 plumes can rapidly change in strength, spatial extent, and transport pathways, as highlighted by Fig. 16. In such a rapidly evolving context, twice-daily measurements are essential for capturing the evolution of volcanic gas clouds on short time scales.

Figure 16SO2 VCD (in DU) retrieved from the twice-daily IASI/Metop-B measurements over Etna (triangle) during 21 consecutive days in March 2021. Each dot corresponds to the on-ground footprint of an individual IASI observation.
Building upon earlier efforts to document volcanic SO2 variability from space (e.g., Carn et al., 2016, 2017; Fisher et al., 2019; Fioletov et al., 2023), we use this dataset to investigate the variability of volcanic SO2 emissions over nearly two decades and to characterize the most significant eruptive episodes captured by IASI.
4.1 Consistency between IASI sounders
Although the three IASI instruments are identical and have similar equator crossing times, small differences in operational parameters and calibration may lead to discrepancies in retrieved gas abundances, especially for weak absorbers (e.g., Van Damme et al., 2021; Clarisse et al., 2023). Since the first observations from IASI/Metop-B in early 2013, at least two IASI sounders have operated simultaneously, providing several years of overlap that are valuable for assessing their consistency. Notably, with the start of IASI/Metop-C observations in April 2019 and the continued operation of IASI/Metop-A until November 2021, the three IASI sounders operated concurrently for more than two years.
Figure 17a shows the global atmospheric SO2 mass derived twice daily (morning and evening overpasses) from IASI/Metop-A, -B, and -C measurements, separately, between April 2019 and September 2021. Over this period, three major enhancements of the global SO2 burden are observed, associated with intense gas emissions from the Raikoke (June 2019), Taal (January 2020), and La Soufrière (April 2021) eruptions. The zoomed views of these events (Fig. 17b–d) show the sharp increase in atmospheric SO2 due to each eruption, with the peak SO2 mass typically reached within 24–48 h after the onset of the Plinian phase, followed by the characteristic exponential decay of SO2 in volcanic plumes. In the case of Raikoke (Fig. 17b), one of the major volcanic eruptions over the last decade (e.g., Muser et al., 2020; de Leeuw et al., 2021; Vernier et al., 2024), the decay of the global SO2 mass is interrupted by several secondary peaks caused by additional SO2 injections into the atmosphere from the successive eruptions of Ulawun and Manam at the end of June, Ubinas in mid-July, and Ulawun again in early August.

Figure 17(a) Twice-daily global atmospheric SO2 mass (in kt) above 5 km altitude derived from IASI/Metop-A (green), -B (red), and -C (blue) observations between April 2019 and September 2021. (b–d) Enlarged views of the three major volcanic eruptions during this period, corresponding to the grey (Raikoke), yellow (Taal), and blue (La Soufrière) shaded areas in (a).
These zoomed views also highlight the good agreement between the atmospheric SO2 masses retrieved from the three IASI sounders: for each eruption case, all three instruments capture comparable peak SO2 burdens, similar decay rates of the volcanic plumes, and a return to the same background SO2 levels. This consistency among the three SO2 datasets is an important prerequisite for the analysis of the entire IASI time series.
Nevertheless, in certain individual overpasses, the SO2 mass derived from one instrument deviates significantly from the other two. This occurs during the Taal eruption, for which IASI/Metop-B does not capture the pronounced SO2 peak observed by the other sounders, or when IASI/Metop-A shows a drop in SO2 burden on 19 January 2020. Such discrepancies, which typically affect only single overpasses, are due to the coverage gaps that exist at low latitudes between successive polar orbits of an IASI sounder. Despite the wide IASI across-track swath of ∼2200 km, individual orbits from a single satellite do not overlap in the tropics and leave uncovered longitudinal bands (Clerbaux et al., 2009). As a result, an IASI sounder may detect only part of a volcanic plume and thus underestimate the total atmospheric SO2 compared with the other sounders that fully sample the plume. These discrepancies occur for eruptions at low latitudes, such as Taal (14° N) and La Soufrière (13° N), but are absent for higher-latitude events like Raikoke (48° N), where consecutive orbits overlap sufficiently. These low-latitude gaps highlight the advantage of having mutually consistent IASI sounders operating concurrently, as the orbits of one instrument fill the gaps left by another.
4.2 SO2 total mass time series
In Fig. 18, we present the global atmospheric SO2 mass time series derived from the entire IASI observational period, considering only SO2 masses above 5 km altitude to minimize the contribution from anthropogenic sources. Because parts of a volcanic plume may not be fully captured by a single IASI sounder at low latitudes (see Sect. 4.1), only the maximum SO2 mass among the three IASI sounders (when available) was retained at each time step.
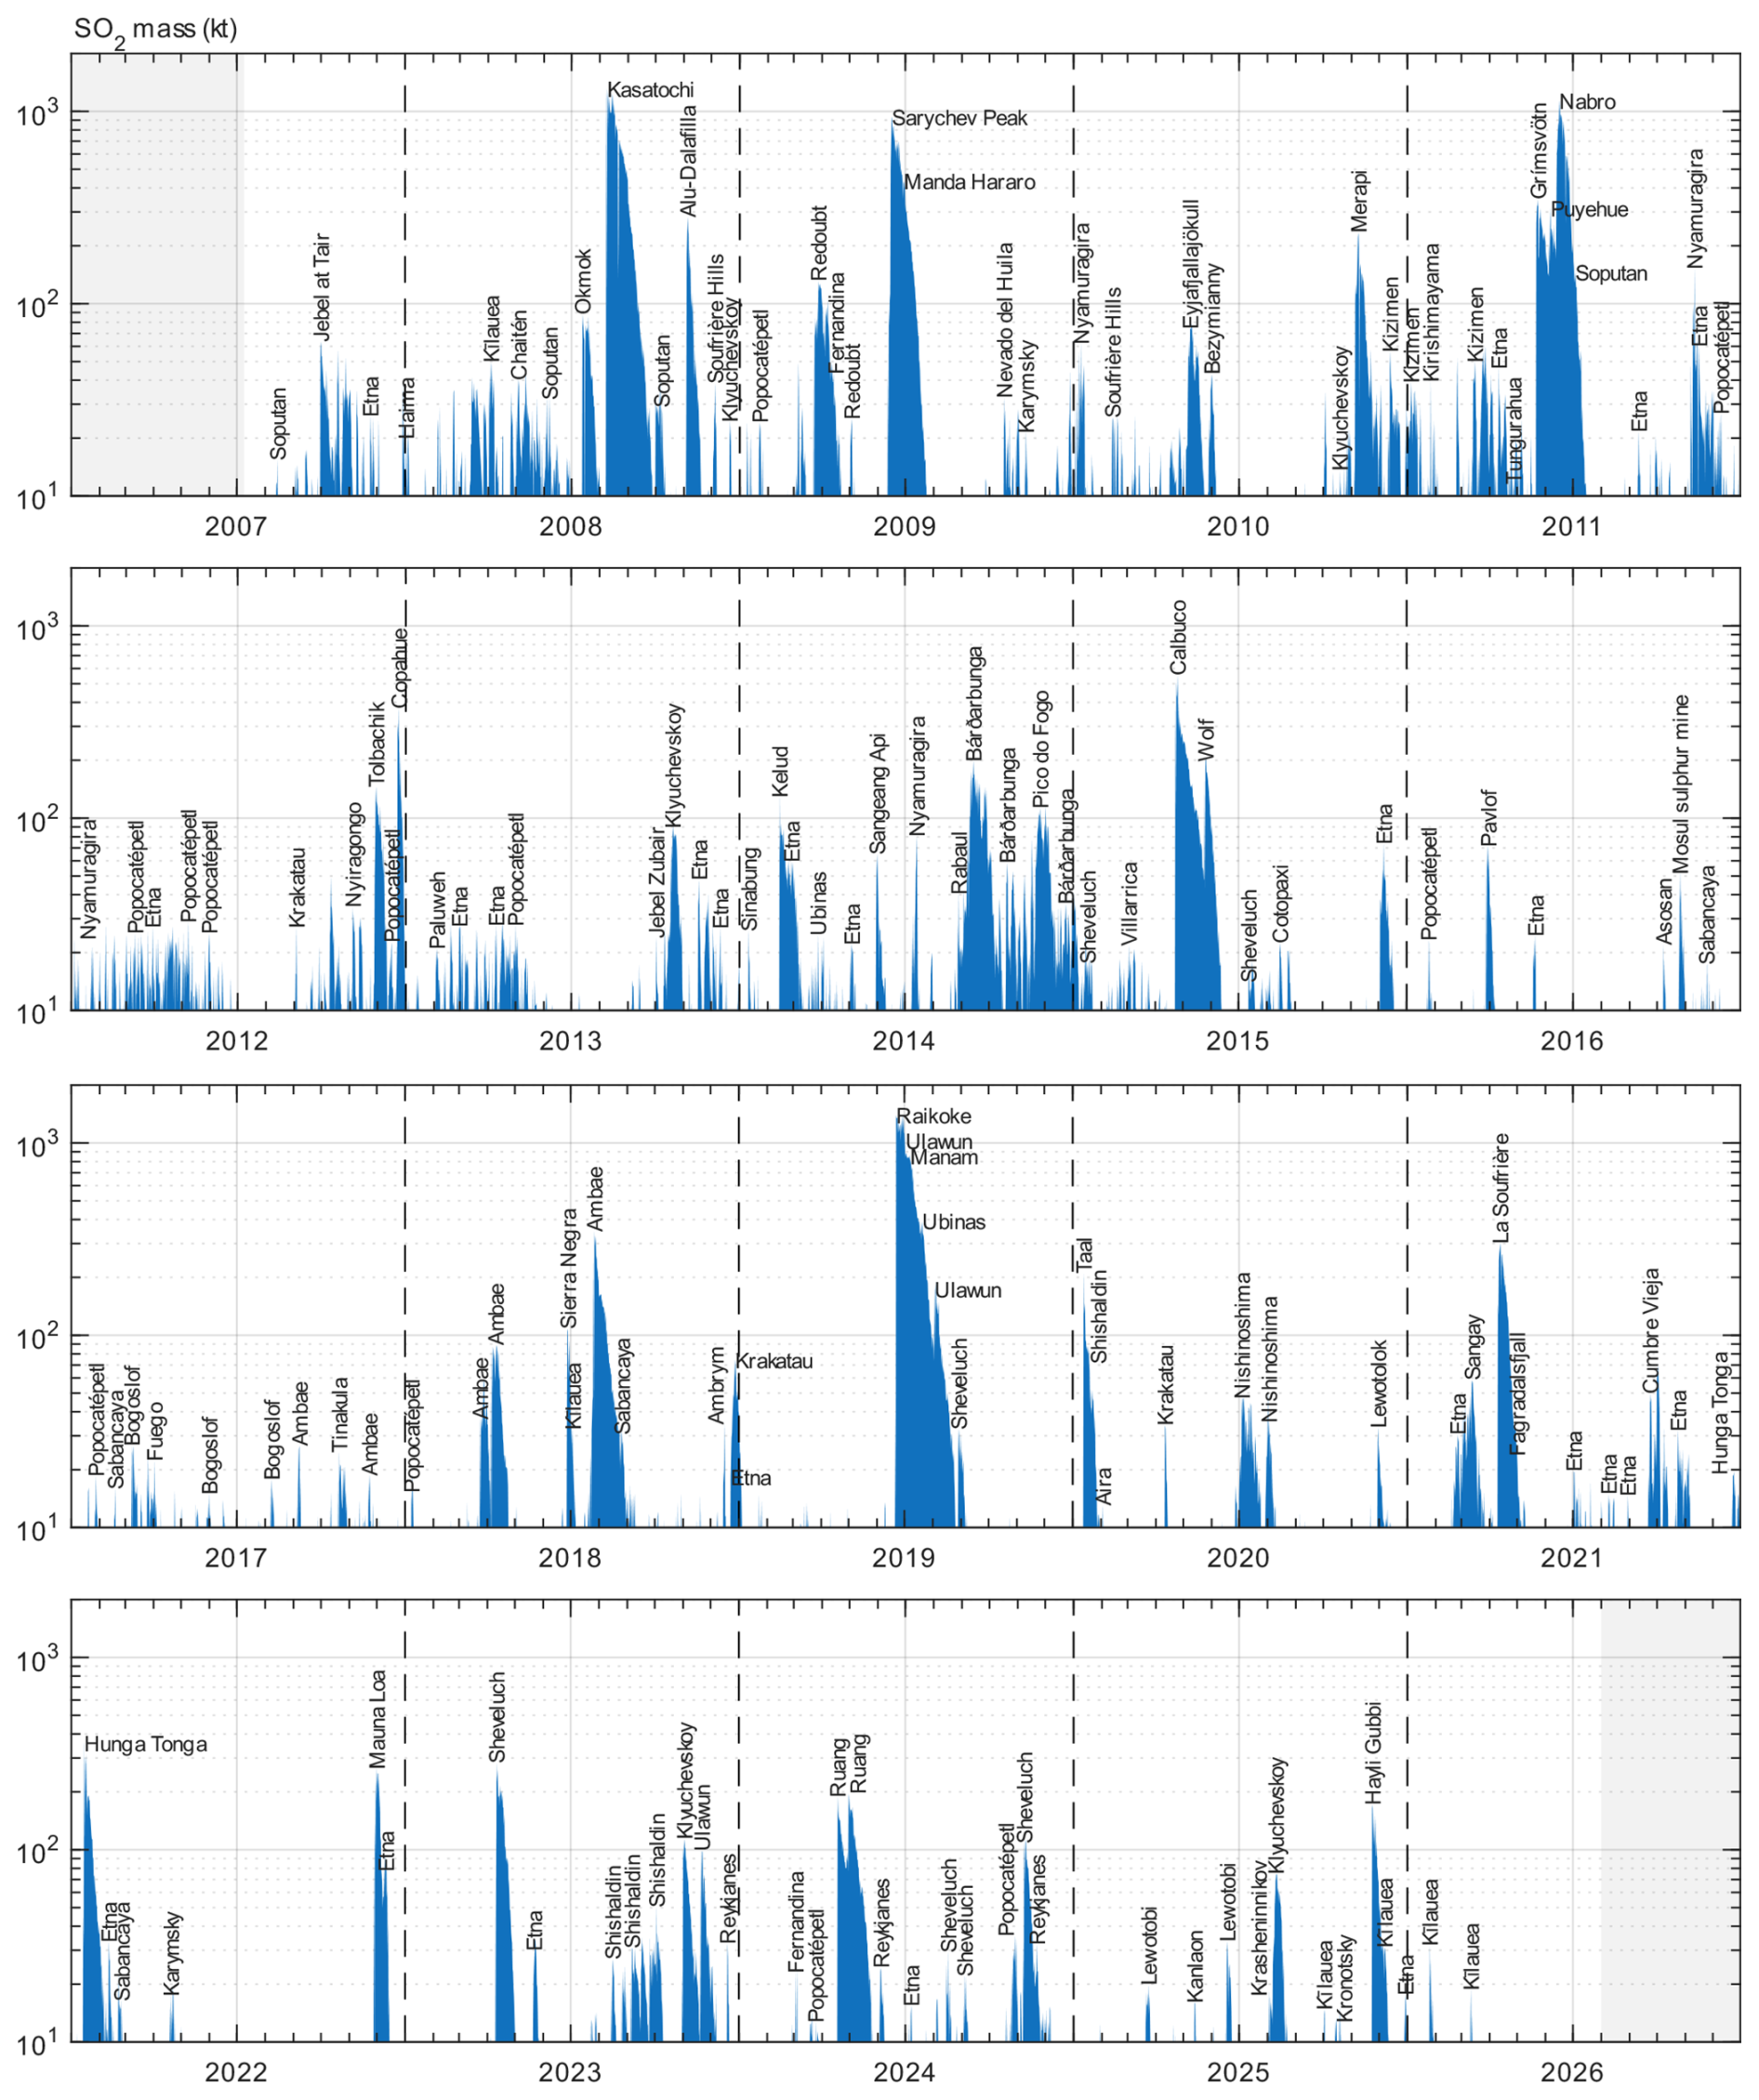
Figure 18Twice-daily global atmospheric SO2 masses (in kt) above 5 km altitude derived from IASI observations between July 2007 and July 2026. At each time step, only the maximum SO2 mass between IASI/Metop-A, -B, and -C (when available) was retained. Major volcanic eruptions detectable with the IASI SO2 product are indicated (non-exhaustive list). Grey-shaded areas indicate periods for which no IASI observations are available.
Numerous peaks can be observed throughout the time series, most of which correspond to substantial enhancements in atmospheric SO2 mass resulting from volcanic eruptions. Using the twice-daily global IASI distributions of SO2 VCDs to track the origin of the SO2 plumes, we have identified the erupting volcanoes responsible for all of the large SO2 mass enhancements as shown in Fig. 18. The most prominent features correspond to Kasatochi (2008), Sarychev Peak (2009), Grímsvötn (2011), Puyehue (2011), Nabro (2011), Calbuco (2015), and Raikoke (2019). Other important events include, e.g., the Merapi (2010), Copahue (2012), Ambae (2018), Taal (2020), La Soufrière (2021), Hunga Tonga (2022), Mauna Loa (2022), Sheveluch (2023), and Ruang (2024) eruptions. The years 2016–2017 in the IASI record are marked by less frequent and overall lower volcanic SO2 masses, with the exception of the 2016 Pavlof eruption. The first major event detected by IASI was the eruption of Jebel at Tair (Yemen), a stratovolcano located in the Red Sea, on 30 September 2007. This event was studied in detail by Clarisse et al. (2008) with IASI and Eckhardt et al. (2008) with other sounders. The most recent major event up to July 2026 is the eruption of Hayli Gubbi (Ethiopia), a shield volcano in the East African Rift Zone, on 23 November 2025. This event, which generated a large SO2 plume that drifted across the Middle East and reached China in the following days, marked the first explosive eruption ever recorded for this volcano. Among the SO2 peaks of lower intensity, many are attributed to volcanoes known for their persistent or frequent activity, and in some cases, continuous degassing over the IASI observation period. Examples include Etna, Popocatépetl, Ubinas, and Nyamuragira. Over the last four years (2023–2026), volcanoes showing frequent SO2 emissions captured by IASI also include Sheveluch, Reykjanes, Lewotobi, and Kīlauea.
Another notable feature in Fig. 18 is the presence of numerous small peaks (typically of SO2 masses below 30 kt), mostly during the early years of the IASI record. While some of these peaks are attributed to small volcanic eruptions (not shown in Fig. 18 for clarity), many correspond to enhanced atmospheric SO2 masses above 5 km altitude originating from significant anthropogenic emissions, particularly from eastern Asia. Indeed, previous studies have shown that anthropogenic SO2 can be transported over long distances and can reach high altitudes (e.g., van Donkelaar et al., 2008; Clarisse et al., 2011; Fadnavis et al., 2019). The frequency and intensity of these non-volcanic peaks gradually decrease over the IASI record, consistent with the substantial reduction of anthropogenic SO2 emissions in China following the implementation of strict national air-quality controls in the early 2010s (Krotkov et al., 2016; Zheng et al., 2018; Fioletov et al., 2023). After 2014–2015, such anthropogenic SO2 events are largely absent from the record (Fig. 18).
4.3 SO2 mass profile time series
Figure 19 presents the time series of SO2 mass profiles from the surface up to 30 km altitude retrieved from IASI, i.e., at each time step, the vertical distribution of the global mass according to the retrieved altitude of SO2. Similar to Fig. 18, a selection of volcanic eruptions identifiable with IASI is highlighted in Fig. 19. For instance, the major events previously discussed (Kasatochi, Sarychev Peak, Grímsvötn – Puyehue – Nabro, Calbuco, and Raikoke) are immediately recognizable due to the exceptionally large SO2 masses they emitted.

Figure 19Twice-daily vertical profiles (from surface up to 30 km altitude) of global atmospheric SO2 mass (in kt) derived from IASI observations between July 2007 and July 2026. At each time step, only the maximum SO2 mass between IASI/Metop-A, -B, and -C (when available) was retained. Selected eruptions are labelled. Grey-shaded areas indicate periods for which no IASI observations are available.
The most interesting feature revealed by Fig. 19 is the clear contrast in the vertical distribution of SO2 masses originating from major intra- and extratropical eruptions, consistent with previous studies (e.g., Robock, 2000; Clarisse et al., 2012; Theys et al., 2013; Carboni et al., 2016; Carn et al., 2016). Within the tropics, SO2 masses frequently reach higher altitudes (up to 18–19 km), reflecting the elevated tropical tropopause. Although part of the emitted mass also remains in the free troposphere, the bulk is often detected near or at the tropopause. Typical examples in the IASI record are Alu-Dalafilla (2008), Merapi (2010), Kelud (2014), Wolf (2015), Ambae (2018), La Soufrière (2021), and Ruang (2024). Even eruptions with comparatively smaller SO2 emissions can reach such altitudes, such as Soufrière Hills (2010), Sangeang Api (2014), Lewotolok (2020), and Lewotobi (2025). In contrast, eruptions at mid- and high latitudes typically inject SO2 to lower altitudes, rarely exceeding 13–14 km, due to the lower regional tropopause. This is the case for most events in the North Pacific (e.g., 2009 Redoubt, 2012 Tolbachik, and 2023 Sheveluch), Iceland (e.g., 2010 Eyjafjallajökull, 2011 Grímsvötn), and the Southern Andes (e.g., 2011 Puyehue, 2012 Copahue).
This pattern, however, is not systematic, as the SO2 injection height depends on various parameters (Robock, 2000; Textor et al., 2003), such as the type of eruption (Plinian eruptions vs. effusive or less explosive eruptions), the atmospheric structure, the plume thermal buoyancy, or the timing of SO2 degassing (during or following the main blast). For example, sustained lava flows and high SO2 degassing rates during the prolonged 2014 Bárðarbunga (Holuhraun) effusive fissure eruption in Iceland generated multiple gas plumes that remained largely confined below 9 km (Pedersen et al., 2017; Simmons et al., 2017). Similarly, several SO2 plumes from major tropical eruptions did not reach the tropopause, with most of their mass remaining in the free troposphere. For instance, although the large eruption of Mauna Loa (a basaltic shield volcano) of December 2022 produced SO2 reaching 16–17 km altitude after atmospheric transport, Fig. 19 indicates that the majority of the mass remained below 10 km. Other examples include the 2008 Kīlauea, 2009 Nevado del Huila, and 2012 Nyiragongo eruptions, whose SO2 plumes did not exceed 12–13 km. Conversely, eruptions with a strong Plinian phase at mid- and high-latitudes may inject substantial SO2 amounts well above the regional tropopause into the lower stratosphere (e.g., Textor et al., 2003; Krotkov et al., 2010; Kremser et al., 2016). The IASI record clearly shows that this occurred during the 2008 Kasatochi, 2009 Sarychev Peak, and 2019 Raikoke eruptions: the initial explosive phase generated large SO2 plumes reaching up to 20 km, directly followed by masses injected at lower altitudes, with the bulk eventually capped near the tropopause (12–13 km). A similar pattern is observed in Fig. 19 at intertropical latitudes for the 2022 Hunga Tonga eruption. As discussed in Sect. 2.3.6, IASI detected an initial injection exceeding 30 km, while subsequent, larger SO2 masses were confined between 16 and 18 km, consistent with the regional tropopause height. The more dilute SO2 that was transported over long range and persisted in the following weeks was located slightly higher, between 18 and 20 km (Fig. 19).
In contrast to Fig. 18, Fig. 19 displays the SO2 mass profile down to the surface, thereby revealing an atmospheric background of SO2 predominantly located in the 1–5 km altitude range. Although volcanic eruptions can contribute to this background, it is largely driven by SO2 emissions from anthropogenic activities, such as smelters, coal-fired power plants, and other industrial and domestic sources (McLinden et al., 2016; Crippa et al., 2018; Fioletov et al., 2023). As mentioned in Sect. 4.2, under specific conditions, concentrated plumes of anthropogenic pollutants can reach the free troposphere, as exemplified in Fig. 19 by the non-volcanic SO2 mass peaks up to 10–12 km observed in the first years of the IASI time series. Another example is the large SO2 release from the fire at the Al-Mishraq sulphur plant (near Mosul, Iraq) in October 2016 (Björnham et al., 2017), which is clearly visible in Fig. 19.
The background SO2 exhibits a clear seasonal cycle in the IASI record: although it generally resides between 1 and 5 km, substantial SO2 masses are also detected close to the surface during Northern Hemisphere winter. This results from enhanced anthropogenic emissions during the cold season in major source regions at mid- and high-latitudes, such as eastern China and Norilsk, Russia (Bauduin et al., 2014; Crippa et al., 2018; Fioletov et al., 2023), combined with an extended atmospheric lifetime of SO2 and a lower planetary boundary layer, which often confines the anthropogenic pollutants near the surface. Although this seasonal pattern persists throughout the time series, Fig. 19 also reveals a decrease in background SO2 mass after 2014–2015. As discussed in Sect. 4.2, this results mostly from the substantial reductions in anthropogenic SO2 emissions in China since the early 2010s, primarily through the large-scale installation of desulfurization scrubbers at coal-fired power plants. Emissions remain comparatively high, however, for other major anthropogenic sources, such as coal-fired power plants in India and the Norilsk smelter in Siberia, Russia (Fioletov et al., 2023).
4.4 Major eruptions
In Table 2, we list all major volcanic eruptions detected with IASI between July 2007 and July 2026. These were identified through a systematic analysis of the data, flagging all instances where the retrieved SO2 mass exceeded 30 kt within any 45° latitude × 90° longitude region. A maximum SO2 mass and date were then associated with each eruption, corresponding to the largest value measured in a single overpass by a single IASI sounder within 72 h of the eruption onset. These selection criteria were designed to exclude aged plumes and to avoid selecting spatially extended plumes resulting from multiple successive emission events. However, we do not report all detected events from volcanoes exhibiting sustained or quasi-continuous eruptive activity over long periods. For example, the Bárðarbunga eruption lasted from August 2014 to February 2015 (Schmidt et al., 2015; Gauthier et al., 2016), and Nishinoshima remained active from December 2019 to September 2020, with a peak activity in July 2020 (Kaneko et al., 2022). During these episodes, IASI detected numerous fresh SO2 plumes exceeding the 30 kt threshold. In such instances, only the most significant events are listed in Table 2.
Clarisse et al. (2008)Eckhardt et al. (2008)Carn et al. (2016)Carboni et al. (2016)Prata et al. (2010); Carn et al. (2016)Spinei et al. (2010)Karagulian et al. (2010); Clarisse et al. (2012); Carn et al. (2016)Carboni et al. (2016)Prata et al. (2010)Krotkov et al. (2010); Theys et al. (2015); Yang et al. (2010); Li et al. (2017)Richter et al. (2009); Nowlan et al. (2011)Corradini et al. (2010)Carn et al. (2016)Carboni et al. (2016)Carn et al. (2016)Carn et al. (2016)Carn et al. (2016)Lopez et al. (2013)Lopez et al. (2013)Wunderman (2009)Clarisse et al. (2012); Jégou et al. (2013)Carboni et al. (2016)Carn et al. (2016)Carn et al. (2013); Theys et al. (2015); Carn et al. (2016)Ferguson et al. (2010)Carn et al. (2016)Carn et al. (2016)Carboni et al. (2016)Rix et al. (2012)Thomas and Prata (2011)Thomas and Prata (2011)Pugnaghi et al. (2016)Carboni et al. (2012)Rix et al. (2012)Thomas and Prata (2011)Carboni et al. (2016); Carn et al. (2016)Wunderman (2011)Carn et al. (2016)Carn et al. (2016)Carn et al. (2016)Clarisse et al. (2012); Carn et al. (2016); Prata et al. (2017)Carboni et al. (2016)Carn et al. (2016)Prata et al. (2017)Sigmarsson et al. (2013); Ge et al. (2016); Prata et al. (2017)Clarisse et al. (2012); Theys et al. (2013); Carn et al. (2016)Carboni et al. (2016)Carn et al. (2016)Clarisse et al. (2012, 2014); Carn et al. (2016)Carboni et al. (2016)Ge et al. (2016)Theys et al. (2013)Carn et al. (2016)Carn et al. (2016)Theys et al. (2013)Carn et al. (2016)Theys et al. (2013)Carn et al. (2016)Carn et al. (2016)Telling et al. (2015)Telling et al. (2015)Carn et al. (2016)Carboni et al. (2016)Carn et al. (2016)Carn et al. (2016)Carn et al. (2016)Zhu et al. (2020)Carn et al. (2016)Zhu et al. (2020)Carn et al. (2016); Li et al. (2017); Zhu et al. (2020)Li et al. (2017)Carn et al. (2016)Carn et al. (2016)Carn et al. (2016)Carboni et al. (2019)Schmidt et al. (2015)Gauthier et al. (2016)Carboni et al. (2019)Schmidt et al. (2015)Gauthier et al. (2016)Carn et al. (2016)Carboni et al. (2019)Gauthier et al. (2016)Carboni et al. (2019)Gauthier et al. (2016)Carn et al. (2016)Carboni et al. (2019)Gauthier et al. (2016)Carn et al. (2016)Wunderman (2014)Carboni et al. (2019)Carn et al. (2016)Carboni et al. (2019)Bègue et al. (2017); Baray et al. (2025)Venzke (2015)Pardini et al. (2018)Bègue et al. (2017)Crafford and Venzke (2016)D’Aleo et al. (2019)Marshak et al. (2018)Crafford and Venzke (2017)Marshak et al. (2018)Vasconez et al. (2018)Malinina et al. (2021)Bani et al. (2025)Crafford and Venzke (2018)Malinina et al. (2021)Bani et al. (2025)Vasconez et al. (2018)Carn et al. (2018)Malinina et al. (2021)Malinina et al. (2021); Liu et al. (2023); Bani et al. (2025)Krippner and Venzke (2019a)Krippner and Venzke (2019b)Shreve et al. (2019)Prata et al. (2020)Gouhier and Paris (2019)Corradini et al. (2021)Vernier et al. (2024)Hyman and Pavolonis (2020)Muser et al. (2020); de Leeuw et al. (2021); McKee et al. (2021a)Inness et al. (2022)Inness et al. (2022)Gorkavyi et al. (2021)Muser et al. (2020); Vernier et al. (2024)Fabris et al. (2026)Fabris et al. (2026)McKee et al. (2021b)Cotterill et al. (2024)McKee et al. (2021b)Kaneko et al. (2022)Crafford and Venzke (2020)Kaneko et al. (2022)Crafford and Venzke (2020)Kaneko et al. (2022)Crafford and Venzke (2020)Bennis and Venzke (2021)Taylor et al. (2023)Esse et al. (2023)Milford et al. (2023)Filonchyk et al. (2022)Filonchyk et al. (2022); Milford et al. (2023)Milford et al. (2023)Crafford and Venzke (2022)Sellitto et al. (2024)Sadeghi et al. (2025)Carn et al. (2022)Zhu et al. (2022)Xia et al. (2024)Zhu et al. (2022)Carn et al. (2022); Xia et al. (2024)Carn et al. (2022)Xia et al. (2024)Esse et al. (2025)Girina et al. (2023)Bennis (2023)Sennert (2024)Zeng et al. (2025)Zeng et al. (2025)Fabris et al. (2026)Fabris et al. (2026)Table 2Maximum atmospheric SO2 masses (in kt) derived from IASI observations for major volcanic eruptions between July 2007 and July 2026, along with the corresponding measurement dates. Only eruptions with SO2 masses exceeding 30 kt within 72 h of eruption onset are reported. Values in parentheses indicate the SO2 mass below and above 8 km altitude, respectively. The lower and upper bounds (in km) of the narrowest altitude range containing 75 % of the total SO2 mass, as well as the altitude of the SO2 mass peak (in parentheses), are provided. Other satellite-derived SO2 mass estimates found in the literature are listed with their corresponding references (non-exhaustive).

Figure 20 shows, for each volcano listed in Table 2, the maximum SO2 mass measured by IASI, with circle sizes proportional to the SO2 mass. It is important to note that this SO2 quantity represents the instantaneous atmospheric mass at the time of an IASI overpass. Consequently, it can differ significantly from the total SO2 mass emitted over the entire eruption event and from the daily SO2 emission fluxes often reported in the literature, which are typically derived from satellite data using specific techniques or modelling approaches (e.g., Theys et al., 2013; Carn et al., 2017; Esse et al., 2025). For many of the events listed in Table 2, the IASI-derived SO2 mass is compared with the same type of atmospheric mass estimates obtained from various satellite sensors and reported in the literature (non-exhaustive list). For each eruption, we also provide the IASI-based SO2 masses below and above 8 km altitude, the lower and upper bounds of the narrowest altitude range containing 75 % of the total SO2 mass, and the altitude of the SO2 mass peak.

Figure 20Map of major volcanic eruptions detected by IASI between July 2007 and July 2026 for which an instantaneous atmospheric SO2 mass above 30 kt was derived (see Table 2). When multiple eruptions were detected by IASI for the same volcano, only the event with the largest retrieved SO2 mass has been retained. Each circle is colour-coded according to the detected SO2 mass, with its size proportional to that mass. Map data from Earthstar Geographics (2026).
In terms of atmospheric SO2 mass, and based on our measurement criteria, three of the four largest eruptions detected by IASI originate from volcanoes in the North Pacific: Raikoke (2019; 1409 kt) and Sarychev Peak (2009; 912 kt) in the Kuril volcanic arc, and Kasatochi (2008; 1309 kt) in the Aleutian arc (Fig. 20). For each of these events, the mass estimates derived in the present work fall well within the ranges reported in previous studies based on IASI and on other IR and UV-Vis sensors (see references in Table 2). Notably, the agreement between IASI, TROPOMI, and OMPS mass estimates for Raikoke is particularly strong, with studies reporting values close to 1400 kt (Muser et al., 2020; Gorkavyi et al., 2021; de Leeuw et al., 2021; McKee et al., 2021a; Inness et al., 2022; Vernier et al., 2024).
The other major eruption in the IASI record is the 2011 Nabro event, in the Afar Rift volcanic province (Clarisse et al., 2014). In Table 2, we provide IASI-based SO2 masses for both 15 June (734 kt) and 16 June (1029 kt) 2011, due to the marked shift in the altitude range containing 75 % of the total mass. On 15 June, most of the SO2 from the initial explosive phase was located between 9 and 18 km altitude, with a mass peak at 17 km, consistent with Fromm et al. (2014). On 16 June, IASI detected a second, lower-altitude injection, which shifted the altitude band containing 75 % of the total mass downward to 5–13 km.
Another noticeable eruption is that of Calbuco in 2015 (546 kt), in the Southern Andean arc, with the bulk of the mass contained between 15 and 17 km. For this event, the SO2 mass derived is slightly higher than previous estimates (Venzke, 2015; Bègue et al., 2017; Pardini et al., 2018; Baray et al., 2025). Interestingly, the other two major eruptions detected by IASI in this region, those of Puyehue (2011; 192 kt) and Copahue (2012; 387 kt), yielded SO2 masses located at comparatively lower altitudes (9–12 km and 4–8 km, respectively) than Calbuco.
Although one of the most powerful explosive eruptions of the satellite era, the January 2022 Hunga Tonga eruption produced a modest maximum of 358 kt of atmospheric SO2 as measured by IASI. This value is significantly lower than those obtained for the largest eruptions reported in this study (Raikoke, Kasatochi, Nabro, and Sarychev Peak), but similar to the masses derived for, e.g., Ambae (2018; 336 kt), Mauna Loa (2022; 308 kt) and Copahue (2012; 387 kt). The SO2 mass retrieved in this study is consistent with estimates from other satellite sensors such as CrIS, TROPOMI, and OMPS (e.g., Carn et al., 2022; Zhu et al., 2022; Sadeghi et al., 2025), as summarized in Table 2, although some studies report significantly higher values (e.g., Xia et al., 2024; Sellitto et al., 2024). Among other factors, the difficulty of retrieval algorithms in constraining the high altitudes reached by the Hunga Tonga SO2 plume following the initial explosion contributes to the discrepancies between these mass estimates. In the present study, 75 % of the entire SO2 mass from the initial phase is contained within 17–29 km, with a mass peak at 27 km (see Fig. 8).
The dataset described in this paper is available from the Aeris data server (https://iasi.aeris-data.fr, last access: 7 August 2026) at https://doi.org/10.25326/870 (IASI/Metop-A; Clarisse and Franco, 2026a), https://doi.org/10.25326/869 (IASI/Metop-B; Clarisse and Franco, 2026b), and https://doi.org/10.25326/868 (IASI/Metop-C; Clarisse and Franco, 2026c).
In this work, we presented a new algorithm for the fast, simultaneous retrieval of atmospheric SO2 plume altitudes and column abundances from twice-daily, global IASI measurements. Building upon earlier developments, the algorithm brings together several methodological advances that provide improved performance and accuracy across a wide range of atmospheric conditions. In particular, the algorithm shows enhanced sensitivity to weak SO2 signals and low-altitude plumes, while also providing robust retrievals for dense and optically thick volcanic plumes. The best performance is achieved for plumes located above 8 km, with uncertainties gradually increasing toward the lower troposphere and in the presence of high H2O content. The retrieved SO2 altitudes show good agreement with CALIOP lidar measurements, typically within 1–2 km for fresh and moderately aged volcanic plumes. In the lower stratosphere, the algorithm tends to underestimate the altitude of slowly ascending, aged plumes. Nevertheless, the algorithm demonstrates strong capability to retrieve plume altitudes well above the tropical tropopause (up to 36 km; see Fig. 7) in the aftermath of the 2022 Hunga Tonga eruption, in good agreement with CALIOP and independent observations. Comparisons of SO2 columns with TROPOMI in fresh volcanic plumes show overall satisfactory agreement, particularly in light of the challenges associated with SO2 retrievals. Remaining discrepancies are mainly attributable to lower plume altitudes inferred from UV measurements, in particular in the presence of aerosols, and to the different vertical sensitivities of the two sensors.
Special care was taken to ensure temporal consistency and cross-platform homogeneity among the three IASI instruments, resulting in a long-term record of SO2 altitude and column measurements well suited for climatological analyses and air quality monitoring applications. We presented the full 19-year IASI time series (2007–2026) of twice-daily atmospheric SO2 masses and mass-altitude profiles. From this dataset, we also derived a catalogue of volcanic SO2 plumes with a maximum mass exceeding 30 kt, reporting for each event the maximum plume mass, the masses below and above 8 km, the altitude range containing 75 % of the total mass, and the mass peak altitude. The IASI time series reveals clear contrasts between major tropical and extratropical explosive eruptions. While the bulk of volcanic SO2 mass is typically confined below or near the regional tropopause, mid- and high-latitude Plinian eruptions can inject substantial SO2 amounts directly into the lower stratosphere. The most prominent events detected by IASI include the 2008 Kasatochi, 2009 Sarychev Peak, 2011 Nabro, and 2019 Raikoke eruptions, for which maximum SO2 plume masses in the range of 900–1400 kt were retrieved. By contrast, despite the exceptional altitude reached by its plume, the 2022 Hunga Tonga eruption produced a comparatively moderate SO2 atmospheric burden of ∼360 kt. Although not explored in this study, IASI and UV-based sensors such as TROPOMI, which is more sensitive to weak, low-altitude SO2 sources (see Sect. 3.5), are complementary and could be combined in future work to improve the detection of weak degassing volcanic and anthropogenic SO2 sources.
In addition to providing the SO2 column at the retrieved plume altitude, the algorithm also retrieves SO2 abundances assuming a set of fixed plume heights between 1 and 60 km. This enables the construction of single-pixel total column averaging kernels that are suitable for data assimilation in atmospheric models or for deriving more accurate SO2 column estimates when third-party constraints on plume altitude are available. Because of the reduced sensitivity of IASI to the lowermost atmospheric layers, a given error in the retrieved plume altitude has a substantially larger impact on the retrieved SO2 column in the lower troposphere than at higher altitudes (Fig. 12). Applying these averaging kernels together with strict external constraints on plume altitude makes it possible to reduce this altitude-induced error.
Despite the overall robustness of the SO2 retrieval algorithm, the presence of clouds and volcanic ash remains a significant source of uncertainty. Both can attenuate or alter the SO2 spectral signature, leading to systematic under- or overestimation of the SO2 abundance, depending on the retrieval approach and plume-cloud geometry. While the current algorithm partially mitigates these effects, accounting explicitly for clouds and ash within the retrieval framework is an important avenue for future development. Water vapour is another important source of interference, most notably for low-altitude tropospheric plumes in humid regions, but also, more unusually, for hydrated stratospheric plumes such as that of the 2022 Hunga Tonga eruption (Sect. 3.4).
The upcoming suite of Infrared Atmospheric Sounding Interferometers – New Generation (IASI-NG; Crevoisier et al., 2014) represents a major step forward for spaceborne IR SO2 monitoring. With the recent launch of the first IASI-NG instrument onboard Metop-SG-A1 (summer of 2025) and the availability of the first observations in 2026, the three planned IASI-NG sensors, with similar spatial resolution and sampling as IASI, are expected to ensure the long-term continuity of the IASI mission well into the coming decades. This continuity will allow the extension of volcanic SO2 monitoring and the construction of a unique, multi-decadal time series based on consistent IR satellite observations.
LC and BF conceptualized the research, analysed and interpreted the results, prepared the figures, and wrote the first version of the manuscript. LF and NT performed the TROPOMI retrievals. All authors took part in the discussions and revisions of the manuscript.
The contact author has declared that none of the authors has any competing interests.
Publisher's note: Copernicus Publications remains neutral with regard to jurisdictional claims made in the text, published maps, institutional affiliations, or any other geographical representation in this paper. The authors bear the ultimate responsibility for providing appropriate place names. Views expressed in the text are those of the authors and do not necessarily reflect the views of the publisher.
L. Clarisse is Senior Research Associate supported by the Belgian F.R.S.-FNRS. ChatGPT (OpenAI) and Claude (Anthropic) were used for language editing to improve grammar and clarity.
The research has been supported by the HIRS Prodex arrangement (ESA-BELSPO) and EUMETSAT (ACSAF). C. Clerbaux and J. Hadji-Lazaro are grateful to CNES and Centre National de la Recherche Scientifique (CNRS) for financial support. L. Fabris and N. Theys were supported by ESA and BELSPO, in particular through the CCI+ precursors for aerosol and ozone ECV project, the ATM-MPC project, and the TROPOMI-related PRODEX TRACE-S5P project.
This paper was edited by Guanyu Huang and reviewed by two anonymous referees.
Bacles, M., Améric, J., and Guidard, V.: Assimilation of volcanic sulfur dioxide products from IASI and TROPOMI into the chemical transport model MOCAGE: case study of the 2021 La Soufrière Saint Vincent eruption with the March 2022 version of MOCAGE, Atmos. Meas. Tech., 18, 2659–2680, https://doi.org/10.5194/amt-18-2659-2025, 2025. a
Bani, P., Aiuppa, A., Coppola, D., Carn, S., Cluzel, D., Rose-Koga, E., Medard, E., Nauret, F., Moussallam, Y., Tari, D., and Bani, I.: Magmatic volatiles control the sub-plinian basaltic eruptions at Ambae volcano, Vanuatu, Commun. Earth Environ., 6, 84, https://doi.org/10.1038/s43247-025-02018-5, 2025. a, b, c, d
Baray, J., Gheusi, F., Duflot, V., and Tulet, P.: Removal Processes of the Stratospheric SO2 Volcanic Plume From the 2015 Calbuco Eruption, J. Geophys. Res.-Atmos., 130, https://doi.org/10.1029/2025jd043850, 2025. a, b
Baron, A., Chazette, P., Khaykin, S., Payen, G., Marquestaut, N., Bègue, N., and Duflot, V.: Early Evolution of the Stratospheric Aerosol Plume Following the 2022 Hunga Tonga-Hunga Ha’apai Eruption: Lidar Observations From Reunion (21° S, 55° E), Geophys. Res. Lett., 50, e2022GL101751, https://doi.org/10.1029/2022gl101751, 2023. a
Bauduin, S., Clarisse, L., Clerbaux, C., Hurtmans, D., and Coheur, P.-F.: IASI observations of sulfur dioxide (SO2) in the boundary layer of Norilsk, J. Geophys. Res.-Atmos., 119, 4253–4263, https://doi.org/10.1002/2013jd021405, 2014. a
Bauduin, S., Clarisse, L., Hadji-Lazaro, J., Theys, N., Clerbaux, C., and Coheur, P.-F.: Retrieval of near-surface sulfur dioxide (SO2) concentrations at a global scale using IASI satellite observations, Atmos. Meas. Tech., 9, 721–740, https://doi.org/10.5194/amt-9-721-2016, 2016. a
Bègue, N., Vignelles, D., Berthet, G., Portafaix, T., Payen, G., Jégou, F., Benchérif, H., Jumelet, J., Vernier, J.-P., Lurton, T., Renard, J.-B., Clarisse, L., Duverger, V., Posny, F., Metzger, J.-M., and Godin-Beekmann, S.: Long-range transport of stratospheric aerosols in the Southern Hemisphere following the 2015 Calbuco eruption, Atmos. Chem. Phys., 17, 15019–15036, https://doi.org/10.5194/acp-17-15019-2017, 2017. a, b, c
Beirle, S., Hörmann, C., Penning de Vries, M., Dörner, S., Kern, C., and Wagner, T.: Estimating the volcanic emission rate and atmospheric lifetime of SO2 from space: a case study for Kīlauea volcano, Hawai`i, Atmos. Chem. Phys., 14, 8309–8322, https://doi.org/10.5194/acp-14-8309-2014, 2014. a
Bennis, K. and Venzke, E.: Global Volcanism Program, 2021. Report on Lewotolok (Indonesia), Tech. Rep. 46:2, Smithsonian Institution, https://doi.org/10.5479/si.gvp.bgvn202102-264230, 2021. a
Bennis, K. L.: Global Volcanism Program, 2023. Report on Sheveluch (Russia), Tech. Rep. 48:5, Smithsonian Institution, https://volcano.si.edu/ShowReport.cfm?doi=10.5479/si.GVP.BGVN202305-300270 (last access: 8 September 2026), 2023. a
Björnham, O., Grahn, H., von Schoenberg, P., Liljedahl, B., Waleij, A., and Brännström, N.: The 2016 Al-Mishraq sulphur plant fire: Source and health risk area estimation, Atmos. Environ., 169, 287–296, https://doi.org/10.1016/j.atmosenv.2017.09.025, 2017. a
Boichu, M., Clarisse, L., Khvorostyanov, D., and Clerbaux, C.: Improving volcanic sulfur dioxide cloud dispersal forecasts by progressive assimilation of satellite observations, Geophys. Res. Lett., 41, 2637–2643, https://doi.org/10.1002/2014gl059496, 2014. a
Boynard, A., Hurtmans, D., Garane, K., Goutail, F., Hadji-Lazaro, J., Koukouli, M. E., Wespes, C., Vigouroux, C., Keppens, A., Pommereau, J.-P., Pazmino, A., Balis, D., Loyola, D., Valks, P., Sussmann, R., Smale, D., Coheur, P.-F., and Clerbaux, C.: Validation of the IASI FORLI/EUMETSAT ozone products using satellite (GOME-2), ground-based (Brewer–Dobson, SAOZ, FTIR) and ozonesonde measurements, Atmos. Meas. Tech., 11, 5125–5152, https://doi.org/10.5194/amt-11-5125-2018, 2018. a
Brenot, H., Theys, N., Clarisse, L., van Gent, J., Hurtmans, D. R., Vandenbussche, S., Papagiannopoulos, N., Mona, L., Virtanen, T., Uppstu, A., Sofiev, M., Bugliaro, L., Vázquez-Navarro, M., Hedelt, P., Parks, M. M., Barsotti, S., Coltelli, M., Moreland, W., Scollo, S., Salerno, G., Arnold-Arias, D., Hirtl, M., Peltonen, T., Lahtinen, J., Sievers, K., Lipok, F., Rüfenacht, R., Haefele, A., Hervo, M., Wagenaar, S., Som de Cerff, W., de Laat, J., Apituley, A., Stammes, P., Laffineur, Q., Delcloo, A., Lennart, R., Rokitansky, C.-H., Vargas, A., Kerschbaum, M., Resch, C., Zopp, R., Plu, M., Peuch, V.-H., Van Roozendael, M., and Wotawa, G.: EUNADICS-AV early warning system dedicated to supporting aviation in the case of a crisis from natural airborne hazards and radionuclide clouds, Nat. Hazards Earth Syst. Sci., 21, 3367–3405, https://doi.org/10.5194/nhess-21-3367-2021, 2021. a
Bruckert, J., Hoshyaripour, G. A., Horváth, Á., Muser, L. O., Prata, F. J., Hoose, C., and Vogel, B.: Online treatment of eruption dynamics improves the volcanic ash and SO2 dispersion forecast: case of the 2019 Raikoke eruption, Atmos. Chem. Phys., 22, 3535–3552, https://doi.org/10.5194/acp-22-3535-2022, 2022. a, b, c
Carboni, E., Grainger, R., Walker, J., Dudhia, A., and Siddans, R.: A new scheme for sulphur dioxide retrieval from IASI measurements: application to the Eyjafjallajökull eruption of April and May 2010, Atmos. Chem. Phys., 12, 11417–11434, https://doi.org/10.5194/acp-12-11417-2012, 2012. a, b, c
Carboni, E., Grainger, R. G., Mather, T. A., Pyle, D. M., Thomas, G. E., Siddans, R., Smith, A. J. A., Dudhia, A., Koukouli, M. E., and Balis, D.: The vertical distribution of volcanic SO2 plumes measured by IASI, Atmos. Chem. Phys., 16, 4343–4367, https://doi.org/10.5194/acp-16-4343-2016, 2016. a, b, c, d, e, f, g, h, i, j, k, l, m, n
Carboni, E., Mather, T. A., Schmidt, A., Grainger, R. G., Pfeffer, M. A., Ialongo, I., and Theys, N.: Satellite-derived sulfur dioxide (SO2) emissions from the 2014–2015 Holuhraun eruption (Iceland), Atmos. Chem. Phys., 19, 4851–4862, https://doi.org/10.5194/acp-19-4851-2019, 2019. a, b, c, d, e, f, g, h, i
Carn, S. A., Krotkov, N. A., Yang, K., and Krueger, A. J.: Measuring global volcanic degassing with the Ozone Monitoring Instrument (OMI), Geol. Soc. Spec. Publ., 380, 229–257, https://doi.org/10.1144/SP380.12, 2013. a
Carn, S. A., Clarisse, L., and Prata, A. J.: Multi-decadal satellite measurements of global volcanic degassing, J. Volcanol. Geoth. Res., 311, 99–134, https://doi.org/10.1016/j.jvolgeores.2016.01.002, 2016. a, b, c, d, e, f, g, h, i, j, k, l, m, n, o, p, q, r, s, t, u, v, w, x, y, z, aa, ab, ac, ad, ae, af, ag, ah, ai, aj, ak, al, am, an, ao
Carn, S. A., Fioletov, V. E., McLinden, C. A., Li, C., and Krotkov, N. A.: A decade of global volcanic SO2 emissions measured from space, Sci. Rep.-UK, 7, 44095, https://doi.org/10.1038/srep44095, 2017. a, b, c
Carn, S. A., Krotkov, N. A., Fisher, B. L., Li, C., and Prata, A. J.: First Observations of Volcanic Eruption Clouds From the L1 Earth-Sun Lagrange Point by DSCOVR/EPIC, Geophys. Res. Lett., 45, 11456–11464, https://doi.org/10.1029/2018gl079808, 2018. a
Carn, S. A., Krotkov, N. A., Fisher, B. L., and Li, C.: Out of the blue: Volcanic SO2 emissions during the 2021–2022 eruptions of Hunga Tonga – Hunga Ha'apai (Tonga), Front. Earth Sci., 10, https://doi.org/10.3389/feart.2022.976962, 2022. a, b, c, d, e
Carr, J. L., Horváth, Á., Wu, D. L., and Friberg, M. D.: Stereo Plume Height and Motion Retrievals for the Record-Setting Hunga Tonga-Hunga Ha’apai Eruption of 15 January 2022, Geophys. Res. Lett., 49, e2022GL098131, https://doi.org/10.1029/2022gl098131, 2022. a
Chevallier, F.: Sampled databases of 60-level atmospheric profiles from the ECMWF analyses, Tech. rep., Eumetsat/ECMWF SAF Programme, Research Report No. 4, 2001. a
Clarisse, L. and Franco, B.: Reanalyzed bi-daily IASI/Metop-A ULB-LATMOS sulphur dioxide (SO2) L2 product (columns and altitude), Aeris [data set], https://doi.org/10.25326/870, 2026a. a, b
Clarisse, L. and Franco, B.: Reanalyzed bi-daily IASI/Metop-B ULB-LATMOS sulphur dioxide (SO2) L2 product (columns and altitude), Aeris [data set], https://doi.org/10.25326/869, 2026b. a, b
Clarisse, L. and Franco, B.: Reanalyzed bi-daily IASI/Metop-C ULB-LATMOS sulphur dioxide (SO2) L2 product (columns and altitude), Aeris [data set], https://doi.org/10.25326/868, 2026c. a, b
Clarisse, L., Coheur, P. F., Prata, A. J., Hurtmans, D., Razavi, A., Phulpin, T., Hadji-Lazaro, J., and Clerbaux, C.: Tracking and quantifying volcanic SO2 with IASI, the September 2007 eruption at Jebel at Tair, Atmos. Chem. Phys., 8, 7723–7734, https://doi.org/10.5194/acp-8-7723-2008, 2008. a, b, c
Clarisse, L., Fromm, M., Ngadi, Y., Emmons, L., Clerbaux, C., Hurtmans, D., and Coheur, P.-F.: Intercontinental transport of anthropogenic sulfur dioxide and other pollutants; an infrared remote sensing case study, Geophys. Res. Lett., 38, L19806, https://doi.org/10.1029/2011GL048976, 2011. a
Clarisse, L., Hurtmans, D., Clerbaux, C., Hadji-Lazaro, J., Ngadi, Y., and Coheur, P.-F.: Retrieval of sulphur dioxide from the infrared atmospheric sounding interferometer (IASI), Atmos. Meas. Tech., 5, 581–594, https://doi.org/10.5194/amt-5-581-2012, 2012. a, b, c, d, e, f, g, h, i, j, k, l, m, n, o
Clarisse, L., Coheur, P.-F., Theys, N., Hurtmans, D., and Clerbaux, C.: The 2011 Nabro eruption, a SO2 plume height analysis using IASI measurements, Atmos. Chem. Phys., 14, 3095–3111, https://doi.org/10.5194/acp-14-3095-2014, 2014. a, b, c, d, e, f, g
Clarisse, L., Clerbaux, C., Franco, B., Hadji-Lazaro, J., Whitburn, S., Kopp, A. K., Hurtmans, D., and Coheur, P.-F.: A Decadal Data Set of Global Atmospheric Dust Retrieved From IASI Satellite Measurements, J. Geophys. Res.-Atmos., 124, 1618–1647, https://doi.org/10.1029/2018jd029701, 2019. a
Clarisse, L., Franco, B., Van Damme, M., Di Gioacchino, T., Hadji-Lazaro, J., Whitburn, S., Noppen, L., Hurtmans, D., Clerbaux, C., and Coheur, P.: The IASI NH3 version 4 product: averaging kernels and improved consistency, Atmos. Meas. Tech., 16, 5009–5028, https://doi.org/10.5194/amt-16-5009-2023, 2023. a, b, c
Clerbaux, C., Coheur, P.-F., Clarisse, L., Hadji-Lazaro, J., Hurtmans, D., Turquety, S., Bowman, K., Worden, H., and Carn, S.: Measurements of SO2 profiles in volcanic plumes from the NASA Tropospheric Emission Spectrometer (TES), Geophys. Res. Lett., 35, L22807, https://doi.org/10.1029/2008GL035566, 2008. a, b
Clerbaux, C., Boynard, A., Clarisse, L., George, M., Hadji-Lazaro, J., Herbin, H., Hurtmans, D., Pommier, M., Razavi, A., Turquety, S., Wespes, C., and Coheur, P.-F.: Monitoring of atmospheric composition using the thermal infrared IASI/MetOp sounder, Atmos. Chem. Phys., 9, 6041–6054, https://doi.org/10.5194/acp-9-6041-2009, 2009. a, b
Coheur, P.-F., Barret, B., Turquety, S., Hurtmans, D., Hadji-Lazaro, J., and Clerbaux, C.: Retrieval and characterization of ozone vertical profiles from a thermal infrared nadir sounder, J. Geophys. Res., 110, D24303, https://doi.org/10.1029/2005JD005845, 2005. a
Corradini, S., Merucci, L., Prata, A. J., and Piscini, A.: Volcanic ash and SO2 in the 2008 Kasatochi eruption: Retrievals comparison from different IR satellite sensors, J. Geophys. Res., 115, D00L21, https://doi.org/10.1029/2009JD013634, 2010. a
Corradini, S., Guerrieri, L., Stelitano, D., Salerno, G., Scollo, S., Merucci, L., Prestifilippo, M., Musacchio, M., Silvestri, M., Lombardo, V., and Caltabiano, T.: Near Real-Time Monitoring of the Christmas 2018 Etna Eruption Using SEVIRI and Products Validation, Remote Sens.-Basel, 12, 1336, https://doi.org/10.3390/rs12081336, 2020. a
Corradini, S., Guerrieri, L., Brenot, H., Clarisse, L., Merucci, L., Pardini, F., Prata, A. J., Realmuto, V. J., Stelitano, D., and Theys, N.: Tropospheric Volcanic SO2 Mass and Flux Retrievals from Satellite. The Etna December 2018 Eruption, Remote Sens.-Basel, 13, 2225, https://doi.org/10.3390/rs13112225, 2021. a, b
Cotterill, A. S., Nicholson, E. J., Hayer, C. S. L., and Kilburn, C. R. J.: Magma recharge at Manam volcano, Papua New Guinea, identified through thermal and SO2 satellite remote sensing of open-vent emissions, B. Volcanol., 86, 87, https://doi.org/10.1007/s00445-024-01772-2, 2024. a
Crafford, A. E. and Venzke, E.: Global Volcanism Program, 2016. Report on Wolf (Ecuador), Tech. Rep. 41:10, Smithsonian Institution, https://doi.org/10.5479/si.gvp.bgvn201610-353020, 2016. a
Crafford, A. E. and Venzke, E.: Global Volcanism Program, 2017. Report on Pavlof (United States), Tech. Rep. 42:3, Smithsonian Institution, https://doi.org/10.5479/si.gvp.bgvn201703-312030, 2017. a
Crafford, A. E. and Venzke, E.: Global Volcanism Program, 2018. Report on Ambae (Vanuatu), Tech. Rep. 43:7, Smithsonian Institution, https://doi.org/10.5479/si.gvp.bgvn201807-257030, 2018. a
Crafford, A. E. and Venzke, E.: Global Volcanism Program, 2020. Report on Nishinoshima (Japan), Tech. Rep. 45:9, Smithsonian Institution, https://doi.org/10.5479/si.gvp.bgvn202009-284096, 2020. a, b, c
Crafford, A. E. and Venzke, E.: Global Volcanism Program, 2022. Report on Wolf (Ecuador), Tech. Rep. 47:5, Smithsonian Institution, https://doi.org/10.5479/si.gvp.bgvn202205-353020, 2022. a
Crevoisier, C., Clerbaux, C., Guidard, V., Phulpin, T., Armante, R., Barret, B., Camy-Peyret, C., Chaboureau, J.-P., Coheur, P.-F., Crépeau, L., Dufour, G., Labonnote, L., Lavanant, L., Hadji-Lazaro, J., Herbin, H., Jacquinet-Husson, N., Payan, S., Péquignot, E., Pierangelo, C., Sellitto, P., and Stubenrauch, C.: Towards IASI-New Generation (IASI-NG): impact of improved spectral resolution and radiometric noise on the retrieval of thermodynamic, chemistry and climate variables, Atmos. Meas. Tech., 7, 4367–4385, https://doi.org/10.5194/amt-7-4367-2014, 2014. a
Crippa, M., Guizzardi, D., Muntean, M., Schaaf, E., Dentener, F., van Aardenne, J. A., Monni, S., Doering, U., Olivier, J. G. J., Pagliari, V., and Janssens-Maenhout, G.: Gridded emissions of air pollutants for the period 1970–2012 within EDGAR v4.3.2, Earth Syst. Sci. Data, 10, 1987–2013, https://doi.org/10.5194/essd-10-1987-2018, 2018. a, b
de Leeuw, J., Schmidt, A., Witham, C. S., Theys, N., Taylor, I. A., Grainger, R. G., Pope, R. J., Haywood, J., Osborne, M., and Kristiansen, N. I.: The 2019 Raikoke volcanic eruption – Part 1: Dispersion model simulations and satellite retrievals of volcanic sulfur dioxide, Atmos. Chem. Phys., 21, 10851–10879, https://doi.org/10.5194/acp-21-10851-2021, 2021. a, b, c
Di Gioacchino, T., Clarisse, L., Noppen, L., Van Damme, M., Bauduin, S., and Coheur, P.: Spatial and Temporal Variations of Thermal Contrast in the Planetary Boundary Layer, J. Remote Sens., 28, 0142, https://doi.org/10.34133/remotesensing.0142, 2024. a
D’Aleo, R., Bitetto, M., Delle Donne, D., Coltelli, M., Coppola, D., McCormick Kilbride, B., Pecora, E., Ripepe, M., Salem, L. C., Tamburello, G., and Aiuppa, A.: Understanding the SO2 Degassing Budget of Mt Etna’s Paroxysms: First Clues From the December 2015 Sequence, Front. Earth Sci., 6, https://doi.org/10.3389/feart.2018.00239, 2019. a, b
Eaton, A. R. V., Amigo, Á., Bertin, D., Mastin, L. G., Giacosa, R. E., González, J., Valderrama, O., Fontijn, K., and Behnke, S. A.: Volcanic lightning and plume behavior reveal evolving hazards during the April 2015 eruption of Calbuco volcano, Chile, Geophys. Res. Lett., 43, 3563–3571, https://doi.org/10.1002/2016gl068076, 2016. a
Eckhardt, S., Prata, A. J., Seibert, P., Stebel, K., and Stohl, A.: Estimation of the vertical profile of sulfur dioxide injection into the atmosphere by a volcanic eruption using satellite column measurements and inverse transport modeling, Atmos. Chem. Phys., 8, 3881–3897, https://doi.org/10.5194/acp-8-3881-2008, 2008. a, b, c
Esse, B., Burton, M., Hayer, C., Contreras-Arratia, R., Christopher, T., Joseph, E. P., Varnam, M., and Johnson, C.: SO2 emissions during the 2021 eruption of La Soufrière, St Vincent, revealed with back-trajectory analysis of TROPOMI imagery, Geol. Soc. London Spec. Publ., 539, 231–244, https://doi.org/10.1144/sp539-2022-77, 2023. a
Esse, B., Burton, M., Brenot, H., and Theys, N.: Insights into eruption dynamics from TROPOMI/PlumeTraj-derived SO2 emissions during the 2022 eruption of Mauna Loa, Hawaii, B. Volcanol., 87, 69, https://doi.org/10.1007/s00445-025-01839-8, 2025. a, b
EUMETSAT: Product User Guide: IASI Level 2 TS, T, Q, European Organisation for the Exploitation of Meteorological Satellites, Darmstadt, Germany, release 1.1 edn., https://user.eumetsat.int/s3/eup-strapi-media/Product_User_Guide_IASI_level2_TS_T_Q_bb33631ebf.pdf (last access: 2 February 2026), 2022. a
Fabris, L., Theys, N., Clarisse, L., Franco, B., Vlietinck, J., Yu, H., Brenot, H., Danckaert, T., Hedelt, P., and Van Roozendael, M.: Enhanced characterization of SO2 plume height and column density using the second UV spectral band of TROPOMI, Atmos. Meas. Tech., 19, 1801–1824, https://doi.org/10.5194/amt-19-1801-2026, 2026. a, b, c, d, e
Fadnavis, S., Müller, R., Kalita, G., Rowlinson, M., Rap, A., Li, J.-L. F., Gasparini, B., and Laakso, A.: The impact of recent changes in Asian anthropogenic emissions of SO2 on sulfate loading in the upper troposphere and lower stratosphere and the associated radiative changes, Atmos. Chem. Phys., 19, 9989–10008, https://doi.org/10.5194/acp-19-9989-2019, 2019. a
Fedkin, N. M., Li, C., Krotkov, N. A., Hedelt, P., Loyola, D. G., Dickerson, R. R., and Spurr, R.: Volcanic SO2 effective layer height retrieval for the Ozone Monitoring Instrument (OMI) using a machine-learning approach, Atmos. Meas. Tech., 14, 3673–3691, https://doi.org/10.5194/amt-14-3673-2021, 2021. a
Ferguson, D. J., Barnie, T. D., Pyle, D. M., Oppenheimer, C., Yirgu, G., Lewi, E., Kidane, T., Carn, S., and Hamling, I.: Recent rift-related volcanism in Afar, Ethiopia, Earth Planet. Sc. Lett., 292, 409–418, https://doi.org/10.1016/j.epsl.2010.02.010, 2010. a
Filonchyk, M., Peterson, M. P., Gusev, A., Hu, F., Yan, H., and Zhou, L.: Measuring air pollution from the 2021 Canary Islands volcanic eruption, Sci. Total Environ., 849, 157827, https://doi.org/10.1016/j.scitotenv.2022.157827, 2022. a, b
Fioletov, V. E., McLinden, C. A., Krotkov, N., Yang, K., Loyola, D. G., Valks, P., Theys, N., Van Roozendael, M., Nowlan, C. R., Chance, K., Liu, X., Lee, C., and Martin, R. V.: Application of OMI, SCIAMACHY, and GOME-2 satellite SO2 retrievals for detection of large emission sources, J. Geophys. Res.-Atmos., 118, 11399–11418, https://doi.org/10.1002/jgrd.50826, 2013. a
Fioletov, V. E., McLinden, C. A., Krotkov, N., and Li, C.: Lifetimes and emissions of SO2 from point sources estimated from OMI, Geophys. Res. Lett., 42, 1969–1976, https://doi.org/10.1002/2015gl063148, 2015. a
Fioletov, V. E., McLinden, C. A., Griffin, D., Abboud, I., Krotkov, N., Leonard, P. J. T., Li, C., Joiner, J., Theys, N., and Carn, S.: Version 2 of the global catalogue of large anthropogenic and volcanic SO2 sources and emissions derived from satellite measurements, Earth Syst. Sci. Data, 15, 75–93, https://doi.org/10.5194/essd-15-75-2023, 2023. a, b, c, d, e, f, g
Fischer, T. P., Arellano, S., Carn, S., Aiuppa, A., Galle, B., Allard, P., Lopez, T., Shinohara, H., Kelly, P., Werner, C., Cardellini, C., and Chiodini, G.: The emissions of CO2 and other volatiles from the world’s subaerial volcanoes, Sci. Rep.-UK, 9, 18716, https://doi.org/10.1038/s41598-019-54682-1, 2019. a
Fisher, B. L., Krotkov, N. A., Bhartia, P. K., Li, C., Carn, S. A., Hughes, E., and Leonard, P. J. T.: A new discrete wavelength backscattered ultraviolet algorithm for consistent volcanic SO2 retrievals from multiple satellite missions, Atmos. Meas. Tech., 12, 5137–5153, https://doi.org/10.5194/amt-12-5137-2019, 2019. a
Fowler, D., Pilegaard, K., Sutton, M. A., Ambus, P., Raivonen, M., Duyzer, J., Simpson, D., Fagerli, H., Fuzzi, S., Schjoerring, J. K., Granier, C., Neftel, A., Isaksen, I. S. A., Laj, P., Maione, M., Monks, P. S., Burkhardt, J., Daemmgen, U., Neirynck, J., Personne, E., Wichink-Kruit, R., Butterbach-Bahl, K., Flechard, C., Tuovinen, J. P., Coyle, M., Gerosa, G., Loubet, B., Altimir, N., Gruenhage, L., Ammann, C., Cieslik, S., Paoletti, E., Mikkelsen, T. N., Ro-Poulsen, H., Cellier, P., Cape, J. N., Horváth, L., Loreto, F., Niinemets, Ü., Palmer, P. I., Rinne, J., Misztal, P., Nemitz, E., Nilsson, D., Pryor, S., Gallagher, M. W., Vesala, T., Skiba, U., Brüggemann, N., Zechmeister-Boltenstern, S., Williams, J., O'Dowd, C., Facchini, M. C., de Leeuw, G., Flossman, A., Chaumerliac, N., and Erisman, J. W.: Atmospheric composition change: Ecosystems–Atmosphere interactions, Atmos. Environ., 43, 5193–5267, https://doi.org/10.1016/j.atmosenv.2009.07.068, 2009. a
Franco, B., Clarisse, L., Stavrakou, T., Müller, J.-F., Van Damme, M., Whitburn, S., Hadji-Lazaro, J., Hurtmans, D., Taraborrelli, D., Clerbaux, C., and Coheur, P.-F.: A General Framework for Global Retrievals of Trace Gases From IASI: Application to Methanol, Formic Acid, and PAN, J. Geophys. Res.-Atmos., 123, 13963–13984, https://doi.org/10.1029/2018jd029633, 2018. a
Fromm, M., Kablick, G., Nedoluha, G., Carboni, E., Grainger, R., Campbell, J., and Lewis, J.: Correcting the record of volcanic stratospheric aerosol impact: Nabro and Sarychev Peak, J. Geophys. Res.-Atmos., 119, 10343–10364, https://doi.org/10.1002/2014JD021507, 2014. a
Fromm, M. D., Kablick, G. P., Taylor, I. A., Grainger, R. G., Seftor, C., Welton, E. J., and Fochesatto, J.: Raikoke Volcanic Sulfate/SO2 Anticyclonic Contained Circulations: In Situ Proof, Morphology, and Radiative Signature, J. Geophys. Res.-Atmos., 130, e2024JD041653, https://doi.org/10.1029/2024jd041653, 2025. a
Gauthier, P.-J., Sigmarsson, O., Gouhier, M., Haddadi, B., and Moune, S.: Elevated gas flux and trace metal degassing from the 2014–2015 fissure eruption at the Bárðarbunga volcanic system, Iceland, J. Geophys. Res.-Sol. Ea., 121, 1610–1630, https://doi.org/10.1002/2015jb012111, 2016. a, b, c, d, e, f
Ge, C., Wang, J., Carn, S., Yang, K., Ginoux, P., and Krotkov, N.: Satellite-based global volcanic SO2 emissions and sulfate direct radiative forcing during 2005–2012, J. Geophys. Res.-Atmos., 121, 3446–3464, https://doi.org/10.1002/2015jd023134, 2016. a, b
Giammanco, S., Salerno, G., La Spina, A., Bonfanti, P., Caltabiano, T., Maugeri, S. R., Murè, F., and Principato, P.: Tracing Magma Migration at Mt. Etna Volcano during 2006–2020, Coupling Remote Sensing of Crater Gas Emissions and Ground Measurement of Soil Gases, Remote Sens.-Basel, 16, 1122, https://doi.org/10.3390/rs16071122, 2024. a
Girina, O. A., Loupian, E. A., Horvath, A., Melnikov, D. V., Manevich, A. G., Nuzhdaev, A. A., Bril, A. A., Ozerov, A. Y., Kramareva, L. S., and Sorokin, A. A.: Analysis of the Development of the Paroxysmal Eruption of the Sheveluch Volcano on April 10–13, 2023, Based on Data from Various Satellite Systems, Cosmic Res.+, 61, S182–S187, https://doi.org/10.1134/s0010952523700533, 2023. a
Gorkavyi, N., Krotkov, N., Li, C., Lait, L., Colarco, P., Carn, S., DeLand, M., Newman, P., Schoeberl, M., Taha, G., Torres, O., Vasilkov, A., and Joiner, J.: Tracking aerosols and SO2 clouds from the Raikoke eruption: 3D view from satellite observations, Atmos. Meas. Tech., 14, 7545–7563, https://doi.org/10.5194/amt-14-7545-2021, 2021. a, b
Gouhier, M. and Paris, R.: SO2 and tephra emissions during the December 22, 2018 Anak Krakatau eruption, Volcanica, 2, 91–103, https://doi.org/10.30909/vol.02.02.91103, 2019. a
Guizzardi, D., Crippa, M., Butler, T., Keating, T., Wu, R., Kaminski, J., Kuenen, J., Kurokawa, J., Chatani, S., Morikawa, T., Pouliot, G., Racine, J., Moran, M. D., Klimont, Z., Manseau, P. M., Mashayekhi, R., Henderson, B. H., Smith, S. J., Hoesly, R., Muntean, M., Banja, M., Schaaf, E., Pagani, F., Woo, J.-H., Kim, J., Pisoni, E., Zhang, J., Niemi, D., Sassi, M., Duhamel, A., Ansari, T., Foley, K., Geng, G., Chen, Y., and Zhang, Q.: The HTAP_v3.2 emission mosaic: merging regional and global monthly emissions (2000–2020) to support air quality modelling and policies, Earth Syst. Sci. Data, 17, 5915–5950, https://doi.org/10.5194/essd-17-5915-2025, 2025. a
Gupta, A. K., Bennartz, R., Fauria, K. E., and Mittal, T.: Eruption chronology of the December 2021 to January 2022 Hunga Tonga-Hunga Ha’apai eruption sequence, Commun. Earth Environ., 3, 314, https://doi.org/10.1038/s43247-022-00606-3, 2022. a
Haywood, J. M., Jones, A., Clarisse, L., Bourassa, A., Barnes, J., Telford, P., Bellouin, N., Boucher, O., Agnew, P., Clerbaux, C., Coheur, P., Degenstein, D., and Braesicke, P.: Observations of the eruption of the Sarychev volcano and simulations using the HadGEM2 climate model, J. Geophys. Res., 115, D21212, https://doi.org/10.1029/2010JD014447, 2010. a
Hedelt, P., Efremenko, D. S., Loyola, D. G., Spurr, R., and Clarisse, L.: Sulfur dioxide layer height retrieval from Sentinel-5 Precursor/TROPOMI using FP_ILM, Atmos. Meas. Tech., 12, 5503–5517, https://doi.org/10.5194/amt-12-5503-2019, 2019. a, b
Hersbach, H., Bell, B., Berrisford, P., Hirahara, S., Horányi, A., Muñoz-Sabater, J., Nicolas, J., Peubey, C., Radu, R., Schepers, D., Simmons, A., Soci, C., Abdalla, S., Abellan, X., Balsamo, G., Bechtold, P., Biavati, G., Bidlot, J., Bonavita, M., Chiara, G., Dahlgren, P., Dee, D., Diamantakis, M., Dragani, R., Flemming, J., Forbes, R., Fuentes, M., Geer, A., Haimberger, L., Healy, S., Hogan, R. J., Hólm, E., Janisková, M., Keeley, S., Laloyaux, P., Lopez, P., Lupu, C., Radnoti, G., Rosnay, P., Rozum, I., Vamborg, F., Villaume, S., and Thépaut, J.-N.: The ERA5 global reanalysis, Q. J. Roy. Meteor. Soc., 146, 1999–2049, https://doi.org/10.1002/qj.3803, 2020. a, b
Horváth, Á., Girina, O. A., Carr, J. L., Wu, D. L., Bril, A. A., Mazurov, A. A., Melnikov, D. V., Hoshyaripour, G. A., and Buehler, S. A.: Geometric estimation of volcanic eruption column height from GOES-R near-limb imagery – Part 2: Case studies, Atmos. Chem. Phys., 21, 12207–12226, https://doi.org/10.5194/acp-21-12207-2021, 2021. a, b
Hyman, D. M. and Pavolonis, M. J.: Probabilistic retrieval of volcanic SO2 layer height and partial column density using the Cross-track Infrared Sounder (CrIS), Atmos. Meas. Tech., 13, 5891–5921, https://doi.org/10.5194/amt-13-5891-2020, 2020. a, b, c
Inness, A., Ades, M., Balis, D., Efremenko, D., Flemming, J., Hedelt, P., Koukouli, M.-E., Loyola, D., and Ribas, R.: Evaluating the assimilation of S5P/TROPOMI near real-time SO2 columns and layer height data into the CAMS integrated forecasting system (CY47R1), based on a case study of the 2019 Raikoke eruption, Geosci. Model Dev., 15, 971–994, https://doi.org/10.5194/gmd-15-971-2022, 2022. a, b, c, d
Jégou, F., Berthet, G., Brogniez, C., Renard, J.-B., François, P., Haywood, J. M., Jones, A., Bourgeois, Q., Lurton, T., Auriol, F., Godin-Beekmann, S., Guimbaud, C., Krysztofiak, G., Gaubicher, B., Chartier, M., Clarisse, L., Clerbaux, C., Balois, J. Y., Verwaerde, C., and Daugeron, D.: Stratospheric aerosols from the Sarychev volcano eruption in the 2009 Arctic summer, Atmos. Chem. Phys., 13, 6533–6552, https://doi.org/10.5194/acp-13-6533-2013, 2013. a
Kaneko, T., Maeno, F., Ichihara, M., Yasuda, A., Ohminato, T., Nogami, K., Nakada, S., Honda, Y., and Murakami, H.: Episode 4 (2019–2020) Nishinoshima activity: abrupt transitions in the eruptive style observed by image datasets from multiple satellites, Earth Planets Space, 74, 34, https://doi.org/10.1186/s40623-022-01578-6, 2022. a, b, c, d
Karagulian, F., Clarisse, L., Clerbaux, C., Prata, A. J., Hurtmans, D., and Coheur, P. F.: Detection of volcanic SO2, ash and H2SO4 using the IASI sounder, J. Geophys. Res., 115, D00L02, https://doi.org/10.1029/2009JD012786, 2010. a, b
Khaykin, S. M., de Laat, A. T. J., Godin-Beekmann, S., Hauchecorne, A., and Ratynski, M.: Unexpected self-lofting and dynamical confinement of volcanic plumes: the Raikoke 2019 case, Sci. Rep.-UK, 12, 22409, https://doi.org/10.1038/s41598-022-27021-0, 2022. a, b
Kim, M.-H., Omar, A. H., Tackett, J. L., Vaughan, M. A., Winker, D. M., Trepte, C. R., Hu, Y., Liu, Z., Poole, L. R., Pitts, M. C., Kar, J., and Magill, B. E.: The CALIPSO version 4 automated aerosol classification and lidar ratio selection algorithm, Atmos. Meas. Tech., 11, 6107–6135, https://doi.org/10.5194/amt-11-6107-2018, 2018. a
Kloss, C., Berthet, G., Sellitto, P., Ploeger, F., Taha, G., Tidiga, M., Eremenko, M., Bossolasco, A., Jégou, F., Renard, J.-B., and Legras, B.: Stratospheric aerosol layer perturbation caused by the 2019 Raikoke and Ulawun eruptions and their radiative forcing, Atmos. Chem. Phys., 21, 535–560, https://doi.org/10.5194/acp-21-535-2021, 2021. a
Kremser, S., Thomason, L. W., von Hobe, M., Hermann, M., Deshler, T., Timmreck, C., Toohey, M., Stenke, A., Schwarz, J. P., Weigel, R., Fueglistaler, S., Prata, F. J., Vernier, J.-P., Schlager, H., Barnes, J. E., Antuña-Marrero, J.-C., Fairlie, D., Palm, M., Mahieu, E., Notholt, J., Rex, M., Bingen, C., Vanhellemont, F., Bourassa, A., Plane, J. M. C., Klocke, D., Carn, S. A., Clarisse, L., Trickl, T., Neely, R., James, A. D., Rieger, L., Wilson, J. C., and Meland, B.: Stratospheric aerosol-Observations, processes, and impact on climate: Stratospheric Aerosol, Rev. Geophys., 54, 278–335, https://doi.org/10.1002/2015rg000511, 2016. a, b
Krippner, J. B. and Venzke, E.: Global Volcanism Program, 2019. Report on Ambae (Vanuatu), Tech. Rep. 44:2, Smithsonian Institution, https://doi.org/10.5479/si.gvp.bgvn201902-257030, 2019a. a
Krippner, J. B. and Venzke, E.: Global Volcanism Program, 2019. Report on Ambrym (Vanuatu), Tech. Rep. 44:1, Smithsonian Institution, https://doi.org/10.5479/si.gvp.bgvn201901-257040, 2019b. a
Krotkov, N., Schoeberl, M., Morris, G., Carn, S., and Yang, K.: Dispersion and lifetime of the SO2 cloud from the August 2008 Kasatochi eruption, J. Geophys. Res., 115, D00L20, https://doi.org/10.1029/2010JD013984, 2010. a, b
Krotkov, N., Realmuto, V., Li, C., Seftor, C., Li, J., Brentzel, K., Stuefer, M., Cable, J., Dierking, C., Delamere, J., Schneider, D., Tamminen, J., Hassinen, S., Ryyppö, T., Murray, J., Carn, S., Osiensky, J., Eckstein, N., Layne, G., and Kirkendall, J.: Day–Night Monitoring of Volcanic SO2 and Ash Clouds for Aviation Avoidance at Northern Polar Latitudes, Remote Sens.-Basel, 13, 4003, https://doi.org/10.3390/rs13194003, 2021. a
Krotkov, N. A., McLinden, C. A., Li, C., Lamsal, L. N., Celarier, E. A., Marchenko, S. V., Swartz, W. H., Bucsela, E. J., Joiner, J., Duncan, B. N., Boersma, K. F., Veefkind, J. P., Levelt, P. F., Fioletov, V. E., Dickerson, R. R., He, H., Lu, Z., and Streets, D. G.: Aura OMI observations of regional SO2 and NO2 pollution changes from 2005 to 2015, Atmos. Chem. Phys., 16, 4605–4629, https://doi.org/10.5194/acp-16-4605-2016, 2016. a
Krueger, A. J.: Sighting of El Chichón Sulfur Dioxide Clouds with the Nimbus 7 Total Ozone Mapping Spectrometer, Science, 220, 1377–1379, https://doi.org/10.1126/science.220.4604.1377, 1983. a
Krueger, A. J., Walter, L. S., Bhartia, P. K., Schnetzler, C. C., Krotkov, N. A., Sprod, I., and Bluth, G. J. S.: Volcanic sulfur dioxide measurements from the total ozone mapping spectrometer instruments, J. Geophys. Res.-Atmos., 100, 14057–14076, https://doi.org/10.1029/95jd01222, 1995. a
Legras, B., Duchamp, C., Sellitto, P., Podglajen, A., Carboni, E., Siddans, R., Grooß, J.-U., Khaykin, S., and Ploeger, F.: The evolution and dynamics of the Hunga Tonga–Hunga Ha'apai sulfate aerosol plume in the stratosphere, Atmos. Chem. Phys., 22, 14957–14970, https://doi.org/10.5194/acp-22-14957-2022, 2022. a
Lelieveld, J., Evans, J. S., Fnais, M., Giannadaki, D., and Pozzer, A.: The contribution of outdoor air pollution sources to premature mortality on a global scale, Nature, 525, 367–371, https://doi.org/10.1038/nature15371, 2015. a
Li, C., Krotkov, N. A., Carn, S., Zhang, Y., Spurr, R. J. D., and Joiner, J.: New-generation NASA Aura Ozone Monitoring Instrument (OMI) volcanic SO2 dataset: algorithm description, initial results, and continuation with the Suomi-NPP Ozone Mapping and Profiler Suite (OMPS), Atmos. Meas. Tech., 10, 445–458, https://doi.org/10.5194/amt-10-445-2017, 2017. a, b, c
Li, C., Krotkov, N. A., Leonard, P. J. T., Carn, S., Joiner, J., Spurr, R. J. D., and Vasilkov, A.: Version 2 Ozone Monitoring Instrument SO2 product (OMSO2 V2): new anthropogenic SO2 vertical column density dataset, Atmos. Meas. Tech., 13, 6175–6191, https://doi.org/10.5194/amt-13-6175-2020, 2020. a
Li, C., Krotkov, N. A., Joiner, J., Fioletov, V., McLinden, C., Griffin, D., Leonard, P. J. T., Carn, S., Seftor, C., and Vasilkov, A.: Version 1 NOAA-20/OMPS Nadir Mapper total column SO2 product: continuation of NASA long-term global data record, Earth Syst. Sci. Data, 16, 4291–4309, https://doi.org/10.5194/essd-16-4291-2024, 2024. a
Li, Q., Qian, Y., Luo, Y., Cao, L., Zhou, H., Yang, T., Si, F., and Liu, W.: Diffusion Height and Order of Sulfur Dioxide and Bromine Monoxide Plumes from the Hunga Tonga–Hunga Ha’apai Volcanic Eruption, Remote Sens.-Basel, 15, 1534, https://doi.org/10.3390/rs15061534, 2023. a
Liu, M., Hoffmann, L., Griessbach, S., Cai, Z., Heng, Y., and Wu, X.: Improved representation of volcanic sulfur dioxide depletion in Lagrangian transport simulations: a case study with MPTRAC v2.4, Geosci. Model Dev., 16, 5197–5217, https://doi.org/10.5194/gmd-16-5197-2023, 2023. a
Lopez, T., Carn, S., Werner, C., Fee, D., Kelly, P., Doukas, M., Pfeffer, M., Webley, P., Cahill, C., and Schneider, D.: Evaluation of Redoubt Volcano's sulfur dioxide emissions by the Ozone Monitoring Instrument, J. Volcanol. Geoth. Res., 259, 290–307, https://doi.org/10.1016/j.jvolgeores.2012.03.002, 2013. a, b
Malavelle, F. F., Haywood, J. M., Jones, A., Gettelman, A., Clarisse, L., Bauduin, S., Allan, R. P., Karset, I. H. H., Kristjánsson, J. E., Oreopoulos, L., Cho, N., Lee, D., Bellouin, N., Boucher, O., Grosvenor, D. P., Carslaw, K. S., Dhomse, S., Mann, G. W., Schmidt, A., Coe, H., Hartley, M. E., Dalvi, M., Hill, A. A., Johnson, B. T., Johnson, C. E., Knight, J. R., O'Connor, F. M., Partridge, D. G., Stier, P., Myhre, G., Platnick, S., Stephens, G. L., Takahashi, H., and Thordarson, T.: Strong constraints on aerosol–cloud interactions from volcanic eruptions, Nature, 546, 485–491, https://doi.org/10.1038/nature22974, 2017. a
Malinina, E., Rozanov, A., Niemeier, U., Wallis, S., Arosio, C., Wrana, F., Timmreck, C., von Savigny, C., and Burrows, J. P.: Changes in stratospheric aerosol extinction coefficient after the 2018 Ambae eruption as seen by OMPS-LP and MAECHAM5-HAM, Atmos. Chem. Phys., 21, 14871–14891, https://doi.org/10.5194/acp-21-14871-2021, 2021. a, b, c, d
Manolakis, D. G., Lockwood, R. B., and Cooley, T. W.: Hyperspectral imaging remote sensing, Cambridge University Press, Cambridge, ISBN 978-1107083660, 2016. a
Marshak, A., Herman, J., Adam, S., Karin, B., Carn, S., Cede, A., Geogdzhayev, I., Huang, D., Huang, L.-K., Knyazikhin, Y., Kowalewski, M., Krotkov, N., Lyapustin, A., McPeters, R., Meyer, K. G., Torres, O., and Yang, Y.: Earth Observations from DSCOVR EPIC Instrument, B. Am. Meteorol. Soc., 99, 1829–1850, https://doi.org/10.1175/bams-d-17-0223.1, 2018. a, b
McKee, K., Smith, C. M., Reath, K., Snee, E., Maher, S., Matoza, R. S., Carn, S., Mastin, L., Anderson, K., Damby, D., Roman, D. C., Degterev, A., Rybin, A., Chibisova, M., Assink, J. D., de Negri Leiva, R., and Perttu, A.: Evaluating the state-of-the-art in remote volcanic eruption characterization Part I: Raikoke volcano, Kuril Islands, J. Volcanol. Geoth. Res., 419, 107354, https://doi.org/10.1016/j.jvolgeores.2021.107354, 2021a. a, b, c
McKee, K., Smith, C. M., Reath, K., Snee, E., Maher, S., Matoza, R. S., Carn, S., Roman, D. C., Mastin, L., Anderson, K., Damby, D., Itikarai, I., Mulina, K., Saunders, S., Assink, J. D., de Negri Leiva, R., and Perttu, A.: Evaluating the state-of-the-art in remote volcanic eruption characterization Part II: Ulawun volcano, Papua New Guinea, J. Volcanol. Geoth. Res., 420, 107381, https://doi.org/10.1016/j.jvolgeores.2021.107381, 2021b. a, b, c
McLinden, C. A., Fioletov, V., Shephard, M. W., Krotkov, N., Li, C., Martin, R. V., Moran, M. D., and Joiner, J.: Space-based detection of missing sulfur dioxide sources of global air pollution, Nat. Geosci., 9, 496–500, https://doi.org/10.1038/ngeo2724, 2016. a
Milford, C., Torres, C., Vilches, J., Gossman, A.-K., Weis, F., Suárez-Molina, D., García, O. E., Prats, N., Barreto, Á., García, R. D., Bustos, J. J., Marrero, C. L., Ramos, R., Chinea, N., Boulesteix, T., Taquet, N., Rodríguez, S., López-Darias, J., Sicard, M., Córdoba-Jabonero, C., and Cuevas, E.: Impact of the 2021 La Palma volcanic eruption on air quality: Insights from a multidisciplinary approach, Sci. Total Environ., 869, 161652, https://doi.org/10.1016/j.scitotenv.2023.161652, 2023. a, b, c
Millán, L., Santee, M. L., Lambert, A., Livesey, N. J., Werner, F., Schwartz, M. J., Pumphrey, H. C., Manney, G. L., Wang, Y., Su, H., Wu, L., Read, W. G., and Froidevaux, L.: The Hunga Tonga-Hunga Ha’apai Hydration of the Stratosphere, Geophys. Res. Lett., 49, https://doi.org/10.1029/2022gl099381, 2022. a
Moxnes, E. D., Kristiansen, N. I., Stohl, A., Clarisse, L., Durant, A., Weber, K., and Vogel, A.: Separation of ash and sulfur dioxide during the 2011 Grímsvötn eruption, J. Geophys. Res.-Atmos., 119, 7477–7501, https://doi.org/10.1002/2013JD021129, 2014. a
Muser, L. O., Hoshyaripour, G. A., Bruckert, J., Horváth, Á., Malinina, E., Wallis, S., Prata, F. J., Rozanov, A., von Savigny, C., Vogel, H., and Vogel, B.: Particle aging and aerosol–radiation interaction affect volcanic plume dispersion: evidence from the Raikoke 2019 eruption, Atmos. Chem. Phys., 20, 15015–15036, https://doi.org/10.5194/acp-20-15015-2020, 2020. a, b, c, d
Noppen, L., Clarisse, L., Tack, F., Ruhtz, T., Van Damme, M., Van Roozendael, M., Schuettemeyer, D., and Coheur, P.: Towards a low-resolution infrared sounder for monitoring atmospheric ammonia (NH3) at high spatial resolution, Atmos. Meas. Tech., 18, 4183–4205, https://doi.org/10.5194/amt-18-4183-2025, 2025. a
Nowlan, C. R., Liu, X., Chance, K., Cai, Z., Kurosu, T. P., Lee, C., and Martin, R. V.: Retrievals of sulfur dioxide from the Global Ozone Monitoring Experiment 2 (GOME-2) using an optimal estimation approach: Algorithm and initial validation, J. Geophys. Res., 116, D18301, https://doi.org/10.1029/2011JD015808, 2011. a
Pardini, F., Burton, M., Arzilli, F., Spina, G. L., and Polacci, M.: SO2 emissions, plume heights and magmatic processes inferred from satellite data: The 2015 Calbuco eruptions, J. Volcanol. Geoth. Res., 361, 12–24, https://doi.org/10.1016/j.jvolgeores.2018.08.001, 2018. a, b, c
Pedersen, G., Höskuldsson, A., Dürig, T., Thordarson, T., Jónsdóttir, I., Riishuus, M., Óskarsson, B., Dumont, S., Magnusson, E., Gudmundsson, M., Sigmundsson, F., Drouin, V., Gallagher, C., Askew, R., Gudnason, J., Moreland, W., Nikkola, P., Reynolds, H., and Schmith, J.: Lava field evolution and emplacement dynamics of the 2014–2015 basaltic fissure eruption at Holuhraun, Iceland, J. Volcanol. Geoth. Res., 340, 155–169, https://doi.org/10.1016/j.jvolgeores.2017.02.027, 2017. a
Prata, A. and Bernardo, C.: Retrieval of volcanic SO2 column abundance from Atmospheric Infrared Sounder data, J. Geophys. Res., 112, D20204, https://doi.org/10.1029/2006JD007955, 2007. a, b
Prata, A., Gangale, G., Clarisse, L., and Karagulian, F.: Ash and sulfur dioxide in the 2008 eruptions of Okmok and Kasatochi: Insights from high spectral resolution satellite measurements, J. Geophys. Res., 115, D00L18, https://doi.org/10.1029/2009JD013556, 2010. a, b
Prata, A. T., Folch, A., Prata, A. J., Biondi, R., Brenot, H., Cimarelli, C., Corradini, S., Lapierre, J., and Costa, A.: Anak Krakatau triggers volcanic freezer in the upper troposphere, Sci. Rep.-UK, 10, 3584, https://doi.org/10.1038/s41598-020-60465-w, 2020. a
Prata, F., Woodhouse, M., Huppert, H. E., Prata, A., Thordarson, T., and Carn, S.: Atmospheric processes affecting the separation of volcanic ash and SO2 in volcanic eruptions: inferences from the May 2011 Grímsvötn eruption, Atmos. Chem. Phys., 17, 10709–10732, https://doi.org/10.5194/acp-17-10709-2017, 2017. a, b, c, d, e, f, g
Pugnaghi, S., Guerrieri, L., Corradini, S., and Merucci, L.: Real time retrieval of volcanic cloud particles and SO2 by satellite using an improved simplified approach, Atmos. Meas. Tech., 9, 3053–3062, https://doi.org/10.5194/amt-9-3053-2016, 2016. a
Qu, Z., Henze, D. K., Worden, H. M., Jiang, Z., Gaubert, B., Theys, N., and Wang, W.: Sector-Based Top-Down Estimates of NOx, SO2, and CO Emissions in East Asia, Geophys. Res. Lett., 49, e2021GL096009, https://doi.org/10.1029/2021gl096009, 2022. a
Richter, A., Wittrock, F., Schönhardt, A., and Burrows, J.: Quantifying volcanic SO2 emissions using GOME-2 measurements, in: EGU General Assembly 2009, EGU2009-7679, http://meetingorganizer.copernicus.org/EGU2009/EGU2009-7679.pdf (last access: 25 February 2026), 2009. a
Rix, M., Valks, P., Hao, N., Loyola, D., Schlager, H., Huntrieser, H., Flemming, J., Koehler, U., Schumann, U., and Inness, A.: Volcanic SO2, BrO and plume height estimations using GOME-2 satellite measurements during the eruption of Eyjafjallajökull in May 2010, J. Geophys. Res., 117, D00U19, https://doi.org/10.1029/2011JD016718, 2012. a, b
Robock, A.: Volcanic eruptions and climate, Rev. Geophys., 38, 191–219, https://doi.org/10.1029/1998RG000054, 2000. a, b
Romero, J. E., Morgavi, D., Arzilli, F., Daga, R., Caselli, A., Reckziegel, F., Viramonte, J., Díaz-Alvaradoa, J., Polaccic, M., Burton, M., and Perugini, D.: Eruption dynamics of the 22–23 April 2015 Calbuco Volcano (Southern Chile): Analyses of tephra fall deposits, J. Volcanol. Geoth. Res., 317, 15–29, https://doi.org/10.1016/j.jvolgeores.2016.02.027, 2016. a
Sadeghi, B., Crawford, A., Chai, T., Cohen, M., Sieglaff, J., Pavolonis, M., Kim, H. C., and Morris, G.: Improving Volcanic SO2 Cloud Modeling Through Data Fusion and Trajectory Analysis: A Case Study of the 2022 Hunga Tonga Eruption, J. Geophys. Res.-Atmos., 130, e2024JD042421, https://doi.org/10.1029/2024jd042421, 2025. a, b, c, d
Schmidt, A., Leadbetter, S., Theys, N., Carboni, E., Witham, C. S., Stevenson, J. A., Birch, C. E., Thordarson, T., Turnock, S., Barsotti, S., Delaney, L., Feng, W., Grainger, R. G., Hort, M. C., Höskuldsson, Á., Ialongo, I., Ilyinskaya, E., Jóhannsson, T., Kenny, P., Mather, T. A., Richards, N. A. D., and Shepherd, J.: Satellite detection, long-range transport, and air quality impacts of volcanic sulfur dioxide from the 2014–2015 flood lava eruption at Bárðarbunga (Iceland), J. Geophys. Res.-Atmos., 120, 9739–9757, https://doi.org/10.1002/2015jd023638, 2015. a, b, c
Sellitto, P., Siddans, R., Belhadji, R., Carboni, E., Legras, B., Podglajen, A., Duchamp, C., and Kerridge, B.: Observing the SO2 and Sulfate Aerosol Plumes From the 2022 Hunga Eruption With the Infrared Atmospheric Sounding Interferometer (IASI), Geophys. Res. Lett., 51, e2023GL105565, https://doi.org/10.1029/2023gl105565, 2024. a, b, c
Sennert, S.: Global Volcanism Program, 2024. Report on Fernandina (Ecuador), Tech. rep., Smithsonian Institution and US Geological Survey, https://volcano.si.edu/showreport.cfm?wvar=GVP.WVAR20240228-353010 (last access: 24 February 2026), 2024. a
Shibata, T. and Kinoshita, T.: Volcanic aerosol layer formed in the tropical upper troposphere by the eruption of Mt. Merapi, Java, in November 2010 observed by the spaceborne lidar CALIOP, Atmos. Res., 168, 49–56, https://doi.org/10.1016/j.atmosres.2015.09.002, 2016. a
Shreve, T., Grandin, R., Boichu, M., Garaebiti, E., Moussallam, Y., Ballu, V., Delgado, F., Leclerc, F., Vallée, M., Henriot, N., Cevuard, S., Tari, D., Lebellegard, P., and Pelletier, B.: From prodigious volcanic degassing to caldera subsidence and quiescence at Ambrym (Vanuatu): the influence of regional tectonics, Sci. Rep.-UK, 9, 18868, https://doi.org/10.1038/s41598-019-55141-7, 2019. a
Sigmarsson, O., Haddadi, B., Carn, S., Moune, S., Gudnason, J., Yang, K., and Clarisse, L.: The sulfur budget of the 2011 Grímsvötn eruption, Iceland, Geophys. Res. Lett., 40, 6095–6100, https://doi.org/10.1002/2013gl057760, 2013. a
Simmons, I. C., Pfeffer, M. A., Calder, E. S., Galle, B., Arellano, S., Coppola, D., and Barsotti, S.: Extended SO2 outgassing from the 2014–2015 Holuhraun lava flow field, Iceland, B. Volcanol., 79, https://doi.org/10.1007/s00445-017-1160-6, 2017. a
Spinei, E., Carn, S. A., Krotkov, N. A., Mount, G. H., Yang, K., and Krueger, A.: Validation of ozone monitoring instrument SO2 measurements in the Okmok volcanic cloud over Pullman, WA, July 2008, J. Geophys. Res., 115, D00L08, https://doi.org/10.1029/2009JD013492, 2010. a
Spurr, R. J. D., Christi, M., Krotkov, N. A., Choi, W.-E., Carn, S., Li, C., Kramarova, N., Haffner, D., Yang, E.-S., Gorkavyi, N., Vasilkov, A., Wargan, K., Torres, O., Loyola, D., Di Pede, S., Pepijn Veefkind, J., Case, P., Schroeder, T., and Bhartia, P. K.: Solar Backscatter Ultraviolet (BUV) retrievals of mid-stratospheric aerosols from the 2022 Hunga Eruption, Atmos. Meas. Tech., 19, 993–1021, https://doi.org/10.5194/amt-19-993-2026, 2026. a
Surono, Jousset, P., Pallister, J., Boichu, M., Buongiorno, M., Budisantoso, A., Costa, F., Andreastuti, S., Prata, F., Schneider, D., Clarisse, L., Humaida, H., Sumarti, S., Bignami, C., Griswold, J., Carn, S., and Oppenheimer, C.: The 2010 explosive eruption of Java's Merapi volcano – a 100-year event, J. Volcanol. Geoth. Res., 241–242, 121–135, https://doi.org/10.1016/j.jvolgeores.2012.06.018, 2012. a, b
Taylor, I. A., Preston, J., Carboni, E., Mather, T. A., Grainger, R. G., Theys, N., Hidalgo, S., and Kilbride, B. M.: Exploring the Utility of IASI for Monitoring Volcanic SO2 Emissions, J. Geophys. Res.-Atmos., 123, 5588–5606, https://doi.org/10.1002/2017jd027109, 2018. a
Taylor, I. A., Grainger, R. G., Prata, A. T., Proud, S. R., Mather, T. A., and Pyle, D. M.: A satellite chronology of plumes from the April 2021 eruption of La Soufrière, St Vincent, Atmos. Chem. Phys., 23, 15209–15234, https://doi.org/10.5194/acp-23-15209-2023, 2023. a
Telling, J., Flower, V., and Carn, S.: A multi-sensor satellite assessment of SO2 emissions from the 2012–13 eruption of Plosky Tolbachik volcano, Kamchatka, J. Volcanol. Geoth. Res., 307, 98–106, https://doi.org/10.1016/j.jvolgeores.2015.07.010, 2015. a, b
Textor, C., Graf, H.-F., and Herzog, M.: Injection of gases into the stratosphere by explosive eruptions, J. Geophys. Res., 108, 4606, https://doi.org/10.1029/2002JD002987, 2003. a, b
Theys, N., Campion, R., Clarisse, L., Brenot, H., van Gent, J., Dils, B., Corradini, S., Merucci, L., Coheur, P.-F., Van Roozendael, M., Hurtmans, D., Clerbaux, C., Tait, S., and Ferrucci, F.: Volcanic SO2 fluxes derived from satellite data: a survey using OMI, GOME-2, IASI and MODIS, Atmos. Chem. Phys., 13, 5945–5968, https://doi.org/10.5194/acp-13-5945-2013, 2013. a, b, c, d, e, f, g
Theys, N., Smedt, I. D., van Gent, J., Danckaert, T., Wang, T., Hendrick, F., Stavrakou, T., Bauduin, S., Clarisse, L., Li, C., Krotkov, N., Yu, H., Brenot, H., and Van Roozendael, M.: Sulfur dioxide vertical column DOAS retrievals from the Ozone Monitoring Instrument: Global observations and comparison to ground-based and satellite data, J. Geophys. Res.-Atmos., 120, 2470–2491, https://doi.org/10.1002/2014jd022657, 2015. a, b
Theys, N., Fioletov, V., Li, C., De Smedt, I., Lerot, C., McLinden, C., Krotkov, N., Griffin, D., Clarisse, L., Hedelt, P., Loyola, D., Wagner, T., Kumar, V., Innes, A., Ribas, R., Hendrick, F., Vlietinck, J., Brenot, H., and Van Roozendael, M.: A sulfur dioxide Covariance-Based Retrieval Algorithm (COBRA): application to TROPOMI reveals new emission sources, Atmos. Chem. Phys., 21, 16727–16744, https://doi.org/10.5194/acp-21-16727-2021, 2021. a
Theys, N., Lerot, C., Brenot, H., van Gent, J., De Smedt, I., Clarisse, L., Burton, M., Varnam, M., Hayer, C., Esse, B., and Van Roozendael, M.: Improved retrieval of SO2 plume height from TROPOMI using an iterative Covariance-Based Retrieval Algorithm, Atmos. Meas. Tech., 15, 4801–4817, https://doi.org/10.5194/amt-15-4801-2022, 2022. a, b, c
Thomas, H. E. and Prata, A. J.: Sulphur dioxide as a volcanic ash proxy during the April–May 2010 eruption of Eyjafjallajökull Volcano, Iceland, Atmos. Chem. Phys., 11, 6871–6880, https://doi.org/10.5194/acp-11-6871-2011, 2011. a, b, c
Van Damme, M., Clarisse, L., Franco, B., Sutton, M. A., Erisman, J. W., Kruit, R. W., van Zanten, M., Whitburn, S., Hadji-Lazaro, J., Hurtmans, D., Clerbaux, C., and Coheur, P.-F.: Global, regional and national trends of atmospheric ammonia derived from a decadal (2008–2018) satellite record, Environ. Res. Lett., 16, 055017, https://doi.org/10.1088/1748-9326/abd5e0, 2021. a
van Donkelaar, A., Martin, R. V., Leaitch, W. R., Macdonald, A. M., Walker, T. W., Streets, D. G., Zhang, Q., Dunlea, E. J., Jimenez, J. L., Dibb, J. E., Huey, L. G., Weber, R., and Andreae, M. O.: Analysis of aircraft and satellite measurements from the Intercontinental Chemical Transport Experiment (INTEX-B) to quantify long-range transport of East Asian sulfur to Canada, Atmos. Chem. Phys., 8, 2999–3014, https://doi.org/10.5194/acp-8-2999-2008, 2008. a
Vasconez, F. J., Ramón, P., Hernandez, S., Hidalgo, S., Bernard, B., Ruiz, M., Alvarado, A., La Femina, P., and Ruiz, G.: The different characteristics of the recent eruptions of Fernandina and Sierra Negra volcanoes (Galápagos, Ecuador), Volcanica, 1, 127–133, https://doi.org/10.30909/vol.01.02.127133, 2018. a, b
Veefkind, J., Aben, I., McMullan, K., Förster, H., de Vries, J., Otter, G., Claas, J., Eskes, H., de Haan, J., Kleipool, Q., van Weele, M., Hasekamp, O., Hoogeveen, R., Landgraf, J., Snel, R., Tol, P., Ingmann, P., Voors, R., Kruizinga, B., Vink, R., Visser, H., and Levelt, P.: TROPOMI on the ESA Sentinel-5 Precursor: A GMES mission for global observations of the atmospheric composition for climate, air quality and ozone layer applications, Remote Sens. Environ., 120, 70–83, https://doi.org/10.1016/j.rse.2011.09.027, 2012. a
Venzke, E.: Global Volcanism Program, 2015. Report on Calbuco (Chile), Tech. Rep. 40:6, Smithsonian Institution, https://doi.org/10.5479/si.gvp.bgvn201506-358020, 2015. a, b
Vernier, J.-P., Aubry, T. J., Timmreck, C., Schmidt, A., Clarisse, L., Prata, F., Theys, N., Prata, A. T., Mann, G., Choi, H., Carn, S., Rigby, R., Loughlin, S. C., and Stevenson, J. A.: The 2019 Raikoke eruption as a testbed used by the Volcano Response group for rapid assessment of volcanic atmospheric impacts, Atmos. Chem. Phys., 24, 5765–5782, https://doi.org/10.5194/acp-24-5765-2024, 2024. a, b, c, d, e, f, g
Walker, J. C., Dudhia, A., and Carboni, E.: An effective method for the detection of trace species demonstrated using the MetOp Infrared Atmospheric Sounding Interferometer, Atmos. Meas. Tech., 4, 1567–1580, https://doi.org/10.5194/amt-4-1567-2011, 2011. a
Walker, J. C., Carboni, E., Dudhia, A., and Grainger, R. G.: Improved detection of sulphur dioxide in volcanic plumes using satellite-based hyperspectral infrared measurements: Application to the Eyjafjallajökull 2010 eruption, J. Geophys. Res., 117, D00U16, https://doi.org/10.1029/2011JD016810, 2012. a
Wang, Y., Wang, J., Xu, X., Henze, D. K., Qu, Z., and Yang, K.: Inverse modeling of SO2 and NOx emissions over China using multisensor satellite data – Part 1: Formulation and sensitivity analysis, Atmos. Chem. Phys., 20, 6631–6650, https://doi.org/10.5194/acp-20-6631-2020, 2020. a
Waythomas, C. F., Scott, W. E., Prejean, S. G., Schneider, D. J., Izbekov, P., and Nye, C. J.: The 7–8 August 2008 eruption of Kasatochi Volcano, central Aleutian Islands, Alaska, J. Geophys. Res., 115, B00B06, https://doi.org/10.1029/2010JB007437, 2010. a
Winker, D. M., Vaughan, M. A., Omar, A., Hu, Y., Powell, K. A., Liu, Z., Hunt, W. H., and Young, S. A.: Overview of the CALIPSO Mission and CALIOP Data Processing Algorithms, J. Atmos. Ocean. Tech., 26, 2310–2323, https://doi.org/10.1175/2009JTECHA1281.1, 2009. a
Winker, D. M., Tackett, J. L., Getzewich, B. J., Liu, Z., Vaughan, M. A., and Rogers, R. R.: The global 3-D distribution of tropospheric aerosols as characterized by CALIOP, Atmos. Chem. Phys., 13, 3345–3361, https://doi.org/10.5194/acp-13-3345-2013, 2013. a
Wunderman, R.: Global Volcanism Program, 2009. Report on Fernandina (Ecuador), Tech. Rep. 34:4, Smithsonian Institution, https://doi.org/10.5479/si.gvp.bgvn200904-353010, 2009. a
Wunderman, R.: Global Volcanism Program, 2011. Report on Merapi (Indonesia), Tech. Rep. 36:1, Smithsonian Institution, https://doi.org/10.5479/si.gvp.bgvn201102-263250, 2011. a
Wunderman, R.: Global Volcanism Program, 2014. Report on Fogo (Cape Verde), Tech. Rep. 39:11, Smithsonian Institution, https://doi.org/10.5479/si.gvp.bgvn201411-384010, 2014. a
Xia, C., Liu, C., Cai, Z., Wu, H., Li, Q., and Gao, M.: Tracking SO2 plumes from the Tonga volcano eruption with multi-satellite observations, iScience, 27, 109446, https://doi.org/10.1016/j.isci.2024.109446, 2024. a, b, c, d
Yang, K., Krotkov, N. A., Krueger, A. J., Carn, S. A., Bhartia, P. K., and Levelt, P. F.: Retrieval of large volcanic SO2 columns from the Aura Ozone Monitoring Instrument: Comparison and limitations, J. Geophys. Res.-Atmos., 112, https://doi.org/10.1029/2007jd008825, 2007. a
Yang, K., Liu, X., Bhartia, P. K., Krotkov, N. A., Carn, S. A., Hughes, E. J., Krueger, A. J., Spurr, R. J. D., and Trahan, S. G.: Direct retrieval of sulfur dioxide amount and altitude from spaceborne hyperspectral UV measurements: Theory and application, J. Geophys. Res., 115, D00L09, https://doi.org/10.1029/2010JD013982, 2010. a, b
Zeng, Z.-C., Clarisse, L., Franco, B., Clerbaux, C., Theys, N., Qi, C., Lee, L., Zhu, L., Hu, X., Gu, M., and Zhang, P.: Volcanic sulfur dioxide monitored from a constellation of FengYun hyperspectral infrared sounders in dawn-dusk, mid-morning, and afternoon sun-synchronous orbits, Remote Sens. Environ., 331, 115057, https://doi.org/10.1016/j.rse.2025.115057, 2025. a, b, c
Zhang, Y., Li, C., Krotkov, N. A., Joiner, J., Fioletov, V., and McLinden, C.: Continuation of long-term global SO2 pollution monitoring from OMI to OMPS, Atmos. Meas. Tech., 10, 1495–1509, https://doi.org/10.5194/amt-10-1495-2017, 2017. a
Zheng, B., Tong, D., Li, M., Liu, F., Hong, C., Geng, G., Li, H., Li, X., Peng, L., Qi, J., Yan, L., Zhang, Y., Zhao, H., Zheng, Y., He, K., and Zhang, Q.: Trends in China's anthropogenic emissions since 2010 as the consequence of clean air actions, Atmos. Chem. Phys., 18, 14095–14111, https://doi.org/10.5194/acp-18-14095-2018, 2018. a
Zhu, Y., Toon, O. B., Jensen, E. J., Bardeen, C. G., Mills, M. J., Tolbert, M. A., Yu, P., and Woods, S.: Persisting volcanic ash particles impact stratospheric SO2 lifetime and aerosol optical properties, Nat. Commun., 11, 4526, https://doi.org/10.1038/s41467-020-18352-5, 2020. a, b, c
Zhu, Y., Bardeen, C. G., Tilmes, S., Mills, M. J., Wang, X., Harvey, V. L., Taha, G., Kinnison, D., Portmann, R. W., Yu, P., Rosenlof, K. H., Avery, M., Kloss, C., Li, C., Glanville, A. S., Millán, L., Deshler, T., Krotkov, N., and Toon, O. B.: Perturbations in stratospheric aerosol evolution due to the water-rich plume of the 2022 Hunga-Tonga eruption, Commun. Earth Environ., 3, 248, https://doi.org/10.1038/s43247-022-00580-w, 2022. a, b, c