the Creative Commons Attribution 4.0 License.
the Creative Commons Attribution 4.0 License.
 | 04 Sep 2026
A gridded dataset of European Forest Types to support forest monitoring, modelling and reporting
Francesca Giannetti

Ilaria Zorzi
Stefanie Linser
Mathias Neumann
Sorin Cheval
Alessio Collalti
Elia Vangi
Elisa Grieco
Mauro Morichetti
Giovanni D'Amico
Nicu Constantin Tudose
Alice Ludvig
Livia Passarino
Jessica Scriva
Yamuna Giambastiani
Irene Fattoretto
Giuliano Secchi
Davide Travaglini
Gherardo Chirici
Piermaria Corona
Marco Marchetti
Anna Barbati
A standardized system of nomenclature for forest types is essential for effectively monitoring and understanding the impacts of climate change on diverse ecosystems in Europe and beyond. A comprehensive classification system, such as the European Forest Types (EFTs) scheme, is essential for assessing baseline conditions, tracking changes, and guiding conservation decisions. A unified forest type nomenclature supports international collaboration, enables researchers and policymakers to accurately compare data across regions and time periods, and enhances the development of targeted conservation strategies and adaptive management practices aimed at preserving biodiversity and ecosystem services. This classification breaks down forested areas in Europe into a handful of ecologically homogeneous units, thus facilitating the analysis of data related to forest conditions and management practices across a wide range of climatic and edaphic conditions. The current lack of an EFTs map for Europe prompted its processing, using a shared rule-based expert system algorithm. Utilizing a dataset featuring 39 “relative probability of presence (RPP) maps” of tree species and various forest masks, the algorithm identified 14 EFT categories. This initiative filled a critical gap in spatial monitoring, providing the first consistent pan-European EFT maps gridded dataset. The availability of standardized and comprehensive spatial data on forest types enhances our capacity to understand, manage, and conserve forest ecosystems effectively. Such data support biodiversity conservation and ensure the sustained provision of essential ecosystem services, highlighting the critical role of forest types in maintaining ecological balance and supporting human well-being. The European Forest Types map gridded dataset is freely available in Zenodo at https://doi.org/10.5281/zenodo.18496150 (Giannetti et al., 2026).
- Article
(6434 KB) - Full-text XML
-
Supplement
(476 KB) - BibTeX
- EndNote


The growing impacts of climate change on forest ecosystems, in Europe in particular, has led to an acceleration in the development of comprehensive classification systems, able to depict the actual distribution of forest vegetation using dominant tree species composition, in correlation with large-scale biogeographic, climatic and edaphic gradients (EEA, 2006, 2008; Giannetti et al., 2018; Ivanova et al., 2022; Jenssen et al., 2021; Kusbach et al., 2023). These classification systems are recognized to play a pivotal role in understanding, assessing, modelling, monitoring, reporting and managing ecological communities, contributing to a deeper insight into ecosystem dynamics (Dahdouh-Guebas et al., 1998; Grondin et al., 2023; Ivanova et al., 2022; Kusbach et al., 2023; Schick et al., 2019). These systems allow to derive details about natural habitats and ecosystems, such as the biophysical/ecological attributes and their historical variations across diverse spatial scales (i.e. global, national, regional, local) (Barbati et al., 2014; De Cáceres et al., 2019; Giannetti et al., 2018; Grondin et al., 2023; Jacquemoud and Ustin, 2019).
Among the variety of habitat and ecosystem classification systems, those based on vegetation are essential for articulating, synthesizing, and representing associations among vegetation communities (Dahdouh-Guebas et al., 1998; Williamson et al., 2016). These classifications provide indispensable information for vegetation-management strategies aimed at maintaining ecosystem functionality over time (Barbati et al., 2014; De Cáceres et al., 2019).
In this context, from the onset of forestry science, foresters have developed forest typologies or forest types of classification schemes (FTCS) as tools for characterizing forest sites and stands (De Cáceres et al., 2019; Cajander, 1949) in terms of dominant association of vegetation communities (i.e. dominant plant species) and site factors (e.g. climate, altitude, edaphic conditions). Although historically these classification schemes were used in the forest sector to support conventional forest management activities (Cajander, 1949; Giannetti et al., 2018), today FTCS are considered essential for the comprehensive assessment and monitoring of changes in forest ecosystems, encompassing all associated ecosystem service indicators rather than focusing solely on timber production (Barbati et al., 2014; Bergeron et al., 2012; Corona, 2016). Moreover, FTCS are becoming increasingly important for the initialization and calibration of forest, more broadly, vegetation, models, particularly those used to compare alternative forest management strategies under climate change scenarios (Dalmonech et al., 2022; Grünig et al., 2026; Santini et al., 2014; Saponaro et al., 2025), and at assessing ecosystem services prevision (Morichetti et al., 2024; Vangi et al., 2026).
FTCS allow forest-monitoring indicators to be disaggregated into ecologically meaningful units, thereby improving their interpretation and their use in decisions on forest conservation and resource management (Barbati et al., 2007). They are also crucial for assessing how environmental and climatic changes affect different forest ecosystems (Maes et al., 2023; Nemani and Running, 1996). Further applications include habitat-quality assessment, disturbance-susceptibility analysis, forest-dynamics modelling, and forest-resource mapping, all of which support the development of sustainable forest-management strategies (Barbati et al., 2014; Corona, 2016; EEA, 2006; Grondin et al., 2023).
The development of FTCS involves partitioning large forest regions into ecologically homogeneous units (Barbati et al., 2014; De Cáceres et al., 2019; Cajander, 1949). The main classes are differentiated by discontinuities in canopy tree-species composition, using dominant species together with biogeographical, altitudinal, or site-specific factors as diagnostic criteria. This stratification improves the analysis, interpretation, and communication of forest-related data (Barbati et al., 2014), particularly for Sustainable Forest Management (SFM) and biodiversity reporting. SFM indicators are often reported using only three broad classes (broadleaved, coniferous, and mixed forest) (Barbati et al., 2014; FAO and UNEP, 2020; FOREST EUROPE, 2015b). Such a simplified classification does not adequately represent forest ecological and biodiversity patterns, especially in environmentally heterogeneous countries such as, for example, France, Spain, and Italy (EEA, 2006; Giannetti et al., 2018).
Many FTCS exist around Europe differing among countries, and even among regions of the same country (D'amico et al., 2021). Currently, there are three existing FTCS that allow for the systematic identification of distinct forest communities in the whole Europe as reported in Giannetti et al. (2018): the “EUNIS Habitat Classification” (Davies et al., 2004), the “Overview of Phytosociological Alliances” presented by Rodwell et al. (2002) and the “European Forest Types – EFTs”(EEA, 2006). The first two classifications schemes are scientifically robust and widely accepted; however, both schemes, as pointed out in the report of the European Environment Agency (EEA, 2006) and the works of Barbati et al. (2007, 2014) and Giannetti et al. (2018), do have limitations when it comes to their potential usability for reporting the pan-European indicators for sustainable forest management of the FOREST EUROPE process (FOREST EUROPE, UNECE and FAO, 2011). One notable limitation is that both systems (e.g. EUNIS and Overview of Phytosociological Alliances) have too many classes, which makes their use impractical for feasible reporting purposes (EEA, 2006). In the context of international framework, reporting a FTCS should adequately capture just the primary factors that contribute to the variations (EEA, 2006), such as: (i) the changes in ecological forest zones that impact the natural composition of tree species, (ii) the length of the growing seasons that reflect the growing stock capacity, (iii) the rate of deadwood decomposition and the occurrence of natural disturbances that have impact for example on the types and quantities of deadwood. Additionally, FTCS should account for changes in management practices that affect the age and density structure, growing stock, and the presence of dead and dying wood left in the forest.
In response to this need, the European Environment Agency (EEA) promoted the development of the European Forest Types classification to be adopted as reference for European-level reporting within the FOREST EUROPE process (Forest Europe, UNECE and FAO, 2011). The classification of EFTs was developed through an expert review process with the initial goal of optimizing the monitoring of forest biodiversity in the EU countries (European Environmental Agency, 2006), and to reflect the ecological diversity of pan-European forests (Barbati et al., 2014; European Environmental Agency, 2006; Giannetti et al., 2018; Pividori et al., 2016). The EFTs are categorized using a hierarchical classification system that consists of 14 first-level classes (categories) and 75 second-level classes (types). The 14 categories of the EFTs represent extensively distributed zonal and azonal forest communities with characteristic tree species combinations. The spatial distribution of the categories in the European region is largely driven by biogeographical, latitudinal/altitudinal gradients or site-factors (e.g. soil water-nutrient conditions). The “type” level is mainly intended to further distinguish the variety and the characteristics of forest ecosystems covered by each category. The classification specifically pertains to forest land as defined by FAO and UNEP (2020) and applied for the FOREST EUROPE national reporting (FOREST EUROPE and FAO, 2020), but the EFTs do not include other wooded lands within its scope (European Environmental Agency, 2006). The EFTs have proven instrumental in facilitating the comparison, interpretation, and dissemination of data pertaining to European forests' conditions. A pilot reporting by EFTs was tested in the State of Europe's Forests 2011 report (FOREST EUROPE, UNECE and FAO, 2011) for a selection of quantitative indicators, primarily forest area and growing stock and some key-biodiversity related indicators (e.g. share of old stands (>140 years) out of total area of even aged forest by EFTs, share of single species stands out of total area of forest by EFTs and volume of deadwood per ha of forest by EFTs). This initiative required an individual effort from European countries to reclassify National Forest Inventories ground plots by EFTs categories, so that data on the pan-European indicators for sustainable forest management (FOREST EUROPE, 2015a; MCPFE, 2003) could be aggregated by EFTs throughout the pan-European region. Though the comparison of data on indicators by ecologically sound units, proved useful to better interpret the values taken by the indicators, explicitly considering ecological differences between EFTs (Barbati et al., 2014), reporting by EFTs has not been further implemented in the subsequent FOREST EUROPE reports (FOREST EUROPE, 2015a, b, 2020).
Despite the existence of several forest typology frameworks and Pan-European classification systems, a spatially explicit, harmonized, and operational map of forest types – such as those based on EUNIS and EFTs – covering the entire European territory is still lacking. At present, the only forest-type map consistently available across all European Union Member States is the product developed within the Copernicus Land Monitoring Services under the High-Resolution Layers called “Forest Type” (Langanke, 2017). This gridded dataset provides a simplified classification with only two categories – coniferous and broadleaved forests – at a spatial resolution of 10 m. A coarse version at 100 m resolution included and additional mixed forest category, distinguish among coniferous, broadleaved forests and mixed forest types (Copernicus Land Monitoring Service, 2021).
However, although the Copernicus High Resolution Layer of Forest Types ensures spatial consistency across Europe, its ecological resolution remains limited, as it captures only broad forest categories (i.e. coniferous, broadleaves, and mixed forests). This level of generalization constrains the disaggregation of forest indicators into ecologically meaningful units across countries, thereby limiting cross-country comparability, biodiversity assessments, and the ecological interpretation of forest monitoring data at the continental scale. More detailed classification systems, such as EUNIS or phytosociological alliances, are conceptually robust but often too complex for operational use in pan-European reporting frameworks (Giannetti et al., 2018). In this context, the EFTs classifications, developed by EEA – supported by the experiment of FOREST EUROPE (Forest Europe, UNECE and FAO, 2011) – represents a suitable compromise, balancing ecological relevance with applicability for large-scale forest monitoring and reporting of sustainable forest management indicators.
It is important to highlight that, to date, no formal reporting requirements established by the EEA regarding the use of the EFTs (European Environment Agency, 2008; Xanthopoulos et al., 2012). However, this situation may evolve in the near future, as the EFTs have been included in the Draft EC Forest Monitoring Regulation (European Commission, 2023). Although it is not yet defined which indicators will be reported by EFTs, it is likely that Member States will be required to provide the information, similarly to the pilot reporting by EFTs in the State of Europe's Forests 2011 report (Forest Europe, UNECE and FAO, 2011).
Significant progress has been made to facilitate the classification of National Forest Inventory (NFI) plots according to the EFT system. Giannetti et al. (2018) developed the first methodology for the automatic classification of inventory plots into EFTs, based on a rule-based algorithm integrating spatially explicit environmental variables with the tree species composition derived from field data (i.e., percentage of basal area per each one of the tree species). This approch enabled the accurate classification of approximately 6000 ICP BIOSOIL plots into the 14 EFTs categories.
However, as noted above, spatially consistent, wall-to-wall gridded datasets of EFTs covering the entire European territory are still lacking, thereby limiting the operational applicability of this classification framework for large-scale monitoring and reporting of sustainable forest management including biodiversity indicators. This gap also constrains the application of certain forest models at broader spatial scales, as their calibration requires detailed wall-to-wall information on tree species composition or group of species (Chirici et al., 2022; Dalmonech et al., 2024, 2026).
The dataset presented in this study addresses this gap by providing the first harmonised, wall-to-wall gridded representation of the 14 EFT categories on a 100 m output grid. It is generated through a reproducible rule-based expert system integrating relative probability of presence (RPP) maps for 39 forest tree species provided by the EC Joint Research Centre (Caudullo et al., 2017; De Rigo et al., 2016) with forest and environmental masks representing major ecological domains. The algorithm originally developed by Giannetti et al. (2018) was adapted and extended for this purpose. The 100 m grid supports interoperability with the Copernicus Forest Type product; it does not imply that the native 1 km species-occurrence information has been enhanced to stand-level spatial accuracy. By translating the EFT conceptual framework into a coherent geospatial product, this work operationalises a classification scheme designed to support pan-European forest monitoring, reporting, and modelling.
In this context, the terms “monitoring, modelling and reporting” refer to the use of ecologically stratified forest information derived from the dataset within several complementary frameworks. Specifically, monitoring refers to the derivation of indicators such as forest area by forest type, modelling to the use of this information in ecological and management-oriented applications (e.g. scenario analysis and forest planning) and reporting to its use in policy and assessment contexts.
These applications include: (i) National Forest Inventory-based indicator assessments, (ii) pan-European Sustainable Forest Management (SFM) reporting frameworks such as FOREST EUROPE indicators, (iii) emerging European policy instruments based on the Green Deal, and (iv) ecological and climate-impact modelling applications requiring stratification by forest types.
The dataset is not intended for greenhouse gas MRV (monitoring, reporting, and verification) systems, where verification represents a formal component of emissions accounting. Rather, it is designed to support ecological, structural, and biodiversity-oriented forest monitoring, modelling, and reporting.
2.1 EFTs classification scheme
This section briefly describes the EFT classification; detailed accounts are available in the EEA report and related publications (EEA, 2006; Barbati et al., 2014; Giannetti et al., 2018; Pividori et al., 2016). The hierarchy comprises 14 first-level categories and 75 second-level types; this study maps the category level. The categories are: (1) Boreal Forest; (2) Hemiboreal and Nemoral Coniferous and Mixed Broadleaved-Coniferous Forest; (3) Alpine Forest; (4) Acidophilous Oak and Oak-Birch Forest; (5) Mesophytic Deciduous Forest; (6) Beech Forest; (7) Mountain Beech Forest; (8) Thermophilous Deciduous Forest; (9) Broadleaved Evergreen Forest; (10) Coniferous Forests of the Mediterranean, Anatolian and Macaronesian Regions; (11) Mire and Swamp Forest; (12) Floodplain Forest; (13) Non-Riverine Alder, Birch or Aspen Forest; and (14) Forests Dominated by Introduced Tree Species. Annex 1 summarises their main characteristics, while Table 2 reports the species-affinity matrix derived from Pividori et al. (2016). EFT assignment reflects not only species composition but also environmental, biological, and anthropogenic differentiation. Categories (1)–(10) and (13) are primarily distinguished along latitudinal, altitudinal, and climatic gradients; categories (11) and (12) are azonal communities controlled by hydrological conditions; and category (14) identifies forests dominated by tree species introduced to Europe.
2.2 Study Site
This study spans over the pan-European forest region (shown in red in Fig. 1), which includes the EU-28 countries plus Switzerland, San Marino, Liechtenstein, Montenegro, Bosnia and Herzegovina, Serbia, Albania, North Macedonia, and Andorra. The countries were selected based on the availability of all the datasets needed for the classification described in the following sections.
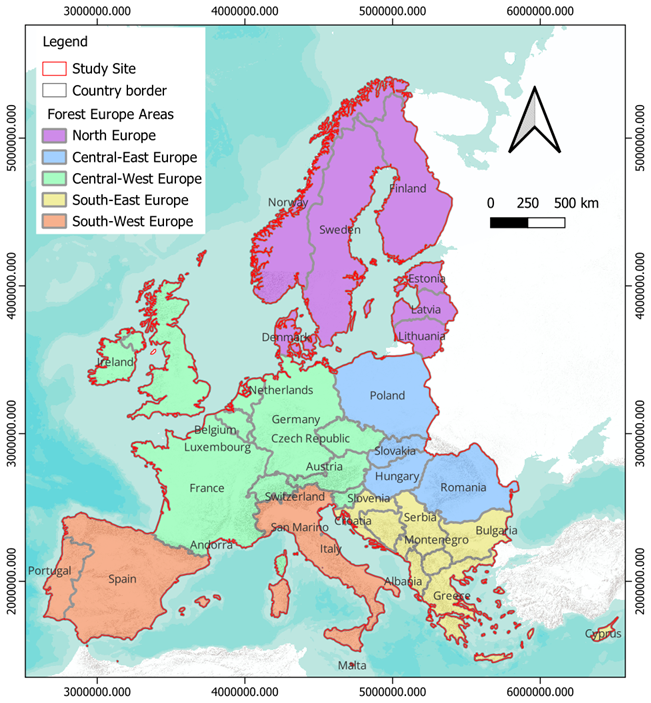
Figure 1Study site, including country borders and geographic regions as defined by FOREST EUROPE, UNECE, and FAO (2011). Background map source: Esri, World Terrain Base | Powered by Esri.
In Europe, forests cover an area of approximately 227 million ha, accounting for more than a third of the continent's total land. Over the last 30 years, there has been a 9 % increase in forested areas (FOREST EUROPE and FAO, 2020). Approximately 46 % of forests are primarily composed of coniferous trees, while 37 % consist of broadleaved trees. Mixed stands make up around 17 % of this area. Conifers dominate in Northern Europe in particular (66.9 %), while a higher proportion of broadleaved trees can be found in other parts of Europe. In particular, Southwest Europe has the highest share of broadleaved forests, accounting for 61.4 %. Around two-thirds of European forests are dominated by two or more tree species. Specifically, 4.6 % of European forest stands are estimated to be composed of more than 6 species, while 13.1 % consist of 4–5 species. Nearly half, 49.5 %, are composed of 2–3 species, and the remaining 33 % of a single tree species. In Southeast Europe, 62.3 % of forests are single-species forests. Contrarily, in Southwest Europe, the forest tree species composition is more diverse, with stands featuring more than six species representing 19.9 % of the total forested areas. Most European forests are estimated to be composed of native species (96.9 %), with introduced tree species covering 3.1 % of the forest area. Moreover, 66 % of the forests in Europe are naturally regenerated, while only 2.2 % are considered undisturbed by human activities, exhibiting a high level of naturalness (FOREST EUROPE, 2020; FAO, 2018).
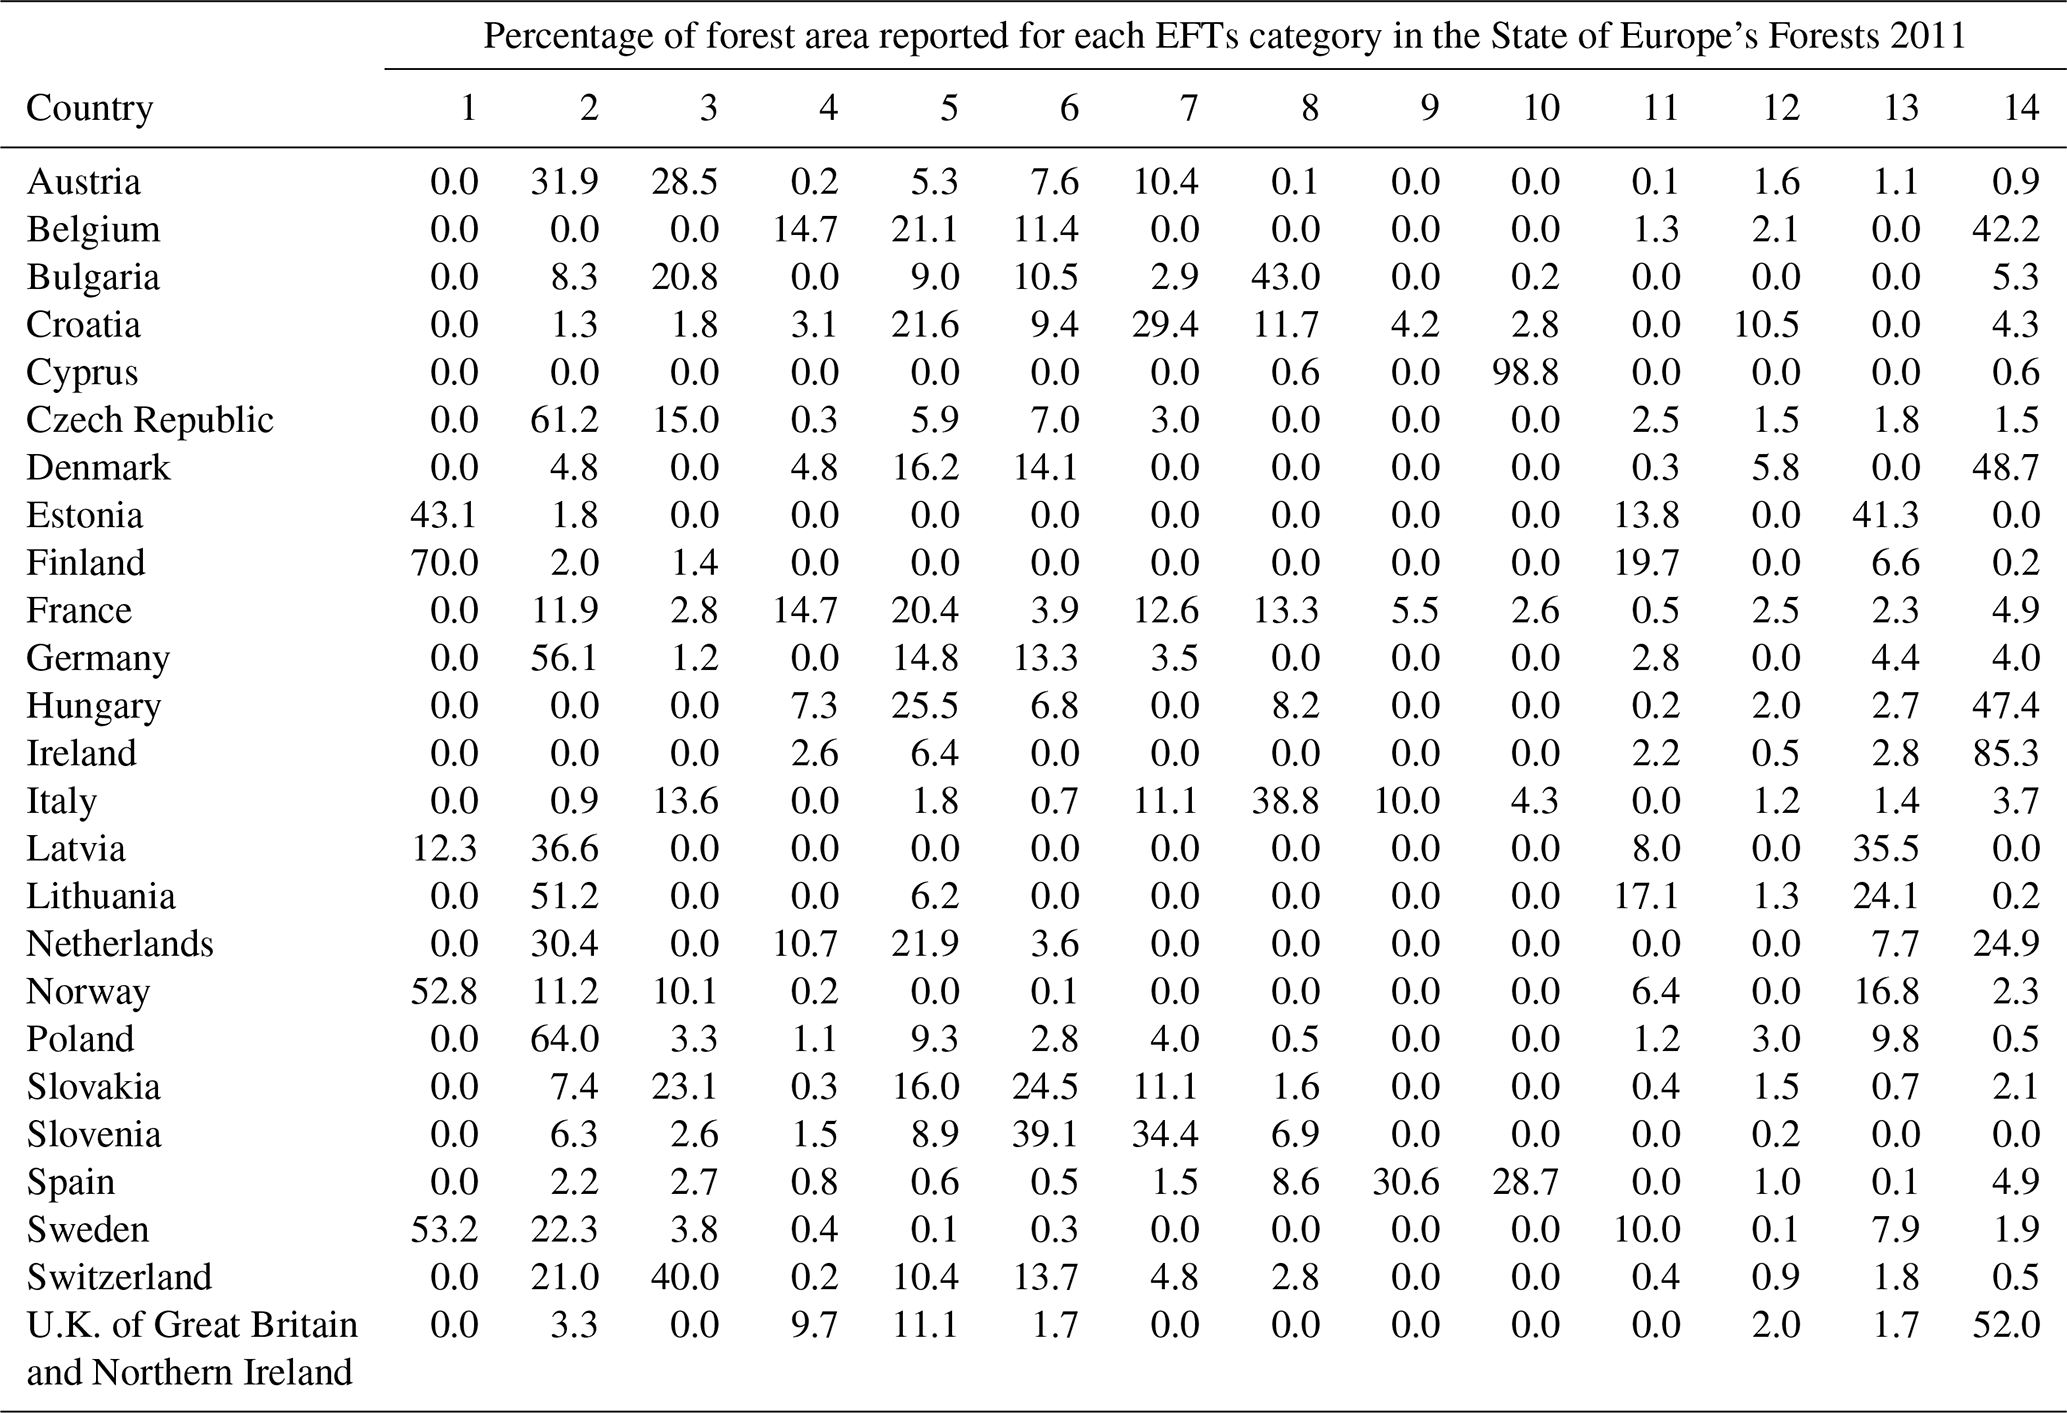
Based on the data of the State of Europe's Forests 2011 report (FOREST EUROPE, UNECE and FAO, 2011), which utilized EFTs for a pilot test on reporting indicators using data gathered from 28 countries for 2010 (Switzerland referred to 2005 and UK to 2000), the forest area in Europe is assigned as following: 21.9 % (1) – Boreal forests; 21.4 % (2) – Hemi boreal and nemoral coniferous and mixed broadleaved-coniferous forests; 7.3 % (4) – Acidophilous oak and oak-birch forests; 6.6 % (11) – Mire and swamp forests; 6.1 % (7) – Mountainous beech forests; 5.4 % (9) – Broadleaved evergreen forests; 5.2 % (13) – Non-riverine alder, birch or aspen forests; 4.5 % (12) – Floodplain forests; 4.2 % (14) – Introduced tree species forests; 3.6 %; (10) – Coniferous forests of the Mediterranean, Anatolian and Macaronesian regions; 3.6 % (3) – Alpine forests; 3.0 % (8) – Thermophilous deciduous forests; 2 % (5) – Mesophytic deciduous forests, and 1.2 % (6) – Beech forests. The details for each country are reported in Table 1.
Table 1Percentage of forest area reported for each EFTs category in State of Europe's Forests 2011 (FOREST EUROPE, UNECE, and FAO, 2011).
2.3 Data
The data needed to construct the EFT raster grid dataset map are multiple and constitute the main inputs of the analysis, which are described in detail in the following sections. Some layers, such as (i) the relative probability of presence (RPP) maps and (ii) the Copernicus forest types maps, are used to determine forest species composition. In addition, a set of geographic layers available at the EU level, described in Sect. 2.3.2, is used to identify ecological breakpoints that influence the spatial differentiation of EFTs.
2.3.1 Relative probability of presence (RPP) maps
To the best of our knowledge, a consistent European-wide dataset of single forest tree species (e.g. cartographic layer of forest tree species, or automatic classification of forest tree species by remote sensing data) suitable to be converted in EFTs is not available. However, three datasets including the distribution of forest tree species suitable to map EFTs are available and consistent in all the EU-28 and the selected countries (Fig. 1), as follows: (i) the tree species distribution by Bonannella et al. (2022), (ii) the EU Tree Map by Brus et al. (2012), (iii) the relative probability of presence (RPP) maps of Tree Atlas by the JRC (De Rigo et al., 2016). These datasets are provided as raster layers containing the probability to find a given forest tree species within a pixel. These maps are called “relative probability of presence maps” (RPP maps). The most recent dataset was published by Bonannella et al. (2022), who classified forest tree species using satellite and ancillary data to produce distribution maps for 16 tree species at high spatial resolution (30 m). A more extensive list of forest tree species maps comprise 21 species/group distribution was provided by Brus et al. (2012) at low resolution scale of 1 km using NFI and ICP Plot Level I data and 10 covariates variables (i.e. biogeographical region, soil class, elevation, slope, annual mean temperature, temperature seasonality, annual precipitation, precipitation of warmest quarter, easting and northing).
The more comprehensive source of forest tree species maps is distributed by the Joint Research Centre (JRC) through the atlas of forest tree species portal (https://forest.jrc.ec.europa.eu/en/european-atlas/atlas-data-and-metadata/, last access: 26 August 2026).
A dataset called “EU-Forest” is open-source and publicly available, obtained by merging the three highest-quality tree species distribution datasets available by the JRC in 2017 (Caudullo et al., 2017): the tree occurrence data provided by Forest Focus (ICP-Forest database from 2003 to 2009), Biosoil and the National Forest Inventory dataset of the EU Countries. The latter accounts for the brunt of data in EU-Forest, as it includes more than 350 wood species and more than half million of occurrence records spread over 19 EU Member States and two neighboring countries (Norway and Switzerland) (Beck et al., 2020; Caudullo et al., 2017). Similarly to the dataset proposed by Brus et al. (2012), also the JRC dataset provides the Relative Probability of Presence (RPP) maps at 1 km spatial resolution. The RPP maps are provided by tree species and represent the average probability (ranging from 0 to 1) of finding the given tree species, at least one individual of the taxon, at 1 km2 pixel resolution (De Rigo et al., 2016).
The RPP maps are provided for individual tree taxa irrespective of the potential co-occurrence of other taxa within the source plots. They represent relative likelihood of occurrence and must not be interpreted as absolute abundance, basal-area share, crown-cover share, biomass, or structural dominance. Consequently, RPP values for different taxa within the same area are not compositional proportions and may sum to more than 100 % (Beck et al., 2020).
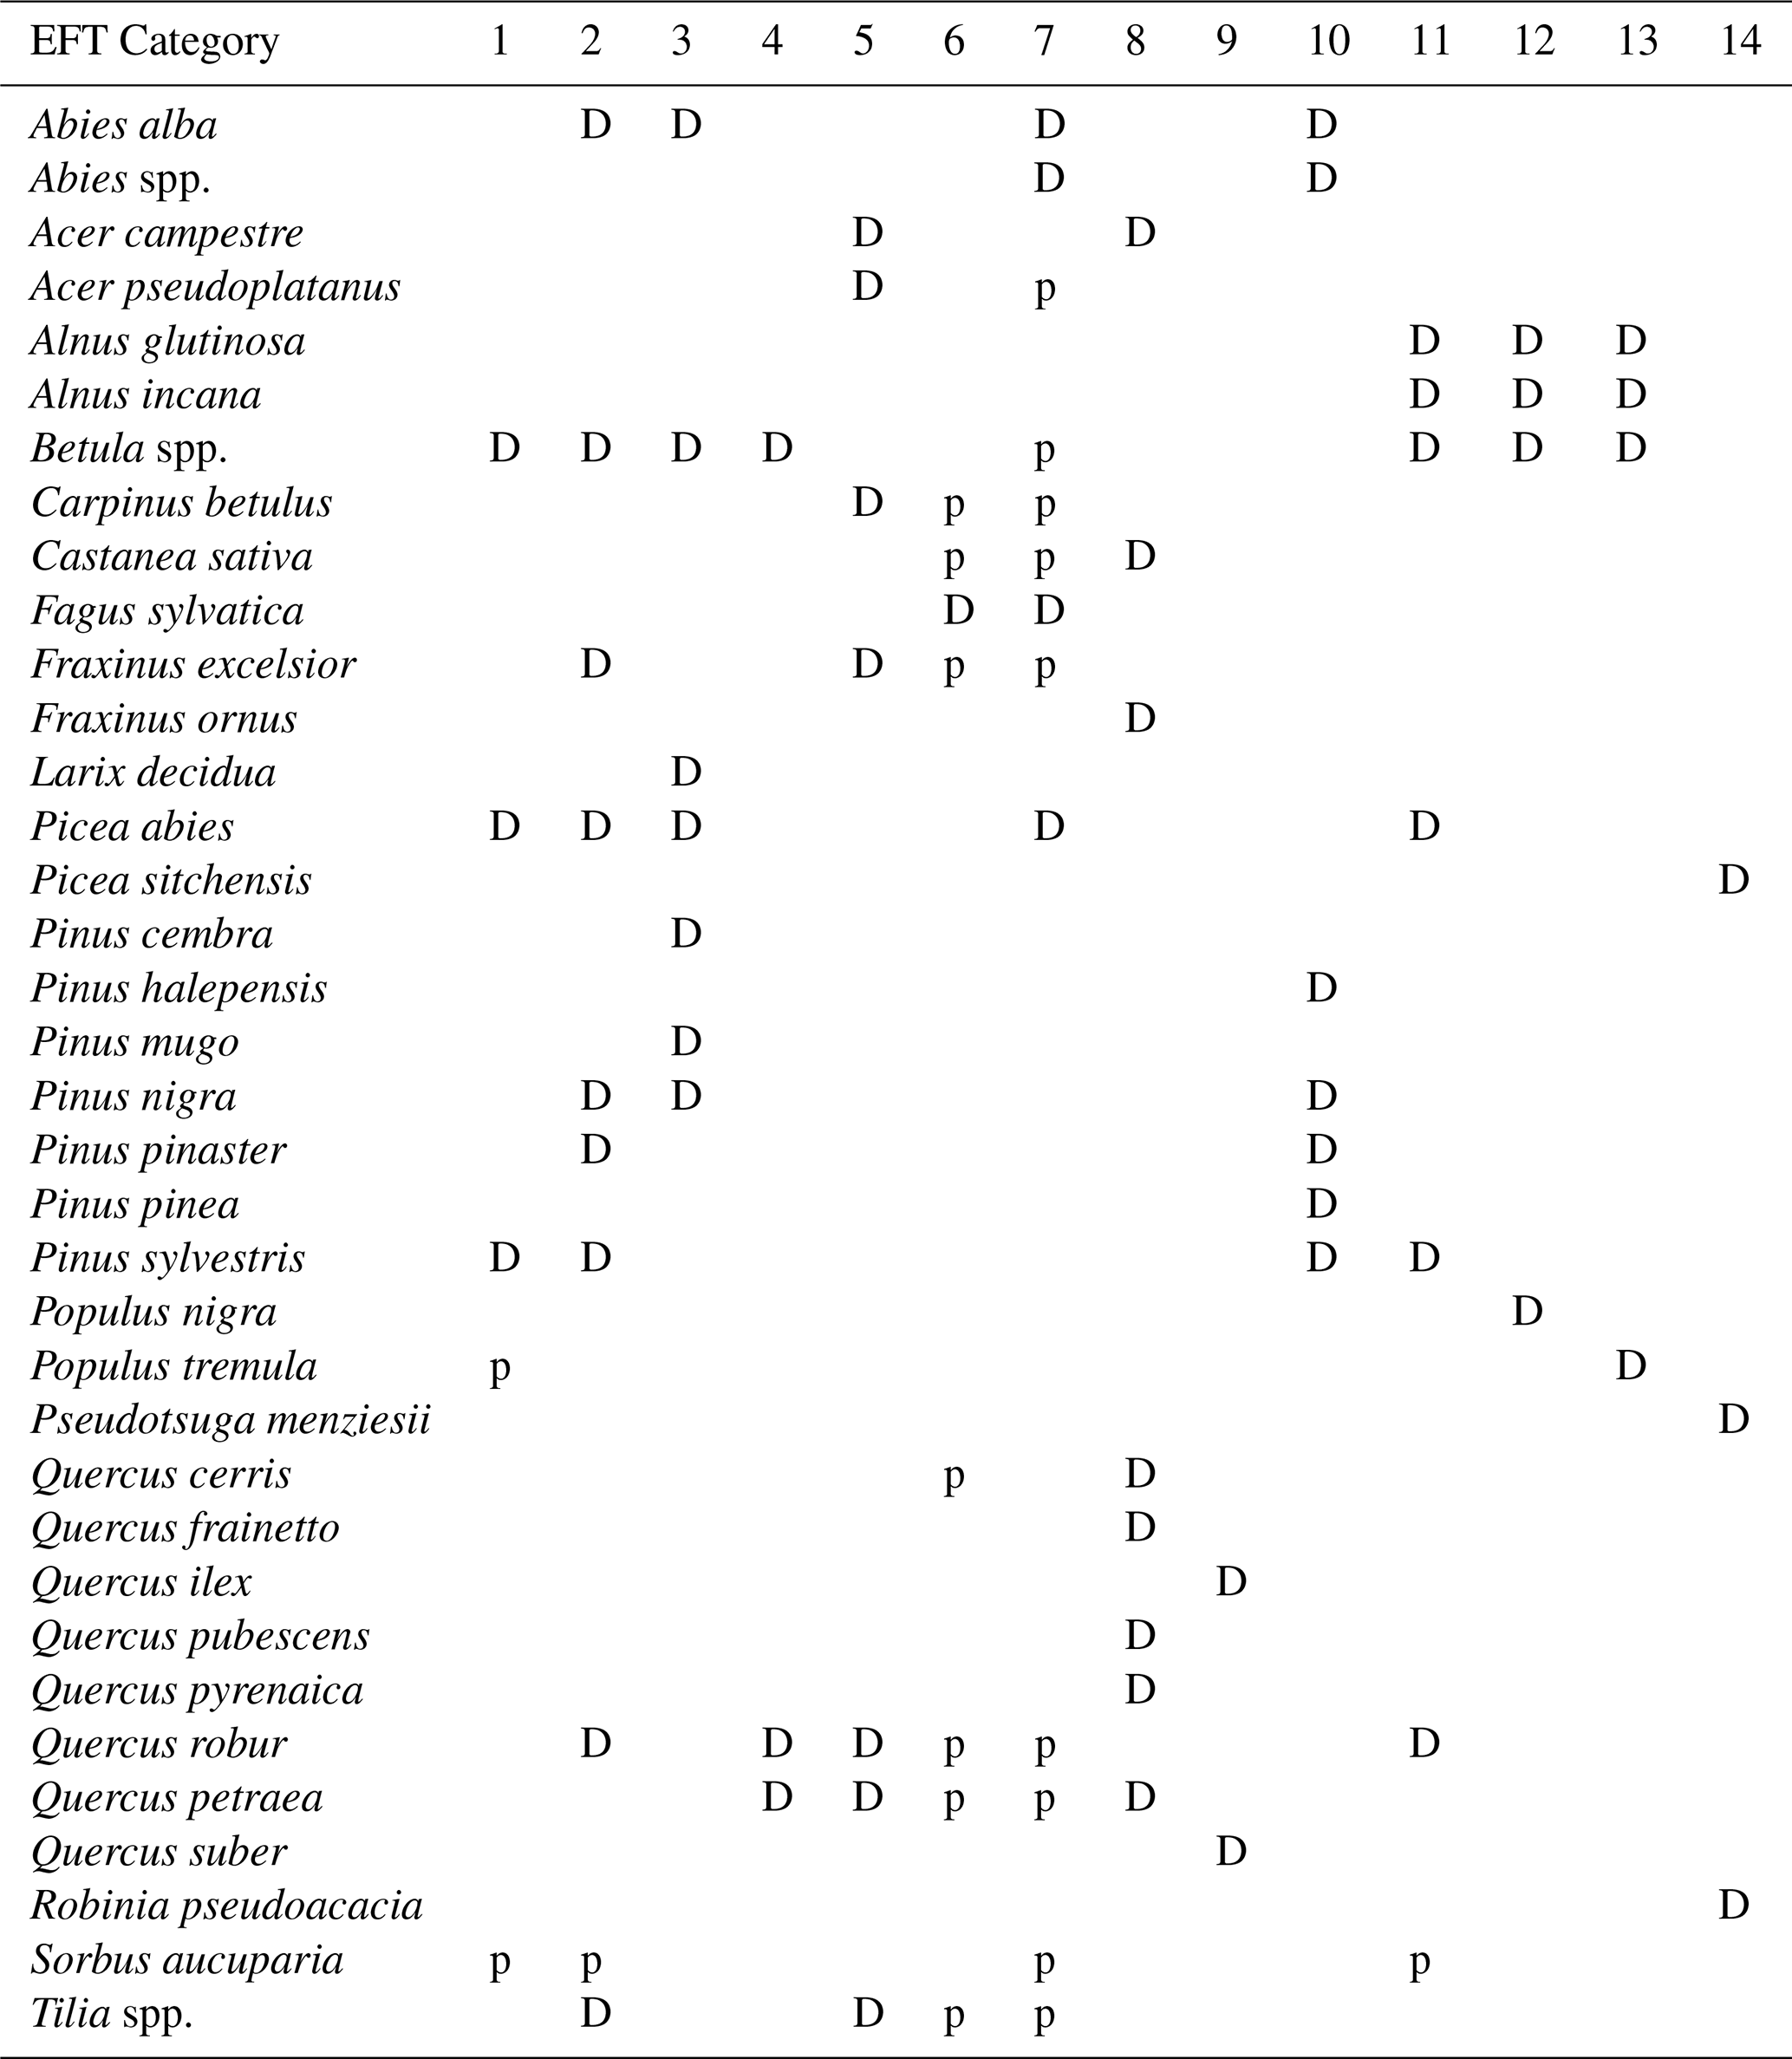
Considering all the above information, this study uses the JRC tree species RPP maps since they provide data based on a large list of forest tree species compared with the other two available datasets. The data related to the RPP were used to have quantitative data of occurrence of tree species. The complete list of species/groups of species available in the JRC dataset is presented in Table 2. From the complete list, we excluded Corylus avellana (L.), Prunus avium (L.), and Salix caprea (L.) since they are not identified as dominant or diagnostic species at the category level, nor as present species.
Table 2List of RPP maps available in the JRC dataset. “D” identify species that are dominant and diagnostic at category level. “p” are species that are only present.
Although the RPP maps are supplied for individual species, they are interpreted jointly in this study. Their combined ranking is used as an indicator of likely species-association patterns within the expert system, not as a direct measurement of stand composition or dominance. The resulting EFT categories therefore provide a continental-scale ecological stratification suitable for harmonised monitoring, modelling, and reporting, but they should not be used as substitutes for plot-level estimates of basal area, crown cover, biomass, or stand structure.
2.3.2 Available layers for EFTs classification
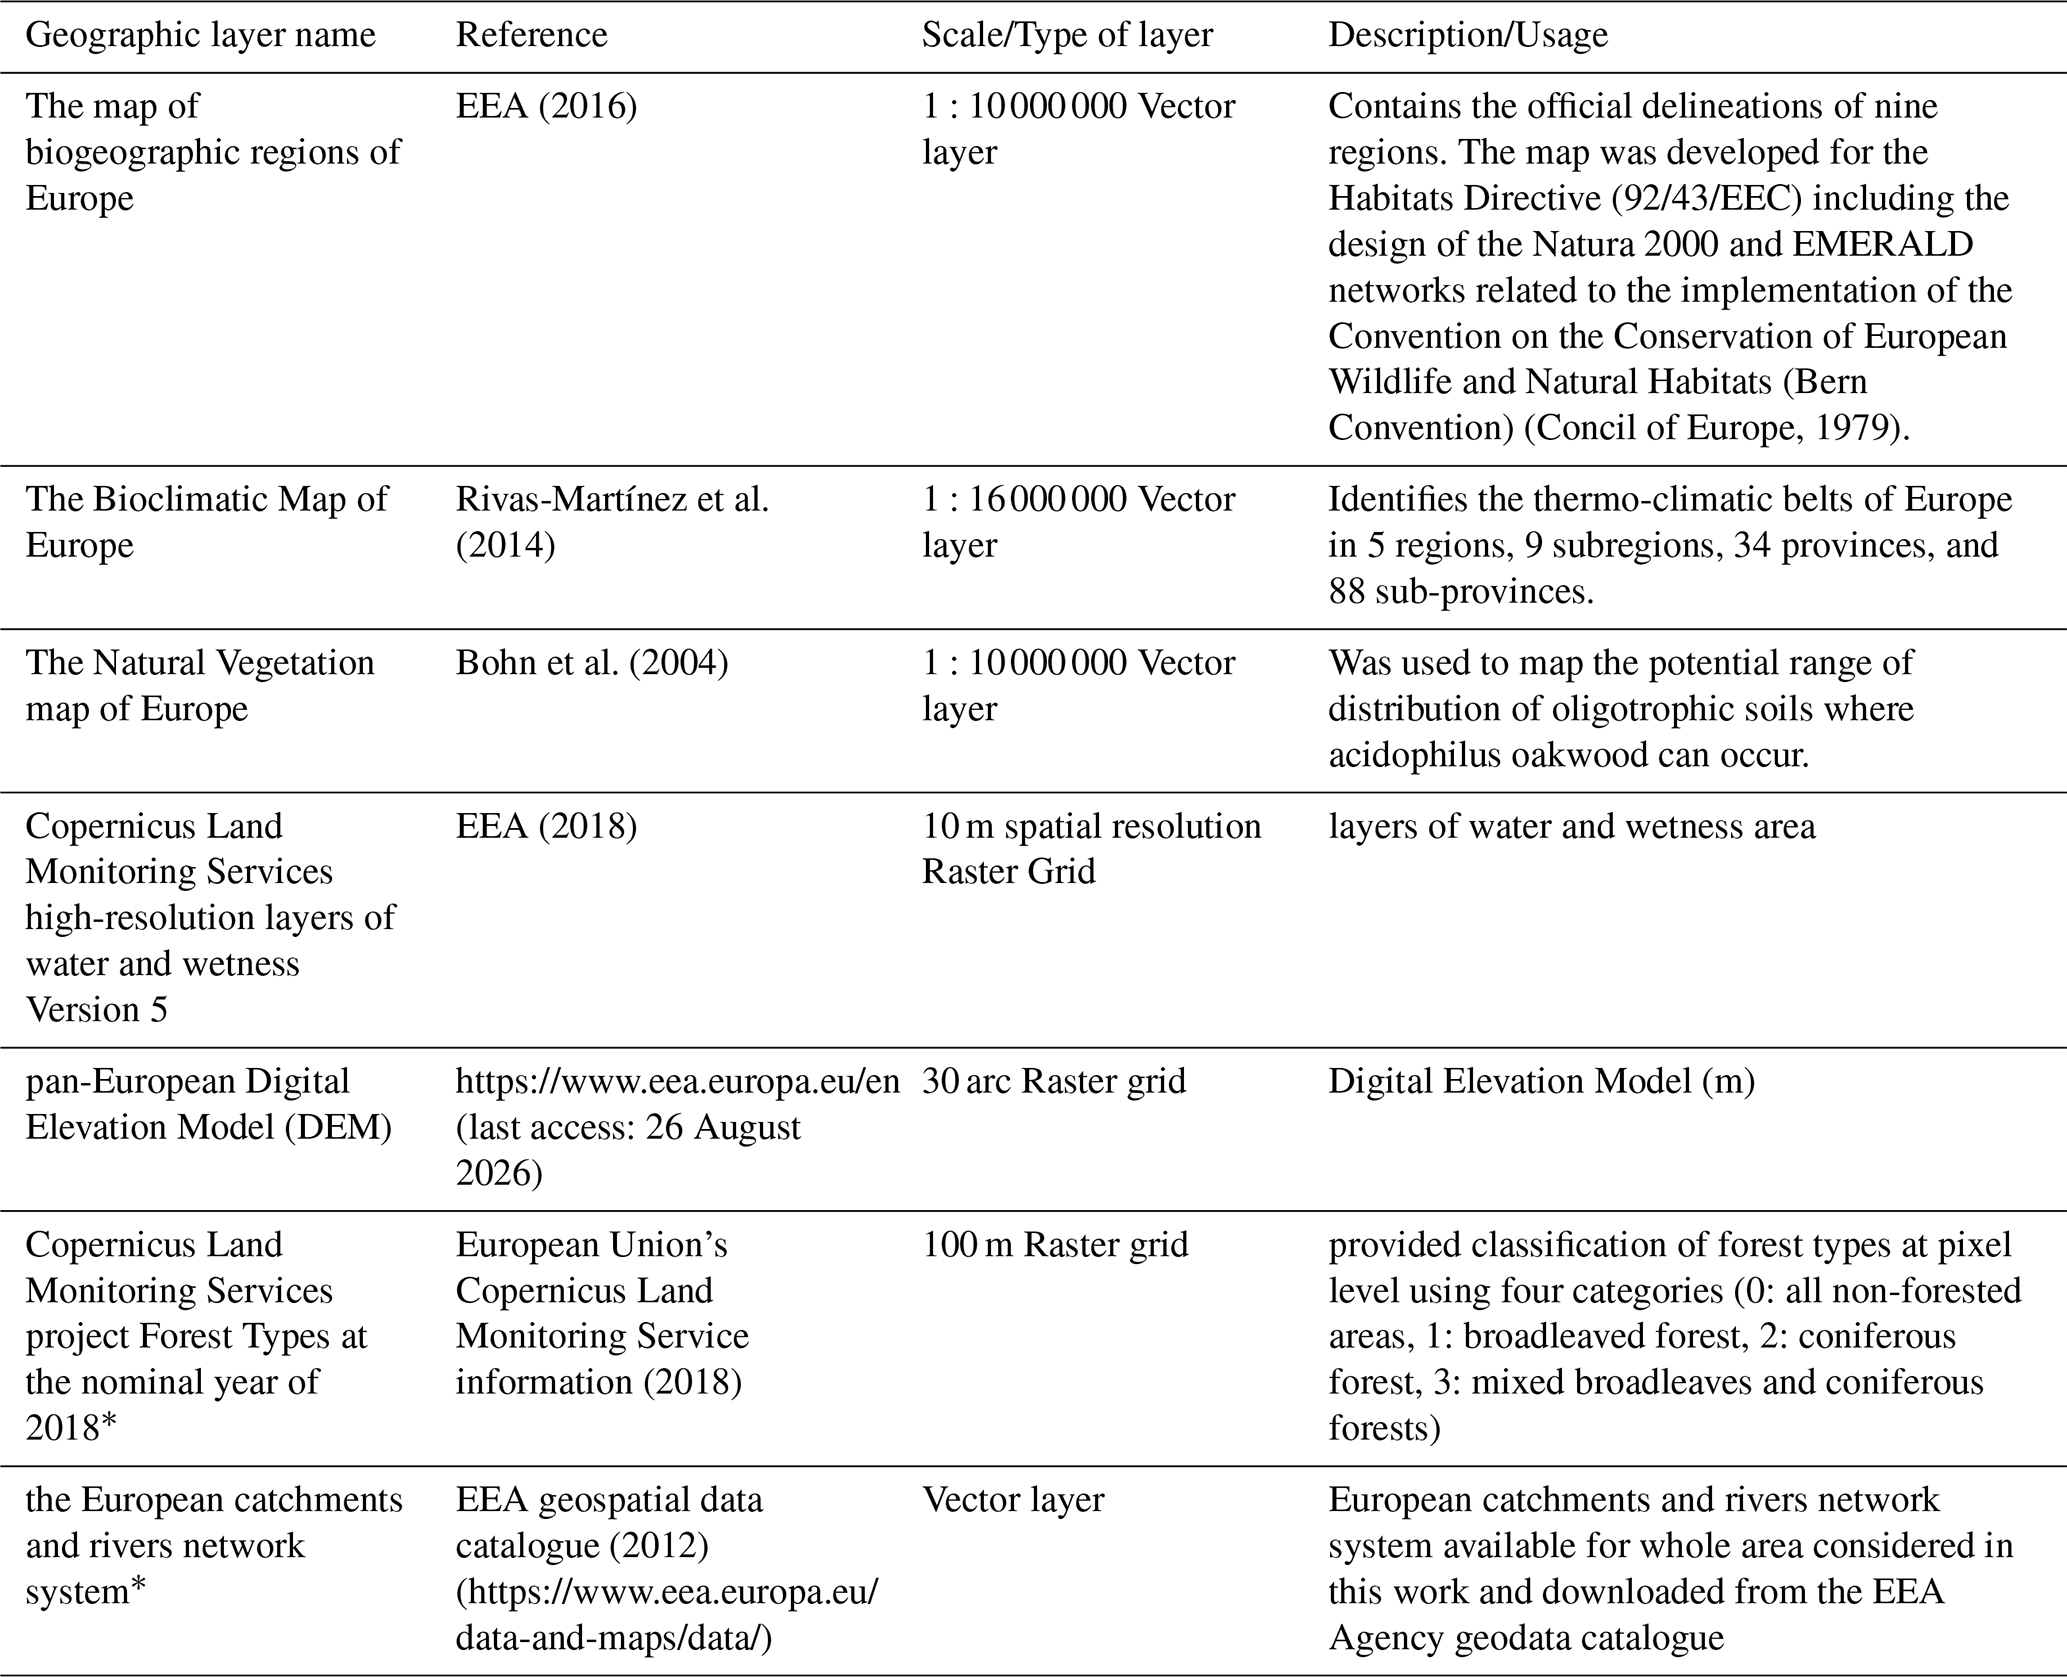
Because EFT classification reflects environmental, biological, and anthropogenic differentiation in addition to species composition (EEA, 2006; Barbati et al., 2014; Giannetti et al., 2018), the automated workflow requires spatial datasets representing these dimensions. We used the layers adopted by Giannetti et al. (2018) and added the Copernicus Forest Type 2018 product and the European catchments and rivers network (Table 3). The Copernicus product provides a harmonised 100 m classification of broadleaved, coniferous, and mixed forest and is used as a thematic constraint on the RPP layers, whereas the other layers define ecological break points among EFT categories.
Table 3Geographic layer for EFTs classification. The * indicate the two additional layers added in this work, while the other were already included in Giannetti et al. (2018).
2.4 Data preparation
2.4.1 Development of breaking-point masks to classify EFTs
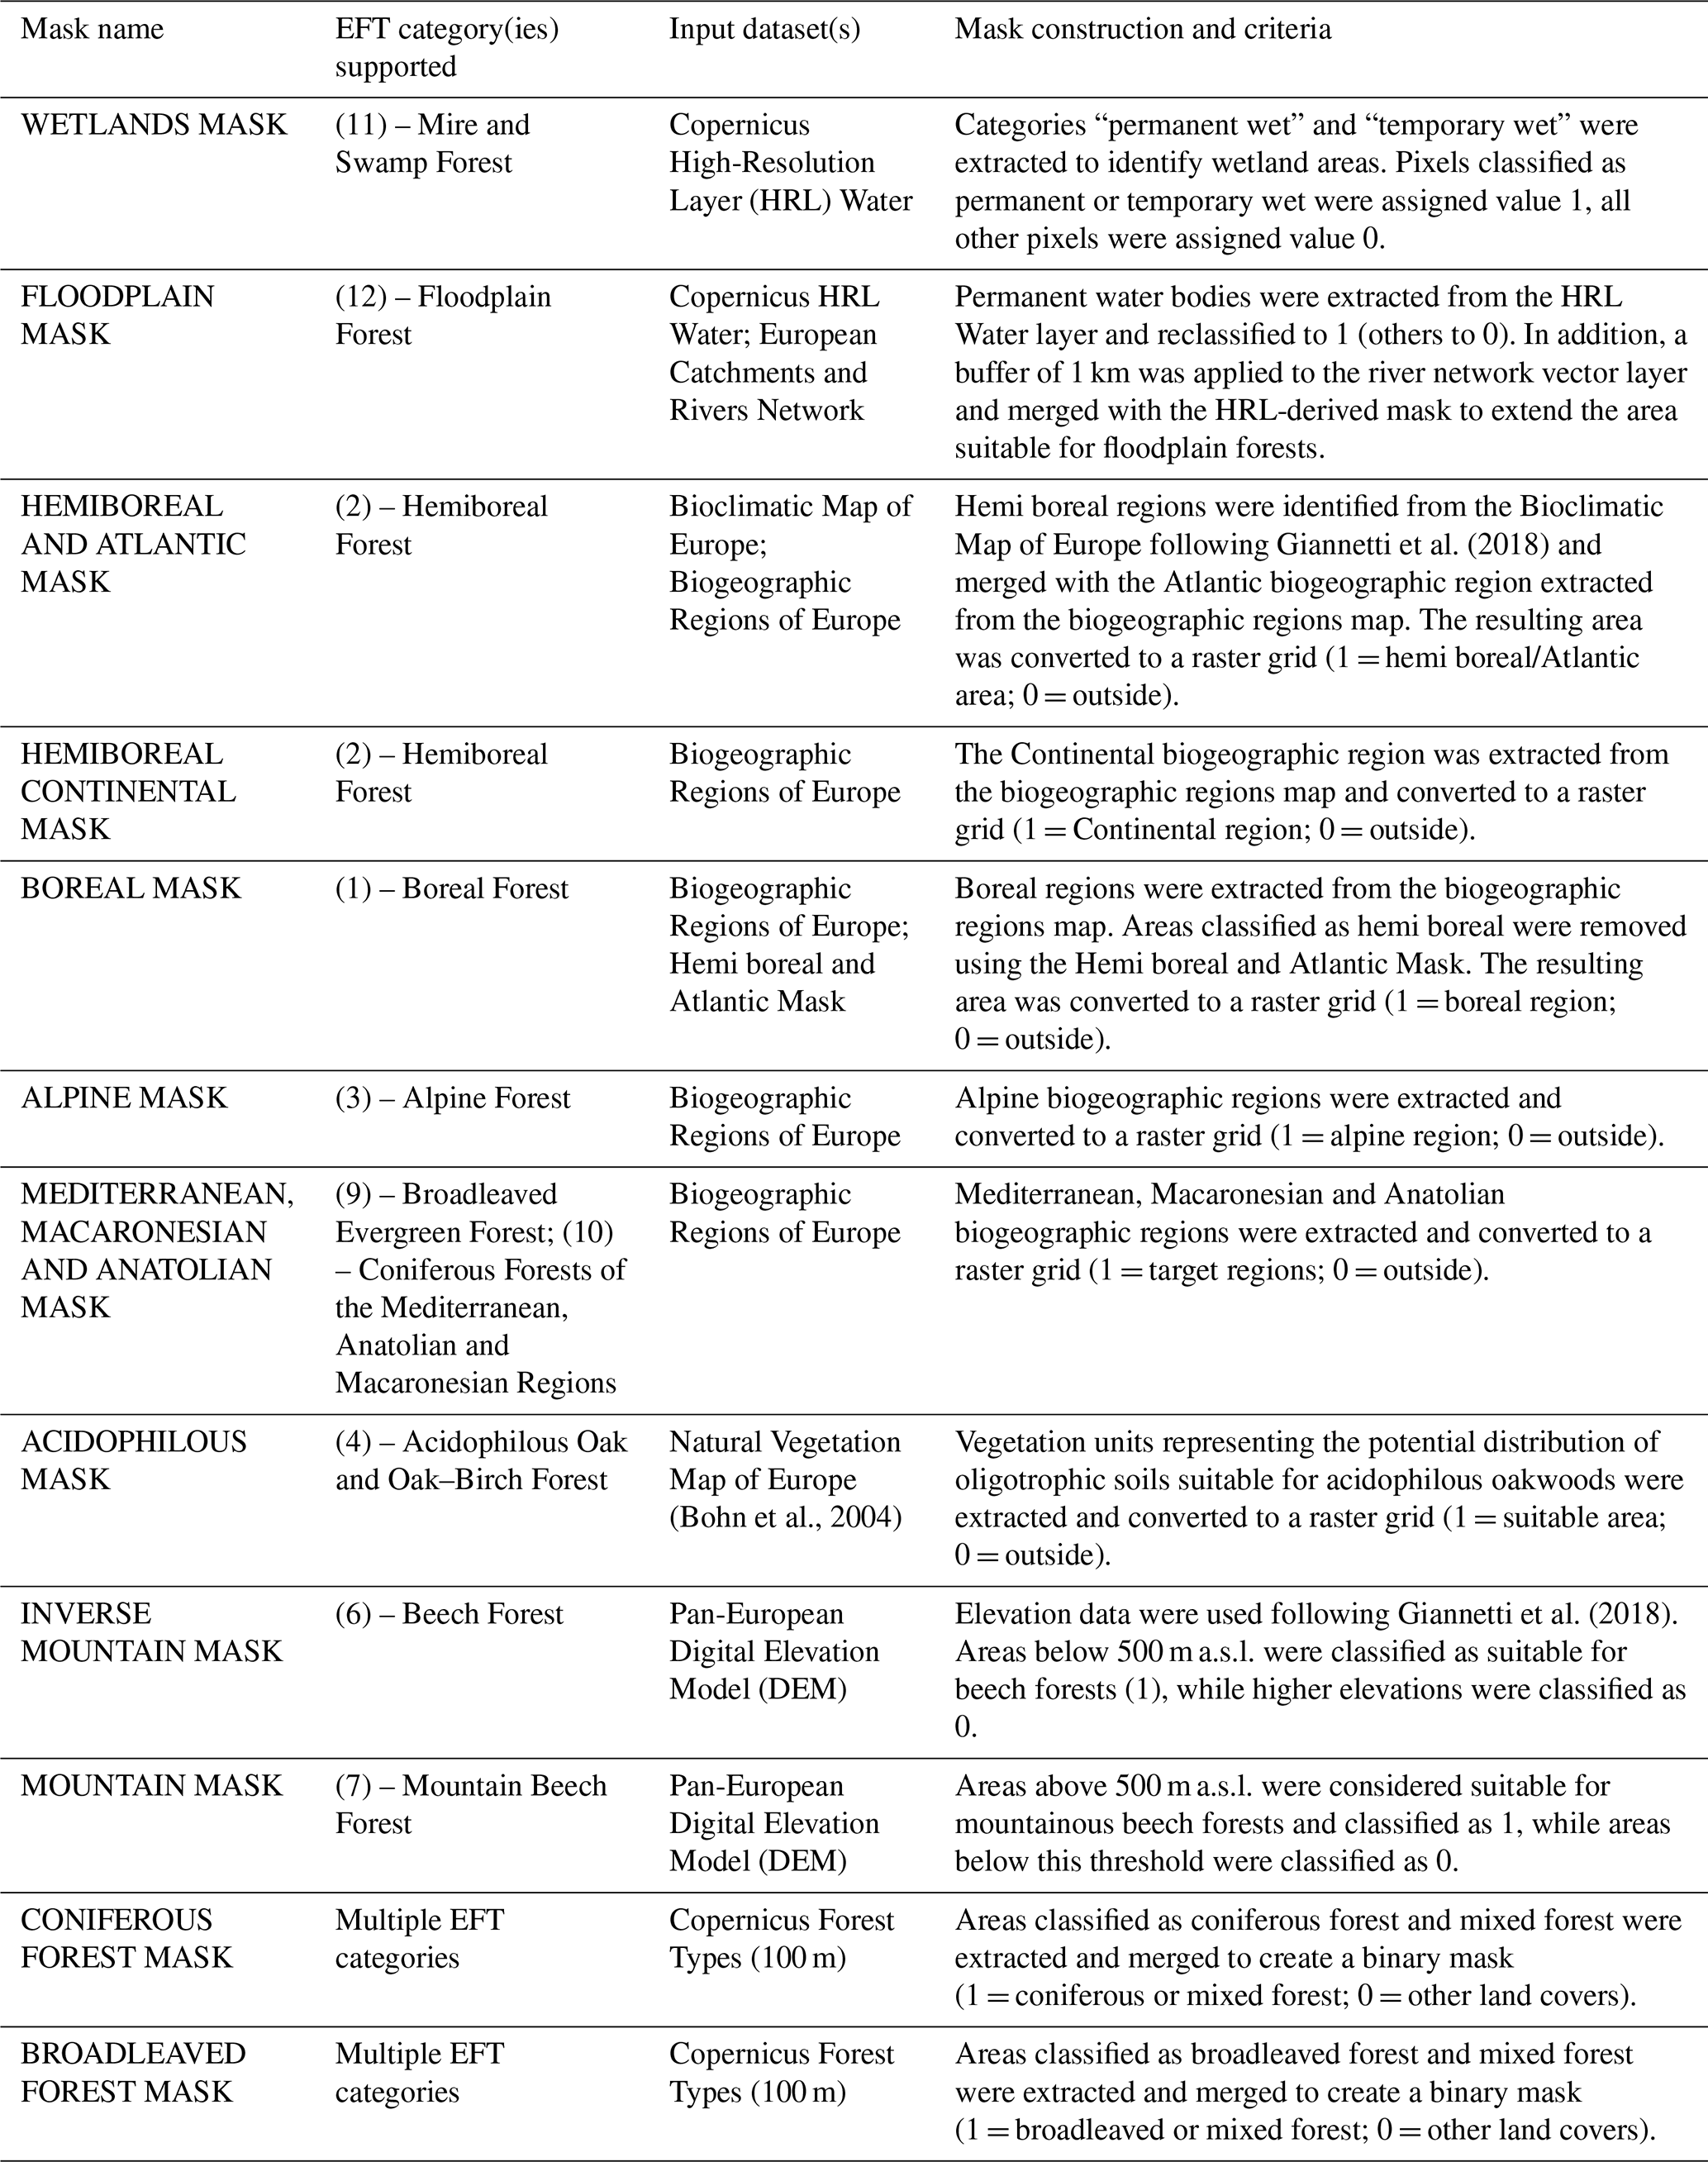
All the layers presented in the previous section were used to create different Boolean masks (1/0) to identify the breaking points necessary to classify the EFTs categories. These breaking points identified the environmental differences between categories and were identified by a literature review following the work done by Giannetti et al. (2018), the report of EEA (2006), and the work of Barbati et al. (2014).
Some of the masks were developed in accordance with the work of Giannetti et al. (2018) (i.e. Wetlands mask, boreal mask, alpine mask, Mediterranean, Micronesian and Anatolian mask, acidophilous mask, mountain mask and inverse mountain mask), while the other masks were created using additional datasets not yet available in 2018 to improve the classification.
Based on the geographic layers described in Sect. 2.3.2, the environmental and forest masks shown in Fig. 2 were derived using the criteria reported in Table 4. The figure illustrates their spatial extent and overlaps across Europe; the masks are binary constraints rather than continuous estimates of environmental suitability.
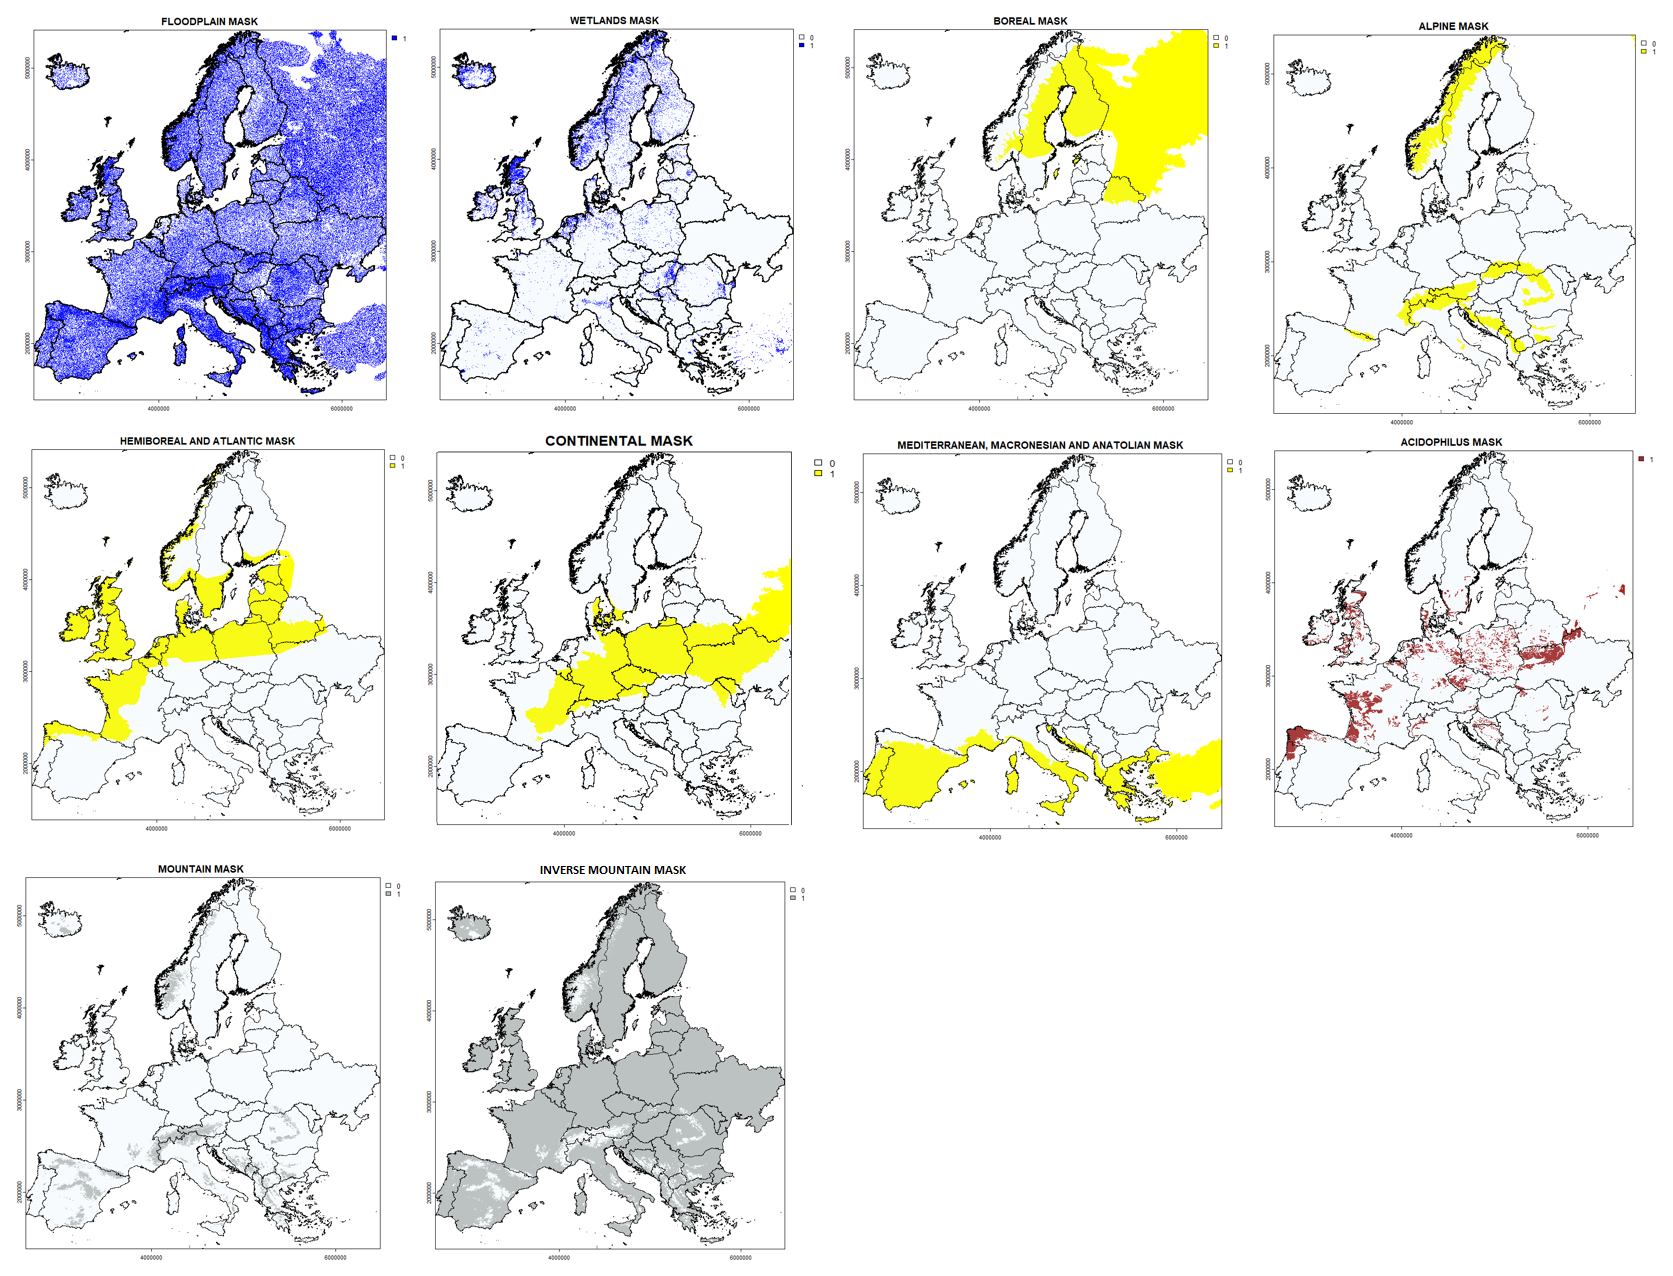
Figure 2Environmental “Breaking point” forest masks for EFTs classification.
Table 4Overview of the datasets and methodological steps used to derive the break-point masks for the EFT classification.
For categories (11) and (12), the masks represent harmonised proxies for wetness and river proximity rather than exhaustive peatland, soil-moisture, or flood-frequency inventories. Their continental consistency is advantageous for reproducibility, but local omissions, positional errors, and the 1 km river buffer may affect the delineation of narrow or fragmented habitats.
2.4.2 Preparation of the RPP maps for EFTs classification
Before EFT classification, the RPP maps were harmonised with the Copernicus Forest Type 2018 product (Copernicus Land Monitoring Service, 2021). The Copernicus layer supplies broadleaved, coniferous, and mixed-forest information on a 100 m grid and is used as an ancillary thematic constraint. This harmonisation improves interoperability and ensures consistency with an operational pan-European forest product. It does not create new species-occurrence information below the native 1 km resolution of the JRC RPP maps.
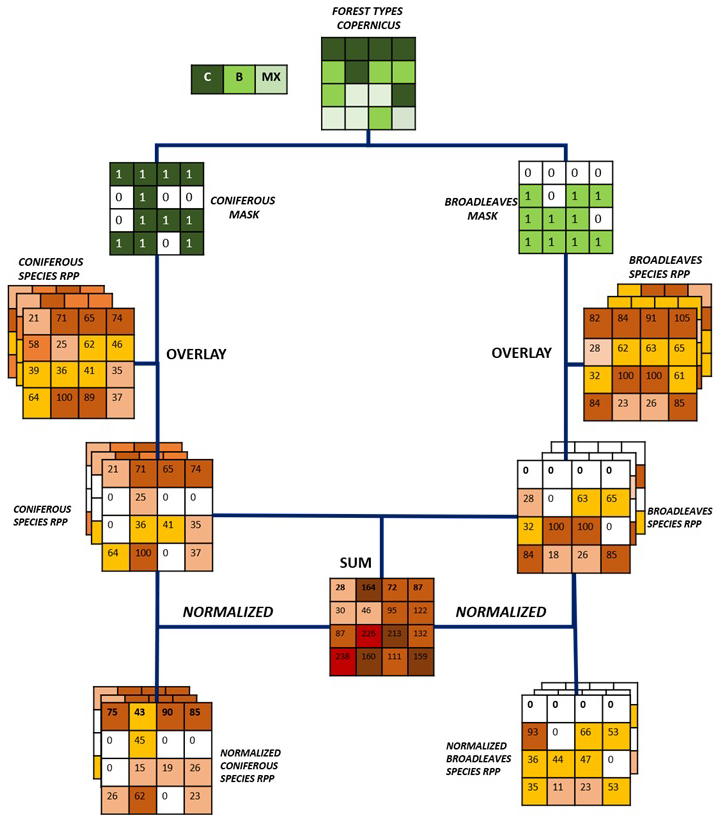
First, the JRC RPP rasters were resampled to the 100 m Copernicus grid and then constrained using the broadleaved and coniferous forest masks. RPP values for broadleaved taxa were set to zero in pixels classified by Copernicus as purely coniferous forest, and RPP values for coniferous taxa were set to zero in pixels classified as purely broadleaved forest; mixed-forest pixels retained both components. Thus, the 100 m product should be interpreted as a spatially disaggregated categorical representation constrained by higher-resolution leaf-type information, not as a downscaling that increases the intrinsic ecological precision of the 1 km RPP data. The 100 m Copernicus product was selected because it includes an explicit mixed-forest class, which is required to retain broadleaved-coniferous mixtures. Processing was performed in R using the terra and rgdal packages.
Secondly, the RPP maps were subjected to a normalization process. Firstly, all available RPP maps by JRC were summed up pixel-by-pixel, and we obtained the SUM RPP MAP. Subsequently, each RPP map corresponding to a specific species was divided into pixel-by-pixel by the SUM RPP MAP obtained before. The resulting raster was then multiplied by 100 to complete the normalization. At the end, we obtained a normalized RPP map for each tree species, which was used as input for the rules-based expert system classification algorithm. The flowchart for the preparation of RPP maps is reported in Fig. 3.
2.4.3 Pixel-level identification of first- and second-ranked RPP taxa
For each forest pixel, the harmonised species-level relative probability of presence (RPP) values were ranked in descending order. The species with the highest and second-highest RPP values were retained as the first-ranked and second-ranked species, respectively (Fig. 4). These labels refer only to their ordering in the RPP data and do not imply structural dominance in basal area, crown cover, biomass, or stem density.
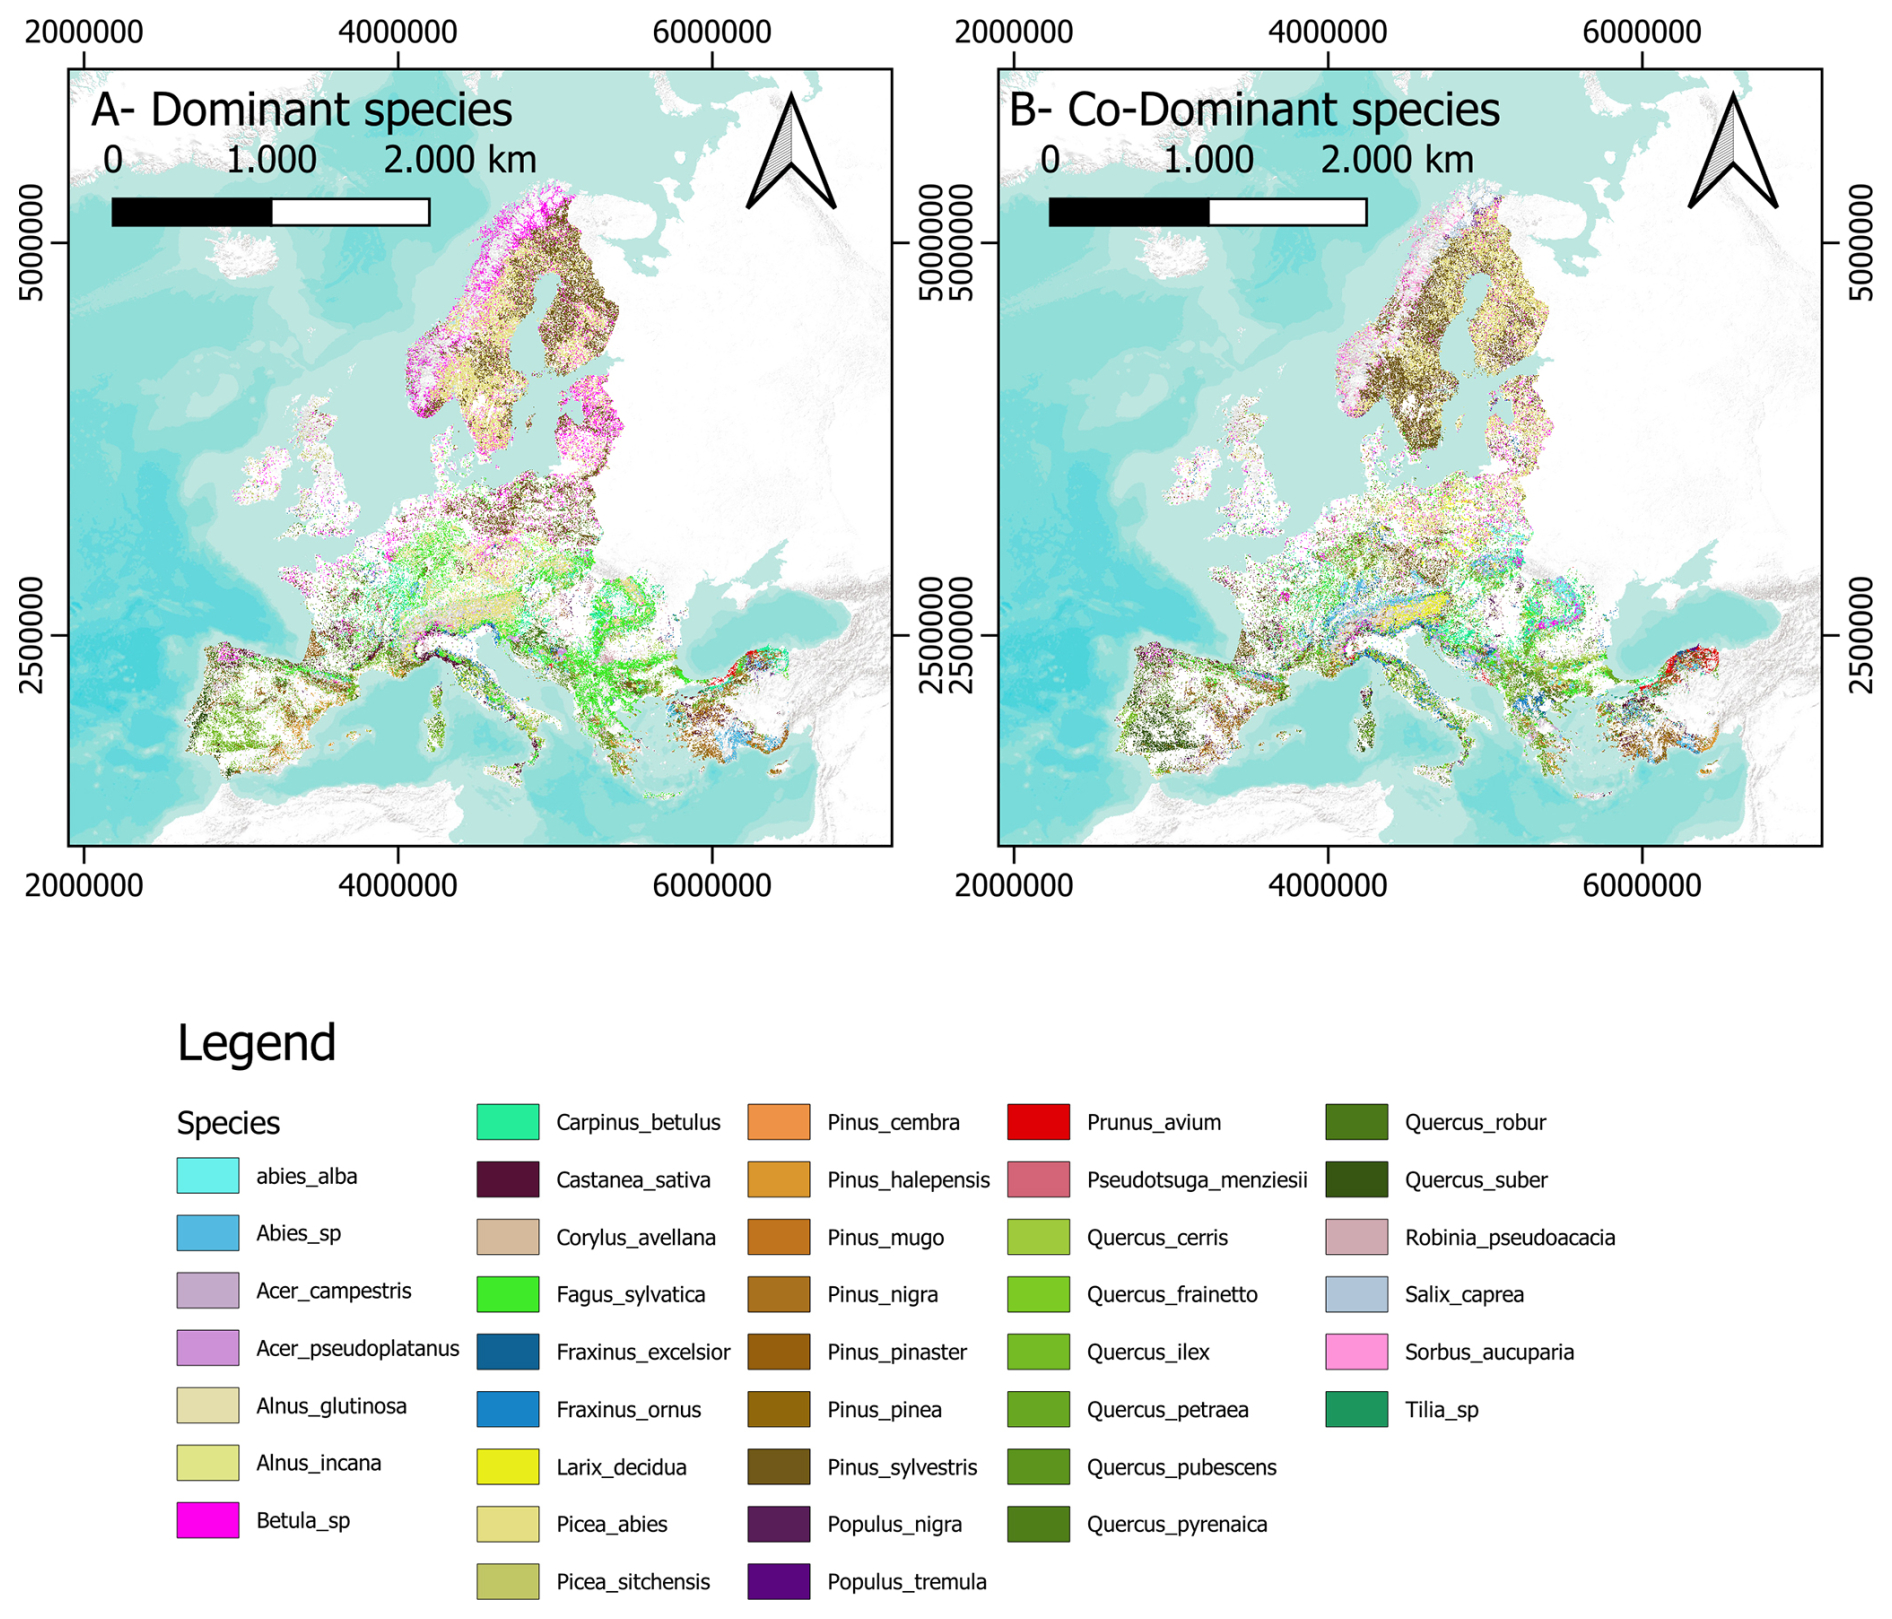
Figure 4First- and second-ranked RPP taxa based on the RPP maps. Background map source: Esri, World Terrain Base | Powered by Esri.
The two top-ranked RPP values were used as indicators of the most likely species association in each pixel. Unlike the plot-based method of Giannetti et al. (2018), which used measured basal-area proportions, the present gridded approach does not apply a quantitative structural-dominance threshold and does not use RPP as a proxy for basal area. Across 87 % of the forested area, the two top-ranked taxa jointly account for 40 %–100 % of the sum of the normalised RPP values considered in each pixel (Fig. 5). This statistic supports retaining two taxa rather than only the highest-ranked taxon, while the ecological masks and rule hierarchy provide additional constraints on EFT assignment.
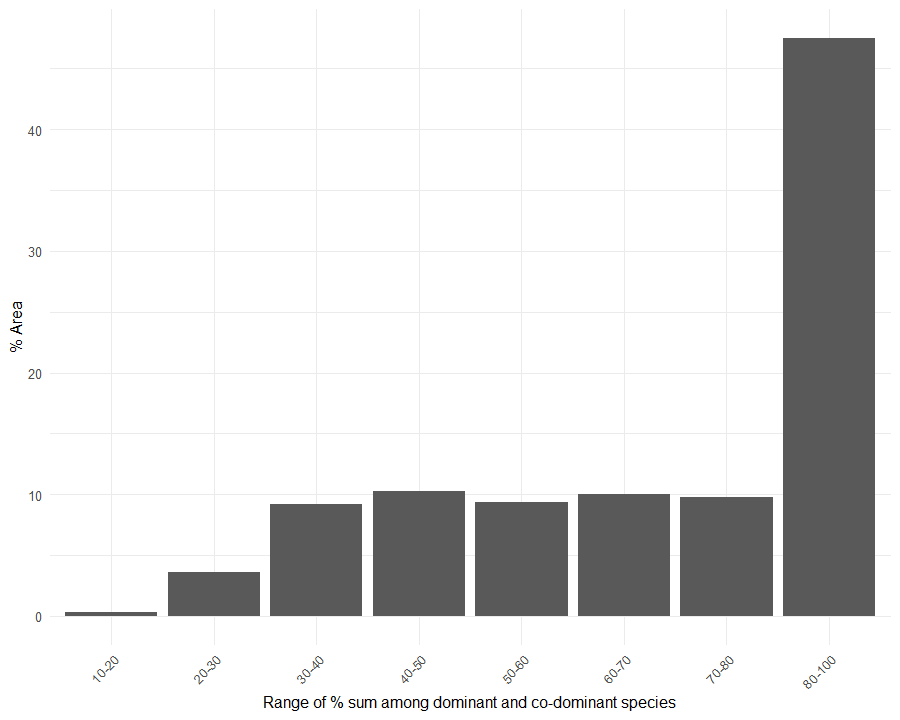
Figure 5Distribution of forested area (%) across classes of the combined normalized RPP contribution of the two highest-ranked taxa at pixel level. The histogram shows that, across most of the study area, the combined normalized RPP contribution of the two highest-ranked taxa exceeds 40 %. This pattern supports retaining the two highest-ranked taxa in the classification workflow and should not be interpreted as species abundance or structural dominance.
Accordingly, the classification rules, described in the next section, were redesigned using the species codes of the first- and second-ranked RPP taxa as the primary decision variables.
2.5 Rule-based algorithm
As presented in the work done by Giannetti et al. (2018), a rule-based expert system, intended as a knowledge-based system (Capelo et al., 2007; Pérez-Ortiz et al., 2016), was developed based on available datasets to create the EFTs raster grid map. This expert system is based on different recursive rules identifying the EFTs categories. The rule-based expert system algorithm uses as input data the first- and second-ranked RPP taxa (Sect. 2.4.3) to construct the classification of EFTs categories and is a revision of the one already developed by Giannetti et al. (2018) for plot level classification.
The rule-based framework links likely species associations, environmental variables, and spatial constraints to support European-scale monitoring, modelling, and reporting. The wall-to-wall grid provides a common spatial framework for cross-country comparisons and ecological stratification. Its intended interpretation is continental to regional; the dataset is not designed to resolve stand-level composition or local management units.
The EFT classification was implemented through a sequential rule-based approach (Table 5), in which each pixel was evaluated against predefined conditions reflecting the two top-ranked RPP species and its ecological context. Dedicated hydrological masks were evaluated early in the decision sequence for the azonal categories (11) (Mire and Swamp Forest) and (12) (Floodplain Forest), before assignment to more widespread zonal types. Other biogeographic, bioclimatic, and physiographic masks were then combined with the ranked species information as shown in Fig. 6.
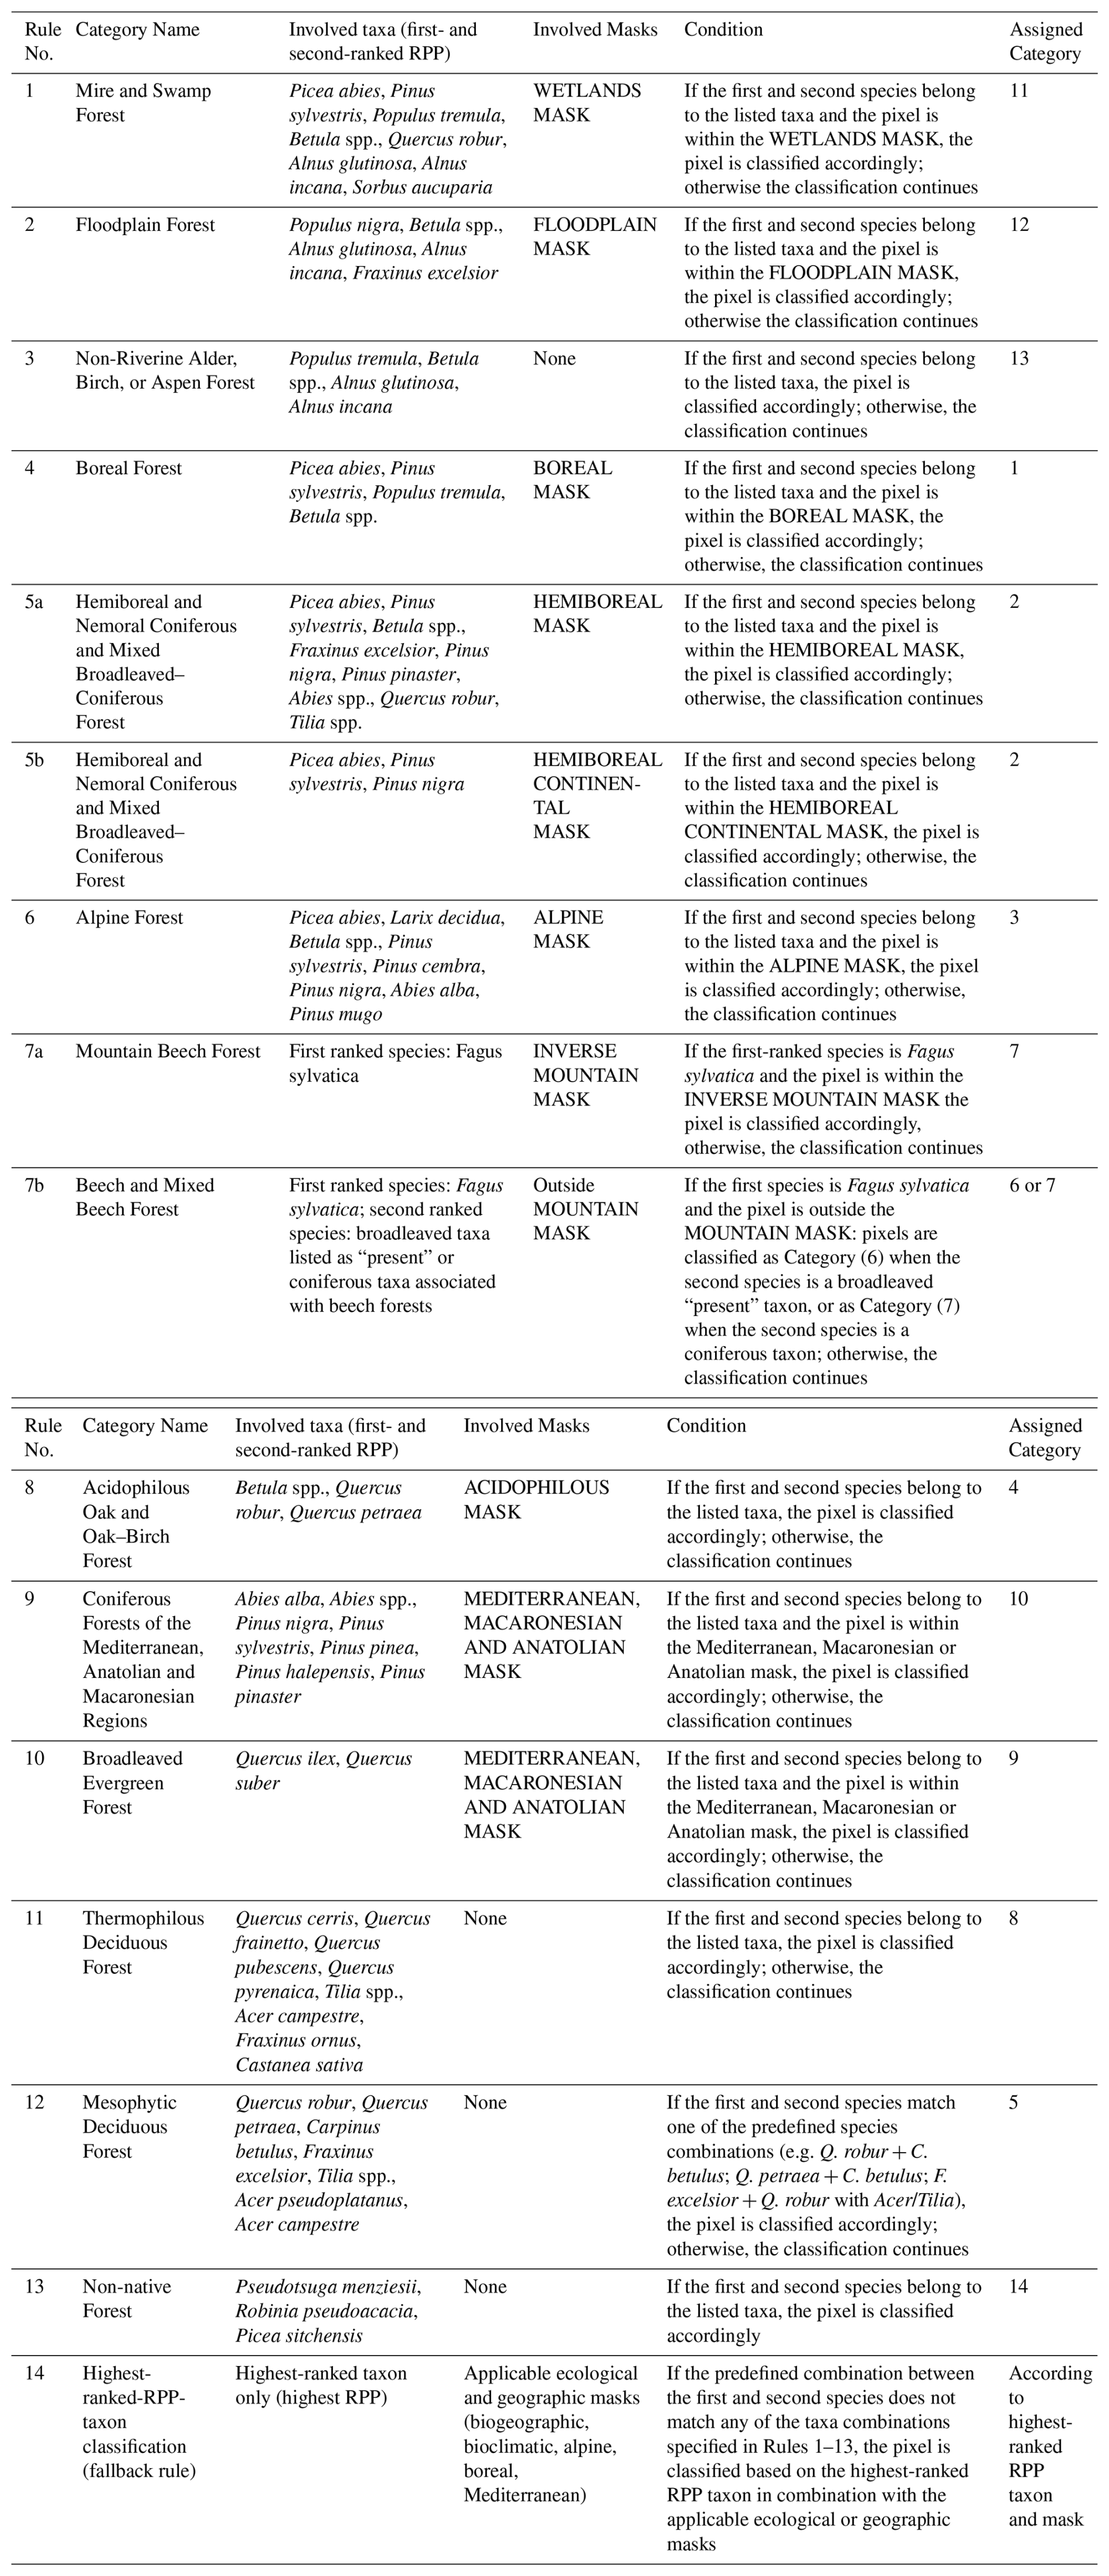
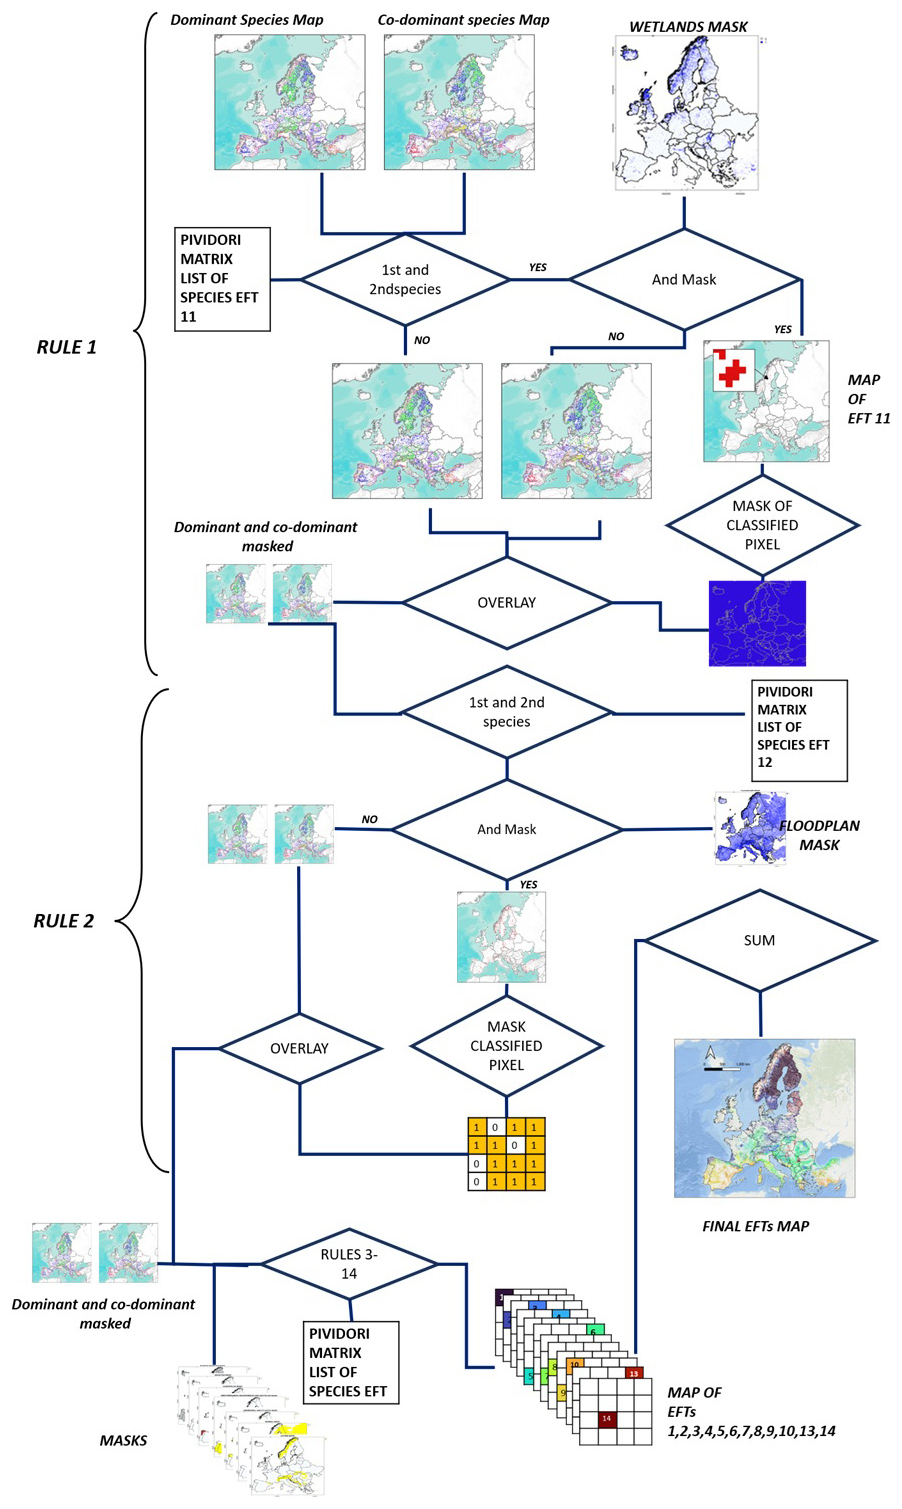
Figure 6Overview of the flowchart of the Rule-based algorithm with the details of the geoprocessing of the first two rules. Background map source: Esri, World Terrain Base | Powered by Esri.
Rules were applied hierarchically, and pixels that did not satisfy a rule were passed to the next one. Most categories were identified from explicit combinations of the first- and second-ranked RPP species, constrained where appropriate by wetland, floodplain, boreal, alpine, Mediterranean, or other ecologically meaningful masks. Because the masks are Boolean, errors or omissions in an underlying mask can propagate directly to the final class assignment, especially for spatially restricted azonal categories.
In cases where none of the predefined combinations between first- and second-ranked RPP taxa were met (Rules 1–13), a fallback classification strategy was applied to ensure complete spatial coverage of the EFT raster grid. Under this final rule (Rule 14), pixels were classified solely based on the highest-ranked RPP taxon, in combination with the applicable ecological or geographic masks. This approach allowed all pixels to be consistently assigned to an EFT category, while preserving the ecological coherence of the classification and avoiding the exclusion of valid forest types due to incomplete species combinations.
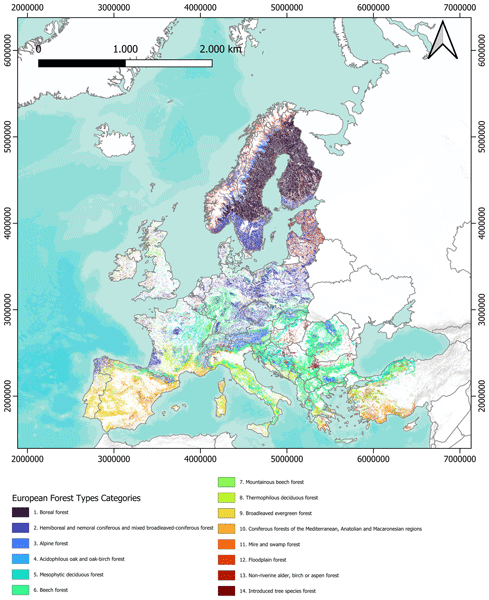
The rule-based expert system enables the classification of all EFTs categories in the forested pixels (Fig. 7).
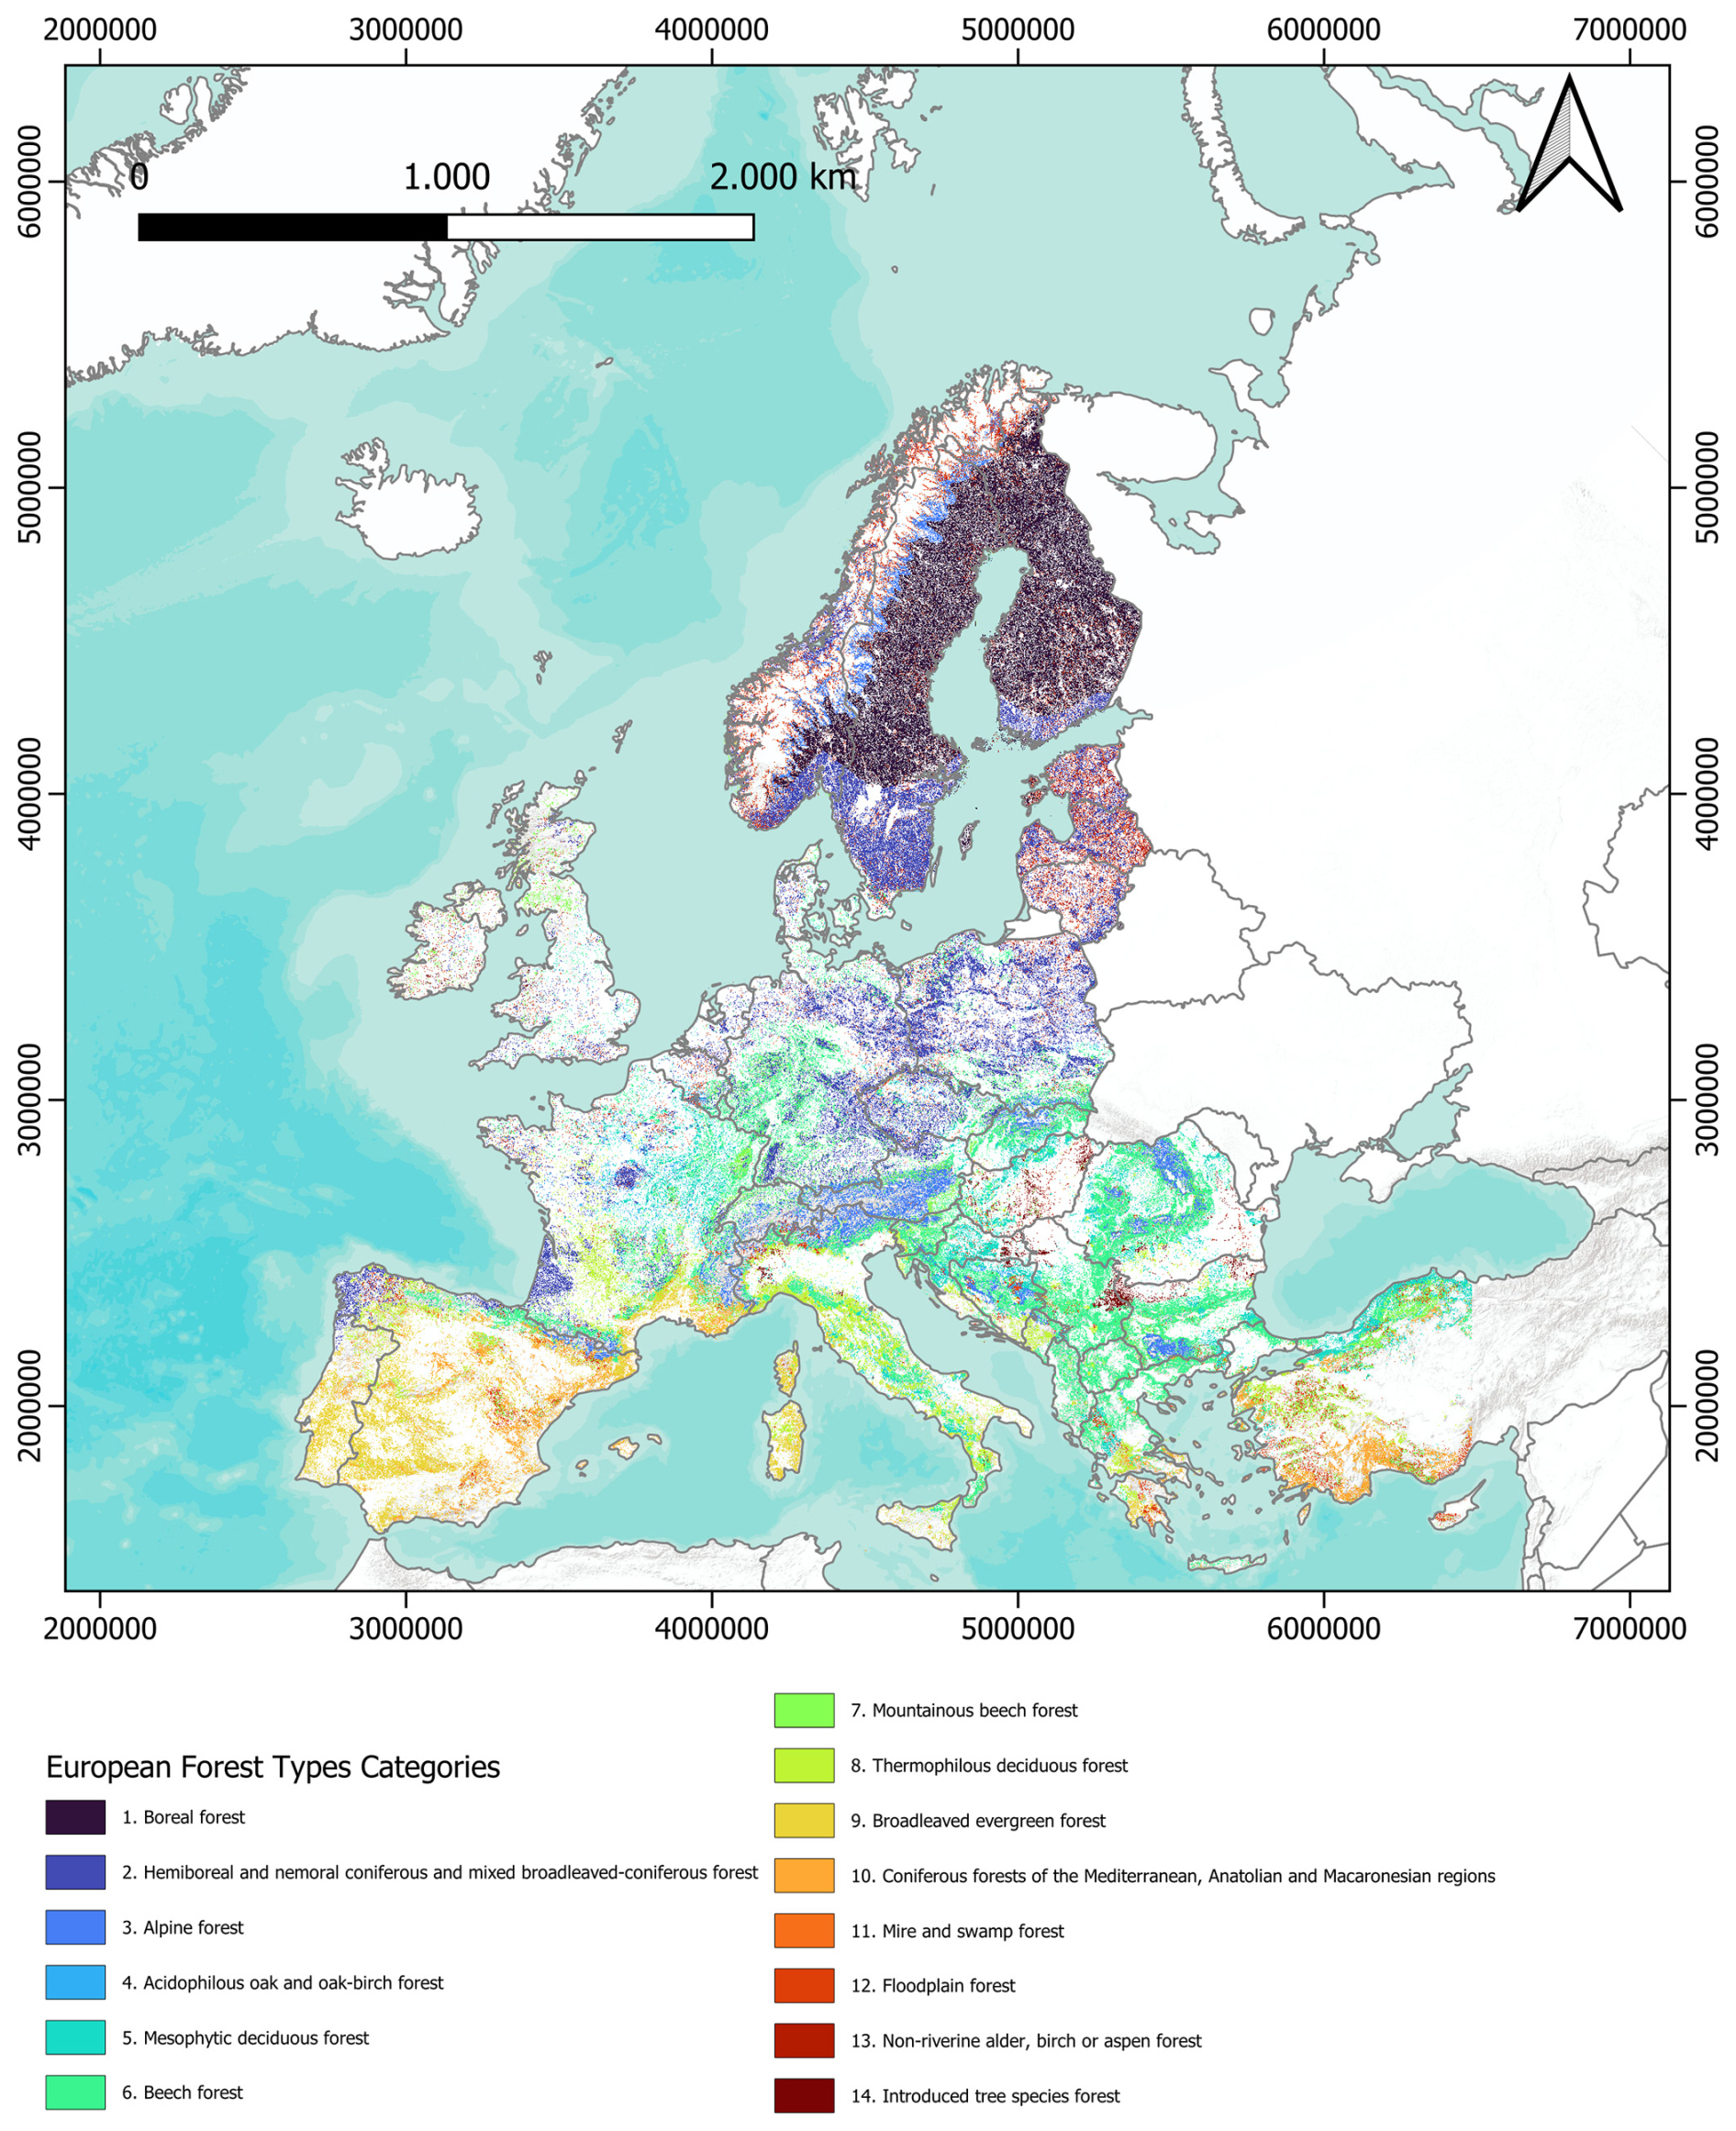
Figure 7European Forest Types gridded dataset map. Background map source: Esri, World Terrain Base | Powered by Esri.
The area and the percentage of forest area covered by each EFT category were extracted based on the pixel level classification. In the total forested area of Europe, category (2) – Hemi boreal and Nemoral Coniferous and Mixed Broadleaved-Coniferous Forest covers the largest area, representing 19.61 % of the total forested area, followed closely by (1) – Boreal Forest (19.17 %). Other major categories include (6) – Beech Forest (17.95 %), (3) – Alpine Forest (7.29 %), and (12) – Floodplain Forest (7.56 %). Smaller contributions are observed for (8) – Thermophilous Deciduous Forest (5.92 %), (9) – Broadleaved Evergreen Forest (5.88 %), (5) – Mesophytic Deciduous Forest (5.28 %), (7) – Mountain Beech Forest (3.74 %), (10) – Coniferous Forests of the Mediterranean, Anatolian and Macaronesian Regions (3.20 %), (13) – Non Riverine Alder, Birch or Aspen Forest (2.26 %), (14) – Non-native Forest (1.10 %), (11) – Mire and Swamp Forest (0.38 %), and (4) – Acidophilous Oak and Oak-Birch Forest (0.66 %) (Figs. 8 and 9).
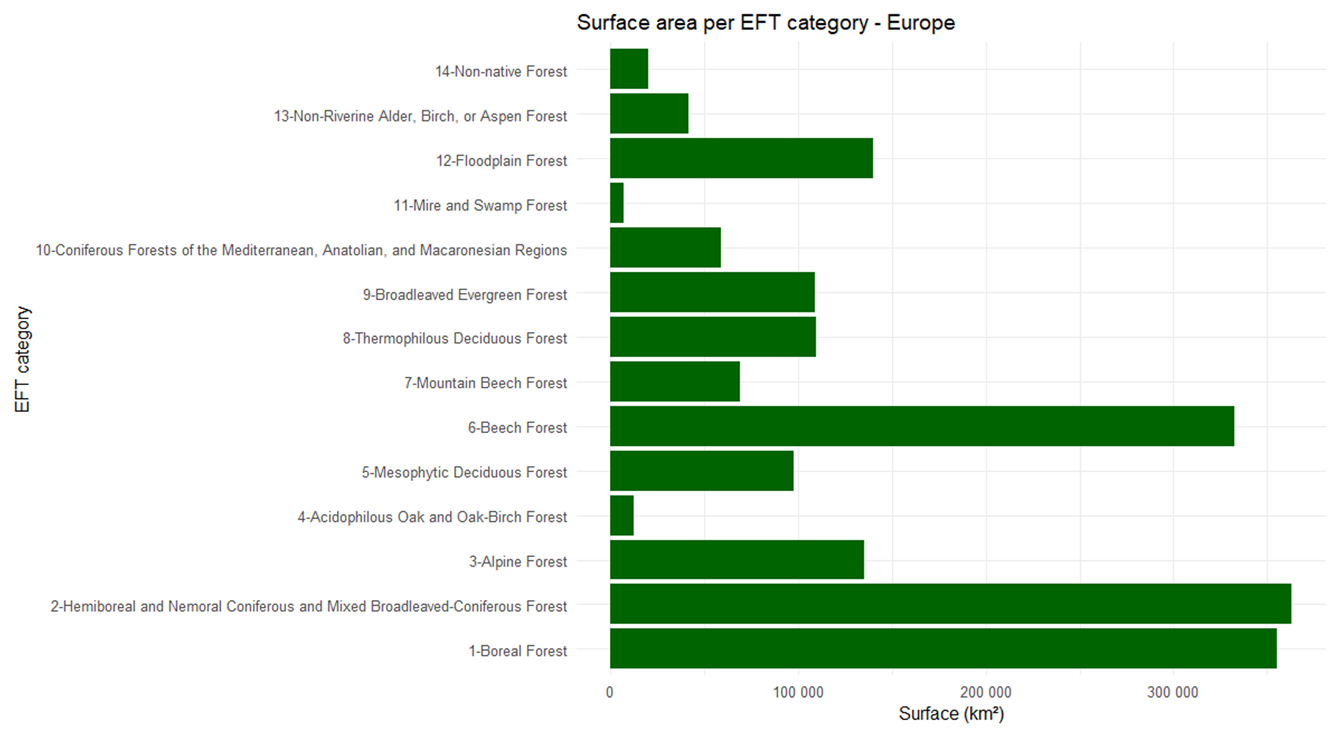
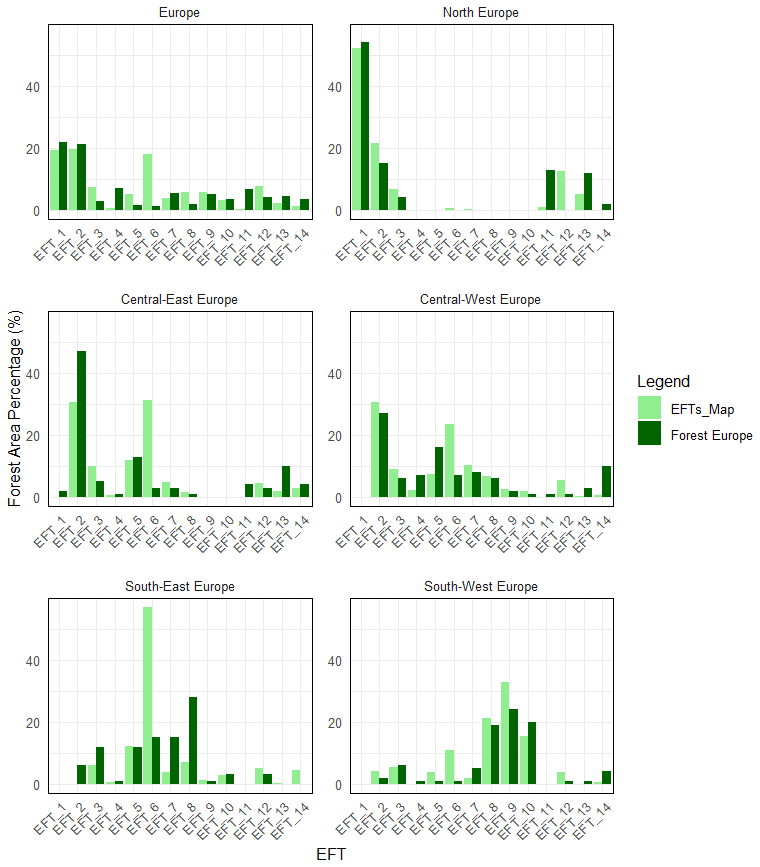
Figure 9Comparison between the forested area for each EFTs categories based on the State of Europe's Forests 2011 report (dark green) and EFTs map (light green) for all Europe and for the 5 identified geographic area: Central-east Europe, Central-West Europe, North Europe, South-East Europe, South-West Europe.
In Northern Europe, (1) – Boreal Forest accounted for the largest forested area (52.3 %), followed by (2) – Hemi boreal and Nemoral Coniferous and Mixed Broadleaved-Coniferous Forest (21.6 %) and (13) – Non-Riverine Alder, Birch, or Aspen Forest (12.5 %) (Fig. 9).
In Central-East Europe, the dominant categories were (12) – Floodplain Forest (31.2 %), (2) – Hemi boreal and Nemoral Coniferous and Mixed Broadleaved-Coniferous Forest (30.7 %), and (3) – Alpine Forest (9.9 %). Similarly, in Central-West Europe, the largest forested areas were (2) – Hemi boreal and Nemoral Coniferous and Mixed Broadleaved-Coniferous Forest (30.6 %), (12) – Floodplain Forest (23.4 %), and (7) – Mountain Beech Forest (10.2 %) (Fig. 9). Central-West Europe exhibited the highest diversity, with (10) out of (14) EFTs categories present (Fig. 9).
In South-West Europe, (10) – Coniferous Forests of the Mediterranean, Anatolian, and Macaronesian Regions covered the largest area (32.9 %), followed by (8) – Thermophilous Deciduous Forest (21.3 %), (3) – Alpine Forest (15.4 %), and (5) – Mesophytic Deciduous Forest (3.8 %) (Fig. 9).
In South-East Europe, (12) – Floodplain Forest dominated the landscape (57.0 %), followed by (5) – Mesophytic Deciduous Forest (12.0 %), (8) – Thermophilous Deciduous Forest (6.9 %), and (3) – Alpine Forest (5.9 %) (Fig. 9).
The comparison between the country-level and regional EFT area shares derived from the map and those reported in the State of Europe's Forests 2011 assessment is used here as a consistency assessment, not as a pixel-level validation or formal accuracy analysis (Fig. 10). The FOREST EUROPE figures were compiled from national submissions for the 2011 pilot reporting by EFT category and differ from the present map in reference data, classification procedures, and reporting year. Because the variation was calculated as FOREST EUROPE minus EFT map, positive values indicate a higher share in FOREST EUROPE, whereas negative values indicate a higher share in the EFT map.
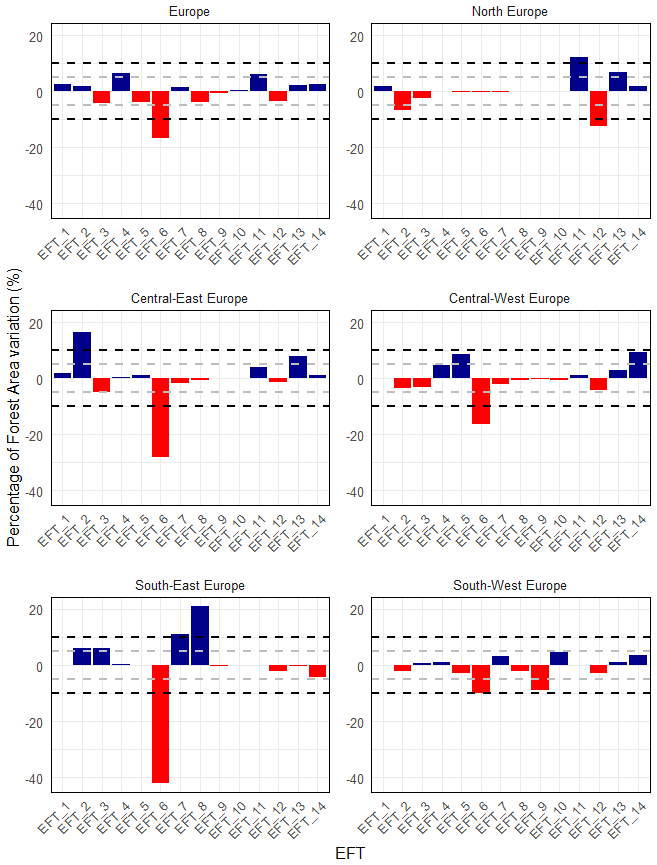
Figure 10Percentage variation in the forested area for each EFT category, based on the State of Europe's Forests 2011 report and the EFTs map, for Europe as a whole and for the five geographic regions: Central-East Europe, Central-West Europe, Northern Europe, South-Eastern Europe, and South-Western Europe. The grey lines indicate the range between −5 % and +5 %, while the black lines indicate the range between −10 % and +10 %. Red bars highlight where the EFTs map reports larger areas compared to FOREST EUROPE data, whereas blue bars indicate where FOREST EUROPE reports larger areas.
In Northern Europe, the strongest positive deviations are observed for (11) – Mire and Swamp Forest (+12.0 %) and (13) – Non-Riverine Alder, Birch, or Aspen Forest (+6.8 %), suggesting that FOREST EUROPE attributes a larger extent to these categories compared to the EFTs Map. Conversely, (12) – Floodplain Forest (−12.5 %) shows a substantial underestimation in the FOREST EUROPE data relative to the EFTs Map, pointing to possible misclassifications between these closely related categories.
In Central-Western Europe, the most notable discrepancies are a sharp underestimation of (6) – Beech Forest (−16.4 %) in FOREST EUROPE and strong overestimations in (5) – Mesophytic Deciduous Forest (+8.6 %) and (14) – Non-native Forest (+9.3 %). This indicates that the two sources diverge, especially in mid-successional or mixed-type forest classes.
In South-Western Europe, differences are more balanced, though still significant. The EFTs Map reports considerably more area for (6) – Beech Forest (−10.0 %) and (9) – Broadleaved Evergreen Forest (−8.9 %), while the FOREST EUROPE data shows relatively higher proportions for (10) – Coniferous Forests of the Mediterranean, Anatolian, and Macaronesian Regions (+4.6 %) and (14) – Non-native Forest (+3.6 %).
In South-Eastern Europe, discrepancies reach particularly high values. FOREST EUROPE underestimates (6) – Beech Forest (−42.0 %) but largely overestimates (8) – Thermophilous Deciduous Forest (+21.1 %) and (7) – Mountain Beech Forest (+11.3 %) compared to the EFTs Map. These strong differences suggest systematic issues in the harmonization of forest types in this region.
In Central-Eastern Europe, the most remarkable contrasts include a substantial underestimation of (6) – Beech Forest (−28.2 %) in FOREST EUROPE, while (2) – Hemiboreal and Nemoral Coniferous and Mixed Broadleaved-Coniferous Forest (+16.3 %) and (13) – Non-Riverine Alder, Birch, or Aspen Forest (+8.0 %) are strongly overrepresented. This again highlights potential mismatches in classification schemes between the two datasets.
At the European aggregate level, results confirm these patterns: FOREST EUROPE reports substantially less area for (6) – Beech Forest (−16.7 %) and (3) – Alpine Forest (−4.3 %), while it assigns more area to (4) – Acidophilous Oak and Oak-Birch Forest (+6.3 %), (11) – Mire and Swamp Forest (+6.2 %), and (14) – Non-native Forest (+2.5 %).
Overall, the discrepancies are concentrated in a limited set of EFT categories, particularly (6) – Beech Forest, (8) – Thermophilous Deciduous Forest, and (11) – Mire and Swamp Forest. These differences identify categories requiring further investigation but cannot be interpreted as omission or commission errors because the FOREST EUROPE statistics are not spatially explicit independent reference observations.
In the Supplement, the percentage of forest area for each EFTs category in each country is reported (Supplement Table S1), while Fig. 10 presents the difference between the percentage of forest area from the FOREST EUROPE 2011 report (Table 1) and that derived from the EFTs gridded dataset for each country.
The analysis of percentage differences in forest area between the FOREST EUROPE 2011 report and the EFTs gridded dataset highlights several patterns across European countries (Fig. 11). In Fig. 11 positive values indicate that FOREST EUROPE reported a larger forest area for a category compared to EFTs, while negative values reflect that EFTs estimated a larger forest area compared to the report.
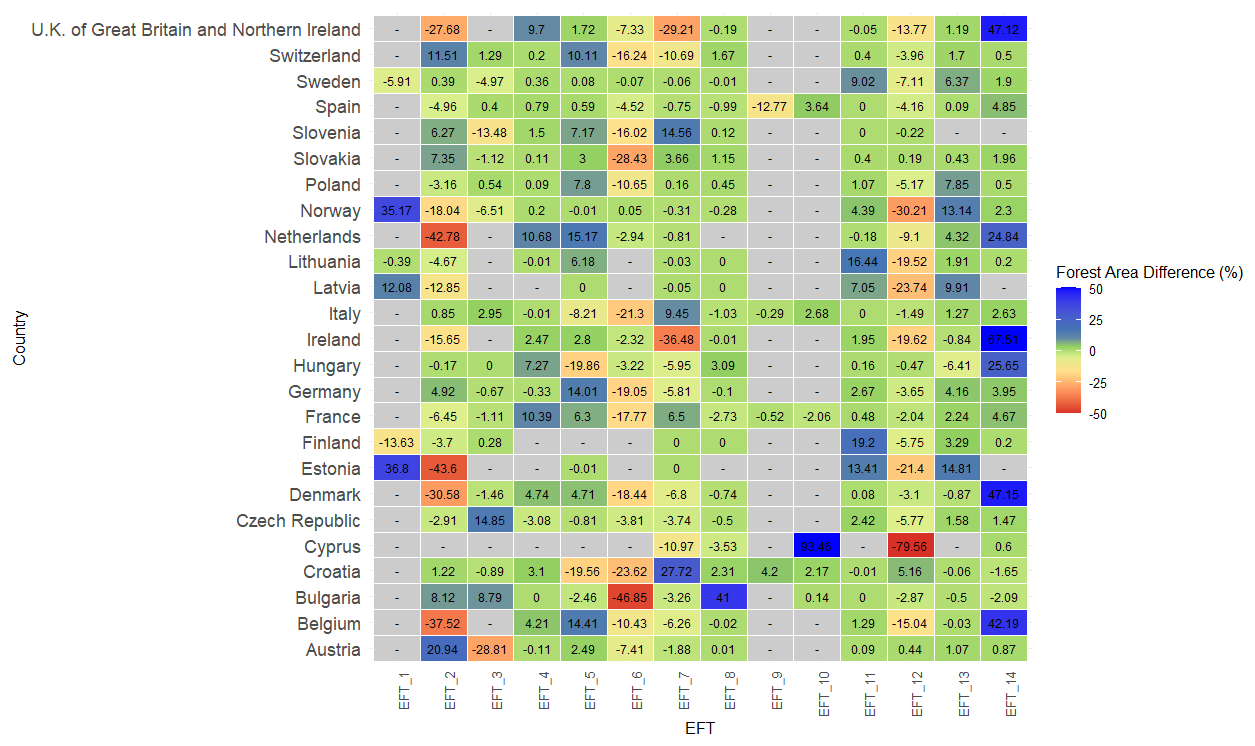
Figure 11Percentage differences between the forest area reported in State of Europe's Forests 2011 (Table 1) and the EFTs gridded dataset, by country (Annex 2). Negative values indicate that the EFTs gridded dataset overestimates forest area relative to the State of Europe's Forests 2011 report, whereas positive values indicate an underestimation.
Austria shows moderate differences, with FOREST EUROPE reporting significantly more area in category (2) (+21 %) and less area in category (3) (−29 %) relative to EFTs, while other categories remain stable.
Belgium exhibits large differences in category (2) (−38 %) and category (12) (−15 %), while FOREST EUROPE reports much more area in category (14) (+42 %).
Bulgaria has strong underestimation by EFTs in category (6) (−47 %), while FOREST EUROPE reports more area in categories (2) and (3) (+8 %–9 %) and especially in category (8) (+41 %).
Croatia shows EFTs underestimation in categories (5) (−20 %) and (6) (−24 %), while FOREST EUROPE reports much more area in category (7) (+28 %).
Cyprus presents extreme variation: category (10) shows FOREST EUROPE reporting +94 % more area, while EFTs overestimates in category (12) (−80 %) and category (7) (−11 %).
Czech Republic shows moderate fluctuations, with FOREST EUROPE reporting more area in category (3) (+15 %) and EFTs slightly overestimating in categories (2), (4), (6), (7), and (12).
Denmark has notable underestimation by EFTs in category (2) (−31 %) and (6) (−18 %), while FOREST EUROPE reports significantly more area in category (14) (+47 %).
Estonia exhibits large FOREST EUROPE overestimations in category (1) (+37 %) and category (13) (+15 %), and EFTs overestimations in category (2) (−44 %) and category (12) (−21 %).
Finland shows minor deviations, with EFTs underestimating in category (1) (−14 %) and (12) (−6 %) and FOREST EUROPE reporting more in category (11) (+19 %).
France shows moderate variations, with FOREST EUROPE reporting more area in category (4) (+10 %) and EFTs underestimating in category (6) (−18 %).
Germany exhibits minor positive and negative differences, with the largest EFTs underestimation in category (6) (−19 %) and slight FOREST EUROPE overestimations in categories (5) (+14 %) and (11) (+3 %).
Hungary shows large EFTs underestimation in category (5) (−20 %) and significant FOREST EUROPE overestimation in category (14) (+26 %).
Ireland presents significant EFTs underestimations in category (7) (−37 %) and (12) (−20 %), but very large FOREST EUROPE overestimation in category (14) (+68 %).
Italy has moderate EFTs underestimation in categories (5) (−8 %) and (6) (−21 %), with FOREST EUROPE reporting more area in categories (7) (+9 %) and (10) (+3 %).
Latvia shows FOREST EUROPE overestimations in categories (1) (+12 %) and (11) (+7 %) and EFTs underestimation in category (12) (−24 %).
Lithuania exhibits large FOREST EUROPE overestimation in category (11) (+16 %) and EFTs underestimation in category (12) (−20 %).
Netherlands shows strong EFTs underestimation in category (2) (−43 %) and (12) (−9 %), with FOREST EUROPE reporting more area in categories (4) (+11 %), (5) (+15 %), and (14) (+25 %).
Norway presents large FOREST EUROPE overestimation in category (1) (+35 %), while EFTs underestimates in category (12) (−30 %).
Poland has minor deviations, with EFTs underestimation in category (6) (−11 %) and slight FOREST EUROPE overestimation in categories (5) and (13) (+ 8%).
Slovakia shows strong EFTs underestimation in category (6) (−28 %) and small FOREST EUROPE overestimations in categories (2) (+7 %) and (7) (+4 %).
Slovenia displays EFTs underestimation in categories (3) (−14 %) and (6) (−16 %), while FOREST EUROPE reports more area in category (7) (+15 %).
Spain shows EFTs underestimation in category (9) (−13 %), with FOREST EUROPE reporting more area in categories (4), (10), and (14).
Sweden shows minor deviations, with FOREST EUROPE reporting more area in category (11) (+9 %) and EFTs underestimating in categories (1) (−6 %) and (12) (−7 %).
Switzerland has notable EFTs underestimations in categories (6) (−16 %) and (7) (−11 %), with FOREST EUROPE reporting more in categories (2) (+12 %) and (5) (+10 %).
U.K. of Great Britain and Northern Ireland shows large EFTs underestimations in categories (2) (−28 %) and (7) (−29 %), while FOREST EUROPE reports much more area in category (14) (+47 %).
This study shows that through the integration of existing geographic layers with data on species composition, specifically RPP maps, it is feasible to consistently classify EFTs in 14 categories in a spatially explicit manner across pan-European regions, as showed by Giannetti et al. (2018) for plot level data.
The present discussion focuses on two main aspects. The first part compares the data obtained through the developed EFTs map gridded dataset with the ones reported in the State of Europe's Forests 2011 report (FOREST EUROPE, UNECE and FAO, 2011). The second part concentrates on the usability of this gridded dataset in the context of sustainable forest management reporting, modeling, and forest ecosystem monitoring.
The comparison between FOREST EUROPE data and the EFTs gridded dataset reveals that eight categories (1, 2, 4, 7, 10, 11, 13, and 14) have higher area values in the State of Europe's Forests 2011 report. Conversely, the opposite trend is observed for the remaining categories (3, 5, 6, 8, 9, and 12).
By comparing the percentages of area for each EFT category derived from the developed EFTs gridded dataset maps with the State of Europe's Forests 2011 report, where the corresponding EFT area percentages are available, some differences can be observed between results presented here and those reported in 2011 for pan-Europe level across the different geographic areas (Fig. 9) and countries (Fig. 11).
Significant discrepancies in the percentage of area for each EFTs are found, however, only in a few instances: Category (6) (Beech forests) shows a notable overestimation of 16.7 %, while Categories (4) (Acidophilous deciduous forest) and (11) (Mire and swamp forest) exhibit underestimations of 6.3 % and 6.2 % respectively.
Both the State of Europe's Forests 2011 report and the EFTs gridded dataset map indicate categories (1) and (2) cover the largest area at the pan-European level, with the EFTs dataset showing a decrease compared to the State of Europe's Forests 2011 report of 2.72 for category (1) and of 1.79 for category (2) (Fig. 10). Considering the category (2) species of composition, it can be presumed that these forests might be reclassified into categories (7) and (6). This inference is supported by the tree species matrix (Pividori et al., 2016), where categories (2), (7), and (6) exhibit overlapping species composition.
In fact, category (6) also exhibits the largest discrepancies between the State of Europe's Forests 2011 dataset and the EFT gridded dataset. The most pronounced regional differences are observed in South-East Europe, where category (6) is overestimated by the EFT gridded dataset by approximately 42.0 %. This overestimation is accompanied by substantial underestimations of thermophilous deciduous forests (category 8, −21.1 %), mountain beech forests (category 7, −11.3 %), alder, birch, and aspen forests (category 13, −6.1 %), as well as hemi boreal and nemoral mixed forests (category 2, −5.9 %).
These discrepancies can be largely attributed to the extensive overlap in species composition among categories (2), (6), (7), and (8), which share several dominant or co-dominant taxa, including Quercus spp., Betula spp., Alnus spp., Populus tremula, and Fagus sylvatica. In the case of category (2), the observed underestimation may also be explained by the fact that South-East Europe does not fall within the hemi boreal zone, which may further contribute to differences in forest type attribution between the two datasets.
A similar, though less extreme, pattern is observed in Central-East Europe, where category (6) is overestimated by 28.2 %, while category (2) (−16.3 %) and category (13) (−8.0 %) are strongly underestimated by EFTs. This further supports the hypothesis that, in transitional biogeographical zones, differences in the application of hemi boreal masks and species-ranking criteria can systematically shift forest areas from composition-specific categories into broader conditional classes.
Categories (4) and (5) represent deciduous forest types defined by relatively specific species combinations, which contributes to a more stable behavior of these categories across regions when compared with more conditional classes such as category (6). Category (4) (acidophilous oak and oak–birch forests) is primarily characterized by the presence of Quercus robur, Quercus petraea, and Betula spp., and its assignment is further constrained by the application of the acidophilous mask. Category (5) (mesophytic deciduous forests) relies on predefined species combinations involving Quercus spp., Carpinus betulus, Fraxinus excelsior, Tilia spp., and Acer spp., without the use of mandatory geographic masks.
At the European scale, both categories show moderate variations, with category (4) being underestimated by the EFT gridded dataset (−6.3 %) and category (5) slightly overestimated (+3.8 %). This overall stability suggests that the rule-based definitions of these categories effectively capture broad deciduous forest types across Europe. However, regional patterns reveal more nuanced dynamics.
In Central-West Europe, category (5) is notably underestimated by EFTs (−8.6 %), while category (4) is also underestimated (−4.7 %). This pattern suggests that forests dominated by mesophytic deciduous species may be partially reassigned to broader mixed categories when the exact species combinations required by Rule 12 are not fully satisfied. In contrast, in South-East Europe, category (4) shows only minor variation (+0.5 %), whereas category (5) is slightly overestimated (−0.03 %), indicating a relatively robust classification of deciduous forests in this region despite the high variability observed in other categories.
In Northern Europe, category (4) exhibits negligible variation (−0.02 %), reflecting the limited extent of acidophilous oak and oak–birch forests in boreal contexts, while category (5) shows a modest overestimation (−0.12 %). In South-West Europe, category (4) is slightly underestimated (+1.0 %), and category (5) is overestimated (−2.8 %), a pattern that may reflect the coexistence of thermophilous and mesophytic deciduous species and the sensitivity of dominant–co-dominant species ranking in transitional Mediterranean environments.
Categories (9) and (10) represent forest types that are primarily defined within the Mediterranean, Macaronesian, and Anatolian biogeographical contexts and are both constrained by the same geographic masks. Category (9) (broadleaved evergreen forests) is dominated by Quercus ilex and Quercus suber, whereas category (10) (Mediterranean, Anatolian, and Macaronesian coniferous forests) is characterized by several Pinus species and Abies spp. The reliance on shared regional masks but distinct dominant species makes these two categories particularly sensitive to differences in dominant-species attribution depend on the RPP map.
At the European scale, both categories show relatively limited variation, with category (9) being overestimated by the EFT gridded dataset (−0.7 %) and category (10) slightly underestimated (+0.4 %). This overall balance suggests a reasonable consistency between the two datasets when aggregated at a continental level. However, regional patterns reveal more pronounced discrepancies.
In South-West Europe, category (9) is substantially overestimated by the EFT gridded dataset (+8.9 %), while category (10) is underestimated (−4.6 %). This contrasting behavior likely reflects differences in the identification of dominant species within the same Mediterranean mask.
In South-East Europe, variations for both categories are relatively limited, with category (9) showing a slight overestimation (−0.27 %) and category (10) with a marginal underestimation (+0.08 %). This indicates a more stable attribution of Mediterranean forest types in this region.
Categories (11), (12), and (13) represent forest types that are strongly influenced by hydrological conditions and species composition, and their classification within the EFT framework depends to a large extent on the application of specific geographic masks. Category (11) (mire and swamp forests) and category (12) (floodplain forests) are explicitly constrained by the wetlands and floodplain masks, respectively, whereas category (13) (non-riverine alder, birch, and aspen forests) is defined solely by species composition and is applied when these hydrological masks are not triggered.
At the European scale, category (11) is underestimated by the EFT gridded dataset (−6.2 %), while category (12) is overestimated (+3.4 %) and category (13) slightly underestimated (−2.2 %). These moderate discrepancies suggest that differences in the spatial extent and delineation of wetland- and floodplain-related masks between the EFT gridded dataset and the State of Europe's Forests 2011 report may play a significant role in determining the final category assignment.
In Northern Europe, the strongest discrepancies are observed, with category (11) being markedly overestimated by the EFT gridded dataset (+12.0 %) and category (12) correspondingly underestimated (−12.5 %). This near-compensatory pattern strongly indicates that forest areas characterized by similar species assemblages (Alnus spp., Betula spp., Populus tremula) may be alternately classified as mire/swamp or floodplain forests depending on the mask applied, rather than reflecting substantive differences in forest composition.
In Central-West Europe, category (12) is overestimated (+4.3 %), while categories (11) (−0.9 %) and (13) (+2.8 %) are underestimated. This pattern suggests that the floodplain mask in the EFT gridded dataset may capture a broader set of riparian forest conditions compared to national statistics, leading to a redistribution of forest area from species-based category (13) toward mask-based category (12).
In South-West and South-East Europe, variations for categories (11) and (12) are generally limited, reflecting the more restricted spatial extent of wetland and floodplain environments. However, in South-East Europe, category (13) is notably underestimated (−6.1 %), suggesting that forests dominated by Alnus, Betula, and Populus outside clearly defined wetland or floodplain masks may be partially absorbed into other broadleaved categories within the EFT classification.
Overall, these results indicate that a substantial portion of the discrepancies observed for categories (11), (12), and (13) can likely be attributed to differences in the definition and application of masks (i.e. WETLAND MASK and FOODPLANE MASK).
Category (8), corresponding to thermophilous deciduous forests, is defined by a specific set of broadleaved species, including Quercus cerris, Quercus frainetto, Quercus pubescens, Quercus pyrenaica, Tilia spp., Acer campestre, Fraxinus ornus, and Castanea sativa, and does not rely on mandatory geographic masks. As a result, its classification depends primarily on the correct identification of dominant and co-dominant species, making this category particularly sensitive to differences in species-ranking between datasets.
At the European scale, category (8) is moderately overestimated by the EFT gridded dataset (−3.9 %), indicating a slight tendency of EFTs to assign thermophilous deciduous species to this category more frequently than reported in the State of Europe's Forests 2011 report. However, this overall pattern masks substantial regional variability.
In South-East Europe, category (8) is strongly underestimated by the EFT gridded dataset (+21.1 %), representing one of the largest discrepancies observed among all forest types. This underestimation occurs in parallel with a marked overestimation of category (6) in the same region, suggesting a redistribution of forest area from thermophilous deciduous forests into broader mixed categories when species overlap is high. Given that several species defining category (8), particularly Quercus spp. and Tilia spp., also occur as secondary or co-dominant species in other deciduous and mixed forest categories, differences in dominant–co-dominant species assignment may substantially affect the final classification.
In Central-West and South-West Europe, variations for category (8) are more limited (−0.6 % and −2.3 %, respectively), indicating a relatively consistent representation of thermophilous deciduous forests by the EFT gridded dataset in regions where these forest types are well established and spatially coherent. In Northern and Central-East Europe, variations are negligible, reflecting the marginal occurrence of thermophilous deciduous species in these biogeographical contexts.
At the country level (Fig. 9), inconsistencies can be attributed to the shift from one category to another as alredy described above.
However, some of the inconsistencies between the EFTs map and the State of Europe's Forests 2011 report can be attributed to the fact that at the time when the FOREST EUROPE pilot approach was used for reporting sustainable forest management indicators by EFTs categories, clear rules establishing connections between tree species composition and forest categories were not available, as highlighted by Giannetti et al. (2018). In fact, the tree species matrix, which associates each species with the correct categories, as presented in the European Atlas of Forest Tree Species, was developed five years later by Pividori et al. (2016). Moreover, Giannetti et al. (2018) found that 63 % of the ICP Biosoil plots – particularly in the categories (4), (5), (6) and (8) – had some inconsistencies between dominant species, as quantified by basal area data, and the EFT category identified in the field. So, it is possible that this misclassification affects also the results reported in the State of Europe's Forests 2011 report, since they were based on plot level data that comprise also ICP Biosoil plots.
The current EFT map contains potential errors that may be significant at a local scale, particularly where cumulative probabilities are low and 1 km resolution RPP maps introduce inherent uncertainties. Nevertheless, our results provide a pioneering example of how European-level data can be synthesized into a consistent pan-European EFT cartographic product suitable for various applications. In fact, the EFTs map represents a significant advancement, bridging a critical gap in spatial monitoring, modelling, and reporting of indicators for sustainable forest management. The resulting EFT maps not only serve as a foundational tool for classifying forest areas but also provide systematic means to support forest monitoring and reporting to aid decision-making processes, particularly concerning forest-based adaptation and mitigation strategies, natural disaster precautionary measures, forest biodiversity maintenance and enhancement, renaturation activities and others. These maps are poised to be instrumental in guiding future initiatives focusing on sustainable forest management practices. Indeed, as demonstrated by Barbati et al. (2014), the use of EFTs can enhance question-driven forest monitoring in various ways. EFT-based reporting facilitates the interpretation of variability in sustainable forest management and explicitly for forest biodiversity indicators by allowing for the explicit consideration of ecological differences between EFTs, which cannot be captured using simplistic categories such as broadleaves, coniferous, or mixed as in the Plant Functional Types (PFTs) classification, as used by many vegetation/land surface models. In this regard, the EFTs map can be easily updated with the availability of new RPP maps or when a comprehensive map of forest tree species, including quantitative data on their presence and mixture, becomes accessible. As a result, temporal trends in forest areas can be analyzed to comprehend the expansion or loss of habitats in the context of climate change induced disturbances. In fact, the developed EFTs map, and future update of such map, has the potential to facilitate the monitoring of forest biodiversity indicators across different temporal scales. From a modeling perspective of forest ecosystems, utilizing the EFTs map instead of individual species reduces the number of input parameters needed to initialize models and then the associated uncertainty (Dalmonech et al., 2024). In fact, as demonstrated in numerous forest, vegetation/land surface model applications (e.g. Huber et al., 2018; Zaehle et al., 2005; Collalti et al., 2019; Massoud et al., 2019; Dunkl et al., 2023), at increasing the number of model parameters uncertainty increases, thus, the aggregation of functional types/species enables a reduction in the number of species to simulate and in the required input data and species-level (or PFTs-level) parameters for each model while ensuring consistent results across large scales. Furthermore, this aggregation has implications for the computational workload of such models, as it requires less parameterization (if compared to the species-level ones), facilitating a more user-friendly implementation. Furthermore, the adoption of a common classification system across pan-Europe enables uniform parameterization of models continent-wide, eliminating the need for merging or harmonizing national/local data. In the context of forest modeling, especially for the Species Distribution Modelling, the EFTs maps serve as a valuable dataset, contributing to the attainment of consistent and comparable data across Europe or to apply forest models at different and broader spatial scale in conjunction with others data and forest variables maps (Chirici et al., 2022; Dalmonech et al., 2024; Giannetti et al., 2022; Grünig et al., 2024, 2026; Vangi et al., 2023). Moreover, the EFTs map will also support the reporting obligations that will arise in connection with the Draft EC Forest Monitoring Regulation (European Commission, 2023). However, this approach has several limitations. The use of Boolean masks derived from vector data introduces mapping artifacts, such as unrealistically sharp boundaries. At present, no alternative datasets are available that allow for more accurate identification of environmental transition zones, limiting the ability to address these issues. In addition, the static nature of RPP maps prevents the representation of temporal dynamics. Regular updates based on newly available European-scale data would support more effective monitoring over time. Furthermore, the integration of remote sensing data and complementary cartographic products could enable the production of higher-resolution species maps, by improving classification accuracy and better capturing local and fine-scale variability, while potentially reducing edge effects. Finally, RPP maps do not include important exotic species, such as Eucalyptus spp. and Ailanthus altissima, within class (14).
Validation and interpretation require particular caution. No publicly available pan-European NFI dataset currently provides harmonised plot-level EFT labels with sufficiently consistent access, sampling design, thematic definitions, and spatial precision for an independent continental validation. The comparison with the State of Europe's Forests 2011 statistics is therefore a consistency check between independently produced area estimates, not an accuracy assessment. Future validation should use harmonised NFI-derived EFT labels or other independent plot data when these become available.
The present release provides a categorical EFT map but no pixel-level confidence layer. Because the final class results from sequential expert rules combining species-level RPP values and Boolean masks, it cannot be interpreted as a posterior class probability. A future uncertainty product could nevertheless report diagnostic measures such as the margin between the first- and second-ranked RPP values, entropy of the normalised species-level RPP distribution, rule-specific sensitivity, or ensemble stability under alternative thresholds and masks.
Ecotones are a further source of uncertainty. Small differences between similarly ranked taxa may change the selected rule, particularly where forest communities vary gradually. For Mediterranean categories (8) and (9), the deciduous and evergreen diagnostic species are generally distinct, which should reduce direct switching between these categories; however, local mixtures and transition zones may still be misclassified. A dedicated sensitivity analysis would be required to quantify pixel-level rule stability.
Categories (11) and (12) depend strongly on the wetland and floodplain masks. Applying these constraints before the zonal rules reduces the risk that azonal habitats are absorbed into widespread beech, oak, or conifer categories, but inaccuracies in the Copernicus wetness layer or river-buffer representation may cause local omission or overextension. These classes should therefore not be used as substitutes for detailed habitat or protected-area inventories.
Category (14) should be interpreted as forests dominated by introduced tree species represented in the RPP dataset, not as a comprehensive plantation map. The available inputs cannot consistently distinguish plantations from naturalised stands, and plantations of species native to another part of Europe may not be uniquely identifiable. The current conservative species list also omits relevant introduced taxa such as Eucalyptus spp. and Ailanthus altissima. The modular workflow can incorporate a harmonised European plantation layer when one becomes available.
Appropriate user scenarios include continental and national stratification of forest area and biodiversity indicators, regional comparison of disturbance exposure, ecological grouping for model initialisation and scenario analysis, and screening support for conservation or restoration planning. Conversely, the map should not be used for stand-level inventories, legal habitat delineation, operational harvesting decisions, or greenhouse-gas MRV without independent local data and uncertainty assessment.
The ETs map gridded dataset across Europe is currently freely available in Zenodo: https://doi.org/10.5281/zenodo.18496150 (Giannetti et al., 2026).
The rule-based expert system, initially developed by Giannetti et al. (2018) and further refined in this study, holds significant potential for advancing the widespread application of EFTs classification in European-wide national forest monitoring initiatives. The creation of a georeferenced raster map at a 100 m resolution, along with the associated dataset, facilitates cross-border collaboration and data sharing among EU member states.
The extensive list of forest tree species and quantitative data on their probability of presence have played a pivotal role in generating more accurate and comprehensive pan-European digital maps specific to EFTs. Notably, these RPP maps have opened opportunities for refining EFTs classification, as they provide an extensive list of forest tree species along with quantitative data (probability of finding a species). Furthermore, the integration of RPP maps into the classification algorithm provides new opportunities for future research and improved operational efficiency. By providing detailed information on forest types and their spatial distribution, modelers, policymakers, and forest managers can develop targeted strategies to enhance forest ecosystem resilience, promote carbon sequestration, and conserve biodiversity (Zampieri et al., 2021). Moreover, standardized information on forest types facilitates communication within a common European framework (Corona, 2022).
Consistent forest data underpin coherent policies and management practices across Europe, contributing to the objectives of the New European Forest Strategy, the European Green Deal, the EU Biodiversity Strategy, and international commitments such as the Paris Agreement and the Convention on Biological Diversity, particularly in the context of increasing pressures from climate change and other anthropogenic and biotic stressors.
The supplement related to this article is available online at https://doi.org/10.5194/essd-18-6435-2026-supplement.
FG, GC, AB: conceptualization; FG, IZ: data curation; FG, AB, GC, IZ: methodology; FG: software; FG, IZ: validation, FG, SL, IZ, AB: writing (original draft). FG, SL, MN, AC, SC, NCT, AL: funding acquisition; MN, SC, AC, EV, EG, GD'A, NCT, LP, JS, GS, IF, YG, DT, GC, PC, MMo, MMa, SL, AL: writing (review and editing).
The contact author has declared that none of the authors has any competing interests.
Publisher's note: Copernicus Publications remains neutral with regard to jurisdictional claims made in the text, published maps, institutional affiliations, or any other geographical representation in this paper. The authors bear the ultimate responsibility for providing appropriate place names. Views expressed in the text are those of the authors and do not necessarily reflect the views of the publisher.
This study was conducted within and funded by the project “OPTimising FORest management decisions for a low-carbon, climate resilient future in Europe (OptFor-EU)” funded by the European Union Horizon Europe programme (grant no. 101060554). To F.G., additional funding was provided by the Università degli Studi Di Firenze under the “Bando di Ateneo per il finanziamento di progetti competitivi biennali per Ricercatori a Tempo Determinato (RTD) dell’Università di Firenze 2026–2027” (D.R. No. 395 of 7 April 2025), through the project “Caratterizzazione delle torbiere in Europa in considerazione del cambiamento climatico – CARTORE”, with specific reference to research on mire and swamp forests (European Forest Type 11). A.C. also acknowledge the project funded under the National Recovery and Resilience Plan (NRRP), Mission 4 Component 2 Investment 1.4 – Call for tender No. 3138 of 16 December 2021, rectified by Decree no. 3175 of 18 December 2021 of Italian Ministry of University and Research funded by the European Union – NextGenerationEU under award Number: Project code CN_00000033, Concession Decree No. 1034 of 17 June 2022 adopted by the Italian Ministry of University and Research (grant no. CUP B83C22002).
This paper was edited by Nophea Sasaki and reviewed by two anonymous referees.
Barbati, A., Corona, P., and Marchetti, M.: A forest typology for monitoring sustainable forest management: The case of European Forest Types, Plant Biosyst., 141, 93–103, https://doi.org/10.1080/11263500601153842, 2007.
Barbati, A., Marchetti, M., Chirici, G., and Corona, P.: European Forest Types and Forest Europe SFM indicators: Tools for monitoring progress on forest biodiversity conservation, For. Ecol. Manage., 321, 145–157, https://doi.org/10.1016/j.foreco.2013.07.004, 2014.
Beck, P., Caudullo, G., Mauri, A., De Rigo, D., Durrant, T., and San-Miguel-Ayanz, J.: Tree species distribution data and maps for Europe, EUR 30148 EN, Publications Office of the European Union, Luxembourg, 2020, ISBN 978-92-76-17431-8, https://doi.org/10.2760/489485, 2020.
Bergeron, J. A. C., Blanchet, F. G., Spence, J. R., and Volney, W. J. A.: Ecosystem classification and inventory maps as surrogates for ground beetle assemblages in boreal forest, J. Plant Ecol., 5, 97–108, https://doi.org/10.1093/jpe/rtr037, 2012.
Bohn, U., Gollub, G., Hettwer, C., Neuhaüslovà, Z., Schlüter, H., and Weber, H.: Map of the natural vegetation of Europe, Interactive CD-ROM (S. Hennekens), Bonn-Bad Godesberg, Fed. Agency Nat. Conserv., https://www.researchgate.net/publication/237396766 (last access: 26 August 2026) 2004.
Bonannella, C., Hengl, T., Heisig, J., Parente, L., Wright, M. N., Herold, M., and de Bruin, S.: Forest tree species distribution for Europe 2000–2020: mapping potential and realized distributions using spatiotemporal machine learning, PeerJ, 10, https://doi.org/10.7717/peerj.13728, 2022.
Brus, D. J., Hengeveld, G. M., Walvoort, D. J. J., Goedhart, P. W., Heidema, A. H., Nabuurs, G. J., and Gunia, K.: Statistical mapping of tree species over Europe, Eur. J. For. Res., 131, 145–157, https://doi.org/10.1007/s10342-011-0513-5, 2012.
Cajander, A. K.: Forest types and their significance, Acta Forestalia Fennica, 56, 7396, https://doi.org/10.14214/aff.7396, 1949.
Capelo, J., Masquita, S., Costa, J. C., Ribeiro, S., Arsénio, P., Neto, C., Monteiro-Henriques, T., Aguiar, C., Honrado, J., Espírito-Santo, D., and Lousã, M.: Amethodological approach to potential vegetation modeling using GIS techniques and phytosociological expert-knowledge: application to mainland Portugal, Phytocoenologia, 37, 399–415, https://doi.org/10.1127/0340-269X/2007/0037-0399, 2007.
Caudullo, G., Welk, E., and San-Miguel-Ayanz, J.: Chorological maps for the main European woody species, Data Br., 12, 662–666, https://doi.org/10.1016/j.dib.2017.05.007, 2017.
Chirici, G., Chiesi, M., Fibbi, L., Giannetti, F., Corona, P., and Maselli, F.: High spatial resolution modelling of net forest carbon fluxes based on ground and remote sensing data, Agric. For. Meteorol., 316, 108866, https://doi.org/10.1016/j.agrformet.2022.108866, 2022.
Collalti, A., Thornton, P. E., Cescatti, A., Rita, A., Borghetti, M., Nolè, A., Trotta, C., Ciais, P., and Matteucci, G.: The sensitivity of the forest carbon budget shifts across processes along with stand development and climate change, Ecol. Appl., 29, 1–18, https://doi.org/10.1002/eap.1837, 2019.
Concil of Europe: Convention on the Conservation of European Wildlife and Natural Habitats, Environ. Conserv., 8, 206, https://doi.org/10.1017/S0376892900027624, 1979.
Copernicus Land Monitoring Service: HRL Forest 2018 Product User Manual, 1–4, https://land.copernicus.eu/en/technical-library/hrl-forest-2018/@@download/file (last access: 26 August 2026), 2021.
Corona, P.: Consolidating new paradigms in large-scale monitoring and assessment of forest ecosystems, Environ. Res., 144, 8–14, https://doi.org/10.1016/j.envres.2015.10.017, 2016.
Corona, P.: The culture of the forest, Annals of Silvicultural Research, 47, https://doi.org/10.12899/asr-2359, 2022.
D'amico, G., Vangi, E., Francini, S., Giannetti, F., Nicolaci, A., Travaglini, D., Massai, L., Giambastiani, Y., Terranova, C., and Chirici, G.: Are we ready for a national forest information system? State of the art of forest maps and airborne laser scanning data availability in Italy, IForest, 14, 144–154, https://doi.org/10.3832/ifor3648-014, 2021.
Dahdouh-Guebas, F., Triest, L., and Verneirt, M.: The importance of a hierarchical ecosystem classification for the biological evaluation and selection of least valuable sites, Impact Assess. Proj. A., 16, 185–194, https://doi.org/10.1080/14615517.1998.10590207, 1998.
Dalmonech, D., Marano, G., Amthor, J. S., Cescatti, A., Lindner, M., Trotta, C., and Collalti, A.: Feasibility of enhancing carbon sequestration and stock capacity in temperate and boreal European forests via changes to management regimes, Agric. For. Meteorol., 327, 109203, https://doi.org/10.1016/j.agrformet.2022.109203, 2022.
Dalmonech, D., Vangi, E., Chiesi, M., Chirici, G., Fibbi, L., Giannetti, F., Marano, G., Massari, C., Nolè, A., Xiao, J., and Collalti, A.: Regional estimates of gross primary production applying the Process-Based Model 3D-CMCC-FEM vs. Remote-Sensing multiple datasets, Eur. J. Remote Sens., 57, https://doi.org/10.1080/22797254.2023.2301657, 2024.
Dalmonech, D., Vangi, E., Quesada Chacónm, D., and Collalti, A: Decadal climate-driven decoupling between gross primary productivity and tree growth in Mediterranean forests, For. Ecol. Manage., 615, https://doi.org/10.1016/j.foreco.2026.123843, 2026.
Davies, C. E., Moss, D., and Hill, M. O.: EUNIS Habitat Classification, https://sdi.eea.europa.eu/data/f5946d76-bf09-4261-8f2e-6218210ae3af?path=/EUNIS habitat classification 2012 documentation# (last access: 28 August 2026), 2004.
De Cáceres, M., Martín-Alcón, S., González-Olabarria, J. R., and Coll, L.: A general method for the classification of forest stands using species composition and vertical and horizontal structure, Ann. For. Sci., 76, https://doi.org/10.1007/s13595-019-0824-0, 2019.
de Rigo, D., Caudullo, G., Houston Durrant, T., and San-Miguel-Ayanz, J.: The European Atlas of Forest Tree Species: modelling, data and information on forest tree species, in: European Atlas of Forest Tree Species, edited by: San-Miguel-Ayanz, J., de Rigo, D., Caudullo, G., Houston Durrant, T., and Mauri, A., Publications Office of the European Union, Luxembourg, e01aa69+, https://w3id.org/mtv/FISE-Comm/v01/e01aa69 (last access: 26 August 2026), 2016.
Dunkl, I., Lovenduski, N., Collalti, A., Arora, V. K., Ilyina, T., and Brovkin, V.: Gross primary productivity and the predictability of CO2: more uncertainty in what we predict than how well we predict it, Biogeosciences, 20, 3523–3538, https://doi.org/10.5194/bg-20-3523-2023, 2023.
EEA: European Forest Types. Categories and types for sustainable forest management reporting and policy, EEA Technical report no. 9/2006, Copenhagen, ISBN 978-92-9167-926-3, https://www.eea.europa.eu/en/analysis/publications/technical_report_2006_9/technical_report_2006_9/@@download/file (last access: 26 August 2026), 2006.
EEA: European forests: ecosystem conditions and sustainable use, 105 pp., https://doi.org/10.2800/3601, 2008.
EEA: Biogeographical regions, https://www.eea.europa.eu/en/analysis/maps-and-charts/biogeographical-regions-in-europe-2/map_2-1_biogeographical-regions (last access: 26 August 2026), 2016.
EEA: Water and Wetness 2018, High Resolution land cover characteristics, Copernicus Land Monitoring Service, https://land.copernicus.eu/en/products/high-resolution-layer-water-and-wetness (last access: 26 August 2026), 2018.
EEA geospatial data catalogue: European catchments and Rivers network system (Ecrins), https://www.eea.europa.eu/en/datahub/datahubitem-view/a9844d0c-6dfb-4c0c-a693-7d991cc82e6e (last access: 26 August 2026), 2012.
European Commission: Draft Forest Monitoring Regulation, COM(2023) 728 final, Brussels, https://eur-lex.europa.eu/legal-content/EN/TXT/?uri=CELEX:52023PC0728 (last access: 26 August 2026), 2023.
European Union's Copernicus Land Monitoring Service information: Forest Type 2018-present (raster 100 m), Europe, 3-yearly, https://doi.org/10.2909/bcc329c2-0676-40f5-bb62-91d36f956355, 2018.
FAO: The State of the World’s Forests 2018 – Forest pathways to sustainable development, Rome, https://openknowledge.fao.org/server/api/core/bitstreams/f8b1c590-8521-43f9-85c8-ef0e66144dcb/content (last access: 26 August 2026), 2018.
FAO and UNEP: The State of the World’s Forests 2020. Forests, biodiversity and people, Rome, 139 pp., https://doi.org/10.4060/ca8642en, 2020.
FOREST EUROPE: 7th Ministerial Conference, Madrid Ministerial Declaration. 25 years toghether promoting Sustainible Forest Managment in Europe, Madrid 20–21 October 2015, https://foresteurope.org/wp-content/uploads/2022/02/7MC_MadridMinisterialDeclaration.pdf (last access: 26 August 2026), 2015a.
FOREST EUROPE: State of Europe's Forests 2015, https://foresteurope.org/wp-content/uploads/2022/02/soef_21_12_2015.pdf (last access: 26 August 2026), 2015b.
FOREST EUROPE: State of Europe’s Forests 2020, https://foresteurope.org/wp-content/uploads/2016/08/SoEF_2020.pdf (last access: 26 August 2026), 2020.
FOREST EUROPE and FAO: State of Europe's Forests 2020, https://foresteurope.org/wp-content/uploads/2016/08/SoEF_2020.pdf (last access: 26 August 2026), 2020.
FOREST EUROPE, UNECE and FAO: State of Europe’s Forests 2011. Status and Trends in Sustainable Forest Management in Europe, https://foresteurope.org/wp-content/uploads/2016/08/State-of-Europes-Forests-2011-Report-Revised-November-2011-2.pdf (last access: 26 August 2026), 2011.
Giannetti, F., Barbati, A., Mancini, L. D., Travaglini, D., Bastrup-Birk, A., Canullo, R., Nocentini, S., and Chirici, G.: European Forest Types: toward an automated classification, Ann. For. Sci., 75, https://doi.org/10.1007/s13595-017-0674-6, 2018.
Giannetti, F., Chirici, G., Vangi, E., Corona, P., Maselli, F., Chiesi, M., D'Amico, G., and Puletti, N.: Wall-to-Wall Mapping of Forest Biomass and Wood Volume Increment in Italy, Forests, 13, 1989, https://doi.org/10.3390/f13121989, 2022.
Giannetti, F., Zorzi, I., Linser, S., Neumann, M., Cheval, S., Collalti, A., Vangi, E., Grieco, E., Morichetti, M., D'Amico, G., Nicu Constantin, T., Ludvig, A., Passarino, L., Scriva, J., Giambastiani, Y., Fattoretto, I., Secchi, G., Travaglini, D., Chirici, G., Corona, P., Marchetti, M., and Barbati, A.: European Forest Types gridded dataset, Version 1, Zenodo [data set], https://doi.org/10.5281/zenodo.18496150, 2026.
Grondin, P., Brice, M.-H., Boulanger, Y., Morneau, C., Couillard, P.-L., Richard, P. J. H., Chalumeau, A., and Poirier, V.: Ecological Classification in Forest Ecosystem Management: Links Between Current Practices and Future Climate Change in a Québec Case Study BT – Boreal Forests in the Face of Climate Change: Sustainable Management, edited by: Girona, M. M., Morin, H., Gauthier, S., and Bergeron, Y., Springer International Publishing, Cham, 219–246, https://doi.org/10.1007/978-3-031-15988-6_8, 2023.
Grünig, M., Rammer, W., Albrich, K., André, F., Augustynczik, A. L. D., Bohn, F., Bouwman, M., Bugmann, H., Collalti, A., Cristal, I., Dalmonech, D., De Caceres, M., De Coligny, F., Dobor, L., Dollinger, C., Forrester, D. I., Garcia-Gonzalo, J., Ramón, J., Hiltner, U., Hlásny, T., Honkaniemi, J., Huber, N., Jonard, M., Maria, A., Lagergren, F., Nieberg, M., Mina, M., Mohren, F., Moos, C., Morin, X., Muys, B., Peltoniemi, M., Po, C., Storms, I., Thom, D., Toïgo, M., and Seidl, R.: A harmonized database of European forest simulations under climate change, Data in Brief, 54, https://doi.org/10.1016/j.dib.2024.110384, 2024.
Grünig, M., Rammer, W., Senf, C., Albrich, K., André, F., Augustynczik, A. L. D., Baumann, M., Bohn, F. J., Bouwman, M., Bugmann, H., Collalti, A., Cristal, I., Dalmonech, D., De Coligny, F., Dobor, L., Dollinger, C., Espelta, J. M., Forrester, D. I., Garcia-Gonzalo, J., González-Olabarria, J. R., Hiltner, U., Hlásny, T., Honkaniemi, J., Huber, N., Jonard, M., Jönsson, A. M., Kunstler, G., Lagergren, F., Lindner, M., Mina, M., Moos, C., Morin, X., Muys, B., Nabuurs, G.-J., Nieberg, M., Patacca, M., Peltoniemi, M., Reyer, C. P. O., Schelhaas, M.-J., Storms, I., Thom, D., Toïgo, M., and Seidl, R.: Climate change will increase forest disturbances in Europe throughout the 21st century, Science, 391, eadx6329, https://doi.org/10.1126/science.adx6329, 2026.
Huber, N., Bugmann, H., and Lafond, V.: Global sensitivity analysis of a dynamic vegetation model: Model sensitivity depends on successional time, climate and competitive interactions, Ecol. Modell., 368, 377–390, https://doi.org/10.1016/j.ecolmodel.2017.12.013, 2018.
Ivanova, N., Fomin, V., and Kusbach, A.: Experience of Forest Ecological Classification in Assessment of Vegetation Dynamics, Sustainability, 14, 1–11, https://doi.org/10.3390/su14063384, 2022.
Jacquemoud, S. and Ustin, S.: Leaf Optical Properties, Cambridge University Press, Cambridge, https://doi.org/10.1017/9781108686457, 2019.
Jenssen, M., Nickel, S., and Schröder, W.: Methodology for classifying the ecosystem integrity of forests in Germany using quantified indicators, Environ. Sci. Eur., 33, https://doi.org/10.1186/s12302-021-00478-y, 2021.
Kusbach, A., Dujka, P., Šebesta, J., Lukeš, P., DeRose, R. J., and Maděra, P.: Ecological classification can help with assisted plant migration in forestry, nature conservation, and landscape planning, For. Ecol. Manage., 546, https://doi.org/10.1016/j.foreco.2023.121349, 2023.
Langanke, T.: High Resolution Layer Forest: Product Specifications Document, Copernicus Land Monitoring Service, 38, https://land.copernicus.eu/en/technical-library/hrl-forest-2012-2015/@@download/file (last access: 26 August 2026), 2017.
Maes, J., Bruzón, A. G., Barredo, J. I., Vallecillo, S., Vogt, P., Rivero, I. M., and Santos-Martín, F.: Accounting for forest condition in Europe based on an international statistical standard, Nat. Commun., 14, 1–15, https://doi.org/10.1038/s41467-023-39434-0, 2023.
Massoud, E. C., Xu, C., Fisher, R. A., Knox, R. G., Walker, A. P., Serbin, S. P., Christoffersen, B. O., Holm, J. A., Kueppers, L. M., Ricciuto, D. M., Wei, L., Johnson, D. J., Chambers, J. Q., Koven, C. D., McDowell, N. G., and Vrugt, J. A.: Identification of key parameters controlling demographically structured vegetation dynamics in a land surface model: CLM4.5(FATES), Geosci. Model Dev., 12, 4133–4164, https://doi.org/10.5194/gmd-12-4133-2019, 2019.
MCPFE: 4th Ministerial Conference on the protection of Forest in Europe, Vienna Living Forest Summit Declaration European Forests, Common Benefits, Shared Responsibilities, 28–30 April, https://foresteurope.org/wp-content/uploads/2016/08/MC-vienna-declaration.pdf (last access: 26 August 2026), 2003.
Morichetti, M., Vangi, E., and Collalti, A.: Predicted Future Changes in the Mean Seasonal Carbon Cycle Due to Climate Change, Forests, 15, 1124, https://doi.org/10.3390/f15071124, 2024.
Nemani, R. and Running, S. W.: Implementation of a hierarchical global vegetation classification in ecosystem function models, J. Veg. Sci., 7, 337–346, https://doi.org/10.2307/3236277, 1996.
Pérez-Ortiz, M., Peña, J. M., Gutiérrez, P. A., Torres-Sánchez, J., Hervás-Martínez, C., and López-Granados, F.: Selecting patterns and features for between- and within-crop-row weed mapping using UAV-imagery, Expert Syst. Appl., 47, 85–94, https://doi.org/10.1016/j.eswa.2015.10.043, 2016.
Pividori, M., Giannetti, F., Barbati, A., and Chirici, G.: European Forest Types: tree species matrix, in: European Atlas of Forest Tree Species, edited by: San-Miguel-Ayanz, J., de Rigo, D., Caudullo, G., Houston Durrant, T., and Mauri, A., 34–35, https://doi.org/10.2760/233115, 2016.
Rivas-Martínez, S., Penas, A., Díaz-González, T. E., Herrero, L., and del Rio, S.: Mapas de vegetación de las series, geoseries y geopermaseries de España. 1.250.000: Asturias, Glob. Geobot., 3, 1–34, 2014.
Rodwell, J. S., Schaminée, J. H. J., Mucina, L., Pignatii, S., Dring, J., and Moss, D.: The diversity of European vegetation; an overview of phytosociological alliances and their relationships to EUNIS habitats, Wageningen: Ministerie van LNV, 168 pp., Rapport EC-LNV; 2002/054, 2002.
Santini, M., Collalti, A., and Valentini, R.: Climate change impacts on vegetation and water cycle in the Euro-Mediterranean region, studied by a likelihood approach, Reg. Environ. Change, 14, 1405–1418, https://doi.org/10.1007/s10113-013-0582-8, 2014.
Saponaro, V., De Cáceres, M., Dalmonech, D., D'Andrea, E., Vangi, E., and Collalti, A.: Forest Ecosystems Assessing the combined effects of forest management and climate change on carbon and water fluxes in European beech forests, Forest Ecosystems, 12, https://doi.org/10.1016/j.fecs.2024.100290, 2025.
Schick, A., Porembski, S., Hobson, P. R., and Ibisch, P. L.: Classification of key ecological attributes and stresses of biodiversity for ecosystem-based conservation assessments and management, Ecol. Complex., 38, 98–111, https://doi.org/10.1016/j.ecocom.2019.04.001, 2019.
Vangi, E., D'Amico, G., Francini, S., Borghi, C., Giannetti, F., Corona, P., Marchetti, M., Travaglini, D., Pellis, G., Vitullo, M., and Chirici, G.: Large-scale high-resolution yearly modeling of forest growing stock volume and above-ground carbon pool, Environ. Model. Softw., 159, 105580, https://doi.org/10.1016/j.envsoft.2022.105580, 2023.
Vangi, E., Sacchelli, S., Nocentini, S., Plutino, M., Dalmonech, D., Collalti, A., Travaglini, D., and Corona, P.: Enhancing ecosystem service provision through the silvicultural management of European black pine stands from afforestation and reforestation in Italy, J. For. Res., 37, 44, https://doi.org/10.1007/s11676-025-01975-z, 2026.
Williamson, J. C., Bestelmeyer, B. T., McClaran, M. P., Robinett, D., Briske, D. D., Wu, X. B., and Fernández-Giménez, M. E.: Can ecological land classification increase the utility of vegetation monitoring data?, Ecol. Indic., 69, 657–666, https://doi.org/10.1016/j.ecolind.2016.05.030, 2016.
Xanthopoulos, G., Calfapietra, C., and Fernandes, P.: Fire Hazard and Flammability of European Forest Types BT – Post-Fire Management and Restoration of Southern European Forests, edited by: Moreira, F., Arianoutsou, M., Corona, P., and De las Heras, J., Springer Netherlands, Dordrecht, 79–92, https://doi.org/10.1007/978-94-007-2208-8_4, 2012.
Zaehle, S., Sitch, S., Smith, B., and Hatterman, F.: Effects of parameter uncertainties on the modeling of terrestrial biosphere dynamics, Global Biogeochem. Cy., 19, GB3020, https://doi.org/10.1029/2004GB002395, 2005.
Zampieri, M.:. Reconciling the ecological and engineering definitions of resilience, Ecosphere 12, e03375, https://doi.org/10.1002/ecs2.3375, 2021.