the Creative Commons Attribution 4.0 License.
the Creative Commons Attribution 4.0 License.
 | 01 Sep 2026
Spatial patterns of global land management intensity are influenced by socioeconomic, biophysical and behavioural factors

Calum Brown
Karina Winkler
Almut Arneth
Mark Rounsevell
Land systems are increasingly influenced not only by land-use change but also by land management intensity. However, persistent data limitations prevent systematic understanding of management intensity and its dependencies on behavioural, socioeconomic, and biophysical factors. We develop a global dataset of land management intensity for 2020 at 0.01° spatial resolution, distinguishing unmanaged, very extensive, extensive, and intensive management across cropland, pasture, and forest systems. Intensive management occupies about 22 % of global managed land, while extensive and very extensive management dominate (78 %). Intensive cropland management accounts for around 44 % of cropland area, but intensive pasture is limited to 10 % of pasture area, and intensive forest systems to only 5 % of forest area, revealing distinct sectoral contrasts. Management intensity is highly heterogeneous, with intensive cropland concentrated in North America, Europe, and South and East Asia, while extensive management dominates in Africa and Latin America. Five countries account for nearly half of global intensive cropland. Income, market access, population density, and aridity influence cropland management intensity, whereas pastures and forests show more complex relationships. Comparison with global land decision-making types shows spatial consistency (68 %), suggesting that land management intensity is influenced by land-user behaviour. This dataset may be useful for various earth system modelling applications in land system science and environmental studies.
The dataset can be visualised through global land management intensity dataset explorer: https://ee-ankitasaxena03as.projects.earthengine.app/view/global-land-use-management (last access: 27 August 2026; Saxena et al., 2025), and accessed through https://doi.org/10.5281/zenodo.18249970 (Saxena et al., 2026) for research purposes. The input data for socioeconomic variables (GDP, GINI, market access and working age population) can be accessed through https://doi.org/10.5281/zenodo.17580780 (Perkins et al., 2025).
- Article
(14667 KB) - Full-text XML
- BibTeX
- EndNote


Human use of land is a major driving force in the functioning of the Earth system, influencing food production, biodiversity, biogeochemical cycles, and climate regulation (IPCC, 2022a). Agriculture and forestry together occupy nearly 70 % of the planet's ice-free surface, contribute roughly one quarter of global greenhouse-gas emissions, and account for more than 70 % of freshwater withdrawals (Foley et al., 2011; FAO, 2020). Over recent decades, research on land-use and land-cover change has substantially improved understanding of processes such as agricultural expansion, deforestation, and urban growth (e.g. Winkler et al., 2021, 2025). However, much less attention has been given to land management intensity, despite its major influence on productivity, resource use and environmental impacts (Kehoe et al., 2015; Matej et al., 2025). Between 2000 and 2020, global cropland area expanded by less than 10 %, while agricultural output increased by more than 45 %, indicating a widespread shift from land expansion toward intensification of production (FAO, 2022). Similarly, the human appropriation of net primary production (HANPP) has more than doubled since 1900 and now exceeds one quarter of potential terrestrial productivity (Kastner et al., 2022). These dynamics indicate that analysing land-cover and land-use transitions alone is insufficient for a comprehensive understanding of land system change and its implications for humans and the environment (Arneth et al., 2025; Bayer et al., 2023; Zabel et al., 2019).
Land management intensity reflects the level and combination of inputs applied to land, including irrigation, fertilisers, and other management interventions, which together determine resource use, and influence productivity and the environment (Erb et al., 2017; Haberl et al., 2014). Existing global studies have typically focussed on agronomic or climatic outcomes of management intensity without characterising intensity itself (Alexander et al., 2015). Widely used state of the art land-use and land-cover datasets such as HILDA+ (Winkler et al., 2021), HANPP (Kastner et al., 2022), HYDE (Klein Goldewijk et al., 2017), EarthStat (EarthStat, 2026) and Global Pasture Watch (Earth Engine Data Catalog, 2026) provide valuable insights into land-use or land-cover change, biomass appropriation, crop production, and specific management components, but lack a harmonised representation of land management intensity across cropland, pasture and forest systems. However, recent years have seen substantial progress in developing spatially-explicit global datasets that captured specific components of land management. These include high-resolution maps of fertiliser application (e.g., Adalibieke et al., 2023; Tian et al., 2022), irrigation extent and intensity in cropland systems (Kebede et al., 2025; Liu et al., 2021; Mehta et al., 2024; Nagaraj et al., 2021), and livestock densities and grazing pressure in pasture systems (e.g., Earth Engine Data Catalog, 2026). Notwithstanding their value, these datasets are largely based on sector-specific indicators, making it difficult to assess land management intensity consistently across land systems and world regions.
Beyond management practices themselves, land management intensity is inherently linked to socioeconomic and behavioural processes (Rounsevell and Arneth, 2011). Economic growth, infrastructure, market access, population density and inequality determine the incentives and abilities of land users to intensify or extensify land management (Ma et al., 2024; Stehfest et al., 2019). At the same time, land management decisions are mediated by human behaviours such as values, aspirations, risk perceptions, and local constraints (Lambin and Meyfroidt, 2011; Rounsevell et al., 2021; Vortkamp and Hilker, 2023). Previous studies incorporating human decision-making into global land-use analyses highlighted regional diversity in land-use strategies (Malek et al., 2019; Malek and Verburg, 2020). However, these behavioural and socioeconomic dimensions have not been examined in relation to spatial patterns of land management intensity using spatially-explicit and globally consistent datasets.
Overall, two key knowledge gaps remain. First, there is no harmonised global representation of land management intensity that consistently distinguishes management intensity levels across cropland, pasture and forest systems. Second, the extent to which observed patterns of management intensity align with underlying socioeconomic drivers and land-use decision-making behaviour remain largely unexplored. To address these gaps, we make three key contributions. First, we develop a harmonised, spatially-explicit global dataset of land management with distinct levels of management intensity across cropland, pasture, and forest systems. Second, we integrate multiple variables in a unified framework, enabling a consistent comparison of management intensity across land systems and regions. Third, we link spatial patterns of land management intensity with socioeconomic and biophysical variables and with land-use decision making types. We then develop new insights into the behavioural and socioeconomic dimensions of land systems, which have not previously been analysed using a globally consistent and spatially-explicit framework.
To analyse global land management intensity and its association with explanatory variables we pose the following research questions;
-
How is land management intensity spatially distributed across cropland, pasture, and forest systems globally, and how does this distribution vary between regions, income groups, and countries?
-
To what extent are observed patterns of land management intensity associated with socioeconomic drivers such as economic development, inequality, market access, and population density, and biophysical variables (aridity index and elevation), and do these relationships differ across land-use sectors?
-
Do spatial patterns of land management intensity align with land-use decision-making types?
We address these questions by developing a harmonised, spatially-explicit global dataset of land management intensity for the year 2020 at 0.01° spatial resolution. The dataset captures cropland, pasture, and forest systems, each classified into management intensity categories of unmanaged, very extensive, extensive, and intensive, derived from multiple biophysical and management indicators. Using this dataset, we (i) analyse the global spatial distribution of land management intensity across regions, income groups and countries; (ii) quantify relationships between management intensity and important socioeconomic drivers including GDP per capita, income inequality (GINI), market access, population density, aridity and elevation using multinomial logistic regression; and (iii) assess the correspondence between management intensity patterns and independently derived global land-use decision-making types (Malek and Verburg, 2020). These analyses provide an understanding of the drivers and behavioural influences of land management intensity at the global scale and provide a basis for integrating management intensity into a global land system analysis.
We develop a global gridded land management intensity dataset at 0.01° spatial resolution for 2020 (Saxena et al., 2026). Agricultural crops, forests, and pasture land are usually managed through species-selection, the application of fertilisers (and agro-chemicals more broadly) and irrigation, among other inputs. The level of management intensity reflects these inputs, which influence yields and the production of various commodities. Here we define four levels of management intensity (intensive, extensive, very extensive and unmanaged) in agricultural, pastoral, and forestry systems, and combine the spatial datasets with urban, agroforestry, photovoltaics, unmanaged (sparse/ no vegetation/natural unmanaged), and water classes. In this study, intensive management refers to a system with high input use and strong human intervention (high fertiliser application rates, irrigation, and active management practices). Extensive management represents practices of moderate input use with a greater reliance on natural processes such as rainfall. Very extensive management refers to a low-input system relying on minimal intervention and natural conditions. An additional `unmanaged' category was used to represent forests, shrublands and pastures with no signs of active human intervention. Furthermore, we categorised cropland based on its primary purpose (e.g., food, feed, or bioenergy), the data were spatially distributed by country using statistics from the Food and Agriculture Organization (FAO) of the United Nations (2024b). We then analysed the spatial distribution of land management intensity globally and by world income groups, and its correlation with socioeconomic and biophysical indicators (see below). We finally assessed the correlation between land management intensities and the land decision-making types from Malek and Verburg (2020). To harmonise different datasets of varying spatial characteristics, we performed all the necessary preprocessing to bring the data to a consistent level that we later integrated. All input layers were aligned to a common grid of 0.01° resolution (Fig. 1) using nearest-neighbour resampling.
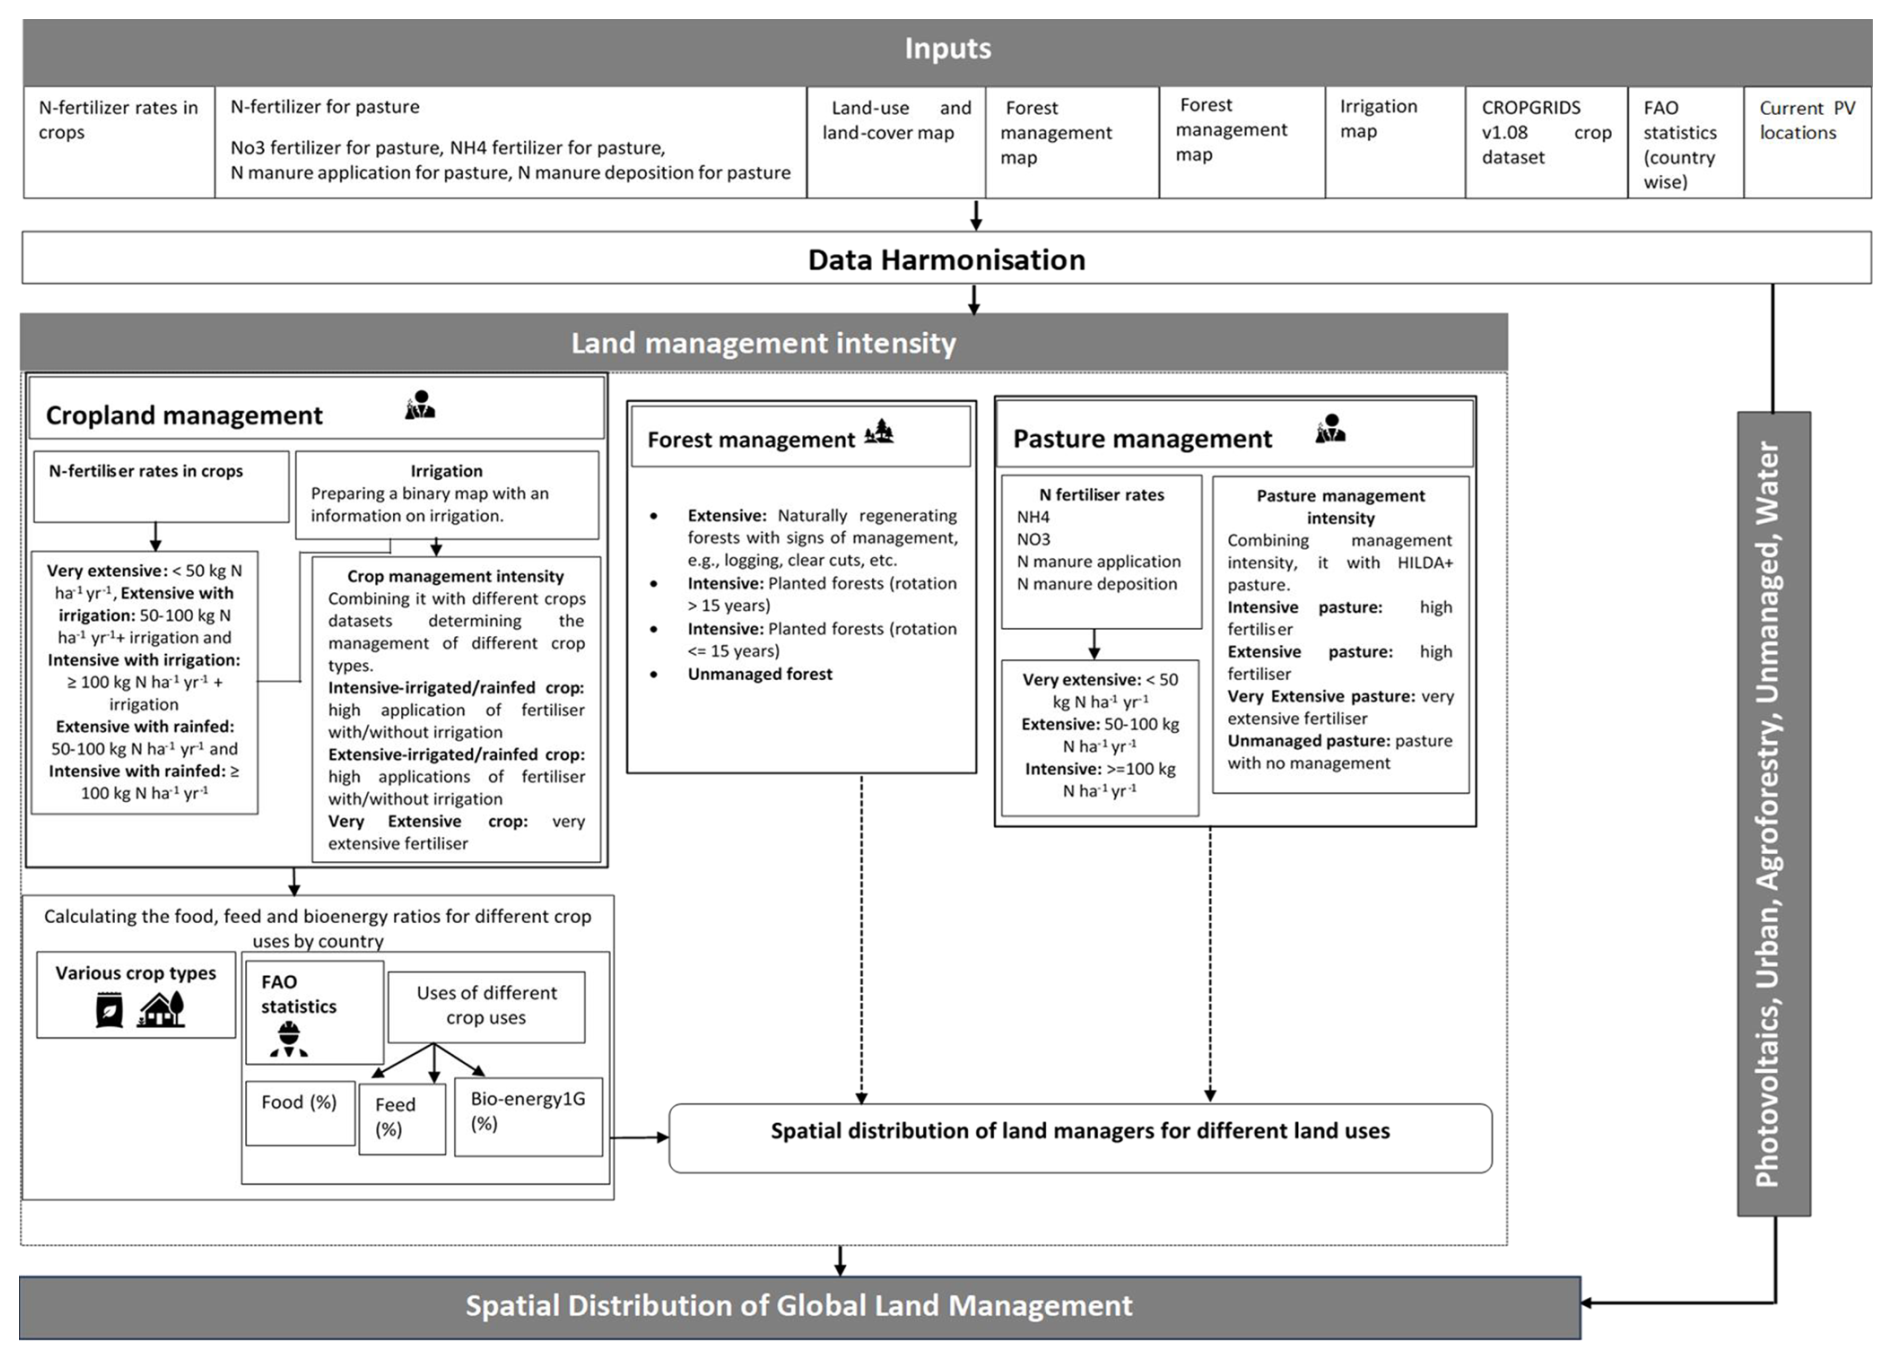
The individual datasets and the methods used are discussed in detail in the following sub-sections.
2.1 Data used
The identities and spatial extents of land-use and land-cover classes were drawn from the global HILDA+ dataset (Winkler et al., 2020, 2021) at 0.01° (Table 1). The cropland areas were refined into specific crop categories by integrating the CROPGRIDS v1.08 dataset (Tang et al., 2024), which provided primary crop data for maize, wheat, soy, rice, and starchy roots at 5 arcmin resolution for the year 2020. To determine management intensity for these crops we utilised a crop-specific N fertiliser dataset (Adalibieke et al., 2023). Pasture land management intensity was derived from total N fertilizer datasets (Tg N yr−1) (Tian et al., 2022) at 5 arcmin. The HILDA+ forest management (managed/unmanaged) dataset (Winkler et al., 2021) was combined with a 100 m resolution forest management dataset (Lesiv et al., 2022) to determine forest management intensity. To account for large-scale photovoltaic (PV) deployment worldwide, we integrated a global PV panels dataset at 20 m spatial resolution (Li et al., 2025), ensuring that solar energy installations were spatially represented in the land-use dataset. We utilised some input datasets corresponding to different reference years than 2020, particularly irrigation and forest management data from 2015. These datasets were considered as they provide the most consistent and currently available spatially-explicit information. To harmonise these inputs, we assumed that large-scale spatial patterns of irrigation and forest management remained relatively stable over short periods of time at the global scale. Thus, the final dataset represented an approximation for the year 2020.
Table 1Salient details on the data used in the creation of land management intensity dataset.
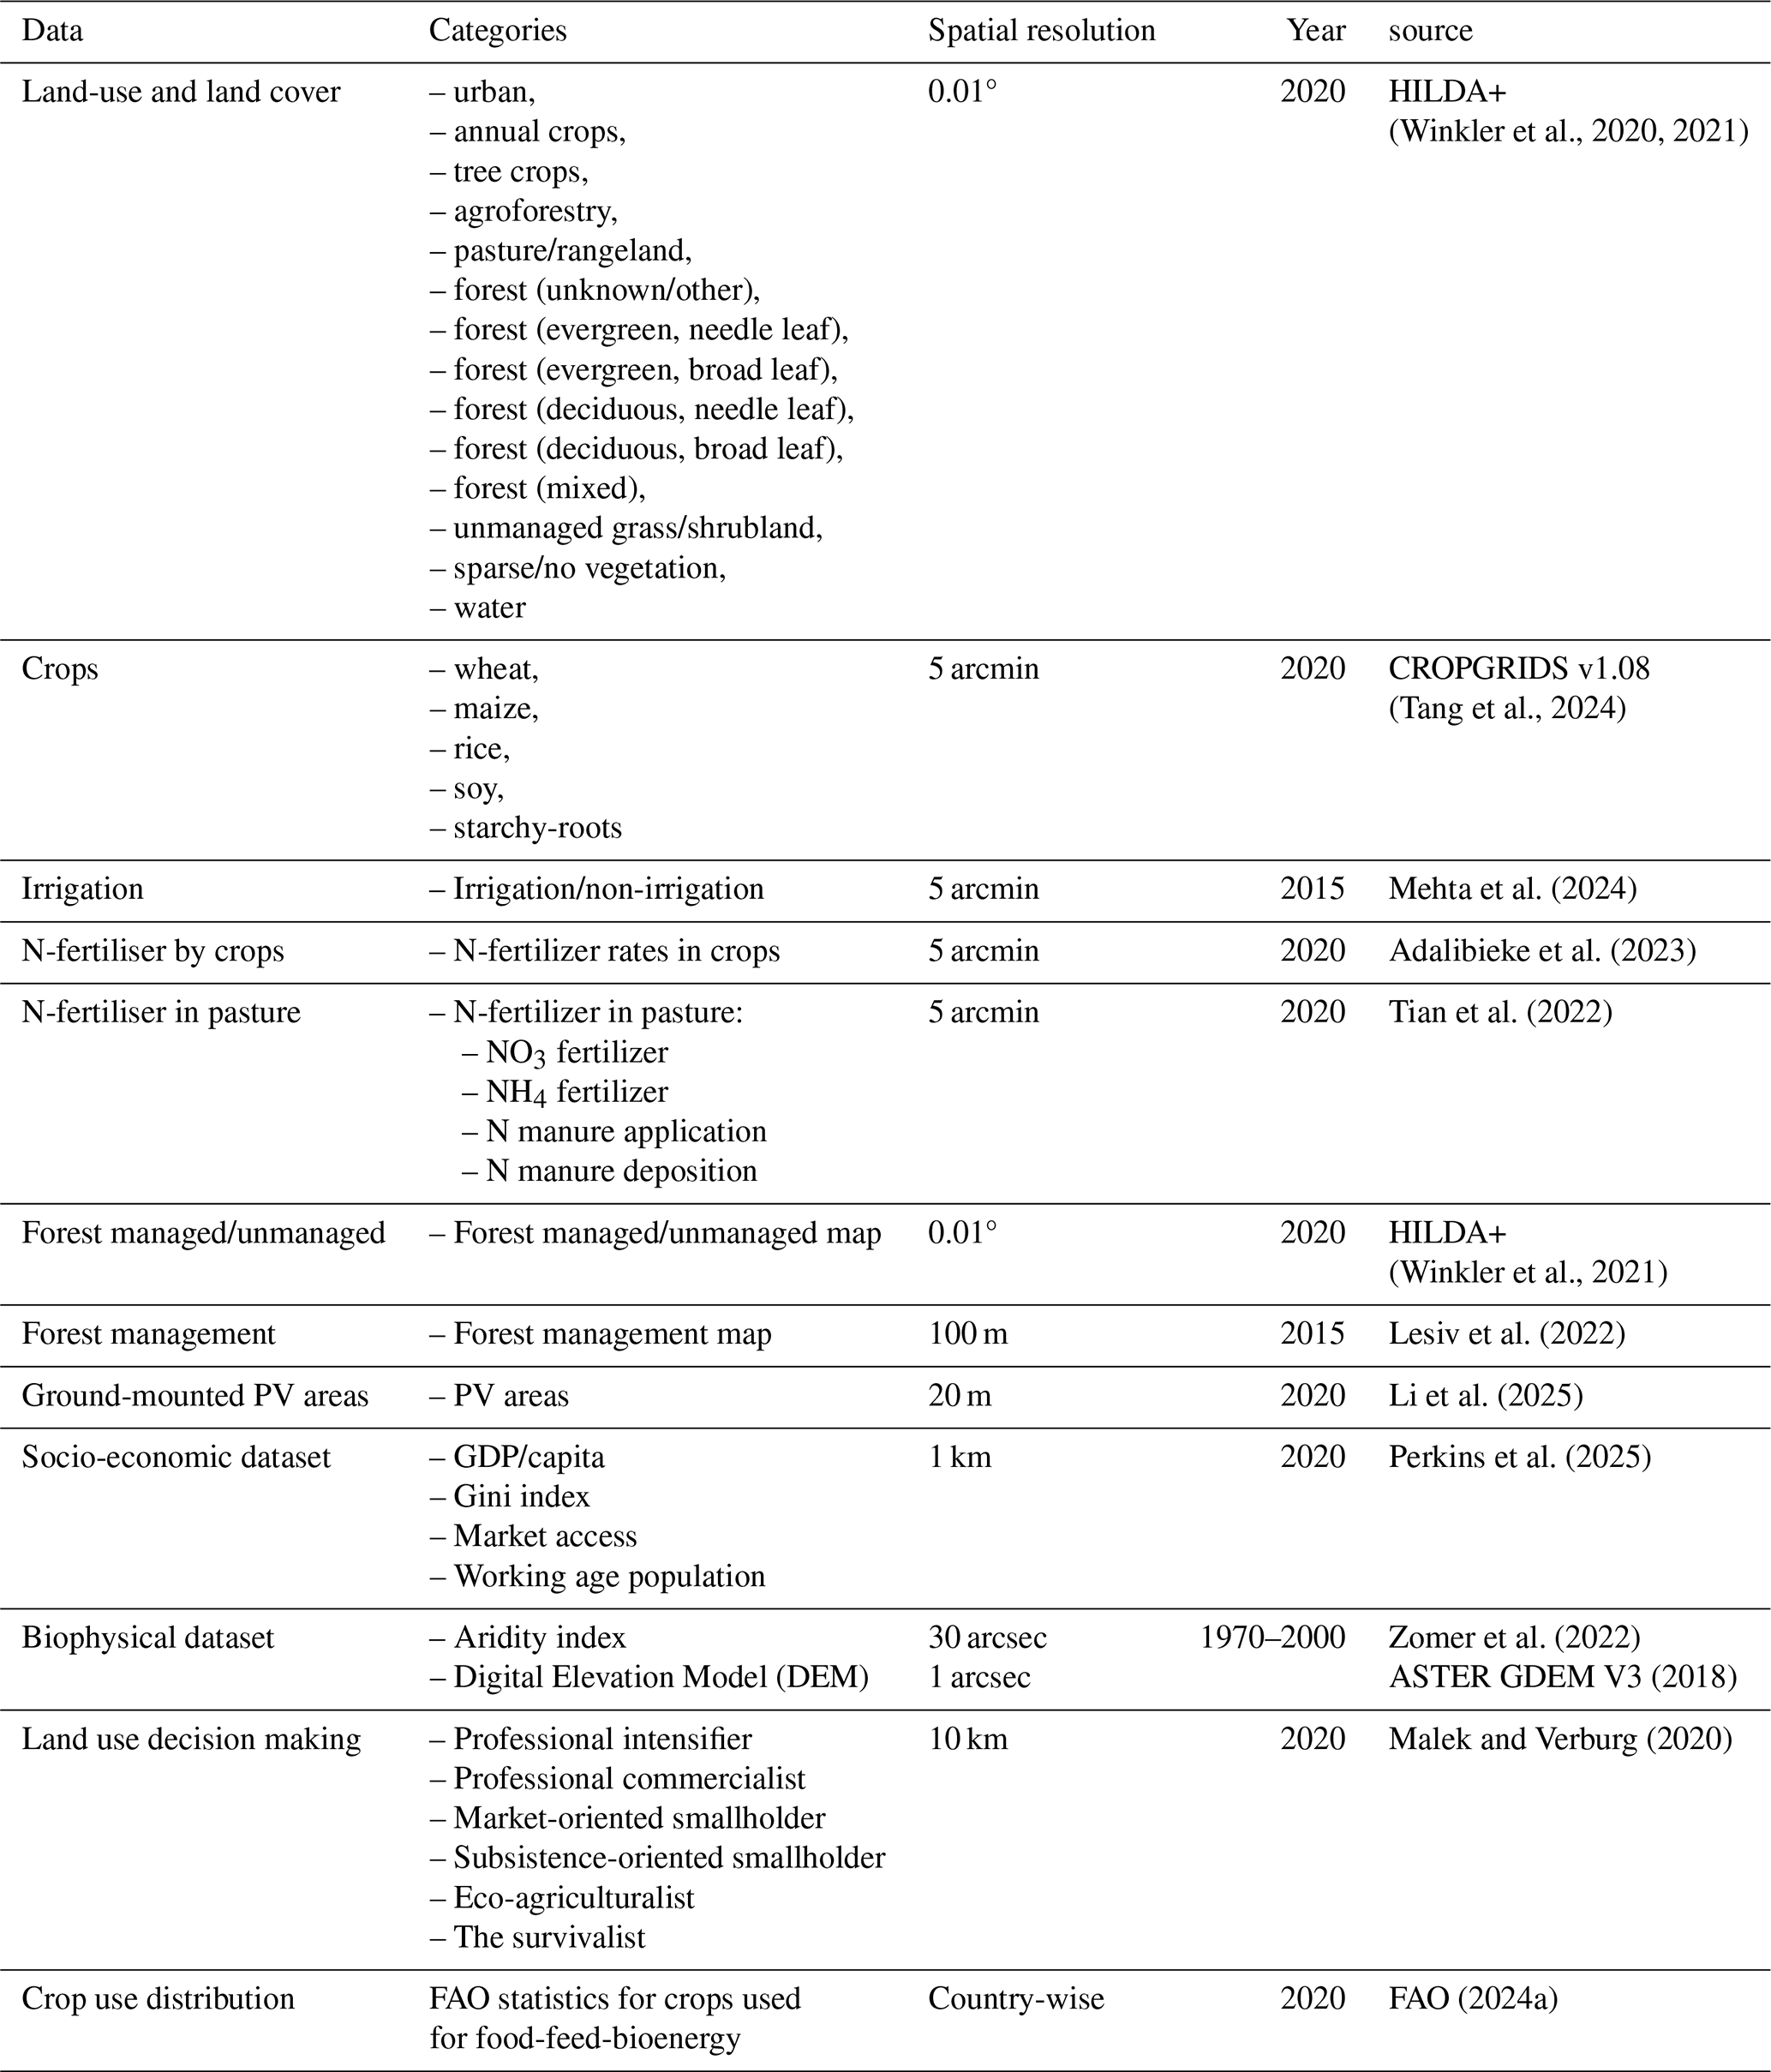
Country-wise FAO crop use data were applied to categorise land-use into food-feed-bioenergy uses using random distribution ensuring spatially-explicit classification at the national level. To characterise socioeconomic contexts, we used the global gridded socio-economic dataset of Perkins et al. (2025) at 1 km resolution. Some of the input variables used to construct the land management intensity dataset included socioeconomic and accessibility related variables in their underlying methodologies, which however differed from the variables used in this study in terms of spatial resolution, temporal reference and role. The passive variables of the inputs of the management intensity dataset relied largely on country-level or coarse-resolution inputs and earlier reference years, whereas the analysis presented here utilised the spatially-explicit and harmonised socioeconomic datasets specifically for the year 2020 (Perkins et al., 2025). These variables were explicitly used as explanatory factors in a separate regression framework, and were not used as direct inputs into the construction of the management intensity dataset. We utilised four globally available socioeconomic indicators representing complementary dimensions of development and accessibility and two biophysical variables – aridity index and elevation. Gross domestic product (GDP) per capita was used as a proxy for financial capital, reflecting economic capacity. Population density captures aspects of human capital and demographic pressure on land systems, influencing labour availability and land management intensity. Market accessibility represents infrastructural and manufactured capital, approximating access to markets and services that facilitate intensive land management. Income inequality, measured using the GINI coefficient, was included as an indicator of social structure and distributional inequality. GINI may influence decisions related to the adoption of land management practices as it is determined by the ability to access to the land, capital, and agricultural inputs Together, these variables provided a parsimonious representation of socioeconomic conditions. In addition, we included aridity index and elevation to account for important biophysical constraints on land management. The aridity index represented long-term moisture availability, where lower values indicate more arid conditions and higher values indicate more humid environments. This is important for understanding the feasibility of intensive and irrigated land management. Elevation was included as a proxy for terrain-related constraints such as climate limitations, which influence the intensity of land management practices. Finally, we compared the land management intensity dataset with a land-use decision-making dataset (Malek and Verburg, 2020) to assess the correlation with the management practices and land-use decision-making types. More details on the datasets used are provided in Table 1.
2.2 Mapping crop types and management intensity onto agriculture land
To map the primary crop types – wheat, maize, rice, oil-N-fixing crops (soy), and starchy-roots (potatoes and tubers) – we used the overall cropland extent from the HILDA+ dataset and then integrated crop specific datasets from CROPGRIDS v1.08 (Tang et al., 2024) to spatially allocate each crop type. The crop-specific harvested area layers were extracted and harmonised to a common spatial grid, with strict enforcement of identical resolution, extent, and coordinate and projection systems across all crop types. Cropland cells with non-zero harvested area for at least one crop were treated as cropland grid cells. A binary presence-absence map was created for each crop type, indicating whether a specific crop was present in a given grid cell. These binary maps were then aggregated into a single dataset to represent the distribution of all crop types. Missing or negative values were assigned as zero. To address overlapping crop types within a grid cell, we allocated the crop type with the highest harvested area as the dominant crop, ensuring one-cell one-crop representation. To ensure consistency across the dataset, we reprojected the data onto the 0.01° resolution by aggregating neighbouring cells and assigning the majority crop type within each aggregation unit.
To assess the management intensity associated with each crop type, we utilised a crop-specific N fertiliser, manuring, and irrigation dataset (Table 1; Adalibieke et al., 2023; Mehta et al., 2024). Fertiliser application rates (kg N ha−1 yr−1) were derived for wheat, maize, rice, soybean, and starchy roots. For each crop, we considered various N fertiliser types including Urea, nitrate fertilisers (ammonium nitrate (AN) and calcium ammonium nitrate (CAN)), compound fertilisers (ammonium phosphate (AP), N K compounds (NK), N P K compounds (NPK), other NP (ONP)), AA&NS (anhydrous ammonia (AA) and N solutions (NS)), other synthetic fertilisers (other N straight (ONS) and ammonium sulphate (AS)) and MA&CR (manure (MA) and crop residues (CR)). These fertiliser components were aggregated at the grid cell level to obtain total N application rates for each crop type. Prior to aggregation, values were screened to remove implausible negatives and extreme outliers. The total crop-wise N fertiliser rates (originally at 5 arcmin resolution) were resampled to the 0.01° grid using the nearest-neighbour resampling approach, and thus all finer resolution cells within each coarse grid cell inherit the averaged value. To determine the management intensity, we classified the crop-specific N fertiliser rates dataset based on absolute N fertiliser thresholds applied to the dominant crop in each cell. Nitrogen application rates were classified into three classes of intensity based on the relevance of their application for agriculture as described by Kleijn et al. (2009): very extensive (<50 kg N ha−1 yr−1), extensive (50–100 kg N ha−1 yr−1), and intensive (≥100 kg N ha−1 yr−1) (Overmars et al., 2014; Dou et al., 2021). Missing fertiliser values were conservatively treated as zero application and classified as very extensive management. The absolute thresholds were applied consistently across all regions and crop types to ensure comparability of management intensity classes at the global scale. We did not include other chemical inputs such as pesticides because pesticide use is often associated with agricultural intensification and tends to co-vary with fertiliser application rates (Pergner and Lippert, 2023). Including both variables would therefore introduce redundancy. The irrigation dataset at 0.05° resolution (Mehta et al., 2024) was also used to distinguish intensive management with and without irrigation. The irrigation dataset at 0.05° resolution (Mehta et al., 2024) was also used to distinguish intensive management with and without irrigation. The information on irrigation presence and absence was first extracted to generate a spatial binary map, the grid cells with an availability of irrigation being assigned value 1, while those without irrigation were assigned value 0. This irrigated and rainfed information was then combined with the intensive class of the N fertiliser application map, prepared in an earlier step, in order to divide the intensive management class into two; intensive irrigated and intensive rainfed.
2.3 Mapping pasture management intensity
The spatial extent of pasture land was derived from the HILDA+ dataset, ensuring consistency with the broader land-use and land cover classification (though note that the underlying data is lower-resolution for pasture than for other land use types). To create the management intensity dataset, we combined data for synthetic (NO, NH) fertiliser and manure (organic N), giving total N fertiliser for pastures (Table 1). To convert the total N data into application rates, the fraction of managed pasture within each grid cell was calculated by spatially aggregating the managed pasture mask.
Grid-cell areas were computed as a function of latitude and total N fertilisers were converted to application rates per unit pasture area (kg N ha−1 yr−1). Cells without pasture were excluded from the calculation. Pasture management intensity was classified into three intensity categories based on the N application rates: very extensive (<50 kg N ha−1 yr−1), extensive (50–100 kg N ha−1 yr−1), and intensive (≥100 kg N ha−1 yr−1). The absolute thresholds were applied consistently across all regions and pastures to ensure comparability of management intensity classes at the global scale. Similar to cropland, the pasture fertiliser inputs (5 arcmin) were resampled to map onto a 0.01° grid.
2.4 Mapping forest types and management intensity
The forest categories considered in this study included needle leaf evergreen, broad leaf evergreen, needle leaf deciduous, broad leaf deciduous, and mixed forest. Forest management intensity was determined by combining the HILDA+ forest management dataset (Winkler et al., 2021) with the forest management dataset of Lesiv et al. (2022), both of which were projected at 0.01° resolution using a majority method. Forest areas were classified into intensive, extensive and unmanaged based on the level of human intervention and management practices. Planted forests were considered as intensively-managed, naturally regenerating forests with signs of management, such as selective logging, or other forestry interventions, were considered as extensively-managed (Lesiv et al., 2022) and forests with no substantial signs of active human intervention (i.e., no or minimal direct management inputs) were considered as natural forests with minimal or no active management.
2.5 Ground mounted photovoltaic (PV) farm mapping
Spatial information on PV farms for the year 2020 was aggregated from high resolution raster data (20 m) to the harmonised land management intensity dataset at 0.01° resolution (Li et al., 2025). Individual PV tiles were processed sequentially and reprojected onto the 0.01° grid using average resampling. The PV fraction of underlying high-resolution cells covered by PV installations, resulted in a continuous PV coverage fraction between 0 and 1. Using these data, we calculated a total PV land area of 8432 km2. PV cell allocation was restricted to non-water, non-urban, and non-forest areas and allocated by ranking candidate cells by descending PV fraction and allocating PV cells until the total PV area was achieved using latitude-adjusted cell areas.
Finally, the land management intensity dataset for year 2020 was produced on 0.01° global grid using a deterministic, rule-based mapping scheme designed to preserve broad land-use and land cover classes from HILDA+ while adding finer details on the management intensity. The land management intensity dataset relies on some low-resolution input datasets (e.g., crop and pasture fertiliser and irrigation), while some of the input datasets were at finer resolutions (e.g., forest management, forest types, etc.). Therefore, the final dataset represented a harmonised integration of varying underlying input data. Water and urban were mapped directly from HILDA+, while cropland, pasture and forest classes were assigned with the management intensity levels derived from respective land management layers. Conservative management intensity was applied where management information was missing or invalid. The cropland cells were assigned to an “other crops” class unless defined crop types and management intensity levels were available. Managed pastures were assigned as very extensive management unless classified otherwise. Forest cells were assigned to extensive management for the respective forest type, when the management intensity information was not present.
2.6 Sensitivity analysis of a range of thresholds for the management intensity classification
We performed a systematic sensitivity analysis by varying the thresholds used to define the management intensity classes (baseline case: 50 kg N ha−1 yr−1 and 100 kg N ha−1 yr−1) for a range of possible threshold combinations i.e., by varying the lower threshold between 40 and 60 kg N ha−1 yr−1 and the upper threshold between 80 and 120 kg N ha−1 yr−1 resulting in nine combined scenarios. For each combination, the spatial distribution of management intensity was quantified (i) the global share of cropland under each management class and (ii) spatial agreement with the baseline thresholds (50 kg N ha−1 yr−1 and 100 kg N ha−1 yr−1). The spatial agreement was computed as the percentage of grid cells for which assigned management intensity class remained unchanged relative to the baseline classification. The sensitivity analysis showed that the management intensity classification remained broadly stable across alternative threshold combinations (Fig. A4; Tables A1–A2). For cropland systems, spatial agreement with the baseline classification ranged between 89.7 % and 96.5 %, while pasture systems showed even higher agreement ranging from 97.7 % to 99 %. Although changes in thresholds altered the relative shares of very extensive, extensive, and intensive classes, the overall spatial patterns remained largely consistent.
2.7 Relationship between land management intensity and socioeconomic and biophysical indicators
To examine the association between socioeconomic and biophysical conditions and land management intensity, we employed multinomial logistic regression at the grid cell level. This analysis was based on an explanatory design-setup for individual land sectors i.e., cropland, pasture and forest. All the grid cells, that had valid management intensity and explanatory variables values were considered in the analysis. The same approach was applied separately within each World Bank income group. To evaluate that the socioeconomic variables do not inculcate multicollinearity, a pairwise correlation coefficient and the variance inflation factor (VIF) were computed for all the variables and the land-use types. Separate models were developed for cropland, pasture and forest systems, with management intensity (very extensive, extensive, and intensive) as the dependent variables. Very extensive management was used as the reference category in the model. Independent variables comprised GDP per capita, Gini index (income inequality), market accessibility and working age population, giving indicators of the primary socioeconomic capital groups of financial, social, manufactured and human capital (Perkins et al., 2025). The biophysical variables comprised aridity index (Zomer et al., 2022) and elevation (ASTER GDEM V3, 2018). All these datasets were harmonised to the same spatial resolution of 0.01° and for the year 2020 as the land management intensity dataset. These predictors were standardised prior to the use in the regression model to allow a direct comparison across the variables. The individual regression models were developed to analyse the variations both globally and in the World Bank income groups (lower-middle income, upper-middle income, high-income and low-income). We also computed the average marginal effects, which quantify the change in the predicted probability of each management intensity category associated with one standard deviation change in each variable. Marginal effects were computed for all explanatory variables and management intensity classes across the land systems and income groups. In addition, to assess where socioeconomic drivers explain land management intensity well, and where they do not, we computed spatial residuals between observed land management intensity and predicted class probabilities derived from the multinomial logistic regression models. For each land sector and management intensity class, residuals were calculated as the difference between the observed binary management class membership and the model-predicted probability at each grid cell. Positive residuals indicate locations where a management intensity class occurs more frequently than predicted by socioeconomic variables alone, while negative residuals indicate under prediction.
We performed a robustness check by using a spatial thinning method to evaluate whether spatial clustering has a role in the regression relationships. We performed an analysis using progressively coarser resolution samples such as 0.10, 0.25, and 0.50° to compute the regression for an individual set-up. The direction and magnitude of marginal effects were compared against the original resolution model (0.01°). The outcome indicated that marginal-effect relationships retained their direction across progressively coarser spatial samples (Figs. A8–A10; Table A6). In particular, GDP, market access, aridity index, and elevation effects remained largely stable across cropland, pasture, and forest systems, although effect magnitudes varied under coarser thinning. Mixed responses occurred mainly for selected pasture and forest relationships, indicating that some associations are more sensitive to spatial aggregation. However, such influences were very limited. Overall, the results suggest that the main regression patterns are not solely driven by spatial clustering of neighbouring grid cells.
2.8 Relationship between land management intensity and the land decision-making types
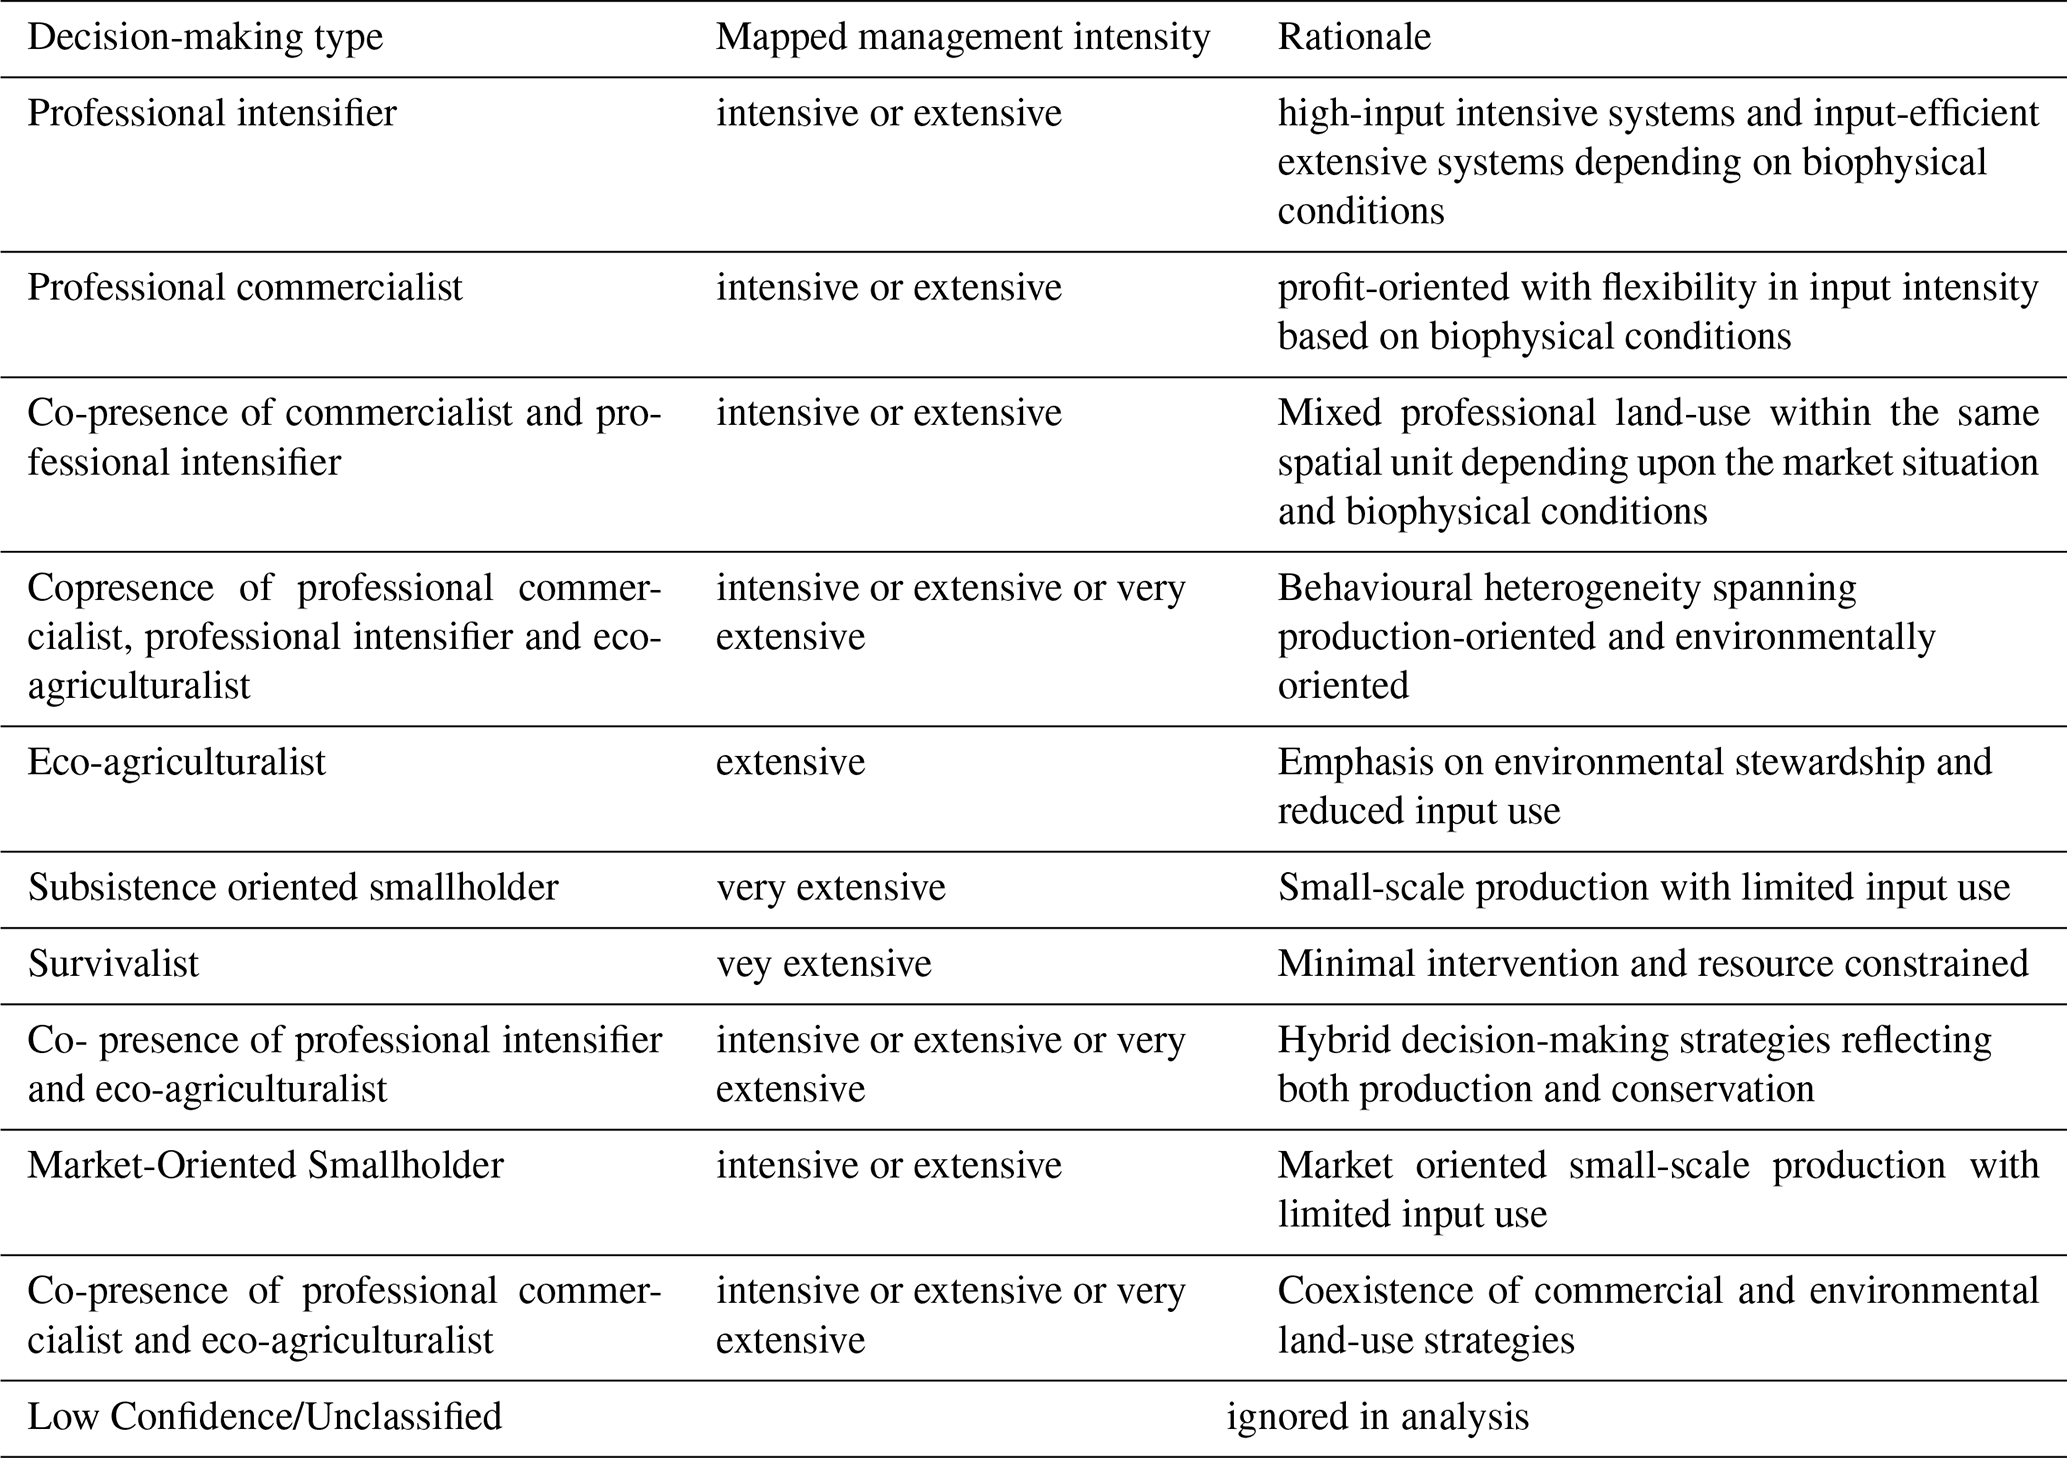
To assess the consistency between land management intensity and land-use decision-making behaviour, we harmonised management intensity classes with decision-making types derived by Malek and Verburg (2020). The mapping was based on the conceptual correspondence between decision-making strategies, which reflected actors' objectives, capacities, and constraints, and observable land management outcomes. Decision-making types associated with market orientation, capital access, and production optimisation including professional intensifiers and professional commercialists were mapped to intensive or extensive management classes (Table 2). These decision-making types corresponded to active engagement in land-use markets and adaptive management strategies, which were inferred as either high-input intensive systems or input-efficient extensive systems depending on biophysical and economic conditions. Decision-making types emphasising environmental concerns or multifunctionality, such as eco-agriculturalists, were mapped primarily to extensive management, reflecting lower input use and greater reliance on ecosystem processes. In contrast, decision-making types constrained by limited resources or risk tolerance such as subsistence-oriented smallholders and survivalists were mapped to very extensive management (Table 2). Several decision-making categories represented co-presence or hybrid strategies, where multiple behavioural types coexist within the same spatial unit. For these cases, we applied multiple management intensity classes (e.g. intensive, extensive, and very extensive). Decision-making classes with low classification confidence or insufficient information were excluded from the comparison. Spatial comparisons were then conducted at the grid-cell level. A match was defined when the observed land management intensity at a given grid cell fell within the set of possible management intensity classes associated with the corresponding decision-making type. This flexible matching approach allows for one-to-many relationships between behaviour and management outcomes, reflecting the fact that similar decision-making strategies may lead to different management intensities depending on local environmental, and institutional conditions. To evaluate the spatial consistency between the land decision-making types and the land management intensity, pixel-wise comparison metrics were computed including total matched (hit) cells, mismatches, and overall accuracy. Additionally, confusion metrics summaries were computed. It is to note that the decision-making dataset is derived using proxy variables such as GDP, irrigation and accessibility from earlier datasets and at a coarser spatial resolution. Similar variables were used in this study to perform the regression analysis which differed in terms of their role, spatial representation, and time coverage. The comparison between the newly developed land management intensity dataset and the decision-making types should therefore be interpreted as broad consistency between behavioural patterns and management intensity.
Table 2Mapping of land-use decision making types onto land management intensities classes based on Malek and Verburg (2020).
3.1 Global distribution of land management intensity
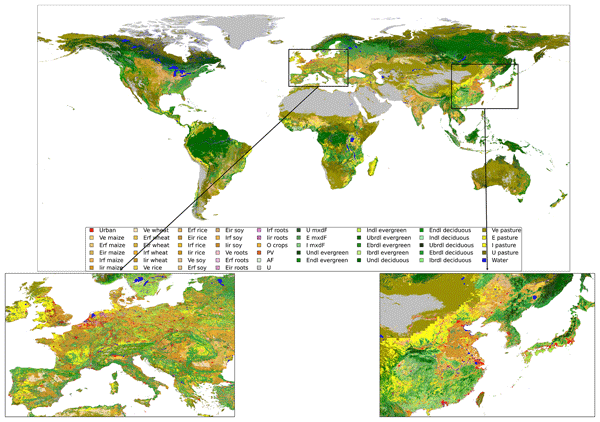
The global land management intensity dataset (Fig. 2) revealed spatial heterogeneity in cropland, pasture and forest management intensity at 0.01° resolution, enabling a spatially consistent global assessment of land management patterns (figures below are expressed as percentages of the entire global terrestrial surface, unless otherwise indicated) (Saxena et al., 2026). Approximately 79 % of the Earth's land area was found to be managed to some degree, ranging from very extensive to intensive management across cropland, pasture and forest systems. The remaining 21 % of the total land area is predominantly unmanaged and consists largely of sparsely and non-vegetated areas, and ice/snow covered areas with minimal human intervention. Intensive management occupies about 22 % of the global managed land area (i.e., cropland, pasture, and forestry), while extensive and very extensive management together accounted for 78 % (Table A3). Despite perceptions of widespread intensive management, most managed land globally remains under extensive or very extensive management (Table A3). Although, management intensity varied substantially across land-use and land-cover sectors. Croplands accounted for around 10.5 % of the global terrestrial surface, yet contained the highest share of intensive management among all land-use and land-cover sectors (Fig. 3). Of global cropland, 44 % was managed intensively comprising around 30 % irrigated management and 14 % rainfed management (Fig. A1). Intensive and extensive croplands were concentrated in densely populated and highly industrialised regions, where infrastructure, fertiliser use, and irrigation were widely available (Fig. A2).
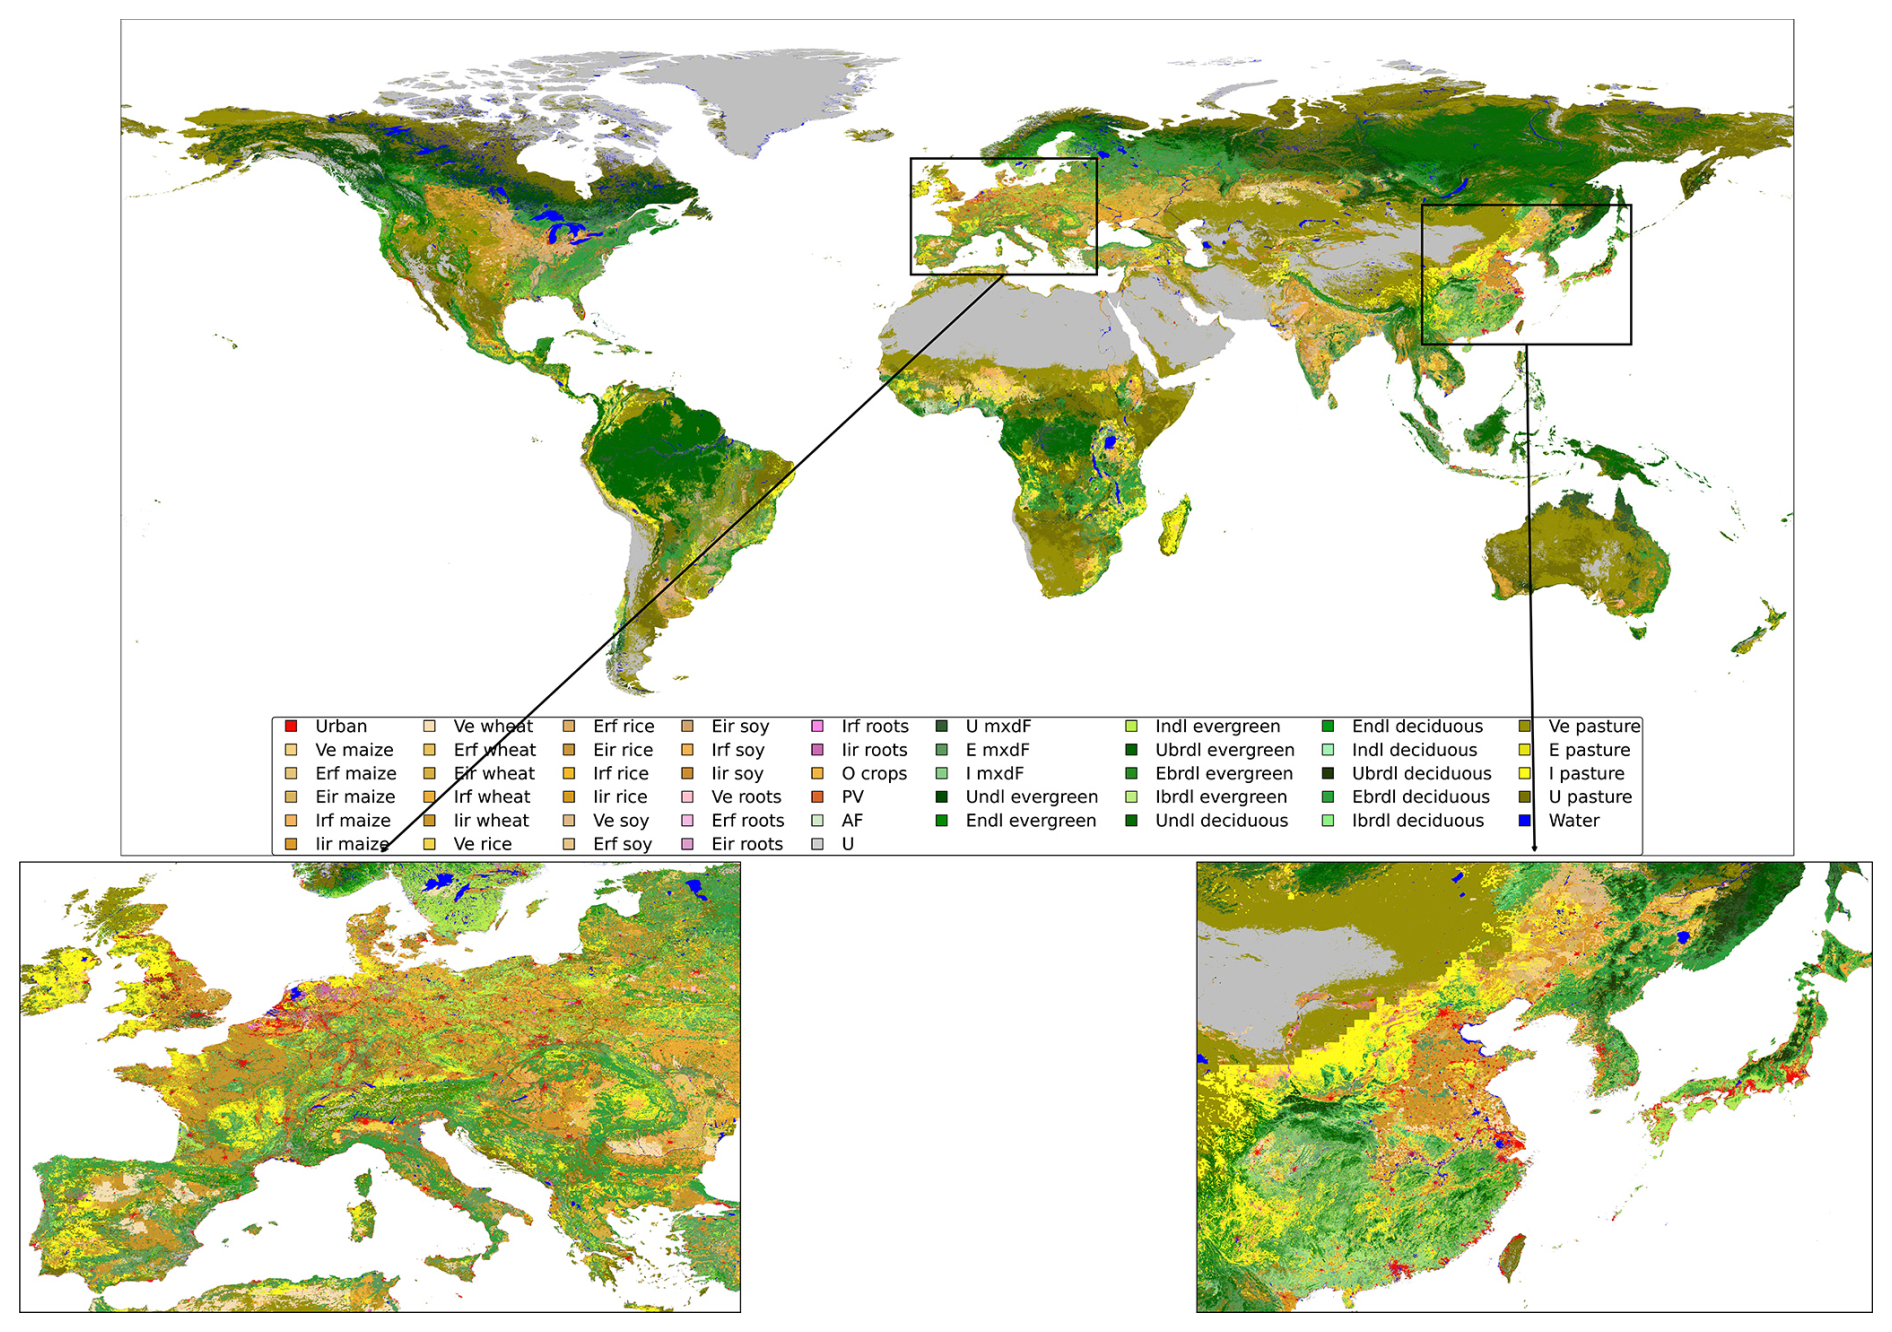
Figure 2Global land management intensity distribution in 2020 at 0.01° spatial resolution. Here, I – intensive, E – extensive, Ve – very extensive ir – irrigated, rf – rainfed, ndl – needleleaf, bdl – broadleaf, mxdF – mixed forest, PV – photovoltaics, AF – Agroforestry, U – unmanaged, and O – other. Enlarged panels show example regions of Europe and East Asia with dense and heterogeneous land management patterns.
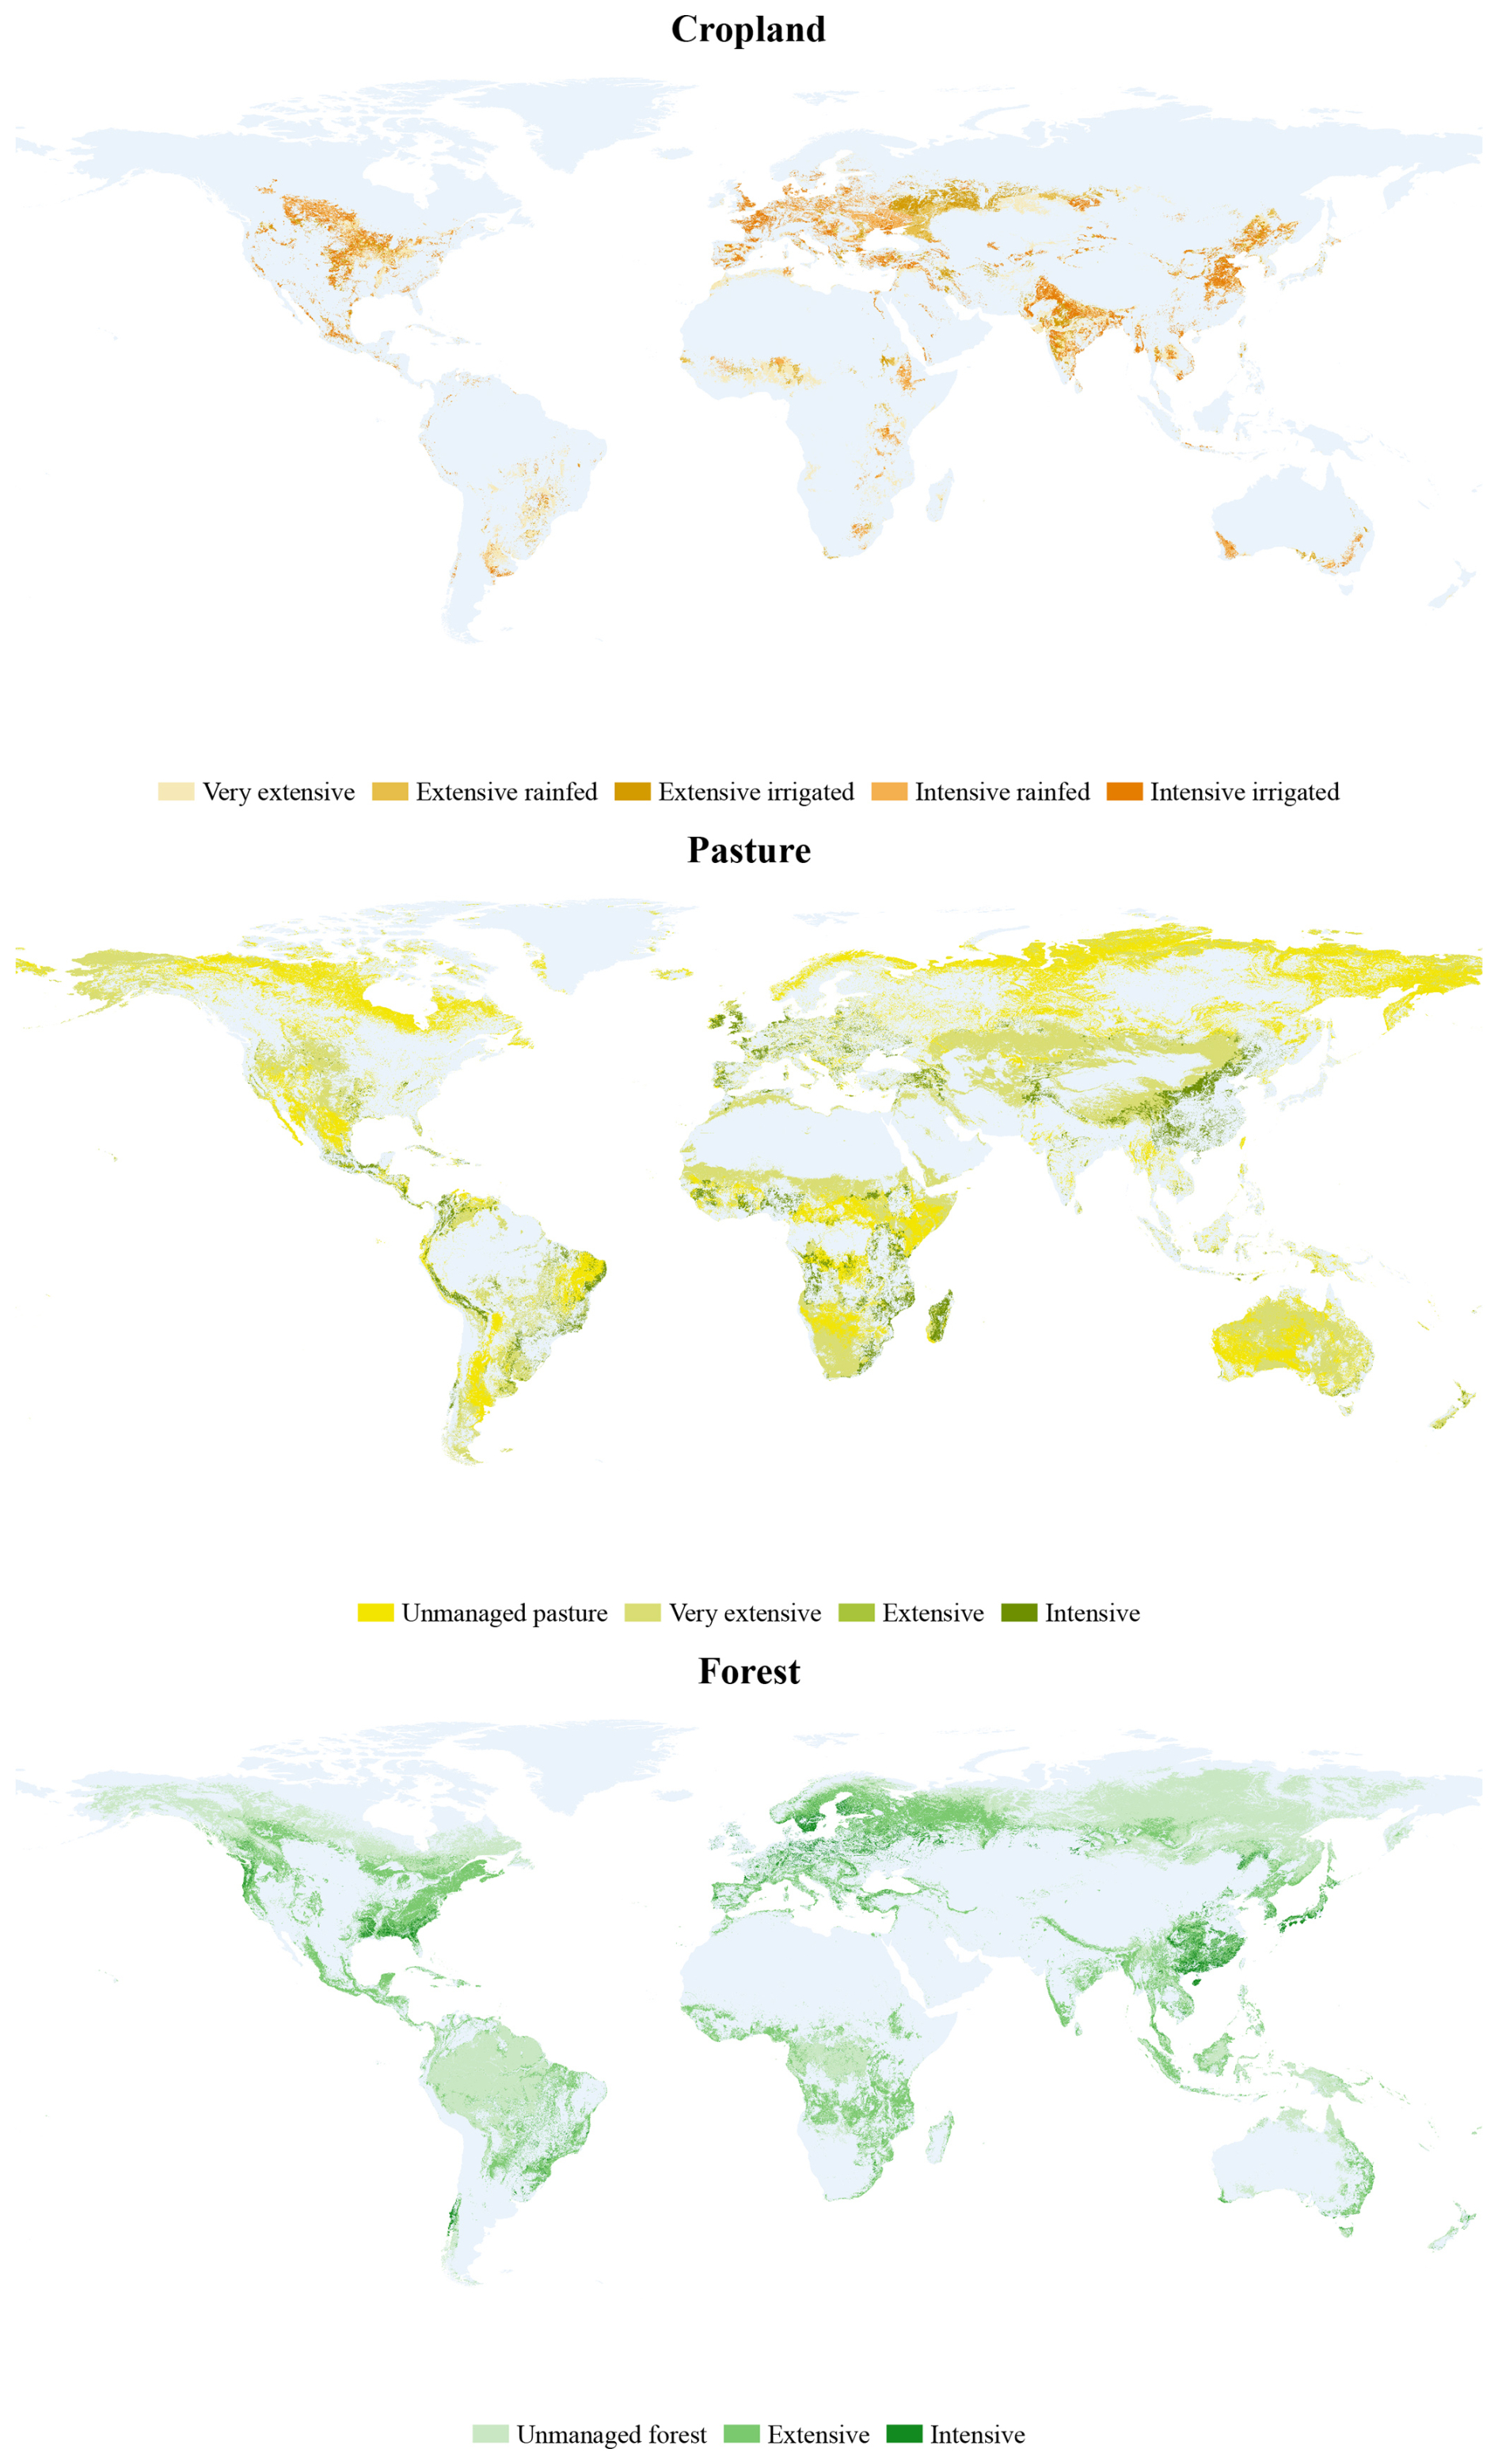
Figure 3Spatial distribution of land management intensity in cropland, pasture, and forest, categorised into very extensive, extensive, intensive, unmanaged forest, and pasture.
The results revealed a sectoral contrast, where intensive management remained concentrated in cropland systems, while pasture and forest systems remained predominantly extensive or very extensive despite their large spatial extent. At the aggregate level, pasture and forest land dominated managed land areas, and together accounted for more than two-thirds of the terrestrial surface. Pasture land occupied around 36 % of the global terrestrial surface, but was predominantly managed at low intensity, with only 10 % under intensive management, 44 % under extensive management, and 46 % under very extensive or minimal management (Figs. A1 & A5). Forests covered around 31.3 % of the global land surface, of which only around 5 % was managed intensively, 40 % managed extensively and 55 % remained unmanaged (mainly in boreal and tropical regions) (Fig. A1). The mapped global distributions of land management intensity aligned closely with independent reference datasets (Fig. A5, Table A3), with deviations (on an area-basis) generally within ±3 percentage points of FAO and IPCC estimates, supporting the robustness of the mapped dataset.
3.2 Economic, regional and country-level patterns in land management intensity
Land management intensity revealed distinct and non-uniform relationships with world income groups, world regions, and countries across land-use sectors (Figs. 4–5 & A1).
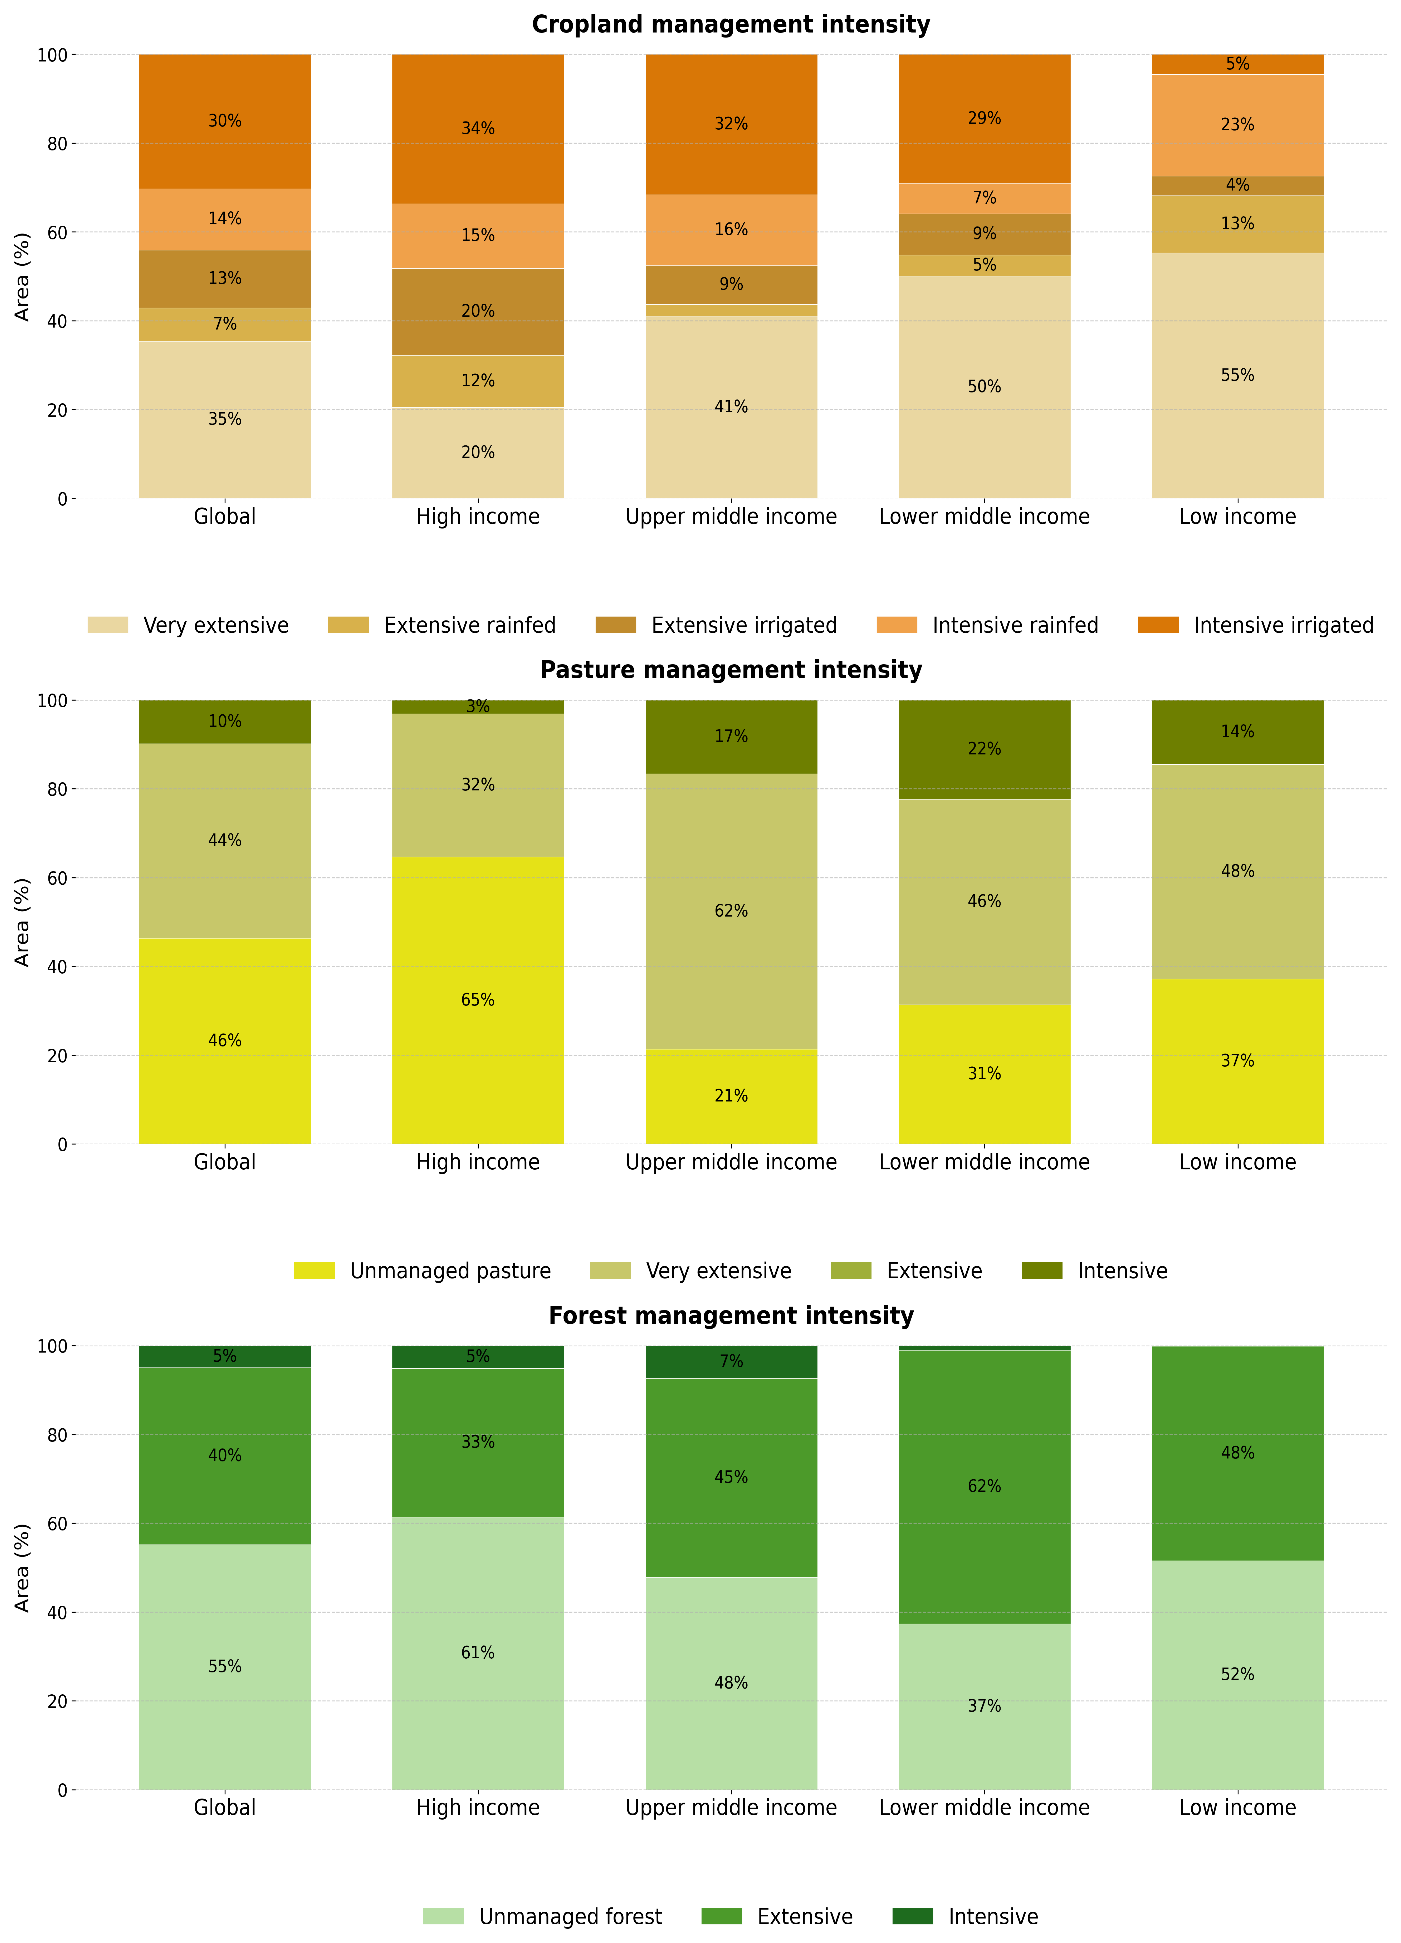
Figure 4Proportion of cropland, pasture, and forest area under different management intensities globally and by world economic groups. Cropland management categories included very extensive, rainfed extensive, irrigated extensive, rainfed intensive, irrigated intensive. Pasture management included unmanaged, very extensive, extensive and intensive. Forest management included unmanaged, extensive and intensive forest.
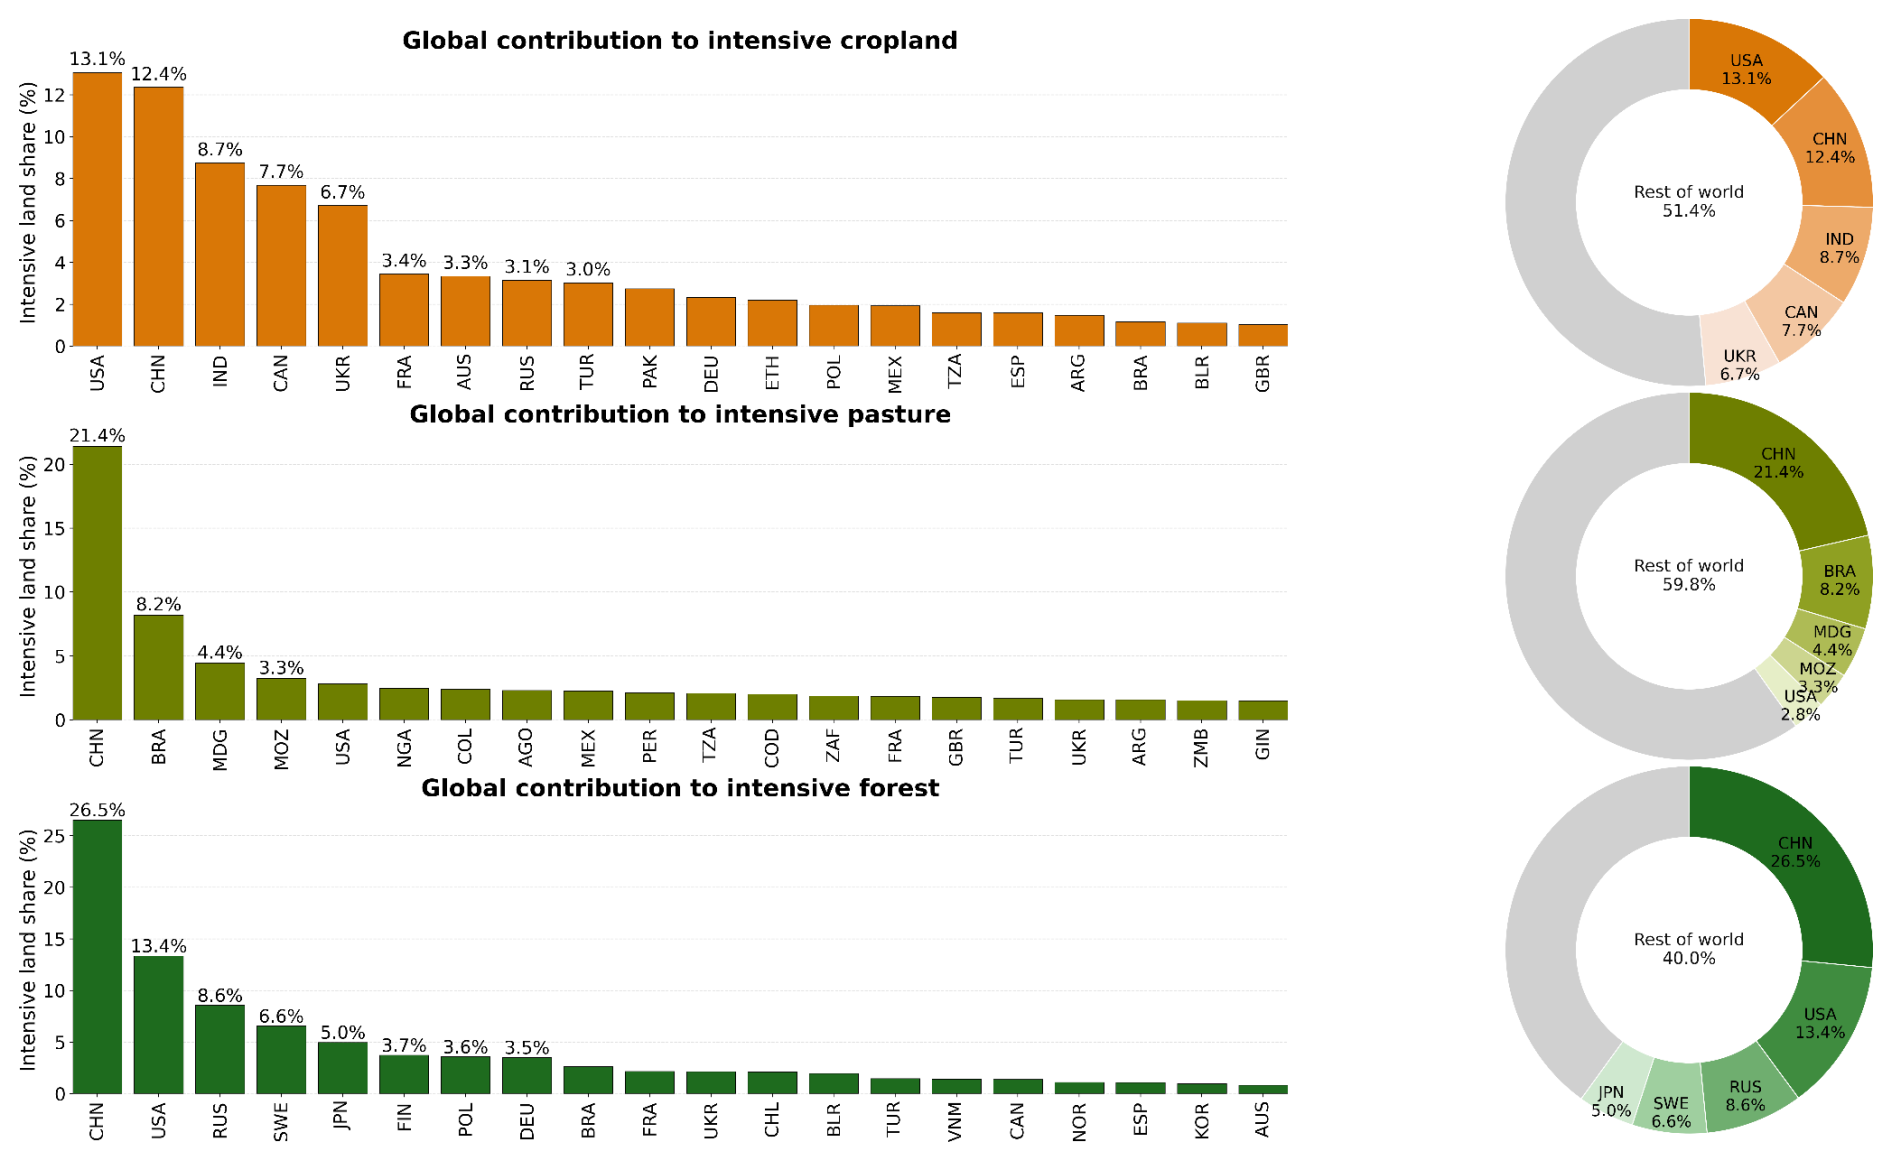
Figure 5Intensively managed land in cropland, pasture, and forest systems. Bars show the percentage distribution of intensive management class for the top twenty countries, while pie donuts show the contribution of top five countries and the rest of world. Countries are arranged by decreasing share of intensive management.
3.2.1 Land management in different income groups
Our analysis indicated that economic development does not uniformly align with intensive management, but has relationship that vary with land-use type and regional characteristics. In cropland systems, economic development and intensive management are strongly linked, but more complex effects are found in pasture and forest systems. In all income groups, management intensity varied substantially across land-use sectors (Fig. 4), indicating that the influence of economic development may vary between cropland, pasture, and forest systems. In cropland, intensive management (rainfed and irrigated combined) accounted for nearly half (49 % and 48 %) of cropland area in high-income and upper-middle income countries respectively, compared to smaller shares in lower-middle income (36 %) and low-income countries (28 %). Conversely, very extensive cropland dominated in low- and lower-middle income countries, where it accounted for approximately 55 % and 50 % of cropland, compared to 35 % globally. Pasture systems were predominantly managed at low intensity across all income groups. Globally, unmanaged and very extensive pastures together accounted for approximately 90 % of pasture area, with intensive pasture representing only about 10 % (Fig. 4). Intensive pasture management was most prevalent in upper-middle and lower-middle income countries (17 % and 22 % respectively) and least common in high-income countries (3 %). Forest management revealed a contrasting pattern, with unmanaged forests dominating globally (55 %) and particularly in high- and low-income countries (61 % and 52 % respectively). Intensive forest management was comparatively rare but occurred disproportionately in upper-middle income (7 %) and high-income countries (5 %).
3.2.2 Land management in different world regions
Regional patterns indicate that land management intensity may not only be driven by economic development (i.e., income), but also by regional conditions, and institutional contexts, leading to diverse management intensities across the globe (Fig. A1). Intensive cropland management was concentrated in North America (56 % of the cropland area) and East Asia & Pacific (55 %), followed by Europe & Central Asia (47 %) and South Asia (41 %).
In contrast, very extensive cropland dominated in Latin America & Caribbean (62 %), Sub-Saharan Africa (56 %) and the Middle East & North Africa (53 %), revealing an uneven distribution of management intensity across regions. Pasture systems were largely unmanaged or very extensively managed across all regions, but showed greater variability in Latin America & Caribbean (i.e., very extensive – 42 %, intensive – 18 %), and South Asia (i.e., very extensive – 46 %, intensive – 23 %). Forest management also exhibited regional differences: intensive forest management was most pronounced in East Asia & Pacific (13 %), followed by Europe & Central Asia (6 %) and North America (4 %). Unmanaged forests dominated in Europe & Central Asia (63 %), while extensive forest management was most prevalent in South Asia (80 %), the Middle East & North Africa (76 %), and Sub-Saharan Africa (57 %).
3.2.3 Concentration of intensive management at the country level
Global patterns of land management intensity were found to be disproportionately driven by a small number of countries, perhaps indicating a role of national-level policies, and land-use practices in determining management intensity decisions. The United States, China, India, Canada and Ukraine together accounted for nearly half of global intensive cropland area (49.8 %), with individual contributions of 13.1 %, 12.4 %, 8.7 %, 7.7 % and 6.7 % respectively. A similar concentration pattern was observed in pasture systems, where China (21.4 %), Brazil (8.2 %), Madagascar (4.4 %), Mozambique (3.3 %), and the United States (2.8 %), together accounted for around 40 % of global intensive pasture area (Fig. 5). Intensive forest management was even more concentrated, with China (26.5 %), the United States (13.4 %), Russia (8.6 %), Sweden (6.6 %), and Japan (5 %) together representing around 60 % of intensively managed forest worldwide (Fig. 5).
3.3 Socioeconomic and biophysical drivers of land management intensity
Multinomial logistic regression models were used to quantify the relationship of socioeconomic (economic development i.e., GDP per capita, inequality i.e., GINI, infrastructure accessibility i.e., market access, and population density) and biophysical variables (elevation and aridity index – higher values are more humid and lower values more arid) with the probability of different land management intensity classes across cropland, pasture and forest systems. A pairwise correlation and the variance inflation factor (VIF) for all the variables and land-use types were computed to check for multicollinearity. A weak to moderate correlation (−0.09 to +0.37) and low VIF (+1.1 to +3.0) values were found to indicate the absence of multicollinearity (Fig. A6). Non-linear relationships were identified between socioeconomic variables and land management intensity, with differences in direction and magnitude across land-use and land-cover classes and world income groups (Table A4, Figs. A7–A9). Marginal effects were computed to quantify the changes in predicted class probabilities associated with a one-standard deviation increase in each socioeconomic variable (Fig. 6).
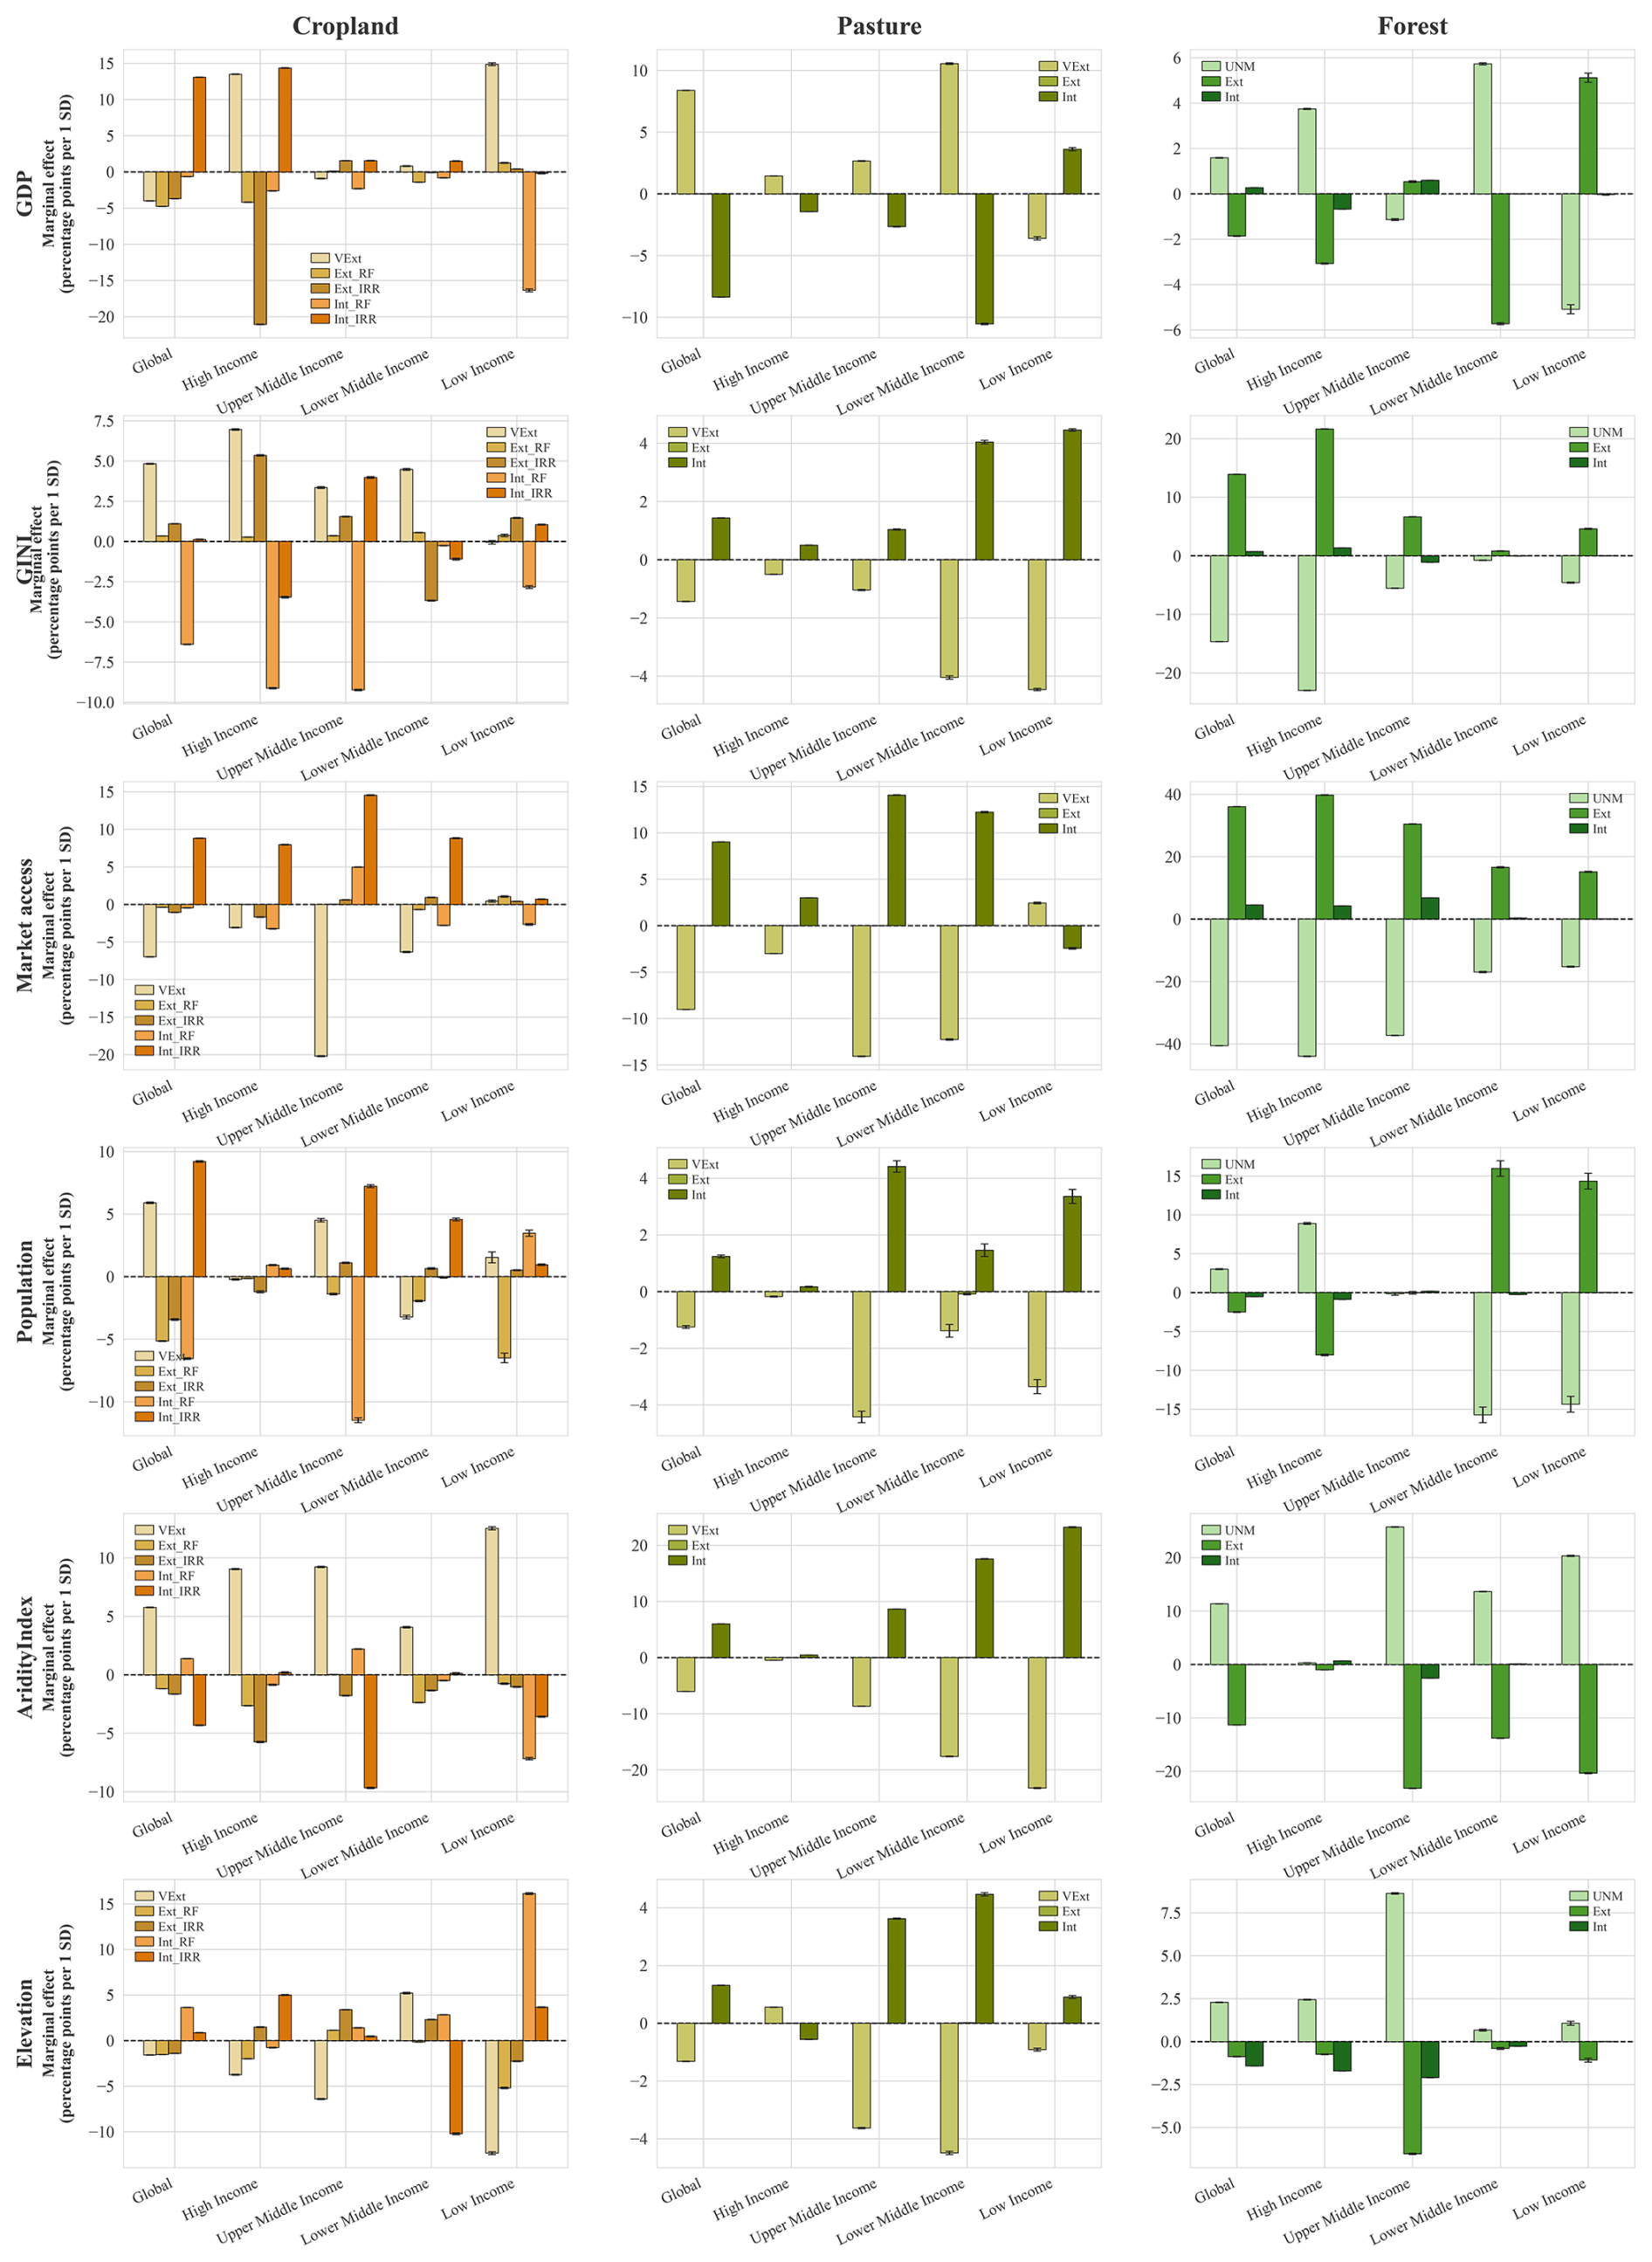
Figure 6Marginal effects of socioeconomic variables on land management intensities. Individual plot shows an average marginal effect of socioeconomic variables on the predicted probability of land management intensity (very extensive, extensive, and intensive) for cropland, pasture and forest across global and world economic group. Bars represent average marginal effects calculated from multinomial logistic regression method with 95 % confidence interval. Positive (negative) values indicate an increase (decrease) in the probability of a given management intensity class associated with a one standard deviation change in the corresponding socioeconomic variable.
3.3.1 Relationship between socioeconomic and biophysical variables, and land management intensity
Socioeconomic and biophysical variables were correlated with land management intensity with the direction and magnitude of these relationships varying across land-use sectors and income groups (Fig. 6, Figs. A7–A9). Cropland management intensity showed a positive association with economic development and market connectivity (Figs. A7 & Fig. 6). Higher GDP per capita and improved market access were correlated with higher probabilities of intensive (with irrigated) cropland management, while extensive and very extensive cropland systems declined. For example, a one standard deviation increase in GDP was associated with increases of up to 17 percentage points in the probability of intensive cropland management. Population density was also positively associated with intensive cropland management, especially in upper- and lower- middle income regions. In contrast, higher income inequality (GINI) and increasing aridity index were correlated with greater probabilities of extensive or very extensive cropland management. Elevation showed more heterogeneous relationships across regions (Fig. A7). The details related to marginal effects are summarised in Table A5.
Pasture management showed associations with market access and climate conditions than with economic development. Increased market accessibility and higher aridity index were corelated with greater probabilities of intensive pasture management across several regions, with aridity index showing a higher association (up to 22 percentage points in some regions) (Figs. A8 & 6). Population density and inequality showed weaker but positive relationships with intensive pasture management, whereas GDP per capita exhibited relatively limited and region-specific correlations.
Forest management intensity was found to be the most heterogeneous among the three sectors. Market accessibility was correlated with higher probabilities of intensive and extensive forest management, accompanied by substantial declines in unmanaged forest probability across regions (Fig. A9). In high- and upper-middle-income regions, greater inequality was associated with increased probabilities of extensive forest management and lower probabilities of unmanaged forest.
Aridity was associated with higher probabilities of unmanaged forest, while GDP per capita showed positive associations with intensive forest management primarily in low-income regions. Population density exhibited mixed relationships, with denser populations associated with more intensive forest management in high-income regions but with greater probabilities of extensive or unmanaged forests in several middle- and low-income regions. Detailed regional marginal effects are reported in Table A5.
3.4 Comparison between land management intensity and land decision-making types
A comparison between the land management intensity dataset presented in this study and the decision-making types of Malek and Verburg (2020) (Table A3) provided insights into the behavioural dimensions of land management. The decision-making categories represented diverse farmer and land manager behaviours, ranging from survivalist and subsistence smallholders to professional intensifiers and eco-agriculturalists. Figure 7 shows the global spatial distribution of consistency with one or more plausible management intensity classes and mismatch between land management intensity and land-use decision-making types (more details in Methods). Across all land systems, a total of 32 822 016 valid grid cells were compared, of which, 22 074 882 grid-cells (68 %) showed spatial consistency with one or more plausible management intensity classes, while 32 % showed divergence. This level of consistency indicated that, despite conceptual differences, spatial patterns of land management intensity are broadly consistent with important dimensions of land-use decision-making at the global scale. Large regions of consistency were observed in intensively managed cropland systems, including parts of North America, Europe, East Asia, and South Asia, where high-input management aligns with decision-making types characterised by commercialisation and intensive management. Consistency was also evident in regions dominated by very extensive or extensive land systems, such as parts of boreal Eurasia, central Africa, and arid and semi-arid regions where low-input management corresponds to decision-making types characterised by limited intervention. In contrast, spatial mismatches were concentrated in heterogeneous landscapes, where land-use decisions and management intensity vary over small spatial extents. These included regions with mixed land-use systems, transitional management regimes, or overlapping decision-making strategies. In such cases, similar decision-making types may correspond to multiple management intensities or management outcomes may diverge from dominant behavioural classifications.
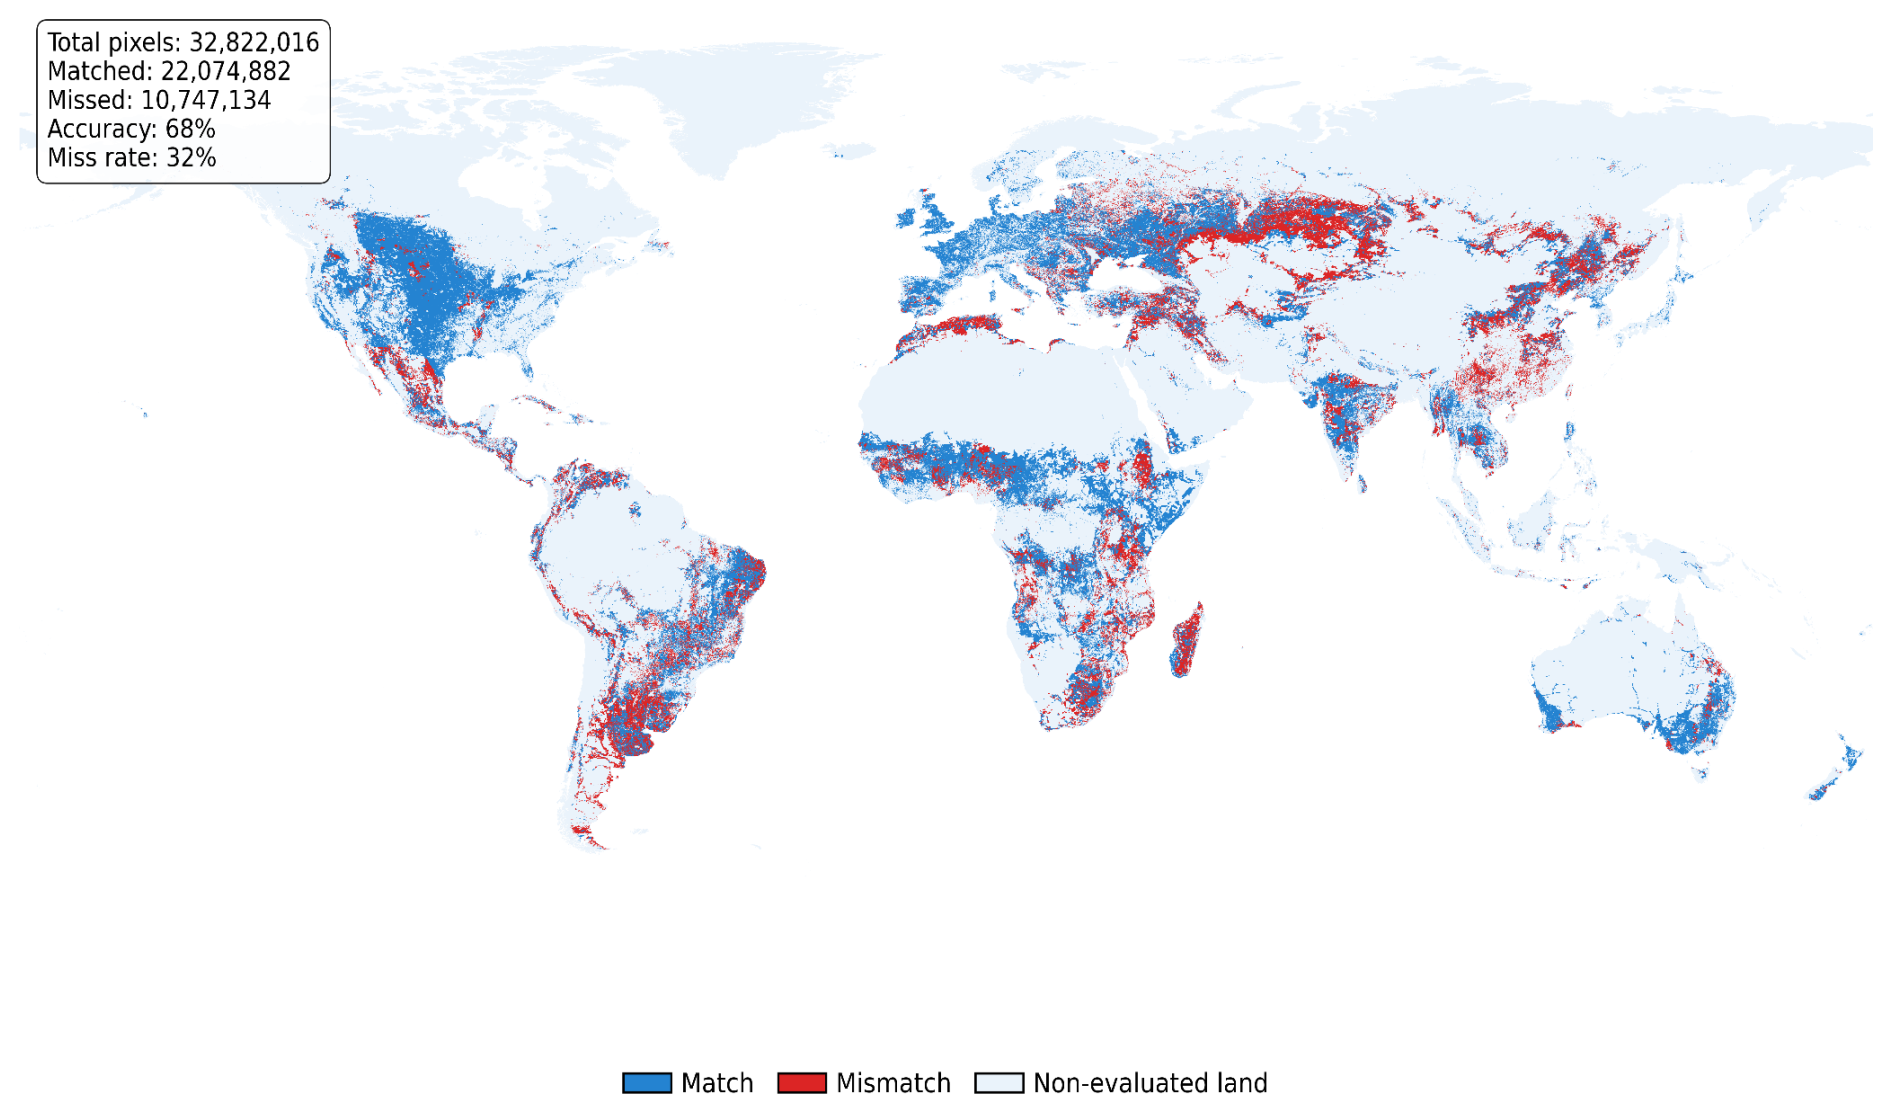
Figure 7Comparing land management intensities and land-use decision-making types (given by Malek and Verburg, 2020) showing spatial consistency between the decision-making types and management intensities.
We provide a global, harmonised land management dataset including all major land-use/cover types across cropland, pasture, forest, photovoltaics, unmanaged land, and urban sectors, along with management intensity information for the agriculture and forest sectors. Until now, no such consistent dataset has been available globally to allow analysis of the statistical relationships between land management and underlying variables relating to income, accessibility, biophysical conditions and demography, among others. In this study, we integrate land-use and land-cover thematic information with land management intensity using multiple datasets, providing a harmonised and spatially-explicit representation of global land management at 0.01°. The relationships of management intensity with socioeconomic and biophysical conditions, and with land-decision making types, deepens understanding of land-system management globally, reflecting its varied dependencies and manifestations. The results reveal that management intensity is unevenly represented across land-use and land-cover categories and across world regions, indicating that land-use and land-cover datasets alone are insufficient to characterise levels of intensity (Erb et al., 2017; Meyfroidt et al., 2022). Globally, intensive management accounted for around 22 % of land areas across cropland, pasture and forest systems, while extensive and very extensive together dominated, covering about 33 % and 45 % respectively. Intensive management represented around 44 % of global cropland area, but only about 10 % of pasture and 5 % of forest area. Despite widespread narratives of intensive management, most land, especially pasture and forest, remains under extensive to very extensive management (Erb et al., 2016; Turner et al., 2022).
Heterogeneous management patterns occur even within broadly similar landscapes, showing strong regional differences in biophysical and socioeconomic conditions. Intensive pasture management is relatively limited and appears to be determined more by biophysical conditions and accessibility than by economic development. Similar relationships were found by Herrero et al. (2013) and Jayne et al. (2019). Forest management intensity is greater in Northern and Central Europe and parts of East Asia, while unmanaged forests dominate large areas of the Amazon basin, Central Africa and Northern Eurasia.
A relatively small number of countries were accounted for a large share of globally intensive land management. We found that the United States, China, India, Canada, and Ukraine together account for nearly half (49.8 %) of intensive cropland globally. Similarly, China, Brazil, Madagascar, Mozambique, and United States account for 40.2 % of intensive pasture, while China, the United States, Russia, Sweden, and Japan together represent around 60 % of the intensive forest management. These patterns are not wholly attributable to economics; high-income regions tend to exhibit higher shares of intensive management in cropland and forest sectors, but extensive and very extensive management remain prevalent, particularly in pasture. Conversely, some low and lower-middle income regions show pockets of intensive, often irrigated cropland, indicating that management intensity emerges from interactions between biophysical and socioeconomic conditions rather than from the economy alone.
The relationships between management intensity and socioeconomic and biophysical variables are sector dependent and also non-linear. Nonetheless, a fairly good match (68 % accuracy, Fig. 7) between our land management intensity dataset and the decision-making types of Malek and Verburg (2020), indicates an association between the spatial distribution of management intensity and the behavioural aspects of land management decisions. Higher GDP and improved market access are generally correlated with increased probabilities of intensive (especially irrigated) cropland management. This pattern reflects the capital and infrastructure intensive nature of high-input cropping (Foley et al., 2011). Similarly, population density correlates with the management intensity indicating a higher land pressure, which appears to provide incentives to intensify production (Zabel et al., 2019). In contrast, income inequality appears to play a comparatively minor and often dampening role suggesting that uneven access to resources can limit transitions toward high-input management even where aggregate economic conditions are favourable (Lambin and Meyfroidt, 2011; Ostrom, 2009).
Pasture management follows a slightly different pattern compared to cropland. Pasture is dominated by very extensive and extensive management with intensive systems occupying only a small area across income groups. Socioeconomic factors show weaker relationships, with market access primarily associated with a transition from very extensive to extensive management rather a shift towards intensive pasture management. This response reflects that grazing systems are often constrained by biophysical conditions (e.g., cold or aridity), and relatively low returns on capital intensive inputs. Unlike cropland, pasture management is therefore less directly linked to economic growth and more to market accessibility among other factors. Pasture (and rangeland) is also a difficult land use class to identify, especially at lower management intensities, making firm conclusions difficult to draw at global extent (Harrison et al., 2025). Forest management intensity shows a heterogeneous response to socioeconomic variables. Increased market access is associated with a decline in less-intensively managed forests and a corresponding increase in predominantly extensive forest management, suggesting that accessibility facilitates forest management. However, this does not relate to widespread intensive forest management, probably because of constraints from government regulation and environmental policies (Rudel et al., 2010). Economic development is therefore insufficient to explain intensive forest management, and in some contexts higher income coincides with reduced intensive management due to conservation policies or land-use zoning.
The comparison between management intensity and land-use decision making types reveals conceptual consistency at the global scale (Malek and Verburg, 2020). Approximately two-thirds of valid grid cells show consistency between the two datasets, despite their different conceptual foundations. The consistency indicates that management intensity aligns with core aspects of land-use decision-making and the behaviours that underpin it. The regions with greatest consistency have clearly defined land-use strategies, such as intensively managed cropland systems in major agricultural regions and very extensive and unmanaged land systems in remote or environmentally constrained areas. Areas of mismatch, in contrast, tend to occur in heterogeneous landscapes with multiple decision-making strategies or where similar strategies lead to different management outcomes. These mismatches imply either mixed land management practices or environmental constraints that were not assessed in this study, and which may reduce the influence of behavioural drivers. Linking management intensity with a behavioral dimension provided a broader understanding of land management decisions which helps to understand these decisions in addition to economics.
The dataset presented here provides a robust baseline of current global land management patterns. It can support the initialisation, parameterisation and validation of land-use models, enabling a better representation of spatial heterogeneity in management practices. In addition, the study can be useful in the assessment of policy-oriented analyses for example land-based climate mitigation strategies – assessing trade-offs between ecosystem service provision and environmental impacts.
The dataset developed here represents a spatially harmonised approximation of global land management conditions around 2020. Absolute thresholds were used to classify management intensity, which may not fully capture regional differences and all locally-relevant management practices. Using this approach does, however, enable a consistent global comparison of management intensity patterns, essential for assessing patterns and relationships. The dataset integrates multiple inputs with different spatial resolutions, temporal coverages, and methodological assumptions. Several crop and pasture management indicators originally available at coarse resolutions were resampled to the 0.01° grid. This approach preserves finer land-use classes, but inevitably retains underlying uncertainties associated with the coarse data. Resampling methods are limited when approximating class assignment, we have tried to minimize this limitation by applying the most suitable methods in individual cases. These are particularly pertinent to pasture classes, where data are not only of coarse spatial and temporal resolution but also more uncertain than equivalent datasets for other land cover classes (Harrison et al., 2025). Some datasets were derived from slightly earlier time periods than 2020 and may therefore not fully represent recent changes. Missing fertiliser values were conservatively treated as absence of fertiliser input and therefore assigned to the very extensive management class. This approach avoids artificially inflating intensive management for relatively small number of grid-cells, but it may lead to some underestimation of management intensity where fertiliser was unrecorded rather than unused. However, this limitation reflects a broader challenge in global land system science, where key processes cannot be directly measured but instead need to be approximated using best-available data.
We provide a global land management intensity dataset explorer: https://ee-ankitasaxena03as.projects.earthengine.app/view/global-land-use-management (last access: 27 August 2026; Saxena et al., 2025) and these data are available at https://doi.org/10.5281/zenodo.18249970 (Saxena et al., 2026) for research purposes. Input data for socioeconomic variables (GDP, GINI, market access and working age population) can be accessed through https://doi.org/10.5281/zenodo.17580780 (Perkins et al., 2025) and world region boundaries can be found at https://datacatalog.worldbank.org/ (last access: 27 August 2026). Any other data that support the findings of this study are included within the article, online methods and appendix materials.
Overall, the study shows that management intensity cannot be treated as a homogeneous response to socioeconomic or biophysical change, since it emerges from complex, sector-specific and non-linear interactions between socioeconomic, biophysical, and behavioural factors. These findings challenge the simplified assumptions that are commonly embedded in global land-use and integrated assessment models, where economic growth is often assumed to drive land-use change uniformly (e.g., Popp et al., 2017; Stehfest et al., 2019; Ma et al., 2024). Instead, the results show distinct relationships with socioeconomic variables across cropland, pasture and forest management. At the same time, broad consistency between land management intensity classes and land-use decision-making types indicates that management intensity can serve as a useful proxy if partial for land-use behaviour at large scales (Brown et al., 2017; Rounsevell et al., 2021). While the observed mismatches further indicate that decision-making strategies do not translate into a single management outcome, particularly in heterogeneous landscapes.
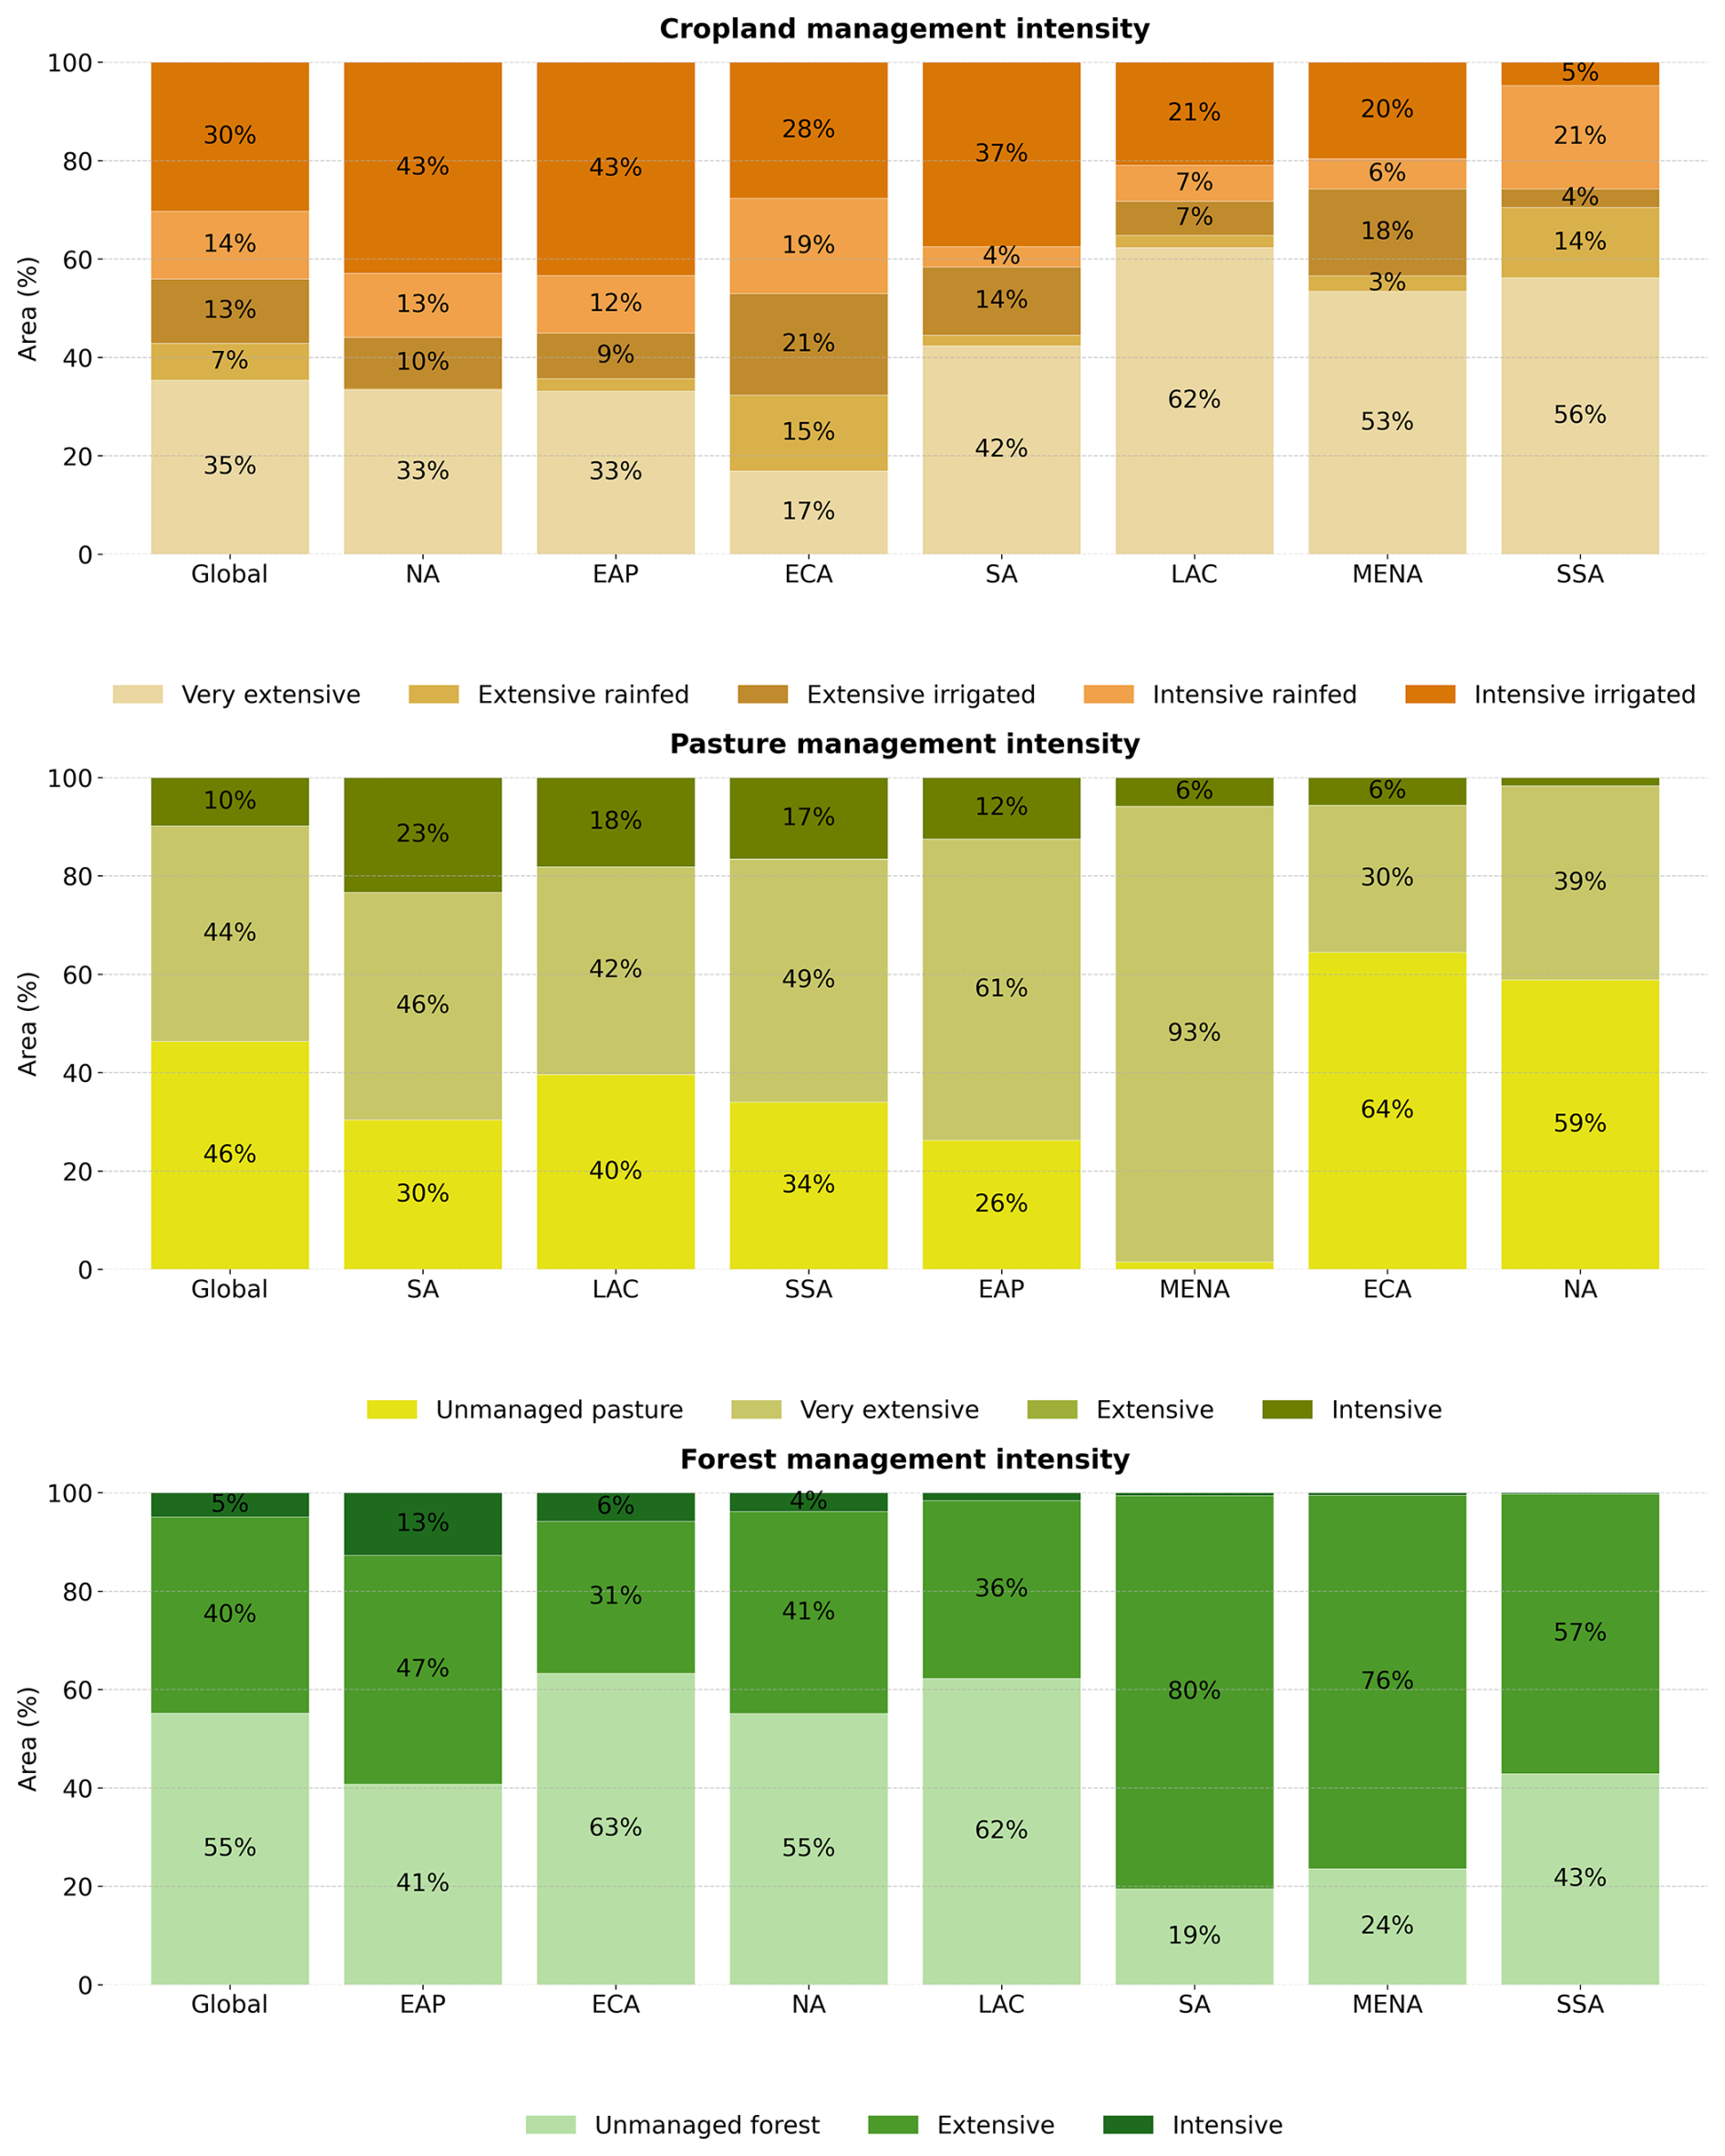
Figure A1Proportion of cropland, pasture, and forest area under different management intensities by World Bank regions in 2020. Cropland management categories included very extensive, extensive rainfed, extensive irrigated, intensive rainfed, intensive irrigated. Pasture management included unmanaged, very extensive, extensive and intensive pasture. Forest management included unmanaged, extensive and intensive forest. Regions include: EAP – East Asia & Pacific, ECA – Europe & Central Asia, LAC – Latin America & Caribbean, MENA – Middle East & North Africa, NA – North America, SA – South Asia, SSA – Sub-Saharan Africa.
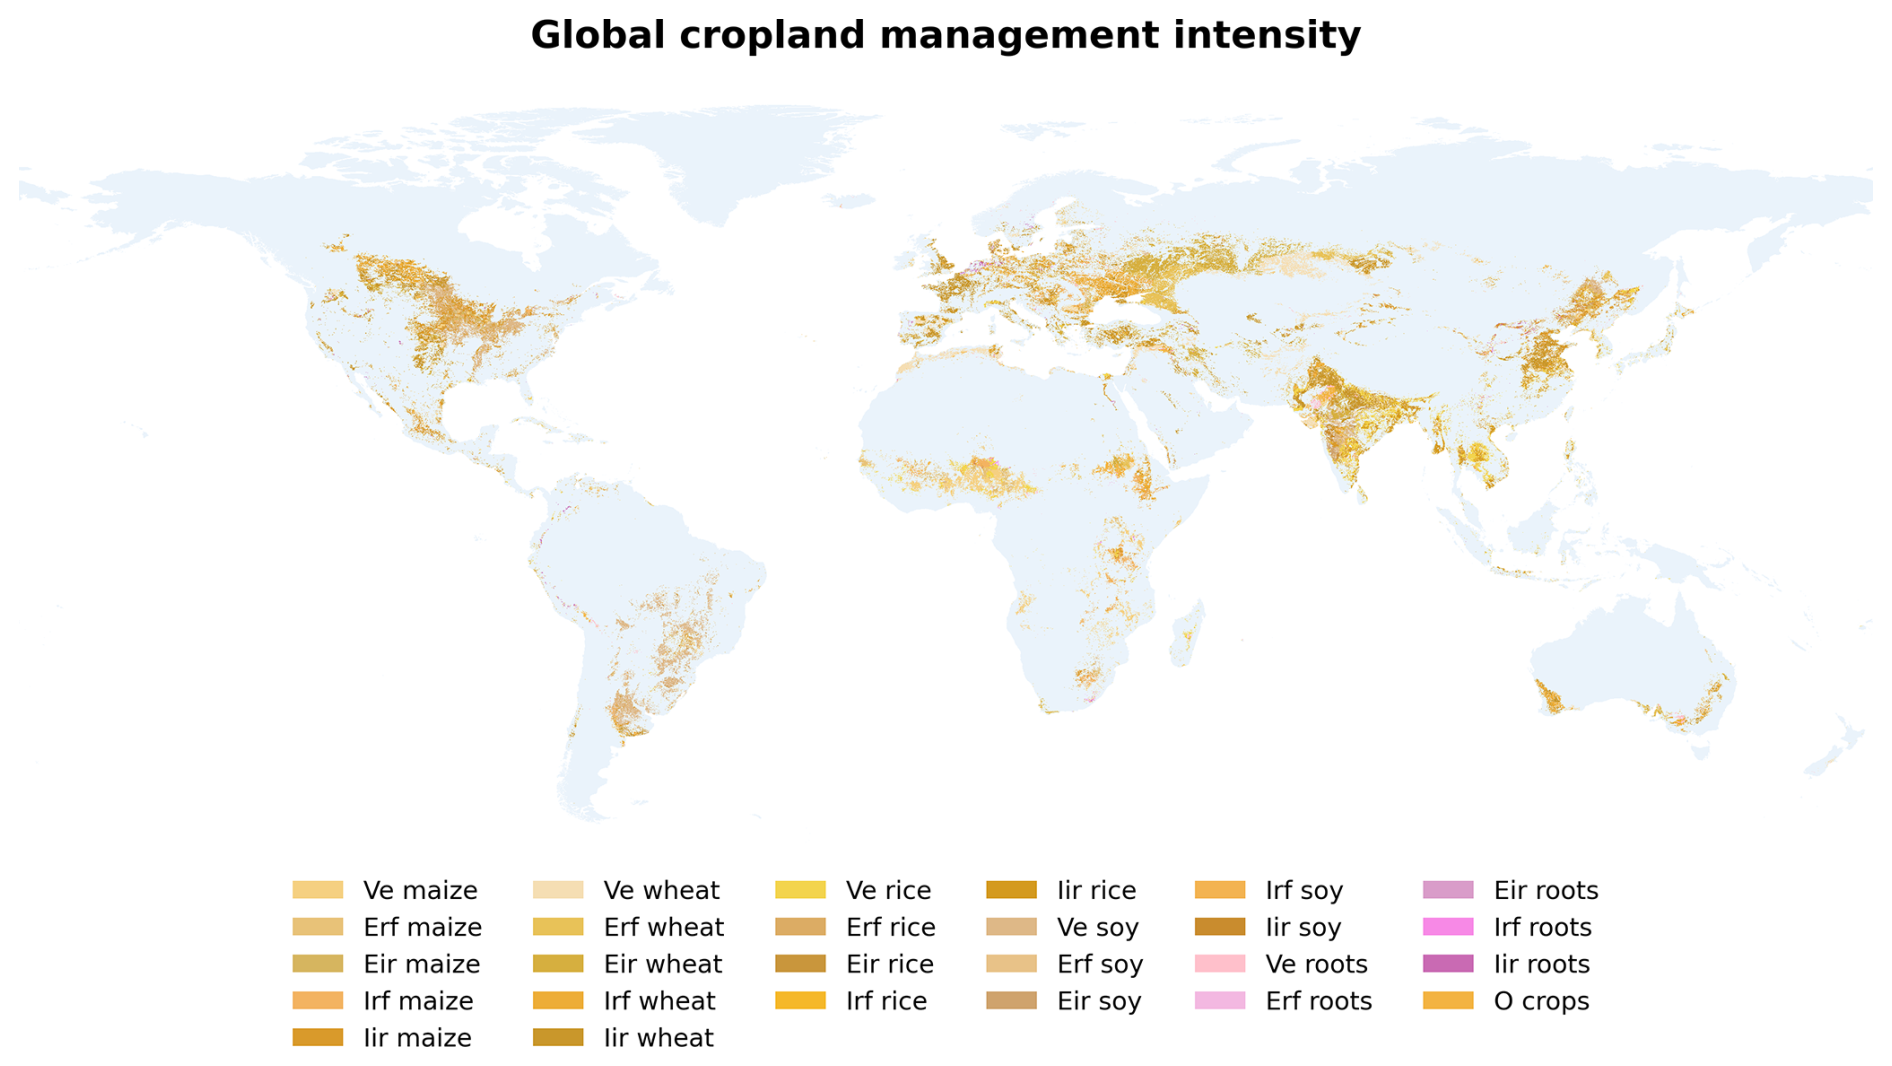
Figure A2Global cropland management intensity. Cropland management categories included very extensive (Ve), extensive rainfed (Erf), extensive irrigated (Eir), intensive rainfed (Irf), intensive irrigated (Iir). Roots include tubers and potatoes, and “O” refers to “other crops”.
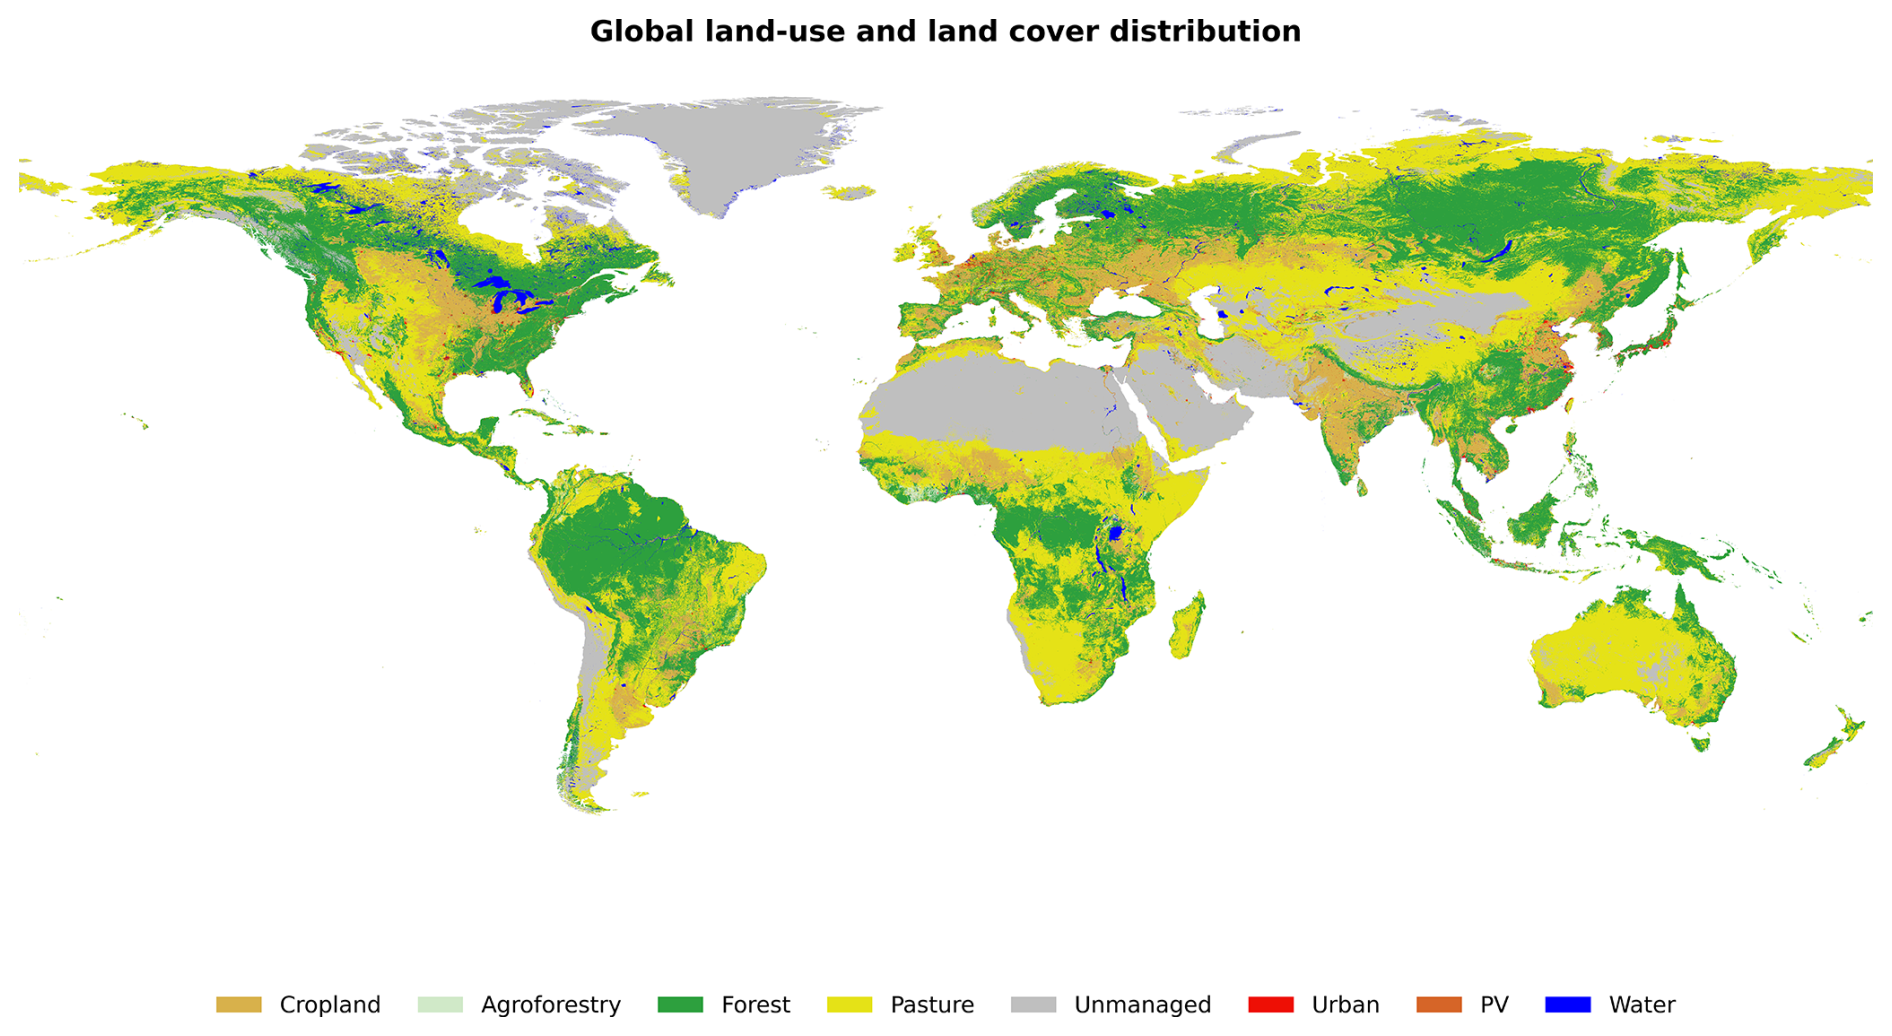
Figure A3Global Land-use and land cover distribution. The map shows broader land-use and land cover classes.
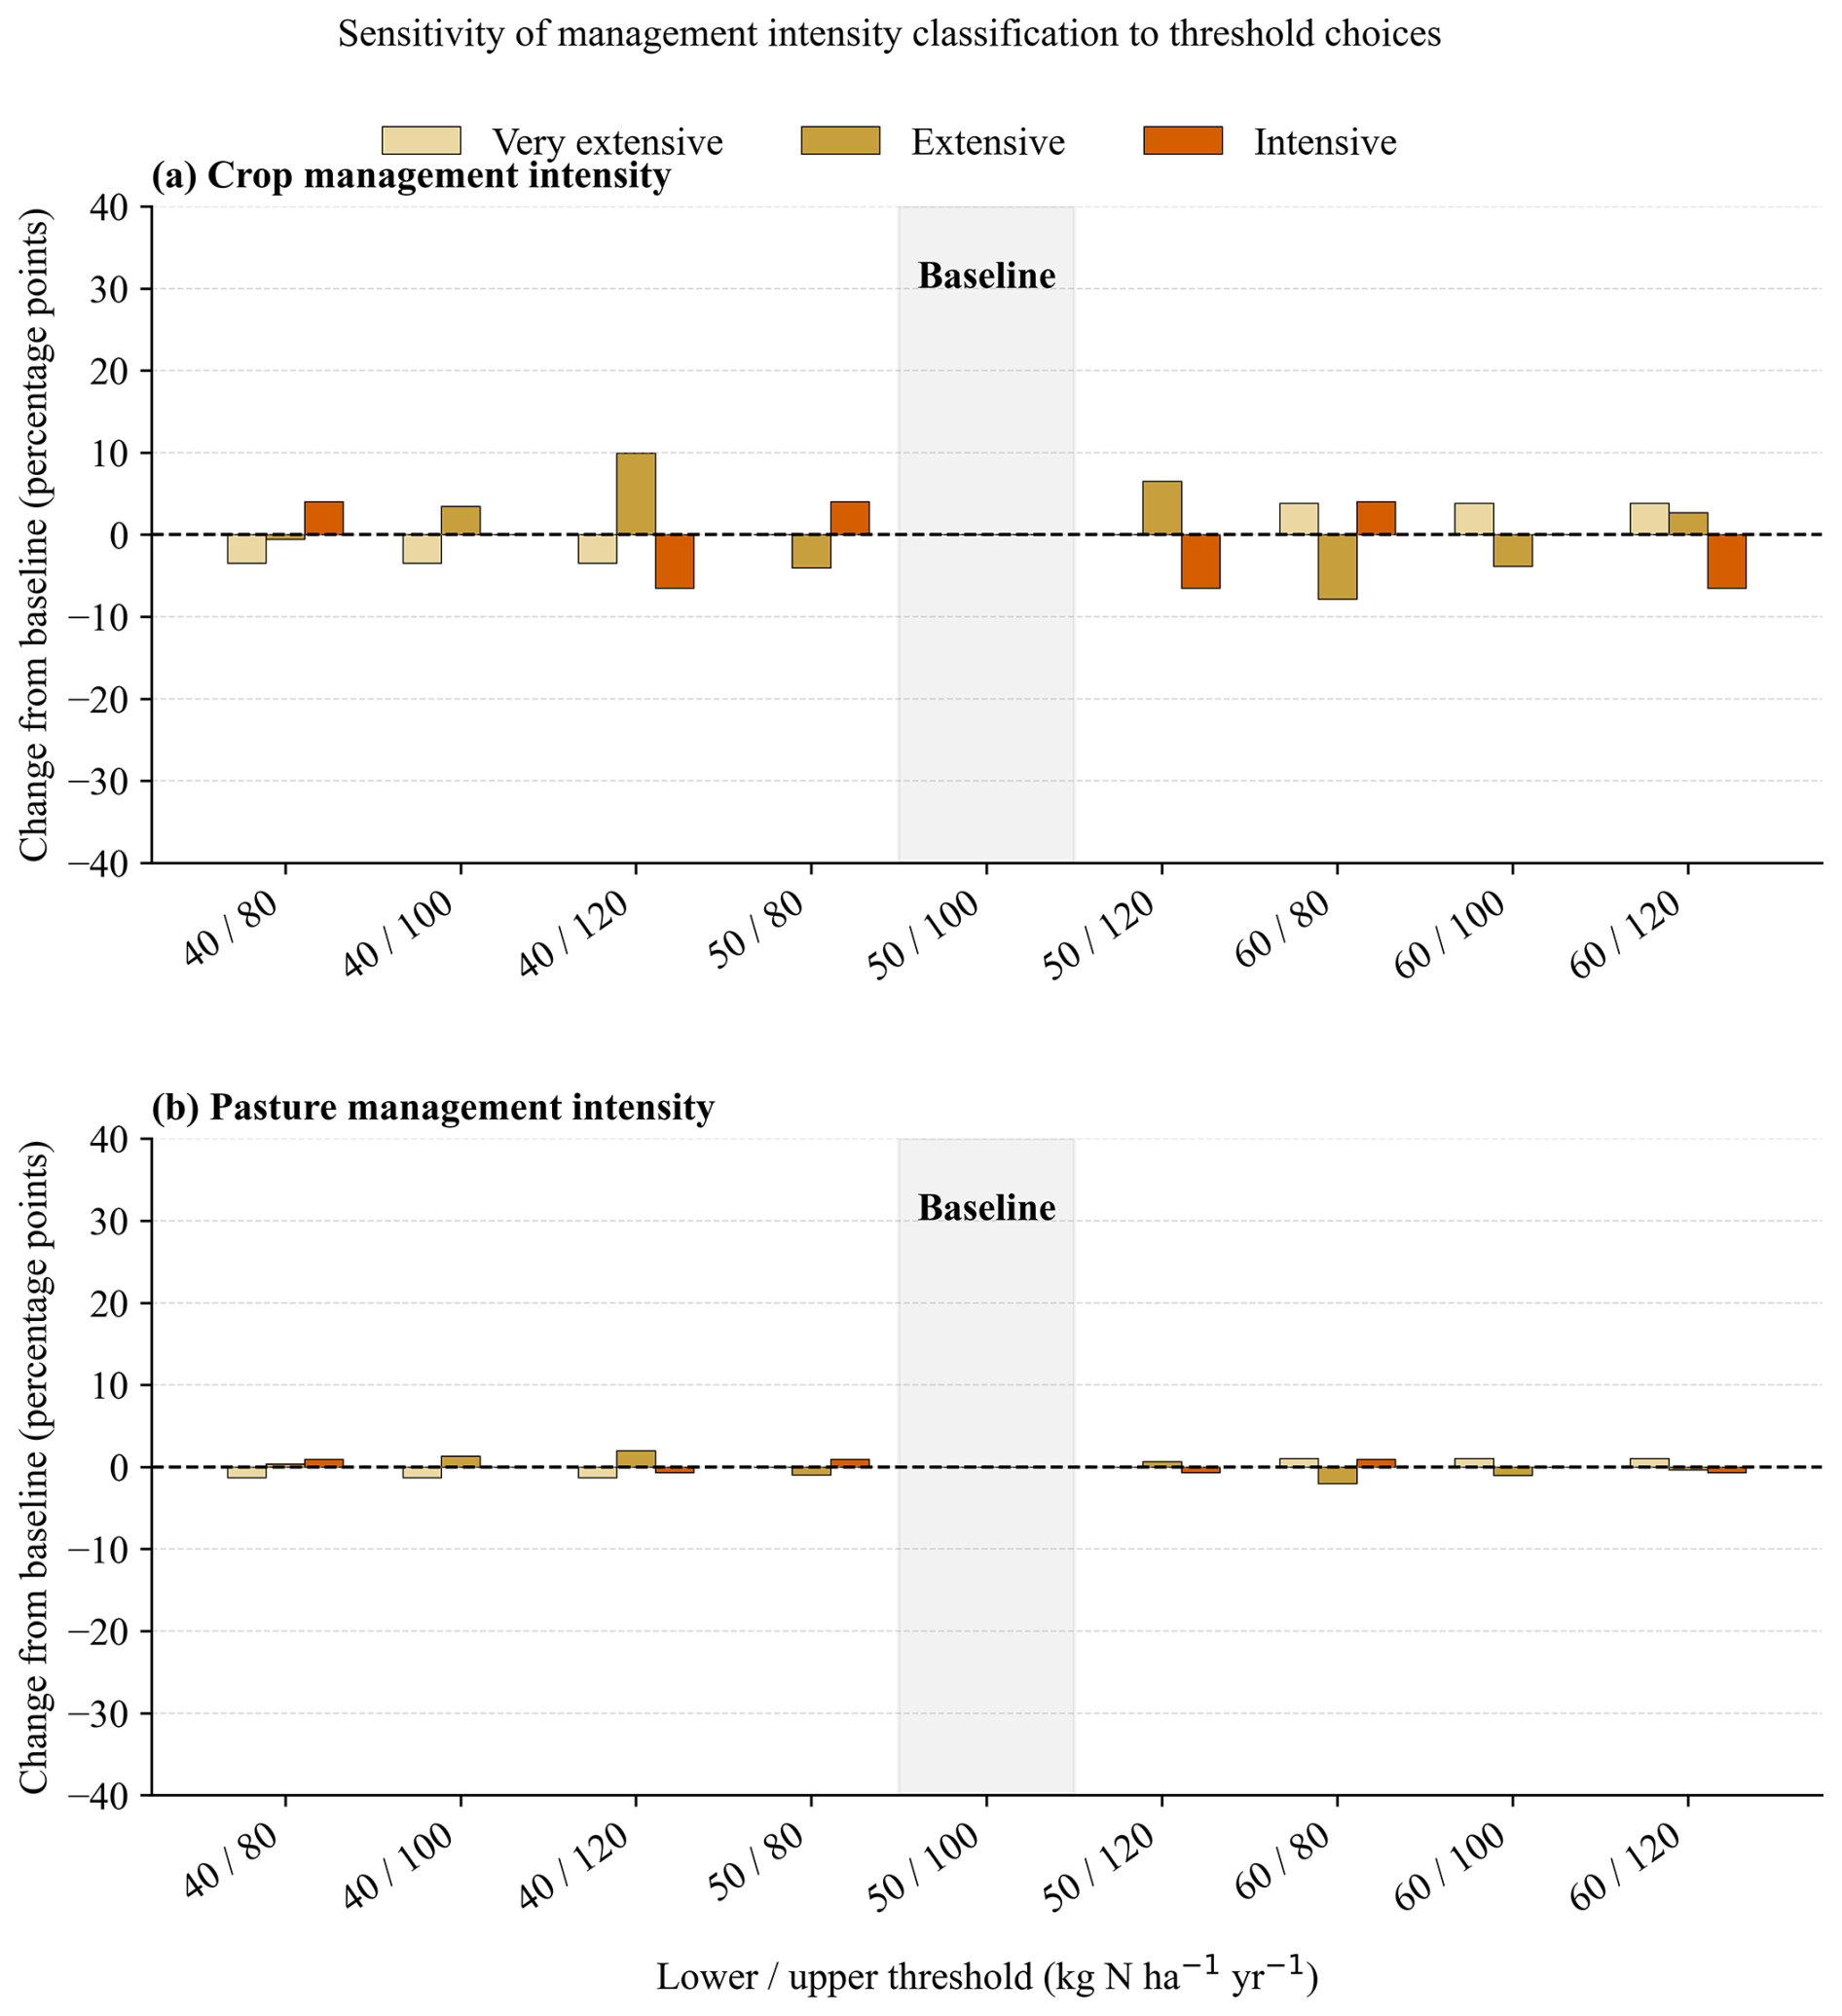
Figure A4Sensitivity analysis of cropland and pasture management intensity classifications to different thresholds values. The x-axis represents the lower and upper thresholds used for the management intensity classes, while the y-axis indicates changes in the spatial agreement with respect to the baseline in percentage points.
Table A1Sensitivity analysis of cropland management intensity classification for different thresholds. The table includes shares of very extensive, extensive, and intensive land and spatial agreement with the baseline threshold.
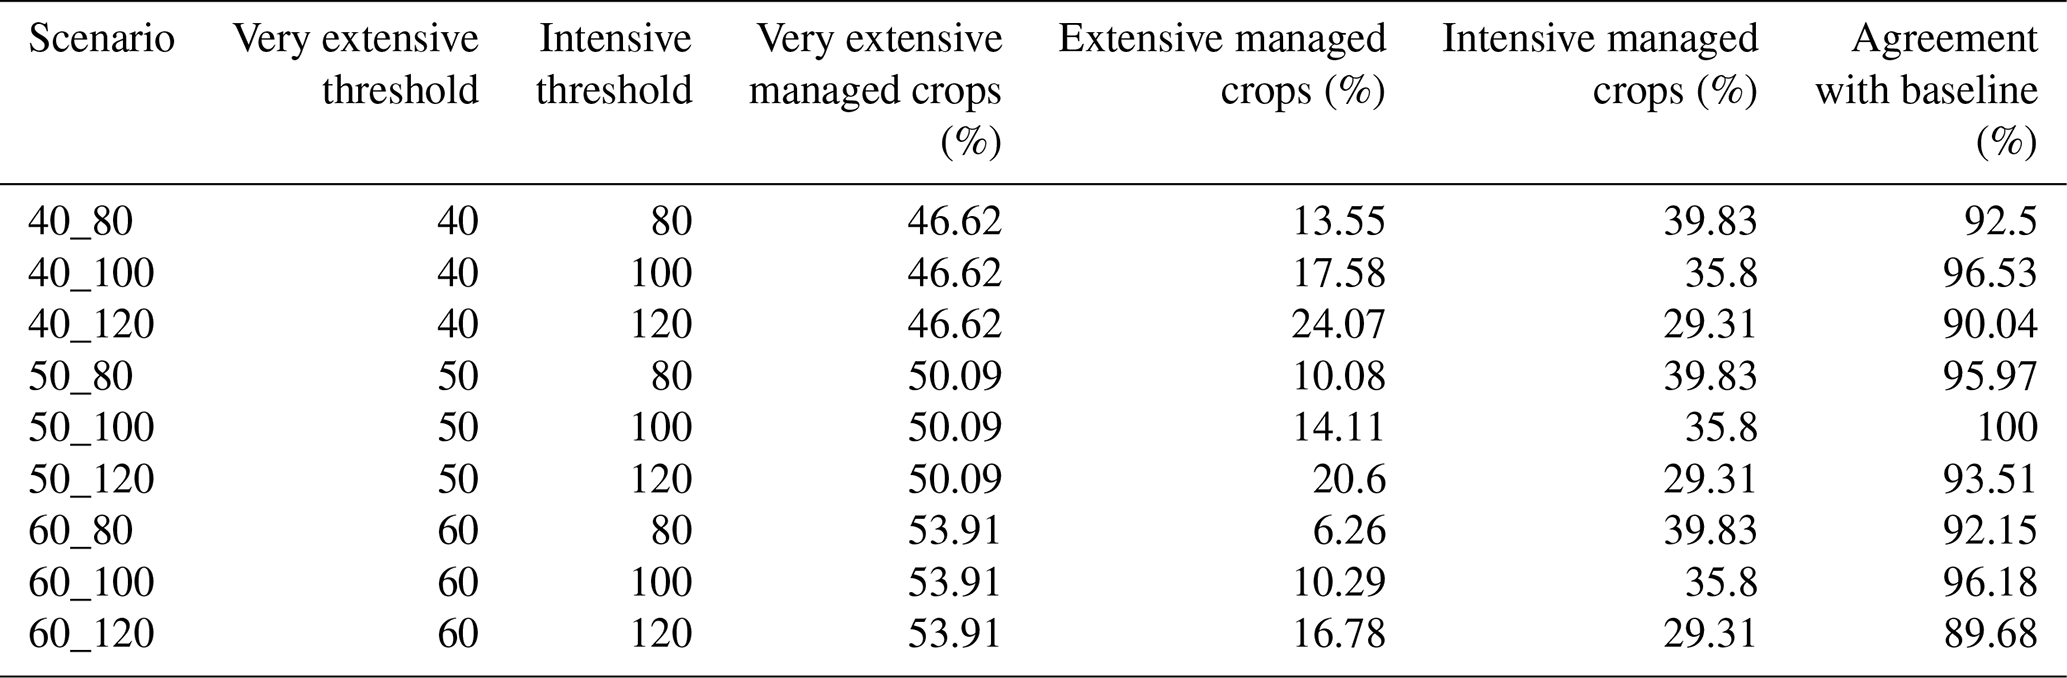
Table A2Sensitivity analysis of pasture management intensity classification for different thresholds. The table includes shares of very extensive, extensive, and intensive land and spatial agreement with the baseline threshold.
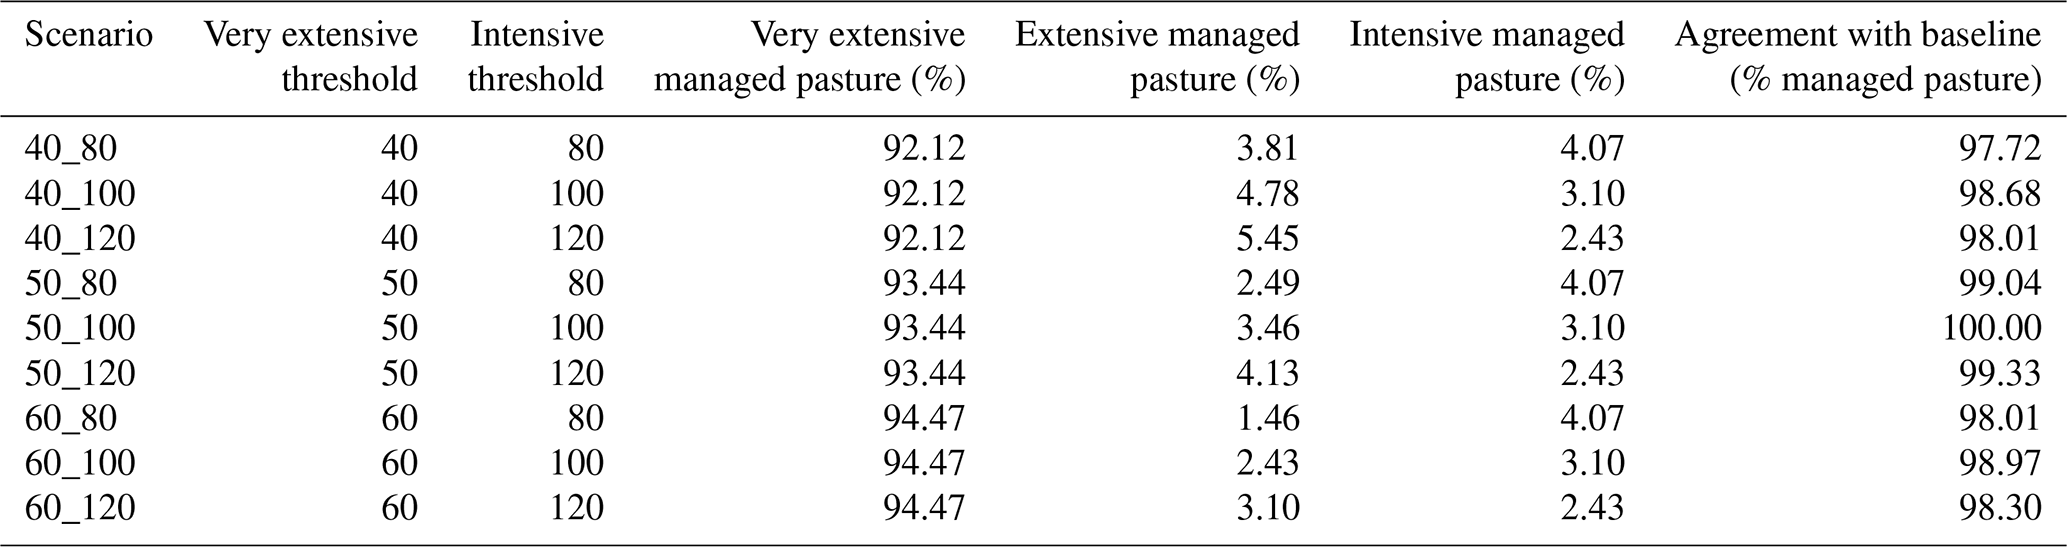
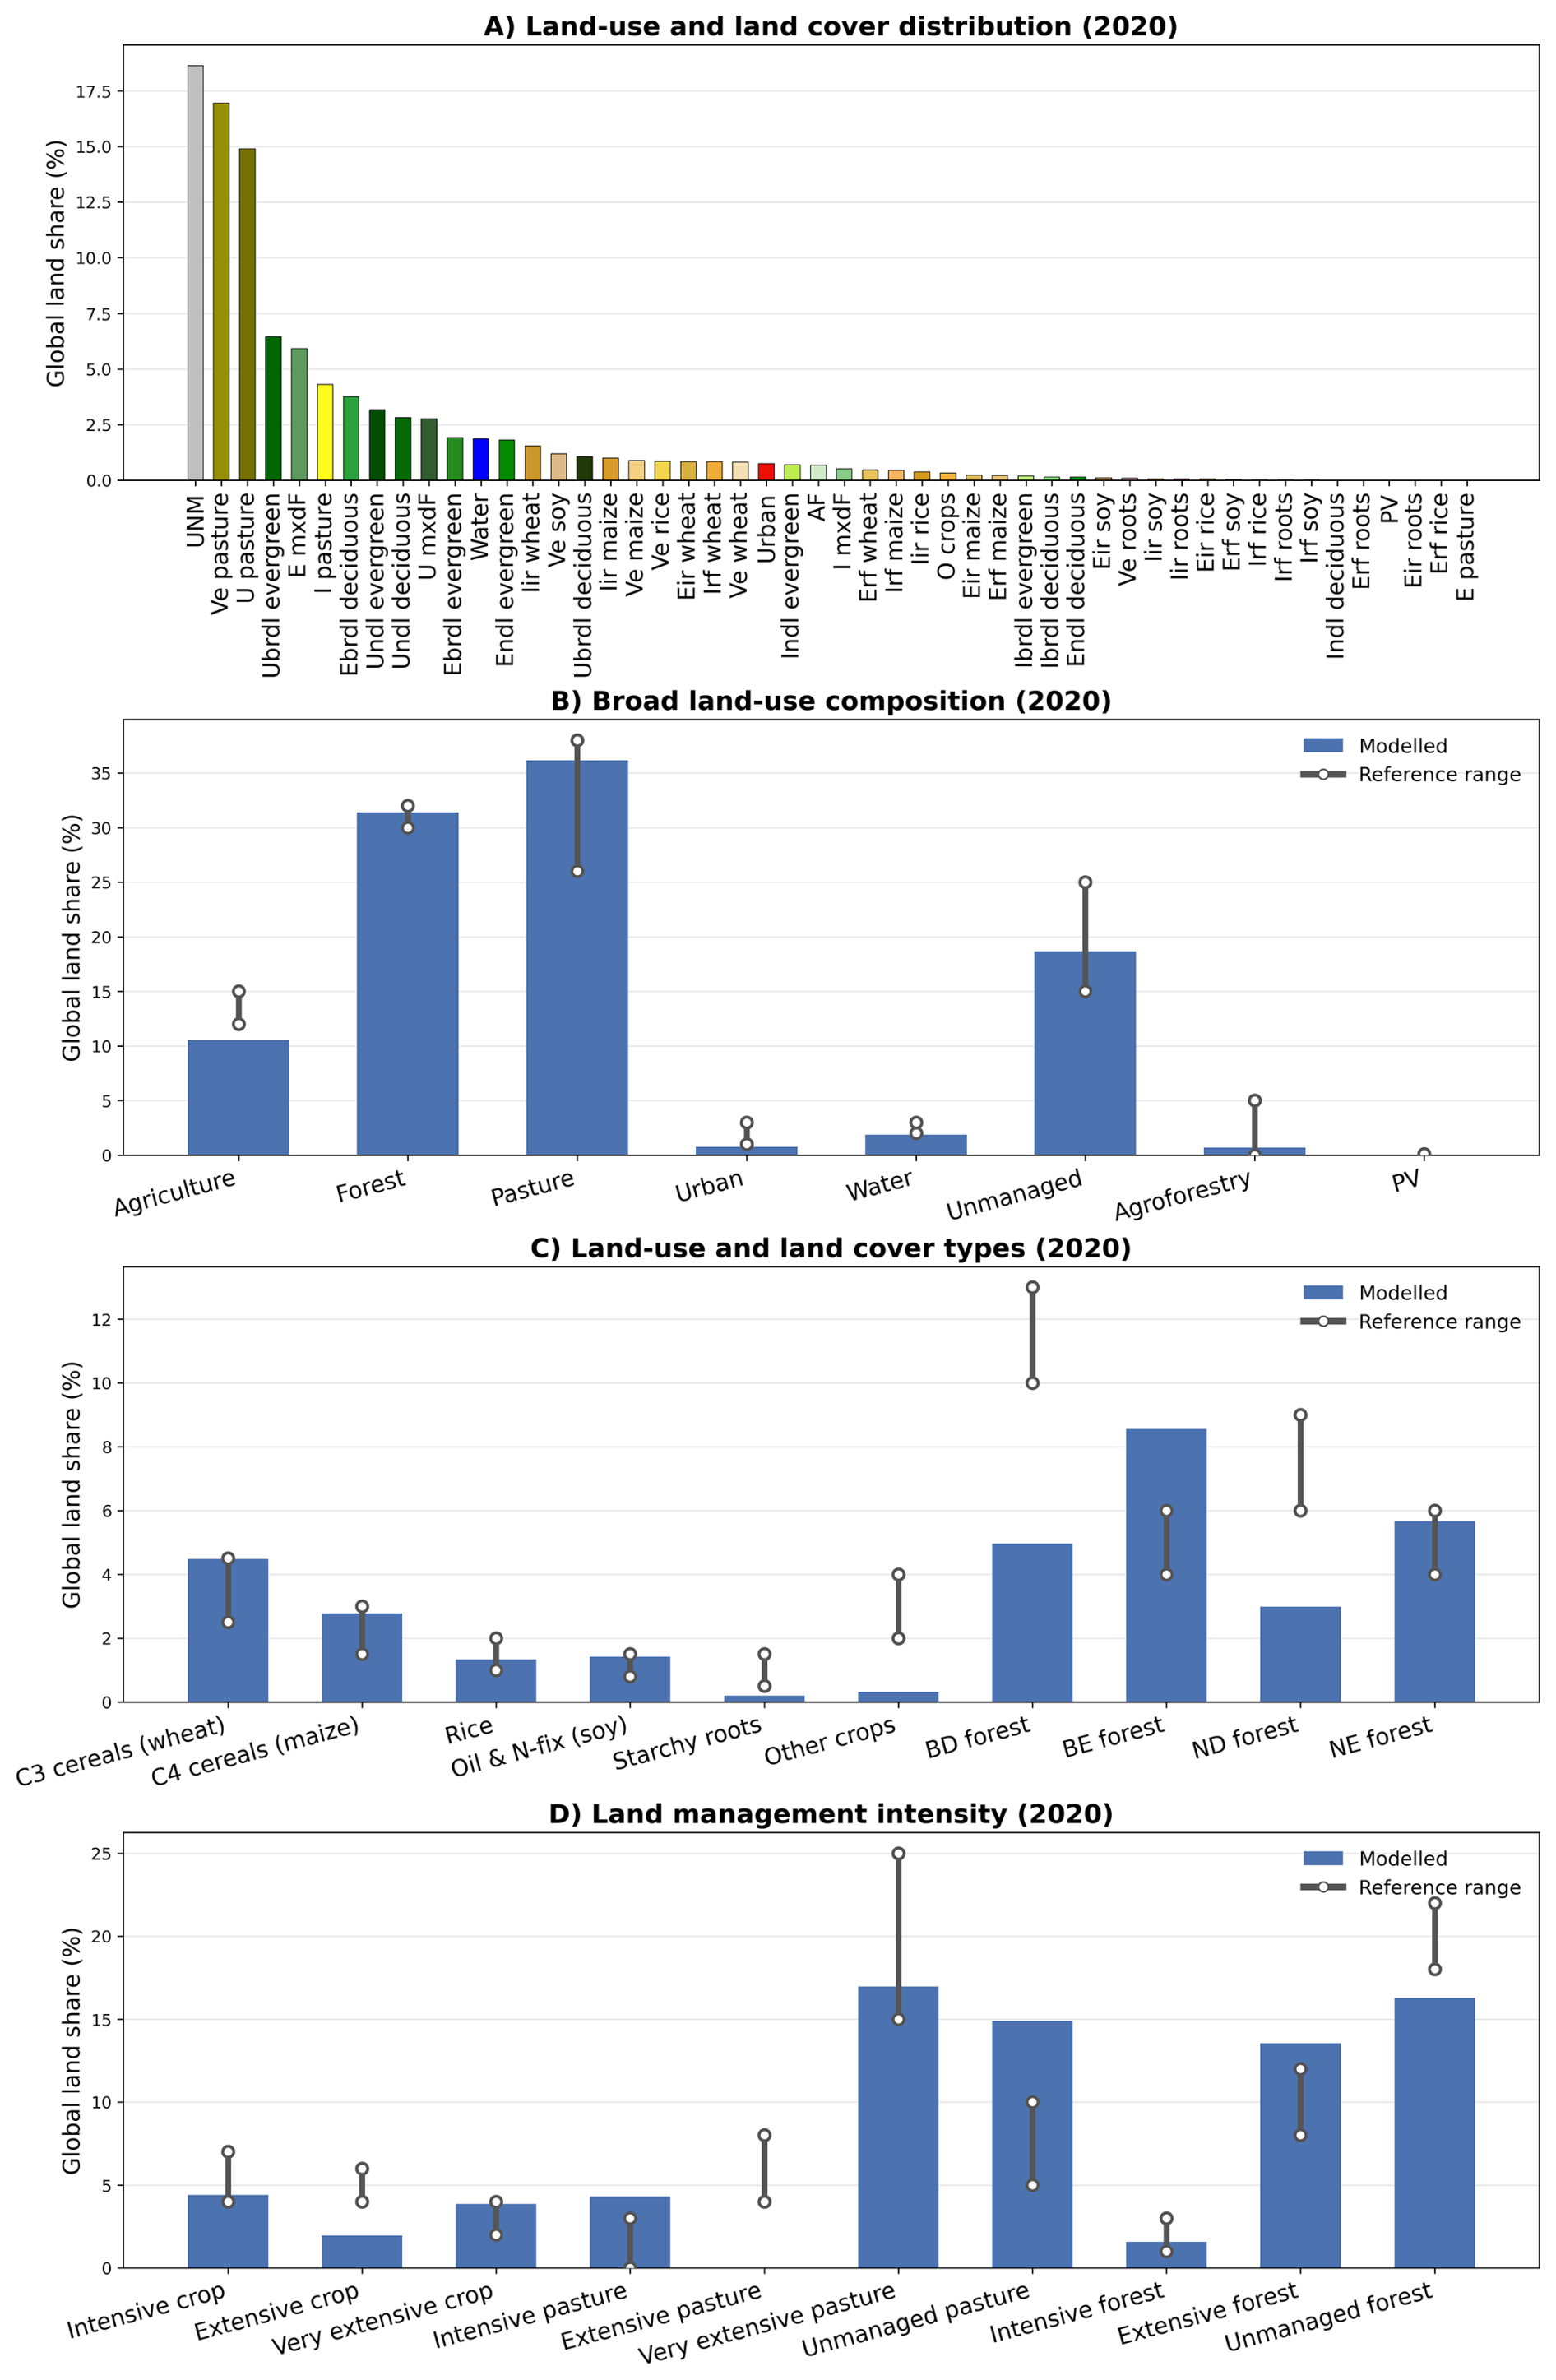
Figure A5(a) Land-use and land cover distribution and a comparison of modelled and reference global land-use shares. Land-use distribution by (b) groups, (c) types, and (d) management intensities. Land-use groups are the broader land-use and cover sectors, Land-use types are finer land-use types, while Land-use management intensity is further classification of the land-use types in various management intensities. Blue bars denote modelled estimates from this study, and red bars indicate reference data.
Table A3Global land-use, land cover, and management intensity comparison. Modelled values are derived from this study (2020 baseline). Reference values are derived from global datasets and various studies, where sources do not explicitly report global percentages, values are interpreted following the published methods.
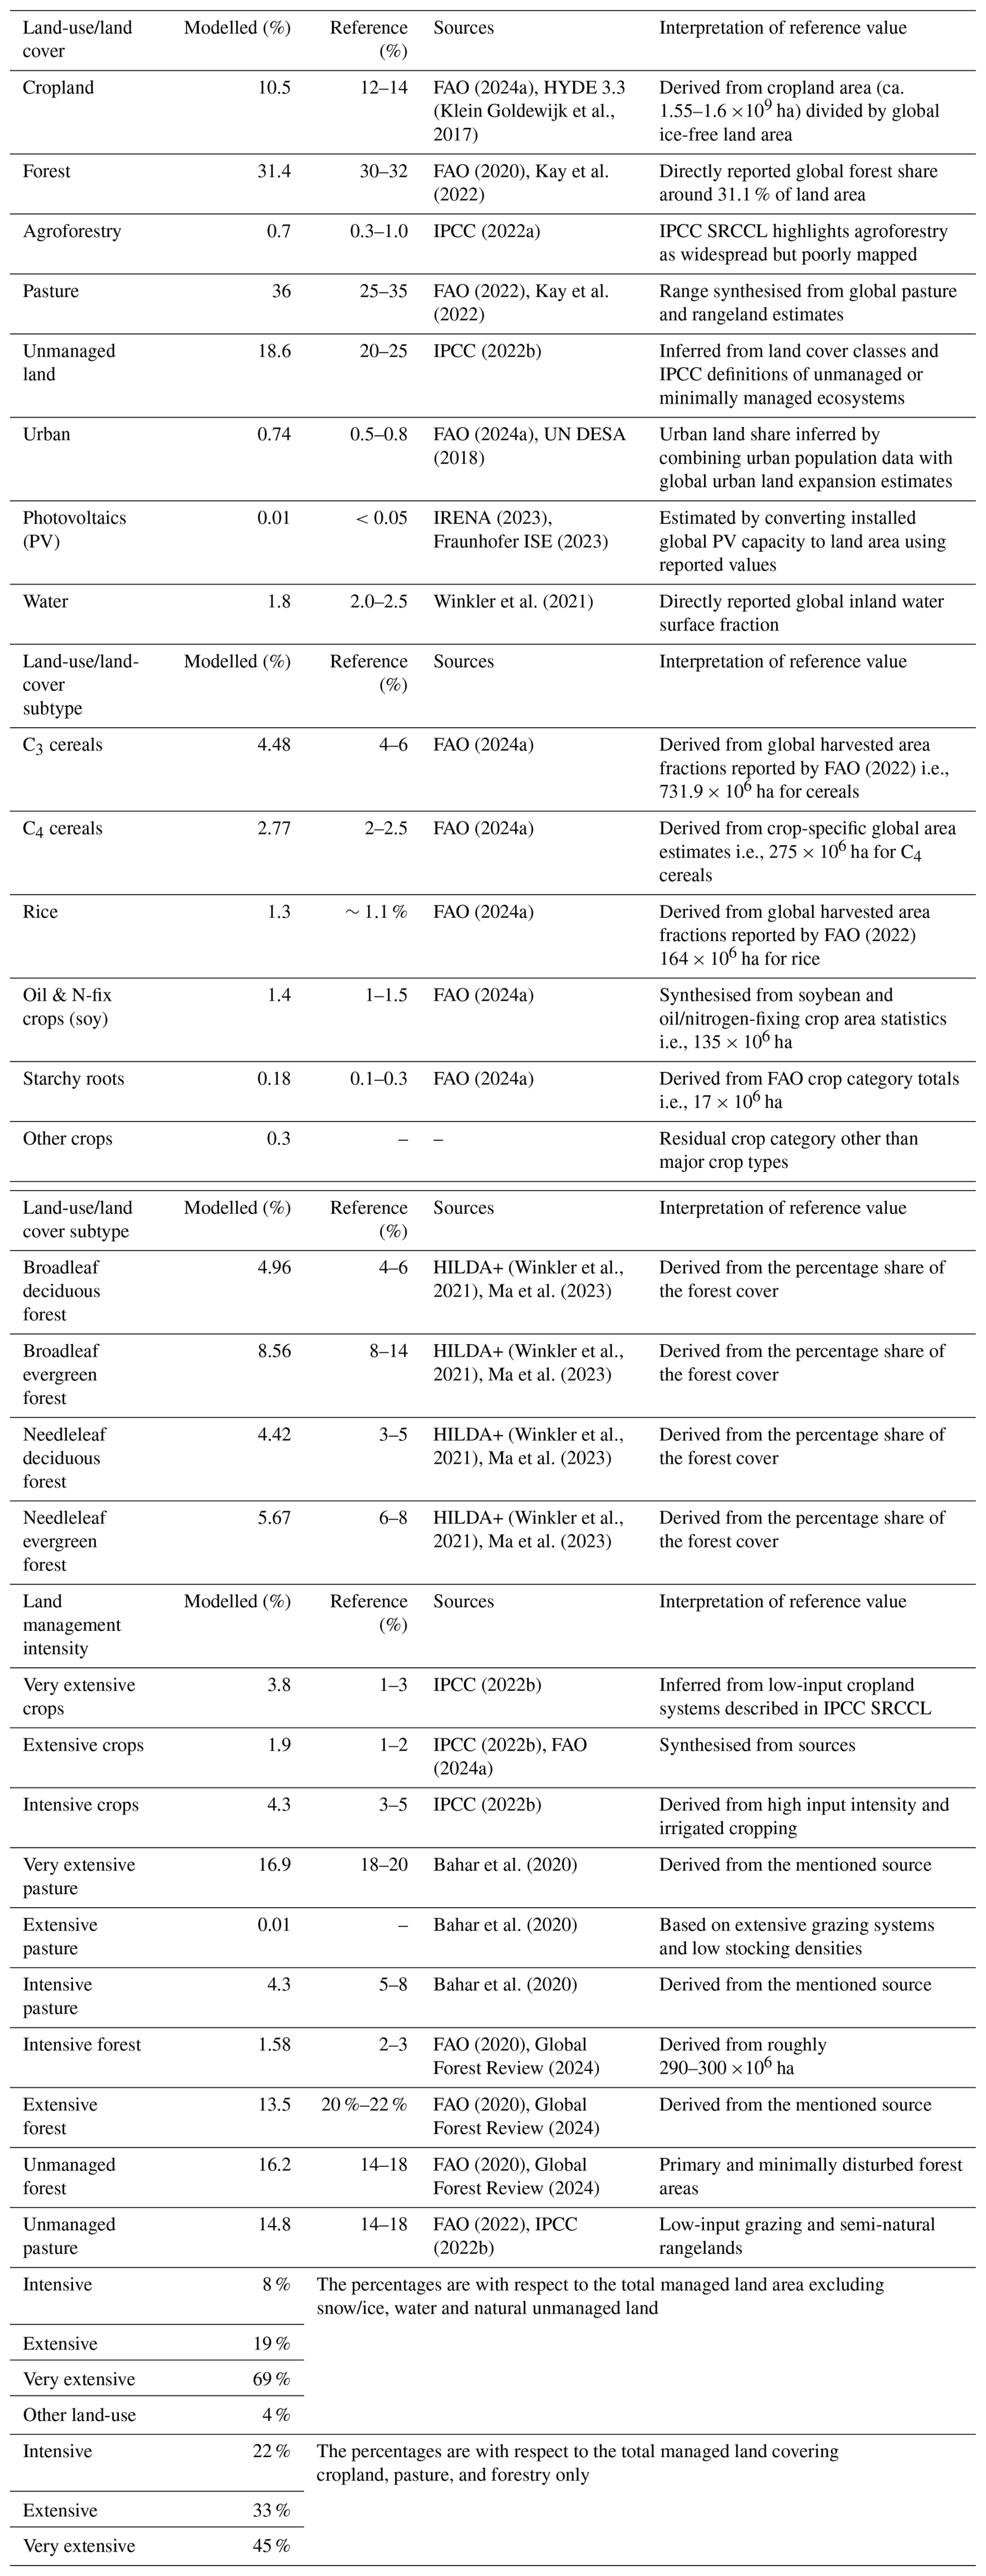
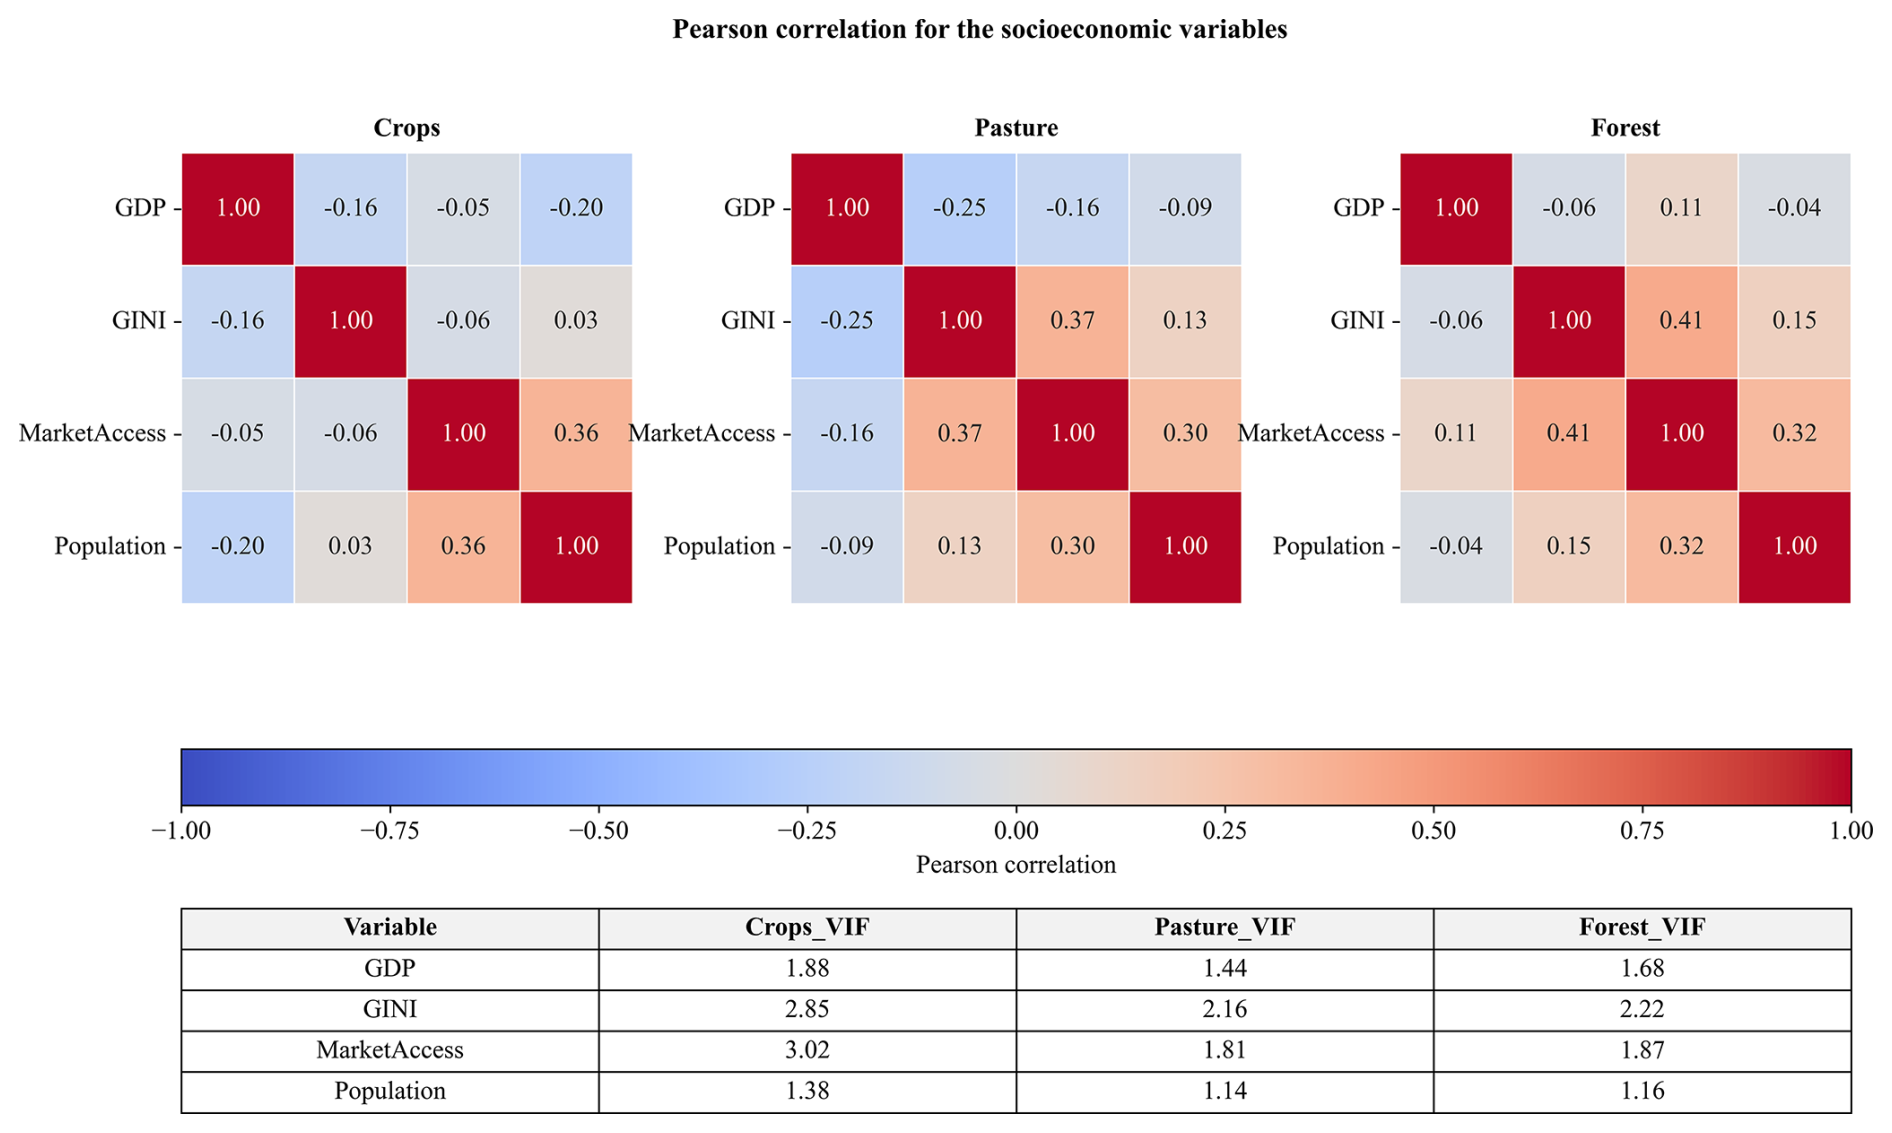
Figure A6Multicollinearity check using pair-wise regression analysis and the variance inflation factor (VIF) methods for the socioeconomic variables.
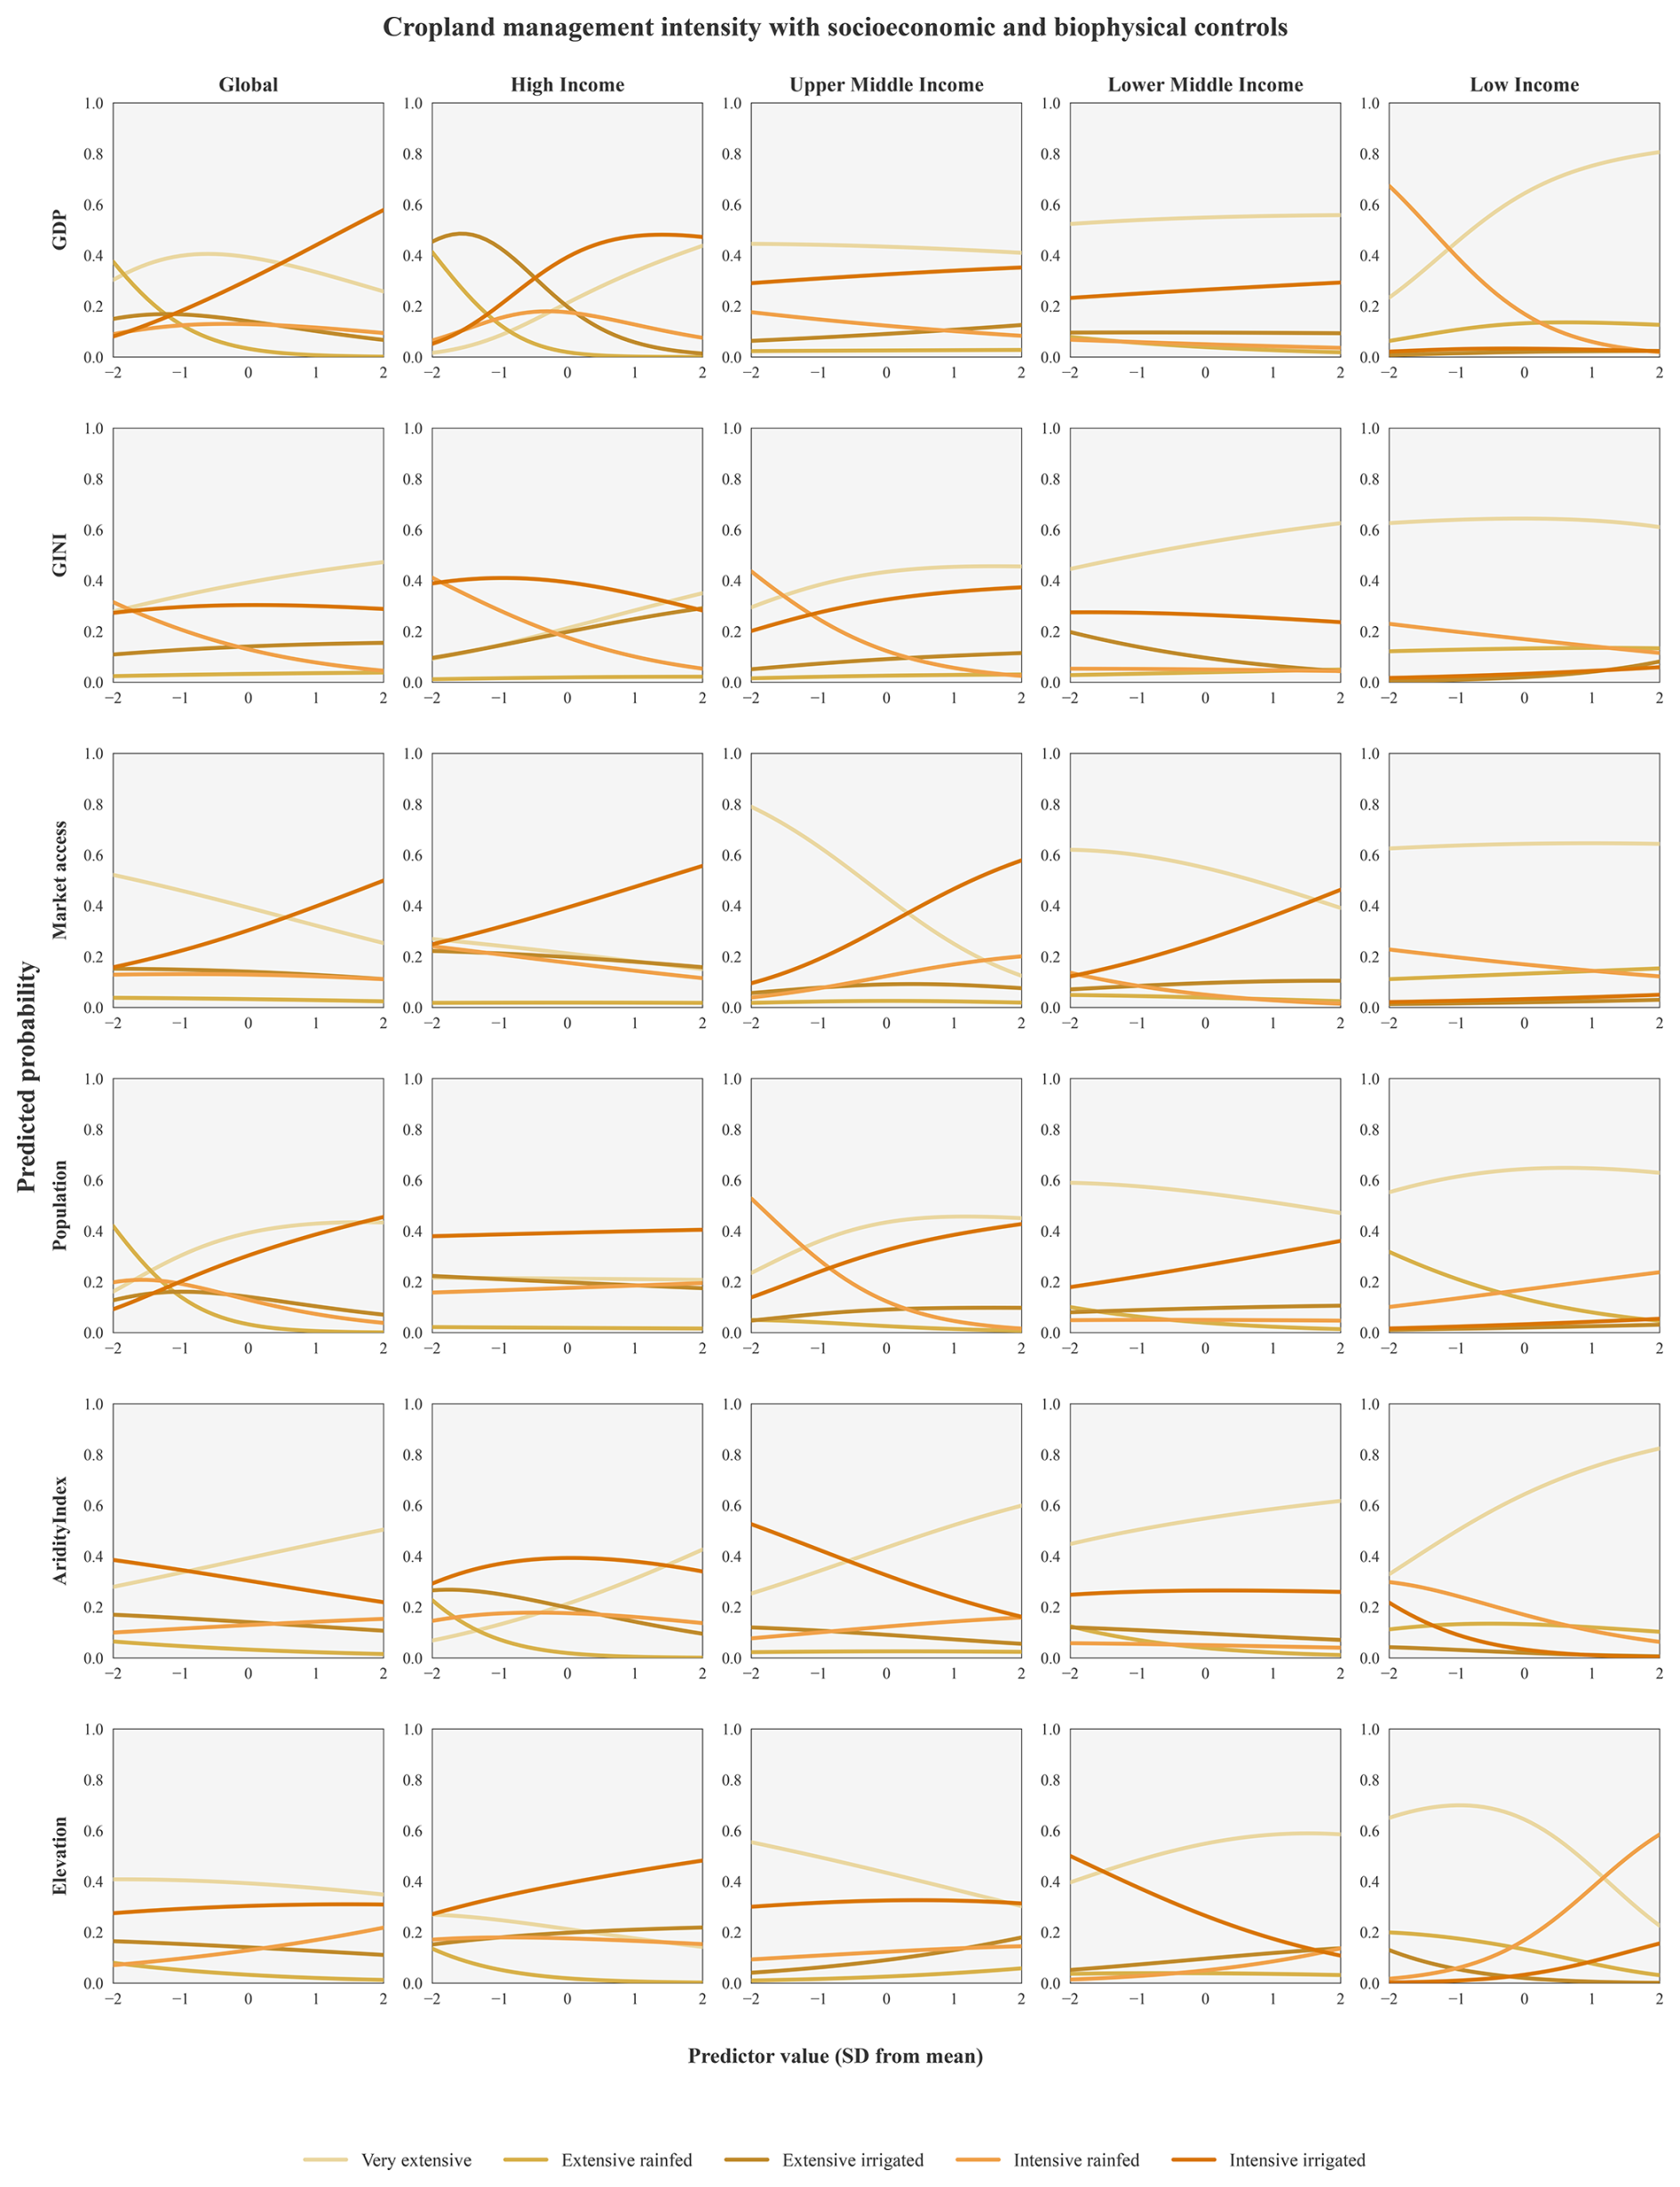
Figure A7Predicted relationships between crop management intensity and socioeconomic drivers across global income groups. The x-axes of each plot show the standardised predictor value (z-score) for various variables (GDP, GINI, market access, and population), and the y-axes indicates the predicted probability of each management intensity (very extensive, extensive, and intensive).
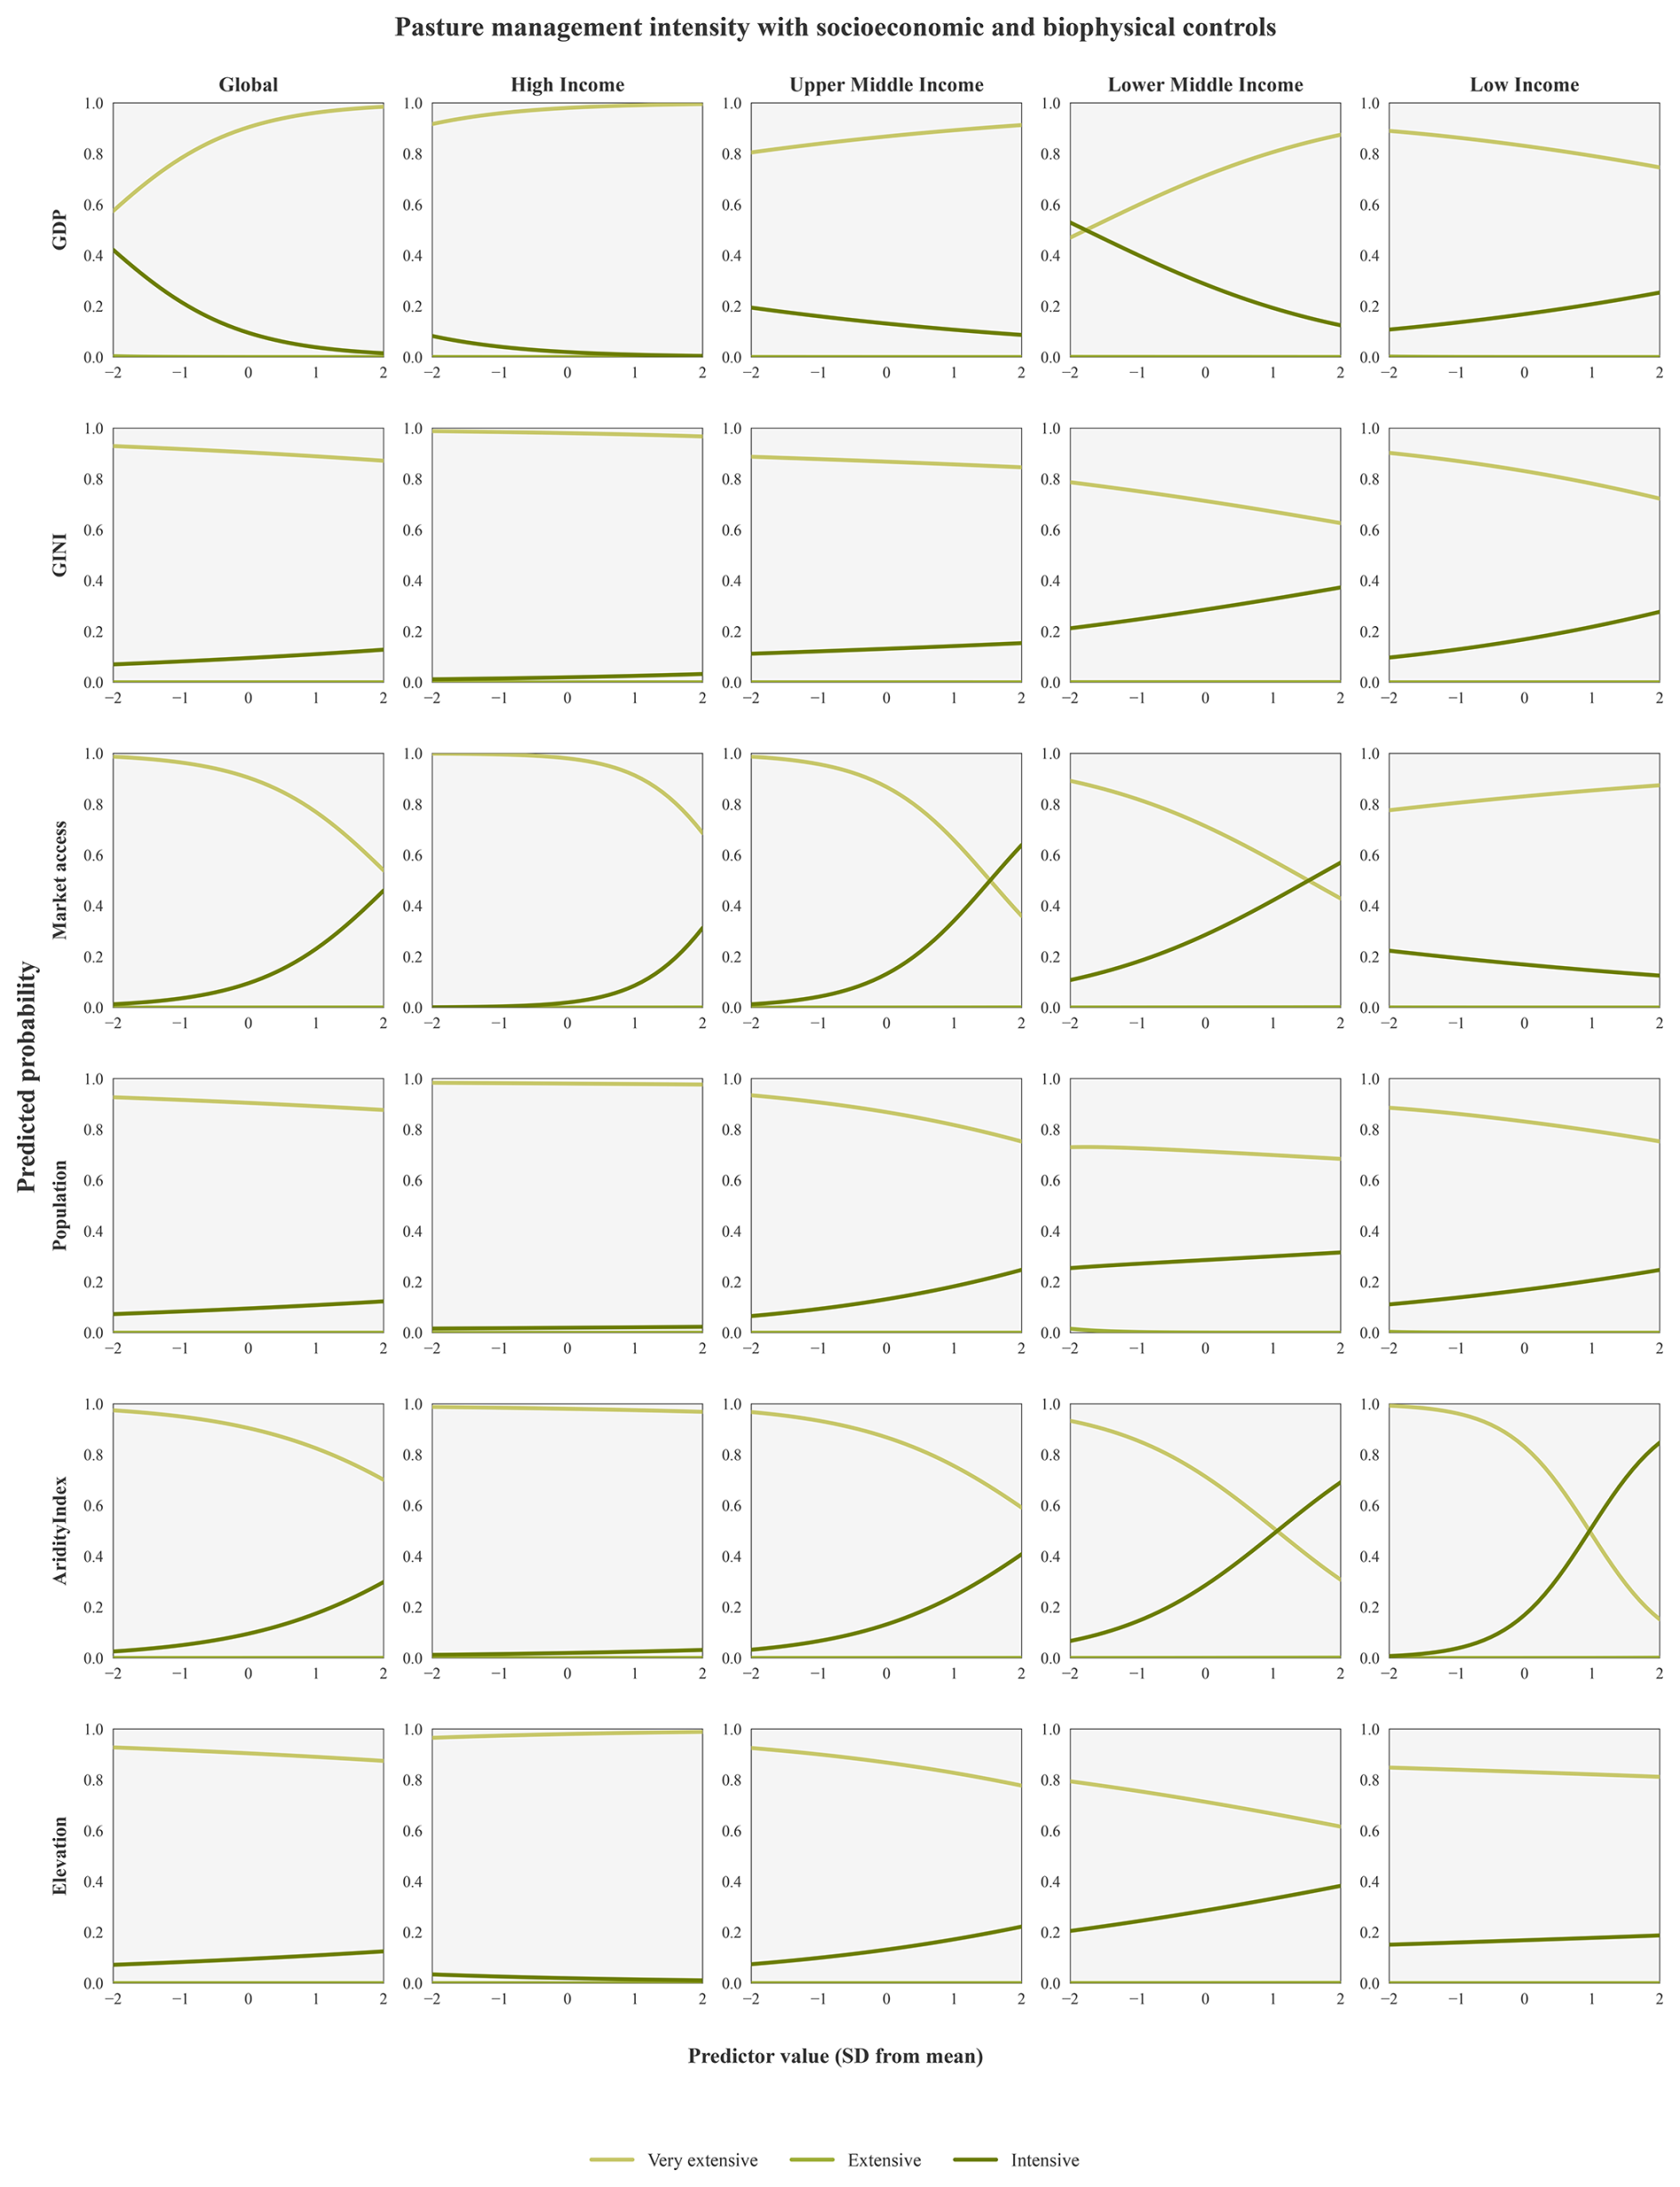
Figure A8Predicted relationships between pasture management intensity and socioeconomic drivers across global income groups. The x-axes of each plot show the standardised predictor value (z-score) for various variables (GDP, GINI, market access, and population), and the y-axes indicates the predicted probability of each management intensity (very extensive, extensive, and intensive).
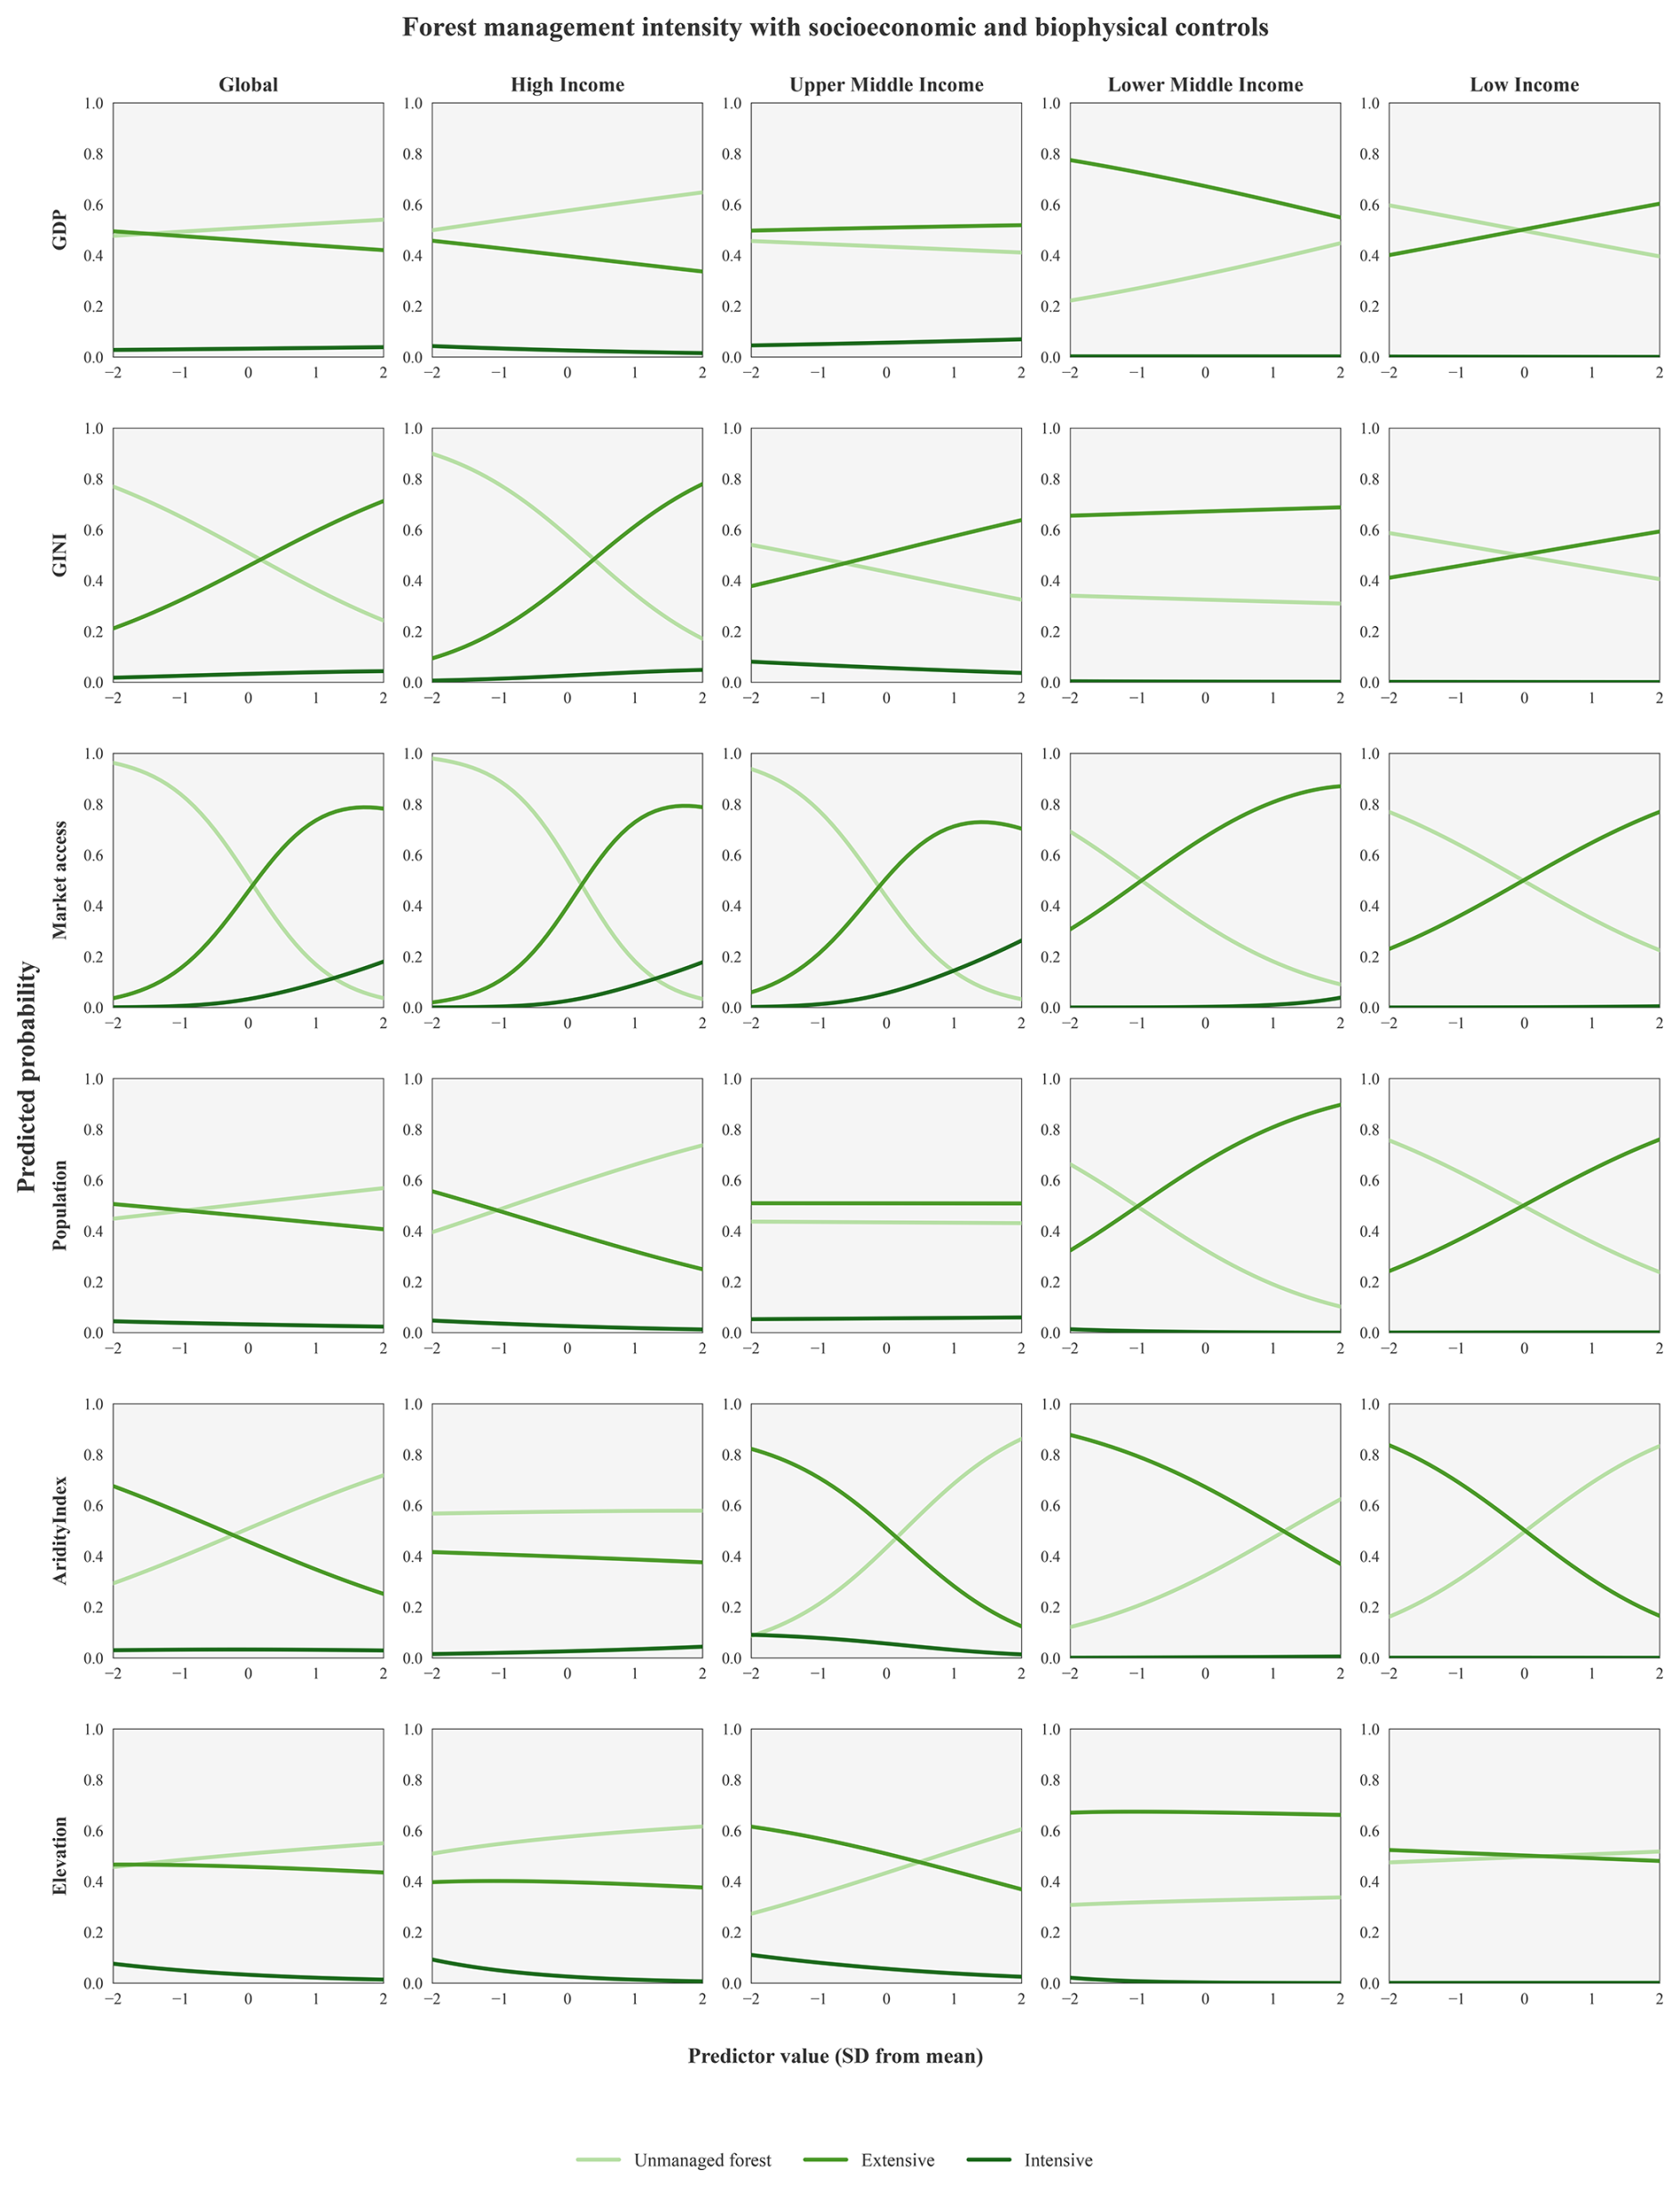
Figure A9Predicted relationships between forest management intensity and socioeconomic drivers across global income groups. The x-axes of each plot show the standardised predictor value (z-score) for various variables (GDP, GINI, market access, and population), and the y-axes indicates the predicted probability of each management intensity (very extensive, extensive, and intensive).
Table A4Multinomial logistic regression. Multinomial logistic regression results showing the association between socioeconomic variables and land-use management intensity levels (Extensive, Intensive) for cropland, pasture, and forest land-use types. Coefficients reported are alongside 95 % confidence intervals. All models use the very extensive (VExt or unmanaged) category as the reference level. The asterisks (*) indicate significance levels: *** p<0.001.
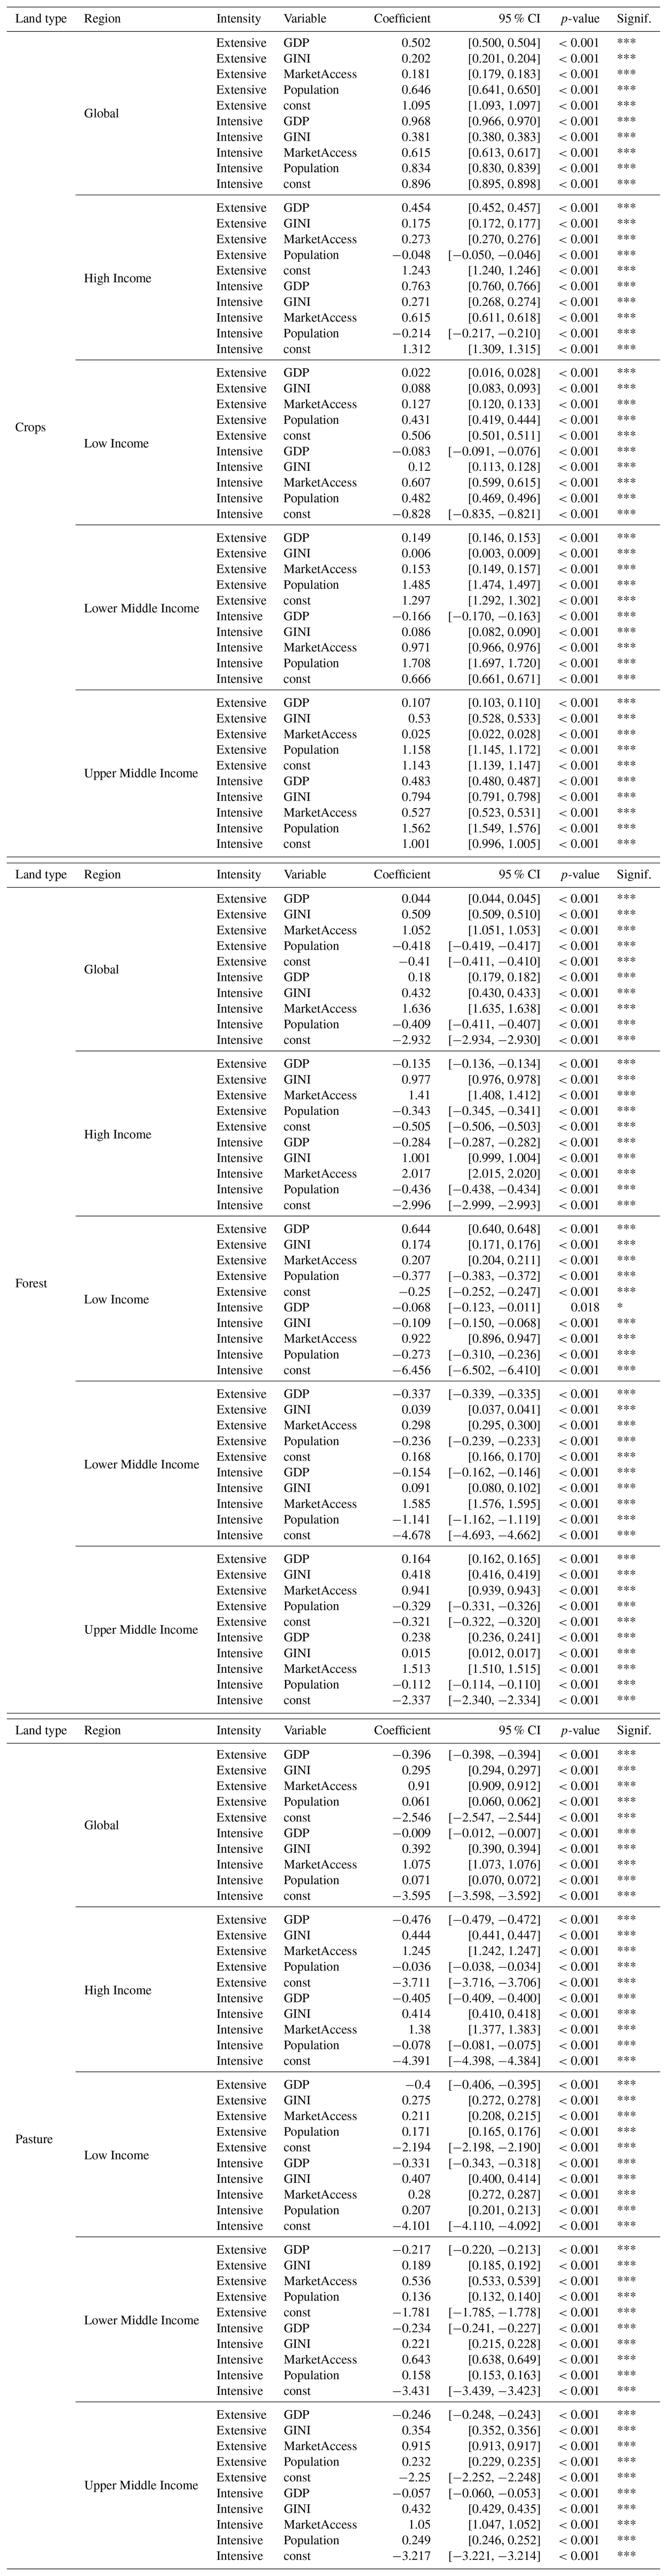
Table A5Summary of marginal-effect relationships between socioeconomic/biophysical variables and land management intensity across land-use sectors and income groups.
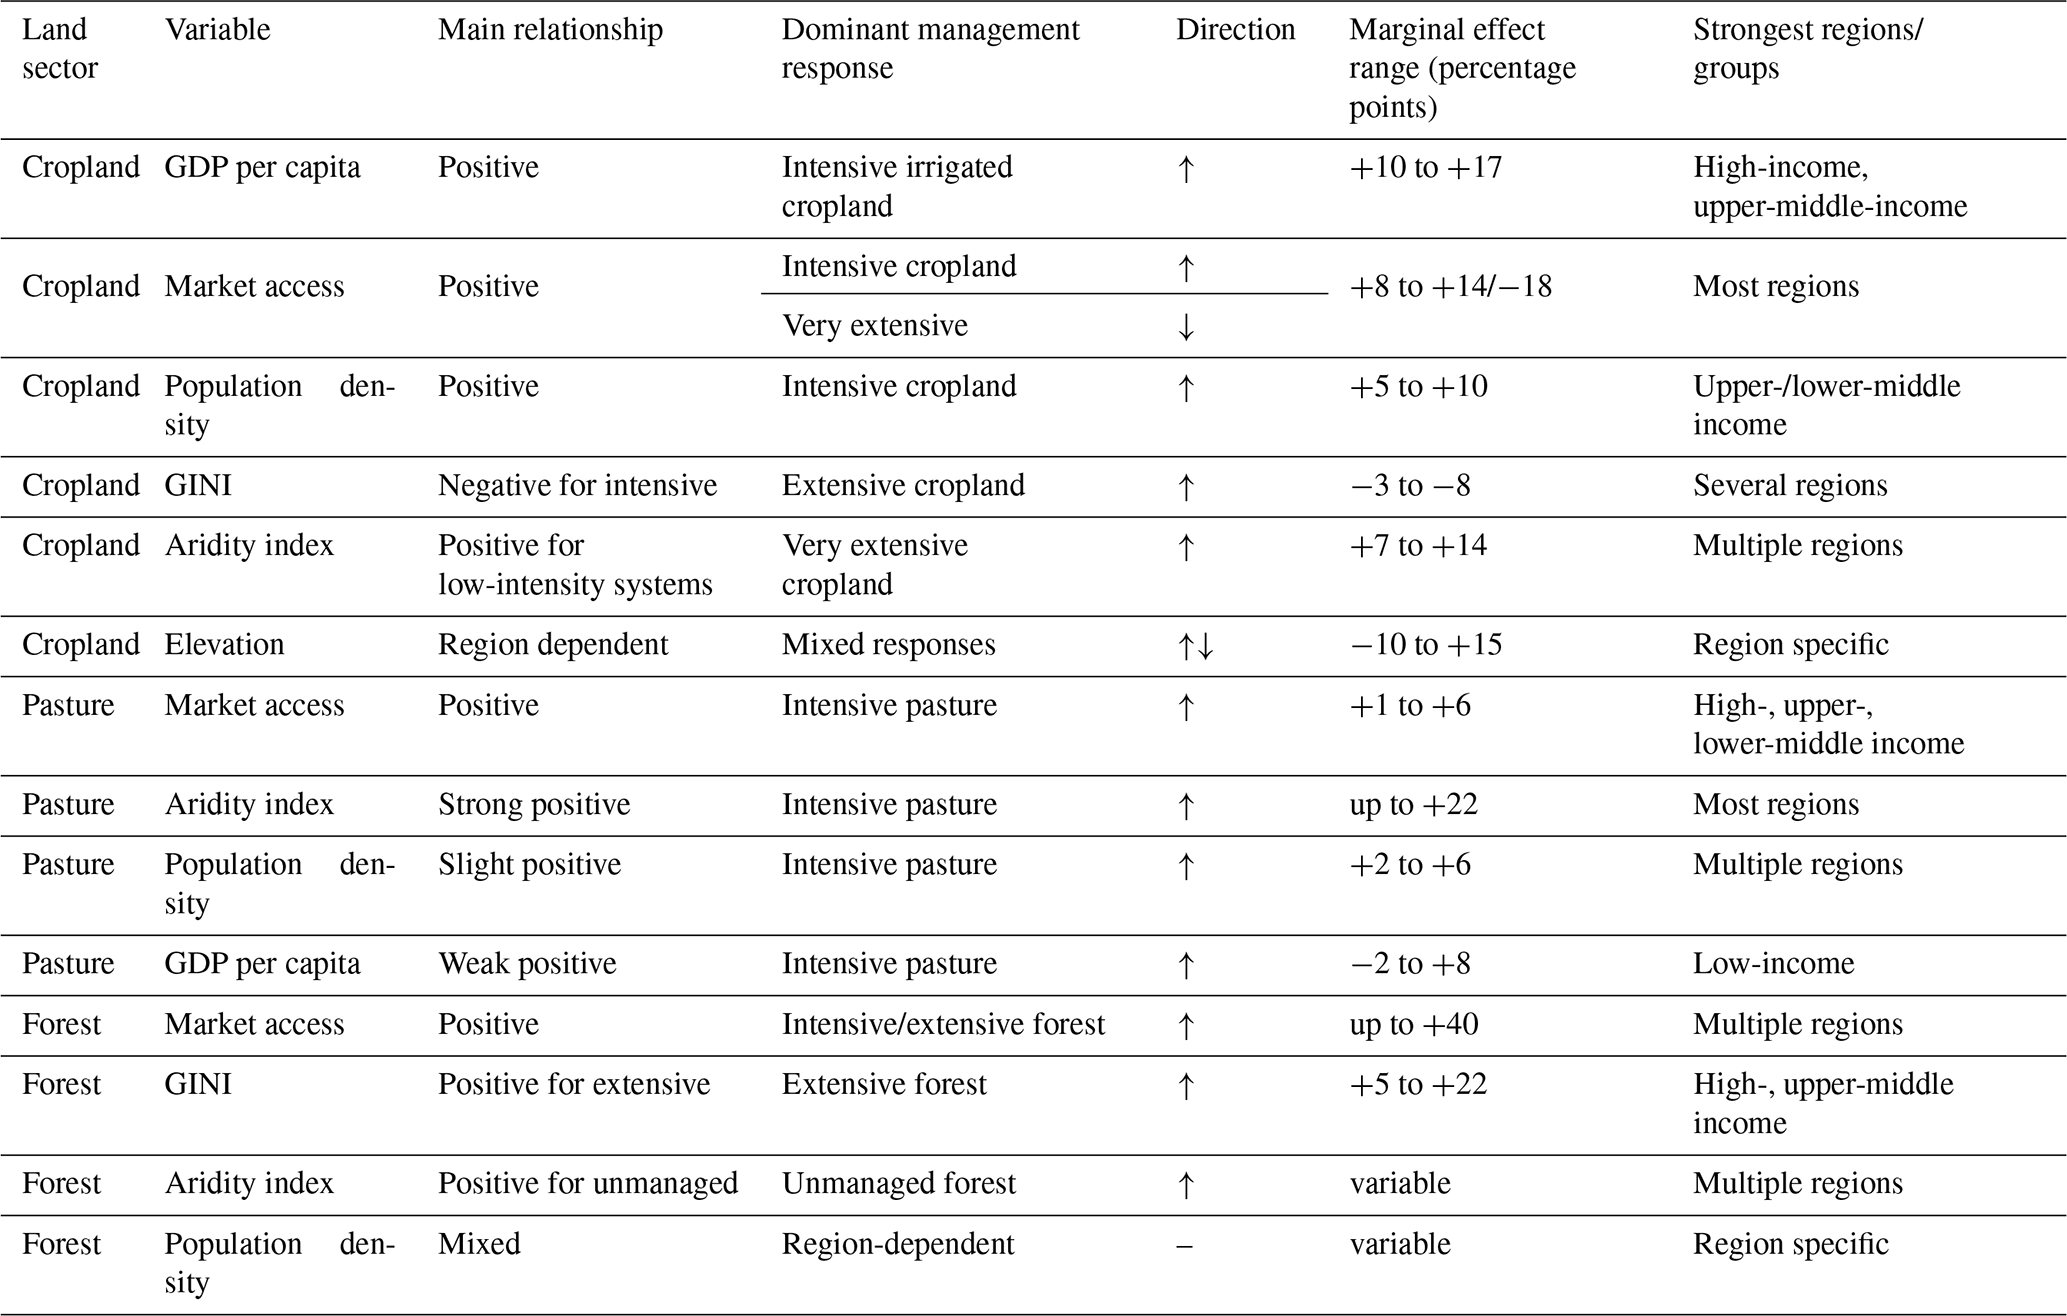
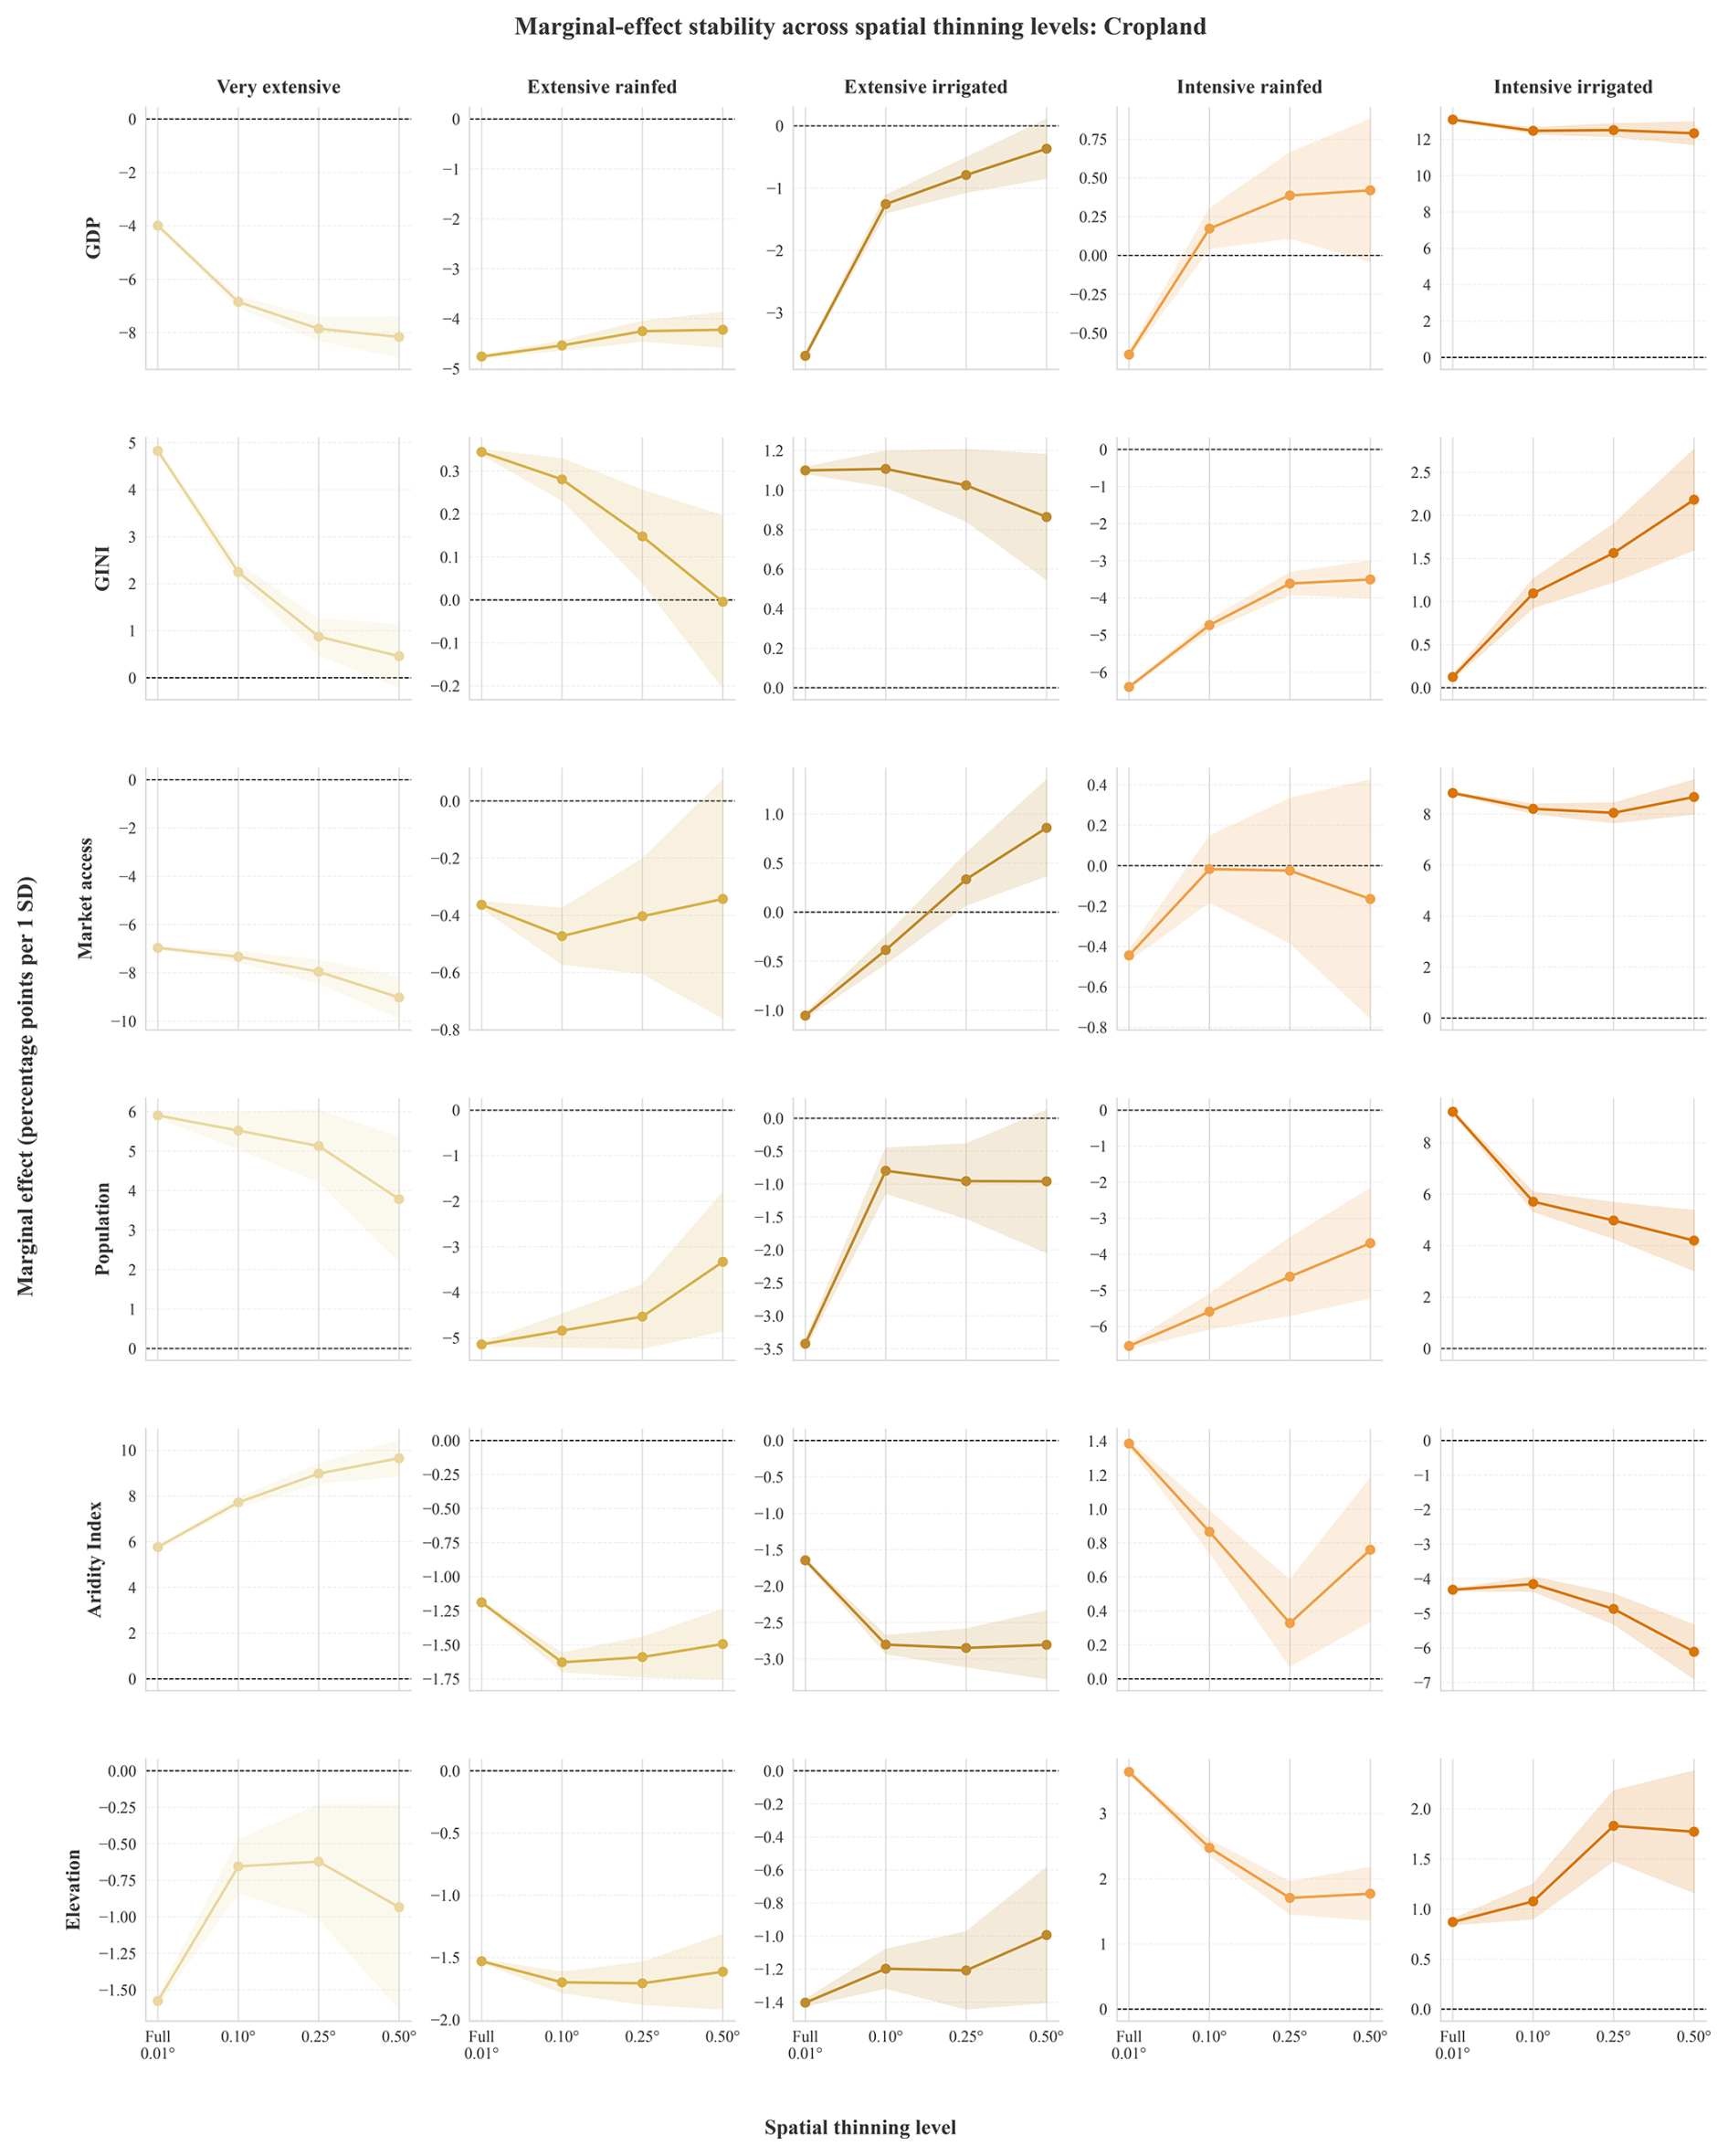
Figure A10Spatial thinning robustness analysis of marginal effects for cropland management intensity classes. Marginal effects were recalculated using progressively coarser spatial samples (0.10, 0.25, and 0.50°). Lines show marginal effects for each thinning level relative to the full-resolution model (0.01°), while shaded areas indicate confidence intervals.
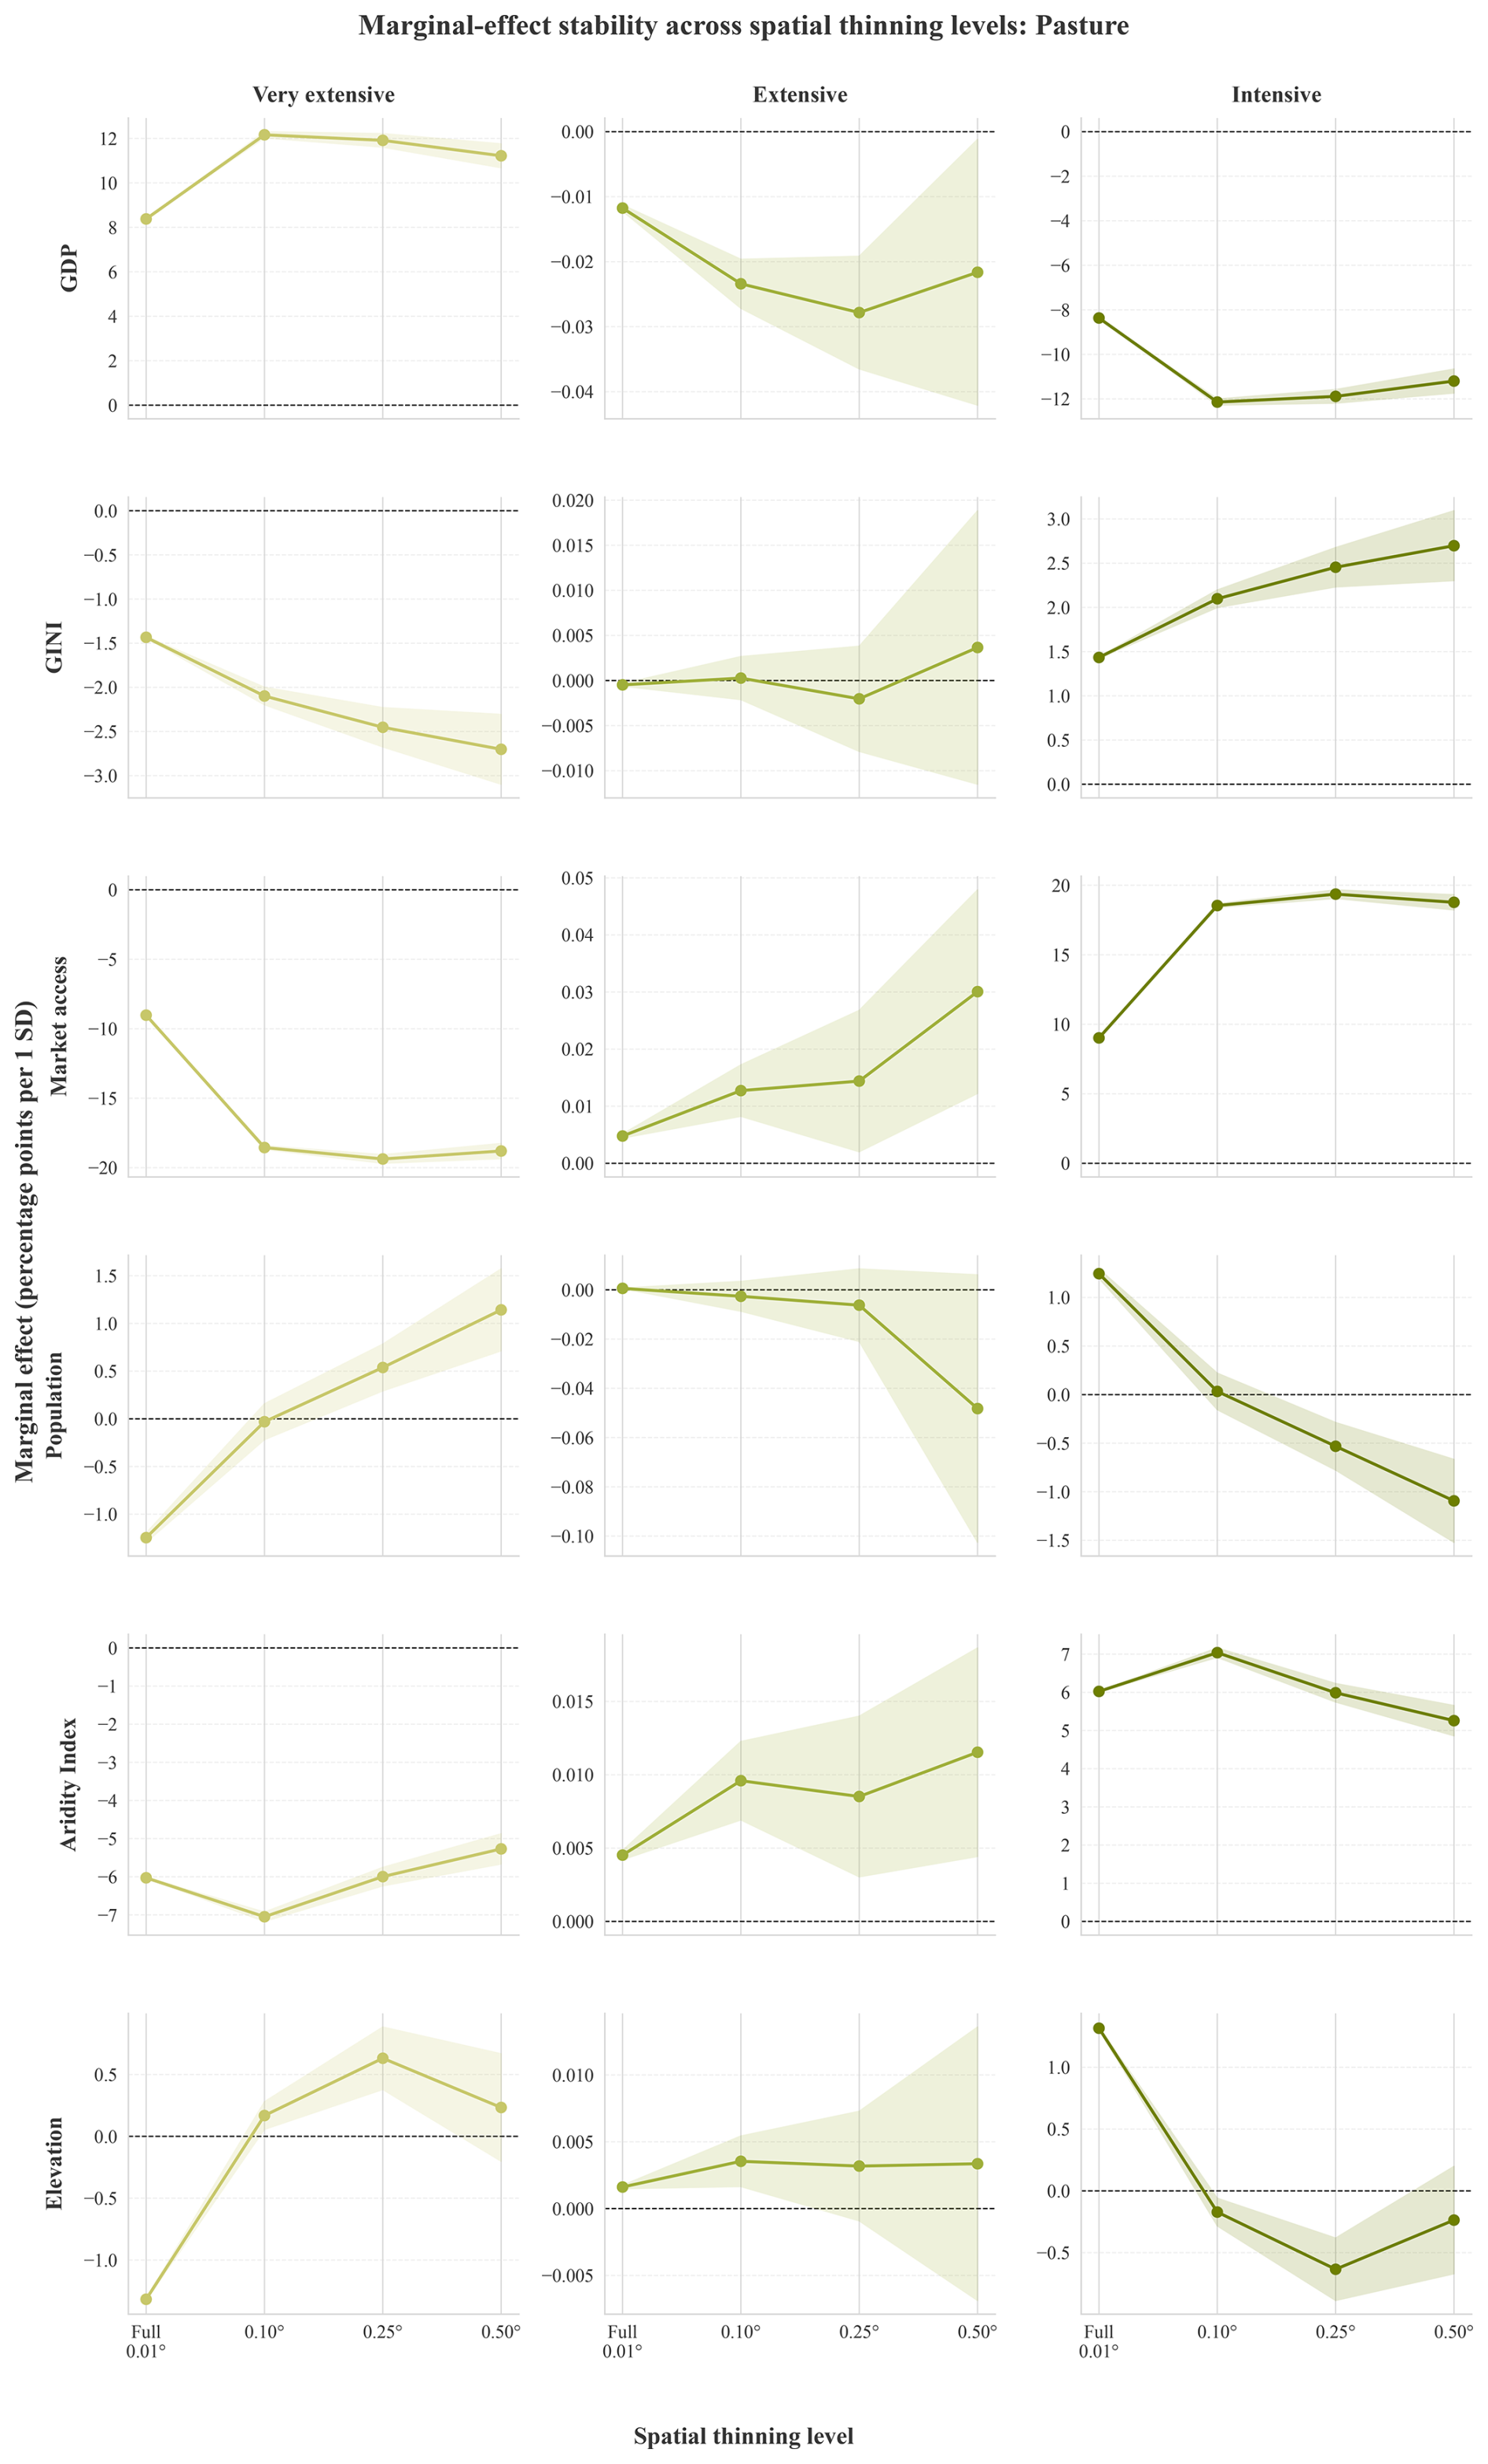
Figure A11Spatial thinning robustness analysis of marginal effects for pasture management intensity classes. Marginal effects were recalculated using progressively coarser spatial samples (0.10, 0.25, and 0.50°). Lines show marginal effects for each thinning level relative to the full-resolution model (0.01°), while shaded areas indicate confidence intervals.
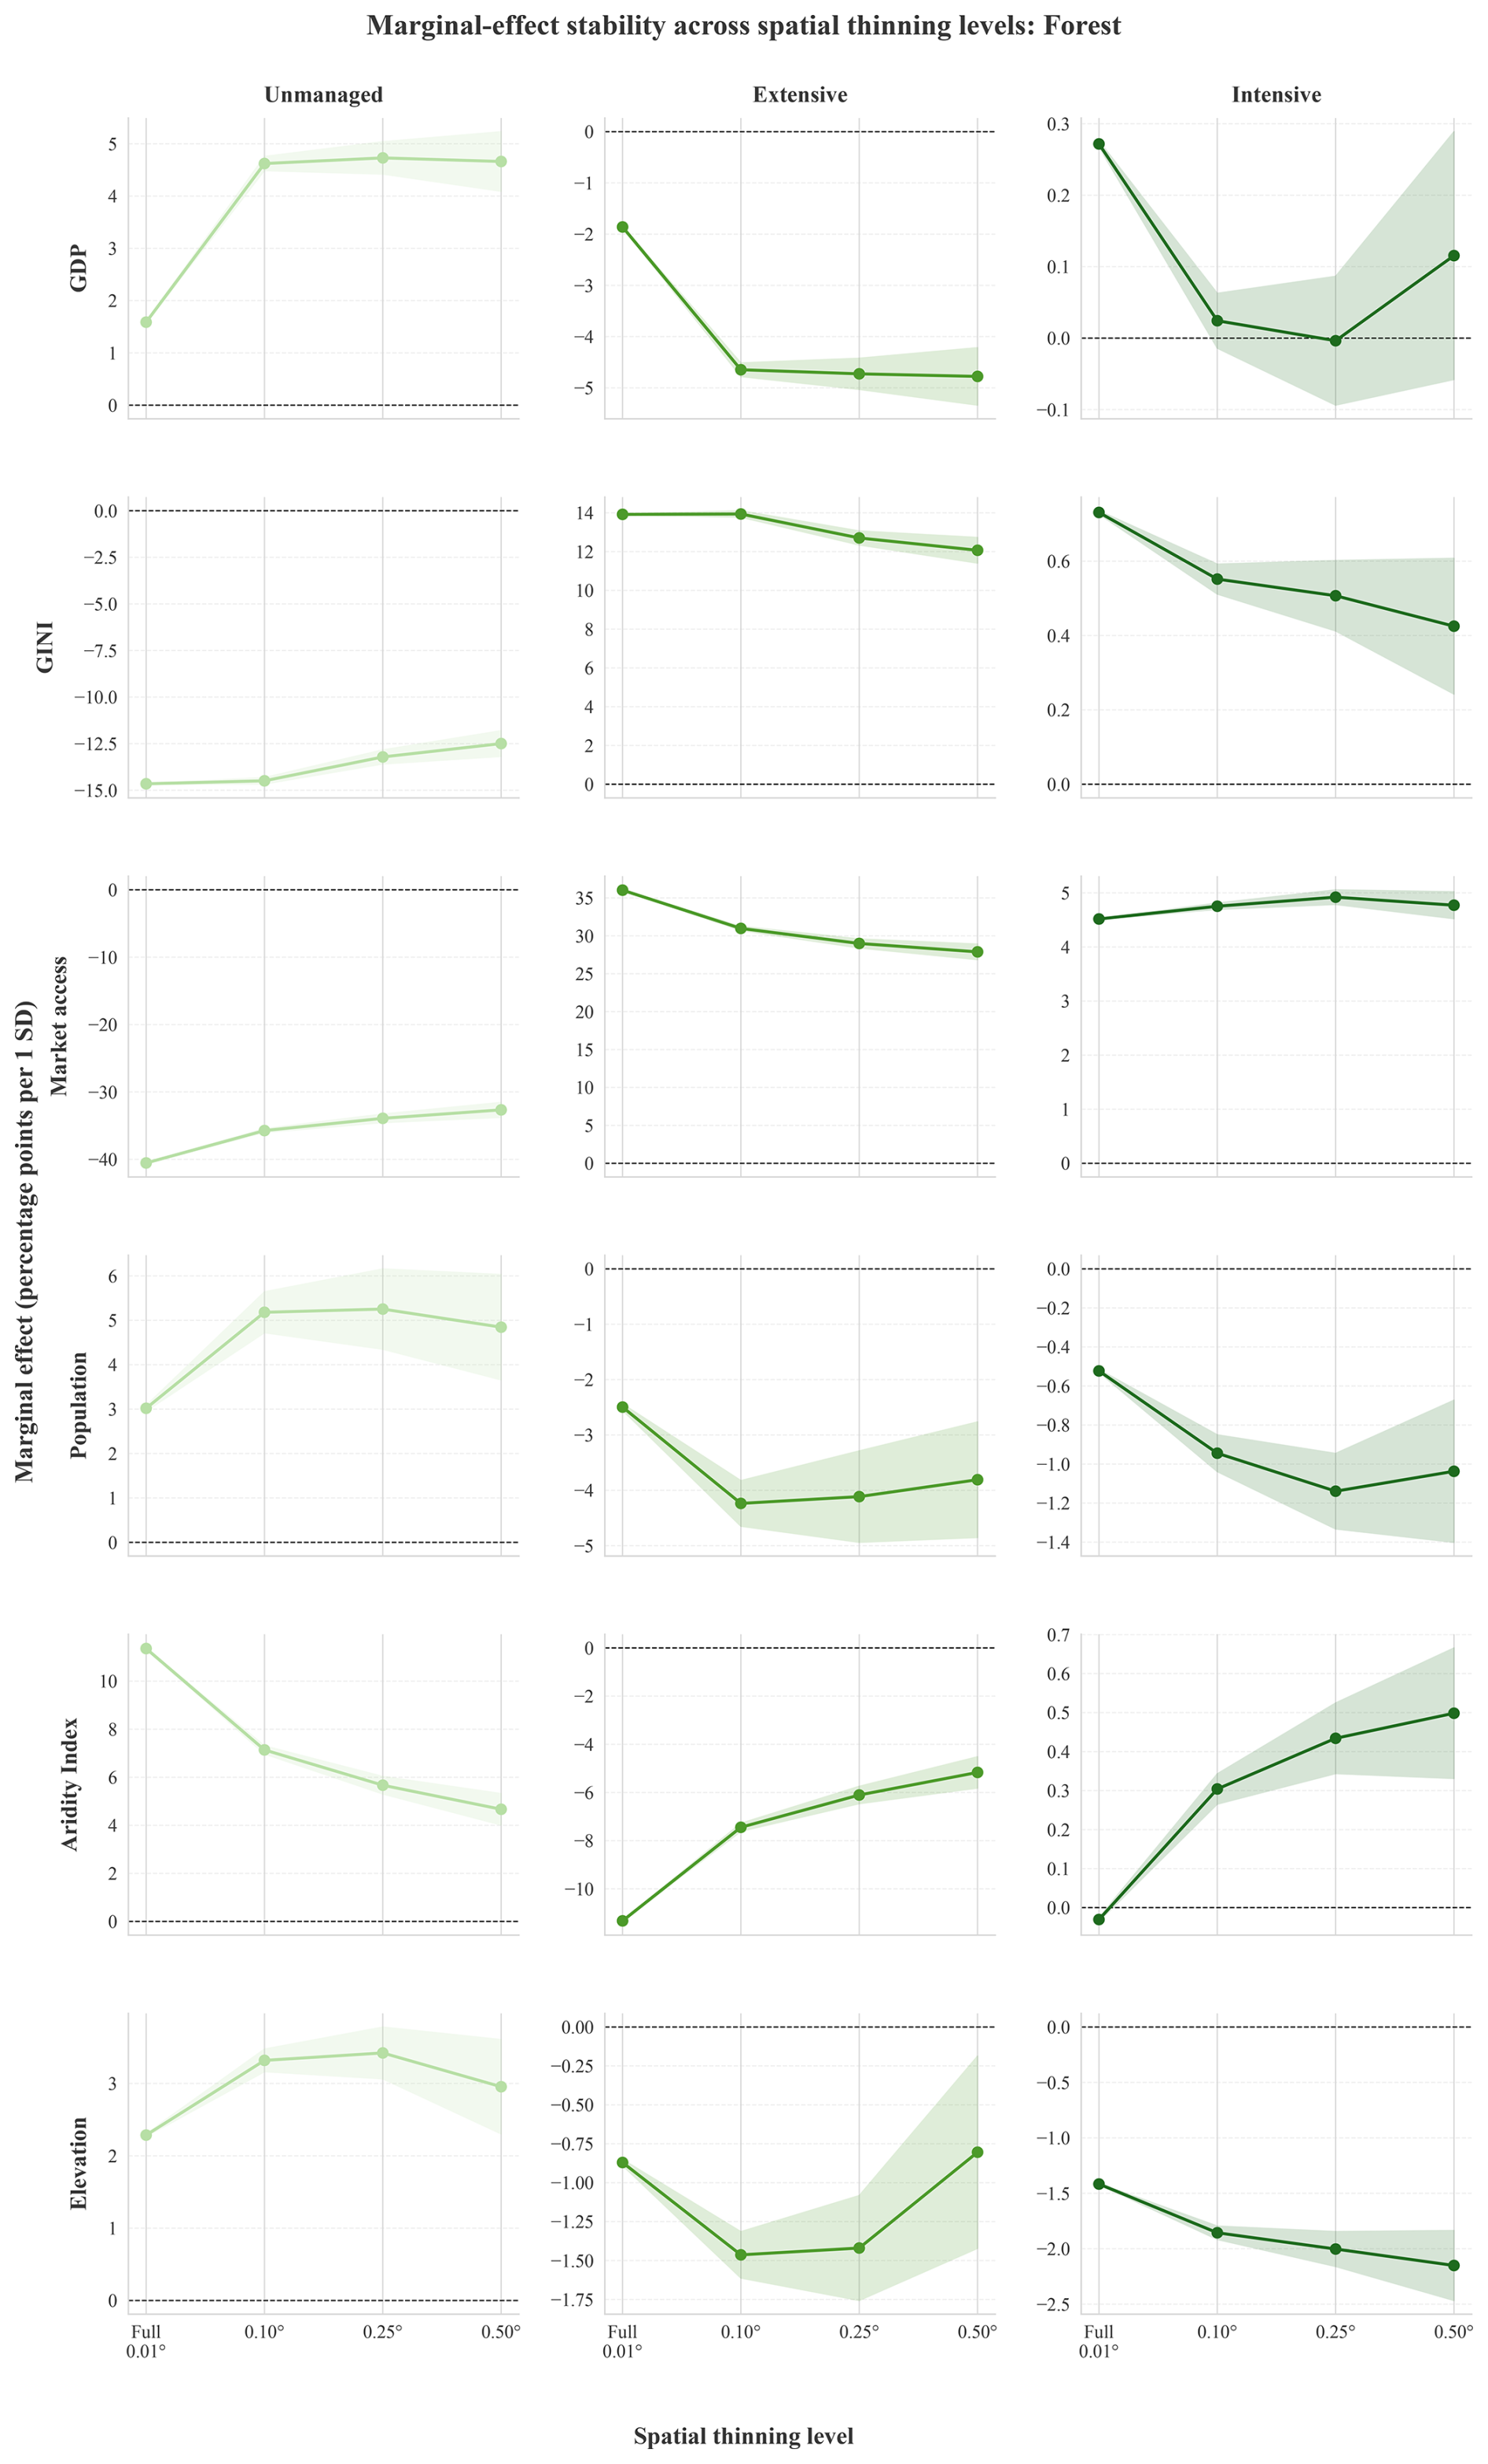
Figure A12Spatial thinning robustness analysis of marginal effects for cropland management intensity classes. Marginal effects were recalculated using progressively coarser spatial samples (0.10, 0.25, and 0.50°). Lines show marginal effects for each thinning level relative to the full-resolution model (0.01°), while shaded areas indicate confidence intervals.
Table A6Spatial thinning based robustness check for various coarser spatial samples such as 0.10, 0.25, and 0.50°.
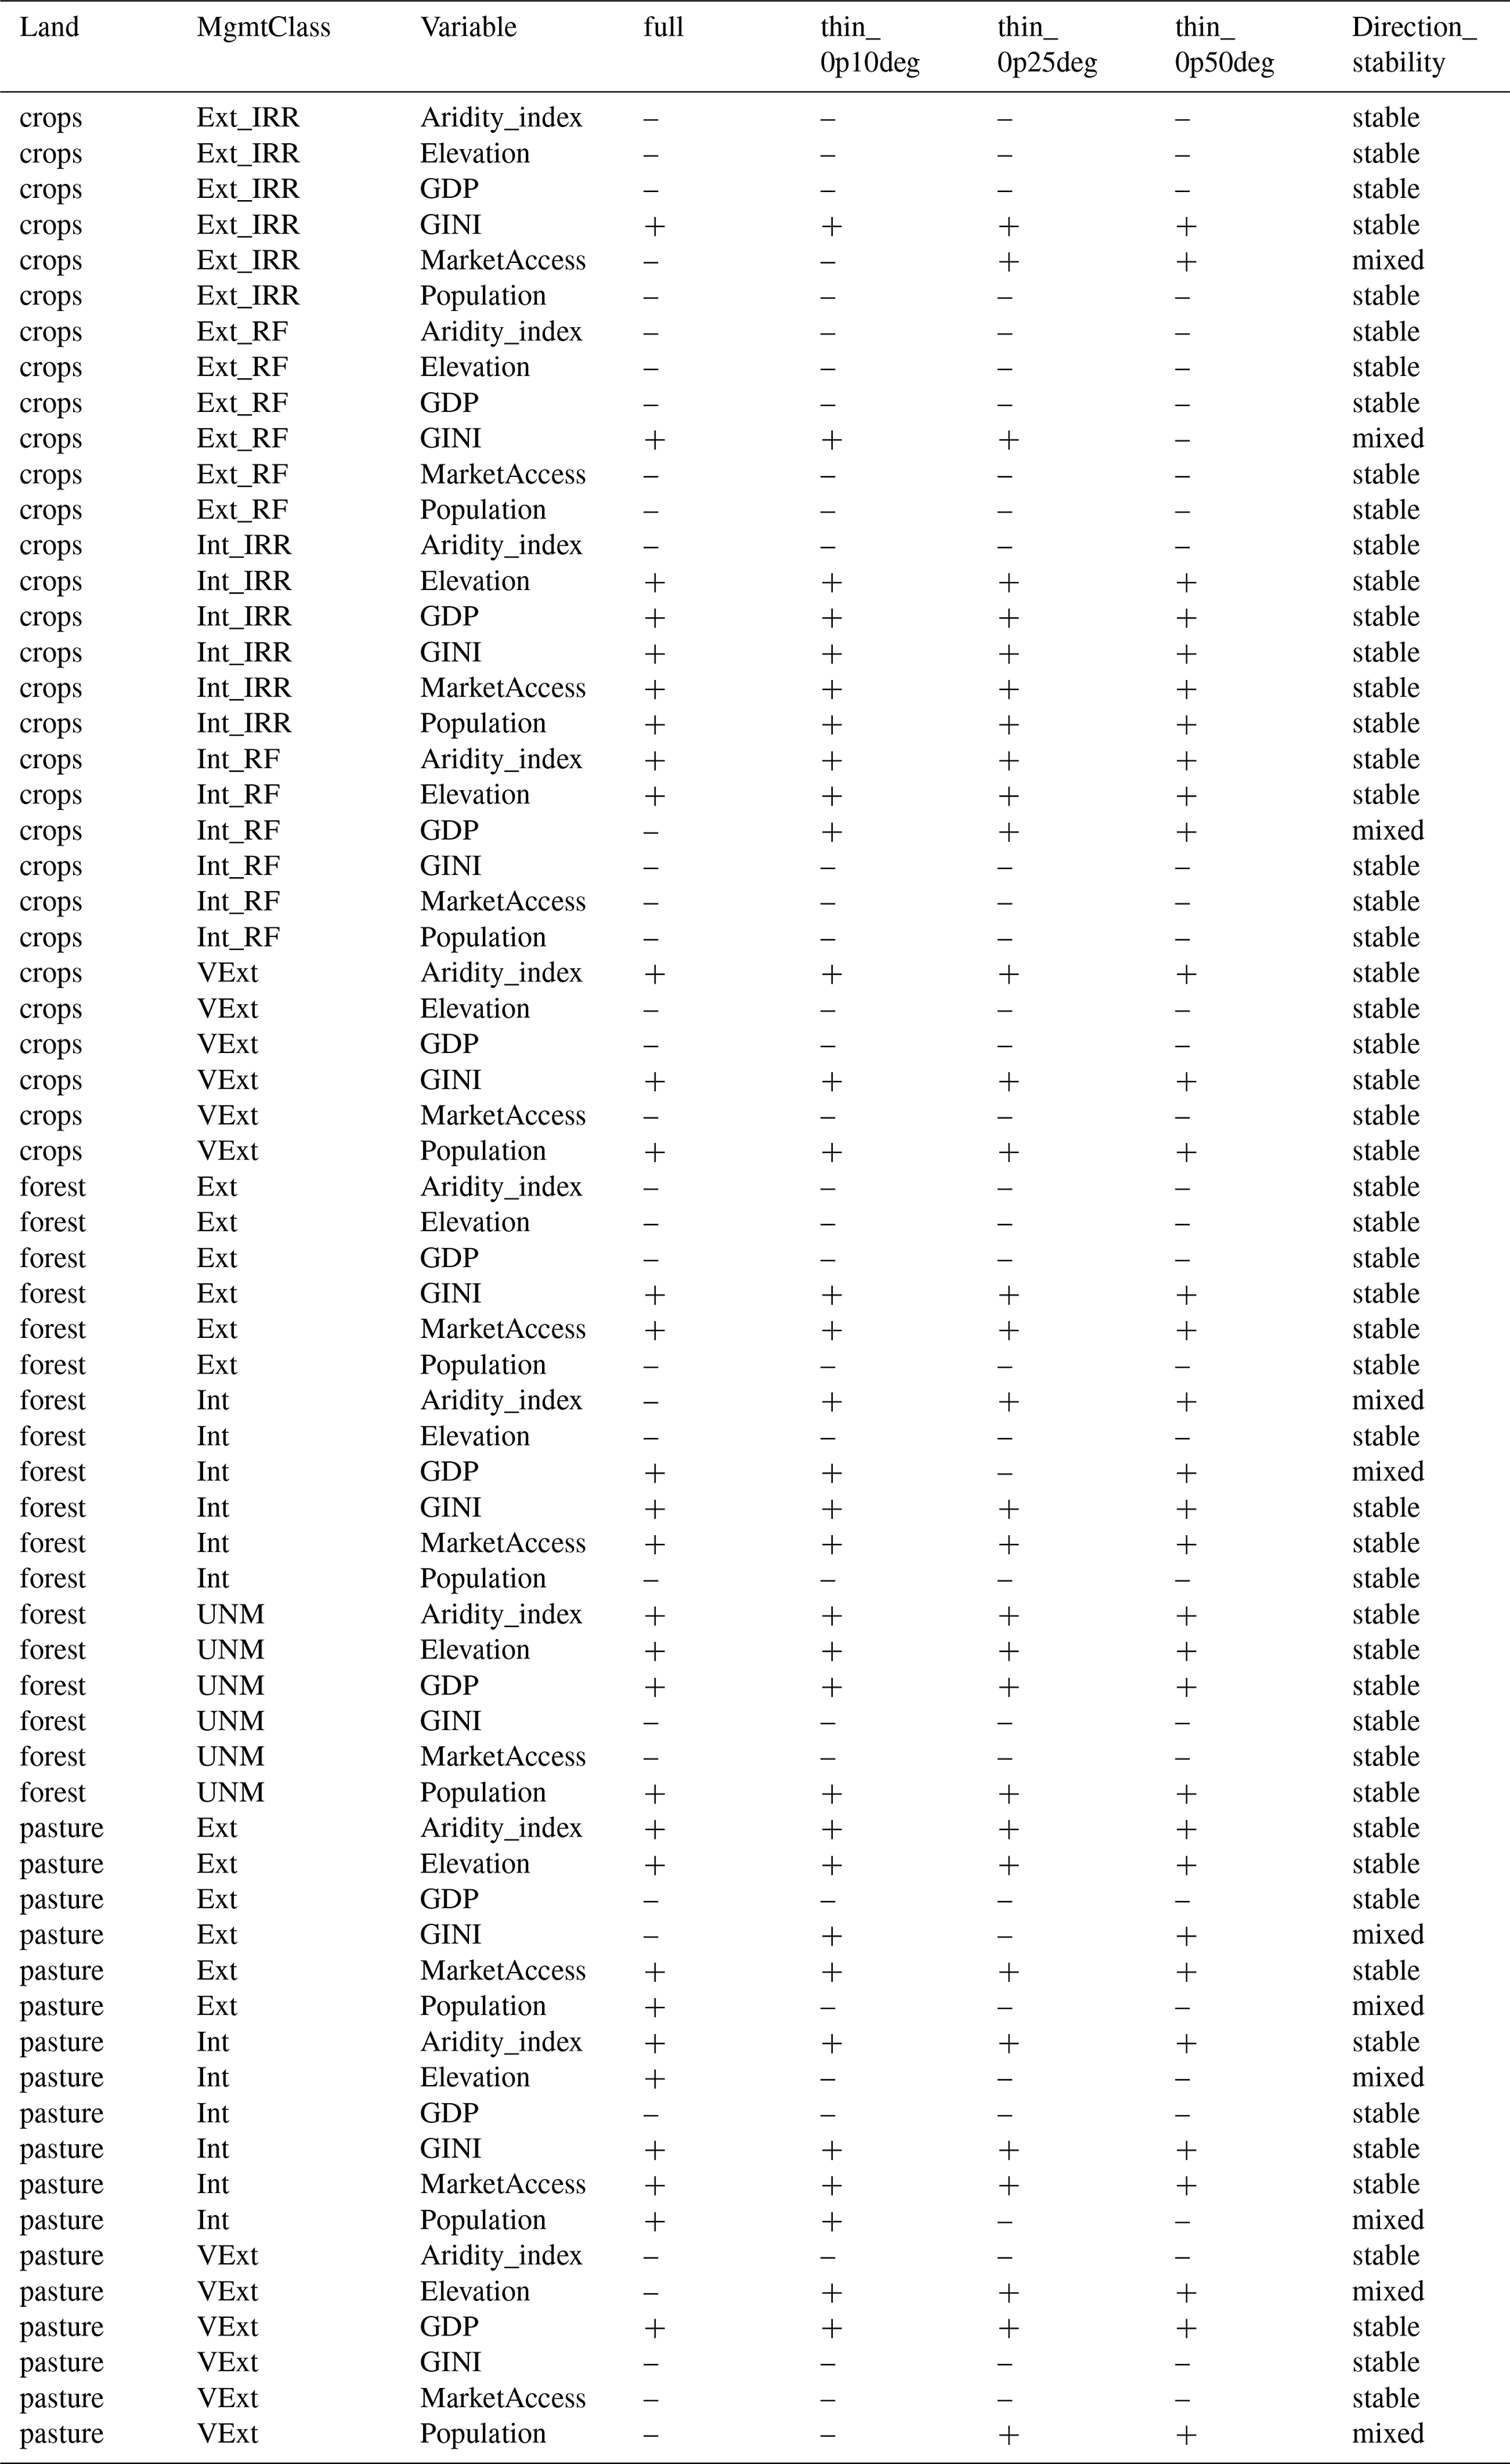
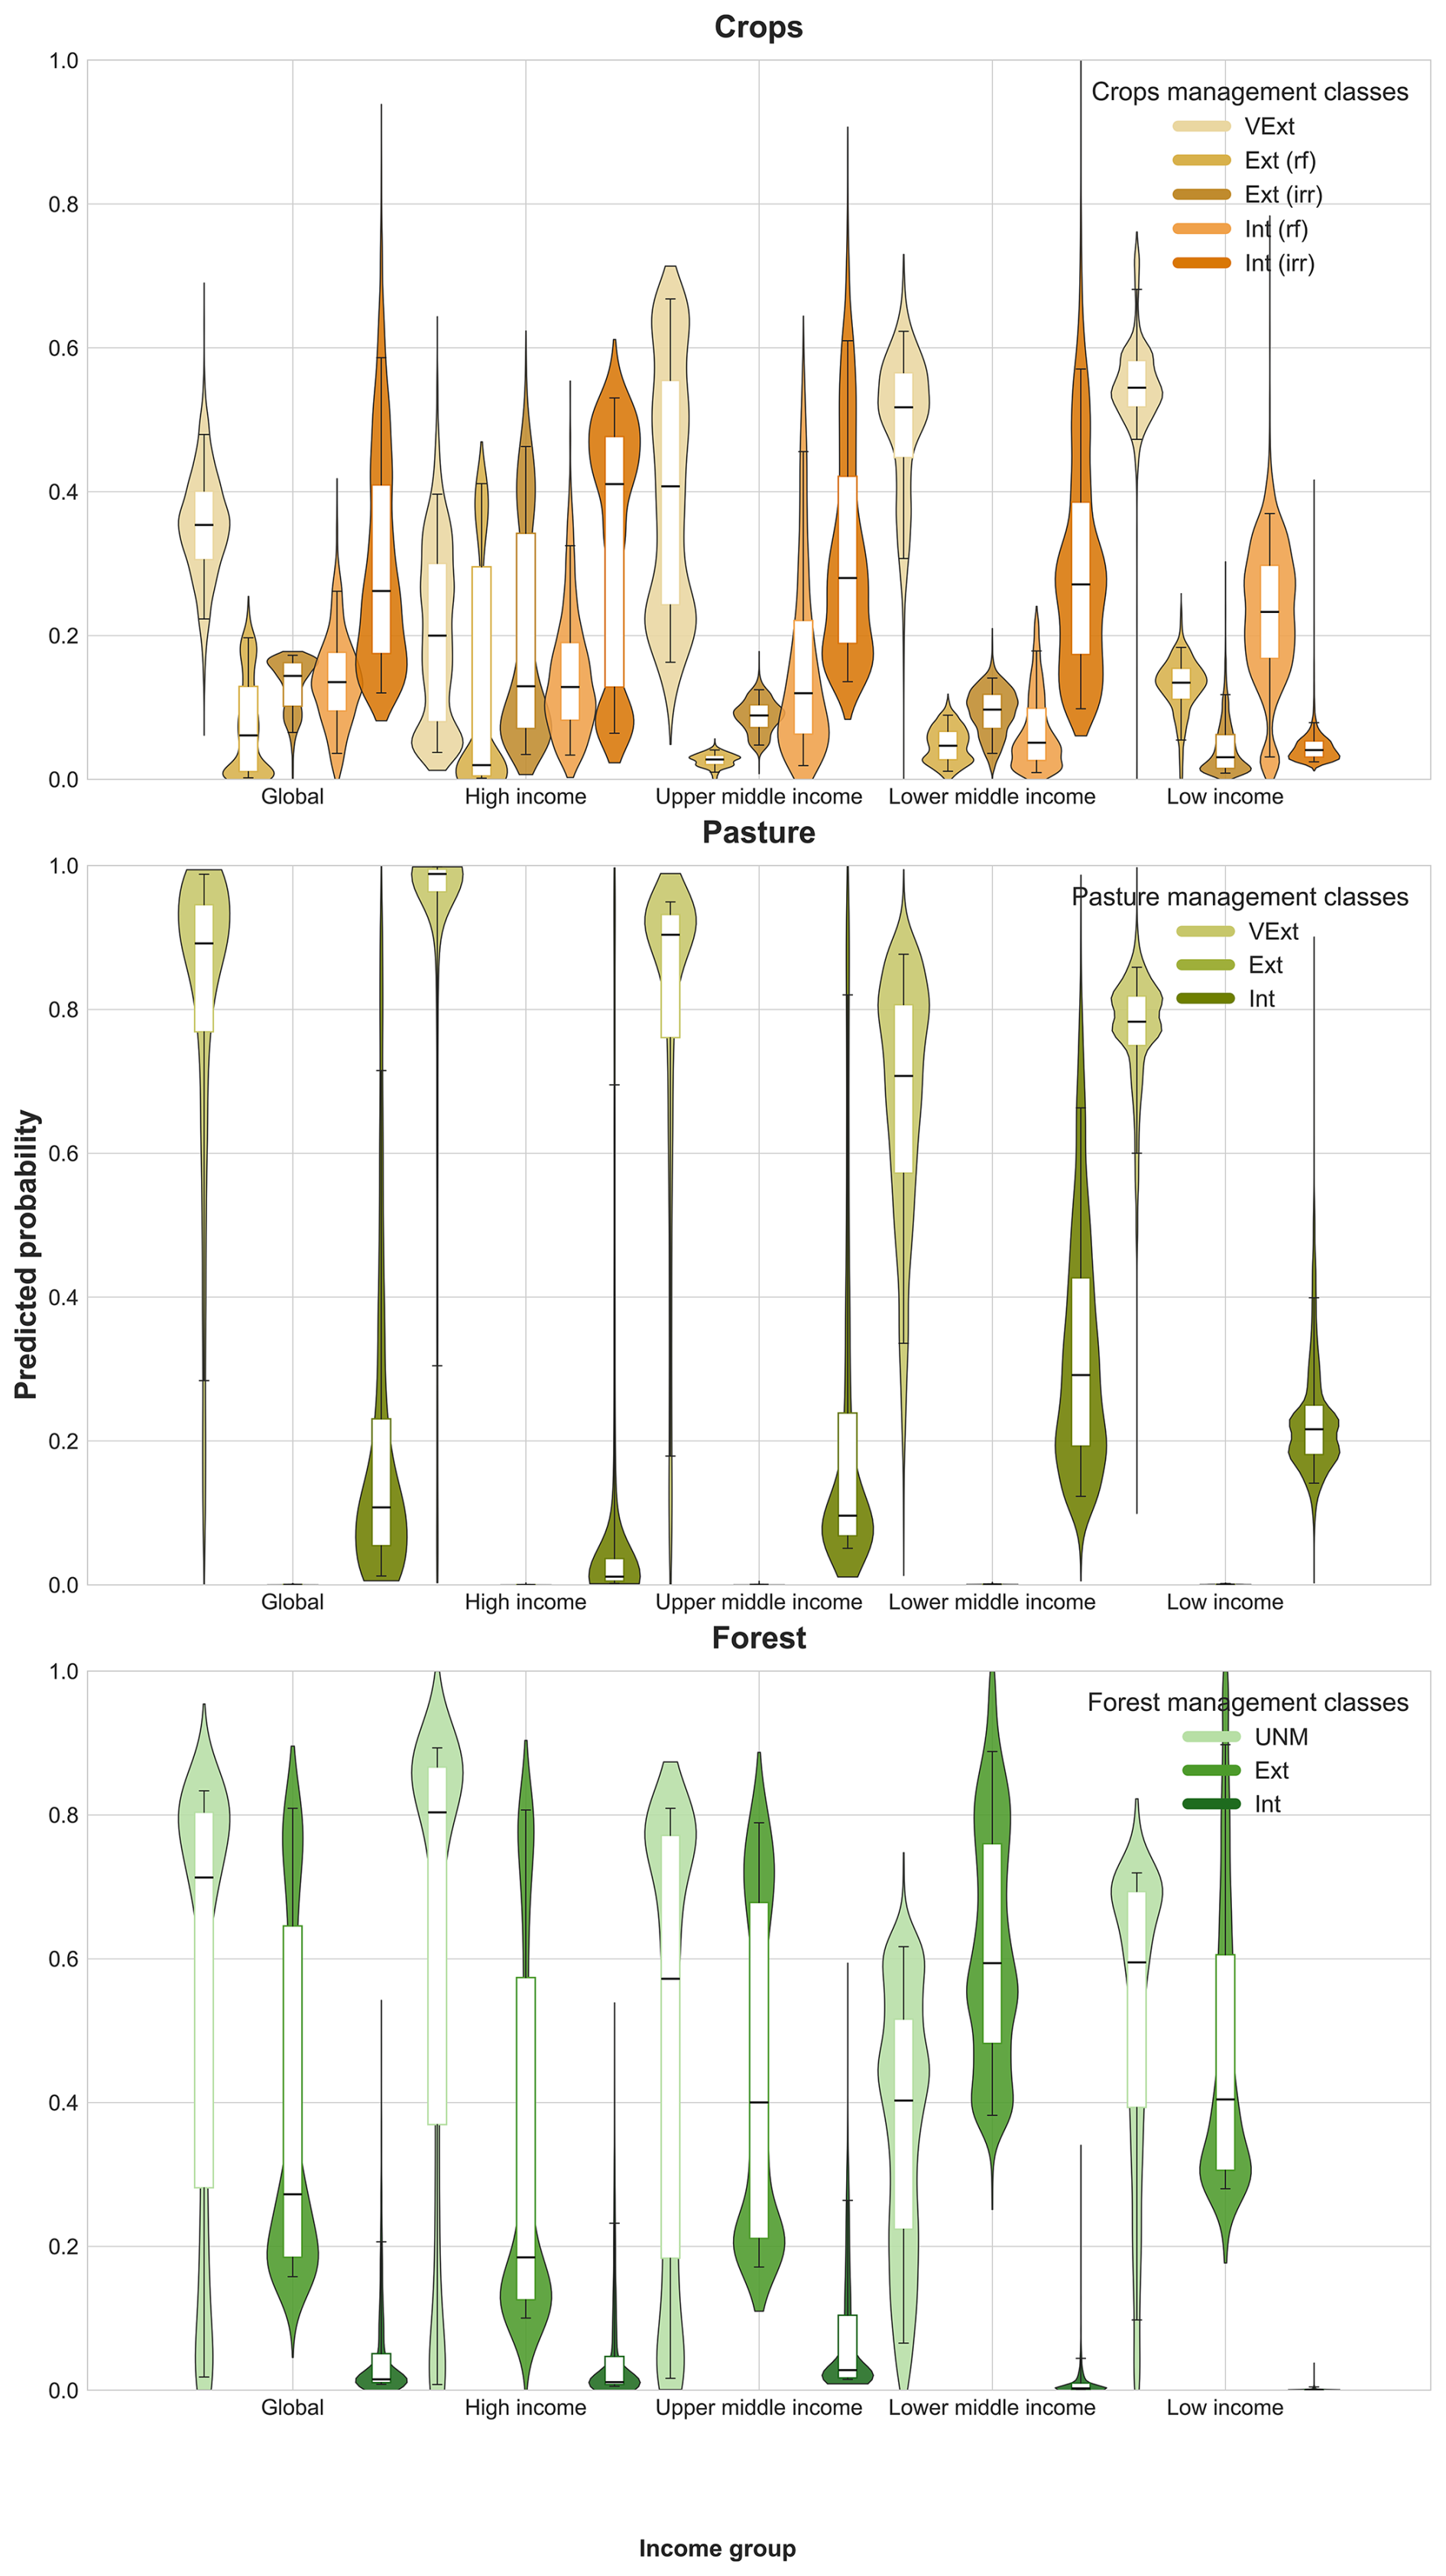
Figure A13Distribution of predicted probabilities for land management intensity. The distributions for predicted probabilities are shown for cropland, pasture and forest systems across global and world income groups. Violins represent full distribution across grid cells, while embedded boxplots indicate the interquartile range (25th–75th percentiles), median, and dispersion within each group.
AS: Conceptualization, Data curation, Methodology, Validation, Investigation, Formal analysis, Writing – original draft, Writing – review & editing. CB: Conceptualization, Methodology, Writing – review & editing. KW: Methodology, Writing – review & editing, AA: Methodology, Writing – Writing – review & editing, MR: Conceptualization, Methodology, Writing – review & editing.
The contact author has declared that none of the authors has any competing interests.
Publisher's note: Copernicus Publications remains neutral with regard to jurisdictional claims made in the text, published maps, institutional affiliations, or any other geographical representation in this paper. The authors bear the ultimate responsibility for providing appropriate place names. Views expressed in the text are those of the authors and do not necessarily reflect the views of the publisher.
The authors acknowledge the use of AI tools (GPT-5.5) to improve the language and readability in some parts of the manuscript, with all content carefully reviewed and assessed by the authors.
The article processing charges for this open-access publication were covered by the Karlsruhe Institute of Technology (KIT).
This paper was edited by Yuanzhi Yao and reviewed by two anonymous referees.
Adalibieke, W., Cui, X., Cai, H., You, L., and Zhou, F.: Global crop-specific nitrogen fertilization dataset in 1961–2020, Sci. Data, 10, 617, https://doi.org/10.1038/s41597-023-02526-z, 2023.
Alexander, P., Rounsevell, M. D., Dislich, C., Dodson, J. R., Engström, K., and Moran, D.: Drivers for global agricultural land use change: The nexus of diet, population, yield and bioenergy, Global Environ. Change, 35, 138–147, 2015.
Arneth, A., Alexander, P., Fuchs, R., Shin, Y., Claudet, J., Coll, M., Leadley, P., Rondinini, C., and Rounsevell, M. D. A.: The biodiversity-climate-food nexus: illustrating challenges and solutions using the Green Shoots framework, One Earth, https://doi.org/10.1016/j.oneear.2025.101455, 2025.
Bahar, N. H., Lo, M., Sanjaya, M., Van Vianen, J., Alexander, P., Ickowitz, A., and Sunderland, T.: Meeting the food security challenge for nine billion people in 2050: What impact on forests?, Global Environ. Change, 62, 102056, https://doi.org/10.1016/j.gloenvcha.2020.102056, 2020.
Bayer, A. D., Lautenbach, S., and Arneth, A.: Benefits and trade-offs of optimizing global land use for food, water, and carbon, Proc. Natl. Acad. Sci. USA, 120, e2220371120, https://doi.org/10.1073/pnas.2220371120, 2023.
Brown, C., Alexander, P., Holzhauer, S., and Rounsevell, M. D.: Behavioral models of climate change adaptation and mitigation in land-based sectors, WIREs Clim. Change, 8, e448, https://doi.org/10.1002/wcc.448, 2017.
Dou, Y., Cosentino, F., Malek, Z., Maiorano, L., Thuiller, W., and Verburg, P. H.: A new European land systems representation accounting for landscape characteristics, Landscape Ecol., 36, 2215–2234, 2021.
Earth Engine Data Catalog: Global Pasture Watch, https://developers.google.com/earth-engine/datasets/publisher/global-pasture-watch (last access: 27 August 2026), 2026.
EarthStat: EarthStat, http://www.earthstat.org, last access: 19 August 2026.
Erb, K. H., Lauk, C., Kastner, T., Mayer, A., Theurl, M. C., and Haberl, H.: Exploring the biophysical option space for feeding the world without deforestation, Nat. Commun., 7, 11382, https://doi.org/10.1038/ncomms11382, 2016.
Erb, K. H., Luyssaert, S., Meyfroidt, P., Pongratz, J., Don, A., Kloster, S., Kuemmerle, T., Fetzel, T., Fuchs, R., Herold, M., and Haberl, H.: Land management: data availability and process understanding for global change studies, Glob. Change Biol., 23, 512–533, 2017.
FAO: Global Forest Resources Assessment 2020: Main report, Food and Agriculture Organization of the United Nations, https://www.fao.org/forest-resources-assessment/en/ (last access: 27 August 2026), 2020.
FAO: FAOSTAT Statistical Database, Food and Agriculture Organization of the United Nations, http://www.fao.org/faostat (last access: 27 August 2026), 2022.
Foley, J. A., Ramankutty, N., Brauman, K. A., Cassidy, E. S., Gerber, J. S., Johnston, M., Mueller, N. D., O'Connell, C., Ray, D. K., West, P. C., and Balzer, C.: Solutions for a cultivated planet, Nature, 478, 337–342, 2011.
Food and Agriculture Organization of the United Nations (FAO): Agricultural production data, Our World in Data, https://ourworldindata.org/agricultural-production (last access: 27 August 2026), 2024a.
Food and Agriculture Organization of the United Nations (FAO): Forest area, Our World in Data, https://ourworldindata.org/forest-area (last access: 27 August 2026), 2024b.
Fraunhofer ISE: Photovoltaics Report, Fraunhofer Institute for Solar Energy Systems ISE, https://www.ise.fraunhofer.de/en/publications/studies/photovoltaics-report.html (last access: 27 August 2026), 2023.
Global Forest Review: Forest Extent Indicator, World Resources Institute, Washington, DC, https://research.wri.org/gfr/forest-extent-indicators/forest-extent (last access: 27 August 2026), 2024.
Haberl, H., Erb, K. H., and Krausmann, F.: Human appropriation of net primary production: patterns, trends, and planetary boundaries, Annu. Rev. Environ. Resour., 39, 363–391, 2014.
Harrison, G. R., Rigge, M., Assal, T. J., Applestein, C., James, D. K., and McCord, S. E.: An accuracy assessment of satellite-derived rangeland fractional cover, Ecol. Indic., 172, 113267, https://doi.org/10.1016/j.ecolind.2025.113267, 2025.
Herrero, M., Havlík, P., Valin, H., Notenbaert, A., Rufino, M. C., Thornton, P. K., Blümmel, M., Weiss, F., Grace, D., and Obersteiner, M.: Biomass use, production, feed efficiencies, and greenhouse gas emissions from global livestock systems, Proc. Natl. Acad. Sci. USA, 110, 20888–20893, 2013.
IPCC: Special Report on Climate Change and Land (SRCCL), Intergovernmental Panel on Climate Change, https://www.ipcc.ch/srccl/ (last access: 27 August 2026), 2022a.
IPCC: Sixth Assessment Report: Working Group III – Climate Change Mitigation, Intergovernmental Panel on Climate Change, https://www.ipcc.ch/report/ar6/wg3/ (last access: 27 August 2026), 2022b.
IRENA: Renewable Capacity Statistics 2023, International Renewable Energy Agency, https://www.irena.org/Statistics (last access: 27 August 2026), 2023.
Jayne, T. S., Snapp, S., Place, F., and Sitko, N.: Sustainable agricultural intensification in an era of rural transformation in Africa, Global Food Secur., 20, 105–113, 2019.
Kastner, T., Matej, S., Forrest, M., Gingrich, S., Haberl, H., Hickler, T., Krausmann, F., Lasslop, G., Niedertscheider, M., Plutzar, C., and Schwarzmüller, F.: Land use intensification increasingly drives the spatiotemporal patterns of the global human appropriation of net primary production in the last century, Glob. Change Biol., 28, 307–322, 2022.
Kay, M., Bunning, S., Burke, J., Boerger, V., Bojic, D., Bosc, P. M., Clark, M., Dale, D., England, M., Hoogeveen, J., and Koo-Oshima, S.: The state of the world's land and water resources for food and agriculture 2021: Systems at breaking point, https://openknowledge.fao.org/handle/20.500.14283/i1688e (last access: 27 August 2026), 2022.
Kebede, E. A., Oluoch, K. O. A., Siebert, S., Mehta, P., Hartman, S., Jägermeyr, J., Ray, D., Ali, T., Brauman, K. A., Deng, Q., and Xie, W.: A global open-source dataset of monthly irrigated and rainfed cropped areas (MIRCA-OS) for the 21st century, Sci. Data, 12, 208, https://doi.org/10.1038/s41597-024-04313-w, 2025.
Kehoe, L., Kuemmerle, T., Meyer, C., Levers, C., Václavík, T., and Kreft, H.: Global patterns of agricultural land-use intensity and vertebrate diversity, Divers. Distrib., 21, 1308–1318, 2015.
Kleijn, D., Kohler, F., Báldi, A., Batáry, P., Concepción, E. D., Clough, Y., Díaz, M., Gabriel, D., Holzschuh, A., Knop, E., and Kovács, A.: On the relationship between farmland biodiversity and land-use intensity in Europe, Proc. R. Soc. B, 276, 903–909, 2009.
Klein Goldewijk, K., Beusen, A., Doelman, J., and Stehfest, E.: Anthropogenic land use estimates for the Holocene – HYDE 3.2, Earth Syst. Sci. Data, 9, 927–953, https://doi.org/10.5194/essd-9-927-2017, 2017.
Lambin, E. F. and Meyfroidt, P.: Global land use change, economic globalization, and the looming land scarcity, Proc. Natl. Acad. Sci. USA, 108, 3465–3472, 2011.
Lesiv, M., Schepaschenko, D., Buchhorn, M., See, L., Dürauer, M., Georgieva, I., Jung, M., Hofhansl, F., Schulze, K., Bilous, A., and Blyshchyk, V.: Global forest management data for 2015 at a 100 m resolution, Sci. Data, 9, 199, https://doi.org/10.1038/s41597-022-01332-3, 2022.
Li, A., Liu, L., Li, S., Cui, X., Chen, X., and Cao, X.: Global photovoltaic solar panel dataset from 2019 to 2022, Sci. Data, 12, 637, https://doi.org/10.1038/s41597-025-04985-y, 2025.
Liu, X., Zheng, J., Yu, L., Hao, P., Chen, B., Xin, Q., Fu, H., and Gong, P.: Annual dynamic dataset of global cropping intensity from 2001 to 2019, Sci. Data, 8, 283, https://doi.org/10.1038/s41597-021-01065-9, 2021.
Ma, H., Crowther, T. W., Mo, L., Maynard, D. S., Renner, S. S., Van den Hoogen, J., Zou, Y., Liang, J., De-Miguel, S., Nabuurs, G. J., and Reich, P. B.: The global biogeography of tree leaf form and habit, Nat. Plants, 9, 1795–1809, 2023.
Ma, J., Tian, L., Zhang, Y., Yang, X., Li, Y., Liu, Z., Zhou, L., Wang, Z., and Ouyang, W.: Global property rights and land use efficiency, Nat. Commun., 15, 8525, https://doi.org/10.1038/s41467-024-52859-5, 2024.
Malek, Z̆., Douw, B., Van Vliet, J., Van Der Zanden, E. H., and Verburg, P. H.: Local land-use decision-making in a global context, Environ. Res. Lett., 14, 083006, https://doi.org/10.1088/1748-9326/ab309e, 2019.
Malek, Z̆. and Verburg, P. H.: Mapping global patterns of land use decision-making, Global Environ. Change, 65, 102170, https://doi.org/10.1016/j.gloenvcha.2020.102170, 2020.
Matej, S., Weidinger, F., Kaufmann, L., Roux, N., Gingrich, S., Haberl, H., Krausmann, F., and Erb, K. H.: A global land-use data cube 1992–2020 based on the Human Appropriation of Net Primary Production, Sci. Data, 12, 511, https://doi.org/10.1038/s41597-025-04788-1, 2025.
Mehta, P., Siebert, S., Kummu, M., Deng, Q., Ali, T., Marston, L., Xie, W., and Davis, K. F.: Half of twenty-first century global irrigation expansion has been in water-stressed regions, Nat. Water, 2, 254–261, 2024.
Meyfroidt, P., De Bremond, A., Ryan, C. M., Archer, E., Aspinall, R., Chhabra, A., Camara, G., Corbera, E., DeFries, R., Díaz, S., and Dong, J.: Ten facts about land systems for sustainability, Proc. Natl. Acad. Sci. USA, 119, e2109217118, https://doi.org/10.1016/j.gloenvcha.2018.08.006, 2022.
Nagaraj, D., Proust, E., Todeschini, A., Rulli, M. C., and D'Odorico, P.: A new dataset of global irrigation areas from 2001 to 2015, Adv. Water Resour., 152, 103910, https://doi.org/10.1016/j.advwatres.2021.103910, 2021.
NASA/METI/AIST/Japan Spacesystems and US/Japan ASTER Science Team: ASTER Global Digital Elevation Model V003, NASA EOSDIS Land Processes DAAC [data set], https://doi.org/10.5067/ASTER/ASTGTM.003, 2018.
Ostrom, E.: A general framework for analyzing sustainability of social-ecological systems, Science, 325, 419–422, 2009.
Overmars, K. P., Schulp, C. J., Alkemade, R., Verburg, P. H., Temme, A. J., Omtzigt, N., and Schaminée, J. H.: Developing a methodology for a species-based and spatially explicit indicator for biodiversity on agricultural land in the EU, Ecol. Indic., 37, 186–198, 2014.
Pergner, I. and Lippert, C.: On the effects that motivate pesticide use in perspective of designing a cropping system without pesticides but with mineral fertilizer – a review, Agron. Sustain. Dev., 43, 24, https://doi.org/10.1007/s13593-023-00877-w, 2023.
Perkins, O., Saxena, A., Seo, B., Millington, J., Brown, C., and Rounsevell, M.: Gridded socio-economic capitals for the SSPs, Zenodo [data set], https://doi.org/10.5281/zenodo.17580780, 2025.
Popp, A., Calvin, K., Fujimori, S., Havlik, P., Humpenöder, F., Stehfest, E., Bodirsky, B. L., Dietrich, J. P., Doelmann, J. C., Gusti, M., and Hasegawa, T.: Land-use futures in the shared socio-economic pathways, Global Environ. Change, 42, 331–345, 2017.
Rounsevell, M. D. and Arneth, A.: Representing human behaviour and decisional processes in land system models as an integral component of the earth system, Global Environ. Change, 21, 840–843, 2011.
Rounsevell, M. D., Arneth, A., Brown, C., Cheung, W. W., Gimenez, O., Holman, I., Leadley, P., Luján, C., Mahevas, S., Maréchaux, I., and Pélissier, R.: Identifying uncertainties in scenarios and models of socio-ecological systems in support of decision-making, One Earth, 4, 967–985, 2021.
Rudel, T. K., Schneider, L., and Uriarte, M.: Forest transitions: An introduction, Land Use Policy, 27, 95–97, 2010.
Saxena, A., Brown, C., Winkler, K., Arneth, A., and Rounsevell, M.: Global Land Management data explorer, https://ee-ankitasaxena03as.projects.earthengine.app/view/global-land-use-management (last access: 27 August 2026), 2025.
Saxena, A., Brown, C., Winkler, K., Arneth, A., and Rounsevell, M.: Global Gridded Land Management Dataset at 0.01-degrees, Zenodo [data set], https://doi.org/10.5281/zenodo.18249970, 2026.
Stehfest, E., van Zeist, W. J., Valin, H., Havlik, P., Popp, A., Kyle, P., Tabeau, A., Mason-D'Croz, D., Hasegawa, T., Bodirsky, B. L., and Calvin, K.: Key determinants of global land-use projections, Nat. Commun., 10, 2166, https://doi.org/10.1038/s41467-019-09945-w, 2019.
Tang, F. H., Nguyen, T. H., Conchedda, G., Casse, L., Tubiello, F. N., and Maggi, F.: CROPGRIDS: a global geo-referenced dataset of 173 crops, Sci. Data, 11, 413, https://doi.org/10.1038/s41597-024-03247-7, 2024.
Tian, H., Bian, Z., Shi, H., Qin, X., Pan, N., Lu, C., Pan, S., Tubiello, F. N., Chang, J., Conchedda, G., Liu, J., Mueller, N., Nishina, K., Xu, R., Yang, J., You, L., and Zhang, B.: History of anthropogenic Nitrogen inputs (HaNi) to the terrestrial biosphere: a 5 arcmin resolution annual dataset from 1860 to 2019, Earth Syst. Sci. Data, 14, 4551–4568, https://doi.org/10.5194/essd-14-4551-2022, 2022.
Turner, B., Devisscher, T., Chabaneix, N., Woroniecki, S., Messier, C., and Seddon, N.: The role of nature-based solutions in supporting social-ecological resilience for climate change adaptation, Annu. Rev. Environ. Resour., 47, 123–148, 2022.
UN DESA: World Urbanization Prospects: The 2018 Revision, United Nations Department of Economic and Social Affairs, Population Division, https://population.un.org/wup/ (last access: 27 August 2026), 2018.
Vortkamp, I. and Hilker, F. M.: Farmers' land-use decision-making: A dynamical modelling approach that integrates qualitative knowledge about social norms into a quantitative model, People Nat., 5, 1147–1159, 2023.
Winkler, K., Fuchs, R., Rounsevell, M., and Herold, M.: HILDA+ Global land use change between 1960 and 2019, PANGAEA [data set], https://doi.org/10.1594/PANGAEA.921846, 2020.
Winkler, K., Fuchs, R., Rounsevell, M., and Herold, M.: Global land use changes are four times greater than previously estimated, Nat. Commun., 12, 2501, https://doi.org/10.1038/s41467-021-22702-2, 2021.
Winkler, K., Fuchs, R., Rounsevell, M., and Herold, M.: Six decades of global crop yield increase and cropland expansion from 1960 to 2020, Environ. Res. Commun., 7, 055013, https://doi.org/10.1088/2515-7620/add3cd, 2025.
Zabel, F., Delzeit, R., Schneider, J. M., Seppelt, R., Mauser, W., and Václavík, T.: Global impacts of future cropland expansion and intensification on agricultural markets and biodiversity, Nat. Commun., 10, 2844, https://doi.org/10.1038/s41467-019-10775-z, 2019.
Zomer, R. J., Xu, J., and Trabucco, A.: Version 3 of the global aridity index and potential evapotranspiration database, Sci. Data, 9, 409, https://doi.org/10.1038/s41597-022-01493-1, 2022.