the Creative Commons Attribution 4.0 License.
the Creative Commons Attribution 4.0 License.
 | 26 Aug 2026
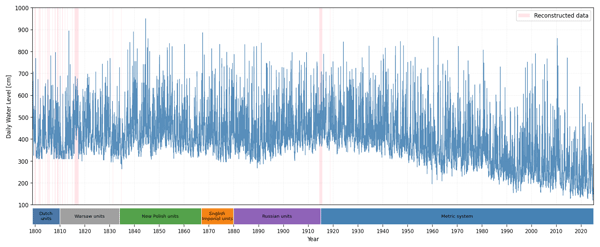
A 225-year (1799–2024) homogenized daily water level series of the Vistula River in Warsaw
Łukasz Sobechowicz
Dariusz Brykała
Ewa Kaznowska
Michał Wasilewicz
Jacek Wolski
Marcin Noras
Wojciech Aleksander Siwek
We present a 225-year (1799–2024) homogenized daily water level series for the Vistula River in Warsaw, comprising 82 453 observations. The construction of this consistent dataset required adjustments for changes in gauge location, shifts in gauge zero, differences in historical measurement units, and calendar discrepancies between the Julian and Gregorian systems. A small number of missing measurements was completed using the Long Short-Term Memory (LSTM) method, applied to measurements taken at the Warsaw gauge and parallel measurements from downstream water level gauge stations along the Vistula. The resulting dataset offers a robust foundation for long-term hydrological, climatic, and socio-environmental research. The dataset is openly available at Zenodo repository: https://doi.org/10.5281/zenodo.16919654 (Sobechowicz et al., 2025a).
- Article
(3109 KB) - Full-text XML
-
Supplement
(488 KB) - BibTeX
- EndNote


Long-term series of instrumental meteorological and hydrographic measurements are essential not only for documenting past weather conditions and water levels, but above all for reconstructing paleoenvironmental conditions and for calibrating climate and hydrological models (cf. Glaser and Stangl, 2004; Brázdil et al., 2006; Cyberski et al., 2006; Macdonald and Sangster, 2017; Brönnimann et al., 2019; Rottler et al., 2020; Nasreen et al., 2022; Sánchez-García and Schulte, 2023). Particularly valuable are the rare hydrological records that extend back to the pre-industrial era. Such long-term datasets play a fundamental role in assessing historical variability, detecting long-term trends, and providing benchmarks for model validation. Prominent examples include two-hundred-year-long river water level records in Europe, such as the Lower River Rhine at the gauges in Nijmegen, Pannerden, and Emmerich (since 1772; Toonen, 2015), the River Rhine in Cologne (since 1782; e.g. Herget and Meurs, 2010), the River Rhine in Basel (since 1808; e.g. Wetter et al., 2011), the River Rhine in Maxau (since 1815; e.g. Lang et al., 2025), and the River Rhône in Beaucaire (since 1816; e.g. Pichard et al., 2017), among others.
The Vistula River, as Poland's longest river and a key element of the country's hydrological system, has been monitored in Warsaw since the end of the 18th century. Daily water level observations from the Warsaw gauge date back to 1799, making them potentially one of the longest hydrometric records in Europe (Mikulski, 1978). However, despite their historical value, these data have remained underutilized in scientific research due to their fragmented publication history, varying measurement units, changes in gauge location and zero reference levels, and calendar inconsistencies between Julian and Gregorian systems. Although portions of the dataset have been published in historical hydrological works (Kolberg, 1861; Słowikowski, 1881), they were never fully consolidated into a single, continuous, and comparable time series. The first attempts to reconstruct water levels of the Vistula River in Warsaw for the period 1799–2000 focused on the series of characteristic annual water levels, i.e., maximum, mean, and minimum values (Fal and Dąbrowski, 2001a, b). Interest in reconstructing water levels of the Vistula River in Warsaw has primarily focused on the highest water levels, with the aim of reconstructing peak flow events of the Vistula in the Warsaw reach (e.g. Jankowski and Stolarska, 1978; Kuźniar, 1997; Bogdanowicz et al., 2000; Fal and Dąbrowski, 2001b; Wierzbicki, 2001; Magnuszewski and Gutry-Korycka, 2009; Kuźniar and Magnuszewski, 2010; Magnuszewski et al., 2012; Magnuszewski and Moran, 2015). Earlier, in the first half of the 20th century, interest was likewise limited to characteristic water level values, which were needed for designing hydraulic engineering works on the Vistula in Warsaw (Siebauer, 1929), or for calculating the probability of high-water events on the Vistula in Warsaw (Pomianowski et al., 1939). As a result, this limited perspective excluded the valuable long-term context provided by daily measurements. The aim of the present study is to reconstruct and publish a standardized daily time series of water levels for the Vistula River in Warsaw, covering the entire period from 1799 to 2024. This unified dataset, comprising over 82 000 daily observations, constitutes the longest continuous daily water level record available for the Vistula River and provides a robust foundation for long-term hydrological and environmental research.
The study focuses on the middle course of the Vistula River, particularly the section flowing through Warsaw (km 407–437, measured upstream from the river mouth at the Baltic Sea), where daily water level measurements have been recorded since 1799. Due to intensive urban development, flood protection measures, and infrastructure construction, the riverbed in Warsaw has been artificially confined to a much narrower channel, commonly referred to as the “Warsaw corset” (Magnuszewski et al., 2012), with a fixed width of approximately 400 m. As a result, the area available for the flow of major floodwaters has been reduced to just 20 %–30 % of the former floodplain (Magnuszewski et al., 2012), and water flow velocity has increased (Szymański, 1897), leading to accelerated channel incision (Gutry-Korycka, 2010). Since the 1940s, there has been a weakening of the relationship between low water levels and the corresponding discherges. Although average low-flow rates have remained at a similar level over the last century, water levels have been steadily falling. This indicates that the cause of this trend is not a reduction in the river's supply, but the deepening of its channel within the urban area (Fal and Dąbrowski, 2001b). For a low-flow rate of Q=150 m3 s−1, the corresponding water level in Warsaw fell by 205 cm between 1919 and 2010 (Magnuszewski et al., 2012). Another major anthropogenic impact on the Warsaw reach is the progressive lowering of the riverbed, primarily driven by large-scale extraction of sand and gravel for construction purposes during the 19th and 20th centuries (Kornacki, 1960; Jacewicz, 2000; Biernacki, 2000; Magnuszewski et al., 2012). This deepening of the riverbed not only altered local hydraulics but also necessitated multiple adjustments to the reference level (gauge zero) at the Warsaw gauging station. These changes had to be carefully accounted for in the homogenization process of the long-term water level series.
To support the reconstruction and verification of the Warsaw dataset, auxiliary observations were used from two downstream gauging stations: in Toruń (km 207), and in Cypel Mątowski – in the upper part of the Vistula River delta (km 55). These stations provided reference data for constructing stage–stage relationships and for identifying anomalies or discontinuities in the Warsaw record. Their location within the same river basin and main channel ensured hydrological comparability and consistency over time.
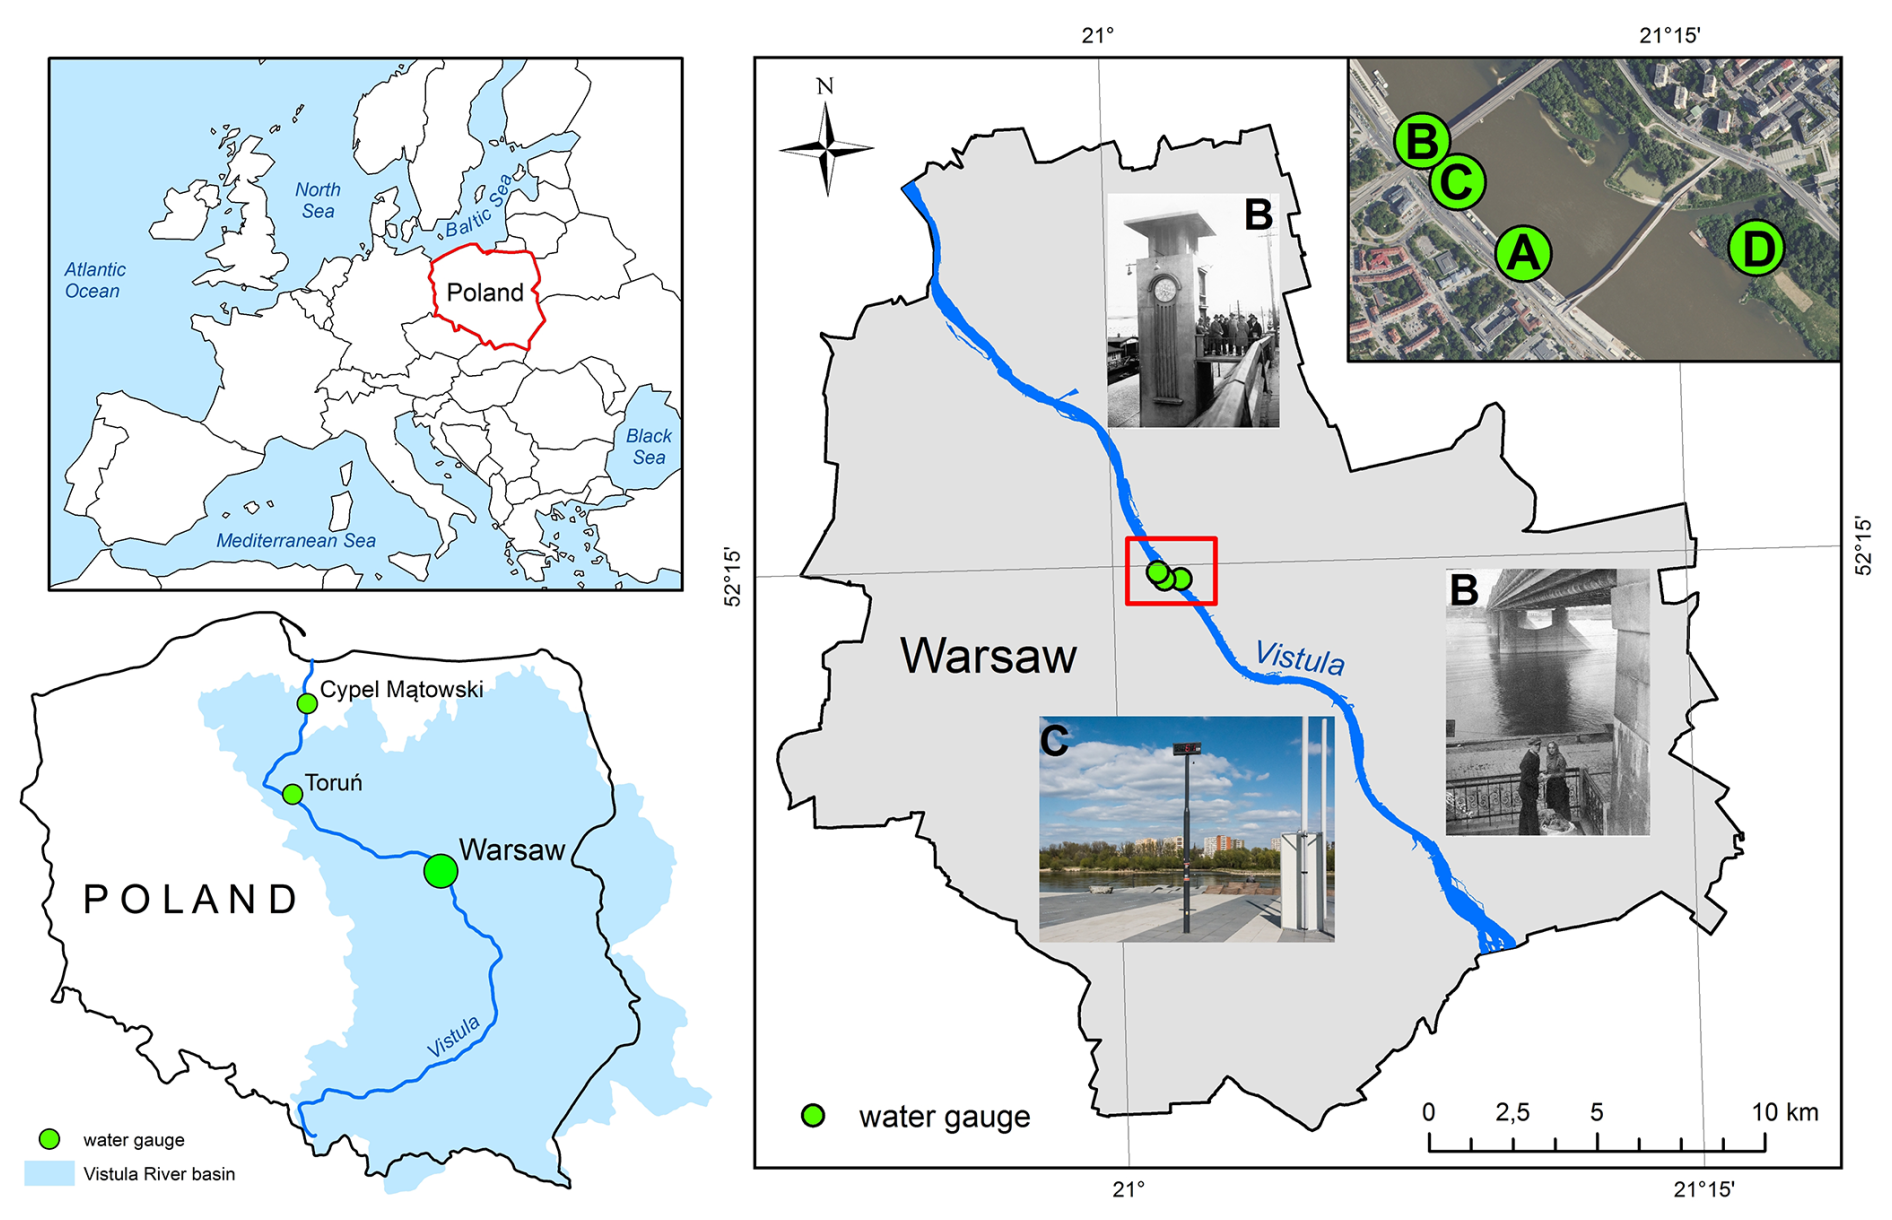
Figure 1Location of historical Warsaw water gauges and auxiliary stations along the Vistula River: (A) Poniński Bridge 1799–1864, (B) Kierbedź Bridge 1864–1937, (C) Warsaw-Boulevards 1937–1959 and 2017–2024, (D) Praga Port 1959–2017. Map by the authors. Aerial imagery courtesy of http://Geoportal.gov.pl (last access: 18 July 2024). Photograph sources: (B) National Digital Archives, Warsaw; (C) Wikimedia Commons.
3.1 Data sources
The earliest preserved water level measurements of the Vistula River in Warsaw (1799–1860) were compiled, standardized, and published by Wilhelm Kolberg (1861). Kolberg was an engineer and member of the Corps of Engineers of the Polish Army, involved in major hydraulic and infrastructural projects, including the construction of the Augustów Canal, the largest hydrotechnical project of the Kingdom of Poland and the Warsaw–Vienna Railway, the first railway line in the country. Kolberg's publication was the first to consolidate daily water level observations and river freezing dates for Cracow, Warsaw, and Kwidzyn, representing the upper, middle, and lower reaches of the Vistula. His work was motivated by the conviction that reliable hydrological data were essential for improving navigation and designing hydraulic works. He emphasized that knowledge of water levels, river ice formation, and break-up had been previously poorly examined, little disseminated, and unsystematized (an example of an original early nineteenth-century measurement sheet is shown in Fig. 2). Our database includes data from this publication for the years 1799 to 1859. For the subsequent period of 1860 to 1879, data were published by Słowikowski (1881). His work closely follows Kolberg's study and serves as a continuation of it. It includes water level measurements for the Vistula River in Warsaw and provided data for our database for the entire observation period from 1860 to 1879. In 1876, a new water gauge was installed that used the English Imperial measurement system, which was also adopted in the Russian Empire. For the years 1876 to 1880, Russian hydrologists published data in graphical form in a yearbook titled “Svedeniya o stoyaniyakh” (Ministry of Ways of Communication of the Russian Empire, 1881), which ran parallel to Słowikowski's publication. Data for 1880 were obtained by digitizing a drawing of a water level hydrograph from this publication. From 1881 to 1910, Russian hydrological yearbooks continued in tabular form over three volumes (“Svedeniya ob urovne”, published in 1907, 1909, and 1915, Ministry of Ways of Communication of the Russian Empire, 1907, 1909, 1915), covering the periods 1881–1890, 1891–1900, and 1901–1910, respectively. The complete data from these three volumes were incorporated into our database. For the data spanning 1911 to 1914, we utilized information contained in German hydrological yearbooks for the Northern Germany region (within its borders at that time), published as “Jahrbuch für die Gewässerkunde Norddeutschlands” (1912–1915) (Jahrbuch für die Gewässerkunde Norddeutschlands, 2016a, b, 1922a, b). In turn, observations from 1915–1918 (in the form of handwritten sources) we found in the state archives in Płock (Fonds: State Waterways Administration in Płock, shelfmark: 2), Toruń (Fonds: Wasserbauinspektion Thorn, shelfmark: 133), Gdańsk (Weichselstrombauverwaltung in Danzig, shelfmark: 18), and subsequently incorporated into the dataset. Observations from 1919 to 1980 were sourced from published hydrographic yearbooks, and were issued by Polish hydrological services. Water-level observations for the hydrological years 1919–1934 were published in the Hydrographic Yearbook: Vistula River Basin (published in 1920–1939). Records for 1935–1937 appeared in the German Jahrbuch für die Gewässerkunde des Weichselgebiets: Wässerstände und niederschläge der kalenderjahre 1935, 1936, 1937, (published in 1941). Data for the hydrological years 1938–1944 were published after the Second World War in the Hydrographic Yearbook: Vistula River Basin (published in 1953 and 1962). The hydrological years 1945–1960 were covered by the Hydrographic Yearbook: The Vistula River and Coastal Rivers East of the Vistula (published in 1950–1965), whereas data for 1961–1980 appeared in the Hydrological Yearbook of Surface Waters: Vistula River Basin and Coastal Rivers East of the Vistula (published in 1966–1985). From 1981 to 2024, daily water level data for the Warsaw station are available in digital format through the database of the Institute of Meteorology and Water Management in Warsaw (IMGW): https://danepubliczne.imgw.pl/data/dane_pomiarowo_obserwacyjne/ (last access: 16 July 2026; IMGW, 2025). All sources used in this study are listed in the Supplement, which provides full bibliographic details for each volume, including information on the availability of digital copies.
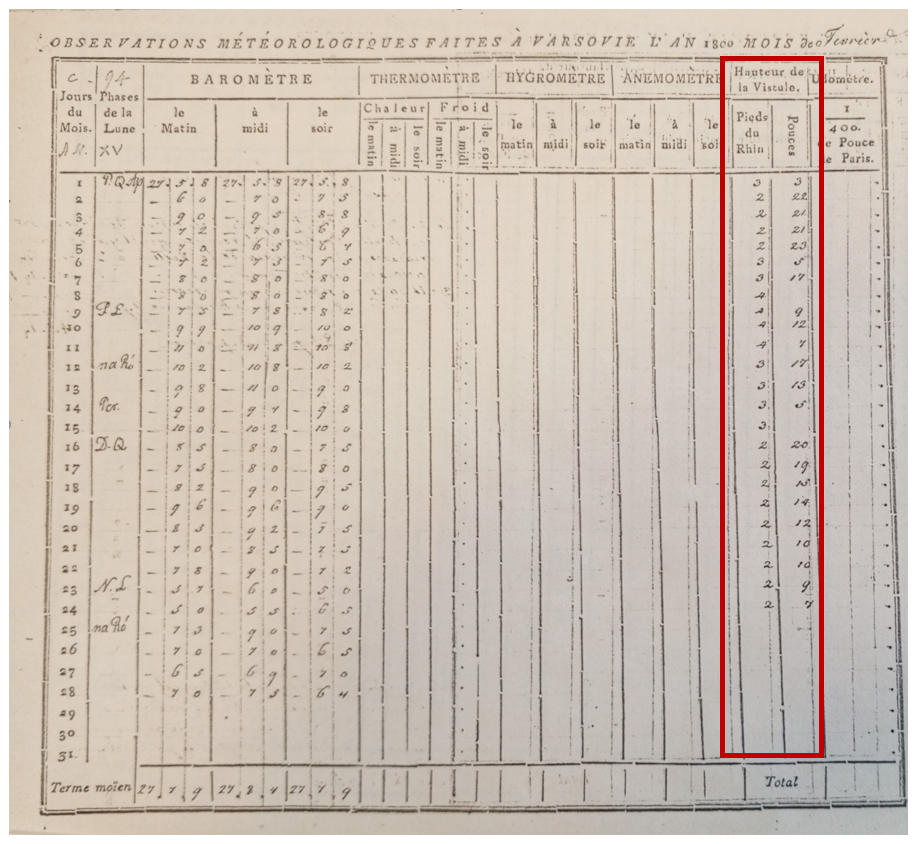
Figure 2Facsimile of a record sheet containing meteorological measurements and water level observations from Warsaw, February 1800. The Vistula River stage is shown in the penultimate column. Held at the Library of the Institute of Meteorology and Water Management (IMGW) in Warsaw, reference no. C3052.
3.2 Reference data
In addition to the primary sources for the Warsaw gauge, we used daily water level series from two downstream stations on the Vistula River: Toruń (km 207) and Cypel Mątowski (km 55). These long-term records served as reference data for reconstructing missing observations in the Warsaw dataset. Their hydrological continuity and proximity within the same river basin made them suitable for deriving stage–stage relationships. Further details on the methods and application of these reference series are provided in Sect. 3.8. Water level data from the Toruń gauge were published by Makowski and Tomczak (2002). Observations from Cypel Mątowski for the years 1799–1828 are preserved in the State Archive in Gdańsk, reference number 7/431. These early measurements have been described and analysed in detail by Kazusek (2025).
3.3 Changes in the location of water level observations in Warsaw
The first water gauge in Warsaw was installed on the left bank of the Vistula River, near the wooden pontoon bridge known as the Poniński Bridge (see Fig. 1). The bridge was located along the extension of Bednarska Street on the Mariensztat side and Kłopotowskiego Street on the Praga side, at km 421.6. After the construction of the first permanent bridge (Kierbedź Bridge) in 1864, the Warsaw gauge was relocated to the western pier of the new crossing, at km 421.3. In 1937, the gauge was moved approximately 90 m upstream, to km 421.4. In 1958, it was transferred to the right bank of the river, near the Praga Port, at km 421.9. Initially, it was mounted on the western wall of the southern pier of the bridge over the canal leading to the port. Later, a new gauge staff was installed on the dock of the Praga Port. Since the beginning of the 2018 hydrological year, water level measurements have been restored in the area of the original 19th-century observation site. After the construction of the new river boulevards on the left bank at km 421.4, a new gauge staff with an electronic water level display was installed and designated as the Warsaw-Boulevards station.
3.4 Changes in the zero reference level of the Warsaw gauges
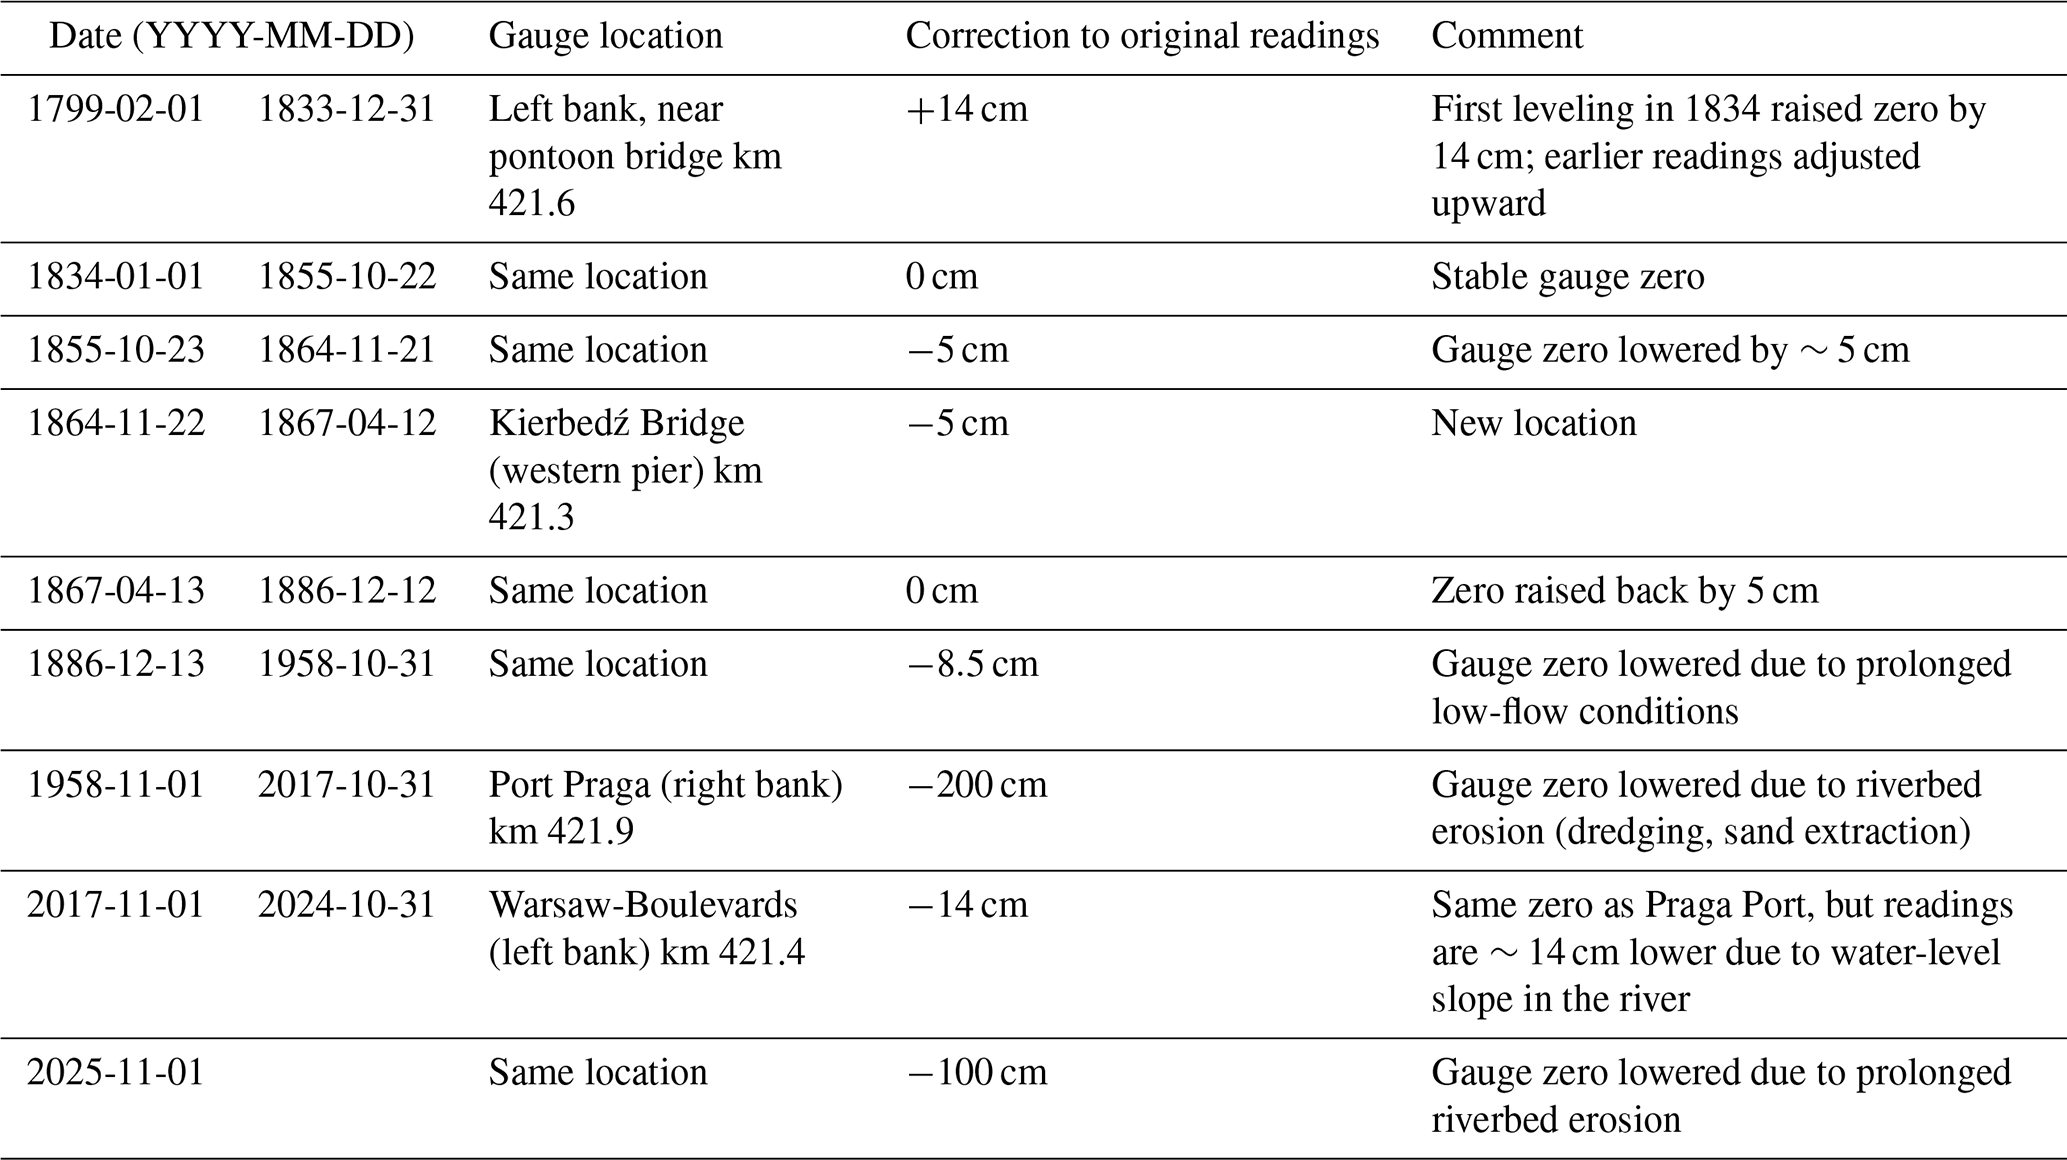
Initially, the Warsaw water gauge did not have a defined zero level referenced to any fixed point. Only from 1 January 1834, was the gauge zero established relative to the high water mark from the 1813 flood (permanently marked on one of the buildings on Bednarska Street), in such a way that the mark corresponded to 21 stopy on the gauge scale (New Polish system, 21 stopy = 604.8 cm). Earlier readings should be increased by 14 cm, as the gauge zero was raised by that amount during the first leveling. In 1848, the gauge zero was tied to the newly established national leveling network. Its elevation was set at 76.991 m above the level of the Baltic Sea near Palanga, without changing the physical location of the gauge (Witkowski, 1907; Fal and Dąbrowski, 2001a). On 23 October 1855, the zero was lowered by approximately 5 cm. After the gauge was relocated to the pier of the Kierbedź Bridge (see Fig. 1) in 1864 (taking into account the river's water surface slope), the gauge zero was adjusted again on 13 April 1867, raising it back by 5 cm to 76.876 m above the Baltic Sea level near Palanga. On 13 December 1886, a minor correction was made, lowering the gauge zero by 8.5 cm to 76.791 m, due to a prolonged low-flow period. The gauge zero level was lowered once again on 1 November 1958, when measurements were transferred to the Praga Port site. On that date, the gauge datum was lowered by 200 cm to compensate for the long-observed lowering of the riverbed in the Warsaw section. During the most recent relocation on 1 November 2017, the zero level remained unchanged). However, because of the water-level slope in the river, readings at the new location (Warsaw–Boulevards) are approximately 14 cm lower than those previously recorded at the Praga Port gauge. Due to the ongoing erosion of the Vistula riverbed, the reference point of the Warsaw-Boulevards gauge was once again lowered by 1 m at the end of the 2025 hydrological year. The current zero level of the Warsaw-Boulevards gauge is therefore 75.08 m a.s.l. in the Kronstadt 60 system and 75.17 m a.s.l. in EVRF2007. A concise summary of all corrections applied to the original water level observations is provided in Table 1.
Table 1Corrections to original water level observations at the Warsaw gauge (1799–2025).
3.5 Measurement units used at the Warsaw gauges
In the past, water level measurements on the Vistula River in Warsaw were recorded using various national and regional systems, including Warsaw units, Dutch units, New Polish units, English Imperial units, and Russian units. A consistent transition to the metric system, with centimetre-level precision, was not implemented until World War I. Table 2 summarizes the periods during which different measurement systems were in use, along with the conversion factors applied to harmonize them with the metric system.

3.6 Timing and accuracy of water level readings
The water levels collected in the database differ in the way they were compiled in the respective historical period, as well as due to the progress of the digital revolution in the 21st century. Data up to the end of the 20th century are time-based observations collected at the obligatory morning observation time, specified as 06:00 LT (Ministry of Public Works, 1923) and, from 1950 onwards, as 07:00 LT. For the nineteenth-century records, LT corresponds to Warsaw Mean Time (WMT; UTC+01:24); in later records, LT refers to the official local civil time in force in Warsaw (Hydrographic Yearbook, 1950, 1955). In contrast, in 2001/2005 in Poland, within the framework of the Monitoring System for National Protection project, the measurement network was upgraded with automatic hydrological stations (Szumiejko et al., 2015). Therefore, from that period on, the data on daily water levels on the Vistula River were processed and stored in the Central Historical Database of the Institute of Meteorology and Water Management in Warsaw, which is a chronological average of measurements recorded every 10 min. It has to be pointed out that water levels presented in the database are not extraordinary observations but daily values – defined as timely values until the end of the 20th century and since the beginning of the 21st century calculated as chronological averages.
Information on the accuracy of water level readings has been provided since 1919, when the centimetre scale gauges appeared. The accuracy of the reading is 1 cm, on water gauge patches which in most cases have a 2 cm scale (Instrukcja dla obserwatorów stacyj wodowskazowych, 1923).
3.7 Calendar systems
In the 19th century, both the Gregorian and Julian calendars were used in Polish territories, depending on the administrative and political context. Daily water level measurements of the Vistula River from 1799 to 1879 were recorded according to the Gregorian calendar. However, from 1880 to 1910, official Russian publications, which reported water levels, used the Julian calendar. The difference between the two calendars amounted to 12 d until 1 March 1900; after that date, it increased to 13 d. This distinction is essential for the correct interpretation and chronological alignment of hydrological data from different periods.
3.8 Gaps in the dataset and methods of reconstruction
The dataset comprises 82 453 daily water level observations for the Vistula River. Missing data account for 2374 d, representing 2.9 % of the total dataset. The most significant gaps correspond to two distinct periods: from 1 December 1815 to 13 July 1817, when ice jam destroyed the bridge and the gauge located beneath it, from 29 July 1914 to 16 October 1915, coinciding with World War I. A complete list of all data gaps, along with the methods used for their reconstruction, is provided in Table 3.
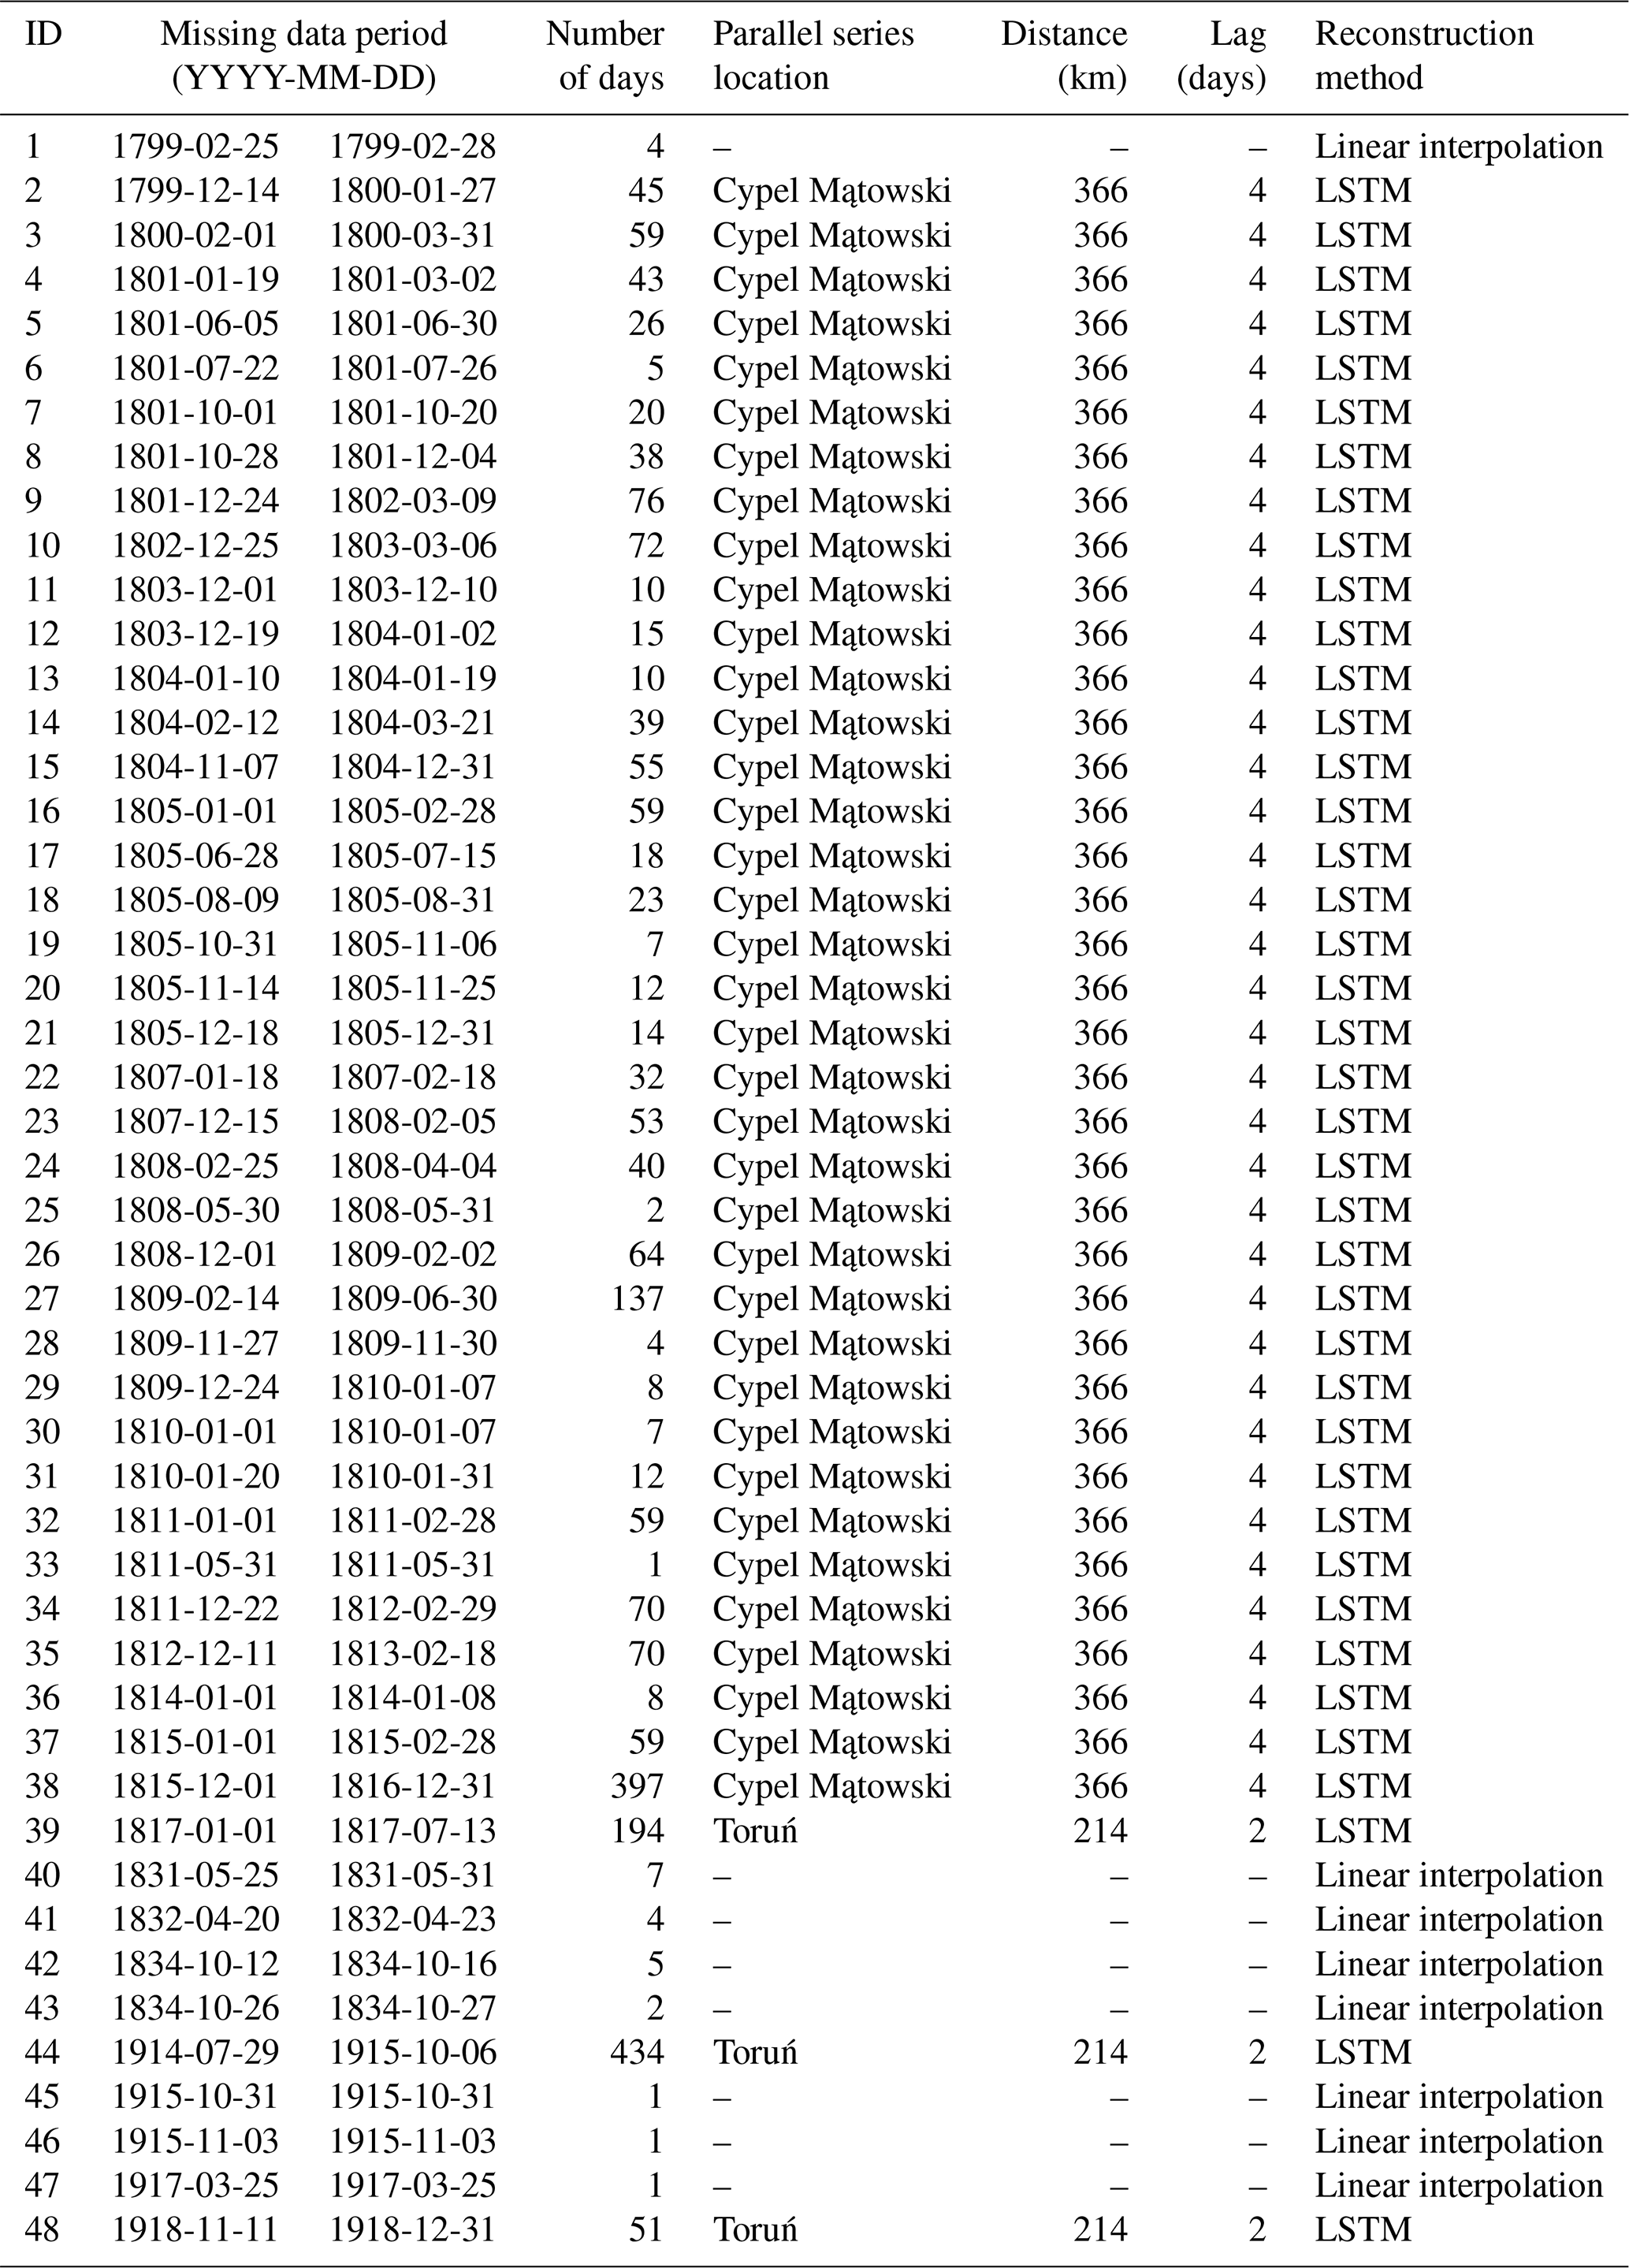
Missing daily water level values for the Vistula River in Warsaw, with the exception of gaps lasting 7 d or less, were reconstructed using relationships with data from two other stations: the Vistula River in Toruń and in Cypel Mątowski (see Fig. 1). The relationships established between water levels in Warsaw and those recorded at Toruń, as well as between Warsaw and Cypel Mątowski, are referred to as gauge relationships. This method relies on the observation that similar hydrological events (such as floods or low flows) occur successively at gauging stations located along the same river or on neighbouring rivers, with a certain time lag (Byczkowski, 1996). It was, however, a demanding inter-gauge reconstruction problem rather than a simple transfer between neighbouring stations. The distance between Warsaw and Toruń is approximately 200 km, and 366 km to Cypel Mątowski. The contributing drainage area increases from about 80 000 km2 at Warsaw to 170 000 km2 at Toruń and more than 180 000 km2 at Cypel Mątowski. Between Warsaw and Toruń, the Vistula receives major tributary inflows and the hydrological signal may be modified by channel storage, changing flow conditions, seasonal effects, and ice-related disturbances. The reconstruction model therefore had to learn a complex downstream relationship rather than a simple one-to-one correspondence between two nearby water-level series.
Before constructing the reconstruction model, the dominant time lag between the Warsaw and Toruń, and Warsaw and Cypel Mątowski gauges was estimated empirically. The analysis was performed using first differences of daily water levels rather than raw stage values. This choice was intended to focus on the timing of short-term hydrological fluctuations and to reduce the influence of strong autocorrelation in the original water-level series. Cross-correlation analysis indicated that a 2 d lag provided the most stable relationship between Warsaw and Toruń gauges, and a 4 d lag between Warsaw and Cypel Mątowski. Those lags produced the strongest association in most monthly subsets and in the main water-level classes. It was therefore adopted as the reference temporal offset for the reconstruction procedure. At the same time, the lag was not treated as a perfectly fixed hydrological constant. The propagation of water-level changes can vary with flow conditions, season, channel state, and ice phenomena.
The reconstruction was carried out using a long short-term memory neural network. LSTM models are designed for sequential data (Hochreiter and Schmidhuber, 1997) and are therefore well suited to problems in which the target value depends not only on one predictor value at a fixed time lag, but also on the shape and recent evolution of the input sequence. LSTM neural networks have already been successfully applied to hydrological reconstruction tasks (Ren et al., 2022). In the present case, the aim was not to forecast future water levels, but to reconstruct missing historical observations in Warsaw using the available hydrological information from Toruń and Cypel Mątowski. For this reason, the LSTM model was not restricted to a single lagged value. Instead, it was supplied with a sequence of observations around the estimated lag, allowing it to learn a broader local representation of the downstream hydrograph.
The target variable was the daily water level of the Vistula River in Warsaw. The main predictor was the daily water level recorded at Toruń or Cypel Mątowski. Two additional types of information were added to the input structure. First, seasonality was represented by cyclic calendar variables, allowing the model to learn annual variation without imposing an abrupt division between seasons. Second, the day-to-day change in water level at Cypel Mątowski was included as a measure of hydrograph state. This variable informed the model whether the river was rising or falling and how rapidly water level was changing. The model was trained on rolling windows of daily observations. Two window designs were considered during model development. A causal window used only antecedent observations from Cypel Mątowski. A centered window used a sequence centered on the Cypel Mątowski observation corresponding to the estimated 2 or 4 d inter-gauge lag. Because the task was retrospective reconstruction rather than real-time forecasting, the centered design was hydrologically justified: observations before and after the reconstructed day could be used to describe the local geometry of the flood wave or low-flow episode recorded downstream. Only uninterrupted input sequences were used. Windows that crossed a gap in the predictor chronology were excluded, so that the model did not learn artificial sequences created by joining observations from opposite sides of a missing interval. This rule was essential for preserving the temporal and physical coherence of the input data.
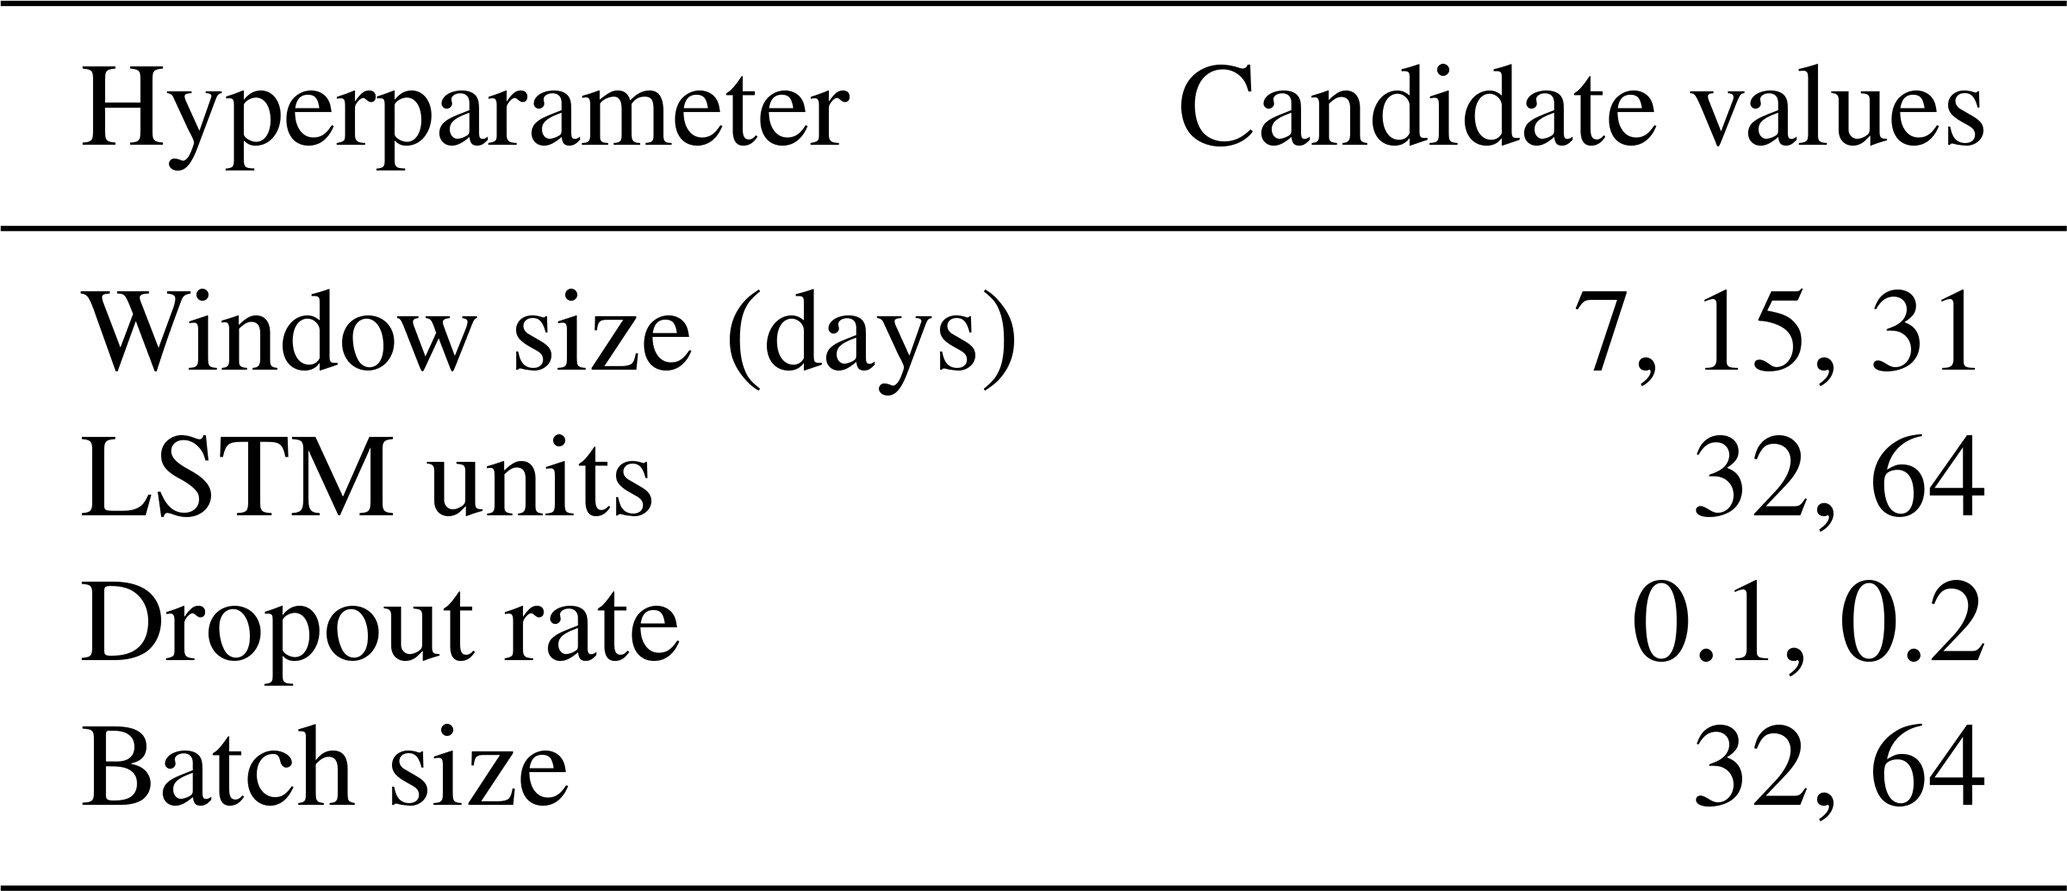
The LSTM architecture consisted of a single LSTM layer followed by dropout regularisation, a fully connected hidden layer with ReLU activation, and a final one-unit output layer producing the reconstructed Warsaw water level. The model was trained using the Adam optimiser and mean squared error as the loss function. Gradient clipping was applied to stabilise optimisation. Input variables and the target series were standardised using parameters estimated only from the training data. These fitted transformations were then applied to the corresponding validation or reconstruction subsets. This prevented information from the validation data from entering the training procedure through scaling. Hyperparameter tuning was performed separately for each predictor specification. The search included alternative window lengths, numbers of LSTM units, dropout rates, learning rates, and batch sizes. The candidate values considered for each hyperparameter during the grid-search procedure are listed in Table 4. Training was run with early stopping based on validation loss, with the best weights restored. The order of observations was not shuffled, because the model relied on the temporal structure of the sequences. To reduce dependence on a single random initialisation, candidate configurations were trained repeatedly using different random seeds, and model selection was based on average validation performance.
Table 4Hyperparameter search space used for LSTM model tuning.
3.9 Technical validation
The long, over two-hundred-year series of daily water level observations on the Vistula River holds exceptional research value, but also presents significant challenges related to data quality and consistency. In order to make reliable use of these data, both in hydrological and historical analyses, a critical assessment of the series' credibility and homogeneity was necessary. This need is justified by two main considerations:
-
Filling gaps in historical data. Numerous gaps are present in the daily records from the early decades of the 19th century. These were filled using either linear interpolation or data from nearby gauging stations (Toruń and Cypel Mątowski). While these are techniques used in hydrological data reconstruction (Ren et al., 2022), they may compromise the quality of the resulting dataset. Not all reconstructions are equally reliable. The considerable distance between Warsaw and the auxiliary stations used, Toruń (214 km downstream) and Cypel Mątowski (366 km downstream), means that local hydrological phenomena could occur at those sites but not in Warsaw. The largest tributary of the Vistula, the Narew River, joins the main stem between these stations and Warsaw. Due to its distinct hydrological regime, it can significantly affect the relationship between gauges. Reconstructing winter data presents an even greater challenge, as ice jams may have caused sudden surges in water level that could be incorrectly attributed to the Warsaw gauge. Because the reconstruction methods cannot fully eliminate such risks, it is essential to identify and clearly mark sections of the dataset that are potentially subject to greater uncertainty.
-
Quality and accuracy of early measurements. In the earliest decades of the observational series, water levels were recorded using a variety of measurement systems, including Warsaw, New Polish, Dutch, English, and Russian units, which were later converted into the metric system. While these conversions were necessary and the entire series has been homogenized, the accuracy and consistency of the original data remain uncertain. Early records may contain rounding, duplication, or transcription errors, and no formal assessment of potential discontinuities or changes in measurement precision had been conducted prior to this study. A critical evaluation of these issues is essential to avoid misinterpretation of hydrological patterns in long-term analyses.
3.9.1 Validation of reconstructed data
The predictive ability of the model was assessed using out-of-sample validation rather than in-sample fit. This was crucial because the purpose of the model was not to describe observed values already available in the Warsaw series, but to estimate missing observations. The validation procedure was therefore designed to test whether the model could reconstruct observed Warsaw values that had been withheld from training. The main validation scheme used leave-one-hydrological-year-out cross-validation (LOHYO). In each validation cycle, one hydrological year was withheld from model training and then reconstructed using the model fitted on the remaining data. This approach provided a historically realistic test of model performance, because it assessed whether the model could generalise to unseen sections of the early record.
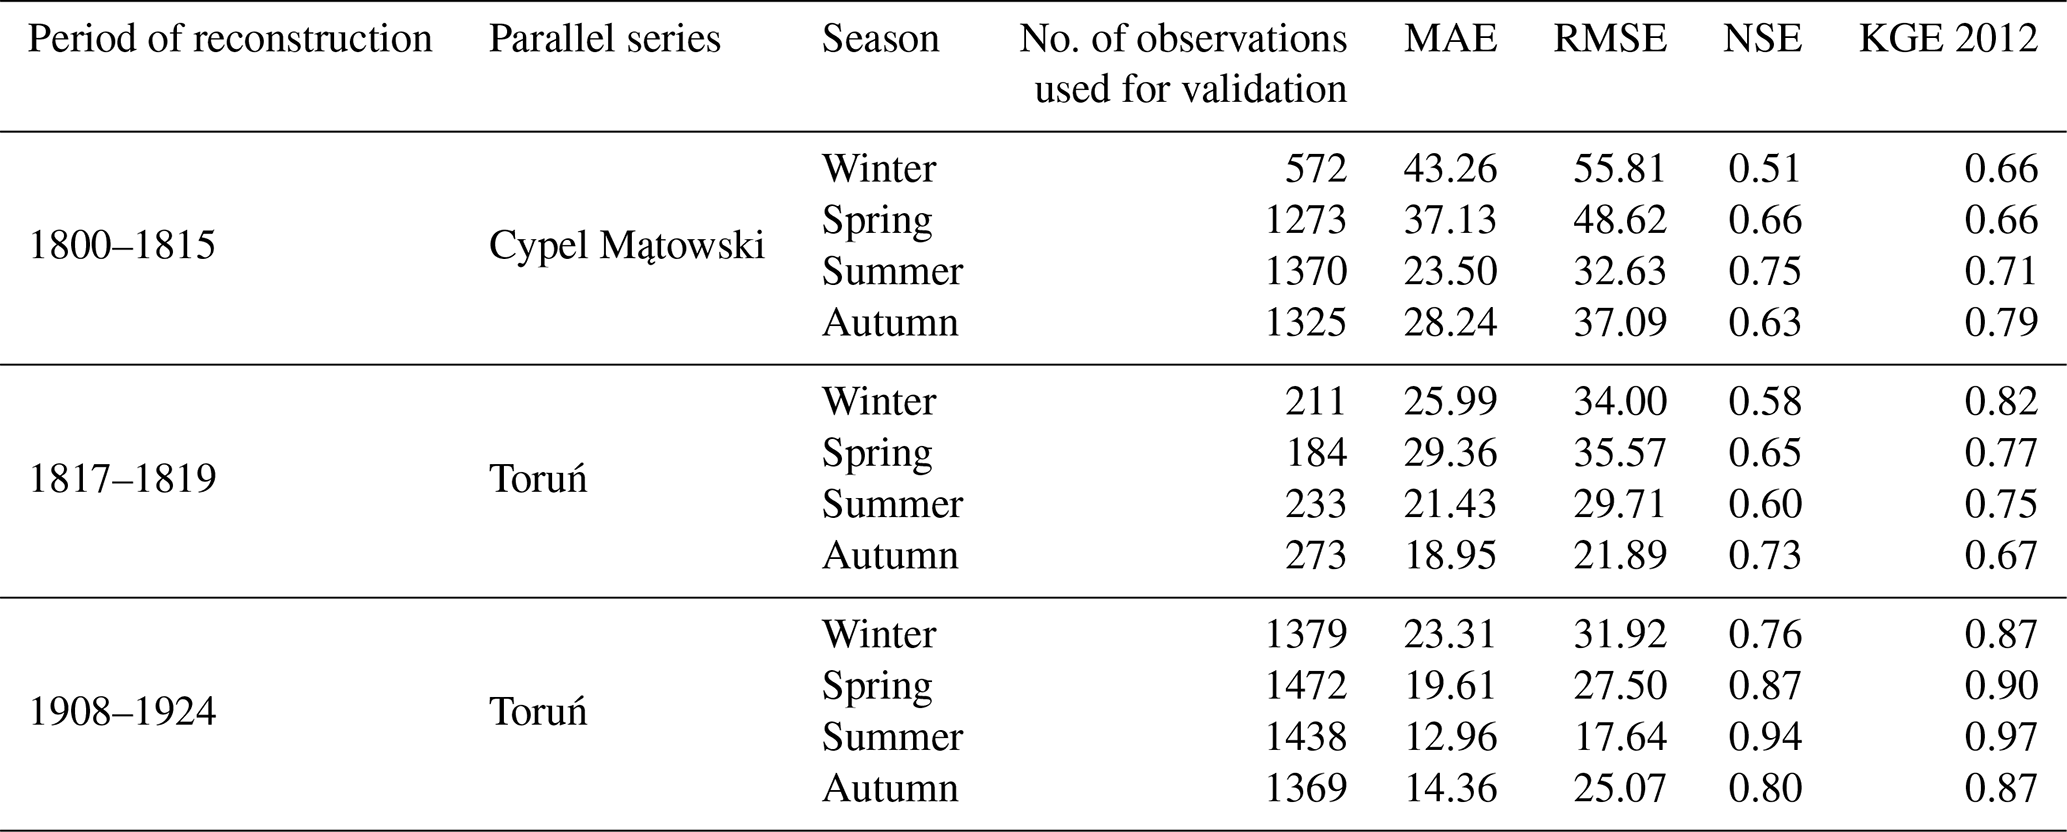
Model performance was evaluated using four complementary metrics: mean absolute error (MAE), root mean square error (RMSE), Nash–Sutcliffe efficiency (NSE) (Nash and Sutcliffe, 1970; McCuen et al., 2006) and Kling–Gupta efficiency (KGE) (Gupta et al., 2009; Kling et al., 2012). MAE measured the average magnitude of daily reconstruction errors. RMSE gave greater weight to larger errors. NSE assessed the ability of the model to reproduce the observed hydrograph relative to a mean-value benchmark, while KGE provided a broader hydrological efficiency measure combining correlation, bias, and variability components. The final model specification was selected not solely on the basis of the lowest daily error, but on the best balance between pointwise accuracy and preservation of hydrograph dynamics. The selected model used a centered input window and included both cyclic seasonality variables and the day-to-day stage-change feature. This configuration was chosen because it provided the strongest overall balance between reconstruction accuracy and hydrograph-level fidelity. The LSTM models achieved good overall predictive performance for the Warsaw series. Detailed results for the tested models are reported in Table 5.
Table 5Predictive performance of the LSTM reconstruction models.

3.9.2 Uncertainty in reconstructed data gaps
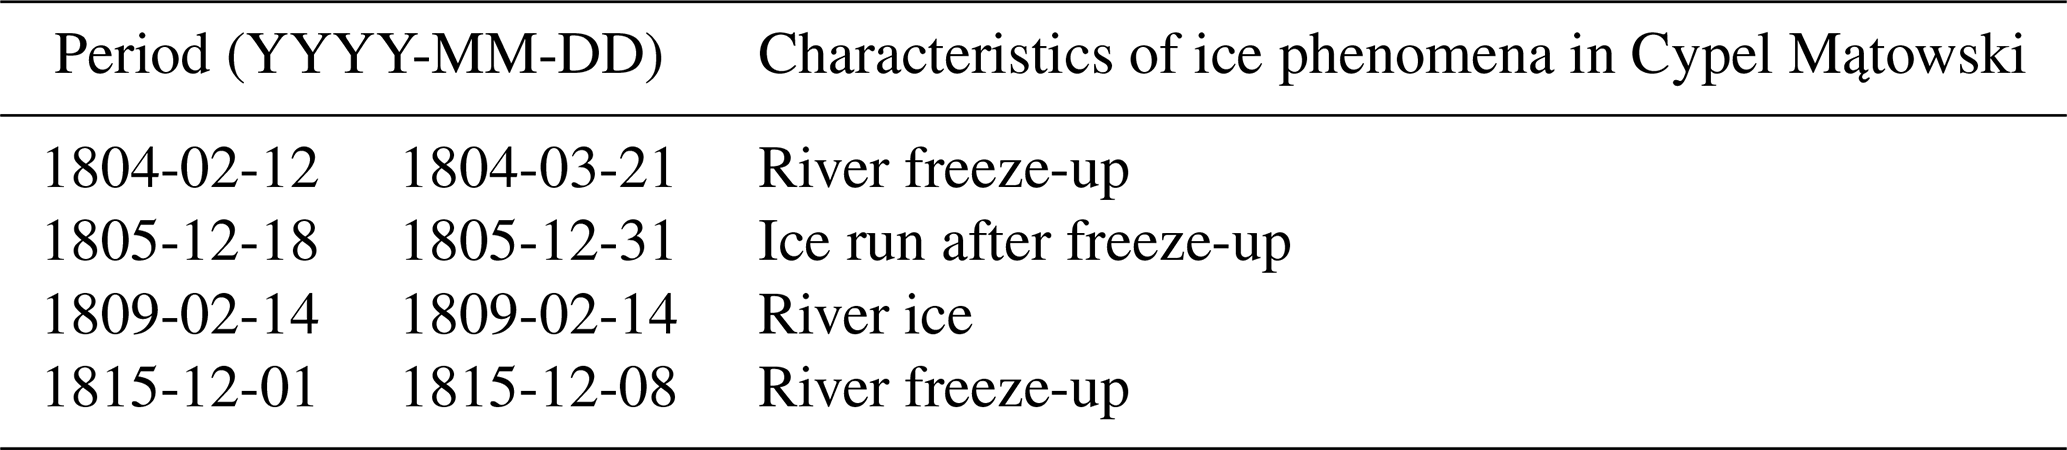
During the reconstruction of water levels for the Vistula River in Warsaw using LSTM models based on inter-gauge relationship, several difficulties were encountered in winter periods of the years 1804, 1805, 1809, and 1815. These difficulties were most likely related to ice phenomena, which could disrupt flow conditions and distort the hydrological relationship between gauging stations (Kiciński et al., 1994). According to Byczkowski (1996), winter ice phenomena tend to raise water levels both within and upstream of the affected river section. If the magnitude of this backwater effect ΔH is similar at both gauging stations, the gauge-to-gauge relationship remains stable. However, if the ice phenomena occur only at one station, or their effect differs significantly between the two, the relationship becomes less reliable.
Such variability must be taken into account, as the timing, duration, and hydraulic impact of ice phenomena may differ between the middle course of the Vistula in Warsaw and its lower course near Toruń or Cypel Mątowski. In several of the examined winter periods, the reconstructed water levels for Warsaw deviated markedly from the adjacent observed values before and after the missing intervals. These deviations often manifested as abrupt upward shifts, inconsistent with the surrounding daily data. This suggests a high degree of uncertainty in the reconstructed water levels for those specific periods. In all four winters, 1804, 1805, 1809, and 1815, where reconstruction uncertainty was identified, independent ice phenomena were reported in Cypel Mątowski. Information about the presence of ice conditions during this time is well documented for both Cypel Mątowski (Kazusek, 2025) and Warsaw (Kolberg, 1861; see Table 6).
Table 6Periods of uncertainty in the reconstruction of water levels for the Vistula River in Warsaw.
To assess whether these uncertainties were limited to individual problematic winters or reflected a broader seasonal pattern, the validation results were additionally summarized by season for all LSTM reconstructions (see Table 7). The comparison shows that reconstruction accuracy was not uniform throughout the year. In the Cypel Mątowski 1800–1815 model, winter produced the highest errors, with MAE reaching 43.26 cm and RMSE 55.81 cm, while summer was reconstructed much more accurately, with MAE of 23.50 cm and RMSE of 32.63 cm. A similar seasonal contrast is visible in the Toruń 1908–1924 model, where winter again had the highest seasonal MAE, whereas summer showed the best performance, with the lowest errors and the highest efficiency scores. The short Toruń 1817–1819 validation period shows a less regular pattern, probably because it is more sensitive to individual hydrological episodes. In this case, spring produced the largest MAE, while autumn had the lowest absolute errors but also a lower KGE value than the other seasons. This suggests that, in short validation windows, individual events may have a stronger influence on seasonal performance metrics. Nevertheless, the broader pattern remains consistent: the most accurate reconstructions were generally obtained during summer and early autumn, whereas winter and spring were more problematic. These results support the interpretation that uncertainty in the reconstructed gaps had a seasonal component. The greatest risk of reconstruction error occurred during periods when local ice effects, backwater conditions, snowmelt, or rapid hydrological changes could disturb the relationship between the reference station and Warsaw. Therefore, the winter reconstructions for 1804, 1805, 1809, and 1815 should be treated with particular caution, even though the overall validation results indicate that the LSTM models performed well at the annual scale.
Table 7Seasonal validation metrics for LSTM-based water-level reconstructions.
3.9.3 Quality and accuracy of measurements
To assess the accuracy of water level measurements, we proposed two indicators: Unique Daily Values (UDV) and Days Without Change (DWC). UDV measures the number of unique daily water level values (in cm) recorded within a given year, while DWC counts the number of instances where the same value was reported on consecutive days. We assume that increasing measurement precision should result in a higher number of unique values, reflecting less rounding, and a lower number of unchanged days, due to the detection of smaller water level fluctuations. The results are presented in Fig. 3. Panel (A) shows year-by-year changes in UDV, while panel (B) presents trends in DWC.
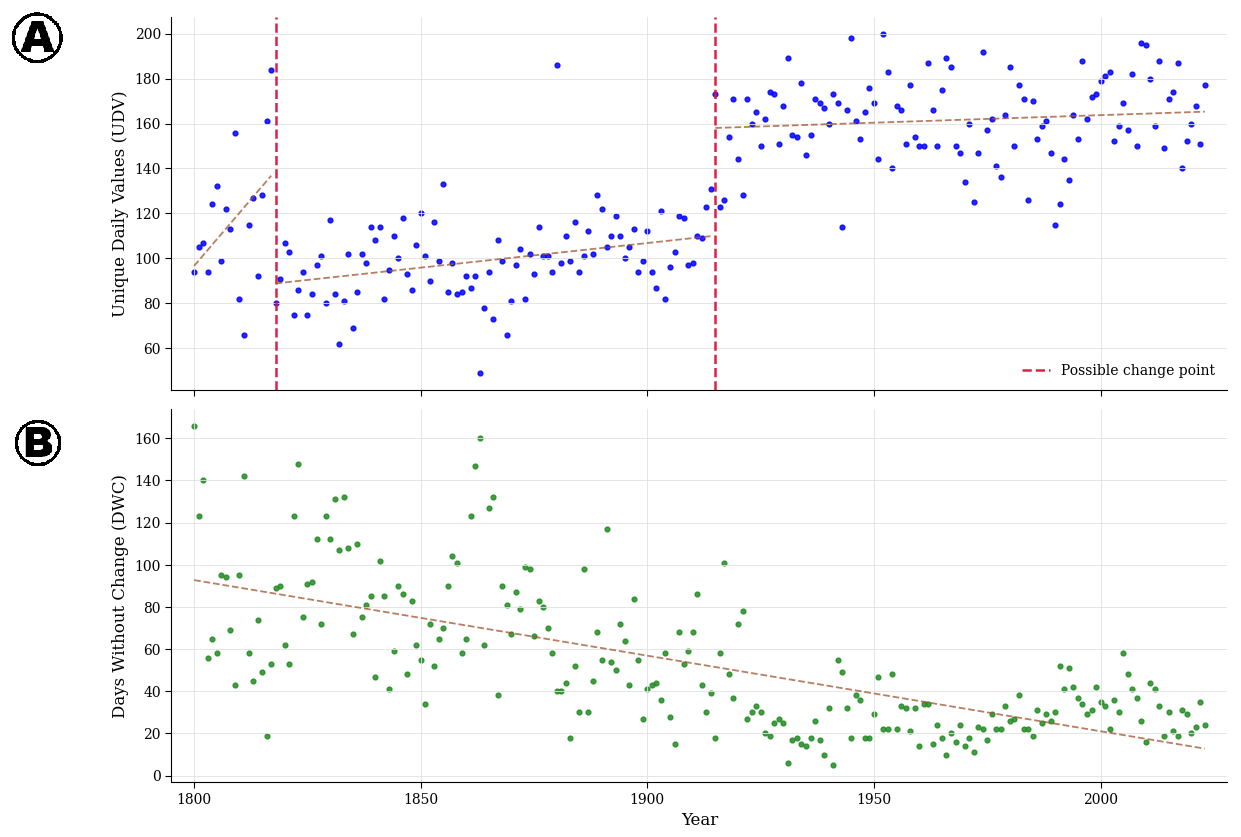
Figure 3Annual number of Unique Daily Values (A) and Days Without Change (B) in water level observations, 1800–2023.
We applied the Standard Normal Homogeneity Test (SNHT) to the UDV and DWC metrics. Prior to conducting the test, we removed the linear trend from the annual UDV and DWC series in order to focus on potential abrupt changes in data characteristics unrelated to gradual improvements in measurement precision or data processing. In case of UDV metric the results identified two statistically significant change points: the year 1818, with a test statistic value of 26.4, and the year 1915, with a value of 18.42. Based on critical values provided by Khaliq and Ouarda (2007), where the threshold at the 99 % confidence level for a series with over 200 observations is 12.982, both change points can be considered statistically significant. The first point, 1818, marks the beginning of uninterrupted daily records in our dataset, as earlier years (1799–1817) contained gaps that were reconstructed using data from other gauges (1964 of 5305 d; 37 %). The second point, 1915, corresponds to the historical switch of the Warsaw gauge to the metric system, a transition likely associated with changes in measurement resolution. This division is further supported by Welch's t tests, which confirmed significant differences between periods in both UDV and DWC indicators.
The average number of UDV was significantly higher in the period 1916–2023 (Mean = 162, Standard Deviation = 18) compared to 1800–1915 (M=103, SD = 22). Welch's t test confirmed that the difference between these periods is statistically significant (, p<0.001, df = 220.28). In the case of DWC, we observed a marked decline in the number of days without change: 1916–2023 (M=30, SD = 15) versus 1800–1915 (M=74, SD = 33). Again, Welch's t test indicated a statistically significant difference (t=13.26, p<0.001, df = 160.59).
The identification of two potential change points, around 1818 and 1915, divides our dataset into three distinct periods: 1799–1818, 1819–1915, and 1916–2024. The high precision of daily measurements observed in the early part of our dataset (1799–1817) can likely be explained by the use of data from the gauge at Cypel Mątowski, located on the lower Vistula River. To verify this hypothesis, we compared UDV index for the Cypel Mątowski and Warsaw stations using Welch's t test for independent samples. We conducted three comparisons:
-
Cypel Mątowski 1800–1828 vs. Warsaw 1800–1828. For the first 18 years of this period, about 37 % of daily observations in Warsaw were interpolated based on data from Cypel Mątowski (Warsaw: M=103, SD = 21; Cypel Mątowski: M=130, SD = 16; , df = 51.79, p<0.001);
-
Cypel Mątowski 1800–1828 vs. Warsaw 1818–1846. The first period in which Warsaw's series contains no missing values and thus no interpolations (Warsaw: M=94, SD = 15; Cypel Mątowski: M=130, SD = 16; , df = 55.84, p<0.001);
-
Cypel Mątowski 1800–1828 vs. Warsaw 1886–1914. The last period before Warsaw switched to the metric system in 1915 (Warsaw: M=107, SD = 11.5; Cypel Mątowski: M=130, SD = 16; , df = 51.06, p<0.001).
In each case, the UDV index was consistently higher for Cypel Mątowski than for Warsaw, indicating greater measurement resolution. Welch's t test confirmed that these differences were statistically significant, providing strong evidence that the early precision seen in Warsaw was due to the influence of interpolated values based on a more finely resolved gauge.
The fitted trend line for the years 1818–1915 reveals a gradual increase in measurement precision, as indicated by the steady rise in the annual number of UDV. The linear trend shows a growth rate of approximately 0.24 UDV units per year, reflecting progressive improvements in manual measurement practices throughout the 19th century. In contrast, after 1915, when the Warsaw gauge transitioned to the metric system, the data show no significant upward trend in measurement precision, despite the implementation of more advanced technologies, such as limnigraphs, continuous recording, and later electronic sensors. This suggests that the shift to metric units brought about an immediate structural improvement in data resolution, but further technological innovations did not translate into a continued increase in the number of unique daily values recorded per year.
To further assess the impact of the transition to the metric system on measurement resolution, we conducted a simulation experiment. Our aim was to evaluate how the UDV indicator would behave if modern 20th- and 21st-century measurements had been recorded using pre-metric units. We used data from the period 1916–2023, consisting of nearly 40 000 daily observations, originally recorded in metric units with a precision of 1 cm. We converted these values into the New Polish units cal, defined as 1 cal = 2.4 cm. The simulation was performed under two rounding scenarios:
Variant 1: values were rounded to the nearest full cal (precision: 2.4 cm),
Variant 2: values were rounded to the nearest half cal (precision: 1.2 cm).
After rounding, we reconverted the values back to cm and rounded them to full cm, mimicking the historical reporting process. We then recalculated the UDV index for both variants and compared the results to the original metric dataset. The simulation showed that in Variant 1, the loss of precision was substantial, with the UDV reduced by an average of nearly 40 %. In Variant 2, the reduction was smaller but still notable, around 10 %. These findings clearly demonstrate how the resolution of measurement units directly affects the quality and interpretability of long-term hydrological records. As shown in Fig. 4, if river levels in the 20th and 21st centuries had still been recorded in non-metric units with a precision close to 1 cal (2.4 cm), then despite the technical progress in measuring instruments the effective resolution of these measurements would have been comparable to that of the 19th century.
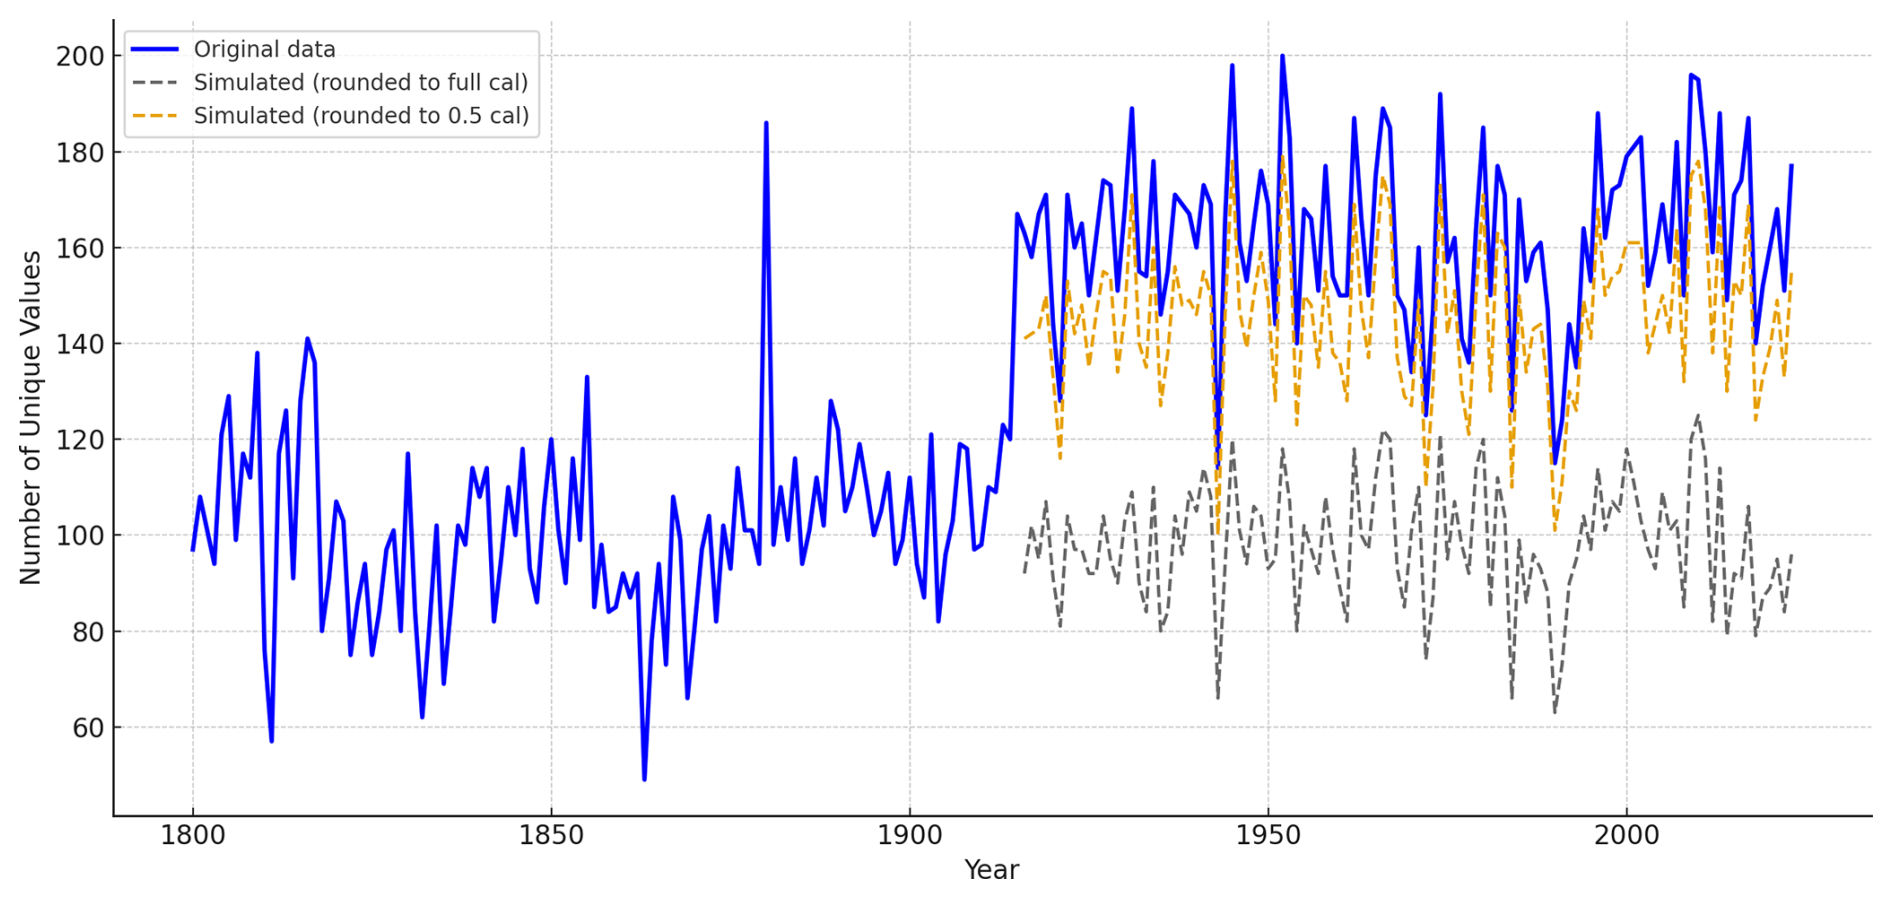
Figure 4UDV index, based on historical Vistula River measurements and simulations, 1800–2023.
Although the SNHT identified two potential shifts in measurement precision, around 1818 and 1915, we consider the dataset to be internally harmonized with respect to documented changes in the observation system. This harmonization was achieved by identifying the locations of historical water gauges in Warsaw, correcting changes in gauge-zero reference levels, converting all observations to metric units, and linking the historical records with the currently operating Warsaw-Boulevards gauge. Nevertheless, nineteenth-century measurements remain less precise than modern observations, with an approximate resolution of 25 mm compared with 10 mm today, and this difference should be considered in analyses sensitive to small day-to-day variations. Importantly, internal harmonization of the measurement series does not imply hydraulic stationarity. Long-term changes in channel morphology, particularly progressive channel incision since the 1940s, have altered the relationship between stage and discharge. Consequently, long-term trends in water level, especially those involving low stages, should not be interpreted directly as equivalent trends in river discharge or climatic forcing. Subject to these limitations, the dataset provides a consistent basis for robust scientific analysis.
The exceptional length, daily resolution, and continuity of the Warsaw water-level record make it a valuable source for hydrological, environmental, historical, and methodological research. The series documents more than two centuries of variation in river stage at a reach affected by both hydrological processes and long-term transformations of the channel. This dual sensitivity is scientifically valuable, but it also requires careful interpretation. Although documented changes in measurement units, gauge location, and gauge-zero reference levels have been corrected, the hydraulic characteristics of the Warsaw reach have evolved over time. In particular, progressive channel incision since the mid-twentieth century has altered the stage–discharge relationship, causing similar discharges to correspond to lower stages in the later part of the record. Long-term trends in recorded stage should therefore not be interpreted directly as equivalent trends in discharge or as evidence of climatic drying.
The record is particularly suitable for studying the chronology, seasonality, duration, and short-term dynamics of hydrological events, as well as variability within periods characterised by relatively stable hydraulic conditions. Its daily resolution also facilitates integration with historical, meteorological, demographic, and socio-economic sources, for example in studies of societal responses to floods, low-water episodes, ice phenomena, and changes in river use (e.g. Sobechowicz et al., 2025b).
The series may additionally support investigations of changes in measurement practice, data quality, gap-reconstruction methods, and the historical evolution of the Warsaw river reach. Comparisons of the absolute magnitude of stages between distant periods require greater caution. Historical floods and low-water episodes can be identified and dated from the record, but their corresponding discharges cannot be inferred without period-specific rating curves or hydraulic reconstruction. Similarly, analyses based on fixed stage thresholds, flood-frequency estimation, or direct attribution of long-term stage trends to climatic forcing should not be conducted for the entire series without accounting for changes in channel morphology. Statistical and machine-learning applications should use temporally structured validation and assess model transferability between different historical periods. Models intended to represent discharge should incorporate independent discharge measurements, period-specific stage–discharge relationships, or an explicit hydraulic component. Analyses based solely on stage may instead focus on event timing, hydrograph shape, relative variability within hydraulically comparable periods, or local water-level forecasting.
The complete and open-access dataset has been published in https://doi.org/10.5281/zenodo.16919654 (Sobechowicz et al., 2025a).
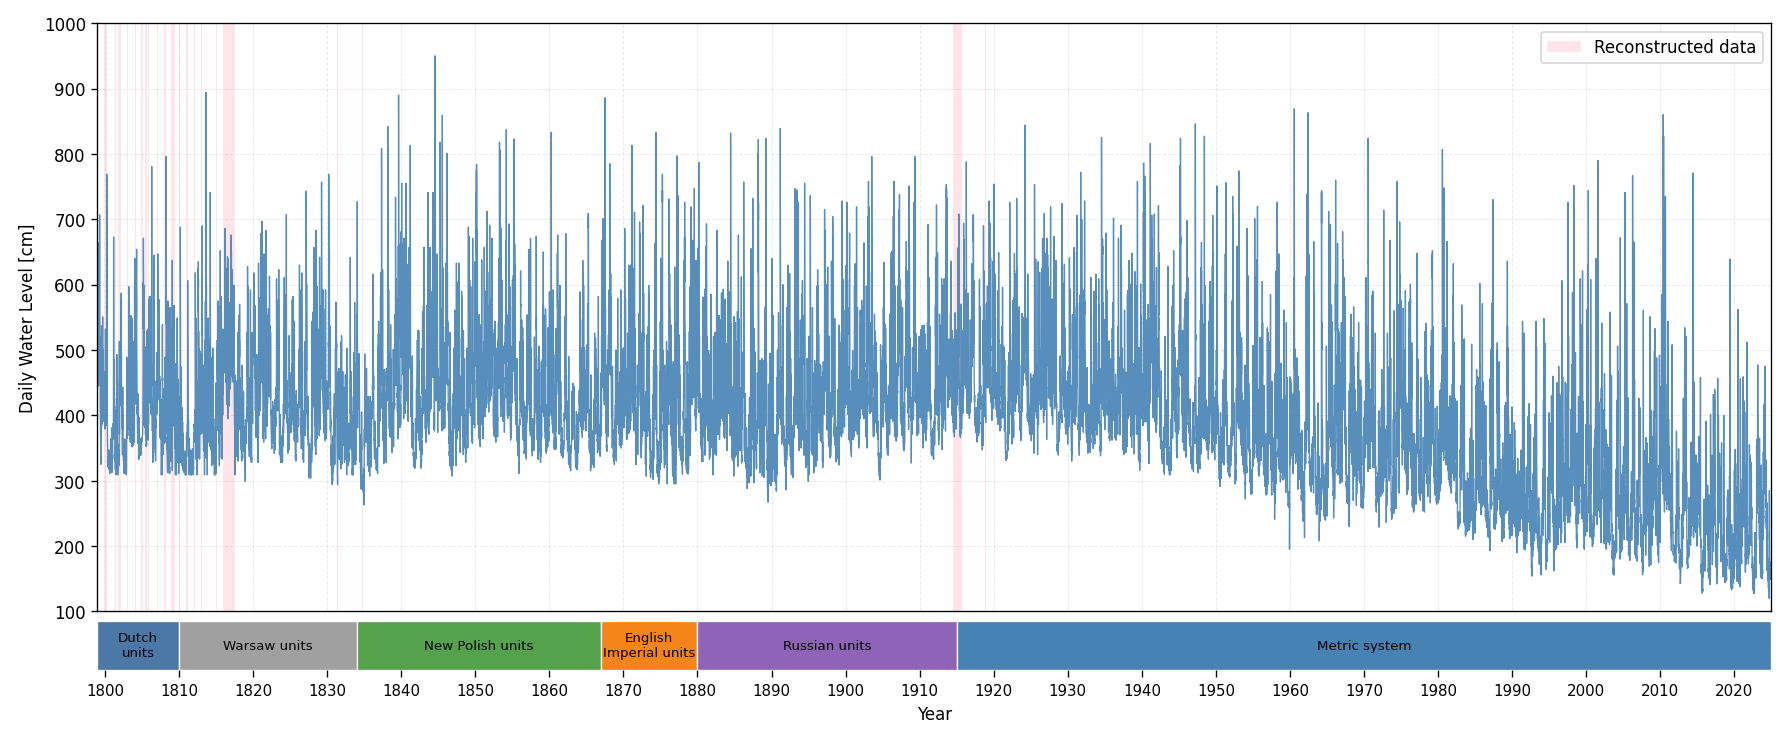
This study presents a homogenized and gap-free daily water-level series for the Vistula River at Warsaw covering the period from 1 February 1799 to 31 October 2024 and comprising 82 453 daily observations (see Fig. 5). The reconstruction integrates fragmented historical sources, standardises changing measurement units and calendar systems, corrects documented changes in gauge location and reference level, and fills 2374 missing days using LSTM models or linear interpolation. Model validation indicates generally good reconstruction performance, although selected winter gaps and the earliest observations remain subject to greater uncertainty. The resulting dataset is internally harmonized with respect to the documented observation systems, but it should not be assumed to be hydraulically stationary over the entire period. In particular, progressive channel incision since the 1940s has altered the relationship between stage and discharge in the Warsaw reach. Subject to this limitation, as well as to changes in measurement precision and uncertainty associated with reconstructed observations, the series provides a valuable basis for hydrological, environmental, historical, and modelling research.
The supplement related to this article is available online at https://doi.org/10.5194/essd-18-6101-2026-supplement.
ŁS conceived the study, performed the formal analysis, methodology and led the writing of the manuscript (original draft preparation; review and editing). DB contributed to the study design, data curation, methodology, and writing (original draft preparation; review and editing). EK contributed to data curation, formal analysis, methodology, and writing (original draft preparation; review and editing). MN contributed to data curation and writing (review and editing). WAS contributed to data curation and writing (review and editing). MW contributed to data curation, formal analysis, methodology, and writing (original draft preparation; review and editing). JW contributed to data curation and writing (review and editing).
The contact author has declared that none of the authors has any competing interests.
Publisher's note: Copernicus Publications remains neutral with regard to jurisdictional claims made in the text, published maps, institutional affiliations, or any other geographical representation in this paper. The authors bear the ultimate responsibility for providing appropriate place names. Views expressed in the text are those of the authors and do not necessarily reflect the views of the publisher.
We would like to note that, to improve the clarity and linguistic consistency of selected parts of the text, we used a language tool based on artificial intelligence (ChatGPT). These edits were purely linguistic and did not affect the scientific content of the work. The scientific interpretation of the results and the underlying analyses remain entirely the responsibility of the authors.
This research has been supported by the National Science Centre, Poland (grant no. 2022/47/D/HS3/02947).
This paper was edited by Sibylle K. Hassler and reviewed by two anonymous referees.
Biernacki, Z.: Geomorphology and Surface Waters, in: The Vistula in Warsaw, edited by: J. Lickiewicz, J. Pawlak, and W. Pietrusiewicz, Office of the Capital City of Warsaw, Department of Spatial Planning and Architecture, Warsaw, 22–70, https://architektura.um.warszawa.pl/documents/12025039/26157681/Wisla_w_Warszawie_0.pdf/b1db8df9-e04e-4f10-9f0f-44ac20901c6d?t=1634497946935 (last access: 21 August 2026), 2000 (in Polish).
Bogdanowicz, E., Fal, B., and Dobrzyńska, I.: Hydrological Characteristics, in: The Vistula in Warsaw, edited by J. Lickiewicz, J. Pawlak, and W. Pietrusiewicz, Office of the Capital City of Warsaw, Department of Spatial Planning and Architecture, Warsaw, 9–13, https://architektura.um.warszawa.pl/documents/12025039/26157681/Wisla_w_Warszawie_0.pdf/b1db8df9-e04e-4f10-9f0f-44ac20901c6d?t=1634497946935 (last access: 21 August 2026), 2000 (in Polish).
Brázdil, R., Kundzewicz, Z. W., and Benito G.: Historical hydrology for studying flood risk in Europe, Hydrological Sciences–Journal–des Sciences Hydrologiques, 51, 739–764, https://doi.org/10.1623/hysj.51.5.739, 2006.
Brönnimann, S., Frigerio, L., Schwander, M., Rohrer, M., Stucki, P., and Franke, J.: Causes of increased flood frequency in central Europe in the 19th century, Clim. Past, 15, 1395–1409, https://doi.org/10.5194/cp-15-1395-2019, 2019.
Byczkowski, A.: Hydrology, Vol. I, Wydawnictwo SGGW, Warsaw, 375 pp., ISBN 83-00-02925-7, 1996 (in Polish).
Cyberski, J., Grześ, M., Gutry-Korycka, M., Nachlik, E., and Kundzewicz, Z. W.: History of floods on the River Vistula, Hydrological Sciences–Journal–des Sciences Hydrologiques, 51, 799–817, https://doi.org/10.1623/hysj.51.5.799, 2006.
Fal, B. and Dąbrowski, P.: Two Hundred Years of Hydrological Observations and Measurements of the Vistula River in Warsaw. Part I: Water Level Observations, Gospodarka Wodna, 11, 461–467, 2001a (in Polish).
Fal, B. and Dąbrowski, P.: Two Hundred Years of Hydrological Observations and Measurements of the Vistula River in Warsaw. Part II: Vistula River Discharge in Warsaw, Gospodarka Wodna, 12, 503–510, 2001b (in Polish).
Glaser, R. and Stangl, H.: Climate and floods in Central Europe since AD 1000: Data, Methods, Results and Consequences, Surv. Geophys., 25, 485–510, https://doi.org/10.1007/s10712-004-6201-y, 2004.
Gupta, H., Kling, H., Yilmaz, K., and Martinez G.: Decomposition of the mean squared error and NSE performance criteria: Implications for improving hydrological modelling, J. Hydrol., 377, https://doi.org/10.1016/j.jhydrol.2009.08.003, 2009.
Gutry-Korycka, M.: Catastrophic Floods of the Vistula River Downstream of Warsaw: A Historical Overview, in: Hydrology in Environmental Protection and Management, edited by: Magnuszewski, A., vol. 2, Polish Academy of Sciences, Committee on Environmental Engineering, Monographs, 69, 93–108, 2010 (in Polish).
Herget, J. and Meurs H.: Reconstructing peak discharges for historic flood levels in the city of Cologne, Germany, Global Planet. Change, 70, 108–116, https://doi.org/10.1016/j.gloplacha.2009.11.011, 2010.
Hochreiter, S. and Schmidhuber, J.: Long Short-Term Memory, Neural Comput., 9, https://doi.org/10.1162/neco.1997.9.8.1735, 1997.
Hydrographic Yearbook 1919: Water-Gauge Observations. Vistula River Basin, Ministry of Public Works, Warsaw, 1920 (in Polish).
Hydrographic Yearbook 1920: Water-Gauge Observations. Vistula River Basin, Ministry of Public Works, Warsaw, 1921 (in Polish).
Hydrographic Yearbook 1921: Water-Gauge Observations. Vistula River Basin, Ministry of Public Works, Warsaw, 1922 (in Polish).
Hydrographic Yearbook 1922: Vistula River Basin, Ministry of Public Works, Warsaw, 1923 (in Polish).
Hydrographic Yearbook 1923: Vistula River Basin, Ministry of Public Works, Warsaw, 1925 (in Polish).
Hydrographic Yearbook 1924: Vistula River Basin, Ministry of Public Works, Warsaw, 1925 (in Polish).
Hydrographic Yearbook 1925: Vistula River Basin, Ministry of Public Works, Warsaw, 1927 (in Polish).
Hydrographic Yearbook 1926: Vistula River Basin, Ministry of Public Works, Warsaw, 1929 (in Polish).
Hydrographic Yearbook 1927: Vistula River Basin, Ministry of Public Works, Warsaw, 1930 (in Polish).
Hydrographic Yearbook 1928: Vistula River Basin, Ministry of Public Works, Warsaw, 1930 (in Polish).
Hydrographic Yearbook 1929: Vistula River Basin, Ministry of Transport, Warsaw, 1932 (in Polish).
Hydrographic Yearbook 1930: Vistula River Basin, Ministry of Transport, Warsaw, 1933 (in Polish).
Hydrographic Yearbook 1931: Vistula River Basin, Ministry of Transport, Warsaw, 1936 (in Polish).
Hydrographic Yearbook 1932: Vistula River Basin, Ministry of Transport, Warsaw, 1936. (in Polish)
Hydrographic Yearbook 1933: Vistula River Basin, Ministry of Transport, Warsaw, 1936 (in Polish).
Hydrographic Yearbook 1934: Vistula River Basin, Ministry of Transport, Warsaw, 1939 (in Polish).
Hydrographic Yearbook 1938: Vistula River Basin, Transport Publications, 1953 (in Polish).
Hydrographic Yearbook 1939–1941: Vistula River Basin, Transport and Communications Publishing House, 1962 (in Polish).
Hydrographic Yearbook 1942–1944: Vistula River Basin, Transport and Communications Publishing House, 1962 (in Polish).
Hydrographic Yearbook 1945: The Vistula River and Coastal Rivers East of the Vistula, State Hydrological and Meteorological Institute, Warsaw, 1950 (in Polish).
Hydrographic Yearbook 1946: The Vistula River and Coastal Rivers East of the Vistula, State Hydrological and Meteorological Institute, Warsaw, 1952 (in Polish).
Hydrographic Yearbook 1947: The Vistula River and Coastal Rivers East of the Vistula, Transport Publications, Warsaw, 1953 (in Polish).
Hydrographic Yearbook 1948: The Vistula River and Coastal Rivers East of the Vistula, Transport Publications, Warsaw, 1954 (in Polish).
Hydrographic Yearbook 1949: The Vistula River and Coastal Rivers East of the Vistula, Transport Publications, Warsaw, 1954 (in Polish).
Hydrographic Yearbook 1950: The Vistula River and Coastal Rivers East of the Vistula, Transport Publications, Warsaw, 1955 (in Polish).
Hydrographic Yearbook 1951: The Vistula River and Coastal Rivers East of the Vistula, Transport Publications, Warsaw, 1957 (in Polish).
Hydrographic Yearbook 1952: The Vistula River and Coastal Rivers East of the Vistula, Transport Publications, Warsaw, 1958 (in Polish).
Hydrographic Yearbook 1953: The Vistula River and Coastal Rivers East of the Vistula, Transport Publications, Warsaw, 1958 (in Polish).
Hydrographic Yearbook 1954: The Vistula River and Coastal Rivers East of the Vistula, Transport Publications, Warsaw, 1959 (in Polish).
Hydrographic Yearbook 1955: The Vistula River and Coastal Rivers East of the Vistula, Transport Publications, Warsaw, 1959 (in Polish).
Hydrographic Yearbook 1956: The Vistula River and Coastal Rivers East of the Vistula, Transport Publications, Warsaw, 1961 (in Polish).
Hydrographic Yearbook 1957: The Vistula River and Coastal Rivers East of the Vistula, Transport Publications, Warsaw, 1962 (in Polish).
Hydrographic Yearbook 1958. The Vistula River and Coastal Rivers East of the Vistula, Transport Publications, Warsaw, (in Polish), 1963.
Hydrographic Yearbook 1959: The Vistula River and Coastal Rivers East of the Vistula, Transport Publications, Warsaw, 1964 (in Polish).
Hydrographic Yearbook 1960: The Vistula River and Coastal Rivers East of the Vistula, Transport Publications, Warsaw, 1965 (in Polish).
Hydrological Yearbook of Surface Waters: Vistula River Basin and Coastal Rivers East of the Vistula YYYY, Transport and Communications Publishing House, Warsaw, 1961–1980 (in Polish).
Hydrological Yearbook of Surface Waters: Vistula River Basin and Coastal Rivers East of the Vistula 1961, Transport and Communications Publishing House, Warsaw, 1966 (in Polish).
Hydrological Yearbook of Surface Waters: Vistula River Basin and Coastal Rivers East of the Vistula 1962, Transport and Communications Publishing House, Warsaw, 1967 (in Polish).
Hydrological Yearbook of Surface Waters: Vistula River Basin and Coastal Rivers East of the Vistula 1963, Transport and Communications Publishing House, Warsaw, 1968 (in Polish).
Hydrological Yearbook of Surface Waters: Vistula River Basin and Coastal Rivers East of the Vistula 1964, Transport and Communications Publishing House, Warsaw, 1969 (in Polish).
Hydrological Yearbook of Surface Waters: Vistula River Basin and Coastal Rivers East of the Vistula 1965, Transport and Communications Publishing House, Warsaw, 1969 (in Polish).
Hydrological Yearbook of Surface Waters: Vistula River Basin and Coastal Rivers East of the Vistula 1966, Transport and Communications Publishing House, Warsaw, 1970 (in Polish).
Hydrological Yearbook of Surface Waters: Vistula River Basin and Coastal Rivers East of the Vistula 1967, Transport and Communications Publishing House, Warsaw, 1971 (in Polish).
Hydrological Yearbook of Surface Waters: Vistula River Basin and Coastal Rivers East of the Vistula 1968, Transport and Communications Publishing House, Warsaw, 1971 (in Polish).
Hydrological Yearbook of Surface Waters: Vistula River Basin and Coastal Rivers East of the Vistula 1969, Transport and Communications Publishing House, Warsaw, 1972 (in Polish).
Hydrological Yearbook of Surface Waters: Vistula River Basin and Coastal Rivers East of the Vistula 1970, Transport and Communications Publishing House, Warsaw, 1973 (in Polish).
Hydrological Yearbook of Surface Waters: Vistula River Basin and Coastal Rivers East of the Vistula 1971, Transport and Communications Publishing House, Warsaw, 1974 (in Polish).
Hydrological Yearbook of Surface Waters: Vistula River Basin and Coastal Rivers East of the Vistula 1972, Transport and Communications Publishing House, Warsaw, 1975 (in Polish).
Hydrological Yearbook of Surface Waters: Vistula River Basin and Coastal Rivers East of the Vistula 1973, Transport and Communications Publishing House, Warsaw, 1976 (in Polish).
Hydrological Yearbook of Surface Waters: Vistula River Basin and Coastal Rivers East of the Vistula 1974, Transport and Communications Publishing House, Warsaw, 1977 (in Polish).
Hydrological Yearbook of Surface Waters: Vistula River Basin and Coastal Rivers East of the Vistula 1975, Transport and Communications Publishing House, Warsaw, 1979 (in Polish).
Hydrological Yearbook of Surface Waters: Vistula River Basin and Coastal Rivers East of the Vistula 1976, Transport and Communications Publishing House, Warsaw, 1980 (in Polish).
Hydrological Yearbook of Surface Waters: Vistula River Basin and Coastal Rivers East of the Vistula 1977, Transport and Communications Publishing House, Warsaw, 1981 (in Polish).
Hydrological Yearbook of Surface Waters: Vistula River Basin and Coastal Rivers East of the Vistula 1978, Transport and Communications Publishing House, Warsaw, 1982 (in Polish).
Hydrological Yearbook of Surface Waters: Vistula River Basin and Coastal Rivers East of the Vistula 1979, Transport and Communications Publishing House, Warsaw, 1984 (in Polish).
Hydrological Yearbook of Surface Waters: Vistula River Basin and Coastal Rivers East of the Vistula 1980, Transport and Communications Publishing House, Warsaw, 1985 (in Polish).
IMGW: Index of /data/dane_pomiarowo_obserwacyjne, https://danepubliczne.imgw.pl/data/dane_pomiarowo_obserwacyjne/, last access: 1 September 2025.
Jacewicz, A.: Assessment and Proposal for the Hydrotechnical Development of the Vistula River Channel, in: The Vistula in Warsaw, edited by: Lickiewicz, J., Pawlak, J., and Pietrusiewicz, W., Office of the Capital City of Warsaw, Department of Spatial Planning and Architecture, Warsaw, 154–171, 2000 (in Polish).
Jahrbuch für die Gewässerkunde des Weichselgebiets: Wässerstände und niederschläge der kalenderjahre 1935, 1936, 1937, Hydrographisches Institut, Warsachu, 1941.
Jahrbuch für die Gewässerkunde Norddeutschlands: Abflussjahr 1912, Heft 1, Memel–, Pregel– und Weichsel–Gebiet, Herausgegeben von der Preußischen Landesanstalt für Gewässerkunde, Ernst Siegfried Mittler und Sohn: Königliche Hofbuchhandlung, Berlin, 1916a.
Jahrbuch für die Gewässerkunde Norddeutschlands: Abflussjahr 1913, Heft 1, Memel–, Pregel– und Weichsel–Gebiet, Herausgegeben von der Preußischen Landesanstalt für Gewässerkunde, Ernst Siegfried Mittler und Sohn : Königliche Hofbuchhandlung, Berlin, 1916b.
Jahrbuch für die Gewässerkunde Norddeutschlands: Abflussjahr 1914, Heft 1, Memel–, Pregel– und Weichsel–Gebiet, Herausgegeben von der Preußischen Landesanstalt für Gewässerkunde, Ernst Siegfried Mittler und Sohn, Buchdruckerei Gm.b.H., Berlin, 1922a.
Jahrbuch für die Gewässerkunde Norddeutschlands: Abflussjahr 1915, Heft 1, Memel–, Pregel– und Weichsel–Gebiet, Herausgegeben von der Preußischen Landesanstalt für Gewässerkunde, Ernst Siegfried Mittler und Sohn, Buchdruckerei Gm.b.H., Berlin, 1922b.
Jankowski, W. and Stolarska, A.: Assessment of the Possibility of a Millennium Flood Wave Occurring in the Warsaw Area, Research Materials, Series: Hydrology and Oceanology, Institute of Meteorology and Water Management (IMGW), Warsaw, 1978 (in Polish).
Kazusek, S.: Hydrological Conditions and Navigation Feasibility of the Vistula River near Mątowski Promontory (1800–1828): Insights from Historical and Reconstructed Water Levels, Ice Phenomena, and Wind Resources, Zapiski historyczne, XC, 59, https://doi.org/10.15762/ZH.2025.03, 2025 (in Polish).
Khaliq, M. N. and Ouarda, T. B. M. J.: Short Communication on the critical values of the standard normal homogeneity test (SNHT), Int. J. Climatol., 27, 681–687, https://doi.org/10.1002/joc.1438, 2007.
Kiciński, T., Byczkowski, A., Skrzynecka, J., and Wicher, M.: Materials for Hydrology Exercises, 1994 (in Polish).
Kling, H., Fuchs, M., and Paulin, M.: Runoff conditions in the upper Danube basin under an ensemble of climate change scenarios, J. Hydrol., 424–425, 264–277, https://doi.org/10.1016/j.jhydrol.2012.01.011, 2012.
Kolberg, W.: The Vistula: Its Course, Characteristics, and Navigability, Part II, Jan Jaworski Printing House, Warsaw, 1861 (in Polish).
Kornacki, Z.: Causes of the Lowering of the Vistula River Bed in Warsaw, Gospodarka Wodna, 7, 305–307, 1960 (in Polish).
Kuźniar, P.: The 500-Year Flood in Warsaw in the Light of Historical Sources and Computer Simulations, in: Scientific and Technical Forum – Flood 1997, Institute of Meteorology and Water Management (IMGW), Warsaw, 143–155, 1997 (in Polish).
Kuźniar, P. and Magnuszewski, A.: Flood Flows of the Vistula River in Warsaw – Reconstruction of Historical Floods, in: Hydrology in Environmental Protection and Management, edited by: Magnuszewski, A., vol. 2, Polish Academy of Sciences, Committee on Environmental Engineering, Monographs, 69, 109–118, 2010 (in Polish).
Lang, M., Le Coz, J., Renard, B., and Darienzo, M.: Accounting for historical data uncertainty in flood frequency analysis: the Upper Rhine River, J. Hydrol., 660, 133480, https://doi.org/10.1016/j.jhydrol.2025.133480, 2025.
Macdonald, N. and Sangster, H.: High-magnitude flooding across Britain since AD 1750, Hydrol. Earth Syst. Sci., 21, 1631–1650, https://doi.org/10.5194/hess-21-1631-2017, 2017.
Magnuszewski, A. and Gutry-Korycka, M.: Reconstruction of High-Water Flows of the Vistula River in Warsaw under Natural Conditions, Prace i Studia Geograficzne, 43, 141–151, 2009 (in Polish).
Magnuszewski, A. and Moran, S.: Vistula River bed erosion processes and their influence on Warsaw's flood safety, Proc. IAHS, 367, 147–154, https://doi.org/10.5194/piahs-367-147-2015, 2015.
Magnuszewski, A., Gutry-Korycka, M., and Mikulski, Z.: Historical and Contemporary Conditions of High-Water Flow of the Vistula River in Warsaw. Part I, Gospodarka Wodna, 1, 9–18, 2012 (in Polish).
Makowski, J. and Tomczak, A.: Water Levels of the Vistula River in Toruń in the Light of Measurements from the Last Two Centuries, Scientific Society in Toruń, 2002 (in Polish).
McCuen, R., Knight, Z., and Cutter, A.: Evaluation of the Nash–Sutcliffe Efficiency Index, J. Hydrol. Eng., 11, https://doi.org/10.1061/(ASCE)1084-0699(2006)11:6(597), 2006.
Mikulski, Z.: An Outline of the History of Hydrology in the Polish Lands, in: History of Hydrology, edited by: Biswas, A. K., PWN, Warszawa, 307–369, 1978 (in Polish).
Ministry of Public Works: Instructions for Water Gauge Station Observers, 1923 (in Polish).
Ministry of Ways of Communication of the Russian Empire: Svedeniya o stoyaniyakh urovnya vody v rekakh i ozerakh Evropeyskoy Rossii po nablyudeniyam na 80-ti vodomernykh postakh [Information on water levels in the rivers and lakes of European Russia based on observations at 80 gauging stations], 1881.
Ministry of Ways of Communication of the Russian Empire: Svedeniya ob urovne na vnutrennikh vodnykh putyakh Rossiyskoy Imperii na vodomernykh postakh, uchrezhdennykh Ministerstvom putey soobshcheniya [Information on water levels on the inland waterways of the Russian Empire at gauging stations established by the Ministry of Ways of Communication], vol. 1, 1881–1890, 1907.
Ministry of Ways of Communication of the Russian Empire: Svedeniya ob urovne na vnutrennikh vodnykh putyakh Rossiyskoy Imperii na vodomernykh postakh, uchrezhdennykh Ministerstvom putey soobshcheniya [Information on water levels on the inland waterways of the Russian Empire at gauging stations established by the Ministry of Ways of Communication], vol. 2, 1891–1900, 1909.
Ministry of Ways of Communication of the Russian Empire: Svedeniya ob urovne na vnutrennikh vodnykh putyakh Rossiyskoy Imperii na vodomernykh postakh, uchrezhdennykh Ministerstvom putey soobshcheniya [Information on water levels on the inland waterways of the Russian Empire at gauging stations established by the Ministry of Ways of Communication], vol. 3, 1901–1910, 1915.
Nash, J. and Sutcliffe, J.: River flow forecasting through conceptual models part I – A discussion of principles, J. Hydrol., 10, https://doi.org/10.1016/0022-1694(70)90255-6, 1970.
Nasreen, S., Součková, M., Vargas Godoy, M. R., Singh, U., Markonis, Y., Kumar, R., Rakovec, O., and Hanel, M.: A 500-year annual runoff reconstruction for 14 selected European catchments, Earth Syst. Sci. Data, 14, 4035–4056, https://doi.org/10.5194/essd-14-4035-2022, 2022.
Pichard, G., Arnaud-Fassetta, G., Moron, V., and Roucaute, E.: Hydro-climatology of the Lower Rhône Valley: historical flood reconstruction (AD 1300–2000) based on documentary and instrumental sources, Hydrol. Sci. J., 62, 1772–1795, https://doi.org/10.1080/02626667.2017.1349314, 2017.
Pomianowski, K., Rybczyński, M., and Wóycicki, K.: Hydrology, Part III: Hydrography and Hydrometry of Surface Waters, 1939 (in Polish).
Ren, H., Cromwell, E., Kravitz, B., and Chen, X.: Technical note: Using long short-term memory models to fill data gaps in hydrological monitoring networks, Hydrol. Earth Syst. Sci., 26, 1727–1743, https://doi.org/10.5194/hess-26-1727-2022, 2022.
Rottler, E., Francke, T., Bürger, G., and Bronstert, A.: Long-term changes in central European river discharge for 1869–2016: impact of changing snow covers, reservoir constructions and an intensified hydrological cycle, Hydrol. Earth Syst. Sci., 24, 1721–1740, https://doi.org/10.5194/hess-24-1721-2020, 2020.
Sánchez-García, C. and Schulte L.: Historical floods in the southeastern Iberian Peninsula since the 16th century: Trends and regional analysis of extreme flood events, Global Planet. Change, 231, 104317, https://doi.org/10.1016/j.gloplacha.2023.104317, 2023.
Siebauer, S.: Hydrological Basis for the Regulation of the Vistula River from Zawichost to the Sea, prepared in 1920, in: Proceedings of the First Polish Hydrotechnical Congress, Warsaw, 3–5 January 1929, 1929 (in Polish).
Słowikowski, J.: Water Levels of the Vistula River near Warsaw from 1860 to 1880, with Indication of the Periods of Freeze-up and Ice Break-up, Pamiętnik Fizjograficzny, 1881 (in Polish).
Sobechowicz, Ł., Brykała, D., Kaznowska, E., Wasilewicz, M., Wolski, J., Noras, M., and Siwek, W. A.: Daily Water Levels of the Vistula River at Warsaw, 1799–2024: A Complete and Homogenized Long-Term Record, Zenodo [data set], https://doi.org/10.5281/zenodo.16919654, 2025a.
Sobechowicz, Ł., Obremska, M., Brykała, D., Ćwiek-Rogalska, K., Gąsiorowski, M., Konopski, M., Łotysz, S., Mulczyk, A., Samojlik, T., Siwek, W., Słowiński, M., Szewczyk, K., Stadnicka, M., Targowski, M., Theuerkauf, M., Wolski, J., and Związek T.: With or against the river? Tracing changes and relationships between social and ecological systems on the Central Vistula Floodplain over the last 200 years, The Anthropocene Review, 12, 2302–2326, https://doi.org/10.1177/20530196251348937, 2025b.
Szumiejko, F., Wdowikowski, M., Hański, A., Kańska, A., and Mielke, M.: History of Hydrological Observations and Measurements, in: Vademecum: Hydrological Measurements and Observations, edited by M. Wdowikowski, Institute of Meteorology and Water Management (IMGW), Warsaw, 2015 (in Polish).
Szymański, E.: Regulation Works on the Vistula River near Warsaw from 1885 to 1895, based on the work of Eng. L. Kwiciński, (in Polish), Przegląd Techniczny, 35, 11–17, 1897.
Toonen, W. H. J.: Flood frequency analysis and discussion of non-stationarity of the Lower Rhine flooding regime (AD 1350–2011): Using discharge data, water level measurements, and historical records, J. Hydrol., 528, 490–502, https://doi.org/10.1016/j.jhydrol.2015.06.014, 2015.
Wetter, O., Pfister, C., Weingartner, R., Luterbacher, J., Reist, T., and Trösch, J.: The largest floods in the High Rhine basin since 1268 assessed from documentary and instrumental evidence, Hydrol. Sci. J., 56, 733–758, https://doi.org/10.1080/02626667.2011.583613, 2011.
Wierzbicki, J.: Stability of the Vertical Configuration of the Vistula River Channel and the Position of Low- and High-Water Levels along the Urban Reach in Warsaw, Gospodarka Wodna, 4, 143–149, 2001 (in Polish).
Witkowski, J.: Materials for the Hypsometry of the Country, Pamiętnik Fizyograficzny, vol. XIX, 1907 (in Polish).