the Creative Commons Attribution 4.0 License.
the Creative Commons Attribution 4.0 License.
 | 25 Aug 2026
NortheastChinaMaizeYield10m: a 10 m resolution maize yield dataset for Northeast China (2019–2024) generated via a mechanistically interpretable, field-label-free framework
Jingbo Hu
Xin Du
Qiangzi Li
Yuan Zhang
Hongyan Wang
Jiansong Luo
Jingyuan Xu
Yachao Zhao
Zhaoming Zhang
Yong Dong
Yunqi Shen
In the face of escalating global food demand and increasing climate variability, precise and granular crop yield monitoring is indispensable for maintaining regional agricultural stability. However, current deep learning approaches for yield estimation are severely constrained by their heavy reliance on massive in situ labeled data, which limits their application in data-scarce regions. Furthermore, these models often overlook the essential temporal evolution logic of yield formation and lack a systematic discussion regarding the contribution patterns of different feature dimensions, resulting in a black-box nature of the underlying model mechanisms. To address these challenges, this study proposes a field-label-free training framework for maize yield estimation that couples mechanistic model with deep learning. The framework's core strength lies in a physiologically complete simulation database, using the WOFOST model to exhaustively cover 30 years of climate variability and habitat combinations across Northeast China (1.24 × 10⁶ km2). A Gated Recurrent Unit (GRU) network was then introduced for end-to-end modeling, accurately capturing the energy accumulation trajectory from vegetative to reproductive growth. Validation against 458 independent ground points (2022–2024) demonstrated robust generalization with an R2 of 0.69, an RMSE of 1.21 t ha−1, and an RRMSE of 13.73 %, despite using no ground data for training. Our analysis revealed that integrating photosynthetic intensity (LAImean), duration (LAD) and peak features (LAImax) across growth stages is critical for accuracy, while omitting early-stage features significantly impairs the model's ability to capture cumulative growth effects. Furthermore, the model successfully captured the spatiotemporal yield anomalies caused by the 2023 typhoon and flooding events. Ultimately, this study generated a 10 m resolution maize yield dataset (2019–2024) for Northeast China. The dataset exhibits consistent interannual stability, with the RRMSE ranging from 7.98 % to 12.92 % and the R2 remaining above 0.44 at the city level. By deeply coupling mechanistic simulation with data mining, this dataset provides detailed support for optimizing agricultural production and guiding farming practices. The Northeast China Maize Yield 10 m dataset is openly available at https://doi.org/10.5281/zenodo.19547014 (Hu et al., 2026).
- Article
(22679 KB) - Full-text XML
- BibTeX
- EndNote


Under the combined pressures of intensifying global climate change and continuous population growth, food security has become a central concern of the international community (Foley et al., 2011; Godfray et al., 2010). As one of the three major staple crops worldwide, maize plays an irreplaceable role in maintaining stable and high production for ensuring the stability of the global agricultural economy. Therefore, achieving accurate, cost efficient, and timely estimation of maize yield has become a critical component of agricultural policy formulation and production guidance (Atzberger, 2013). However, traditional field-based measurements are often too labor-intensive and spatially limited to meet the real-time, macro-level management needs of modern agriculture (Kosmowski et al., 2021; Lobell et al., 2020; Weiss et al., 2020).
Given the limitations of traditional approaches, satellite remote sensing has become an important tool for yield estimation due to its capability for large area synoptic observation, high spatial and temporal resolution, and effective detection of vegetation spectral characteristics (Burke and Lobell, 2017; Rembold et al., 2013; Weiss et al., 2020). At present, remote sensing based crop yield estimation methods can generally be classified into two major categories: data-driven approaches and knowledge-driven approaches(Jin et al., 2018; van Klompenburg et al., 2020). Data-driven approaches are typically empirical statistical models that explore the linear or nonlinear relationships between vegetation indices, such as NDVI and EVI, or biophysical variables, such as LAI and FPAR, and historical ground measured yield data (Burke and Lobell, 2017; Khan et al., 2025; Zhang et al., 2025a). In recent years, with the rapid development of artificial intelligence techniques, machine learning methods including support vector machines, random forests, and deep learning have been widely applied to explore complex nonlinear relationships between remote sensing observations and crop yield, leading to substantial improvements in estimation accuracy (Cai et al., 2019b; van Klompenburg et al., 2020). However, these empirical approaches typically disregard the underlying physiological responses to environmental variability. Examples include the crucial influence of early-season soil moisture on subterranean biomass development and the vulnerability of reproductive organs to high-temperature stress, which can severely compromise kernel set. Furthermore, they are inherently black box algorithms lacking explicit descriptions of internal physiological mechanisms (Hu et al., 2023), and their training heavily relies on massive and high quality ground truth labels (Reichstein et al., 2019). In practice, acquiring in situ data at a large scale and over long terms is labor intensive and often suffers from time lags (van Klompenburg et al., 2020), which directly leads to a significant degradation in model generalization capabilities in regions where training samples are scarce (Muruganantham et al., 2022).
Unlike data-driven methods, knowledge-driven crop growth models (CGMs) are built upon explicit agronomic mechanisms and are capable of describing the complete crop development process from sowing to harvest (Jones et al., 2003; Xu et al., 2026). These models characterize the nonlinear trajectory of crop development by integrating fundamental metabolic pathways, such as assimilation and dissimilation processes, with external environmental drivers including soil and climate conditions (Woodhead, 1979). Common examples of such frameworks encompass SAFY, which emphasizes light use efficiency (Duchemin et al., 2008), AquaCrop for moisture based simulations (Raes et al., 2009), the atmospheric driven WOFOST model (van Diepen et al., 1989), and the modularly structured APSIM platform for comprehensive cropping systems analysis (Holzworth et al., 2014). However, the application of pure mechanistic models in large-scale scenarios faces several challenges: (1) high-precision model input parameters (e.g., soil properties and management practices) are extremely difficult to acquire spatially (Xu et al., 2026); and (2) the accurate acquisition and calibration of model parameters involve substantial uncertainty, leading to severe biases in yield estimation (Wu et al., 2021; Xie et al., 2025). In response to these constraints, data assimilation strategies that integrate satellite derived observations with mechanistic models have emerged and are regarded as classic hybrid approaches. Data assimilation utilizes the high spatial and temporal resolution of remote sensing to correct the simulation trajectory of models, thereby improving simulation accuracy (Huang et al., 2015; Huang and Liu, 2024). Nevertheless, data assimilation typically requires complex iterative optimization processes. When applied to high resolution remote sensing data, the substantial computational cost becomes a new constraint, making it difficult to meet the demands for large-scale, high timeliness monitoring (Huang et al., 2023; Xu et al., 2025).
Given the limitations above, integrating the mechanistic knowledge embedded in process-based crop models with the data mining capabilities of machine learning has become a key strategy for enhancing the spatiotemporal generalization of crop yield estimation and alleviating the challenge of sparse training data. Currently, this strategy driven by both mechanisms and data is primarily implemented through two application modes (Xie et al., 2025). The first is feature augmentation, in which key growth variables simulated by crop models are incorporated as auxiliary inputs into machine learning models (Everingham et al., 2016; Xie et al., 2025; Yang et al., 2021); however, this approach still relies heavily on large amounts of ground-based yield observations. The second is surrogate modeling, whereby machine learning algorithms are used to emulate the input-output behavior of crop models and replace complex biophysical calculations (Du et al., 2025; Huntington et al., 2023; Ren et al., 2023; Umutoni and Samadi, 2024; Xu et al., 2026), enabling the construction of generalized models that do not depend on field-measured yield data. Numerous studies have demonstrated that surrogate models can significantly improve yield estimation accuracy (Umutoni and Samadi, 2024; Xie and Huang, 2021), mainly due to three advantages: the ability of CGMs to produce extensive synthetic libraries for addressing the lack of ground truth observations (Xu et al., 2026), model simulated outputs provide biophysical constraints that ensure agronomic plausibility (Tian et al., 2025), and machine learning substantially improves computational efficiency compared with traditional data assimilation techniques (Reichstein et al., 2019). Nevertheless, despite their effectiveness in addressing data limitations, existing research still faces severe challenges across temporal, spatial, and mechanistic dimensions when confronting large-scale and complex scenarios: (1) the lack of explicit temporal evolution logic, as most studies employ static machine learning algorithms such as random forests and treat features from different growth stages as independent variables, thereby neglecting the intrinsic causal relationships and temporal dynamics of crop growth (van Klompenburg et al., 2020; Wang et al., 2024b); given that crop yield formation is a continuous accumulation process across growth stages (Becker-Reshef et al., 2010; Monteith, 1977), this simplification limits the ability of models to capture the regulatory effects of early growth conditions on subsequent yield potential; (2) The limitations of large-scale simulation data in the spatial dimension. Previous studies often focused on small-scale or single-scenario simulations, lacking comprehensive datasets that cover extreme climates and complex habitats at large scale; and (3) The black-box nature of feature combination patterns at the mechanistic level, as there is still a lack of systematic understanding of how features from different growth stages and dimensions, such as instantaneous intensity and cumulative duration, jointly contribute to yield formation, resulting in persistent uncertainty and arbitrariness in feature selection even within mechanism-informed machine learning frameworks.
To address the aforementioned challenges, this study constructs a field-label-free training framework for large-scale maize yield estimation. Unlike conventional supervised learning, which relies on real-world ground-truth labels, or unsupervised learning, which does not involve target variables, the proposed framework employs process-based crop model simulations to generate synthetic target labels. While resolving the issue of sample scarcity, the framework follows a mainline of mechanistic-temporal distillation to reconstruct the continuous energy accumulation trajectory of crops from vegetative to reproductive growth across vast geographic spaces. This holistic solution not only resolves the dependency on in situ labels but also enables a deep interpretation of growth mechanisms under complex habitats. The key innovations and advantages of this study are summarized as follows. (1) Construction of a large-scale and physiologically consistent synthetic sample library. Unlike previous studies that relied on limited simulations or single scenarios, this study employs the WOFOST model to generate a multi-scenario dataset comprising 3 686 400 valid samples. Through a full factorial experimental design, the dataset exhaustively represents nearly 30 years of climatic variability in Northeast China, together with diverse soil textures and agronomic management practices, thereby ensuring both representativeness under extreme climate conditions and physical consistency across complex agroecological environments. (2) Integration of temporal accumulation mechanisms with large-scale deep learning modeling. This study introduced a Gated Recurrent Unit (GRU) deep learning network with temporal memory capabilities to achieve end-to-end yield modeling across the entirety of Northeast China (approximately 1.24 × 10⁶ km2). This architecture not only overcomes the drawbacks of traditional static models that ignore growth continuity but also accurately characterizes the non-linear trajectory of energy accumulation from vegetative to reproductive growth. (3) Mechanistic interpretation of feature combinations in yield formation. By designing four systematic experimental schemes (Schemes A–D), this study deeply explored and compared the synergistic effects of photosynthetic intensity (Mean LAI), photosynthetic duration (LAD), and peak features across different developmental stages on final yield. This systematic analysis of feature combinations provides mechanistic transparency and offers physiological insight into how deep learning models internalize crop growth processes.
2.1 Study Area
The investigation was conducted across Northeast China, a region spanning from 38°40′ to 53°34′ N in latitude and 115°05′ to 135°02′ E in longitude. This study area encompasses the entire provinces of Heilongjiang, Jilin, and Liaoning, as well as eastern Inner Mongolia, with a total area of approximately 1.24 × 10⁶ km2 (Fig. 1). This region was chosen not only for its strategic importance as one of the world's three major “golden maize belts” in ensuring national food security but also for the pronounced hydrothermal gradients formed by its typical temperate continental monsoon climate (Hu et al., 2025; Zhao et al., 2023). The annual accumulated temperature increases from 2200 °C in the north to 3600 °C in the south, while annual precipitation ranges between 350 and 1000 mm (Zhao et al., 2011; Tan et al., 2014). Such strong gradients in moisture and temperature provide a robust test for the generalization capability of the yield estimation model across various stress scenarios without site-specific calibration. Furthermore, due to the uneven distribution of irrigation infrastructure, over 80 % of the maize fields in this region are rainfed, making crop growth highly sensitive to precipitation and temperature anomalies (Yin et al., 2016). This sensitivity provides a reliable basis for evaluating the model's ability to capture yield losses caused by extreme climatic disasters. Figure 1 illustrates the geographic location of the study area, the distribution of selected representative meteorological stations, and the maize distribution in 2024.

Figure 1Study area overview in Northeast China, illustrating the spatial distribution of maize cultivation, in situ validation plots, and the meteorological stations used for WOFOST simulations.
2.2 Data Sources
2.2.1 Remote Sensing Data
Sentinel-2 imagery acquired by the Multi-Spectral Instrument (MSI) was selected as the primary remote sensing data source for retrieving leaf area index (LAI) in this study. Sentinel-2 provides relatively high spatial and temporal resolution data (10 and 20 m spatial resolution with a five day revisit interval) and includes three red edge spectral bands, which offer distinct advantages for monitoring vegetation conditions during the middle and late stages of crop growth (Drusch et al., 2012). Using the Google Earth Engine (GEE) cloud computing platform, Sentinel-2 Level-2A surface reflectance products covering the study area were collected for the maize growing seasons from 2019 to 2024, spanning from April to October. These products have been radiometrically calibrated and atmospherically corrected. Notably, because the time-series reconstruction algorithm employed in this study can utilize all valid pixels, no cloud filtering was performed at the initial collection stage. To eliminate interference from clouds and shadows, we applied cloud masking to all images using the QA60 band. The 60 m bands were excluded due to their low spatial resolution and limited relevance for field-scale yield estimation. In contrast, the 10 m bands (B2: Blue, B3: Green, B4: Red, B8: Near-Infrared) and key 20 m red-edge bands (B5 and B8A) were retained.
2.2.2 In situ measurements
To independently evaluate the accuracy of the model estimates, field yield surveys were conducted during the maize harvest period (late September to mid-October) in 2022, 2023, and 2024 across the study region. The survey was designed based on sample plots with a size of 100 m × 100 m. Within each plot, six sampling units were uniformly distributed, and their coordinates were recorded using high-precision GPS. At each sampling unit, planting density was measured, and three representative maize plants were consecutively selected for destructive sampling. The yield per unit area (kg ha−1) for each sampling unit was calculated based on the single-plant yield and the measured density. The final yield of the plot was determined by calculating the arithmetic mean of the six sampling units. In total, 458 valid in situ yield samples were obtained (Fig. 1). These datasets were used exclusively for independent validation and were not involved in the training of any deep learning models. All in situ yield measurements were standardized to a grain moisture content of 14 % (Wang et al., 2024a). Additionally, a separate field survey was conducted in 2025, with 93 valid samples collected following the same protocol. These data were held out as a dedicated out-of-sample year to further evaluate the temporal generalization capability of the optimal model (Sect. 3.4).
To assess the reliability of Sentinel-2 LAI retrievals, in situ LAI measurements were conducted synchronously during key growth stages in 2023 and 2024 using an LAI-2000C Plant Canopy Analyzer (LI-COR, Lincoln, NE, USA). Within each 20 m × 20 m sample plot, six sampling units were randomly selected to represent the canopy heterogeneity. At each sampling unit, the measurement protocol involved taking one above-canopy reference reading followed by five below-canopy readings to compute the local LAI. The final ground truth LAI for the plot was derived by averaging the measurements from the six sampling units. After strict quality control and outlier removal, a total of 538 valid LAI samples were retained for validation (Fig. 1).
2.2.3 Meteorological data
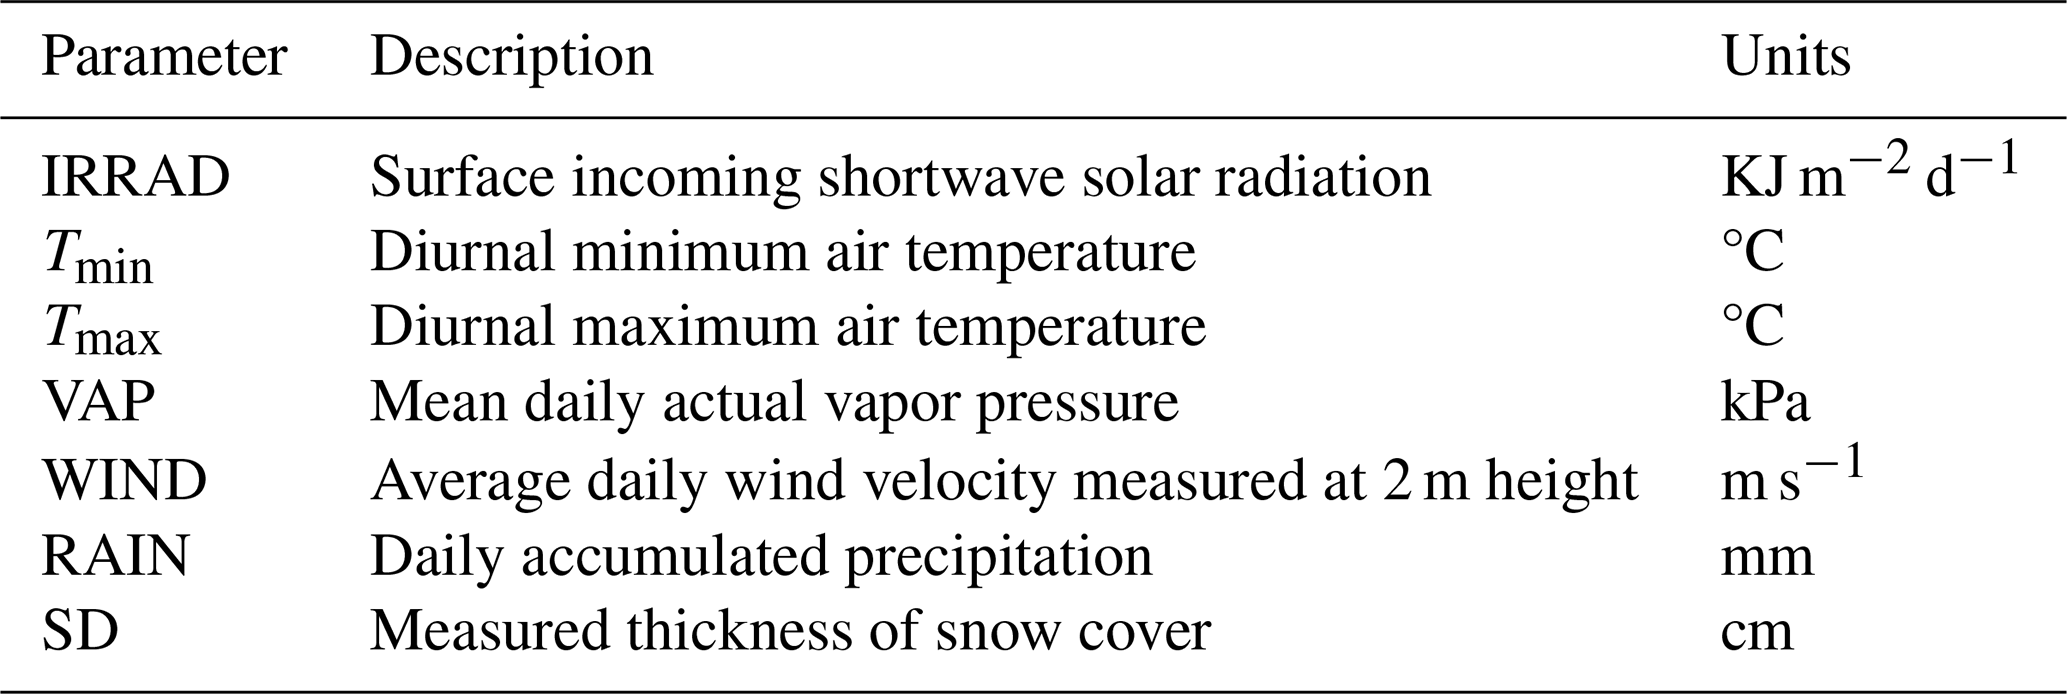
The meteorological variables required by the WOFOST crop growth model are listed in Table 1. In this study, meteorological data were obtained from the China Meteorological Information Center (http://data.cma.cn, last access: 13 August 2026). A total of 60 meteorological stations located within the major maize growing areas of the study region were selected (Fig. 1), and daily observations from 1995 to 2024 were collected. All meteorological datasets were subjected to quality control and preprocessing prior to use. The processed data were then employed as the primary driving variables for the WOFOST crop growth model to generate long term crop growth simulation datasets.
Table 1Standard meteorological input requirements for the WOFOST maize growth model.
2.2.4 Soil data
To define the soil physical properties required for crop modeling, we utilized the 1:1 000 000 Soil Database of China (Shi et al., 2004). Comprising more than 94 000 mapping units, this repository integrates spatial data derived from national soil surveys and utilizes the GSCC taxonomic system at the soil family level (National Soil Survey Office, 1995) (Xu et al., 2026). By extracting the spatial distribution of major soil types from this digital repository, we established a baseline for assigning the specific hydraulic parameters needed to simulate maize growth across various soil environments.
2.2.5 Identification of Maize Cultivation Areas
To ensure the precise spatial mapping of maize, this study constructed a crop planting mask based on the 10 m resolution crop classification dataset for Northeast China (NEC-Crop) released by You et al. (2021). This dataset was generated using Sentinel-2 optical imagery in combination with a random forest classifier and achieved an overall classification accuracy exceeding 85 % for maize in Northeast China. Because the original NEC-Crop dataset covers the period from 2017 to 2019 and does not fully overlap with the study period (2019–2024), the phenology-based feature selection and random forest classification framework described by You et al. (2021) was implemented on the Google Earth Engine (GEE) platform to extend the crop classification time series and update maize distribution maps through 2024.
2.2.6 Statistical data
Official annual maize yield statistics at the county level from 2019 to 2024 were collected from the Statistical Yearbooks publicly released by the Statistical Bureaus of Heilongjiang Province (http://tjj.hlj.gov.cn, last access: 13 August 2026), Jilin Province (http://tjj.jl.gov.cn, last access: 13 August 2026), Liaoning Province (https://tjj.ln.gov.cn, last access: 13 August 2026), and the Inner Mongolia Autonomous Region (https://tj.nmg.gov.cn, last access: 13 August 2026). However, because the Statistical Yearbooks data were not published for certain regions in some years, the available data cover only a subset of regions in those specific years. These statistical data are primarily used to validate the results of this study, and are also combined with the published yield records to assess the reasonableness of the simulated yields produced by our approach.
2.3 Overall Methodological Framework
The overall methodological framework of this study is illustrated in Fig. 2, which primarily includes: (1) Construction of multi-scenario maize growth simulation dataset: driving the WOFOST model to simulate a vast number of maize growth scenarios in Northeast China under various combinations of meteorological conditions, soil types, crop variety parameters, and agro-management practices. (2) Development and optimization of the yield surrogate model: extracting statistical LAI features of key growth stages from the simulated time series and utilizing a GRU network to capture the cumulative process of yield formation, while simultaneously introducing Random Forest (RF) as a baseline model for comparative experiments to determine the optimal yield estimation model. (3) Multi-scale maize yield estimation and validation: the surrogate model is transferred to Sentinel-2–derived LAI time-series data to produce spatial maps of maize yield at 10 m resolution across Northeast China. The estimated yields are then validated for accuracy using independent ground-based field measurements and statistical data.

Figure 2Schematic architecture of the integrated 10 m maize yield estimation framework, encompassing mechanism driven simulation, GRU model development, and regional satellite mapping.
2.4 Construction of the Crop Growth Simulation Dataset
To generate training data containing detailed mechanistic information, this study employed the process-based WOFOST model to construct a maize growth simulation dataset. The WOFOST model is founded on the principles of photosynthesis, respiration, and assimilate partitioning, and is capable of quantitatively describing the nonlinear relationships between crop growth status and environmental conditions, including meteorological variables, soil properties, and agricultural management practices (Boogaard et al., 1998; van Diepen et al., 1989). In this study, the WOFOST model was implemented within the Python Crop Simulation Environment (PCSE, version 6.0). The PCSE framework provides flexible interfaces that are well-suited for high-throughput batch processing, thereby facilitating the application of the point-based model to the regional scale (de Wit et al., 2019). During model execution, maize development is governed by a temperature driven development stage index (Development Stage, DVS), where DVS = 0 represents emergence, DVS = 1 denotes anthesis, and DVS = 2 indicates physiological maturity. The model simulates biomass accumulation by integrating daily canopy photosynthesis while accounting for maintenance and growth respiration losses. The accumulated dry matter is dynamically allocated among roots, stems, leaves, and storage organs, ultimately determining final grain yield (van Diepen et al., 1989).
2.4.1 WOFOST model input parameters
The WOFOST model simulates crop growth by coupling a series of biophysical parameters across meteorological, soil, crop, and agro-management categories (van Diepen et al., 1989). In this study, rather than seeking globally optimal values through traditional model calibration, we established a “multi-scenario parameter space” to represent the diverse agricultural production environments of Northeast China. This approach ensures that the subsequent deep learning training dataset captures a wide range of physiologically plausible growth trajectories without relying on site-specific in situ calibration. The values of the parameters were determined from four sources: ground observation, online database, existing literatures and the initial values provided in WOFOST.
-
Crop parameters
Previous sensitivity analysis studies of the WOFOST model applied to maize in the same study region have shown that crop growth and yield simulations are highly sensitive to parameters related to phenological development and leaf growth (Cai et al., 2019a; Qian et al., 2024). Therefore, considering the environmental conditions of Northeast China and relevant literature sources (Cai et al., 2019a; Huang, 2024; Zhang and Zeng, 2024), this study selected four key sensitive parameters and defined physically reasonable value ranges and search intervals for each parameter to construct parameter sequences. All selected sensitive parameters were then combined using a full factorial parameter combination strategy, and multiple parameter sets were generated and input into the WOFOST model for simulation. The four parameters include the temperature sum from emergence to anthesis (TSUM1), the temperature sum from anthesis to maturity (TSUM2), the initial total dry weight (TDWI), and leaf lifespan at 35 °C (SPAN). For the remaining crop parameters, default values provided by the WOFOST model or optimal values reported in previous studies were adopted. Detailed values and data sources of the main crop parameters used in the WOFOST simulations are provided in Appendix Table A1.
-
Meteorological parameters
Temporal variability in meteorological conditions represents one of the primary sources of uncertainty affecting crop yield formation. Based on the meteorological dataset described in Sect. 2.2.3, this study exhaustively utilized daily meteorological records from the selected stations over the past 30 years (1995–2024) for model simulations. This long term simulation strategy not only captures the climatic characteristics of typical years, but more importantly, to some extent represents crop responses under extreme climate conditions, such as anomalously warm and dry years or years affected by cold stress events. As a result, the training dataset better supports the learning of crop responses to climate extremes and enhances the generalization capability of the deep learning model when encountering extreme weather events (Li et al., 2025; Xu et al., 2024).
-
Soil parameters
Key hydraulic parameters required by the WOFOST water balance module – specifically soil moisture content at wilting point (SMW), soil moisture content at field capacity (SMFCF), soil moisture content at saturation (SM0), and saturated hydraulic conductivity (K0) – were determined based on soil textures derived from the spatial database. The study area is dominated by four loam subclasses: coarse-textured sandy loams, light-textured loams, intermediate-textured medium loams, and fine-textured heavy loams. Specific values for these parameters were assigned to each subclass by referencing relevant literature (Shi et al., 2004; Sun et al., 2022; Xu et al., 2026), as summarized in Table 2.
-
Agro-management parameters
Given that maize production in Northeast China is predominantly rainfed and generally follows regionally standardized fertilizer management practices, the WOFOST model was operated under the water-limited mode in this study. Under this configuration, crop growth is primarily constrained by precipitation and soil moisture conditions, while nutrient supply is assumed to be non-limiting. The sowing period of maize in Northeast China typically ranges from late April to late May (Zhang et al., 2025b). To account for management related uncertainty arising from interannual climate variability and differences in farmers' practices, four representative sowing dates were specified in the simulation scenarios: 20 April, 30 April, 10 May, and 20 May. All sowing scenarios were exhaustively simulated to generate a crop growth dataset that captures diverse phenological responses.
Table 2Key hydraulic constants for dominant soil types in WOFOST.

2.4.2 Multi-scenario crop simulations
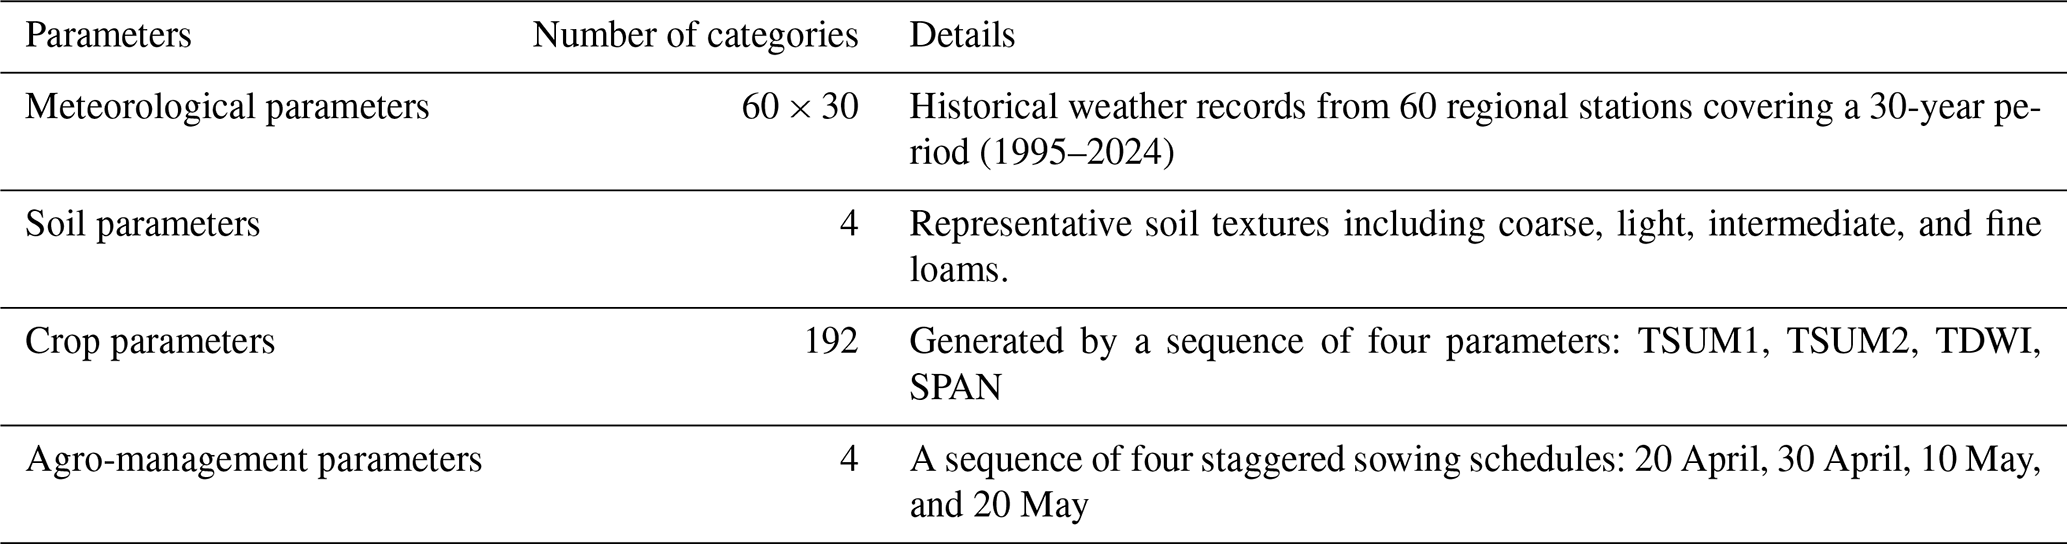
By systematically combining long-term meteorological records from 60 stations spanning 30 years, four major soil texture types, four representative sowing dates, and extensive crop parameter variations (192 crop parameter combinations), a maize growth simulation dataset with pronounced spatiotemporal heterogeneity was constructed using the PCSE framework. Our full-factorial design prioritizes physiological state space coverage over exhaustive enumeration of all possible agronomic combinations, ensuring that the training dataset encompasses a wide range of growth rates, phenological durations, and stress responses under Northeast China's climatic and edaphic conditions. In total, 3 686 400 valid simulation samples were generated, and the detailed parameter combinations are summarized in Table 3. This dataset preserves complete time series trajectories of leaf area index (LAI) under diverse environmental stress conditions, together with the corresponding final grain yield, thereby providing a comprehensive crop growth simulation dataset for subsequent deep learning surrogate model training.
Table 3Multi-scenario combinations designed for WOFOST synthetic dataset generation.
2.5 Feature Extraction and Sample Generation
2.5.1 Phenological Stage Partitioning based on Chronological-Physiological Mapping
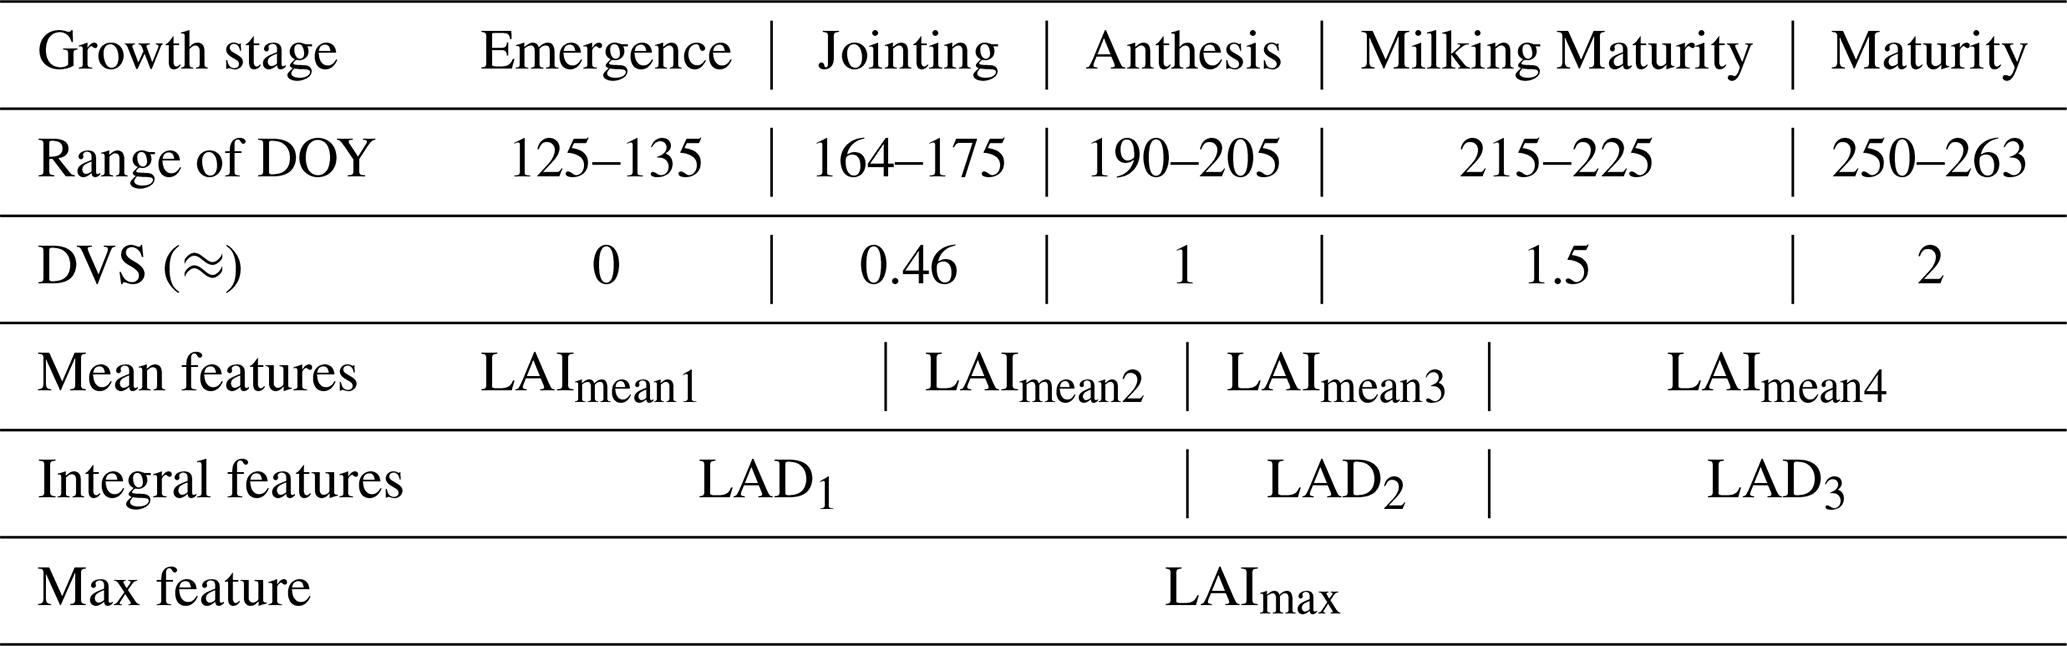
Maize yield formation results from the continuous accumulation and allocation of photosynthates across different growth stages, and the contribution of vegetation conditions to final yield varies substantially among phenological phases. To accurately capture such stage dependent characteristics, this study adopted a phenological partitioning strategy that integrates real world chronological time, expressed as day of year (DOY), with physiological development time represented by the development stage (DVS) variable in the crop model. First, a comprehensive review of maize phenology studies in Northeast China (Cai et al., 2023, 2019a; Cui et al., 2022; Li et al., 2013) was conducted to determine the average DOY ranges corresponding to five key developmental stages of maize in the region (Table 4). Subsequently, the distribution of the DVS variable within these phenological periods was analyzed using the simulation dataset described in Sect. 2.4, and representative DVS threshold values were identified to delineate individual growth stages (Table 4). Based on these DVS thresholds, the continuous LAI time series in the simulation dataset were segmented into multiple growth stages, which served as temporal windows for subsequent feature extraction.
Table 4Maize growth stages and LAI feature extraction based on DVS and DOY.
2.5.2 Feature Extraction
For each growth stage delineated in Sect. 2.5.1, two key feature metrics were derived: the mean leaf area index (LAImean) and leaf area duration (LAD). LAImean was calculated as the arithmetic mean of daily LAI values within each stage and represents the average canopy leaf area level and potential photosynthetic capacity during that period. LAD was computed by temporally integrating (i.e., cumulatively summing) daily LAI values over each stage, thereby characterizing the overall magnitude of canopy development and the cumulative effect of photosynthesis.
Mean based features were calculated separately for four growth stages to capture pronounced differences in growth rates across developmental phases, including emergence to jointing, jointing to anthesis, anthesis to milk stage, and milk stage to maturity. In contrast, integral based features were aggregated over three key accumulation periods: the vegetative growth accumulation phase (emergence to anthesis), early reproductive growth phase (anthesis to milk stage), and late reproductive growth phase (milk stage to maturity) (Table 4). The entire vegetative growth period was aggregated into a single integral feature to provide a more robust representation of the overall photosynthetic potential established prior to reproductive development, while avoiding feature fragmentation and information redundancy caused by relatively low LAI values during early growth stages. Finally, maximum LAI (LAImax) was extracted as the maximum value observed throughout the entire growing season. This metric is utilized to characterize the peak growth status of the crop canopy and serves as a critical indicator of the potential upper limit of final yield.
Through this process, the daily LAI time series of each simulation sample was transformed into a set of stage-based feature vectors. Subsequently, a dataset for driving the deep learning model was constructed using the final grain yield as the target variable.
2.6 Statistical Analysis and Surrogate Model Implementation
2.6.1 Feature Correlation Analysis and Scheme Design
Given the complexity of crop physiological processes, the relationships between LAI-derived features and yield may exhibit both linear and complex nonlinear patterns. To comprehensively analyze these dependencies, this study employed both the Pearson correlation coefficient and the Spearman rank correlation coefficient (Hauke and Kossowski, 2011). The Pearson coefficient was utilized to quantify linear associations, whereas the Spearman coefficient was selected to capture monotonic nonlinear dependencies. These metrics were calculated to quantify the strength of associations between input features and simulated yields and to diagnose multicollinearity among features, thereby providing a statistical basis for feature selection and experimental design in subsequent deep learning modeling.
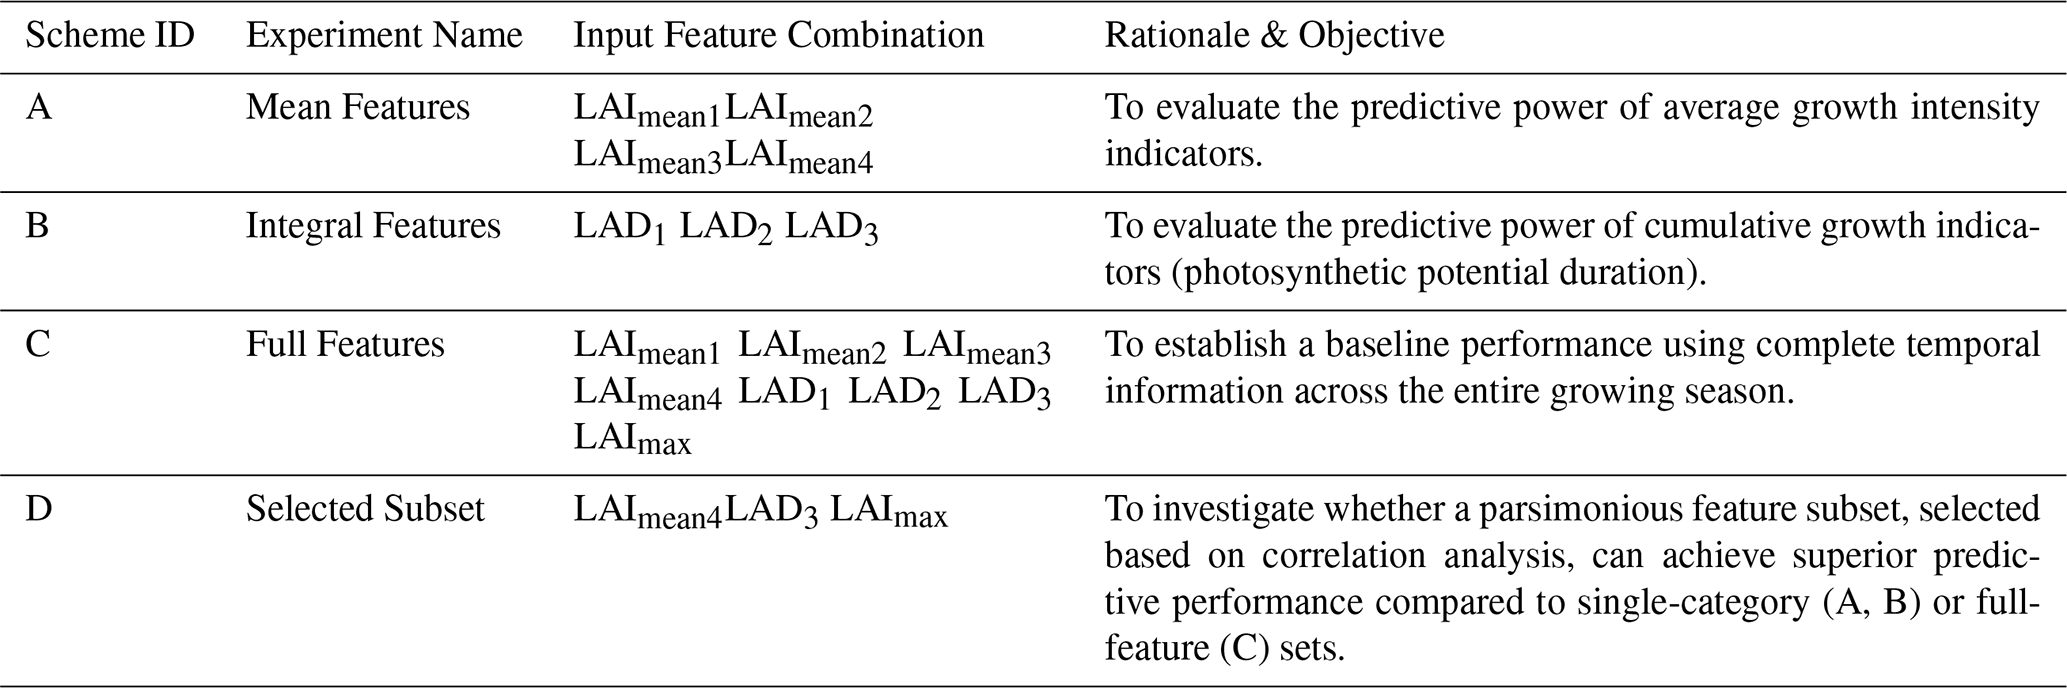
The results of the correlation analysis (provided in Fig. A1 of the Appendix A) indicate that the associations between extracted features and yield exhibit pronounced stage-dependent variations, along with significant multicollinearity among the features. Based on these statistical findings and their physiological significance, four feature combination schemes were designed (Table 5) to evaluate the model's robustness across different information dimensions and to verify the capability of deep learning in handling multicollinearity. These schemes represent average growth intensity (Scheme A), cumulative growth effects (Scheme B), the full temporal context of the growing season (Scheme C), and a parsimonious subset selected based on statistical correlations (Scheme D). By comparing these schemes, this study systematically analyzes the mechanistic contributions of different physiological feature types to yield formation.
2.6.2 GRU Model Construction and Training
Although stage-based features were extracted in this study, crop growth is inherently an irreversible temporal process that progresses from vegetative to reproductive development. The physiological status of earlier stages influences subsequent growth phases through cumulative effects. For instance, carbohydrates and nitrogen accumulated in maize stems prior to silking are remobilized and translocated to the grains during the filling stage, thereby directly contributing to final yield formation (Borrás et al., 2002; Ciampitti and Vyn, 2012; Ruiz et al., 2025). Therefore, an effective yield estimation model must be capable of capturing causal dependencies across growth stages, which is challenging for static machine learning models such as Random Forests (RF) (Wang et al., 2023). To address this requirement, a gated recurrent unit (GRU) network (Fig. 3) was adopted to construct the crop yield estimation surrogate model. GRU is an improved variant of recurrent neural networks (RNNs) designed to alleviate the vanishing and exploding gradient problems commonly encountered when modeling long sequential data (Cho et al., 2014). Its key advantage lies in a compact gating mechanism that dynamically regulates information flow across time steps. Specifically, GRU consists of two core gating units. The update gate controls the extent to which historical information is retained and propagated to future states, enabling the model to capture long term temporal dependencies. The reset gate determines how much past information should be discarded when computing the current candidate state, allowing the model to filter out irrelevant historical influences. Previous studies have shown that GRU can achieve prediction accuracy comparable to that of long short term memory (LSTM) networks while offering higher computational efficiency and faster convergence (Chung et al., 2014; Wang et al., 2023). These characteristics make GRU particularly suitable for modeling the stage based LAI temporal features constructed in this study, enabling efficient learning of the nonlinear temporal relationships between crop growth dynamics and final yield from large-scale simulation data.

Here, σ denotes the sigmoid activation function; Zt and rt represent the update gate and reset gate at time step t respectively; denotes the candidate hidden state at time step t; xt and yt are the model input and output at time step t, respectively; and ht−1 and ht denote the hidden states at the previous and current time steps (Fig. 3).
The GRU surrogate model was implemented using the PyTorch deep learning framework. The constructed dataset was randomly shuffled and split into training, validation, and test subsets with a ratio of . A total of 25 trials were conducted, with the objective of minimizing the mean squared error (MSE) on the validation set. The Optuna framework was employed to jointly optimize key GRU hyperparameters, including hidden size, number of layers, learning rate, and batch size. In each trial, the model was trained for 250 epochs using the Adam optimizer. Gradient clipping was applied to improve training stability. Validation loss was monitored throughout the training process, and the global best model achieving the lowest validation loss across all trials was selected for subsequent evaluation on the test set and for maize yield estimation.
2.6.3 Baseline Model: Long Short-Term Memory (LSTM)
To further justify our choice of the GRU architecture, we additionally implemented a Long Short-Term Memory (LSTM) network as a baseline time-series model. LSTM is a recurrent neural network architecture designed to address the vanishing and exploding gradient problems in long sequential data modeling (Hochreiter and Schmidhuber, 1997). Unlike GRU's two-gate structure, LSTM employs three gates (forget gate, input gate, and output gate) and a separate cell state, enabling more fine-grained control over long-term memory retention (Yunita et al., 2025). The LSTM model was implemented using the same input features, data splitting, and Optuna-based hyperparameter optimization as the GRU model to ensure a fair comparison. Including LSTM allows us to assess whether GRU's more compact architecture provides comparable performance with higher computational efficiency for large-scale yield estimation.
2.6.4 Baseline Model: Random Forest (RF)
To evaluate the advantages of the GRU network in capturing temporal dependencies, a Random Forest (RF) model was implemented as a static machine learning baseline. RF is an ensemble learning method that constructs multiple decision trees during training and outputs the mean prediction of the individual trees to achieve robust regression (Breiman, 2001). In this study, the RF model utilized the same feature combination schemes as the GRU model. Unlike GRU, RF treats input features from different phenological stages as independent variables, making it a representative tool for assessing the performance of non-sequential models in yield estimation (van Klompenburg et al., 2020; Yang et al., 2021). To ensure a fair comparison, the key hyperparameters of the RF model (including the number of estimators and maximum depth) were also optimized using the Optuna framework.
2.6.5 Accuracy Evaluation Metrics
The coefficient of determination (R2), root-mean-square error (RMSE), and relative RMSE (RRMSE) were used to evaluate the accuracy and reliability of the yield prediction models. R2 reflects the degree of consistency between predicted and observed values, with values closer to 1 indicating a more reliable model with higher explanatory power. RMSE measures the average magnitude of the differences between predicted and observed values; the closer the RMSE is to 0, the more accurate the prediction results. RRMSE serves as a metric for comparing prediction accuracy across different models, with a lower RRMSE value indicating higher estimation accuracy. These statistical metrics are defined as follows:
where n represents the total number of samples, and Mi and Pi represent the measured and predicted yield for sample i, respectively. represents the average measured yield over all samples.
2.7 LAI Retrieval and Time-series Reconstruction
In this study, maize leaf area index (LAI) was used to characterize canopy growth conditions and was retrieved from Sentinel-2 multispectral imagery through an empirical regression relationship with the normalized difference vegetation index using red-edge bands (NDVIRE). NDVIRE was calculated from Sentinel-2 red-edge bands (Eq. 4) and subsequently used to establish the LAI retrieval model (Eq. 5). This retrieval approach has been extensively validated by Nguy-Robertson et al. (2012) based on multi-season field experiments. For maize LAI estimation, the method achieved a coefficient of determination (R2) of up to 0.90 and a root mean square error (RMSE) of 0.54 m2 m−2, demonstrating high accuracy and robustness. The specific retrieval equations are presented as follows:
where NIR and RE represent the B8A and B5 bands of Sentinel-2 data, respectively.
Due to the influence of cloud cover and precipitation, LAI time series directly retrieved from optical remote sensing imagery often suffer from data gaps and noise-induced fluctuations. To obtain temporally continuous and high-quality input data, this study followed the approach proposed by Zhu et al. (2022) and applied pixel-level time series reconstruction to Sentinel-2-derived LAI data using the Google Earth Engine (GEE) platform. Specifically, a double logistic (DL) function was employed to fit the LAI time series, with model parameters optimized through nonlinear least squares iteration to characterize the full crop growth trajectory from green-up through senescence. Using this approach, a spatially continuous LAI dataset with a spatial resolution of 10 m and daily temporal resolution was reconstructed for the entire study area from 2019 to 2024.
3.1 Characteristics and Representativeness of the Simulated Dataset
To assess the validity and representativeness of the simulated dataset, we conducted a comprehensive evaluation from two perspectives: consistency of crop growth trajectories and coverage of yield distributions.
A total of 3000 maize LAI growth trajectories were randomly sampled from the multi scenario simulation dataset. The daily mean LAI curve (blue solid line) and the corresponding standard deviation envelope (blue shaded area) were calculated. In parallel, Sentinel-2 derived LAI time series at all ground observation locations during 2022–2024 were extracted and overlaid onto the simulated trajectories for comparison (Fig. 4). The results show that the vast majority of remotely sensed LAI observations (cyan, light green, and orange-red dots) fall within or close to the standard deviation range of the simulated curves. This indicates that, by incorporating diverse meteorological conditions, soil properties, and management scenarios, the simulated dataset effectively captures the major spatiotemporal variability of maize growth under real field conditions in Northeast China. Overall, the simulated growth trajectories exhibit strong agreement with remotely sensed observations.

Figure 4Comparison between the simulated LAI time-series trajectories (mean ± 1 SD) and satellite-retrieved LAI values from 2022 to 2024.

Figure 5Frequency distribution comparison between WOFOST-simulated maize yields and measured yields.
Figure 5 compares the frequency distributions of WOFOST simulated yields and ground observed yields. The simulated yields (cyan) and observed yields (orange) show a high degree of consistency in both value ranges and probability density patterns. Specifically, the simulated yields span from approximately 4000 kg ha−1 under low yield conditions, typically associated with severe drought or poor soil fertility, to more than 13 000 kg ha−1 under favorable water and nutrient conditions. The distribution peaks of both datasets are concentrated within the range of 9000–10 000 kg ha−1. Although the simulated yield distribution is slightly narrower than that of the observed data, it adequately covers the dominant yield range observed in the study area. These results demonstrate that the constructed simulation dataset does not merely represent potential yields under ideal conditions but also realistically reflects yield reductions caused by various environmental stresses commonly encountered in maize production across Northeast China.
Overall, the simulated dataset exhibits sufficient representativeness in terms of both crop growth dynamics and yield variability, providing a solid data foundation for subsequent deep learning based yield modeling.
3.2 Comparative Performance of Deep Learning Models
3.2.1 GRU Models
To evaluate the performance of the proposed GRU-based surrogate models, Table 6 provides the detailed accuracy metrics across the four input feature schemes, while Fig. 6 illustrates the corresponding scatter plots and fitting performance for the training, testing, and validation subsets.
Table 6Performance comparison of GRU models under four different feature combination schemes using the simulated dataset.
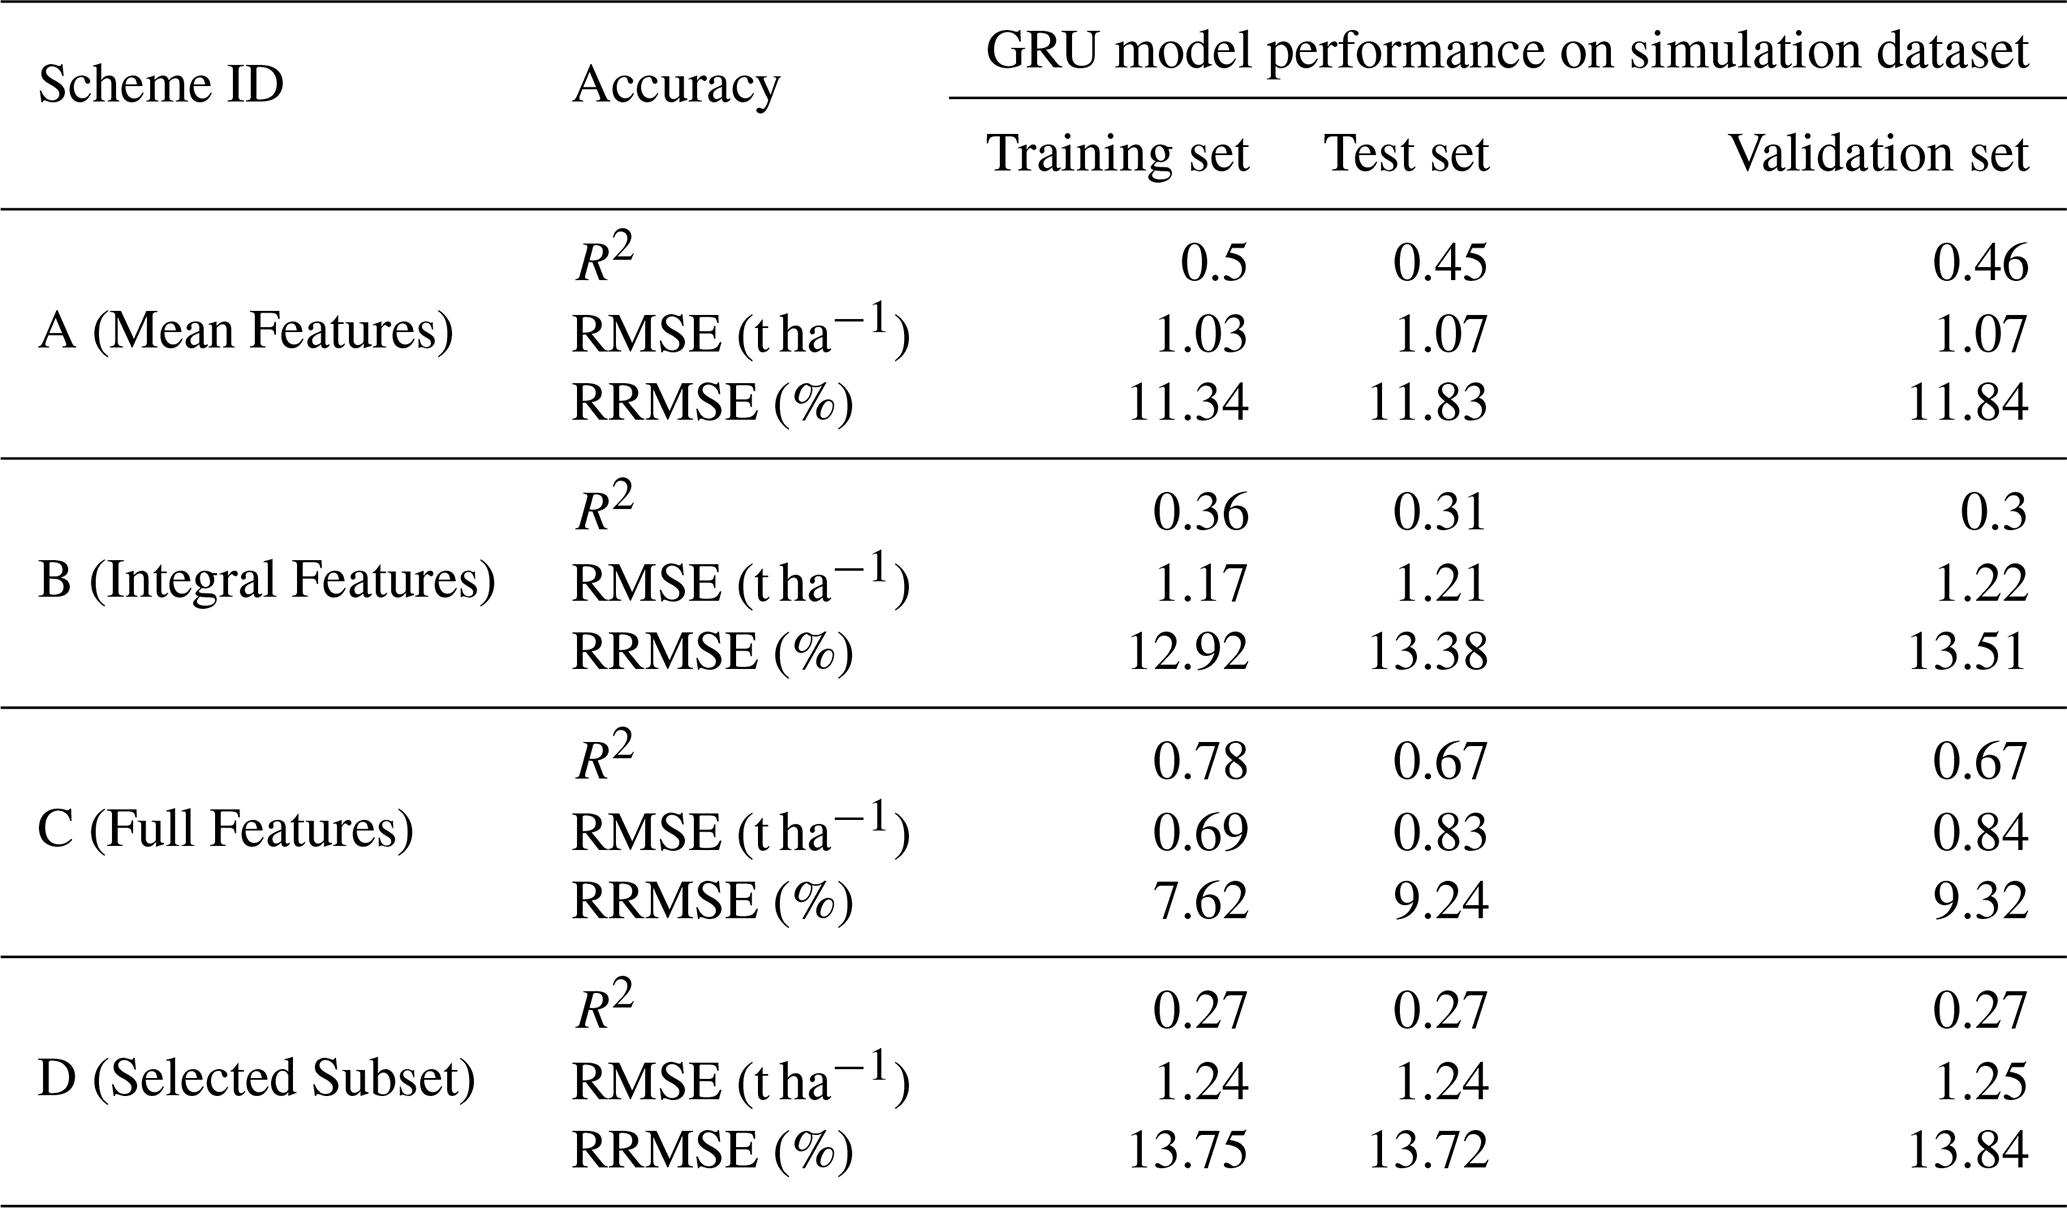

Figure 6Performance comparison of the GRU-based surrogate model across different input feature schemes (A–D) on the WOFOST-simulated dataset (Training, Testing, and Validation subsets).
Among the four schemes, the model incorporating mean, integral, and peak LAI features across the entire growing season (Scheme C) achieved the best overall performance, with an R2 of 0.67, an RMSE of 0.84 t ha−1, and an RRMSE of 9.32 % (Table 6). These results indicate that, despite the presence of substantial collinearity among input features, the GRU network is able to effectively regulate information flow through its update and reset gates, thereby mitigating feature redundancy and fully exploiting the complete temporal context, including early vegetative growth stages, to establish a more robust yield mapping relationship (Schwalbert et al., 2020; Tian et al., 2021). Previous studies have also demonstrated that, compared with traditional machine learning approaches that rely heavily on manual feature selection, deep learning models can automatically extract informative representations from high dimensional inputs and capture complex nonlinear dependencies. This capability allows models trained with comprehensive feature sets to retain more potentially relevant information for yield prediction (Kamilaris and Prenafeta-Boldú, 2018; LeCun et al., 2015).
The feature selection scheme based on correlation analysis (Scheme D, Selected Subset) did not outperform the full feature set. Instead, it exhibited the lowest prediction accuracy, with an R2 of 0.27 and an RRMSE of 13.84 % (Table 6). This result highlights the limitations of feature elimination strategies that rely solely on static statistical correlations. Although features from early vegetative growth stages (e.g., seedling stage LAI) show weak direct correlations with final yield, they constitute essential initial state information for crop growth processes. Manually excluding these features disrupts the temporal continuity of growth trajectories, thereby impairing the ability of the GRU model to learn complete temporal dependency chains (Sun et al., 2019). As noted by LeCun et al. (2015) and Muruganantham et al. (2022), a key advantage of deep learning lies in its capacity to automatically extract spatiotemporal patterns from raw inputs without manual feature selection, whereas excessive human intervention may instead lead to the loss of critical process-related information (Reichstein et al., 2019).
When comparing single feature types, Scheme A using only mean based features (R2=0.46, RRMSE = 11.84 %) outperformed Scheme B using only integral based features (R2=0.30, RRMSE = 13.51 %) (Table 6). This suggests that, within the WOFOST simulation framework, LAI mean features representing the average intensity of photosynthetic activity during each growth stage contain more informative signals for yield formation than cumulative LAD features representing duration. The integration of multi stage and multi type features generally provides a richer representation than any single feature category, which further explains why Scheme C, combining both mean and integral features, achieved the best overall performance.
To provide a quantitative assessment of individual feature contributions, we conducted a SHAP analysis on the optimal GRU model (Scheme C). SHAP provides a unified measure of feature importance by quantifying each input's marginal contribution to the model output across all possible feature subsets. Figure 7 presents the SHAP summary plot for all eight features in Scheme C, with features sorted by their mean absolute SHAP values in descending order. The results reveal that cumulative features (LAD1–LAD3) dominate the model's decision-making, collectively accounting for 56.61 % of the total SHAP importance. LAD1 (Emergence to Flowering) exhibits the highest individual contribution at 28.35 %, followed by LAD2 (Flowering to Milking Maturity) at 18.72 % and LAD3 (Milking Maturity to Maturity) at 9.54 %. The peak feature LAImax ranks third with 14.25 % contribution, indicating that maximum canopy development is an important indicator of yield potential, though secondary to cumulative growth metrics. This implies that achieving a high peak LAI is not sufficient; the temporal accumulation of photosynthetic capacity across the season is more decisive.

3.2.2 LSTM Models
As shown in Table 7, the LSTM model achieves moderate performance on the simulation test set (R2=0.57, RMSE =0.96 t ha−1) but exhibits substantial degradation when transferred to real-world conditions, with an independent validation R2 of only 0.31 (RMSE =1.67 t ha−1). This substantial gap suggests that GRU's more compact gating mechanism, with fewer parameters, offers superior generalization from simulated training data to noisy real-world satellite observations. Given its competitive performance and higher computational efficiency, GRU was selected as the primary model for this study.
Table 7Performance of LSTM models under Scheme C (Full Features) and independent validation using in situ yield measurements (2022–2024).

3.3 Accuracy Assessment of Sentinel-2 Derived LAI
Sentinel-2 retrieval results were validated using in situ LAI measurements from 2023 and 2024 across key maize growth stages. As shown in Fig. 8, LAI values retrieved from the Sentinel-2 red-edge index NDVIRE exhibit strong agreement with in situ measurements, with most samples distributed along the 1:1 reference line. Statistical analysis indicates a highly significant linear relationship between the two datasets (R2=0.94, RMSE =0.41 m2 m−2). These results demonstrate that the proposed approach effectively captures the dynamic variations of maize canopy growth in the study area, providing a reliable data foundation for subsequent yield estimation.

3.4 Plot-scale yield validation based on Sentinel-2
Based on the daily Sentinel-2 LAI time series reconstructed in Sect. 2.7, LAI features for sample plots from 2022 to 2024 were extracted across key growth stages. The GRU models developed under the four experimental schemes were then applied to generate yield predictions, and the accuracy validation results are presented in Table 8. Notably, all in situ measurements served exclusively as an independent validation set and were not involved in any model training process.
Table 8Accuracy assessment of GRU models based on independent plot-level validation datasets.
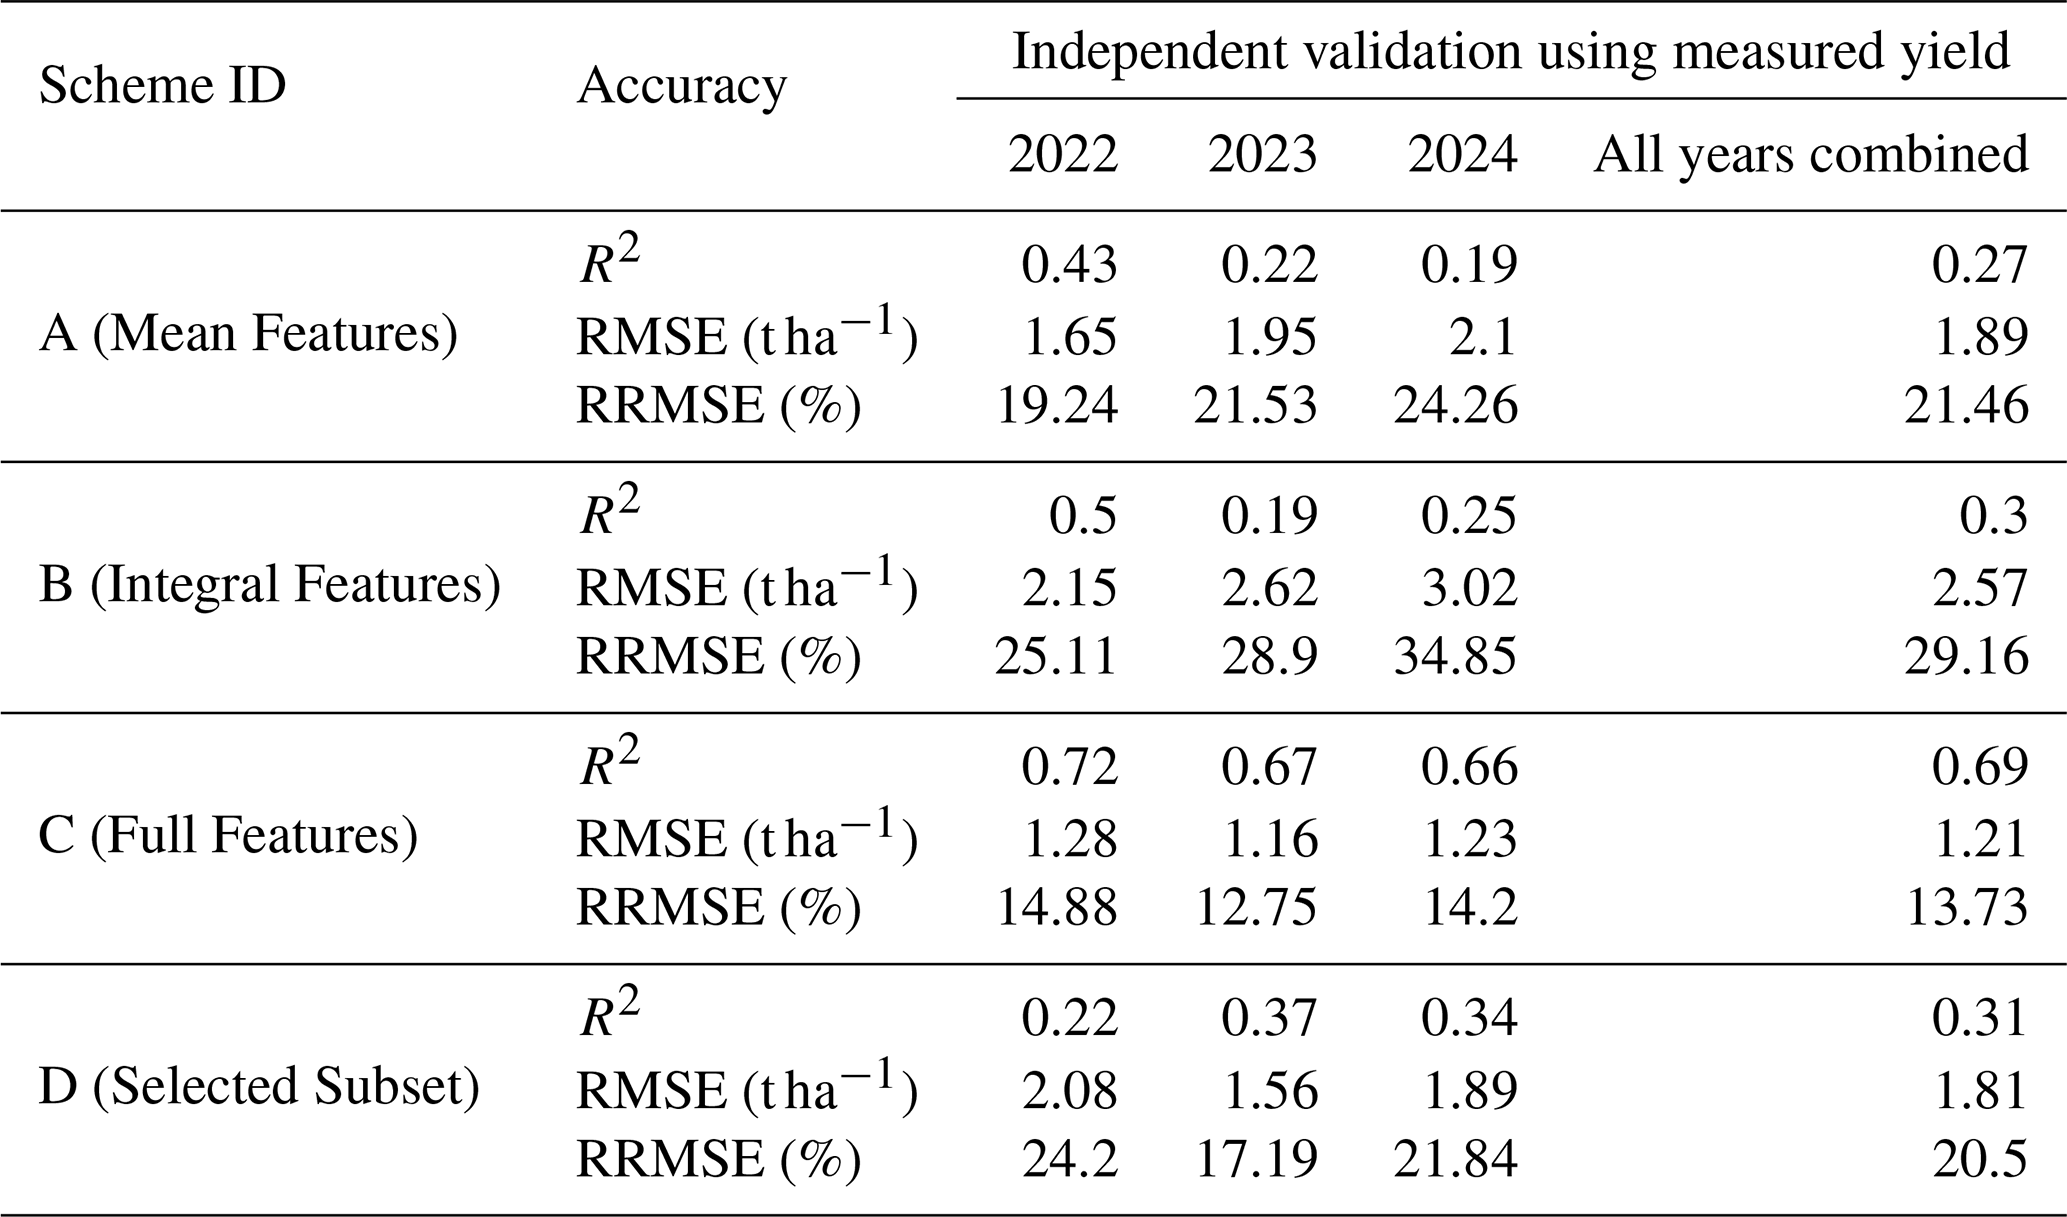
The results indicate that Scheme C, which integrates mean, integral, and peak LAI features across the entire growing season, exhibited the highest estimation accuracy and robustness in real-world scenarios. Its combined validation accuracy across three years reached an R2 of 0.69 (RMSE = 1.21 t ha−1), slightly outperforming even its results on the simulation test set. More critically, Scheme C maintained exceptional inter-annual stability, with validation R2 values of 0.72, 0.67, and 0.66 for the years 2022 to 2024, respectively (Table 8). Given that the model was trained exclusively on the WOFOST simulation dataset, this level of accuracy confirms that the surrogate model has successfully captured the crop growth to yield mapping mechanism, achieving effective transferability from mechanistic simulation to real-world application.
Consistent with the conclusions from the simulation analysis, Scheme D (Selected Subset), which prioritized feature selection based on correlation analysis, exhibited the poorest performance. Its combined R2 across three years was only 0.31 (Table 8). The artificial exclusion of features from the seedling stage disrupted the temporal continuity of the growth curve. This caused the model to lose critical information regarding the initial state, thereby preventing it from correctly inferring the subsequent process of yield formation. This provides further evidence that retaining the complete temporal context is crucial for deep learning models to comprehend nonlinear growth processes when confronting complex data from real scenarios.
The validation using in situ measurements also revealed the limitations of using a single type of feature. In contrast to the high accuracy and stability of Scheme C, both Scheme A (using mean features) and Scheme B (using integral features) exhibited significant volatility across years, although they performed reasonably well in certain specific years. For instance, the R2 for Scheme A dropped sharply from 0.43 in 2022 to 0.19 in 2024, while Scheme B similarly suffered a major decline in 2023 (R2=0.19) (Table 8). This indicates that features from different dimensions are complementary in explaining yield formation: means capture growth intensity, integrals reflect long-term cumulative effects, and peak values define the potential upper limit. Integrating these three feature types enables the model to withstand environmental disturbances across different climatic years, ensuring consistent and stable yield estimation.
To further evaluate the model's generalization to completely unseen climatic conditions, we extended the field validation to include the newly collected 2025 growing season using the optimal GRU model (Scheme C). The 2025 season lies entirely outside the WOFOST simulation period (1995–2024) used for training data generation, providing a rigorous out-of-sample temporal test. As shown in Fig. 9, the model achieved an R2 of 0.61 and RMSE of 1.65 t ha−1 on the 2025 validation set, consistent with the performance on 2022–2024 (R2=0.69, RMSE = 1.21 t ha−1). This confirms that the model genuinely generalizes to unseen years rather than merely interpolating within the simulation space.

Figure 9Independent validation of the optimal GRU model (Scheme C) against in situ measurements in 2025.
3.5 Spatio-temporal Mapping and Validation of Maize Yield in Northeast China
3.5.1 Spatial Mapping and City-Level Validation of Our Product
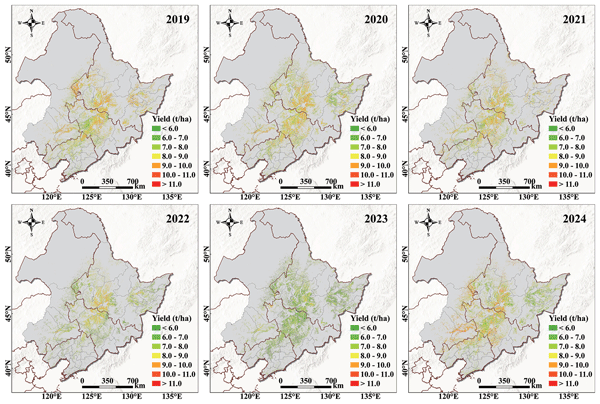
Given the superior accuracy and robustness demonstrated by the GRU model trained under Scheme C in the independent validation (Sect. 3.4), this study deployed it as the final regional yield estimator. By applying this model to the pixel-level LAI statistical feature maps extracted from the reconstructed Sentinel-2 LAI time series, a high resolution (10 m) spatiotemporal dataset of maize yield covering the entirety of Northeast China from 2019 to 2024 was generated (Fig. 10).

Figure 10Multi-year spatial mapping of 10 m maize yields across Northeast China for the 2019–2024 period, reconstructed from Sentinel-2 time series.
At the regional scale, maize yield across the study area exhibited clear spatial continuity. High yield clusters, with multi year average yields exceeding 10.0 t ha−1, were primarily concentrated in the Songnen Plain, Liaohe Plain, and Sanjiang Plain. These regions are characterized by flat terrain, deep soil profiles, and favorable hydrothermal conditions, forming the core areas for stable and high maize production. In contrast, low yield areas were mainly scattered along the northern low mountain and hilly transition zones and the western margins of semi arid regions, where yields were generally below 8.0 t ha−1 due to constraints such as complex terrain, limited soil water and nutrient retention capacity, and relatively insufficient accumulated temperature. The overall spatial pattern shows strong consistency with regional soil type distributions and agro-climatic zoning, thereby confirming the applicability of the proposed model at the large-scale.
At the field scale, benefiting from the high revisit frequency of Sentinel-2 imagery, this study constructed high-quality LAI time series trajectories. This high-density temporal sampling effectively minimizes data gaps common in coarser temporal resolution products, ensuring that rapid canopy development and subtle variations during critical phenological stages are accurately captured (Zhu et al., 2022). Combined with the 10 m spatial resolution, the model clearly revealed yield variability within fields. As illustrated in the zoomed in views in Fig. 11D, E, the model not only accurately delineated the boundaries between cropland and non cultivated features (such as field roads and parcel edges) but also explicitly captured the spatial yield heterogeneity associated with field boundaries, roads, and drainage ditches, thereby reducing mixed pixel effects. Moreover, the model proved capable of identifying yield patches within large fields caused by micro topographic variations or soil texture heterogeneity. This capability to characterize fine-scale yield variability provides valuable high resolution information to support precision agriculture management in the black soil region.

Figure 11An example of yield estimation result used to showcase detailed local estimates.
Notably, the generated yield maps successfully captured a pronounced regional yield reduction in 2023 (Fig. 10). In contrast to the relatively homogeneous high-yield patterns observed in normal years such as 2022 and 2024, the yield estimates for 2023 exhibited widespread low-value zones across most parts of the study area, particularly in the central and southern regions. To quantitatively assess the spatial pattern of this anomaly, we computed county-level yield anomalies for 2023 relative to the multi-year average (2019–2024), defined as (yield2023 − yieldmean) yieldmean. As shown in Fig. 12a, the most severe negative anomalies are concentrated in southern Heilongjiang Province and northern Jilin Province. In contrast, adjacent areas outside the reported flood zones exhibit near-normal or only moderately reduced yields, confirming the localized nature of the disaster impact. We further compared the spatial distribution of 2023 county-level estimated yields against the officially reported flood-affected zones (China Meteorological Administration, 2024; Qi et al., 2024; Yin et al., 2025). As shown in Fig. 12b, the counties within the documented flood-affected areas – including Wuchang, Shangzhi, Yushu, and Shulan – exhibit substantially lower yields (generally 6.0–8.0 t ha−1) compared to adjacent unaffected counties (typically 8.5–10.0 t ha−1). This spatial correspondence between low-yield zones and the flood extents documented in official reports and previous studies provides independent evidence that our product effectively captures the yield anomalies induced by the 2023 flooding events.

Figure 12County-level analysis of the 2023 flood-induced maize yield anomalies in Northeast China. (a) Spatial distribution of county-level yield anomalies in 2023 relative to the multi-year average (2019–2024). (b) Spatial distribution of estimated county-level maize yields in 2023. The most severe anomalies concentrated in southern Heilongjiang and northern Jilin provinces.
Figure 11A–C illustrates the spatial distribution of maize yield in the severely affected area along the boundary between Wuchang City and Yushu City before, during, and after the disaster year. In non disaster years such as 2022 and 2024, maize yields in this region were generally maintained at high levels ranging from 9.5 to 11.0 t ha−1, reflecting its strong production potential as a core area within the “golden maize belt”. In contrast, during the disaster year of 2023, the estimated yields declined sharply to approximately 7.0–9.0 t ha−1. Early August coincides with the critical phenological stage from tasseling and silking to early grain filling, during which maize is particularly sensitive to water conditions. Prolonged waterlogging stress caused root hypoxia and decay, which subsequently accelerated leaf chlorosis and premature senescence in the aboveground canopy. This process substantially reduced photosynthetic assimilation and ultimately led to significant yield losses.
To further verify the robustness of the model at the regional scale, the estimated city-level average yields were compared with the statistical yearbook data of Northeast China from 2019 to 2024 for which complete official statistical records were available (Fig. 13). The results indicate that the model exhibits high robustness at the macro scale, with the coefficient of determination (R2) remaining above 0.44 over the six-year period, peaking at 0.56 in 2022. The relative root-mean-square error (RRMSE) fluctuated between 7.98 % and 12.92 %, effectively capturing the spatial heterogeneity of city-level yields. In 2023, a year significantly impacted by disasters, the model achieved its lowest RRMSE (7.98 %) despite increased spatial heterogeneity, proving that the mechanism-driven simulation data provide excellent coverage of extreme years.

Figure 13City-level validation of estimated maize yields against statistical yearbook data in Northeast China (2019–2024).
3.5.2 Comparison with Existing Public Yield Products
We compared our product with the publicly available “A 10 m maize, rice and soybean yield dataset from 2016 to 2021 in Northeast China” (Teng et al., 2026) over the overlapping period (2019–2021). Both products were evaluated against official county-level statistical yearbook data (Fig. 14). As shown in Fig. 14, our product achieves consistently higher agreement with county-level statistics across all three years compared to the benchmark dataset. At the county-level, our product demonstrates robust performance across the full 2019–2024 period, with R2 values ranging from 0.28 to 0.45 and RRMSE from 12.38 % to 17.13 %.
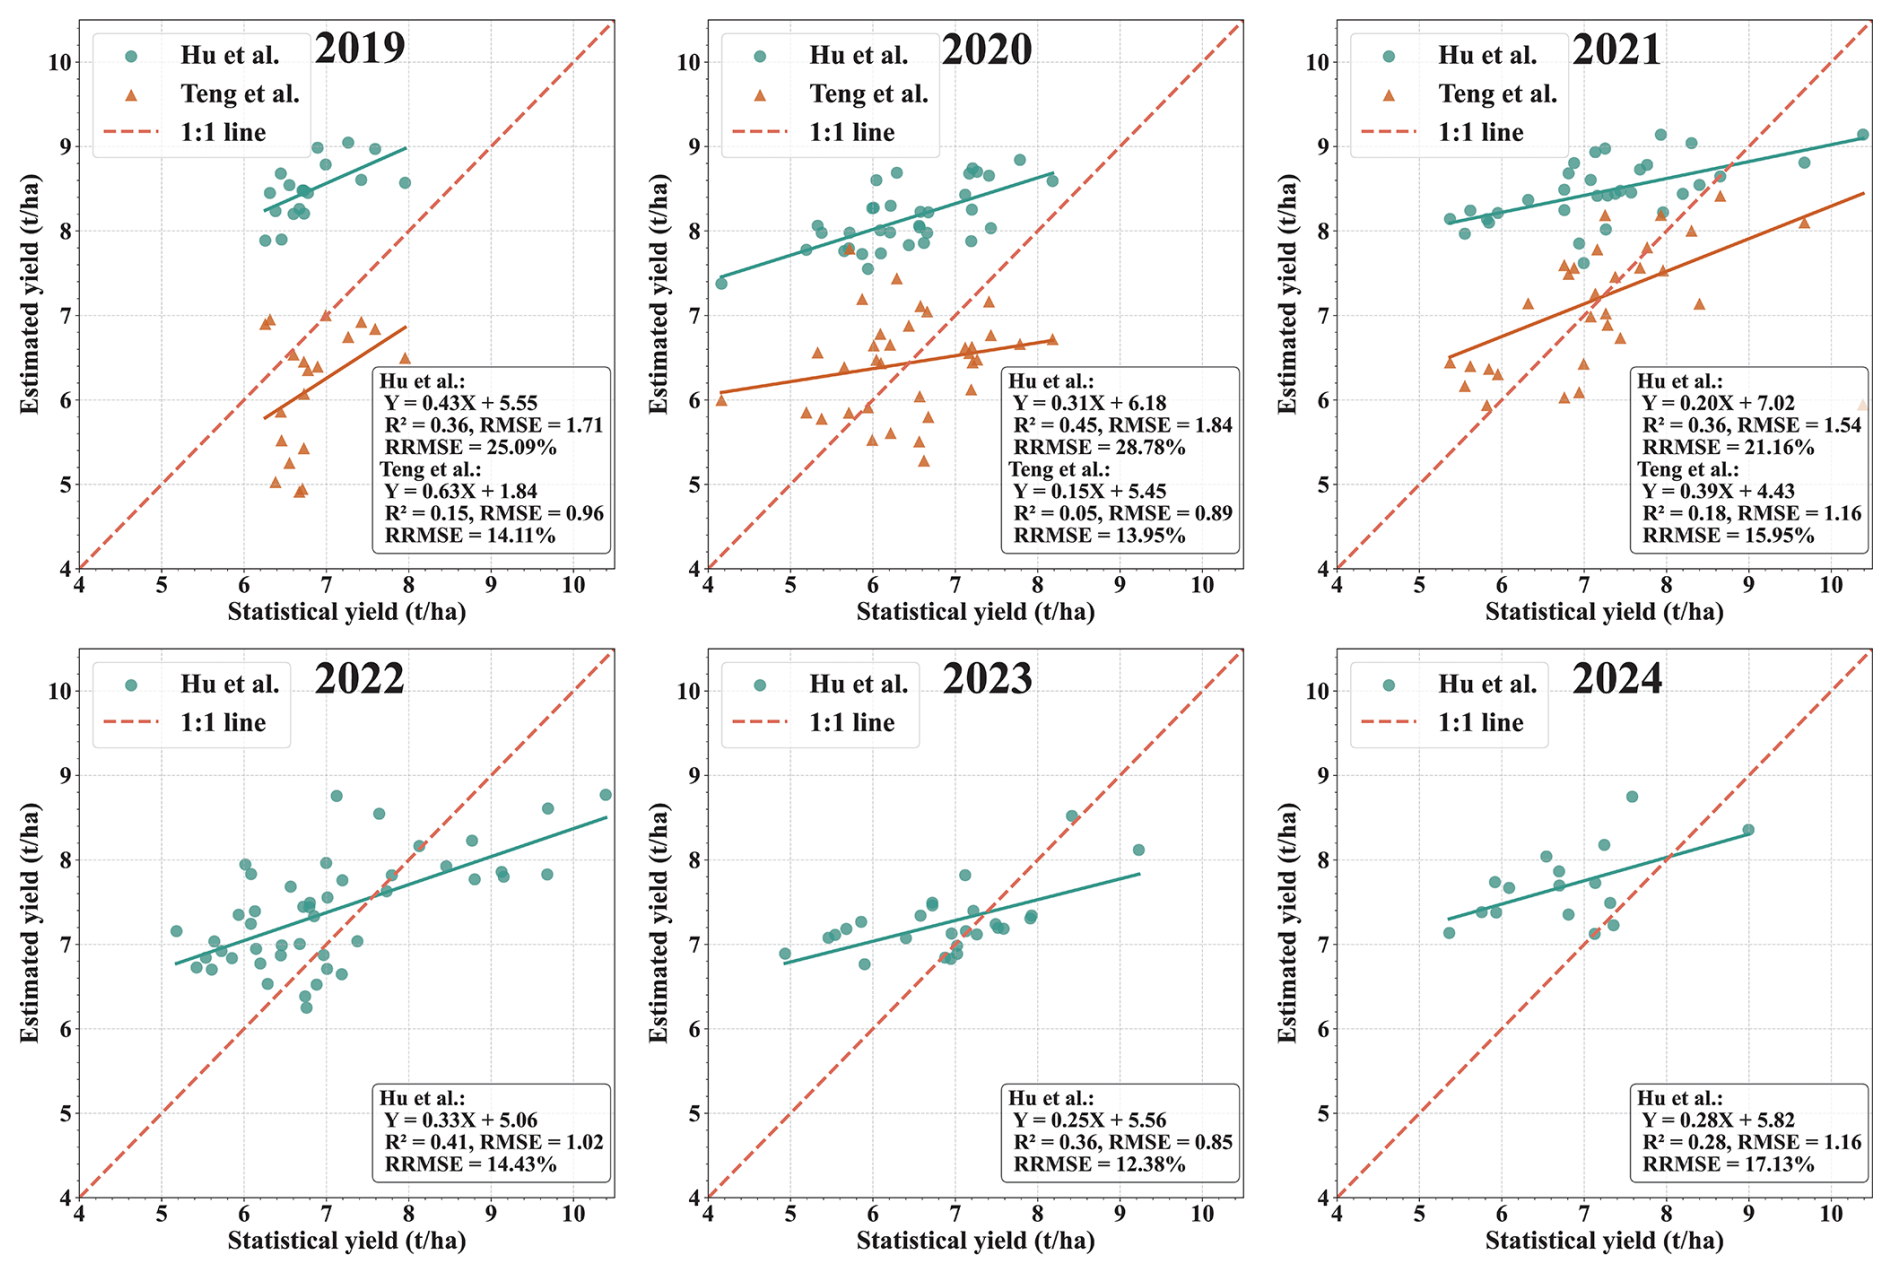
Figure 14County-level comparison of maize yield estimates between our product and the existing 10 m benchmark dataset (Teng et al., 2026) against official statistical yearbook data in Northeast China (2019–2021).
Beyond quantitative accuracy, we also assessed the spatial depiction quality of the two products through visual comparison. Figure 15 presents the spatial distribution of estimated maize yields in the major maize-producing area at the junction of Heilongjiang and Jilin provinces. Our product exhibits clearly delineated field boundaries and more spatially continuous within-field patterns, with fewer fragmented or missing pixels. Non-crop linear features such as field ridges are effectively removed, resulting in cleaner and more homogeneous field parcels. Our product achieves favorable accuracy against the existing benchmark and provides added value through extended temporal coverage (2019–2024), improved spatial accuracy at finer administrative scales, and enhanced field-level spatial detail.

Figure 15Visual comparison of spatial maize yield mapping between our product and the existing 10 m benchmark dataset (Teng et al., 2026) in the major maize-producing areas at the junction of Heilongjiang and Jilin provinces.
4.1 Effectiveness of Combining Process-Based Simulation and Machine Learning to Address Sample Scarcity
This study proposes a process-based simulation–guided deep learning framework that effectively alleviates the widespread challenge of ground-truth yield sample scarcity in large-scale agricultural remote sensing applications, enabling a robust transfer of yield estimation models from virtual simulation environments to real field conditions. Deep learning models generally rely on large volumes of high-quality labeled data for training (Reichstein et al., 2019). However, the acquisition of field-measured crop yield data is often time-consuming, labor-intensive, and spatially limited, which severely constrains the development of accurate and transferable yield estimation models in many regions (Jabed and Azmi Murad, 2024; van Klompenburg et al., 2020). To overcome this limitation, this study incorporates the WOFOST crop growth model to generate virtual training data by systematically combining diverse meteorological conditions, soil properties, and management practices. This approach results in a large-scale simulated dataset that effectively substitutes for costly and difficult-to-obtain field measurements (Cheng et al., 2026). This strategy is highly consistent with the findings of Umutoni and Samadi (2024), who demonstrated that simulated datasets generated by crop models such as AquaCrop can successfully train machine learning models (e.g., GRU and MLP) and achieve reliable yield estimation in data-scarce regions.
The experimental results further show that the GRU model trained exclusively on simulated data exhibits strong generalization capability when evaluated against independent field observations from 2022 to 2024, achieving an R2 of 0.69 and an RMSE of only 1.21 t ha−1. These results provide compelling evidence that process-based crop models can generate highly representative “pseudo-label” data, enabling deep learning networks to learn robust and physically constrained mappings between crop growth dynamics and final yield, rather than merely fitting statistical patterns in the data (Reichstein et al., 2019). As noted by Lu et al. (2025), integrating the scientific interpretability of process-based models with the data-driven strengths of deep learning can lead to more accurate and reliable yield predictions, particularly in heterogeneous agricultural landscape. Moreover, compared with traditional real-time data assimilation approaches, the proposed simulation-driven learning strategy avoids complex iterative optimization procedures, substantially improving computational efficiency at the regional scale (Tian et al., 2025; Umutoni and Samadi, 2024). Overall, this study demonstrates the feasibility and robustness of yield estimation driven by process-informed deep learning without relying on field-measured yield data for model training, providing an efficient and transferable solution for agricultural monitoring in data-limited regions.
4.2 Capability of Deep Learning in Capturing Temporal Features of Crop Growth
Although the continuous LAI time series were simplified in this study into statistical descriptors (mean values and integrals) corresponding to key phenological stages, this does not imply that crop yield formation can be treated as a static nonlinear regression problem. Crop growth is inherently an irreversible and cumulative temporal process (Becker-Reshef et al., 2010). The physiological state established during earlier growth stages (e.g., biomass accumulation during the jointing stage) is not only the outcome of previous environmental conditions, but also acts as a form of “memory” that directly constrains subsequent growth potential and modulates crop sensitivity to environmental stresses (Wang et al., 2023).
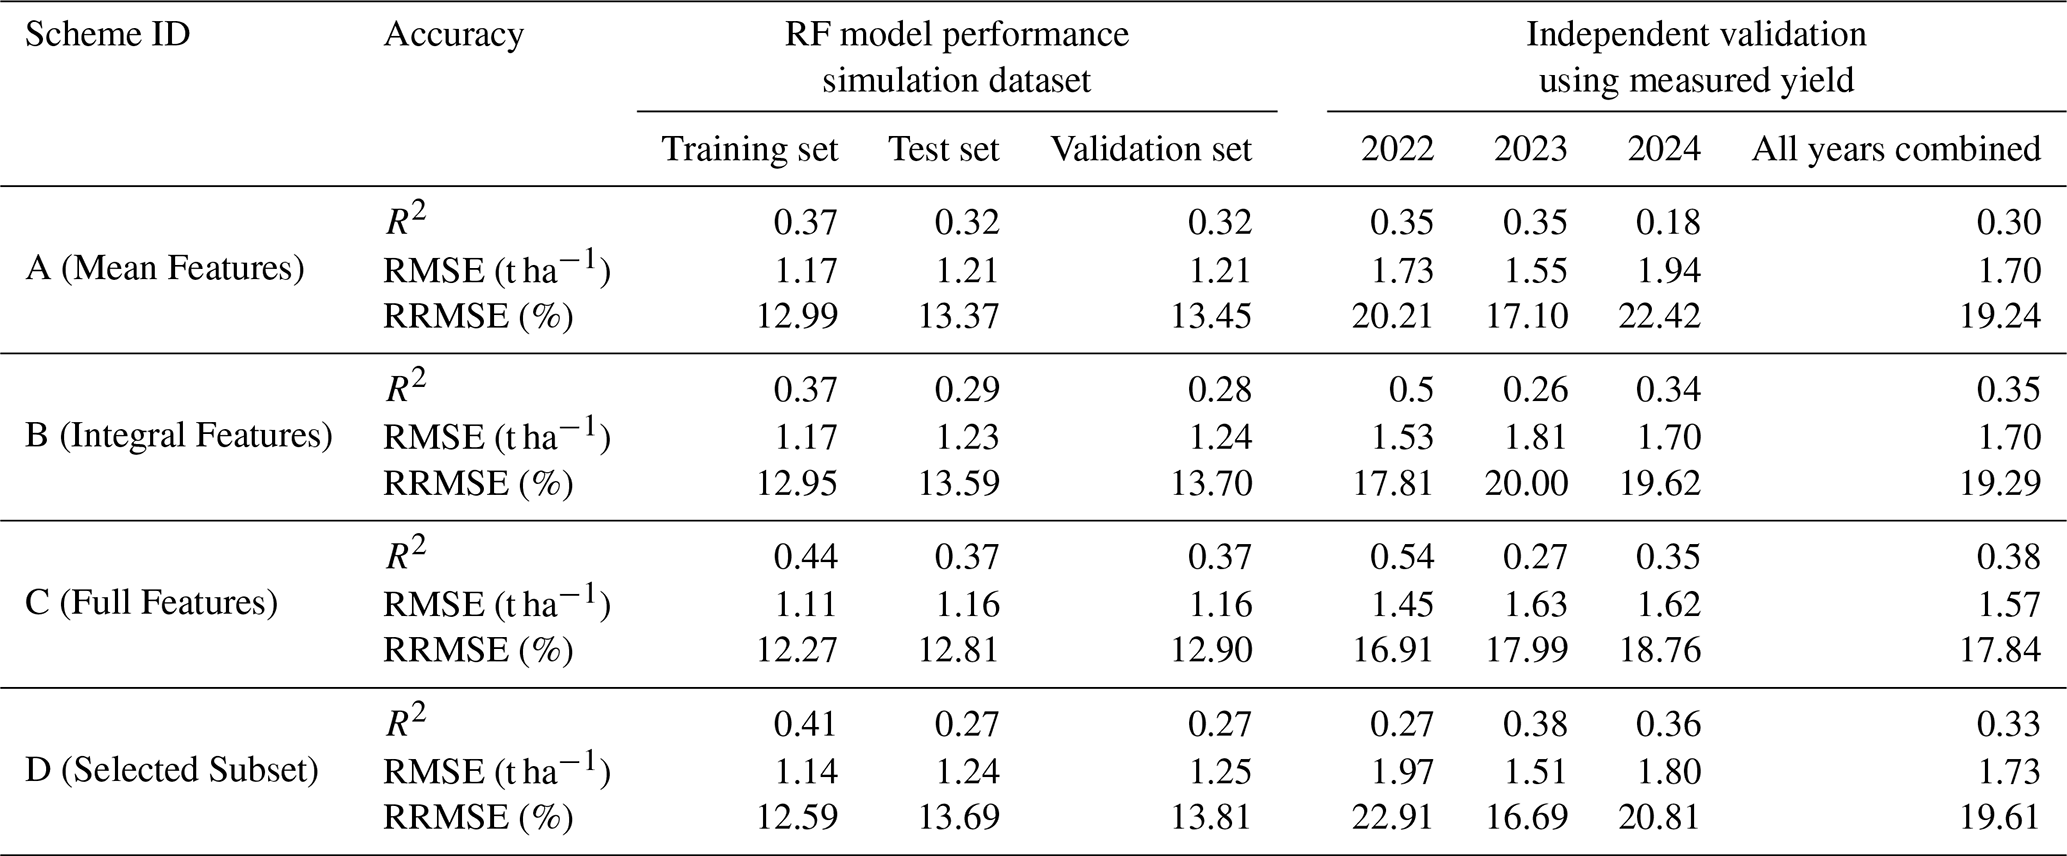
To quantify the advantages of deep learning in capturing temporal dependencies, this study further benchmarked the performance of the Random Forest (RF) model using the same feature schemes. As shown in Table 9, under the most informative full-feature scenario (Scheme C), the RF model achieved only limited accuracy on the independent validation set, with a combined R2 of 0.38 (RMSE = 1.57 t ha−1). This is significantly inferior to the GRU model, which attained an R2 of 0.69 (RMSE = 1.21 t ha−1) (Table 8). This substantial performance gap highlights a fundamental distinction between the two approaches. Traditional static machine learning models, such as Random Forests (RF) or Multilayer Perceptrons (MLP), typically treat input features as independent variables, thereby neglecting the intrinsic chronological order and causal evolution embedded in crop growth processes (Khaki et al., 2020). As noted by Lu et al. (2025), deep learning models – particularly recurrent neural network (RNN) architectures – exhibit clear advantages over conventional machine learning approaches in capturing dynamic growth trajectories and nonlinear cumulative effects in crop systems (Qiao et al., 2021). The Gated Recurrent Unit (GRU) model adopted in this study is particularly well suited for this task due to its gate-based architecture composed of update and reset gates, which enables effective learning of inter-stage dependencies (Cho et al., 2014). Specifically, the GRU is capable of retaining critical state information from early vegetative growth stages and propagating it into reproductive stages, thereby implicitly reconstructing a coherent biological growth continuum from emergence to maturity within the network (Ullah et al., 2025). The performance differences observed among the various feature-combination schemes further demonstrate that preserving temporal continuity is essential for GRU models to accurately capture stage-to-stage accumulation effects. Consistent with the findings of Feng et al. (2020), different phenological stages contribute unequally to final yield formation, as climatic conditions and vegetation status exert stage-specific influences on crop productivity. Therefore, retaining complete phenological evolution information is a prerequisite for achieving accurate and robust dynamic yield estimation.
Table 9Performance of RF models under different experimental schemes and independent validation using in situ yield measurements (2022–2024)
4.3 Physiological Interpretation of LAI Features
As the core input feature, the LAI is not merely a static structural variable; rather, it serves as a comprehensive characterization of both canopy architecture and photosynthetic capacity, which directly determines the fraction of intercepted photosynthetically active radiation and consequently drives biomass accumulation. The temporal dynamics of LAI throughout the entire growing season can reflect the cumulative impacts of water stress and extreme temperature conditions, as any environmental disturbances will inevitably leave distinct imprints on the seasonal LAI sequence through inhibited leaf expansion, accelerated senescence, or changes in canopy greenness. Furthermore, LAI can be stably retrieved from high-resolution satellite imagery such as Sentinel-2, making it suitable for large-scale, high-frequency crop monitoring, whereas observational datasets for moisture and temperature are often difficult to acquire at comparable spatial and temporal scales. Therefore, selecting LAI as the exclusive core feature in this study successfully balances mechanistic interpretability with data feasibility.
This study indicates that the model based on mean LAI features (Scheme A) slightly outperformed the model based on cumulative integral features (LAD; Scheme B), while the combined Scheme C achieved the best performance (R2 = 0.67, RMSE = 0.84 t ha−1, RRMSE = 9.32 %) (Table 6). This result carries clear physiological significance: mean LAI characterizes the photosynthetic intensity at a given stage, reflecting the instantaneous capacity of the canopy to intercept light; whereas integral features implicitly capture the duration of the phenological stage, representing the cumulative effect of photosynthesis (Bakó et al., 2025; Ban et al., 2016). The slight superiority of Scheme A over Scheme B suggests that in the study region, canopy growth vigor or instantaneous assimilate efficiency is a stronger determinant of yield than the duration of the growth period. Crop growth in Northeast China is strictly constrained by effective accumulated temperature and the frost-free period (Wang et al., 2025). Under such climatic conditions where the time window is fixed, the marginal contribution of extending growth duration (i.e., increasing LAD) to yield diminishes, as low temperatures in the late season often restrict assimilate transport and grain filling. In contrast, increasing the dry matter assimilation rate per unit time becomes key to yield improvement (Zhao et al., 2023). Therefore, within a limited growing season, maximizing photosynthetic intensity (Efficiency) is often more critical for determining final yield potential than merely extending duration. The performance of Scheme C confirms that yield is the comprehensive outcome of both photosynthetic intensity and duration. The GRU model effectively learned the nonlinear interactions between these two complementary features, thereby achieving more accurate estimation than models relying on a single feature type.
4.4 Simulation and Model Response to Extreme Precipitation Stress
In this study, the WOFOST model was operated under the water-limited production mode, which is not equivalent to simulating only drought stress. The WOFOST soil water balance module is driven by actual daily precipitation and dynamically tracks changes in daily soil moisture content (van Diepen et al., 1989). Although the WOFOST model does not explicitly simulate the full range of physiological processes associated with anaerobic root conditions under waterlogging, this simplification does not prevent the model from capturing waterlogging-induced yield losses. When cumulative precipitation exceeds the soil drainage and runoff capacity, the model inherently triggers excess-water stress responses – suppressing root oxygen availability, limiting canopy transpiration and photosynthesis, and ultimately reducing LAI and biomass accumulation (Boogaard et al., 1998; Liu et al., 2020). Therefore, our training dataset inherently includes yield reduction scenarios caused by excessive soil moisture, which originate directly from the 30-year historical meteorological records (1995–2024). Sentinel-2 satellite observations are capable of capturing such LAI anomaly signals, and the GRU model has learned, during the training phase, the general mapping relationship between depressed LAI trajectories and reduced final yields under various environmental stresses. When applied to real satellite imagery, the model does not explicitly detect flood events; instead, it infers yield losses through the observed LAI decline as a comprehensive stress signal.
4.5 Uncertainties and Limitations
Although this study achieved relatively high yield estimation accuracy, the model still carries certain uncertainties due to data source limitations and simplified assumptions. The gap between crop growth model simulations and reality, along with input data uncertainties, are the primary sources constraining the reliability of crop yield estimates.
The input layer of the WOFOST simulations, including both cultivar parameters and agronomic management settings, inevitably deviates from the complexity of real world conditions. In this study, several key physiological parameters governing phenological development were assigned based on literature values and the model's default settings, rather than calibrated against site-specific field trials for each cultivar. In terms of agronomic management, our framework assumes non-limiting nutrient conditions and discretizes the sowing window into only four fixed dates. In reality, smallholder farmers across Northeast China employ flexible sowing schedules and highly diverse management strategies (Chuanwei et al., 2024). These two types of input deviations may jointly cause the simulated LAI trajectories to diverge to some extent from actual growth curves in specific fields. Nevertheless, we argue that the full-factorial parameter combination strategy adopted in this study constructs an exhaustive training set that covers a broad physiological and management space. The consistency between estimated yields and statistical yearbook data, together with the robust multi-year independent field validation performance (Sect. 3.4), demonstrates that the simulated data generated under the current input settings are sufficiently reliable to support accurate yield estimation.
A systematic discrepancy also exists between the WOFOST-simulated LAI and the satellite-derived LAI. The simulated values represent a deterministic, noise-free “green leaf area index” at the point scale under idealized atmospheric conditions (Boogaard et al., 1998). In contrast, the satellite-retrieved LAI is subject to multiple factors, including residual atmospheric correction errors, cloud-gap filling algorithms, and mixed-pixel effects. As noted by Lu et al. (2025), satellite-derived vegetation parameters (e.g., LAI) are not free from uncertainty, particularly in areas with high LAI or dense canopies, where saturation or underestimation may occur. Moreover, different data processing workflows, such as cloud masking and filtering algorithms, can introduce systematic errors. Consequently, input uncertainties can propagate through the prediction model when a model trained on clean simulated data is generalized to noisy satellite observations (Xie et al., 2025). However, the gating mechanism of the GRU provides inherent robustness to such input noise by dynamically weighting the contribution of each time step (Cho et al., 2014). The stable performance of the model in independent validation across 2022–2024 (Table 8) further confirms that the proposed framework can effectively mitigate the adverse effects of uncertainties in satellite-derived LAI under the current data quality.
The use of a unified phenological time window for feature extraction represents a trade-off between strictly matching local phenology and ensuring the model's applicability at the large-scale. It is true that crop development differs between the southern and northern parts of the study area due to climate variations. However, in large-scale modeling, attempting to correct phenology for every single pixel often introduces greater uncertainty due to cloud cover or calculation errors (Zeng et al., 2020; Zhang et al., 2003). Therefore, this study used fixed time windows with sufficient tolerance to capture the core growth signals. Although this may cause slight timing mismatches in some areas, the gating mechanism of the GRU model demonstrates a strong ability to extract features, effectively learning key yield patterns despite this slight input noise. The stable performance of the model across different years (2022–2024) (Table 8) confirms that this approach is reliable and practical, even without high-precision real-time phenological data.
Finally, there is still potential to further enhance the spatial generalization of the model in complex surface environments. This limitation is primarily constrained by the spatial resolution of the driving data used in crop growth simulations. Current simulation frameworks rely heavily on data from standard meteorological stations, which typically represent average climatic conditions of the region. However, in regions with complex terrain, variations in elevation and aspect can significantly alter local microclimatic characteristics, such as creating temperature gradients and precipitation redistribution induced by microtopography (Hwang et al., 2011; Hu and Mo, 2011; Zhao et al., 2020). Driving data based on stations often fail to capture this spatial heterogeneity at a fine scale, leading to a training dataset that may lack detailed representations of crop growth dynamics in specific habitats (Luo et al., 2023). Consequently, when the model is applied to regions with sharp environmental gradients, estimation uncertainties may arise due to subtle deviations between input features and the training distribution (Ma et al., 2024). Future research could consider incorporating gridded meteorological data of high resolution or coupled terrain and climate models to optimize input quality at the simulation stage, thereby endowing the model with stronger spatial adaptability (Feng et al., 2024).
The maize yield dataset for Northeast China (Northeast China Maize Yield 10 m) during the 2019–2024 period is available at https://doi.org/10.5281/zenodo.19547014 (Hu et al., 2026). Accompanying 10 m resolution uncertainty layers (coefficient of variation, CV) for 2023 and 2024 are also provided. The CV layers were generated using Monte Carlo Dropout, with CV values scaled by 10 000 for integer storage; users should divide pixel values by 10 000 to recover the original CV. Users are encouraged to consult these uncertainty layers to assess the spatial reliability of the yield estimates.
To address the challenges of severe scarcity of ground-truth labels in large-scale crop yield estimation, the neglect of temporal growth logic in existing models, and the unclear mechanisms of feature combinations, this study proposes a field-label-free training maize yield estimation framework that couples mechanistic models with deep learning. By integrating the physiological mechanisms of the WOFOST model with the temporal mining capabilities of a Gated Recurrent Unit (GRU) network, this research achieves a knowledge transfer from virtual simulation space to real geographic space.
The results demonstrate that a massive and physiologically complete sample library is the foundation for achieving field-label-free training yield estimation. This study utilized a mechanistic model to construct a multi-scenario database containing 3 686 400 valid samples, significantly surpassing previous studies in both scale and completeness. Through full-factorial experiments, this database exhaustively covers nearly 30 years of climate fluctuations and habitat combinations across Northeast China, ensuring the model maintains strong robustness and generalization capabilities without requiring ground-truth data for training. In independent field validations, the GRU network, equipped with temporal memory, exhibited superior performance (R2=0.69, RMSE = 1.2 t ha−1), with accuracy significantly higher than that of Random Forest models that do not account for temporal continuity. This further indicates that accurately characterizing the energy accumulation trajectory from vegetative to reproductive growth is central to achieving precise yield estimation in large-scale, complex environments.
Furthermore, through a comparative analysis of four systematic experimental schemes (Schemes A–D), this study confirms that yield is the result of the combined effects of photosynthetic intensity, duration, and peak features. Although the statistical correlation between early-stage growth features and final yield is low, these features are crucial as initial states for maintaining the integrity of the temporal context, directly influencing the model's accurate inference of subsequent growth potential. This systematic mining of contributions from different feature dimensions breaks the “black box” of deep learning in yield estimation and deepens the scientific understanding of how deep learning models acquire crop physiological mechanisms.
From a practical application perspective, this study not only constructs a low-cost, scalable, mechanism-driven, field-label-free training estimation solution but also successfully generates a high-precision maize yield map at a 10 m resolution for Northeast China. This dataset can capture subtle spatial differences within fields and accurately identify yield fluctuations caused by extreme meteorological disasters, such as the typhoons and flooding in 2023, providing a vital decision-making basis for precision agricultural management and regional food security early warning systems.
Table A1Physiological parameterization and characterization of crop traits in WOFOST.
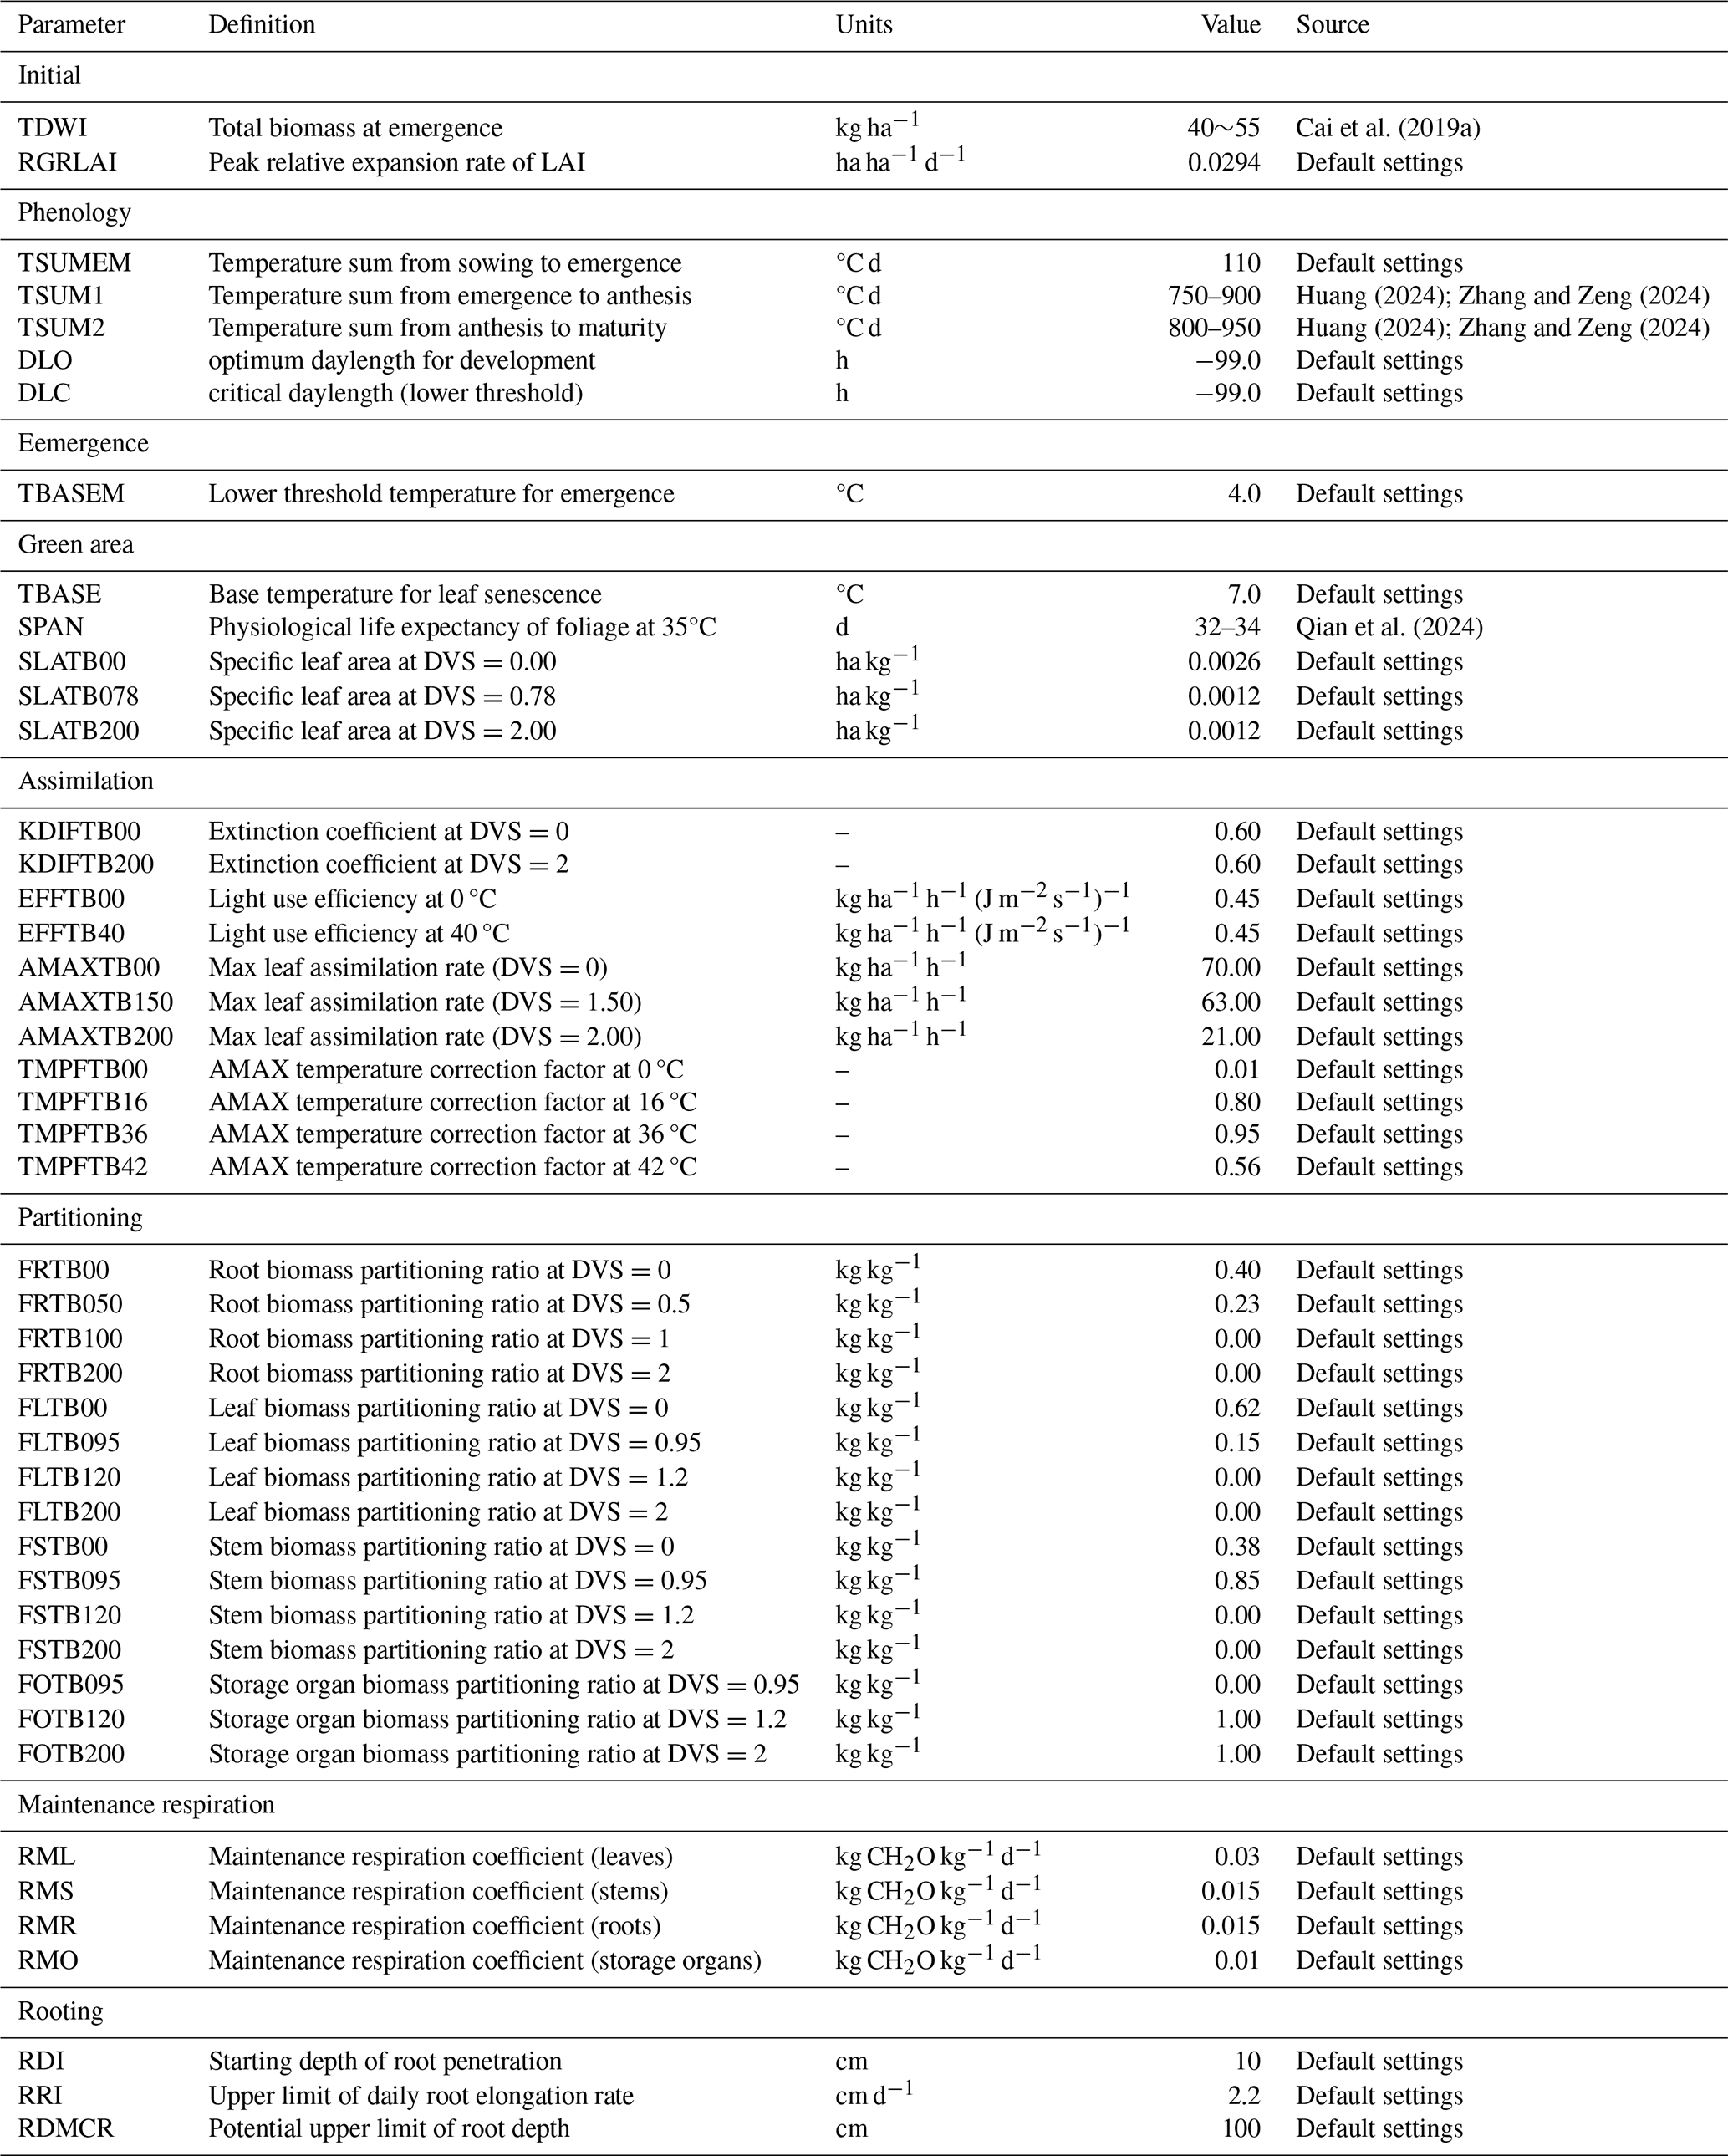
Table A2Bootstrap-derived uncertainty estimates (mean, standard deviation, and 95 % confidence intervals) for deep learning model performance metrics.
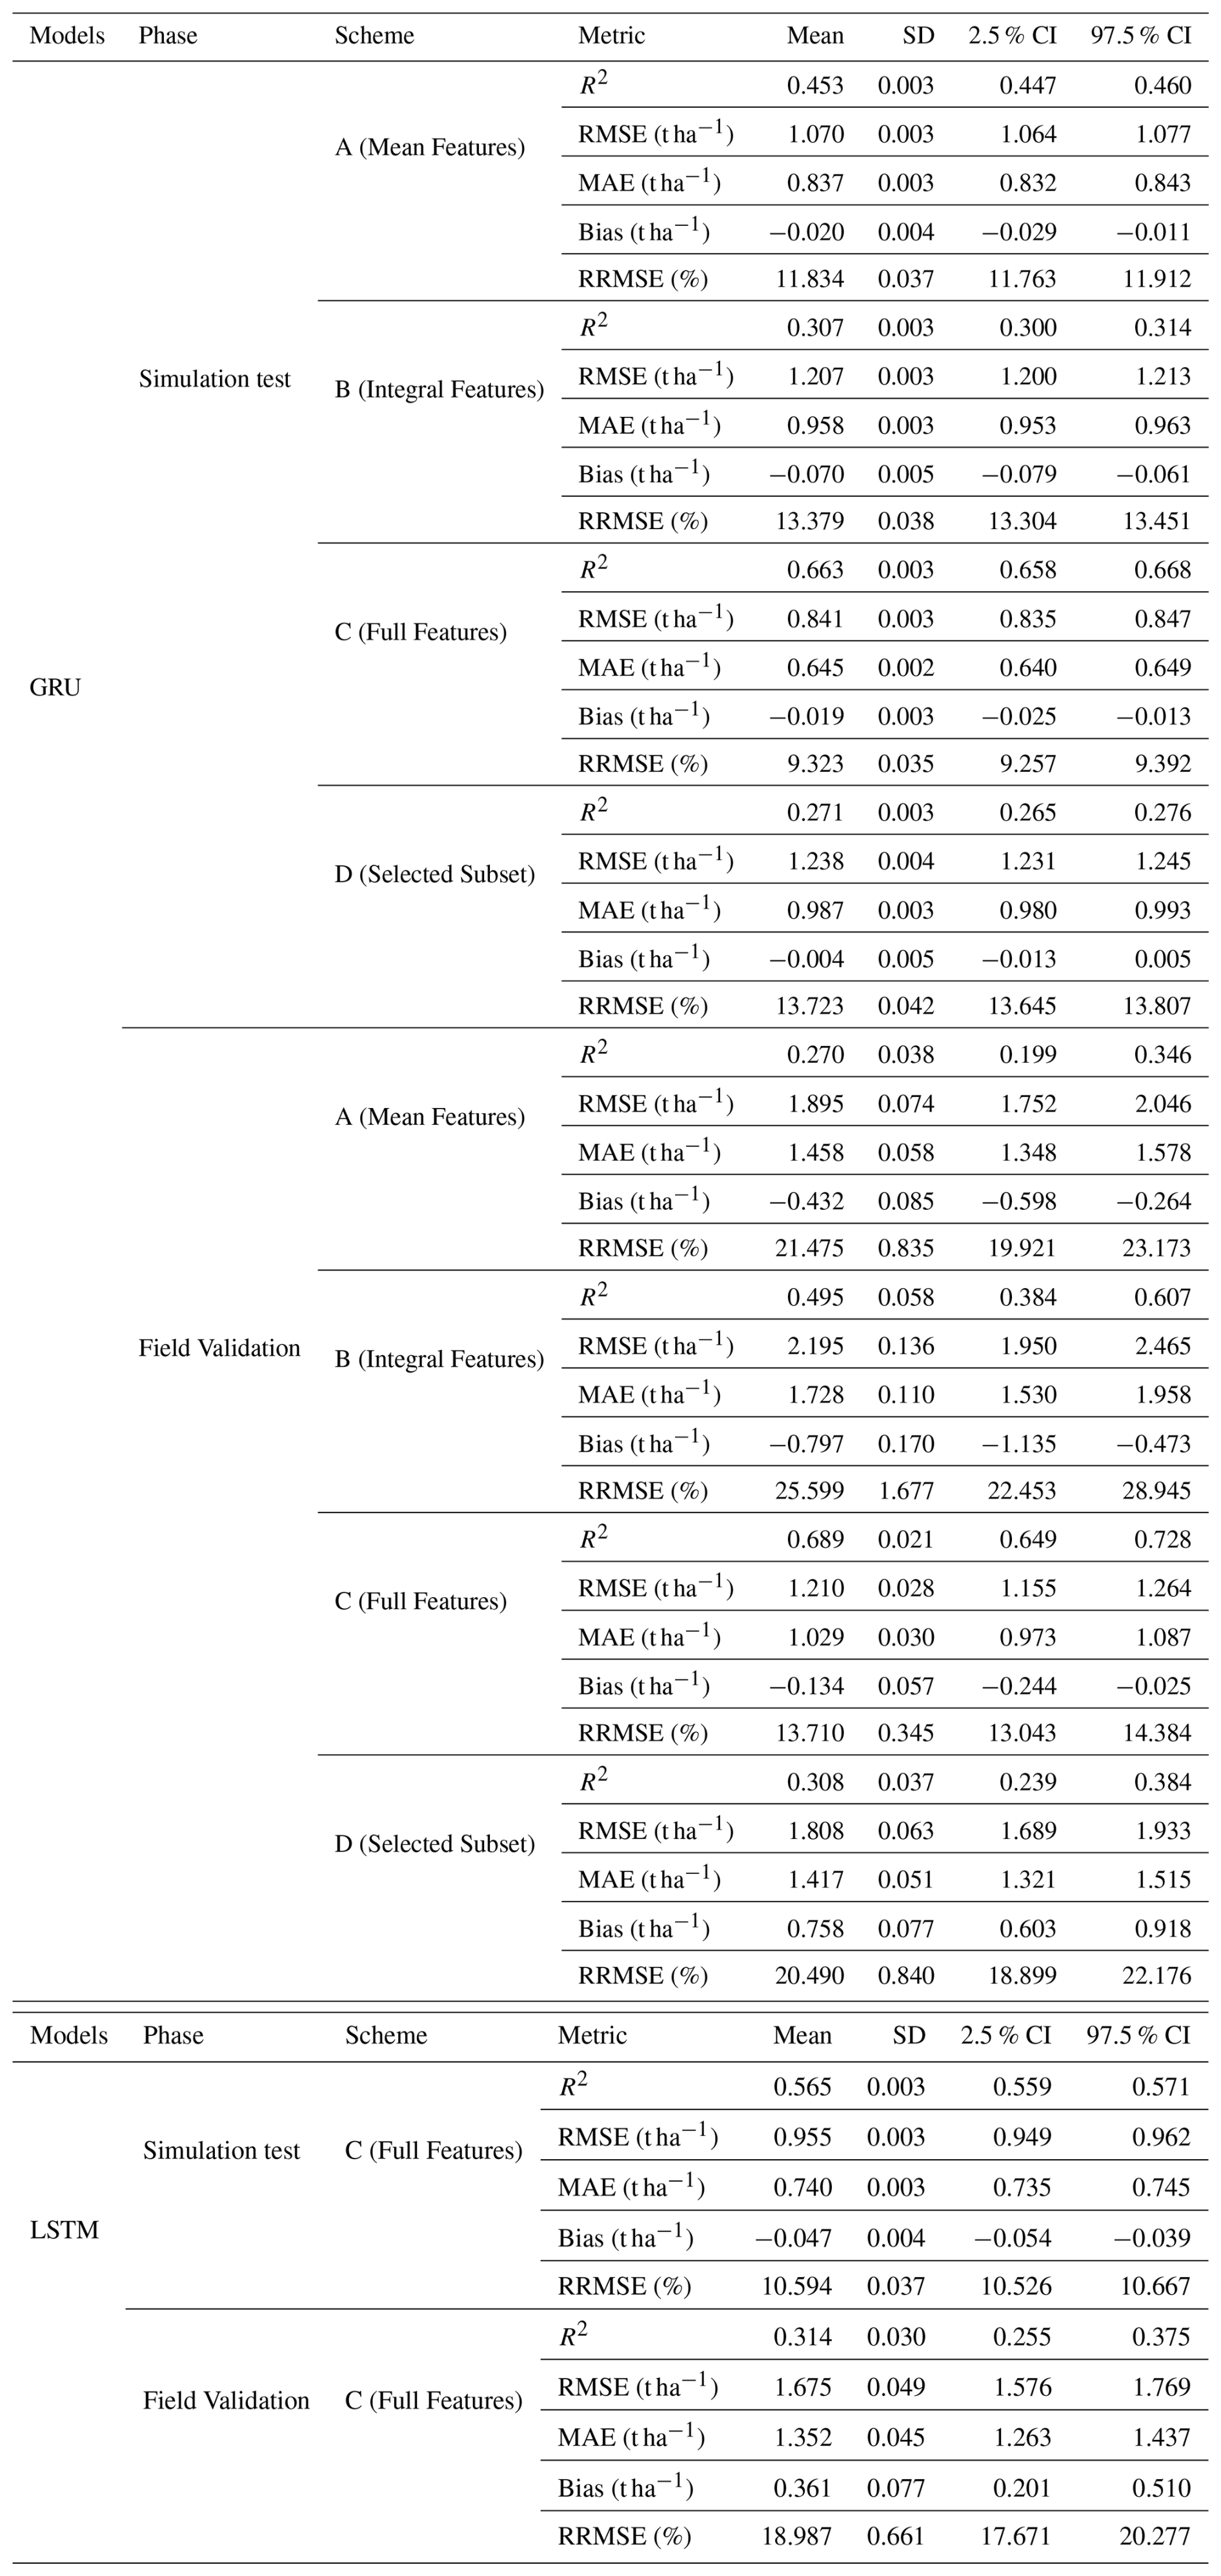

Figure A1Correlation matrix heatmaps of input features with simulated yield. (A) Pearson correlation coefficient; (B) Spearman rank correlation coefficient.
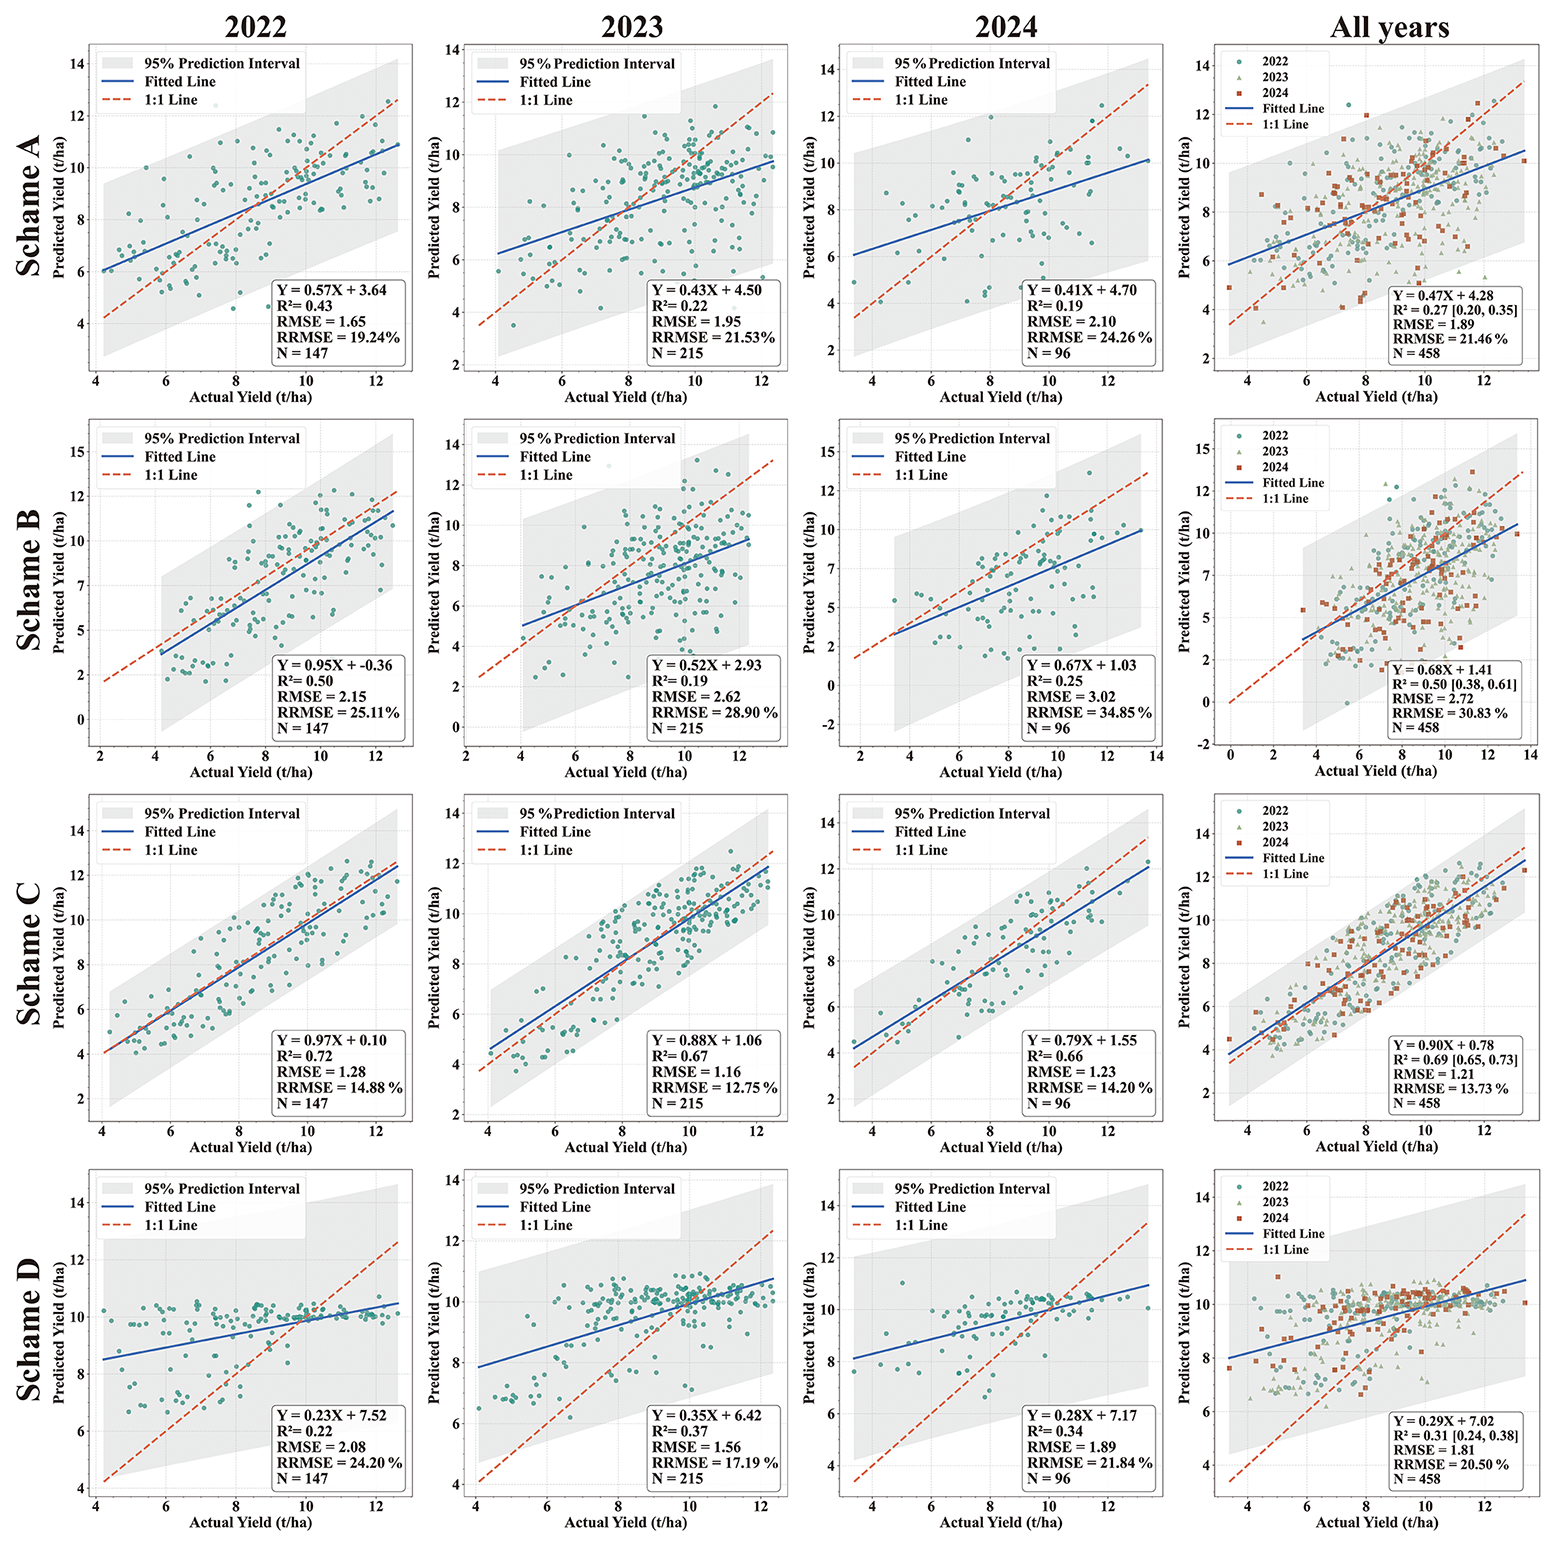
Figure A2Year-by-year independent validation of the GRU yield estimation models under four different feature schemes (A–D) using in situ measurements from 2022 to 2024

Figure A3Performance of LSTM models under Scheme C (Full Features) and independent validation using in situ yield measurements (2022–2024).

Figure A4Year-by-year independent validation of the RF yield estimation models under four different feature schemes (A–D) using in situ measurements from 2022 to 2024.
JH: Writing – review & editing, Writing – original draft, Validation, Methodology, Formal analysis, Data curation, Conceptualization. XD: Writing – review & editing, Supervision, Resources, Project administration, Investigation, Funding acquisition, Conceptualization. QL: Supervision, Investigation, Funding acquisition. YuaZ: Supervision, Project administration, Funding acquisition. HW: Resources, Funding acquisition, Conceptualization. JL: Methodology, Investigation, Data curation. JX: Validation, Investigation, Data curation. YacZ: Writing – review & editing, Methodology, Conceptualization. ZZ: Resources, Investigation, Data curation. YD: Writing – review & editing, Methodology. YS: Writing – review & editing, Supervision, Methodology.
The contact author has declared that none of the authors has any competing interests.
Publisher's note: Copernicus Publications remains neutral with regard to jurisdictional claims made in the text, published maps, institutional affiliations, or any other geographical representation in this paper. The authors bear the ultimate responsibility for providing appropriate place names. Views expressed in the text are those of the authors and do not necessarily reflect the views of the publisher.
The authors are grateful to China's Civil Space Infrastructure for granting access to in-situ LAI datasets through its Common Application Support Platform for Land Observation Satellites.
We acknowledge the use of AI-based language tools, including Gemini and ChatGPT, to assist with improving the consistency and clarity of the manuscript. These tools were used solely for language refinement and did not influence the scientific content, analysis, or conclusions.
This research has been supported by the National Key Research and Development Program of China (grant no. 2021YFD1500103), the Strategic Priority Research Program of the Chinese Academy of Sciences (grant no. XDA28070504), the National Natural Science Foundation of China (grant no. 42371359), and the Natural Science Foundation of Beijing Municipality (grant no. L251051).
This paper was edited by Jia Yang and reviewed by two anonymous referees.
Atzberger, C.: Advances in remote sensing of agriculture: Context description, existing operational monitoring systems and major information needs, Remote Sens., 5, 949–981, https://doi.org/10.3390/rs5020949, 2013.
Bakó, K., Rácz, C., Dövényi-Nagy, T., Molnár, K., and Dobos, A.: Advancements in leaf area index estimation for maize using modeling and remote sensing techniques: A review, Agronomy, 15, 519, https://doi.org/10.3390/agronomy15030519, 2025.
Ban, H.-Y., Kim, K., Park, N.-W., and Lee, B.-W.: Using MODIS data to predict regional corn yields, Remote Sens., 9, 16, https://doi.org/10.3390/rs9010016, 2016.
Becker-Reshef, I., Vermote, E., Lindeman, M., and Justice, C.: A generalized regression-based model for forecasting winter wheat yields in kansas and ukraine using MODIS data, Remote Sens. Environ., 114, 1312–1323, https://doi.org/10.1016/j.rse.2010.01.010, 2010.
Boogaard, H. L., van Diepen, C. A., Rötter, R. P., Cabrera, J. M. C. A., and van Laar, H. H.: WOFOST7.1: A user's guide, https://doi.org/10.13140/RG.2.1.1814.1282, 1998.
Borrás, L., Curá, J. A., and Otegui, M. E.: Maize kernel composition and post-flowering source-sink ratio, Crop Sci., 42, 781–790, https://doi.org/10.2135/cropsci2002.7810, 2002.
Breiman, L.: Random forests, Mach. Learn., 45, 5–32, 2001.
Burke, M. and Lobell, D. B.: Satellite-based assessment of yield variation and its determinants in smallholder african systems, P. Natl. Acad. Sci. USA, 114, 2189–2194, https://doi.org/10.1073/pnas.1616919114, 2017.
Cai, F., Mi, N., Ji, R.-P., Ming, H.-Q., Feng, R., Zhang, S.-J., Zhang, H., Zhao, X.-L., and Zhang, Y.-S.: Determination of crop parameters for WOFOST model and its performance evaluation based on field experiment of spring maize in Jinzhou,Liaoning, Chinese Journal of Ecology, 38, 1238–1248, https://doi.org/10.13292/j.1000-4890.201904.031, 2019a.
Cai, F., Mi, N., Ming, H., Zhang, Y., Zhang, H., Zhang, S., Zhao, X., and Zhang, B.: Responses of dry matter accumulation and partitioning to drought and subsequent rewatering at different growth stages of maize in Northeast China, Front. Plant Sci., 14, 1110727, https://doi.org/10.3389/fpls.2023.1110727, 2023.
Cai, Y., Guan, K., Lobell, D., Potgieter, A. B., Wang, S., Peng, J., Xu, T., Asseng, S., Zhang, Y., You, L., and Peng, B.: Integrating satellite and climate data to predict wheat yield in australia using machine learning approaches, Agr. Forest Meteorol., 274, 144–159, https://doi.org/10.1016/j.agrformet.2019.03.010, 2019b.
Cheng, Z., Gu, X., Zhang, Y., Fang, X., Xu, Y., Sun, S., Du, Y., and Cai, H.: Integrating multiple crop models and multi-source data in a knowledge-guided deep learning framework for wheat and maize yield forecasting in the huang-huai-hai plain, China, Field Crops Res., 340, 110372, https://doi.org/10.1016/j.fcr.2026.110372, 2026.
China Meteorological Administration: China Climate Bulletin 2023, National Climate Centre, China Meteorological Administration, Beijing, China, https://www.cma.gov.cn/zfxxgk/gknr/qxbg/202402/t20240223_6084527.html (last access: 13 August 2026), 2024.
Cho, K., Merrienboer, B. van, Gulcehre, C., Bahdanau, D., Bougares, F., Schwenk, H., and Bengio, Y.: Learning phrase representations using RNN encoder-decoder for statistical machine translation, arXiv [preprint], https://doi.org/10.48550/arXiv.1406.1078, 2014.
Chuanwei, Z., Gao, J., Liu, L., and Wu, S.: Simulating the effects of optimizing sowing date and variety shift on maize production at finer scale in northeast China under future climate, J. Sci. Food Agr., 104, 3637–3647, https://doi.org/10.1002/jsfa.13247, 2024.
Chung, J., Gulcehre, C., Cho, K., and Bengio, Y.: Empirical evaluation of gated recurrent neural networks on sequence modeling, arXiv [preprint], https://doi.org/10.48550/arXiv.1412.3555, 2014.
Ciampitti, I. and Vyn, T.: Grain nitrogen source changes over time in maize: A review, Crop Sci., 53, https://doi.org/10.2135/cropsci2012.07.0439, 2012.
Cui, Y., Liu, S., Li, X., Geng, H., Xie, Y., and He, Y.: Estimating Maize Yield in the Black Soil Region of Northeast China Using Land Surface Data Assimilation: Integrating a Crop Model and Remote Sensing, Front. Plant Sci., 13, 915109, https://doi.org/10.3389/fpls.2022.915109, 2022.
de Wit, A., Boogaard, H., Fumagalli, D., Janssen, S., Knapen, R., van Kraalingen, D., Supit, I., van der Wijngaart, R., and van Diepen, K.: 25 years of the WOFOST cropping systems model, Agric. Syst., 168, 154–167, https://doi.org/10.1016/j.agsy.2018.06.018, 2019.
Drusch, M., Del Bello, U., Carlier, S., Colin, O., Fernandez, V., Gascon, F., Hoersch, B., Isola, C., Laberinti, P., Martimort, P., Meygret, A., Spoto, F., Sy, O., Marchese, F., and Bargellini, P.: Sentinel-2: ESA's optical high-resolution mission for GMES operational services, Remote Sens. Environ., 120, 25–36, https://doi.org/10.1016/j.rse.2011.11.026, 2012.
Du, X., Zhu, J., Xu, J., Li, Q., Tao, Z., Zhang, Y., Wang, H., and Hu, H.: Remote sensing-based winter wheat yield estimation integrating machine learning and crop growth multi-scenario simulations, Int. J. Digit. Earth, 18, https://doi.org/10.1080/17538947.2024.2443470, 2025.
Duchemin, B., Maisongrande, P., Boulet, G., and Benhadj, I.: A simple algorithm for yield estimates: Evaluation for semi-arid irrigated winter wheat monitored with green leaf area index, Environ. Modell. Softw., 23, 876–892, https://doi.org/10.1016/j.envsoft.2007.10.003, 2008.
Everingham, Y., Sexton, J., Skocaj, D., and Inman-Bamber, G.: Accurate prediction of sugarcane yield using a random forest algorithm, Agron. Sustain. Dev., 36, 27, https://doi.org/10.1007/s13593-016-0364-z, 2016.
Feng, P., Wang, B., Liu, D. L., Waters, C., Xiao, D., Shi, L., and Yu, Q.: Dynamic wheat yield forecasts are improved by a hybrid approach using a biophysical model and machine learning technique, Agr. Forest Meteorol., 285–286, 107922, https://doi.org/10.1016/j.agrformet.2020.107922, 2020.
Feng, Z., Cheng, Z., Ren, L., Liu, B., Zhang, C., Zhao, D., Sun, H., Feng, H., Long, H., Xu, B., Yang, H., Song, X., Ma, X., Yang, G., and Zhao, C.: Real-time monitoring of maize phenology with the VI-RGS composite index using time-series UAV remote sensing images and meteorological data, Comput. Electron. Agr., 224, 109212, https://doi.org/10.1016/j.compag.2024.109212, 2024.
Foley, J. A., Ramankutty, N., Brauman, K. A., Cassidy, E. S., Gerber, J. S., Johnston, M., Mueller, N. D., O'Connell, C., Ray, D. K., West, P. C., Balzer, C., Bennett, E. M., Carpenter, S. R., Hill, J., Monfreda, C., Polasky, S., Rockström, J., Sheehan, J., Siebert, S., Tilman, D., and Zaks, D. P. M.: Solutions for a cultivated planet, Nature, 478, 337–342, https://doi.org/10.1038/nature10452, 2011.
Godfray, H. C. J., Beddington, J. R., Crute, I. R., Haddad, L., Lawrence, D., Muir, J. F., Pretty, J., Robinson, S., Thomas, S. M., and Toulmin, C.: Food security: The challenge of feeding 9 billion people, Science, 327, 812–818, https://doi.org/10.1126/science.1185383, 2010.
Hauke, J. and Kossowski, T.: Comparison of values of pearson's and spearman's correlation coefficients on the same sets of data, Quaestiones Geographicae, 30, 87–93, 2011.
Hochreiter, S. and Schmidhuber, J.: Long short-term memory, Neural Comput., 9, 1735–1780, https://doi.org/10.1162/neco.1997.9.8.1735, 1997.
Holzworth, D. P., Huth, N. I., deVoil, P. G., Zurcher, E. J., Herrmann, N. I., McLean, G., Chenu, K., van Oosterom, E. J., Snow, V., Murphy, C., Moore, A. D., Brown, H., Whish, J. P. M., Verrall, S., Fainges, J., Bell, L. W., Peake, A. S., Poulton, P. L., Hochman, Z., Thorburn, P. J., Gaydon, D. S., Dalgliesh, N. P., Rodriguez, D., Cox, H., Chapman, S., Doherty, A., Teixeira, E., Sharp, J., Cichota, R., Vogeler, I., Li, F. Y., Wang, E., Hammer, G. L., Robertson, M. J., Dimes, J. P., Whitbread, A. M., Hunt, J., van Rees, H., McClelland, T., Carberry, P. S., Hargreaves, J. N. G., MacLeod, N., McDonald, C., Harsdorf, J., Wedgwood, S., and Keating, B. A.: APSIM – evolution towards a new generation of agricultural systems simulation, Environ. Modell. Softw., 62, 327–350, https://doi.org/10.1016/j.envsoft.2014.07.009, 2014.
Hu, J., Du, X., Li, Q., Zhang, Y., Wang, H., Luo, J., Xu, J., Zhao, Y., Zhang, Z., Dong, Y., and Shen, Y.: NortheastChinaMaizeYield10m: A 10-m Resolution Maize Yield Dataset for Northeast China (2019–2024) Generated via a Mechanistically Interpretable, Field-label-free Framework, Zenodo [data set], https://doi.org/10.5281/zenodo.19547014, 2026.
Hu, S. and Mo, X.: Interpreting spatial heterogeneity of crop yield with a process model and remote sensing, Ecol. Model., 222, 2530–2541, https://doi.org/10.1016/j.ecolmodel.2010.11.011, 2011.
Hu, T., Zhang, X., Bohrer, G., Liu, Y., Zhou, Y., Martin, J., Li, Y., and Zhao, K.: Crop yield prediction via explainable AI and interpretable machine learning: Dangers of black box models for evaluating climate change impacts on crop yield, Agr. Forest Meteorol., 336, 109458, https://doi.org/10.1016/j.agrformet.2023.109458, 2023.
Hu, X., Zhang, S., Li, L., Huang, J., Zhao, Z., Liu, K., Zhang, Z., and Yao, X.: Major grain crop mapping in northeast China using sample generation method and ensemble learning, Eur. J. Agron., 169, 127678, https://doi.org/10.1016/j.eja.2025.127678, 2025.
Huang, D.: Simulation of summer maize growth process based on UAV remote sensing and crop model data assimilation, Northwest A&F University, 116 pp., https://doi.org/10.27409/d.cnki.gxbnu.2023.002326, 2024.
Huang, H., Huang, J., Wu, Y., Zhuo, W., Song, J., Li, X., Li, L., Su, W., Ma, H., and Liang, S.: The Improved Winter Wheat Yield Estimation by Assimilating GLASS LAI Into a Crop Growth Model With the Proposed Bayesian Posterior-Based Ensemble Kalman Filter, IEEE T. Geosci. Remote, 61, 1–18, https://doi.org/10.1109/TGRS.2023.3259742, 2023.
Huang, J., Tian, L., Liang, S., Ma, H., Becker-Reshef, I., Huang, Y., Su, W., Zhang, X., Zhu, D., and Wu, W.: Improving winter wheat yield estimation by assimilation of the leaf area index from landsat TM and MODIS data into the WOFOST model, Agr. Forest Meteorol., 204, 106–121, https://doi.org/10.1016/j.agrformet.2015.02.001, 2015.
Huang, Y. and Liu, Z.: Improving northeast China's soybean and maize planting structure through subsidy optimization considering climate change and comparative economic benefit, Land Use Policy, 146, 107319, https://doi.org/10.1016/j.landusepol.2024.107319, 2024.
Huntington, T., Baral, N. R., Yang, M., Sundstrom, E., and Scown, C. D.: Machine learning for surrogate process models of bioproduction pathways, Bioresour. Technol., 370, 128528, https://doi.org/10.1016/j.biortech.2022.128528, 2023.
Hwang, T., Song, C., Bolstad, P. V., and Band, L. E.: Downscaling real-time vegetation dynamics by fusing multi-temporal MODIS and landsat NDVI in topographically complex terrain, Remote Sens. Environ., 115, 2499–2512, https://doi.org/10.1016/j.rse.2011.05.010, 2011.
Jabed, Md. A. and Azmi Murad, M. A.: Crop yield prediction in agriculture: A comprehensive review of machine learning and deep learning approaches, with insights for future research and sustainability, Heliyon, 10, e40836, https://doi.org/10.1016/j.heliyon.2024.e40836, 2024.
Jin, X., Kumar, L., Li, Z., Feng, H., Xu, X., Yang, G., and Wang, J.: A review of data assimilation of remote sensing and crop models, Eur. J. Agron., 92, 141–152, https://doi.org/10.1016/j.eja.2017.11.002, 2018.
Jones, J. W., Hoogenboom, G., Porter, C. H., Boote, K. J., Batchelor, W. D., Hunt, L., Wilkens, P. W., Singh, U., Gijsman, A. J., and Ritchie, J. T.: The DSSAT cropping system model, Eur. J. Agron., 18, 235–265, 2003.
Kamilaris, A. and Prenafeta-Boldú, F. X.: Deep learning in agriculture: A survey, Comput. Electron. Agr., 147, 70–90, https://doi.org/10.1016/j.compag.2018.02.016, 2018.
Khaki, S., Wang, L., and Archontoulis, S. V.: A CNN-RNN framework for crop yield prediction, Front. Plant Sci., 10, 1750, https://doi.org/10.3389/fpls.2019.01750, 2020.
Khan, S. N., Iqbal, J., Khan, M. R., Malik, N. A., Khan, F. A., Khan, K., Khan, A. N., and Wahab, A.: Using remotely sensed vegetation indices and multi-stream deep learning improves county-level corn yield predictions, Eur. J. Agron., 164, 127496, https://doi.org/10.1016/j.eja.2024.127496, 2025.
Kosmowski, F., Chamberlin, J., Ayalew, H., Sida, T., Abay, K., and Craufurd, P.: How accurate are yield estimates from crop cuts? Evidence from smallholder maize farms in ethiopia, Food Policy, 102, 102122, https://doi.org/10.1016/j.foodpol.2021.102122, 2021.
LeCun, Y., Bengio, Y., and Hinton, G.: Deep learning, Nature, 521, 436–444, https://doi.org/10.1038/nature14539, 2015.
Li, X., Lyu, Y., Zhu, B., Liu, L., and Song, K.: Maize yield estimation in northeast China's black soil region using a deep learning model with attention mechanism and remote sensing, Sci. Rep., 15, 12927, https://doi.org/10.1038/s41598-025-97563-6, 2025.
Li, Z. G., Yang, P., Tang, H. J., Wu, W. B., Chen, Z. X., Liu, J., Zhang, L., Tan, J. Y., and Tang, P. Q.: Trends of spring maize phenophases and spatio-temporal responses to temperature in three provinces of Northeast China during the past 20 years, Acta Ecol. Sin., 33, 5818–5827, https://doi.org/10.5846/stxb201304010573, 2013.
Liu, K., Harrison, M., Shabala, S., Meinke, H., Ahmed, I., Zhang, Y., Tian, X., and Zhou, M.: The state of the art in modeling waterlogging impacts on plants: What do we know and what do we need to know, Earth's Future, https://doi.org/10.1029/2020EF001801, 2020.
Lobell, D. B., Azzari, G., Burke, M., Gourlay, S., Jin, Z., Kilic, T., and Murray, S.: Eyes in the sky, boots on the ground: Assessing satellite‐ and ground‐based approaches to crop yield measurement and analysis, Am. J. Agric. Econ., 102, 202–219, https://doi.org/10.1093/ajae/aaz051, 2020.
Lu, J., Li, J., Fu, H., Zou, W., Kang, J., Yu, H., and Lin, X.: Estimation of rice yield using multi-source remote sensing data combined with crop growth model and deep learning algorithm, Agr. Forest Meteorol., 370, 110600, https://doi.org/10.1016/j.agrformet.2025.110600, 2025.
Luo, L., Sun, S., Xue, J., Gao, Z., Zhao, J., Yin, Y., Gao, F., and Luan, X.: Crop yield estimation based on assimilation of crop models and remote sensing data: A systematic evaluation, Agric. Syst., 210, 103711, https://doi.org/10.1016/j.agsy.2023.103711, 2023.
Ma, Y., Liang, S.-Z., Myers, D. B., Swatantran, A., and Lobell, D. B.: Subfield-level crop yield mapping without ground truth data: A scale transfer framework, Remote Sens. Environ., 315, 114427, https://doi.org/10.1016/j.rse.2024.114427, 2024.
Monteith, J. L.: Climate and the efficiency of crop production in britain, Philos. T. R. Soc. Lond. B, 281, 277–294, https://doi.org/10.1098/rstb.1977.0140, 1977.
Muruganantham, P., Wibowo, S., Grandhi, S., Samrat, N. H., and Islam, N.: A systematic literature review on crop yield prediction with deep learning and remote sensing, Remote Sens., 14, 1990, https://doi.org/10.3390/rs14091990, 2022.
National Soil Survey Office: Soil Species of China, China Agriculture Press, Beijing, 924 pp., https://www.resdc.cn/data.aspx?DATAID=145 (last access: 13 August 2026), 1995.
Nguy-Robertson, A., Gitelson, A., Peng, Y., Viña, A., Arkebauer, T., and Rundquist, D.: Green Leaf Area Index Estimation in Maize and Soybean: Combining Vegetation Indices to Achieve Maximal Sensitivity, Agron. J., 104, 1336–1347, https://doi.org/10.2134/agronj2012.0065, 2012.
Qi, D., Wang, C., Bai, X., Gao, Y., Sun, Q., Li, C., Tang, K., and Zhao, Y.: Characteristics and causes of extreme heavy rainfall in Heilongjiang Province during August 2023, J. Appl. Meteorol. Sci., 35, 257–271, https://doi.org/10.11898/1001-7313.20240301, 2024.
Qian, F., Wang, H., Wang, X., Yu, Y., Xin, J., and Gu, H.: Maize yield estimation at county level based on world food studies model and remote sensing data assimilation, Journal of Shenyang Agricultural University, 55, 138–152, https://doi.org/10.3969/j.issn.1000-1700.2024.02.002, 2024.
Qiao, M., He, X., Cheng, X., Li, P., Luo, H., Zhang, L., and Tian, Z.: Crop yield prediction from multi-spectral, multi-temporal remotely sensed imagery using recurrent 3D convolutional neural networks, Int. J. Appl. Earth Obs., 102, 102436, https://doi.org/10.1016/j.jag.2021.102436, 2021.
Raes, D., Steduto, P., Hsiao, T. C., and Fereres, E.: AquaCrop – the FAO crop model to simulate yield response to water: II. Main algorithms and software description, Agron. J., 101, 438–447, 2009.
Reichstein, M., Camps-Valls, G., Stevens, B., Jung, M., Denzler, J., Carvalhais, N., and Prabhat: Deep learning and process understanding for data-driven earth system science, Nature, 566, 195–204, https://doi.org/10.1038/s41586-019-0912-1, 2019.
Rembold, F., Atzberger, C., Savin, I., and Rojas, O.: Using low resolution satellite imagery for yield prediction and yield anomaly detection, Remote Sens., 5, 1704–1733, https://doi.org/10.3390/rs5041704, 2013.
Ren, Y., Li, Q., Du, X., Zhang, Y., Wang, H., Shi, G., and Wei, M.: Analysis of Corn Yield Prediction Potential at Various Growth Phases Using a Process-Based Model and Deep Learning, Plants, 12, 446, https://doi.org/10.3390/plants12030446, 2023.
Ruiz, A., Listello, A., Trifunovic, S., and Archontoulis, S. V.: Maize breeding enhances lodging resistance through vertical allocation changes of stem dry matter and nitrogen, Front. Plant Sci., 16, https://doi.org/10.3389/fpls.2025.1514045, 2025.
Schwalbert, R. A., Amado, T., Corassa, G., Pott, L. P., Prasad, P. V. V., and Ciampitti, I. A.: Satellite-based soybean yield forecast: Integrating machine learning and weather data for improving crop yield prediction in southern brazil, Agr. Forest Meteorol., 284, 107886, https://doi.org/10.1016/j.agrformet.2019.107886, 2020.
Shi, X. Z., Yu, D. S., Warner, E. D., Pan, X. Z., Petersen, G. W., Gong, Z. G., and Weindorf, D. C.: Soil database of 1:1,000,000 digital soil survey and reference system of the Chinese genetic soil classification system, Soil Survey Horizons, 45, 129–136, https://doi.org/10.2136/sh2004.4.0129, 2004.
Sun, J., Di, L., Sun, Z., Shen, Y., and Lai, Z.: County-level soybean yield prediction using deep CNN-LSTM model, Sensors, 19, 4363, https://doi.org/10.3390/s19204363, 2019.
Sun, X., Li, Q., Qiao, Y., Hu, Z., Zhang, X., and Liu, Y.: Warming and drought in hailun of heilongjiang: Effects on growth and development of soybean, Chin. Agric. Sci. Bull., 38, 27–33, https://doi.org/10.11924/j.issn.1000-6850.casb2021-0788, 2022.
Tan, J., Yang, P., Liu, Z., Wu, W., Zhang, L., Li, Z., You, L., Tang, H., and Li, Z.: Spatio-temporal dynamics of maize cropping system in northeast China between 1980 and 2010 by using spatial production allocation model, J. Geogr. Sci, 24, 397–410, https://doi.org/10.1007/s11442-014-1096-0, 2014.
Teng, F., Wang, M., Shi, W., Pan, L., Guo, J., and Xiao, X.: A 10 m maize, rice and soybean yield dataset from 2016 to 2021 in northeast China, Sci. Data, 13, 344, https://doi.org/10.1038/s41597-026-06719-0, 2026.
Tian, H., Wang, P., Tansey, K., Zhang, J., Zhang, S., and Li, H.: An LSTM neural network for improving wheat yield estimates by integrating remote sensing data and meteorological data in the guanzhong plain, PR China, Agr. Forest Meteorol., 310, 108629, https://doi.org/10.1016/j.agrformet.2021.108629, 2021.
Tian, H., Wang, P., Tansey, K., and Zhang, S.: A knowledge-guided deep learning framework with remotely sensed variables and meteorological variables for improving wheat yield estimation, IEEE T. Geosci. Remote, 63, 1–13, https://doi.org/10.1109/TGRS.2025.3600418, 2025.
Ullah, K., Akram, W., Hassan, A., Bokhari, S. A. S., Abid, S., Yousaf, H., and Farooq, A.: Hybrid CNN–BiGRU model with attention mechanism for enhanced short-term load forecasting, Energy Rep., 14, 2570–2577, https://doi.org/10.1016/j.egyr.2025.09.035, 2025.
Umutoni, L. and Samadi, V.: Coupling AquaCrop and machine learning approaches for cotton yield simulation, Elsevier, 291–313, https://doi.org/10.1016/B978-0-443-13293-3.00007-5, 2024.
van Diepen, C. A., Wolf, J., van Keulen, H., and Rappoldt, C.: WOFOST: A simulation model of crop production, Soil Use Manage., 5, 16–24, https://doi.org/10.1111/j.1475-2743.1989.tb00755.x, 1989.
van Klompenburg, T., Kassahun, A., and Catal, C.: Crop yield prediction using machine learning: A systematic literature review, Comput. Electron. Agr., 177, 105709, https://doi.org/10.1016/j.compag.2020.105709, 2020.
Wang, J., Wang, P., Tian, H., Tansey, K., Liu, J., and Quan, W.: A deep learning framework combining CNN and GRU for improving wheat yield estimates using time series remotely sensed multi-variables, Comput. Electron. Agr., 206, 107705, https://doi.org/10.1016/j.compag.2023.107705, 2023.
Wang, L., Chen, J., Ren, B., Zhao, B., Liu, P., Dong, S., and Zhang, J.: Water use characteristics of an early and late maturing maize hybrid using stable isotopes, Agron. J., 116, 661–673, https://doi.org/10.1002/agj2.21515, 2024a.
Wang, Y., Feng, K., Sun, L., Xie, Y., and Song, X.-P.: Satellite-based soybean yield prediction in argentina: A comparison between panel regression and deep learning methods, Comput. Electron. Agr., 221, 108978, https://doi.org/10.1016/j.compag.2024.108978, 2024b.
Wang, Y., Shen, Y.-J., Yu, S., Zhang, X., and Xiao, D.: Climate extremes are critical to maize yield and will be severer in north China, Clim. Risk Manage., 48, 100710, https://doi.org/10.1016/j.crm.2025.100710, 2025.
Weiss, M., Jacob, F., and Duveiller, G.: Remote sensing for agricultural applications: A meta-review, Remote Sens. Environ., 236, 111402, https://doi.org/10.1016/j.rse.2019.111402, 2020.
Woodhead, T.: Simulation of assimilation, respiration and transpiration of crops. By D. T. de Wit et al. Pudoc (Wageningen), 1978. Pp. 140. D.F1.22.50, Q. J. Roy. Meteor. Soc., 105, 728–729, https://doi.org/10.1002/qj.49710544518, 1979.
Wu, S., Yang, P., Ren, J., Chen, Z., and Li, H.: Regional winter wheat yield estimation based on the WOFOST model and a novel VW-4DEnSRF assimilation algorithm, Remote Sens. Environ., 255, 112276, https://doi.org/10.1016/j.rse.2020.112276, 2021.
Xie, J., Zhang, D., Jin, N., Cheng, T., Zhao, G., Han, D., Niu, Z., and Li, W.: Coupling crop growth models and machine learning for scalable winter wheat yield estimation across major wheat regions in China, Agr. Forest Meteorol., 372, 110687, https://doi.org/10.1016/j.agrformet.2025.110687, 2025.
Xie, Y. and Huang, J.: Integration of a crop growth model and deep learning methods to improve satellite-based yield estimation of winter wheat in henan province, China, Remote Sens., 13, 4372, https://doi.org/10.3390/rs13214372, 2021.
Xu, J., Du, X., Dong, T., Li, Q., Zhang, Y., Wang, H., Liu, M., Zhu, J., and Yang, J.: Estimation of sugarcane biomass from sentinel-2 leaf area index using an improved SAFY model (SAFY-sugar), Int. J. Appl. Earth Obs., 140, 104570, https://doi.org/10.1016/j.jag.2025.104570, 2025.
Xu, J., Du, X., Dong, T., Li, Q., Zhang, Y., Wang, H., Xiao, J., Zhang, J., Shen, Y., and Dong, Y.: NortheastChinaSoybeanYield20m: an annual soybean yield dataset at 20 m in Northeast China from 2019 to 2023, Earth Syst. Sci. Data, 18, 2413–2441, https://doi.org/10.5194/essd-18-2413-2026, 2026.
Xu, Q., Liang, H., Wei, Z., Zhang, Y., Lu, X., Li, F., Wei, N., Zhang, S., Yuan, H., Liu, S., and Dai, Y.: Assessing climate change impacts on crop yields and exploring adaptation strategies in northeast China, Earth's Future, 12, e2023EF004063, https://doi.org/10.1029/2023EF004063, 2024.
Yang, S., Hu, L., Wu, H., Ren, H., Qiao, H., Li, P., and Fan, W.: Integration of crop growth model and random forest for winter wheat yield estimation from UAV hyperspectral imagery, IEEE J. Sel. Top. Appl. Earth Obs., 14, 6253–6269, https://doi.org/10.1109/JSTARS.2021.3089203, 2021.
Yin, J., Li, F., Li, M., Xia, R., Bao, X., Sun, J., and Liang, X.: The unique features in the 4 d widespread extreme rainfall event over North China in July 2023, Nat. Hazards Earth Syst. Sci., 25, 1719–1735, https://doi.org/10.5194/nhess-25-1719-2025, 2025.
Yin, X. G., Jabloun, M., Olesen, J. E., Öztürk, I., Wang, M., and Chen, F.: Effects of climatic factors, drought risk and irrigation requirement on maize yield in the northeast farming region of China, J. Agr. Sci., 154, 1171–1189, https://doi.org/10.1017/S0021859616000150, 2016.
You, N., Dong, J., Huang, J., Du, G., Zhang, G., He, Y., Yang, T., Di, Y., and Xiao, X.: The 10-m crop type maps in northeast China during 2017–2019, Sci. Data, 8, 41, https://doi.org/10.1038/s41597-021-00827-9, 2021.
Yunita, A., Pratama, M. I., Almuzakki, M. Z., Ramadhan, H., Akhir, E. A. P., Firdausiah Mansur, A. B., and Basori, A. H.: Performance analysis of neural network architectures for time series forecasting: A comparative study of RNN, LSTM, GRU, and hybrid models, MethodsX, 15, 103462, https://doi.org/10.1016/j.mex.2025.103462, 2025.
Zeng, L., Wardlow, B. D., Xiang, D., Hu, S., and Li, D.: A review of vegetation phenological metrics extraction using time-series, multispectral satellite data, Remote Sens. Environ., 237, 111511, https://doi.org/10.1016/j.rse.2019.111511, 2020.
Zhang, L., Li, C., Zhang, G., Wu, X., Zhou, L., Chen, L., Jiao, Y., Liu, G., and Hei, W.: Winter wheat yield estimation based on multisource remote sensing data: A dual-branch TCN-transformer model and analysis of growth-stage feature transition mechanisms, Comput. Electron. Agr., 239, 111014, https://doi.org/10.1016/j.compag.2025.111014, 2025a.
Zhang, Q.-J., Wu, D.-L., Zhu, Y.-C., Liu, C., and Yang, D.-S.: A long-term dataset of maize phenology observations from agrometeorological stations in northeast China (1981–2024), Sci. Data, https://doi.org/10.1038/s41597-025-06330-9, 2025b.
Zhang, X., Friedl, M. A., Schaaf, C. B., Strahler, A. H., Hodges, J. C. F., Gao, F., Reed, B. C., and Huete, A.: Monitoring vegetation phenology using MODIS, Remote Sens. Environ., 84, 471–475, https://doi.org/10.1016/S0034-4257(02)00135-9, 2003.
Zhang, Y. and Zeng, W. Z.: Regional maize yield estimation based on assimilating net primary production, Water Saving Irrigation, 61–67, https://doi.org/10.12396/jsgg.2023480, 2024.
Zhao, G.-S., Wang, J.-B., Fan, W.-Y., and Ying, T.-Y.: Vegetation net primary productivity in Northeast China in 2000–2008: simulation and seasonal change, Chinese Journal of Applied Ecology, 22, 621–630, 2011.
Zhao, J., Liu, Z., Lv, S., Lin, X., Li, T., and Yang, X.: Changing maize hybrids helps adapt to climate change in northeast China: Revealed by field experiment and crop modelling, Agr. Forest Meteorol., 342, 109693, https://doi.org/10.1016/j.agrformet.2023.109693, 2023.
Zhao, Y., Potgieter, A. B., Zhang, M., Wu, B., and Hammer, G. L.: Predicting wheat yield at the field scale by combining high-resolution sentinel-2 satellite imagery and crop modelling, Remote Sens., 12, 1024, https://doi.org/10.3390/rs12061024, 2020.
Zhu, W., He, B., Xie, Z., Zhao, C., Zhuang, H., and Li, P.: Reconstruction of Vegetation Index Time Series Based on Self-Weighting Function Fitting from Curve Features, Remote Sens., 14, 2247, https://doi.org/10.3390/rs14092247, 2022.