the Creative Commons Attribution 4.0 License.
the Creative Commons Attribution 4.0 License.
 | 25 Aug 2026
A daily gridded dataset of the Fire Weather Index across Canada, with calculations based on the sun's elevation
Clémence Benoit
Jonathan Durand
Philippe Gachon
Jonathan Boucher
Yan Boulanger
This article summarizes the work carried out at the ESCER (Étude et Simulation du Climat à l'Échelle Régionale, UQAM) Centre to develop the ERA5-FWI-SN dataset – a new automated, gridded dataset of the Canadian Forest Fire Weather Index (FWI) System components for Canada, at a spatial resolution of approximately 31 km. The ERA5-FWI-SN dataset is derived from the hourly ERA5 reanalysis using a new method, called the solar noon method, which is based on the sun's elevation above the local horizon at noon. This method aims to improve the conventional method for calculating the FWI System components, the UTC method, based on the maximum insolation defined via time zones (or specific areas covered by one Coordinated Universal Time zone, i.e. UTC zone), which can cover a wide longitudinal region where the same time prevails. The classical method relies on the principle that the average solar time over the territory covered by the same time zone is not too far from legal time (i.e., solar noon is not too far from legal noon), which can be problematic in regions that are very extensive in longitude, such as in Canada where only six time zones have been defined over more than 95° of longitudes. The solar noon method also allows for the correction of systematic biases associated with the UTC method, particularly those arising in gridded datasets near time zone boundaries or across the east–west extent of a single time zone. The dataset spans from 1950 to the present and is updated daily through an automation process that allows the calculation of the FWI components with a six-day lag, corresponding to the latest ERA5 available reanalysis data for download, resulting in a rapid (i.e., 6 d lag) monitoring of recent wildfire danger throughout Canada. Data were compared between solar noon and UTC methods and were tested against the Canadian Wildland Fire Information System (CWFIS) FWI calculated from observation station data. The dataset is available for download at https://doi.org/10.5683/SP3/4B18XZ (Benoit et al., 2025), and derived visualization products can be accessed across the web platform http://feux.escer.uqam.ca/ (last access: 8 July 2026).
- Article
(6669 KB) - Full-text XML
- BibTeX
- EndNote


The Canadian Forest Fire Weather Index (FWI) System (Turner and Lawson, 1978; Van Wagner, 1985; Van Wagner and Pickett, 1985; Wang et al., 2015), which is part of the Canadian Forest Fire Danger Rating System (CFFDRS) developed by Natural Resources Canada (NRCan), is used by many countries around the world (e.g., Australia, France, and Portugal) for wildfire management, prevention and suppression . Notably, this digital system is widely utilized by Canadian fire management agencies and international counterparts specifically to assess fire danger and potential fire behavior of active wildfires. It is also widely used in the context of climate change (see Barnes et al., 2023) to predict several fire regime variables (e.g., fire occurrence, annual area burned, fire season length).
The current FWI System, as defined in Van Wagner (1987), depends on readings taken each day at local noon, either according to the time zone or standard UTC (Coordinated Universal Time), of the following surface weather variables: the air temperature (at 2 m), the relative humidity (at 2 m), the wind speed (at 10 m) and the accumulated precipitation during the previous 24 h. Noon weather readings were chosen because the original work on the FWI method demonstrated that these values can accurately predict fire danger at its mid-afternoon peak at around 17:00. However, this standard local noon method (referred to as the UTC method hereafter) has several shortcomings for continuous and gradual calculation of indices across the entire Canadian territory. Canada, spanning over 5500 km from west to east, has six time zones across more than 95° of longitudes. Calculating FWI at local noon within each time zone produces a significant temporal bias between the easternmost and westernmost areas of the same time zone, since the same legal time is used regardless of the station's location or where the meteorological data are collected. For example, Havre-Saint-Pierre (50°14′ N, 63°36′ W), in Eastern Quebec, and Thunder Bay (48°22′ N, 89°14′ W), in Western Ontario (see Fig. A1), lie in the same time zone, but are separated by almost 26° of longitude, leading to a time difference of about 104 min for the sun to reach its zenith in each location. This can lead to substantial differences in the representativeness of the most fire prone conditions during the day depending on the location, making it challenging to compare results both between and within zones. Additionally, the elevation of the sun in the sky, and consequently the received solar radiation influencing the local energy balance, can vary significantly at the same local time due to the longitudinal extent of the time zone.
The other shortcoming of the UTC method is the discontinuity or heterogeneity of the calculated FWI fields along the time zone boundary, especially when using gridded data (reanalysis or meteorological/climatological model data) and even more so when the spatial resolution of reanalysis or gridded products increases. This is of particular importance as fine- to medium-scale gridded daily weather data are becoming increasingly accessible worldwide to calculate FWI components at regional and local scale (e.g., ERA5-Land reanalysis products; Muñoz-Sabater et al., 2021, high-resolution convection-permitting regional climate model). The abrupt change in legal UTC time can lead to a sharp demarcation in the calculated FWI output fields. This discontinuity makes it impossible or difficult to evaluate the various components included in the FWI System in the areas adjacent to two different time zones.
The main objective of this study was to create a high-resolution gridded dataset of the daily FWI System components and other fire season related indices, that best reflects the physical reality, for monitoring, in retrospective (6 d lag), the daily evolution of the fire danger across Canada.
In this paper, we describe the development and deployment of the ERA5-FWI-SN dataset, calculated according to the local insolation conditions, i.e., the solar noon (SN) method, and using ERA5 reanalysis hourly data (Hersbach et al., 2020). We also provide, in the results section, a comparison of the ERA5-FWI values calculated using the new improved and more physically-based approach (SN method, ERA5-FWI-SN) with those calculated following the local noon classical approach (UTC method, ERA5-FWI-UTC). Since the starting and end dates of the FWI System calculations can have critical impacts on the resulting values, the analysis used to identify the optimal approach for determining fire season onset (or start of the fire season) and the end of the fire season across Canada, based on ERA5 data, is also provided. These are also used to calculate the length of the fire season.
3.1 Overview of the Canadian Forest Fire Weather Index (FWI) System calculation
The FWI System is composed of three fuel moisture codes, i.e., the Fine Fuel Moisture Code (FFMC), the Duff Moisture Code (DMC) and the Drought Code (DC), as well as three fire behavior indices, i.e., the Initial Spread Index (ISI), the Buildup Index (BUI) and the Fire Weather Index (FWI), calculated on a daily basis (Fig. 1). Their calculation requires the following fire weather observations at local standard noon (following the standard UTC method, see Van Wagner and Pickett, 1985):
-
Air temperature at 2 m a.g.l. (in °C);
-
Relative humidity at 2 m a.g.l. (in %);
-
Wind speed at 10 m a.g.l. (in km h−1); and
-
Accumulated precipitation over the last 24 h (in mm).
It also requires the previous day's value of the following fuel moisture codes (start-up default values are used on the first day of the fire season):
-
Previous day's FFMC (start-up default value is 85);
-
Previous day's DMC (start-up default value is 6); and
-
Previous day's DC (start-up default value is 15).

Figure 1The Canadian Forest Fire Weather Index System and its input variables, modified from Lawson and Armitage (2008). Start-up default values are taken from Lawson and Armitage (2008) while the Severity Rating formula is taken from Van Wagner (1987).
Default start-up values for FFMC, DMC and DC represent their standard dryness state and provide a reasonable set of conditions for most spring conditions in Canada, northern United States, and Alaska (Lawson and Armitage, 2008; Canadian Forest Service, 1984). However, an overwinter adjustment of the DC is necessary if drought conditions from the previous fall are suspected at the beginning of the season (Hanes et al., 2020). More details about this overwintering adjustment are provided in Sect. 3.3.3.
3.2 Input dataset: hourly ERA5 reanalysis
As a first step, we used the hourly ERA5 reanalysis (Hersbach et al., 2020) with its original horizontal resolution of 0.25°, or about 31 km, for its near real time availability from 1950 to the present as a benchmark to develop the ERA5-FWI-SN gridded dataset across Canada. ERA5 reanalysis was provided by ECMWF (European Centre for Medium-Range Weather Forecasts) and accessed via the Climate Data Store (C3S, 2025) download platform. This fifth-generation reanalysis was developed by the ECMWF center via assimilation with the 4D-VAR method of satellite observations and in situ meteorological data collected by the World Meteorological Organization (WMO; Hersbach et al., 2020). Access to the most recent ERA5 data, commonly referred to as ERA5T (see C3S, 2025), is limited to six days before the current day. Therefore, if the current day is 10 July, the latest available data for download dates to 3 July, necessitating a six-days lag.
3.3 ERA5-FWI calculations and validation methods
3.3.1 The solar noon (SN) and local noon (UTC) methods
The SN method was developed to provide fire weather data based on a more “physical” approach. In contrast to the classical local noon time approach (UTC method), which results in arbitrarily assigned values based on common longitudes and not dependent on the seasonal cycle, the SN method is based entirely on the property of the sun's elevation above the local horizon, i.e., the local insolation conditions. The SN method also solves temporal biases and artifacts associated with the UTC method across time zones, thus allowing for a more homogeneous and spatially continuous field along time zone boundaries and across longitudes over Canada using medium – to fine–scale gridded data.
For both SN and UTC methods, we calculated the daily FWI System components across Canada, for each grid point of about 31 km spatial resolution of the ERA5 regular grid and for each day of the local fire season, from 1950 to 2024, following the more up-to-date guidelines from literature. For the four near-surface or surface meteorological controls of fire weather, i.e., hourly temperature, relative humidity, wind speed, and 24 h accumulated precipitation, we selected (or in the case of precipitation, calculated) values either at local solar noon (SN method) or at local noon (UTC method). These values were then used to calculate the six standard daily components of the FWI System. Daily maximum temperature (tasmax) and daily mean snow depth (sdmean) were also calculated from hourly fields to determine, each year, the beginning (onset) and the end of the fire season (see the upcoming Sect. 3.3.2 for calculation methods). Daily sdmean was aggregated from hourly snow depth (sd, in m), which was calculated following Eq. (1) from hourly ERA5 snow water equivalent (SWE, in m) and snow density (rsn, in kilogram per cubic meter) variables:
where ρwater represents the water density, estimated at 1000 kg m−3.
To calculate the FWI System components using the UTC method, we used a time zone mask that allowed us to identify the correct time zone for each grid point (i.e. pair of latitude and longitude coordinates), and therefore the respective UTC time, corresponding to the local noon time. Input weather parameters were then selected at the corresponding UTC time for FWI calculation.
To calculate the FWI System components using the SN method, we selected the input weather parameters at the time corresponding to when the sun reaches the local meridian (i.e., the highest position of the sun in the sky) for each grid point and for each day. Local solar noon at each location on Earth's surface was determined following Duffie et al. (2020). A longitude correction was first applied to the local time (1° of longitude corresponds to a time difference of 4 min). A correction called the “equation of time” was then applied, which corresponds to the fact that the Earth does not always move at the same speed on its orbit, so the sun can appear at the zenith with a deviation of up to ±16 min compared to the local time or UTC.
The final correction equation for solar noon is therefore:
where SNT corresponds to the solar noon time, LT the local time, LC the longitude correction, and ETC the equation of time correction.
The calculation of solar noon was performed using the Python library “daylight” (Python Package Index – PyPI, 2020) which allows the obtention of the solar noon time in UTC from geographic coordinates. Since the meteorological variables from the ERA5 reanalysis are provided on an hourly basis Coordinated Universal Time (UTC), the local solar noon corresponding value for each variable was calculated using a temporal proximity proportion or weighted average value that was applied between the two temporally closest fields. For example, if for a grid point the solar noon of the day was calculated at 18:20 UTC, the field value had to be weight-averaged using the 18:00 and 19:00 UTC fields using and as the respective weights. This technique allows for a spatially explicit calculation of the various indices that eliminate artifacts along time zone boundaries across Canada.
For both methods, we used a Python code composed of six functions that we derived from the fwi function of the Canadian Forest Fire Danger Rating System (cffdrs) R library (Wang et al., 2024). This library was developed to calculate fire danger indices for single meteorological stations and was therefore adapted for model data or gridded data in NetCDF format, in Python programming language. In addition to the six FWI System outputs, we calculated the Daily Severity Rating (DSR), which is a numerical assessment of the difficulty or effort expected to control fires, as well as the cumulative DSR over each fire season (DSRc), which gives a relevant indication of fire severity over an entire season. DSR was calculated following Eq. (3):
3.3.2 Fire season onset and stop
By convention, the FWI System calculations are stopped at the end of the fire season and are restarted the next spring, on onset day, using the start-up default values for FFMC, DMC and DC components. We defined the end of the fire season (WinterOnset) following the approach outlined by Wotton and Flannigan (1993), as the fourth day following three consecutive days with daily maximum temperature (tasmax) < 5 °C. For fire season onset calculation, we considered not only temperature conditions, but snow conditions as well, since the snow cover, in snow-covered regions, plays a major role in the determination of the fire season onset. Also, the snow cover's important variability across the country makes it essential to distinguish between areas where the fire season onset depends on its ablation, and those where the onset depends solely on temperature conditions. Also, important changes in the snow cover that occurred since 1950 and that will continue in the future have already impacted the fire season onset, leading to earlier onset dates (Jain et al., 2017). In snow-covered regions, the initiation of the calculation in the spring is scheduled to start the first day of the year following three consecutive days with no snow cover and with tasmax greater than 12 °C while it is scheduled to occur the first day of the year following three consecutive days with tasmax greater than 12 °C for non-snow-covered regions, according to Turner and Lawson (1978). Snow-covered regions are defined as regions where at least 75 % of the days in January and February have a mean snow depth value of 0.10 m or greater (CWFIS, 2026).
However, considering the snow condition in snow-covered regions for onset calculation across Canada and using gridded data is a challenge, due to the poor quality of gridded data snow products. We found that using ERA5 reanalysis data was leading to important delays in ablation of snowpack in the spring, that did not correspond to the ablation date given by satellite observation data, especially in the Rocky Mountains or surrounding areas (see Fig. A1), which was also mentioned in other studies (Kouki et al., 2023; Lei et al., 2022; Hersbach et al., 2020). Moreover, during data preparation and exploration phase, we found that some grid points in mountainous areas (Rocky Mountains for example) would never show 3 consecutive days with a snow depth value of 0 m for some years, which was again inconsistent with satellite-based observations. We found that using a snow depth threshold value of 0.01 m instead of 0 m, in the application of the snow condition, would lead in a more accurate onset date.

Figure 2Climatology between 1950 and 2024 of the monthly (June, July, and August, left to right panels, respectively) mean FWI values obtained with (a) the solar noon (SN) method, and (b) the local noon (UTC) method. The differences in the monthly (June, July, and August) mean values between these two fields (i.e., a–b) are shown in panels (c). FWI were all calculated using the ERA5 reanalysis hourly data.
We therefore adapted the methodology for calculating onset using ERA5 data, utilizing temperature and snow conditions, with a snow depth threshold set at 0.01 m (“TS” method). Snow conditions were verified using the daily mean snow depth (sdmean) and no onset was calculated for regions where sdmean never reaches values below 0.01 m. Appendix B provides a comparison between onset values calculated using the “TS” method, and onset values calculated using only temperature conditions (“T” method) or using temperature and snow conditions with total snow ablation (“TS0” method).
3.3.3 Overwintering adjustment of the DC
In Canada, it is assumed that FFMC and DMC reach the moisture saturation point of winter precipitation at the time of spring melt. This assumption is reasonable because the assumed initial conditions disappear rapidly after a few days. However, due to the relatively long response time of the DC fuel layer (around 53 d under normal conditions), any bias in the estimation of this starting condition before the arrival of spring or thawing conditions can affect the DC at the beginning of the fire season (Hanes et al., 2020). If the fuel layer required for the DC calculation does not fully reach saturation when the snow melts in the spring, an overwintering adjustment of the DC start-up value needs to be applied, which is often the case in the dry areas of the Canadian Prairies (de Groot et al., 2006). At each year's start-up date, we applied the overwintering procedure of the DC for the regions where the last DC value from the previous fire season (DCf) was far from saturation, i.e., ≥ 50, following Hanes and Wotton (2024), and used start-up default value of 15 elsewhere. This recent study shows that this criterion (DCf ≥ 50) is a better indicator of abnormal dry conditions during the previous fall and winter than the accumulated precipitation during winter (rw) threshold of rw ≤ 200 mm, proposed by Lawson and Armitage (2008). DCf and rw normal values maps can be found in Appendix C. Their values reveal that the overwintering adjustment of the DC applies in more areas when using the DCf criteria (Fig. C1) than when using the accumulated precipitation during winter (Fig. C2). However, using DCf criteria instead of rw will affect DC start-up values only for few grid cells outside of the area where rw ≤ 200 mm, with a calculated DC start-up value of 15 in most cases (Fig. C3). Nevertheless, using the DCf criteria still leads, most of the time, into more areas with higher DC start-up values in west and central parts of Canada, with persistent effects on the following seasons, as revealed for years 2022, 2023 and 2024 (Fig. C3). The equations for the DC overwintering adjustment, given by Turner and Lawson (1978), are as follows:
-
DC moisture equivalent at the end of fall (Qf):
-
DC moisture equivalent at the beginning of spring (Qs):
-
DC obtained for the beginning of the fire season (DCs):
where DCf corresponds to the DC value at the end of the previous fire season, a corresponds to the carry-over fraction of last fall's moisture, b corresponds to the wetting efficiency fraction, which corresponds to the effectiveness of winter precipitation in recharging depleted soil moisture reserves in the spring, and rw corresponds to winter precipitation (in mm).
The accumulated precipitation during winter (rw) was calculated, locally, from the day following the end of the previous fire season to the next fire season (i.e., to define the onset value). We used a value of 1.0 for the carry-over fraction (a) and a value of 0.5 for the wetting efficiency fraction (b), as suggested by Hanes and Wotton (2024).
3.4 Data validation
The ERA5-FWI-SN and ERA5-FWI-UTC daily FWI values were validated with the CWFIS-FWI, which corresponds to the FWI calculated from observation station data at local noon by the CWFIS across their network in Canada (see their locations in Fig. D1). Data was validated between 2015 and 2024 (years of available observed data) and the comparison was made by selecting the closest grid point (ERA5-FWI-SN and ERA5-FWI-UTC) to each station (CWFIS-FWI). Independent FWI calculation from CWFIS observation station data using both UTC and SN methods was not feasible, as the organization only supplied the daily FWI values.
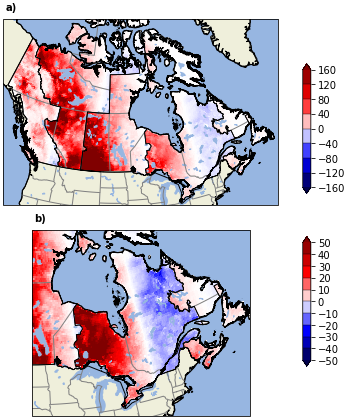
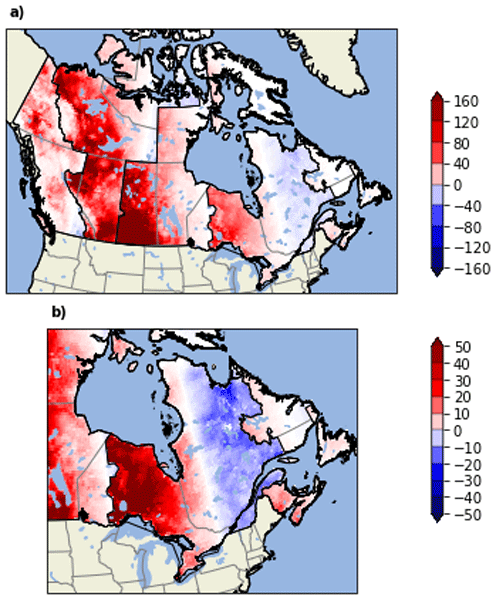
Figure 3Differences between solar noon (SN) and UTC methods for the ERA5 cumulative Severity Rating (DSRc) index for the year 2023 for (a) Canada and (b) eastern Canada with a readjusted scale. The black isolines correspond to the delimitation of time zones.
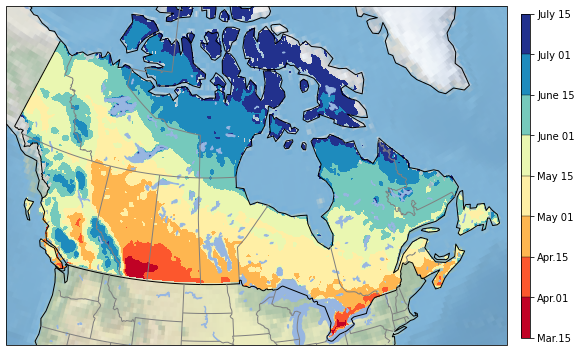
Figure 4Fire season onset climatology (1991–2020). Onset normal values were calculated using the TS method, which considers temperature and snow conditions in snow-covered regions, using a snow depth threshold value of 1 cm.
3.5 ERA5-FWI-SN dataset and automation
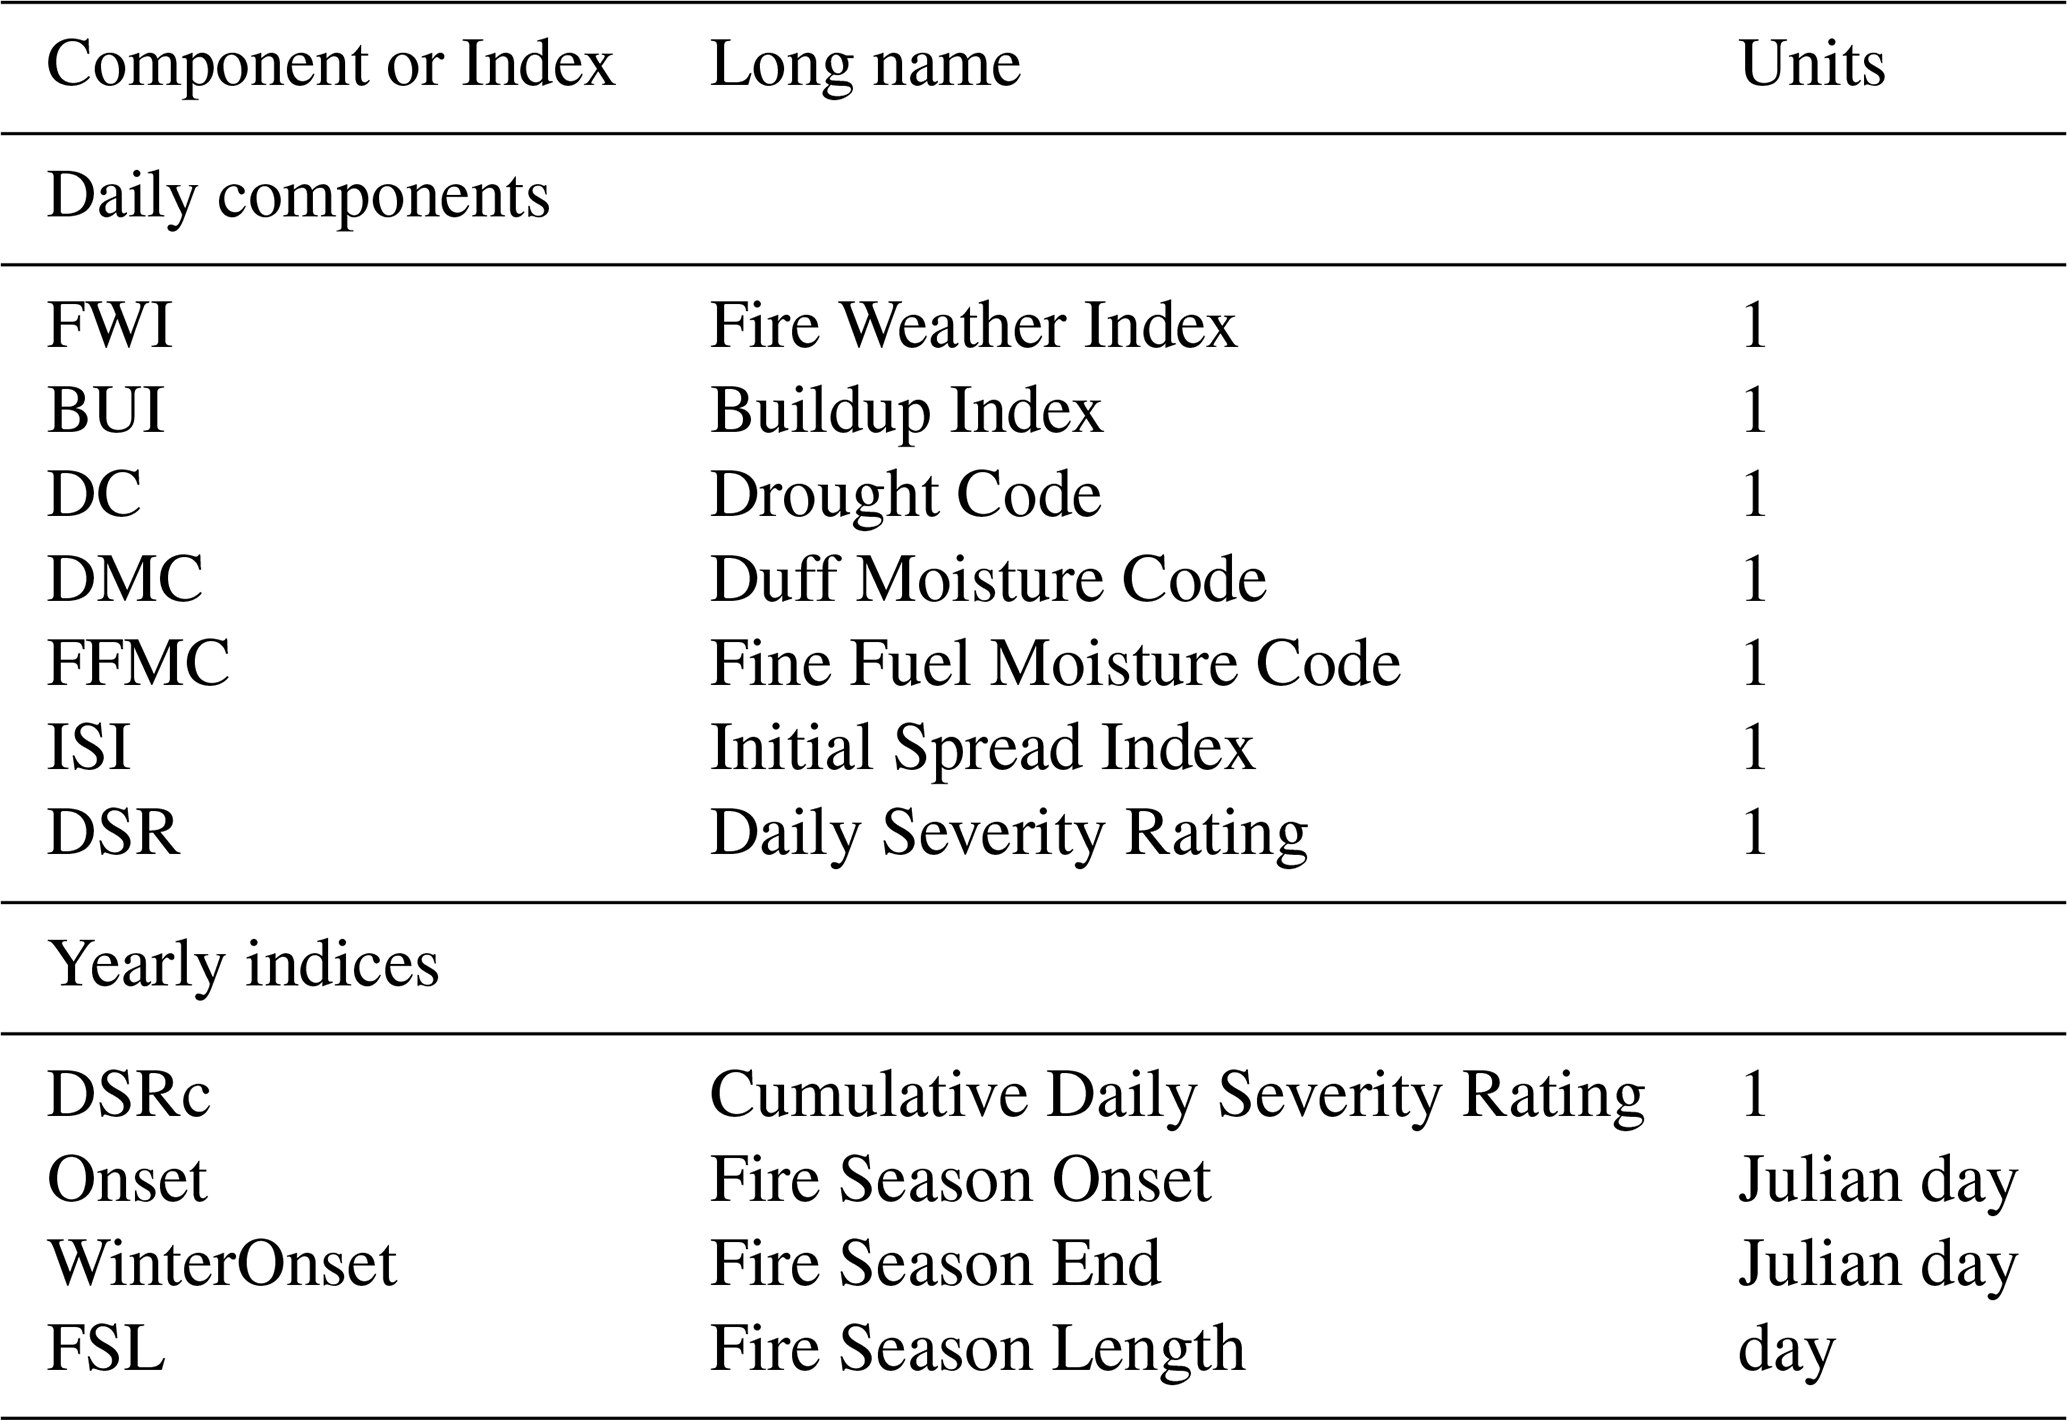
Finally, the gridded daily FWI System components (FFMC, DMC, DC, ISI, BUI and FWI) calculated across Canada using the SN method, including the DSR index, were formatted into standard NetCDF and GeoTIFF files for sharing via the ERA5-FWI-SN dataset and for further analysis. Other indices related to the fire season (the start of the fire season, i.e., Onset, the fire season end, i.e. WinterOnset, the length of the fire season, i.e., FSL, and the cumulative Daily Severity Rating, i.e., DSRc) were also added to the dataset. Table 1 provides an overview of the indices available in the ERA5-FWI-SN dataset. The dataset covers the land masses of Canada at a spatial resolution of about 31 km from 1950 up to now (6 d lag). The calculations were initialized in 1950 using DC, DMC and FFMC start-up default values. For the subsequent years, we followed the overwintering procedures to adjust, if necessary, the DC start-up value.
Table 1Description of the daily FWI components and related yearly indices included in the ERA5-FWI-SN dataset, available for download in NetCDF or GeoTIFF format at https://doi.org/10.5683/SP3/4B18XZ (Benoit et al., 2025).
An automation process, carried out at the ESCER Centre, was also set up to calculate the FWI System components every day with a 6 d lag, corresponding to the latest ERA5 available data for download, and to update the dataset daily. The automation process has an execution time of approximately 1 h, depending on the speed of access (download time) to ERA5 reanalysis data and ensure that the following steps are carried out every day of the year at 02:00 a.m. local time in Eastern time zone (i.e., 07:00 UTC), namely:
-
The download of the latest available fire weather input data (with a 6 d lag from the current time, i.e., j-6) from the “ERA5 hourly data on single levels from 1940 to present” dataset via the Copernicus CDS Application Program Interface (API) download service (see C3S, 2025).
-
The formatting of all fire weather input data from ERA5 to enable the calculation of the FWI System components, including the calculation of hourly wind speed, relative humidity and snow depth.
-
The calculation of the fire season onset (Onset), the start of the overwintering period (WinterOnset), the accumulated precipitation during winter (WinterRain) and the fire season length (FSL).
-
The calculation of the daily FWI System components (including the DSR and DSRc indices) using the SN method.
-
The download of the latest FWI values calculated by the CWFIS (CWFIS-FWI) from observation station data (https://cwfis.cfs.nrcan.gc.ca/downloads/fwi_obs/current/, last access: 8 July 2026), i.e., nearly 650 meteorological stations on average, depending on the day (the location of the CWFIS stations network is provided in Fig. D1).
-
The calculation of statistics and correlations between CWFIS-FWI and ERA5-FWI-SN daily FWI values for all available stations and their corresponding grid point, including the preparation of the daily map showing these values and correlations.
-
The production of daily maps for FWI comparison with historic daily records, recalculated yearly, at the end of the year, to include all data since 1950.
-
The preparation of the daily GeoTIFF files for all the FWI System components for interactive viewing on the website (http://feux.escer.uqam.ca/en/viewer.html, last access: 8 July 2026).
4.1 Fire-weather index climatology
We produced the climatology of the monthly mean FWI, calculated between 1950 and 2024, for the months of June, July, and August, for both SN (Fig. 2a) and UTC (Fig. 2b) methods. In both cases, most of the highest FWI values are located south of Alberta and Saskatchewan with normal values reaching up to, respectively for SN method and UTC method, 18 and 17 June, 26 and 25 July, and 29 and 28 August. This area of highest FWI values, largely covered by agricultural prairies, does not have forests prone to large vegetation fires. However, annual dry weather conditions combined with high temperatures in summer generate high FWI values. The area located around the Great Slave Lake in the Northwest Territories (see Fig. A1) also exhibits high FWI in June, with monthly mean values reaching up to 18 for SN method and 17 for UTC method. The south of British Columbia is the second area with the highest FWI normal values for the months of June and July, with values exceeding 15. Overall, the average monthly mean FWI values for the Canadian provinces and territories are between 2 and 10 either for June, July or August, with an average value around 5 for the entire country.
4.2 Comparison of the solar noon (SN) and the local noon (UTC) methods
The SN method aims to diminish the abrupt change in component values between two provinces with different time zones both over the western and eastern areas due to the change in local time. The differences between the two methods (SN minus UTC methods) for June, July and August FWI monthly mean value (Fig. 2c), reveal higher values over western time zones from SN method than UTC ones, and discontinuities between time zones (up to +3.4 in July west of Alberta, west of the daylight time and up to +2.6 in August west of Saskatchewan). Over the longest time zone located in eastern Canada covering Québec and Ontario (i.e., eastern daylight time – EDT, extending approximately 1900 km from East to West with a temporal lag of 68 min in local time calculation), slight negative values (around −0.6) are present in the east and moderate positive ones (> 1) using the SN method with respect to the UTC method. The higher positive differences of FWI monthly mean values are located over western time zones, in central and mountain daylight time zones (see Fig. 2c).
As for the FWI index (see Fig. 2), the UTC method tends to generate higher/lower DSRc values in the eastern/western part of the EDT time zone than the SN method (Fig. 3b). These higher DSRc values are also particularly pronounced over central and mountain daylight time zones, with strong discontinuities between two consecutive time zones (Fig. 3a). For these cumulative DSR, as defined in Eq. (3), the differences increase between the two (SN and UTC) methods over the whole fire season, as changes in the local time vary during the year and not only during the day.
4.3 Fire season onset climatology and trends
Using ERA5 reanalysis data and the method that considers both snow and temperature thresholds in snow-covered regions, and temperature threshold in non-snow-covered regions, to calculate fire season onset (i.e. see method “TS” in Appendix B), we found that onset happens first in south west Prairies and in the southernmost area of Canada, northside of Lake Erie (between 15 March and 1 April), as shown by the onset normal values map for 1991–2020 period on Fig. 4. On average, in the Boreal Forest and Woodland of Canada, fire season normally starts between 6 May and 8 June, with the earlier onset happening in the West-Central Boreal Forest, as early as 9 April, and the latest in the Atlantic Maritime Heathland (onset ranging between 8 May and 21 July) and in the Subarctic Woodland-Tundra (onset ranging between 22 May and 24 July) . Without considering the Arctic Tundra, where fires are scarce, the latest onset dates are found over the Rocky Mountains and other mountainous areas of Canada (between 15 June and 1 July on average) due to the persistence of snow until early summer.
Between 1950 and 2024, changes in temperature and snow conditions during spring led to earlier onset dates in most of the forest dominated areas of Canada. While the diminution of snowpack in westernmost regions of Canada greatly contributed to earlier onset in that area, more than temperature warming did alone, as shown by calculated trends in Figs. B2, B3 and B4.
4.4 ERA5-FWI validation with CWFIS-FWI
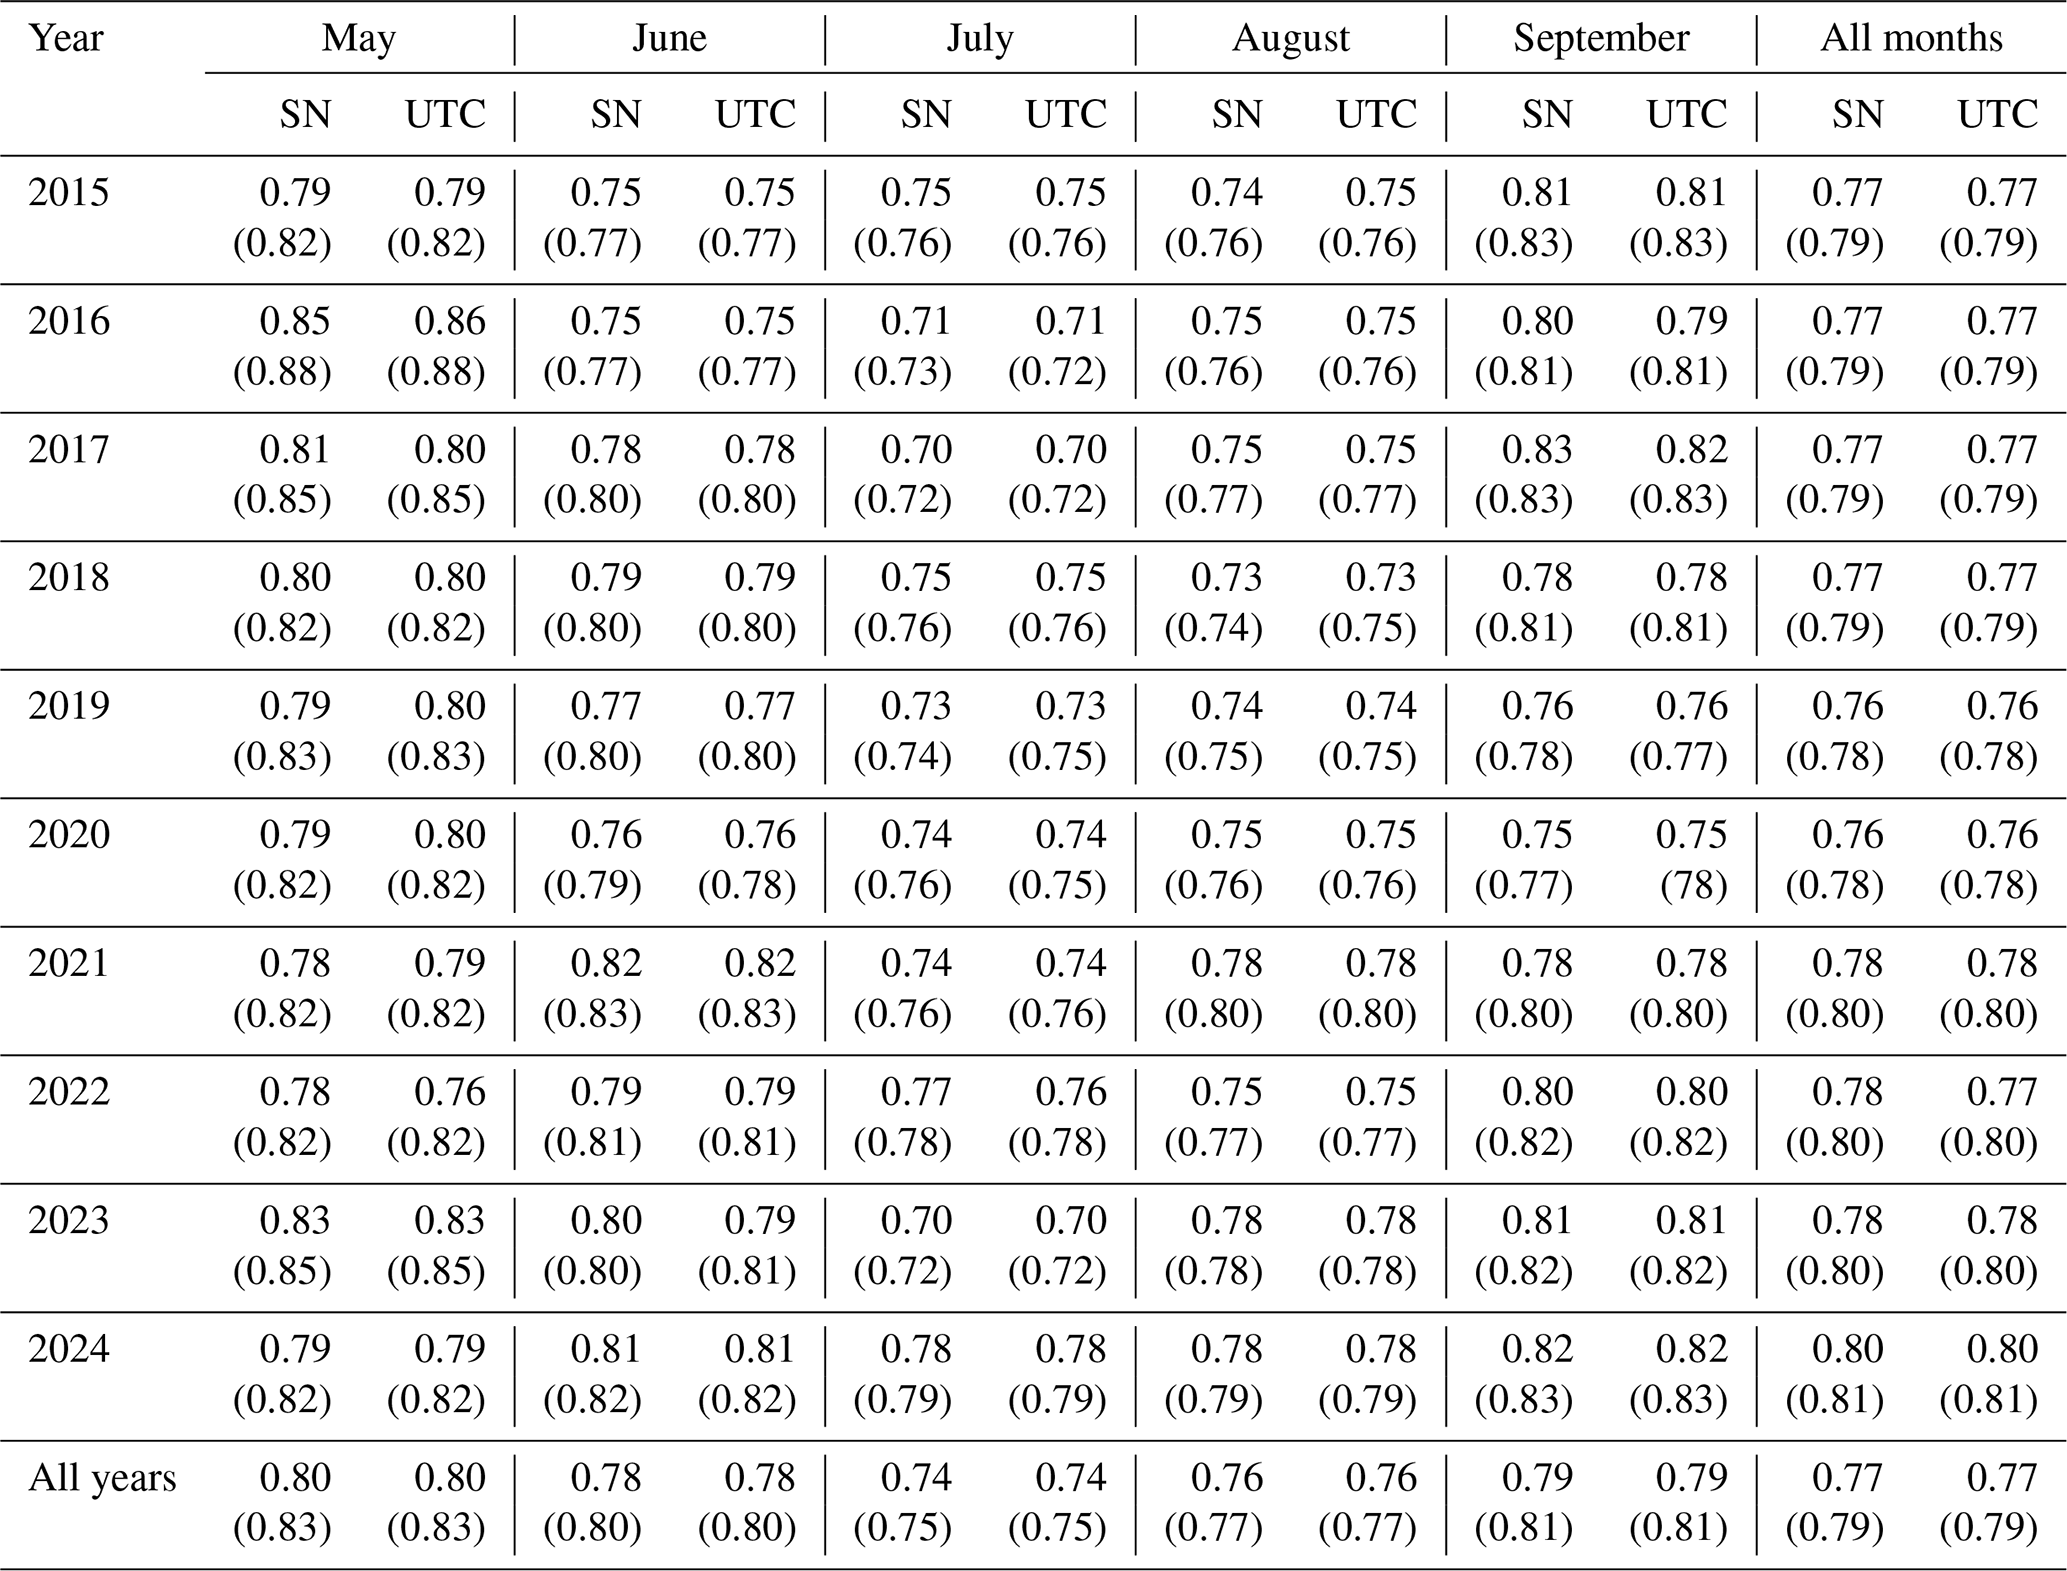
Table D1 presents Pearson (temporal) correlation coefficients calculated on a daily scale for each month from May to September and for each year from 2015 to 2024 between the CWFIS observed FWI, and those calculated using the ERA5 reanalysis for both SN and UTC methods. The average correlation with meteorological stations varies from 0.70 to 0.86 depending on the month and the year, with very similar results between the two methods.
The Taylor diagram statistics (Fig. 5) reveal that both methods produce FWI values that are very well spatially correlated with observations for most of the stations (median of 0.81 for both methods), with very similar results between the two methods. The normalized standard deviation for both methods (median of +1.09 for UTC method and +1.06 for SN method) indicates a slight overestimation of the spatiotemporal variability with respect to observations, with a slightly lower bias obtained with the SN method (Fig. 5). The RMSEs are also similar between the two methods, with relatively low values on average (median value slightly over 0.6 in both cases, Fig. 5).
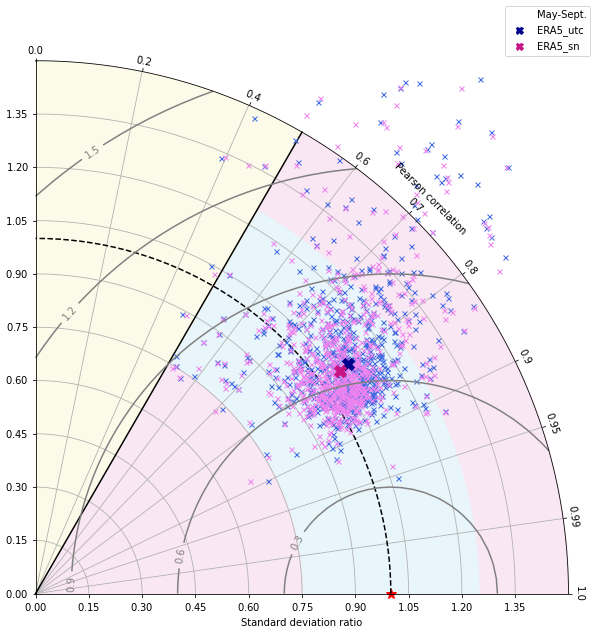
Figure 5Taylor diagrams statistics (standard deviation, Pearson correlation, and RMSE– Root Mean Square Error) between the ERA5 FWI calculated using the UTC method (ERA5_utc in blue) and using the SN method (ERA5_sn in violet) and the Canadian Wildland Fire Information System (CWFIS) FWI calculated from observation station data. Statistics were calculated between the daily FWI values and are summarized from 1 May to 30 September for years 2015 to 2024 for all available stations. All values were normalized with respect to the observations (CWFIS FWI), represented by the red star. The curved lines correspond to the normalized RMSE, and the big dark blue/violet cross to the median values of the UTC/SN method statistics from all pairs of grid points and observation stations data (small cross).
The full time series (1950 to the most recent full year available) of the daily FWI System components and other fire-season-related indices (Table 1) is available as the ERA5-FWI-SN dataset in both NetCDF and GeoTIFF formats via the Borealis platform at https://doi.org/10.5683/SP3/4B18XZ (Benoit et al., 2025), as the ERA5 dataset. A direct link to the dataset is also provided in the “Data Access” section of the project website: http://feux.escer.uqam.ca/en/data_access.html (last access: 8 July 2026). A Web Map Service (WMS), currently under development, will also allow users to access the mapped data directly through geospatial applications or software.
Both static and interactive visualizations of the daily FWI components and related analyses are available on the website. The homepage (http://feux.escer.uqam.ca/en/index.html, last access: 8 July 2026) features a static map of the most recent FWI values across Canada, along with two additional maps comparing current FWI values to historical records (see Fig. 6 for example and refers to step 7 in Sect. 3.5). A more detailed map of daily FWI values, including a comparison with CWFIS-FWI values (see Fig. 7 for example and refer to step 6 in Sect. 3.5), is also available for download in PNG format for any day since 2021 in the “FWI” section (http://feux.escer.uqam.ca/en/fwi.html, last access: 8 July 2026). Finally, interactive viewing of daily FWI components values since 2021 is available in the “Data Viewer” section (http://feux.escer.uqam.ca/en/viewer.html, last access: 8 July 2026).

Figure 6FWI breaking records for 29 May 2025 across Canada. The left panel map shows areas with FWI values breaking the daily record (for 29 May, in black contours) while the right panel map shows areas with FWI values breaking fire season record (considering the entire fire season, in red contours) for the current day. Colormap represents, locally (spatial resolution of approximately 31 km), the number of days where the daily FWI has been breaking records since the onset. Historical records were calculated over the period 1950–2024.

Figure 7FWI daily value for 29 May 2025 across Canada, at a spatial resolution of approximately 31 km, calculated using ERA5 reanalysis data (colormap) and its comparison with FWI values calculated from CWFIS observation station data (point markers). This daily map can be found in the website “FWI” section at http://feux.escer.uqam.ca/en/fwi.html (last access: 8 July 2026).
The source code used to calculate the daily FWI components following the solar noon method and to generate the ERA5-FWI-SN dataset is available at https://github.com/risqueescer/era5-fwi-sn (last access: 6 August 2026) and has been archived at Zenodo: https://doi.org/10.5281/zenodo.21398765 (Benoît and Durand, 2026).
The new solar noon (SN) method applied to calculate the daily FWI System components using ERA5 hourly reanalysis data provides more consistent and plausible values across Canada, especially along the western parts of the daylight time zones, and prevent discontinuities in component values over these areas. The FWI values from this new method are also compatible with the ones calculated from the CWFIS meteorological weather stations network. Our dataset also offers significant improvements over the FWI dataset based on the ERA5 reanalysis developed by ECMWF (Vitolo et al., 2020), which relies on the UTC method for its calculations. Additionally, these FWI calculations omit both the start and end-of-fire-season rules, as well as any overwintering procedures at the onset of the season. In fact, we have clearly demonstrated the importance and advantage of both considering the overwintering procedures to potentially adjust the DC start-up value, and the local solar noon approach, in providing more physical gridded values of FWI components over different climatic conditions across Canada.
The new ERA5-FWI-SN dataset and related products were made available on the ESCER website: http://feux.escer.uqam.ca (last access: 8 July 2026). However, as noted in the recent study over Sweden in Sjöström et al. (2025), moderate to high ERA5-based FWI were underestimated with respect to the values based on observations. In our case, we can see from Fig. 6 that maximum FWI values > 85 are observed from CWFIS station data (on 29 May 2025) whereas ERA5-FWI-SN maximum values are only around 71. In fact, to document these potential biases, we verified all daily values of FWI during the fire season across Canada, between CWFIS stations and ERA5 reanalysis, since 2015 at intra-annual and interannual scales. As noted previously, ERA5 reanalysis is a large-scale reference dataset commonly used in many climate studies, but as suggested in various studies, a careful analysis for extreme-value bias against point observations is needed to prevent any misinterpretation as compared to observational products (see also the recent studies of Alpizar et al., 2026; Chan et al., 2022).
In the near future, we plan to use the SN method to identify and evaluate the changes in the FWI System components and in forest fire danger from high resolution regional climate model simulations under climate change. This will be done with simulations from the latest version of the new Canadian regional climate model (CRCM version 6, i.e. CRCM6 used and described in Llerena et al., 2023, and Roberge et al., 2024), developed at the ESCER center, in middle/long-terms or climate mode (i.e. under seamless prediction) from the available analyses and simulation ensembles of the GEPS/GDPS (Global Ensemble Prediction System/Global Deterministic Prediction System) and/or RDPS (Regional Deterministic Prediction System) of Environment and Climate Change Canada, and CMIP6 climate simulations (see Intergovernmental Panel on Climate Change (IPCC), 2021). The CRCM6 configuration with a 12 km horizontal resolution and covering all North America will be used for this purpose. Preliminary results revealed the feasibility of this approach, since the 6- or 3-hourly variables are available to drive the CRCM6 at the lateral boundaries (i.e., simulated climate variables from Global Climate Models used to downscale climate information at the regional scale from Regional Climate Model, see further details in Chap. 10 of the last IPCC report; Doblas-Reyes et al., 2021).
Further works also need to be done to assess the changes in forest fire danger at the ecosystem scales from the convection-permitting configuration of the CRCM6 model (at resolution < 4 km, see Benoit et al., 2022; Llerena et al., 2023; Roberge et al., 2024) to evaluate how the mesoscale convection systems, that affect ignition of vegetation fires from thunderstorms and their associated lighting occurrences, will be modified under climate change. The SN method will then be relevant for such purposes, to prevent discontinuities across the longitudes of single point indices value (revealed in the UTC method), more pronounced at higher resolution. This will also improve our collective capacity to better anticipate and consider higher temporal and spatial weather conditions that could trigger severe and extensive forest fires across Canada, as those experienced during the fire season of 2023 (see Boulanger et al., 2025; Barnes et al., 2023). By providing daily values of the FWI components for each grid point of approximately 31 km across Canada, the FWI-SN dataset contributes to a more realistic depiction of the fire danger in regions located far from observational station data, especially near the time zone boundaries. These data should therefore be of particular interest to fire management agencies as part of their operational systems, especially given that the SN method corrects the strong discontinuities and over- or underestimations in FWI values that occur with the UTC method in regions located near the boundaries between eastern and western time zones. Given the biases introduced by the UTC method, the SN approach would also improve how provinces define fire danger categories based on percentiles, by relying on more realistic grid-based estimates of FWI.
The analysis conducted so far comparing the SN and UTC methods remains limited, as it does not address how the two methods perform with extreme values or how these extremes relate to historical observations. In future work, we aim to develop risk indices based on threshold- and percentile-based FWI component values. These indices will be calculated using both the SN and UTC methods to extend the analysis and better demonstrate the added value of the SN method, particularly in an operational context.
The website http://feux.escer.uqam.ca (last access: 8 July 2026) is under constant development and improvement and should soon propose the same FWI-SN products as generated using the ERA5 reanalysis data for the historical period, but using the CRCM6 simulation data. Products related to changes between future and historical FWI should also be available soon after CRCM6 future simulations will be completed. More interactive plots to allow FWI analysis at different time and space levels will also be deployed. Finally, any changes that would be made to the FWI dataset will be announced on the website and detailed in the “Methods” section (http://feux.escer.uqam.ca/en/methodology.html, last access: 8 July 2026).

Figure A1Study domain, i.e., land masses of Canada, including the delineation of the provinces and territories, and of the vegetation zones of Canada (Baldwin et al., 2019). The map shows important places with their toponym, mentioned or not in the paper, for a better overall comprehension.
Each year, for grid points that report significant snow cover during the winter (i.e., ≥ 10 cm, this snow cover threshold occurrence represents at least 75 % of the days in January and February), we calculated the onset date using the three following methods:
-
“TS” method. Onset occurs on the day following 3 consecutive days with snow depth lower than 1 cm and maximum daily temperature higher than 12 °C;
-
“T” method. Onset occurs on the day following 3 consecutive days with maximum daily temperature higher than 12 °C;
-
“TS0” method. Onset occurs on the fourth day following snow ablation (snow depth of 0 cm). For the previous 3 d, snow depth value needs to be of 0 cm and maximum daily temperature higher than 12 °C.

Figure B1Fire season onset climatology (1991–2020) and its comparison with onset calculated using different methods. In (a) onset normal values are shown and were calculated using the “TS” method, which considers temperature and snow conditions in snow-covered regions, using a snow depth threshold value of 1 cm. In (b) difference between onset normal values, calculated using the “T” method, which only considers temperature conditions in snow-covered regions, and “TS” onset normal values. In (c) difference between onset normal values, calculated using the “TS0” method, which considers temperature and snow conditions in snow-covered regions, using a snow depth threshold value of 1 cm, and “TS” onset normal values. Values in panels (b) and (c) correspond to the onset date difference given in number of days.
For grid points that don't report significant snow cover during the winter, onset was calculated following the temperature condition (“T” method) only.
The onset climatology (1991–2020) for the “TS” method is shown in Fig. B1a as well as its difference with the onset climatology calculated using the “T” method (Fig. B1b, “T” – “TS”) and the “TS0” method (Fig. B1c, “TS0”–“TS”). The latest onset values calculated over the Great Bear Lake and the Great Slave Lake (between 8 June and 9 August, Fig. B1a) are in adequation with climate observations found in the literature, with daily mean temperature normal values exceeding 12 °C only in July (Environment and Climate Change Canada, 2025). When considering only the temperature condition (“T” method), onset happens earlier in snow-covered regions (2 d earlier on average but can be up to 54 d earlier in mountainous regions) than when considering both temperature and snow condition with a threshold value of 1 cm (“TS” method) (Fig. B1b). When considering the complete snow ablation with ERA5 reanalysis data (“TS0” method), onset occurs later than the ones from “TS” method (5 d later on average, but up to 26 d later in some areas) (Fig. B1c).
Trends calculated on the fire season onset date, over the whole time window between 1950 and 2024, show that the snow and temperature conditions changed leading to an earlier season start-up, a trend significant (p-value < 0.05) for the whole study area, including most of the forest dominated areas of Canada, for both “TS” and “T” methods (Fig. B2 for onset days and Figs. B3–B4 for snow/temperatures trends). However, changes in snow conditions contributed to more significant grid points with changes in fire season onset time, and more important changes in values, with onset occurring up to more than 30 d earlier in British Columbia (Fig. B2a and B2c). Figures B3 and B4 show the trends in snow depth values on 15 February, March, April and May and the monthly mean value of the maximum daily temperature for the same months, calculated over the period from 1950 to 2024. Both variables reveal their influence on the onset date trend with an important decrease in snow depth values in British Columbia (Fig. B3), and important increases in temperature over a major part of the Boreal Forest, especially in May (Fig. B4).
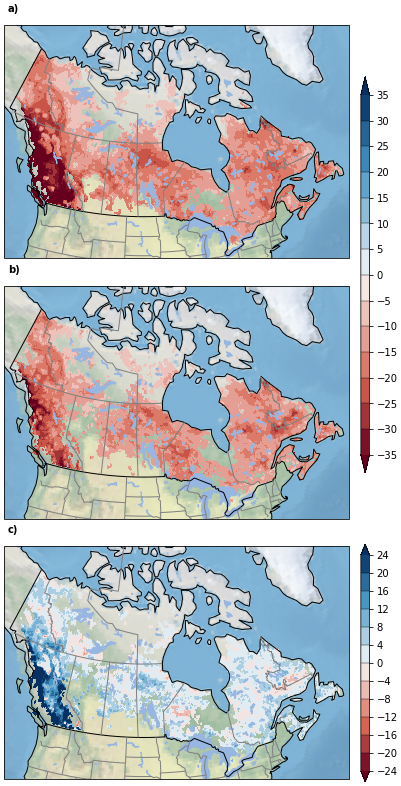
Figure B2Trends for onset values (in days over 75 years) for (a) “TS” method and (b) “T” method, calculated over the whole-time window between 1950 and 2024, using ERA5 hourly reanalysis data. Differences between method “T” and method “TS” are shown in (c). Trends are calculated using the Trend free Pre-Whitening method from the pyMannKendall library, with a statistical significance level of 0.95. Only significant trends are shown (i.e., for p-value < 0.05).
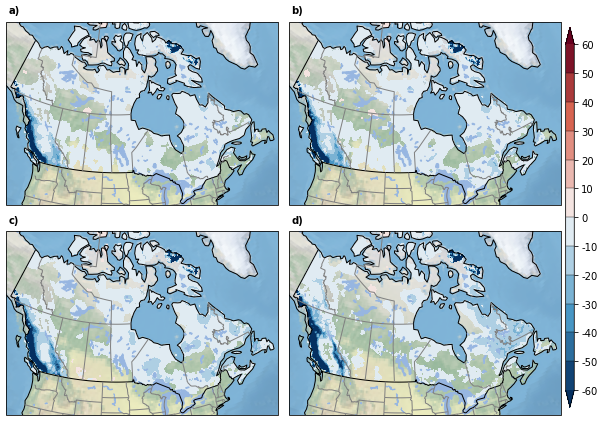
Figure B3Trends for daily mean snow depth values (in cm over 75 years) on (a) 15 February, (b) 15 March, (c) 15 April, and (d) 15 May, calculated over the whole-time window between 1950 and 2024, using ERA5 hourly reanalysis data. Trends are calculated using the Trend free Pre-Whitening method from the pyMannKendall library, with a statistical significance level of 0.95. Only significant trends are shown (i.e., for p-value < 0.05).
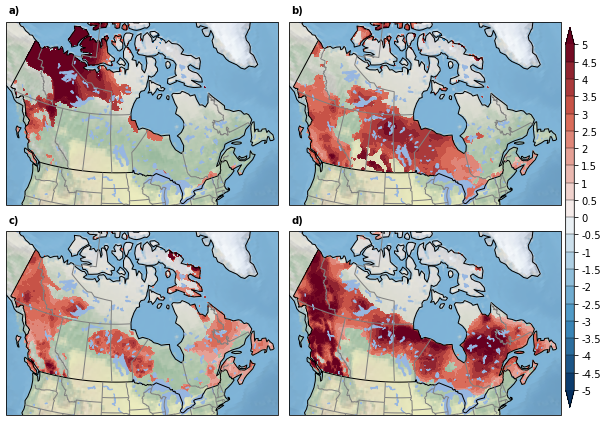
Figure B4Trends for the monthly average values of daily maximum temperatures (in °C over 75 years) in (a) February, (b) March, (c) April, and (d) May, calculated over the whole-time window between 1950 and 2024, using ERA5 hourly reanalysis data. Trends are calculated using the Trend free Pre-Whitening method from the pyMannKendall library, with a statistical significance level of 0.95. Only significant trends are shown (i.e., for p-value < 0.05).
Normal values (1991–2020) of the Drought Code value at the end of the fire season (DCf, Fig. C1) and of the winter precipitation (rw, Fig. C2), calculated between the local end of the fire season and the local onset date. Values are represented at a spatial resolution of approximately 31 km across Canada and were calculated using ERA5 reanalysis data.
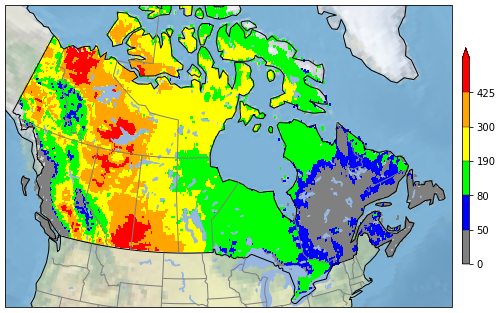
Figure C1Climatology (1991–2020) of the Drought Code value at the end of the fire season (DCf) across Canada, calculated from each year locally, using the ERA5 hourly reanalysis data. All the areas except the ones in grey show an average DCf ≥ 50, indicating where the overwinter adjustment of the DC typically applies, following Hanes and Wotton (2024).
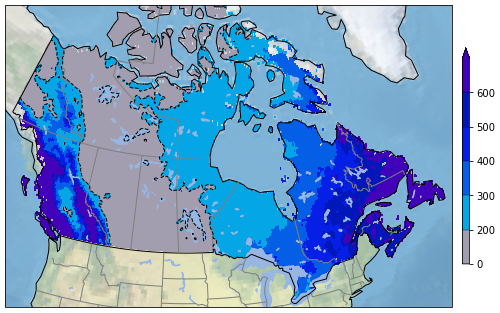
Figure C2Climatology (1991–2020) of the winter precipitation (rw, in mm) across Canada, calculated from each year between the local end of the fire season and the local onset date, inclusively, using the ERA5 hourly reanalysis data. The black dashed contour line delineates areas where the average rw ≤ 200 mm, indicating where the overwinter adjustment of the DC typically applies, following Lawson and Armitage (2008).

Figure C3Comparison of overwintered start-up DC (DCi) values for years 2022, 2023 and 2024 when using (a) last DC value from previous fall (DCf), or (b) winter accumulated precipitation (WinterRain), for overwintering procedure application. Panels (c) show the difference in DCi values between DCf and WinterRain methods, only where values are different. Overwintering adjustment applies when (a) DCf ≥ 50, and (b) WinterRain ≤ 200 mm, otherwise start-up default value of 15 is used.
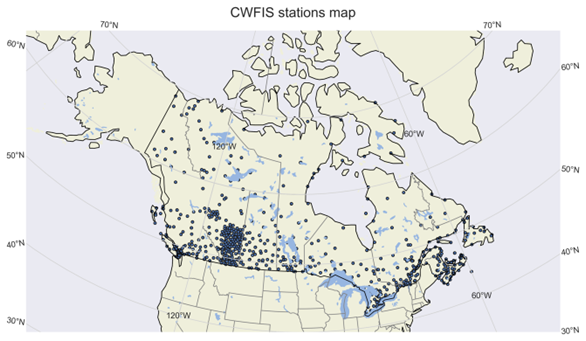
Figure D1Location of all stations in the CWFIS network that were used for comparing daily ERA5 FWI values obtained using both methods (solar noon and UTC).
Table D1Pearson correlation coefficients (p-value < 0.05) calculated between the daily CWFIS FWI, from the CWFIS meteorological stations across Canada (see their locations in Fig. D1) and the daily FWI calculated using the ERA5 reanalysis data for both solar noon (SN) and classical UTC (UTC) methods, for each year from 2015 to 2024, and for each month from May to September, and considering all months (May–September). Average coefficients value for significant correlations only (p-value < 0.05) are given in parenthesis.
JD developed the solar noon method as well as the Python code to run the model from gridded data and performed the data comparison and validation. CB updated the Python code and generated the dataset. CB and JD prepared the manuscript with contributions from all co-authors. All the authors contributed to the discussion of the dataset and reviewed and edited the paper.
The contact author has declared that none of the authors has any competing interests.
Publisher's note: Copernicus Publications remains neutral with regard to jurisdictional claims made in the text, published maps, institutional affiliations, or any other geographical representation in this paper. The authors bear the ultimate responsibility for providing appropriate place names. Views expressed in the text are those of the authors and do not necessarily reflect the views of the publisher.
The authors would like to thank Natural Resources Canada (Canadian Forest Service) for the financial support of this project at the ESCER center of UQAM. We would like to thank Fréderic Toupin from the department of Earth and atmospheric sciences of UQAM for providing all the technical tools necessary for the successful completion of the simulations, and his help with the web site development. The help of Katja Winger of the ESCER center is also strongly acknowledged. Finally, we thank ECMWF for sharing the fifth-generation reanalysis data ERA5 (see C3S, 2025).
This research has been supported by Natural Resources of Canada (through Grant and Contribution program) and by the Discovery Grant program and the Alliance program grant of the Natural Sciences and Engineering Research Council of Canada (Alliance grant ALLRP no. 601741-2024, and individual grant no. 2022-3005032).
Computations were made on the supercomputers, managed by Calcul Québec and the Digital Research Alliance of Canada, whose operation is funded by the Canada Foundation for Innovation, Ministère de l’Économie et de l’Innovation du Québec (MEI) and the Fonds de recherche du Québec-Nature et technologies (FRQNT).
This paper was edited by Di Tian and reviewed by two anonymous referees.
Alpizar, M., Di Luca, A., Gachon, P., and Roberge, F.: Mesoscale Convective Systems in Northeastern North America: identification and evaluation with the convection-permitting version of the Canadian Regional Climate Model, Clim. Dynam., 64, 129, https://doi.org/10.1007/s00382-026-08102-6, 2026.
Baldwin, K., Allen, L., Basquill, S., Chapman, K., Downing, D., Flynn, N., MacKenzie, W., Major, M., Meades, W., Meidinger, D., Morneau, C., Saucier, J.-P., Thorpe, J., and Uhlig, P.: Vegetation Zones of Canada: a Biogeoclimatic Perspective. [Map] Scale , Natural Resources Canada, Canadian Forest Service, Great Lake Forestry Center, Sault Ste. Marie, ON, Canada, https://open.canada.ca/data/en/dataset/22b0166b-9db3-46b7-9baf-6584a3acc7b1 (last access: 8 July 2026), 2019.
Barnes, C., Boulanger, Y., Keeping, T., Gachon, P., Gillett, N., Boucher, J., Roberge, F., Kew, S., Haas, O., Heinrich, D., Vahlberg, M., Singh, R., Elbe, M., Sivanu, S., Arrighi, J., Van Aalst, M., Otto, F., Zachariah, M., Krikken, F., Wang, X., Erni, S., Pietropalo, E., Avis, A., Bisaillon, A., and Kimutai, J.: Climate change more than doubled the likelihood of extreme fire weather conditions in eastern Canada, Sci. Rep., https://doi.org/10.25561/105981, 2023.
Benoît, C. and Durand, J.: era5-fwi-sn v1.0.0, Zenodo [code], https://doi.org/10.5281/zenodo.21398765, 2026.
Benoit, C., Demers, I., Roberge, F., Gachon, P., and Laprise, R.: Inondations des printemps 2017 et 2019 dans le bassin versant de la rivière des Outaouais (Québec, Canada): analyse des facteurs physiographiques et météorologiques en cause, in: Les inondations au Québec: risques, aménagement du territoire, impacts socioéconomiques et transformation des vulnérabilités, edited by: Buffin-Bélanger, T., Maltais D. and Gauthier, M., Presse de l'Université du Québec, 29–58, https://doi.org/10.2307/j.ctv3405p58.11, 2022.
Benoit, C., Durand, J., Gachon, P., Boulanger, Y., and Boucher, J.: ERA5-FWI-SN dataset (V1), ESCER – Post-traitées [data set], https://doi.org/10.5683/SP3/4B18XZ, 2025.
Boulanger, Y., Arseneault, D., Bélisle, A. C., Bergeron, Y., Boucher, J., Boucher, Y., Danneyrolles, V., Erni, S., Gachon, P., Girardin, M. P., Grant, E., Grondin, P., Jetté, J. P., Labadiem, G., Leblond, M., Leduc, A., Puigdevall, J. P., St-Laurent, M. H., Tremblay, J. A., and Waldron, K.: The 2023 wildfire season in Québec: an overview of extreme conditions, impacts, lessons learned and considerations for the future, Can. J. Forest Res., 55, 1–21, https://doi.org/10.1139/cjfr-2023-0298, 2025.
Canadian Forest Fire Danger Rating System (CFFDRS): Natural Resources Canada website, https://cwfis.cfs.nrcan.gc.ca/background/summary/fdr, last access: 19 August 2025.
Canadian Forest Service: Tables for the Canadian Forest Fire Weather Index System, 4th edn., Environ. Can., Can. For. Serv., Ottawa, Ont, For. Tech. Rep. 25, 48 pp., https://ostrnrcan-dostrncan.canada.ca/entities/publication/7d4a3d66-04c9-4648-8260-0c7417aa6bb3 (last access: 8 July 2026), 1984.
Canadian Wildland Fire Information System (CWFIS): Data Sources and Methods, Natural Resources Canada, https://cwfis.cfs.nrcan.gc.ca/background/dsm/fwi (last access: 8 July 2026), 2026.
Chan, M.-Y., Chen, X., and Leung, L. R.: A High-Resolution Tropical Mesoscale Convective System Reanalysis (TMeCSR), J. Adv. Model. Earth Sy., 14, e2021MS002948, https://doi.org/10.1029/2021MS002948, 2022.
Copernicus Climate Change Service (C3S): ERA5 hourly data on single levels from 1940 to present, Climate Data Store (CDS) [data set], https://doi.org/10.24381/cds.adbb2d47, 2025.
de Groot, W. J., Goldammer, J. G., Keenan, T., Brady, M. A., Lynham, T. J., Justice, C. O., Csiszar, I. A., and O'Loughlin, K.: Developing a global early warning system for wildland fire, Forest Ecol. Manag., 234, https://doi.org/10.1016/j.foreco.2006.08.025, 2006.
Doblas-Reyes, F. J., Sörensson, A. A., Almazroui, M., Dosio, A., Gutowski, W. J., Haarsma, R., Hamdi, R., Hewitson, B., Kwon, W.-T., Lamptey, B. L., Maraun, D., Stephenson, T. S., Takayabu, I., Terray, L., Turner, A., and Zuo, Z.: Linking Global to Regional Climate Change, in: Climate Change 2021: The Physical Science Basis. Contribution of Working Group I to the Sixth Assessment Report of the Intergovernmental Panel on Climate Change, edited by: Masson-Delmotte, V., Zhai, P., Pirani, A., Connors, S. L., Péan, C., Berger, S., Caud, N., Chen, Y., Goldfarb, L., Gomis, M. I., Huang, M., Leitzell, K., Lonnoy, E., Matthews, J. B. R., Maycock, T. K., Waterfield, T., Yelekçi, O., Yu, R., and Zhou, B., Cambridge University Press, Cambridge, United Kingdom and New York, NY, USA, 1363–1512, https://doi.org/10.1017/9781009157896.012, 2021.
Duffie, J. A., Beckman, W. A., and Blair, N.: Solar Engineering of Thermal Processes, Photovoltaics and Wind, Fifth Edition, John Wiley & Sons, Inc., https://doi.org/10.1002/9781119540328, 2020.
Environment and Climate Change Canada (ECCC): Canadian Climate Normals 1991–2020 Data – DELINE, Northwest Territories, https://climate.weather.gc.ca/climate_normals/, last access: 5 June 2025.
Hanes, C. and Wotton, M.: Updated guidance for the Drought Code overwintering adjustment, Can. Wildland Fire Smoke Newsl., Can. Wildfire, 2–8, https://www.canadawildfire.org/past-issues (last access: 8 July 2026), 2024.
Hanes, C., Wotton, M., Woolford, D. G., Martell, D. L., and Flannigan, M.: Preceding Fall Drought Conditions and Overwinter Precipitation Effects on Spring Wildland Fire Activity in Canada, Fire, 3, 24, https://doi.org/10.3390/fire3020024, 2020.
Hersbach, H., Bell, B., Berrisford, P., Hirahara, S., Horányi, A., Muñoz-Sabater, J., Nicolas, J., Peubey, C., Radu, R., Schepers, D., Simmons, A., Soci, C., Abdalla, S., Abellan, X., Balsamo, G., Bechtold, P., Biavati, P., Bidlot, J., Bonavita, M., De Chiara, G., Dahlgren, P., Dee, D., Diamantakis, M., Dragani, R., Flemming, J., Forbes, R., Fuentes, M., Geer, A., Haimberger, H., Healy, S., Hogan, R. J., Hólm, E., Janisková, M., Keeley, S., Laloyaux, P., Lopez, P., Lupu, C., Radnoti, G., de Rosnay, P., Rozum, I., Vamborg, F., Villaume, S., and Thépaut, J.-N.: The ERA5 global reanalysis, Q. J. Roy. Meteor. Soc., 146, 1999–2049, https://doi.org/10.1002/qj.3803, 2020.
Intergovernmental Panel on Climate Change (IPCC): Climate Change 2021: The Physical Science Basis. Contribution of Working Group I to the Sixth Assessment Report of the Intergovernmental Panel on Climate Change, edited by: Masson-Delmotte, V., Zhai, P., Pirani, A., Connors, S. L., Péan, C., Berger, S., Caud, N., Chen, Y., Goldfarb, L., Gomis, M. I., Huang, M., Leitzell, K., Lonnoy, E., Matthews, J. B. R., Maycock, T. K., Waterfield, T., Yelekçi, O., Yu, R., and Zhou, B., Cambridge University Press, Cambridge, United Kingdom and New York, NY, USA, 2391 pp., https://doi.org/10.1017/9781009157896, 2021.
Jain, P., Wang, X., and Flannigan, M. D.: Trend analysis of fire season length and extreme fire weather in North America between 1979 and 2015, Int. J. Wildland Fire, 26, 1009–1020, https://doi.org/10.1071/WF17008, 2017.
Kouki, K., Luojus, K., and Riihelä, A.: Evaluation of snow cover properties in ERA5 and ERA5-Land with several satellite-based datasets in the Northern Hemisphere in spring 1982–2018, The Cryosphere, 17, 5007–5026, https://doi.org/10.5194/tc-17-5007-2023, 2023.
Lawson, B. D. and Armitage, O. B.: Weather Guide for the Canadian Forest Fire Danger Rating System, Nat. Res. Can., Can. For. Serv., Edmonton, Alta., 84 pp., https://ostrnrcan-dostrncan.canada.ca/handle/1845/219568 (last access: 8 July 2026), 2008.
Lei, Y., Pan, J., Xiong, C., Jiang, L., and Shi, J.: Snow depth and snow cover over the Tibetan Plateau observed from space in against ERA5: matters of scale, Clim. Dynam., 60, 1523–1541, https://doi.org/10.1007/s00382-022-06376-0, 2022.
Llerena, A., Gachon, P., and Laprise, R.: Precipitation Extremes and Their Links with Regional and Local Temperatures: A Case Study over the Ottawa River Basin, Canada, Atmosphere, 14, 1130, https://doi.org/10.3390/atmos14071130, 2023.
Muñoz-Sabater, J., Dutra, E., Agustí-Panareda, A., Albergel, C., Arduini, G., Balsamo, G., Boussetta, S., Choulga, M., Harrigan, S., Hersbach, H., Martens, B., Miralles, D. G., Piles, M., Rodríguez-Fernández, N. J., Zsoter, E., Buontempo, C., and Thépaut, J.-N.: ERA5-Land: a state-of-the-art global reanalysis dataset for land applications, Earth Syst. Sci. Data, 13, 4349–4383, https://doi.org/10.5194/essd-13-4349-2021, 2021.
Natural Resources Canada: Hydrographic Features – CanVec Series – 1M, Government of Canada [data set], https://open.canada.ca/data/en/dataset/9d96e8c9-22fe-4ad2-b5e8-94a6991b744b (last access: 8 July 2026), 2017.
Python Package Index – PyPI: daylight 0.1.3, PyPI [code], https://pypi.org/project/daylight/ (last access: 8 July 2026), 2020.
Roberge, F., Di Luca, A., Laprise, R., Lucas-Picher, P., and Thériault, J.: Spatial spin-up of precipitation in limited-area convection-permitting simulations over North America using the CRCM6/GEM5.0 model, Geosci. Model Dev., 17, 1497–1510, https://doi.org/10.5194/gmd-17-1497-2024, 2024.
Sjöström, J., Vermina Plathner, F., and Granström, A.: 70 Years of observational weather data show increasing fire danger for boreal Europe and reveal bias of ERA5 reanalysed data, Sci. Rep., 15, https://doi.org/10.1038/s41598-025-04200-3, 2025.
Turner, J. A. and Lawson, B. D.: Weather in the Canadian Forest Fire Danger Rating System, A user guide to national standards and practices, Environment Canada, Pacific Forest Research Centre, Victoria, BC. BC-X-177, https://ostrnrcan-dostrncan.canada.ca/handle/1845/230952 (last access: 8 July 2026), 1978.
Van Wagner, C. E.: Development and structure of the Canadian Forest Fire Weather Index System, Paper presented at the Can. For. Serv., Forestry Tech. Rep., https://ostrnrcan-dostrncan.canada.ca/handle/1845/228434 (last access: 8 July 2026), 1987.
Van Wagner, C. E. and Pickett, T. L.: Equations and FORTRAN program for the Canadian Forest Fire Weather Index System, Canadian Forestry Service, Petawawa National Forestry Institute, Chalk River, Ontario, Forestry Technical Report 33, 18 pp., https://ostrnrcan-dostrncan.canada.ca/handle/1845/228362 (last access: 8 July 2026), 1985.
Vitolo, C., Di Giuseppe, F., Barnard, C., Coughlan, R., San-Miguel-Ayanz, J., Libertá, G., and Krzeminski, B.: ERA5-based global meteorological wildfire danger maps, Scientific Data, 7, 216, https://doi.org/10.1038/s41597-020-0554-z, 2020.
Wang, X., Thompson, D., Marshall, G., Tymstra, C., Carr, R., and Flannigan, M.: Increasing frequency of extreme fire weather in Canada with climate change, Clim. Change, 130, 573–586, https://doi.org/10.1007/s10584-015-1375-5, 2015.
Wang, X., Cantin, A., Parisien, M.-A., Wotton, M., Anderson, K., Moore, B., Schiks, T., and Flannigan, M.: Canadian Forest Fire Danger Rating System, v1.9.0, RForge [code], https://r-forge.r-project.org/projects/cffdrs/ (last access: 16 September 2025), 2024.
Wotton, B. M. and Flannigan, M. D.: Length of the fire season in a changing climate, Forest. Chron., 69, 187–192, https://doi.org/10.5558/tfc69187-2, 1993.
- Abstract
- Introduction
- Objectives
- Data production and methods
- Results
- Data availability
- Code availability
- Discussion and further work
- Appendix A: Study domain map
- Appendix B: Onset calculation methodology and analysis
- Appendix C: Overwintering of the Drought Code (DC)
- Appendix D: FWI correlations with CWFIS stations observations
- Author contributions
- Competing interests
- Disclaimer
- Acknowledgements
- Financial support
- Review statement
- References
- Abstract
- Introduction
- Objectives
- Data production and methods
- Results
- Data availability
- Code availability
- Discussion and further work
- Appendix A: Study domain map
- Appendix B: Onset calculation methodology and analysis
- Appendix C: Overwintering of the Drought Code (DC)
- Appendix D: FWI correlations with CWFIS stations observations
- Author contributions
- Competing interests
- Disclaimer
- Acknowledgements
- Financial support
- Review statement
- References