the Creative Commons Attribution 4.0 License.
the Creative Commons Attribution 4.0 License.
 | 25 Aug 2026
Geospatial micro-estimates of slum populations in 129 Global South countries using machine learning and public data
Dan Li
Yang Yu
Peipei Tian
Slums are a visible manifestation of poverty in Global South countries. Reliable estimation of slum populations is crucial for urban planning, humanitarian aid provision, and improving well-being. However, large-scale and spatially explicit mapping is still lacking due to inconsistent methodologies and definitions across countries. Existing datasets often rely on government statistics, lacking spatial continuity or underestimating slum populations due to factors such as city image and privacy concerns. Here, we develop a standardized bottom-up approach to estimate slum populations at the grid-cell level (∼6.72 km resolution at the equator) for 129 Global South countries in 2018. Leveraging the Sustainable Development Goal 11.1 framework and machine learning, our estimation integrates publicly accessible household-based surveys, satellite imagery, and gridded population data. The resolution is thus jointly determined by the model input patch size and the spatial resolution of Landsat imagery. Our models explain 82 %–95 % of the variation in within-country spatial prediction and 45 %–91 % in country-level holdout validation, corresponding to median R2 values of 0.89 and 0.85, respectively. These results indicate strong predictive performance and remain broadly comparable with, and in some cases higher than, previously reported benchmarks. To our knowledge, this is the first comprehensive geospatial inventory of slum populations across Global South countries. Although not designed for site-specific operational applications, the dataset provides valuable insights for national and regional urban sustainability assessments and further research on vulnerable populations. The maps of slum populations and their local shares in Global South countries are available in the Zenodo repository at https://doi.org/10.5281/zenodo.13779002 (Li et al., 2025).
- Article
(9534 KB) - Full-text XML
-
Supplement
(1387 KB) - BibTeX
- EndNote


The right to adequate housing and shelter holds a central position in the realm of international human rights (Hohmann, 2013; Nowak, 2003). Adequate housing means more than physical shelter; it includes secure tenure, protection from forced eviction, cultural suitability, and access to essential services, schools, and employment. However, a distressing reality persists: millions of individuals worldwide live in life- or health-threatening conditions, commonly referred to as slums, informal settlements, favelas, or shanties (Hardoy et al., 2013). As a kind of visible expressions of poverty, slums are typically characterized by physical state of disrepair, degraded environment in insanitary conditions, and absence of basic and essential facilities, and they are often situated in disadvantageous, exposed and hazardous areas (Abascal et al., 2022; UN‐Habitat, 2004). The emergence and persistence of slums have been a consequence of rapid and unplanned urbanization that outpaces economic growth and infrastructure development (Ezeh et al., 2017; Marx et al., 2013). According to the World Cities Report 2020 (UN-Habitat, 2020), over 1 billion people live in urban slums, with 80 % of them residing in cities within developing countries. Nevertheless, urbanization has not yet peaked, and the population living in slum-like conditions is expected to grow (Guan et al., 2018; UN-Habitat, 2020). This intensifies the urgency to provide adequate housing, basic services and slums upgrades, in line with the commitment to the Sustainable development Goals (SDG) and “leaving no one behind” (Weber, 2018; Tian et al., 2024).
Reliable slum population estimates are essential for understanding the spatial scale and distribution of slum populations, providing foundational data for implementing targeted urban planning and improving human well-being (Parikh et al., 2013; Satterthwaite et al., 2020; Schetke et al., 2012). These estimates help identify vulnerable populations, similar to demographic data on the elderly and women (Singh, 2016). Detailed knowledge of slum population locations enables effective resources allocation and targeted interventions (Doe et al., 2020; Zhou et al., 2022). Quantitative data can also motivate policymakers and researchers to tackle inequalities, while spatial knowledge can help pinpoint drivers of slum population growth, such as proximity to rivers and elevation, thus contributing to climate risk management (Baynes et al., 2022; Rentschler et al., 2023; Sietchiping and Yoon, 2010).
Despite this, large-scale, comparable inventories of slum populations remain scarce. National statistics and sparse survey data, such as those from censuses or Know Your City Campaigns, a participatory slum mapping initiative by Slum Dwellers International, fail to provide a spatially continuous view of slum population (Angeles et al., 2009; Pedro and Queiroz, 2019; Persello and Kuffer, 2020). These data collections are inconsistent across countries (Thomson et al., 2020), and governments may withhold or omit sensitive information due to factors such as city image considerations (Björkman, 2013; Moreno, 2003; Wurm et al., 2017). Privacy concerns also contribute to underreporting (Engin et al., 2020), as slum dwellers may distrust external inquiries (Binzel and Fehr, 2013; Rogler, 1967). As a result, spatially explicit data on slum populations, particularly in developing countries, remain scarce.
Recent advancements in machine learning and the availability of satellite imagery provide new opportunities for slum population mapping (Burke et al., 2021; Gram-Hansen et al., 2019; Wurm et al., 2019). While considerable research has focused on identifying slums based on satellite-derived morphological features, such as studies in Mumbai (Ibrahim et al., 2019), and Kenya (Mahabir et al., 2020), these efforts are often limited to individual cities (Banerjee et al., 2017; Thomson et al., 2020) and may not provide comparable results across countries or regions. For instance, the boundaries of slum determined in these studies may yield discrete outcomes (Patel et al., 2019), making it difficult to integrate this information with population data to produce large-scale demographic insights (Breuer and Friesen, 2023). In some cases, there might be a necessity to obfuscate the precise boundaries of slums to safeguard the privacy of already vulnerable populations (Thomson et al., 2019). Although several studies have estimated slum populations in selected cities across the developing countries, these estimates are generally considered to be underestimations (Breuer et al., 2024; Thomson et al., 2022).
In this study, we integrate ground-surveys, public satellite imagery, and advanced machine learning to map slum populations at the grid-cell level (6.72 km × 6.72 km at the equator; approximately 16 grid cells for Nairobi City County) across Global South countries. The Global South refers to the countries and territories in developing regions listed by the United Nations Conference on Trade and Development (UNCTAD, 2025). During the training, validation, and testing phases, we assemble data from surveys covering over 1 million households in 67 204 clusters across 53 countries, sourced from Demographic and Health Surveys (DHS). Using this data, we construct a slum indicator framework and fine-tune the ResNet-34, a widely used deep learning model for image recognition, to extract features from Landsat and nighttime light imagery. For out-of-sample predictions, we apply the cross-validated model to predict slum indicators and integrate them with gridded population data to create detailed slum population maps for 129 Global South countries in 2018. Overall, we offer a generalized and scalable approach to slum population mapping that enables regional comparisons while maintaining privacy safeguards. The objectives of this study are to (1) develop a machine learning-based workflow for slum population mapping, (2) generate a comprehensive geospatial inventory of slum populations in 129 Global South countries, and (3) analyze spatial distribution disparities across different geographic regions and income groups.
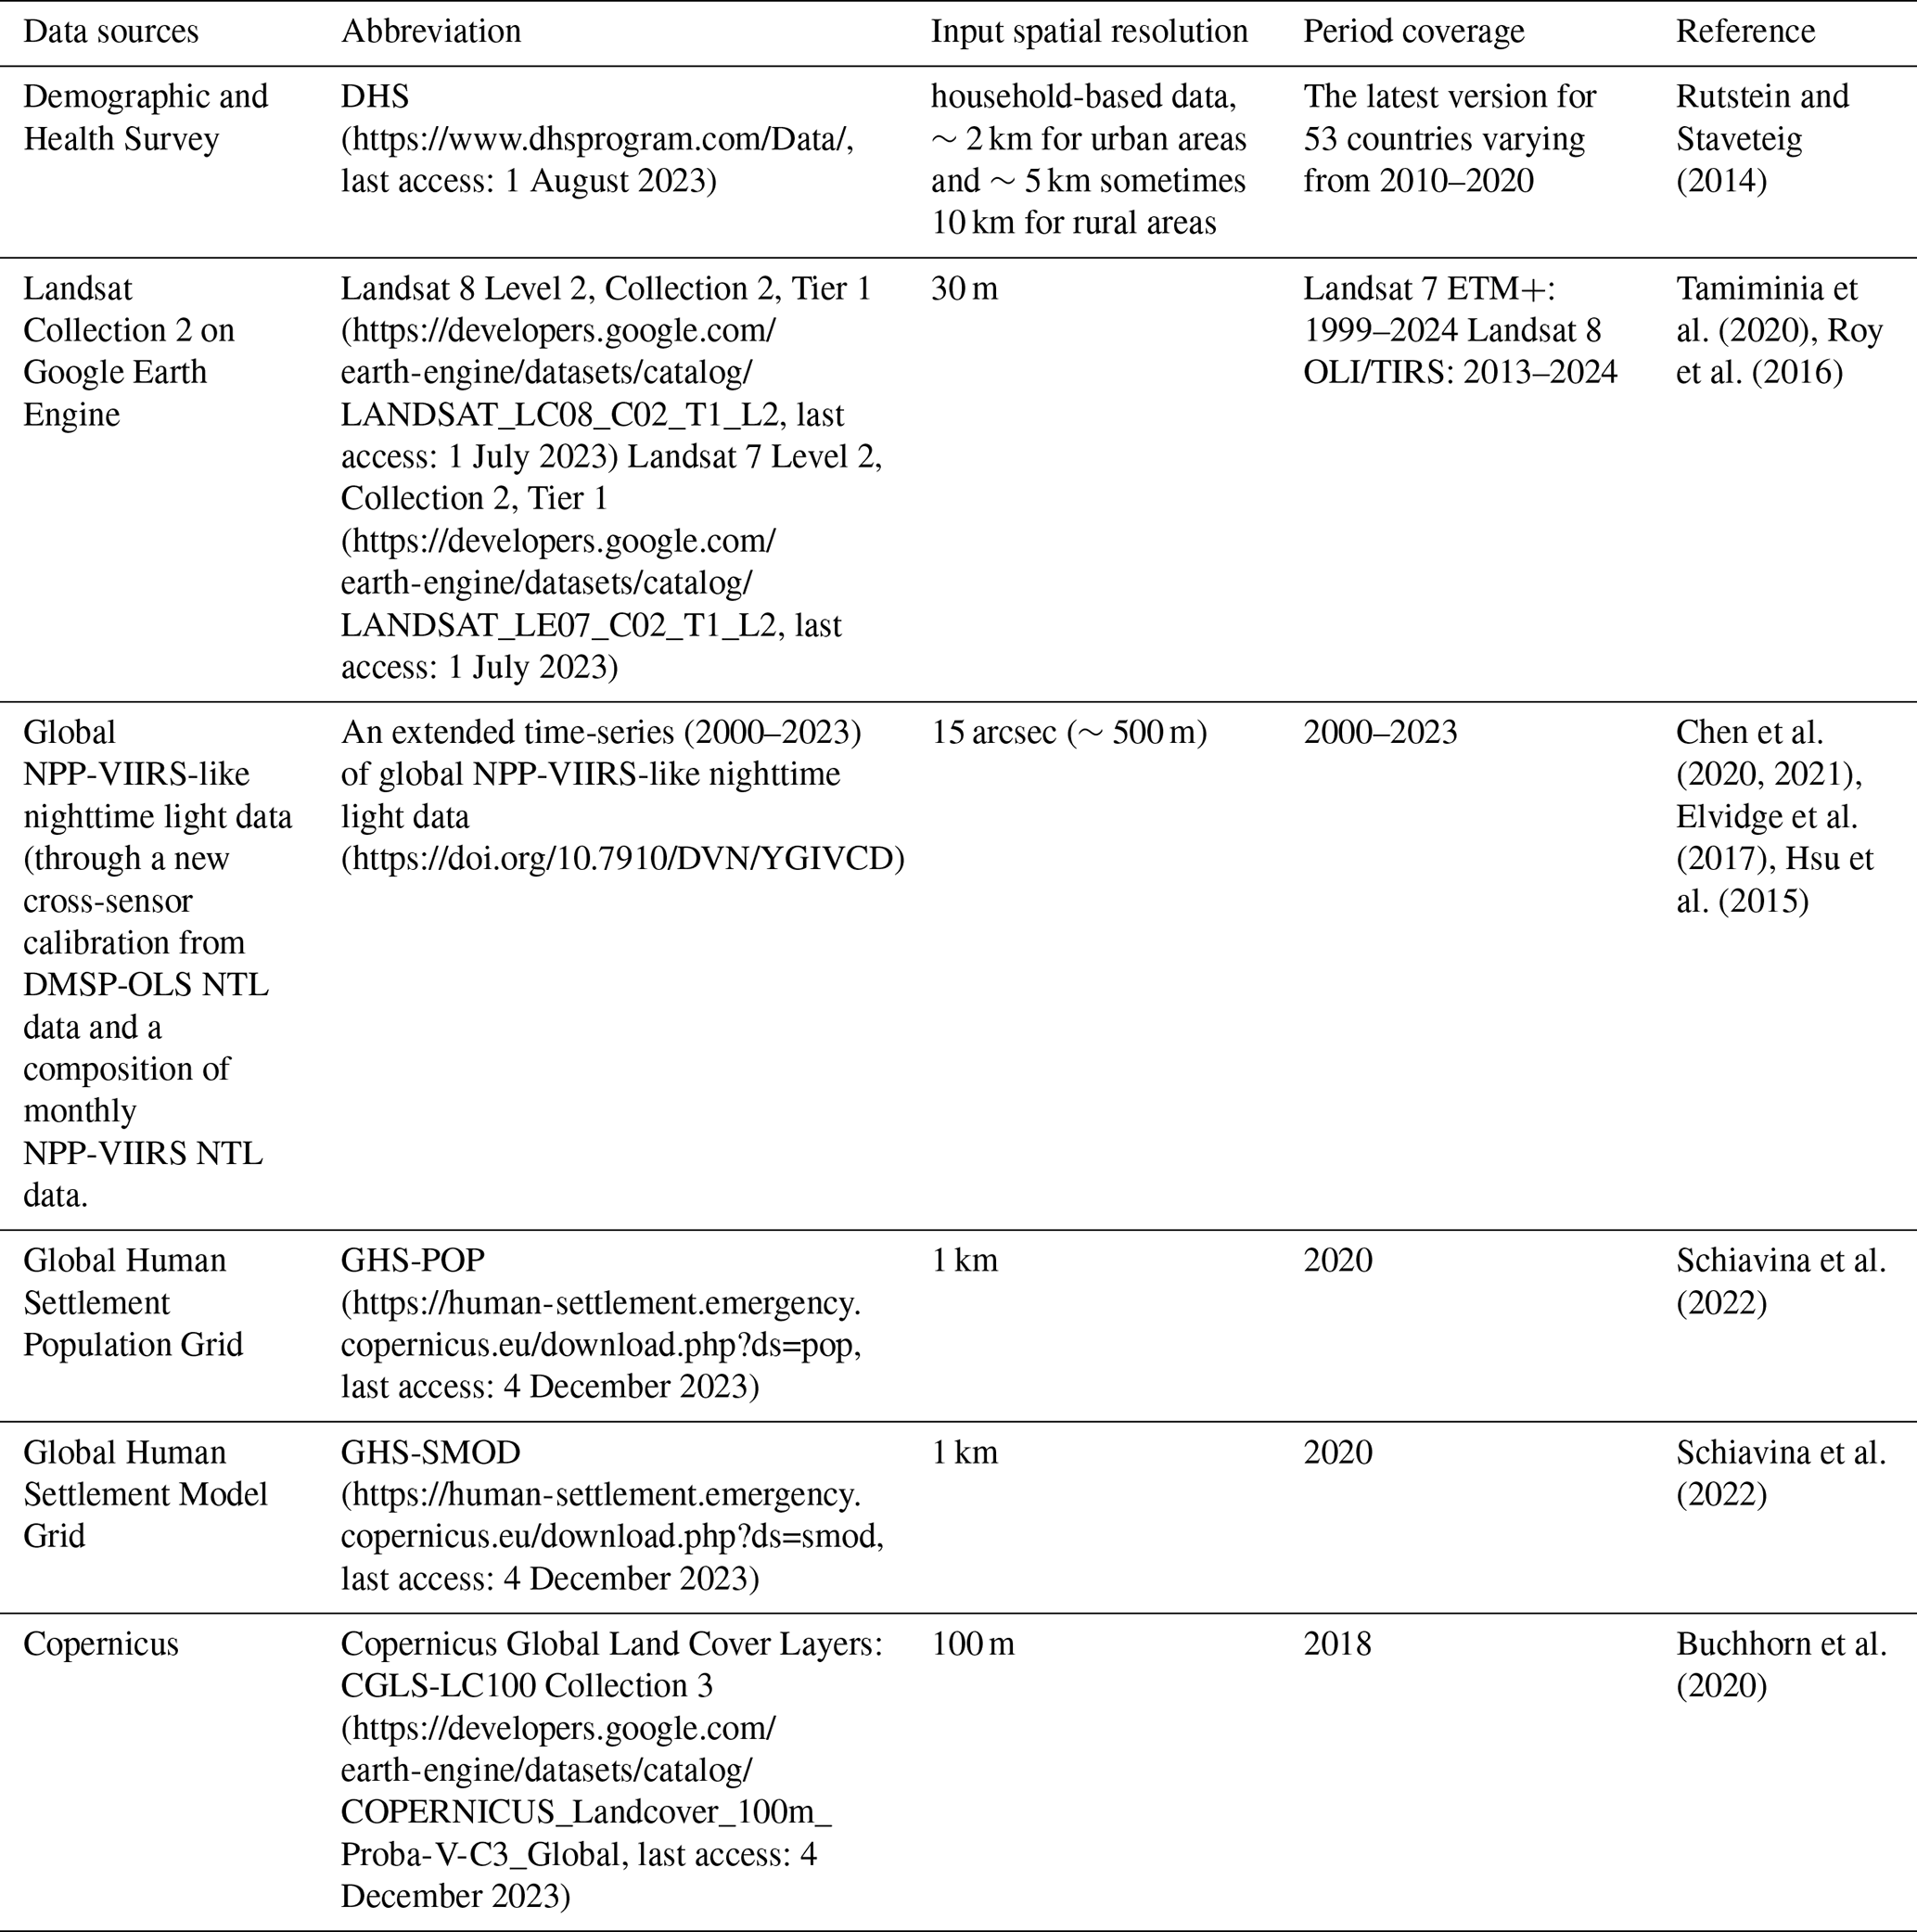
Four types of publicly accessible datasets are used in this study. The first type is geo-referenced household surveys, which are used to calculate the slum indicator as machine learning labels. The second type consists of daytime satellite imagery and nighttime light imagery, which serve as the input features. The third type is gridded population data, used in combination with the slum indicator to produce the final gridded slum population estimates. The fourth type consists of gridded auxiliary data related to slum populations, which help exclude areas without human settlements. Table 1 outlines the datasets and layers that are used to generate the slum population map in this study.
Table 1Overview of data sources for generating the slum population map in Global South countries.
2.1 Geo-referenced household surveys
This study used the household-based ground survey data from Demographic and Health Surveys (DHS) to calculate the proportion of slum households for each cluster. Here, a cluster refers to a DHS enumeration unit, approximately the size of a neighborhood or village, typically containing 50–300 households. The DHS program is funded primarily by the United States Agency for International Development (USAID), and collects nationally representative and comparable information based on a consistent set of questionnaires for a wide range of monitoring and impact evaluation indicators in the areas of population, health, and household living conditions in developing countries (Rutstein and Staveteig, 2014). The derived standard DHS Surveys have large sample sizes (usually between 5000 and 30 000 households) and typically are conducted about every 5 years. Focusing on Global South countries, we derived the geo-referenced data from 53 countries (as of 2022) in Latin American, Africa and Asia, with a valid dataset comprising over 1 million households across 67 204 clusters. The ground-truth household surveys points can be found in Fig. S1 and Table S1 in the Supplement. To protect respondent confidentiality, the DHS program randomly displaces the geographic coordinates of the surveyed locations, with a maximum of 2 km for urban clusters and 5 km or sometimes 10 km for rural clusters (Burgert et al., 2013). To avoid misclassification in analysis using administrative-level data, the displacements are constrained within the administrative boundaries, specifically at the administrative level 3 (Fig. S2). The cluster thus corresponds to neighborhoods in urban areas or villages in rural areas.
2.2 Satellite imagery
We obtained publicly available Landsat-7 ETM+ (Collection 2, Tier 1), Landsat-8 OLI (Collection 2, Tier 1) and nighttime light imagery from Google Earth Engine platform (Tamiminia et al., 2020), along with the Global NPP-VIIRS-like nighttime light dataset (Chen et al., 2021). The Landsat imagery series provides the world's longest-running collection of consistently acquired, high-resolution Earth observation data and have been widely applied in studies such as urban growth monitoring (Patel et al., 2015; Wulder et al., 2022). The collection 2, Tier 1 images have undergone improved systematic geometric correction and radiometric calibration. Due to differences in the spectral reflectance between different sensors, we adopted the normalization coefficients from Roy et al. (2016) to characterize the ETM+ reflectance to that of OLI. To get clear slices with fewer clouds and snow, we generated a 1-year median composite from Landsat imagery by selecting cloud-free pixels based on the quality assessment (QA) bands, and then calculating the median value for each available cloud-free pixel over the 1-year period (Azzari and Lobell, 2017). Higher-resolution alternatives, including Sentinel-2 and PlanetScope, were considered but not used as primary inputs. For example, Sentinel-2 offers 10–20 m multispectral imagery, but its shorter historical record limits temporal consistency with many DHS survey years. PlanetScope provides approximately 3 m imagery, but its commercial licensing, cost, and data-access constraints limit reproducibility for global-scale analysis. We therefore relied on Landsat imagery because it provides publicly available, long-term, and globally consistent observations suitable for cross-country analysis.
Similarly, considering the inconsistent timing of household surveys across countries, we used the Global NPP-VIIRS-like nighttime light dataset to ensure spatiotemporal consistency between satellite imagery and slum indicator labels. This NPP-VIIRS-like dataset is particularly suitable for analyzing long-term demographic and socioeconomic trends, as its cross-sensor calibration between DMSP OLS (2000–2012) and NPP VIIRS (2013–2018) removes inter sensor bias and drift, yielding a radiometrically consistent time series (Chen et al., 2021). Brighter nighttime lights generally indicate more developed areas, so this helps the model distinguish slums from better-served neighborhoods. We thus obtained six multispectral bands from Landsat imagery including red, green, blue, near infrared and two shortwave infrared bands, and one single band from NPP-VIIRS-like nighttime light dataset. The input images used for model training were centered on the geographic coordinates of each DHS cluster, a small geographic survey unit based on a census enumeration area, using a standardized grid cell size of approximately 6.72 km to ensure spatial alignment with the corresponding DHS labels. For map generation, images were collected for every 6.72 km grid cell across the study area, enabling the production of spatially continuous predictions. The Landsat image patches were set to 224×224 pixels to match the input size required by our convolutional neural network architecture and to cover the spatial displacement of DHS cluster coordinates. Consequently, our mapping resolution is determined to be 6.72 km at the equator (30 m-pixel size × 224 pixels = 6.72 km).
2.3 Population and gridded auxiliary data
We utilized and processed the Global Human Settlement Population dataset (GHS-POP), a global population dataset that distributes census counts into 1 km grid cells developed by the EU Joint Research Center, to estimate the slum population (Schiavina et al., 2022). The GHS-POP dataset provides a more precise estimation of population distribution by disaggregating census or administrative unites into grid cells, based on the classification of built-up areas in the Global Human Settlement Layer derived from Landsat imagery. It was selected for its superior accuracy and top-down constrained allocation approach, outperforming other available gridded population datasets (Smith et al., 2019; Tellman et al., 2021). We resampled this population dataset to match the resolution of our grid-cell level mapping. Additionally, we incorporated the GHS Settlement Model Grid (GHS-SMOD) and the Copernicus Global Land Cover Layers product (CGLS-LC100) as auxiliary gridded data (Buchhorn et al., 2020; Schiavina et al., 2022). This helped us differentiate settlement patterns across urban, semi-urban, and rural areas, and also allowed us to exclude areas with low population density.
We proposed a standardized and comparable framework for estimating grid-cell level slum population, which integrated a slum indicator framework based on the definition of slum households, a deep learning model, and a tree-based ensemble regression model. Our approach addressed the underestimation of slum population in prior literature, which heavily relied on slum boundary geometry. A set of examples of the uncertainties in slum boundary delineation is shown in Fig. S3. Figure 1 depicts the flowchart for mapping slum populations in Global South countries. The main procedures are outlined as follows.
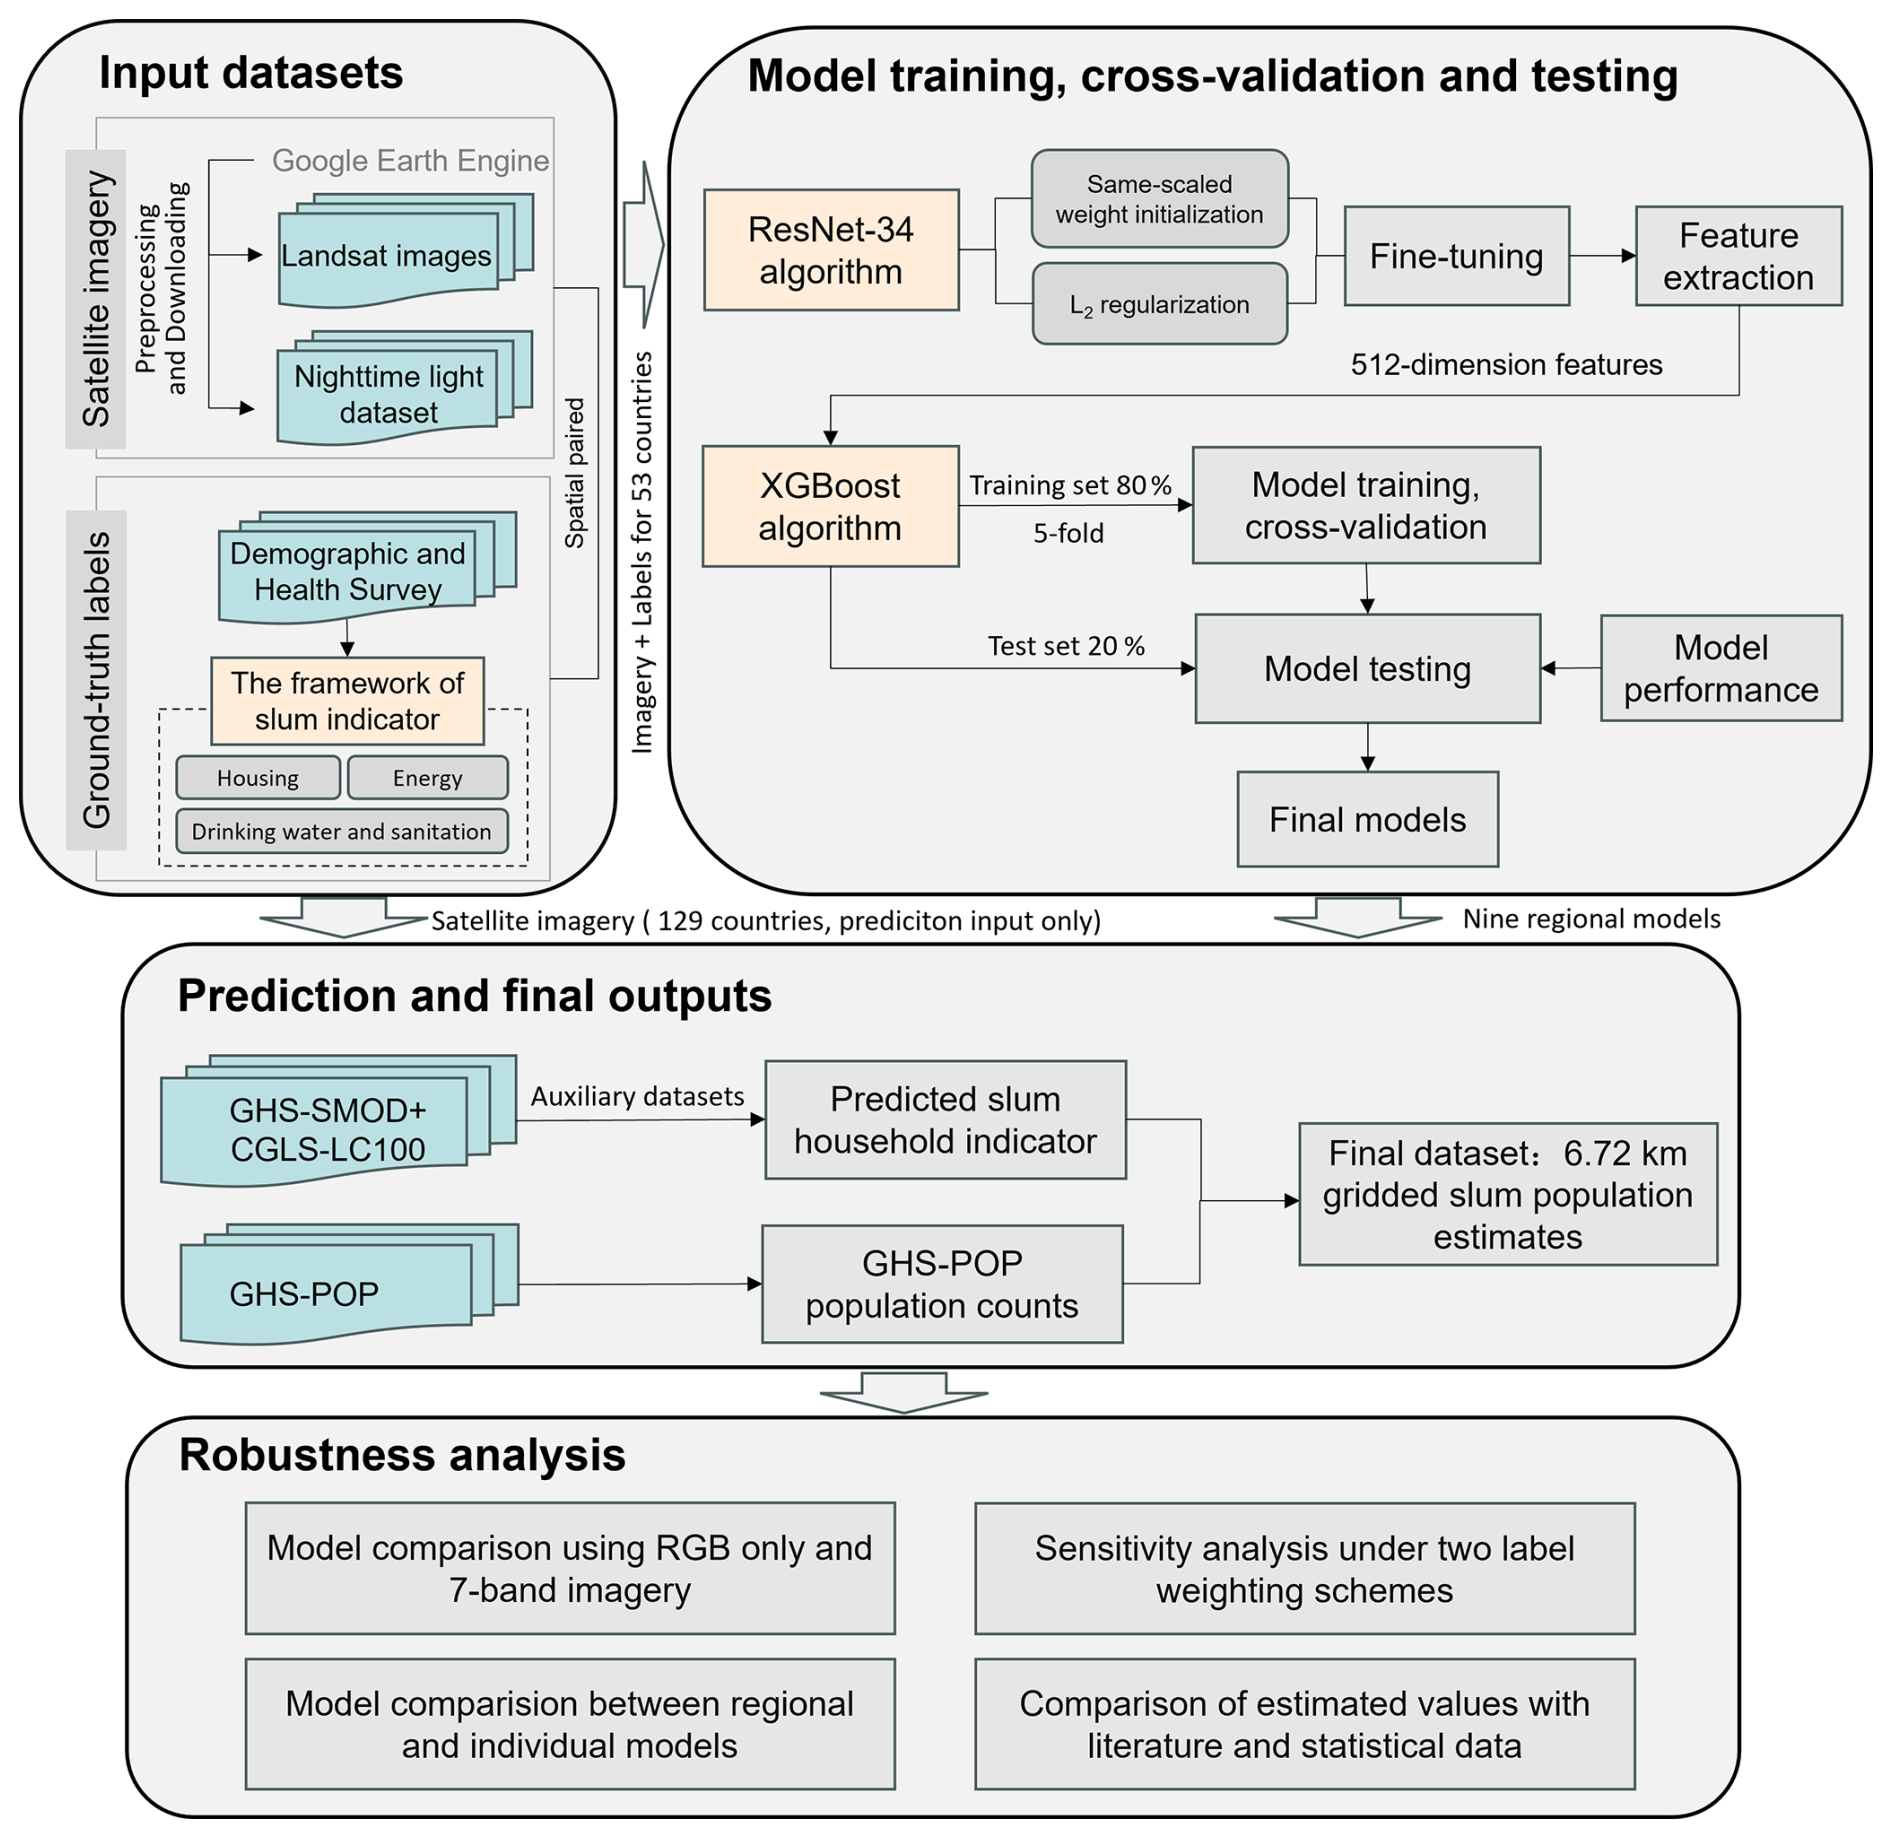
Figure 1Workflow of this study. Blue backgrounds represent datasets, yellow backgrounds indicate the indicator framework or model architecture, and gray backgrounds denote specific processes or procedural steps.
3.1 Framework of slum indicator
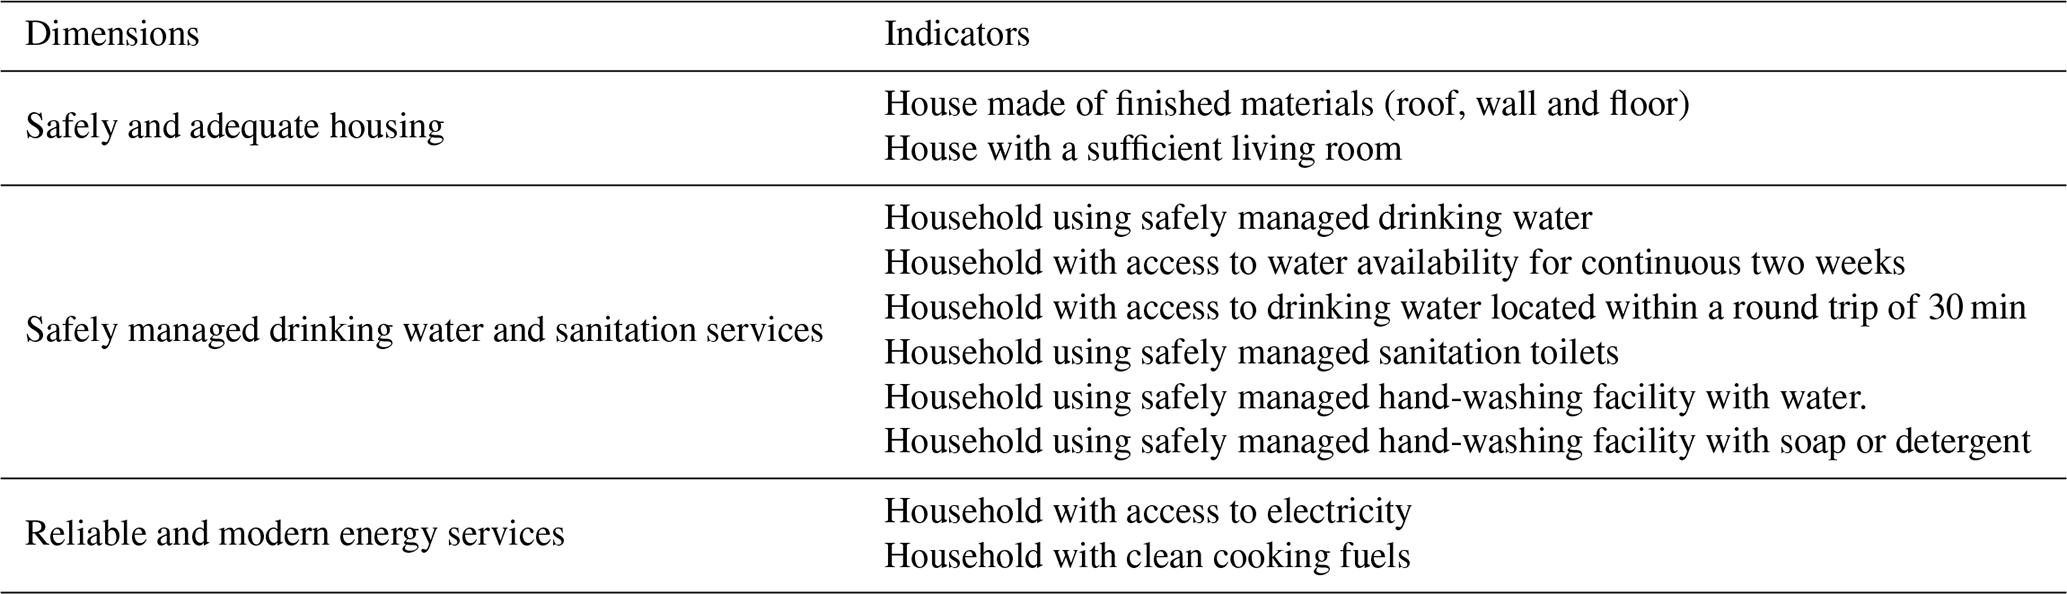
We used the SDG 11.1 framework, referring to the United Nations indicator framework for monitoring access to adequate, safe, and affordable housing and basic services, as a proxy to estimate the occurrence of households living in slums or slum-like conditions within a cluster. Based on UN-Habitat's definition of a slum household (UN-Habitat, 2021), we incorporated “access to electricity” into our framework because it is a key dimension of infrastructure services, consistent with the broader focus of SDG 11.1 on adequate, safe and affordable housing and basic services. However, we excluded the “security of tenure” dimension due to the lack of internationally comparable data. As a result, the slum population is defined as individuals (or households) living in conditions lacking one or more of the following: safe and adequate housing, safely managed drinking water and sanitation services, or reliable and modern energy services. These conditions are categorized into three dimensions, comprising 10 indicators (Table 2). The specific definitions and criteria are detailed in Table S2.
Table 2The framework of slum indicator based on household data.
The indicator calculates a weighted average of the proportion of households lacking services in each dimension. We did not use a simple average across all sub-indicators or data-driven weighting methods such as principal component analysis. A simple average across all sub-indicators would give disproportionate influence to dimensions with more indicators, particularly water and sanitation services, while data-driven weights would depend on the covariance structure of specific samples and could therefore reduce cross-country comparability. We therefore treated adequate housing, water and sanitation services, and energy services as equally important dimensions of multidimensional infrastructure deprivation and assigned each dimension an equal weight of 0.33. The slum indicator is then determined as follows:
where Sc represents the slum indicator for each cluster c; NHc is the total number of households in cluster c; wH, wW, and wE represent the weights assigned to the dimensions of safely and adequate housing (H), safely managed drinking water and sanitation services (W), and reliable and modern energy services (E); nH, nW, nE represent the total number of sub-indicators within the H, W and E dimensions, respectively; hi,c, waj,c, and el,c denote the numbers of households in cluster c that fail to meet the criteria for the ith housing sub-indicator, jth water and sanitation sub-indicator, and lth energy sub-indicator, respectively.
The DHS surveys' standardized instruments and rigorous quality control protocols ensure high reliability of the data, which in turn supports the validity of our labels. Before constructing the slum household indicator, we applied a comprehensive data cleaning process. Sub-indicator with missing values, “don't know” responses, or implausible entries were excluded. If all sub-indicators within a given dimension were missing, the corresponding household record was removed. Clusters with invalid GPS coordinates were also excluded. Additionally, to evaluate the sensitivity of the labels to the indicator weighting scheme, we implemented two alternative weighting scenarios (see Sect. 3.5 for more details).
3.2 Model architecture
We employed transfer learning by fine-tuning the pre-trained ResNet-34 to extract the informative features from satellite imagery (Fig. 2). Transfer learning in deep learning leverages pre-trained models, which have been trained on large datasets, to capture general features with high accuracy (Pan and Yang, 2009). Like reusing a general-purpose image-recognition system (trained on everyday photos) and adapting it to recognize slum-like patterns in satellite images. In this study, we started with a ResNet model pre-trained on the large ImageNet dataset, which comprises over 100 million samples. ResNet, standing for the Residual Network, is a deep convolutional neural network (CNN) architecture that uses skip connections to bypass one or more layers, allowing input data to be added directly to the output (He et al., 2016). These skip connections help mitigate the vanishing or exploding gradient problems often encountered in deep networks. ResNet-34 strikes a balance between model depth and computational efficiency, making it an idea choice for mapping tasks (Robinson et al., 2017; Shi et al., 2023) while offering a good trade-off between model capacity and accuracy (Russakovsky et al., 2015).
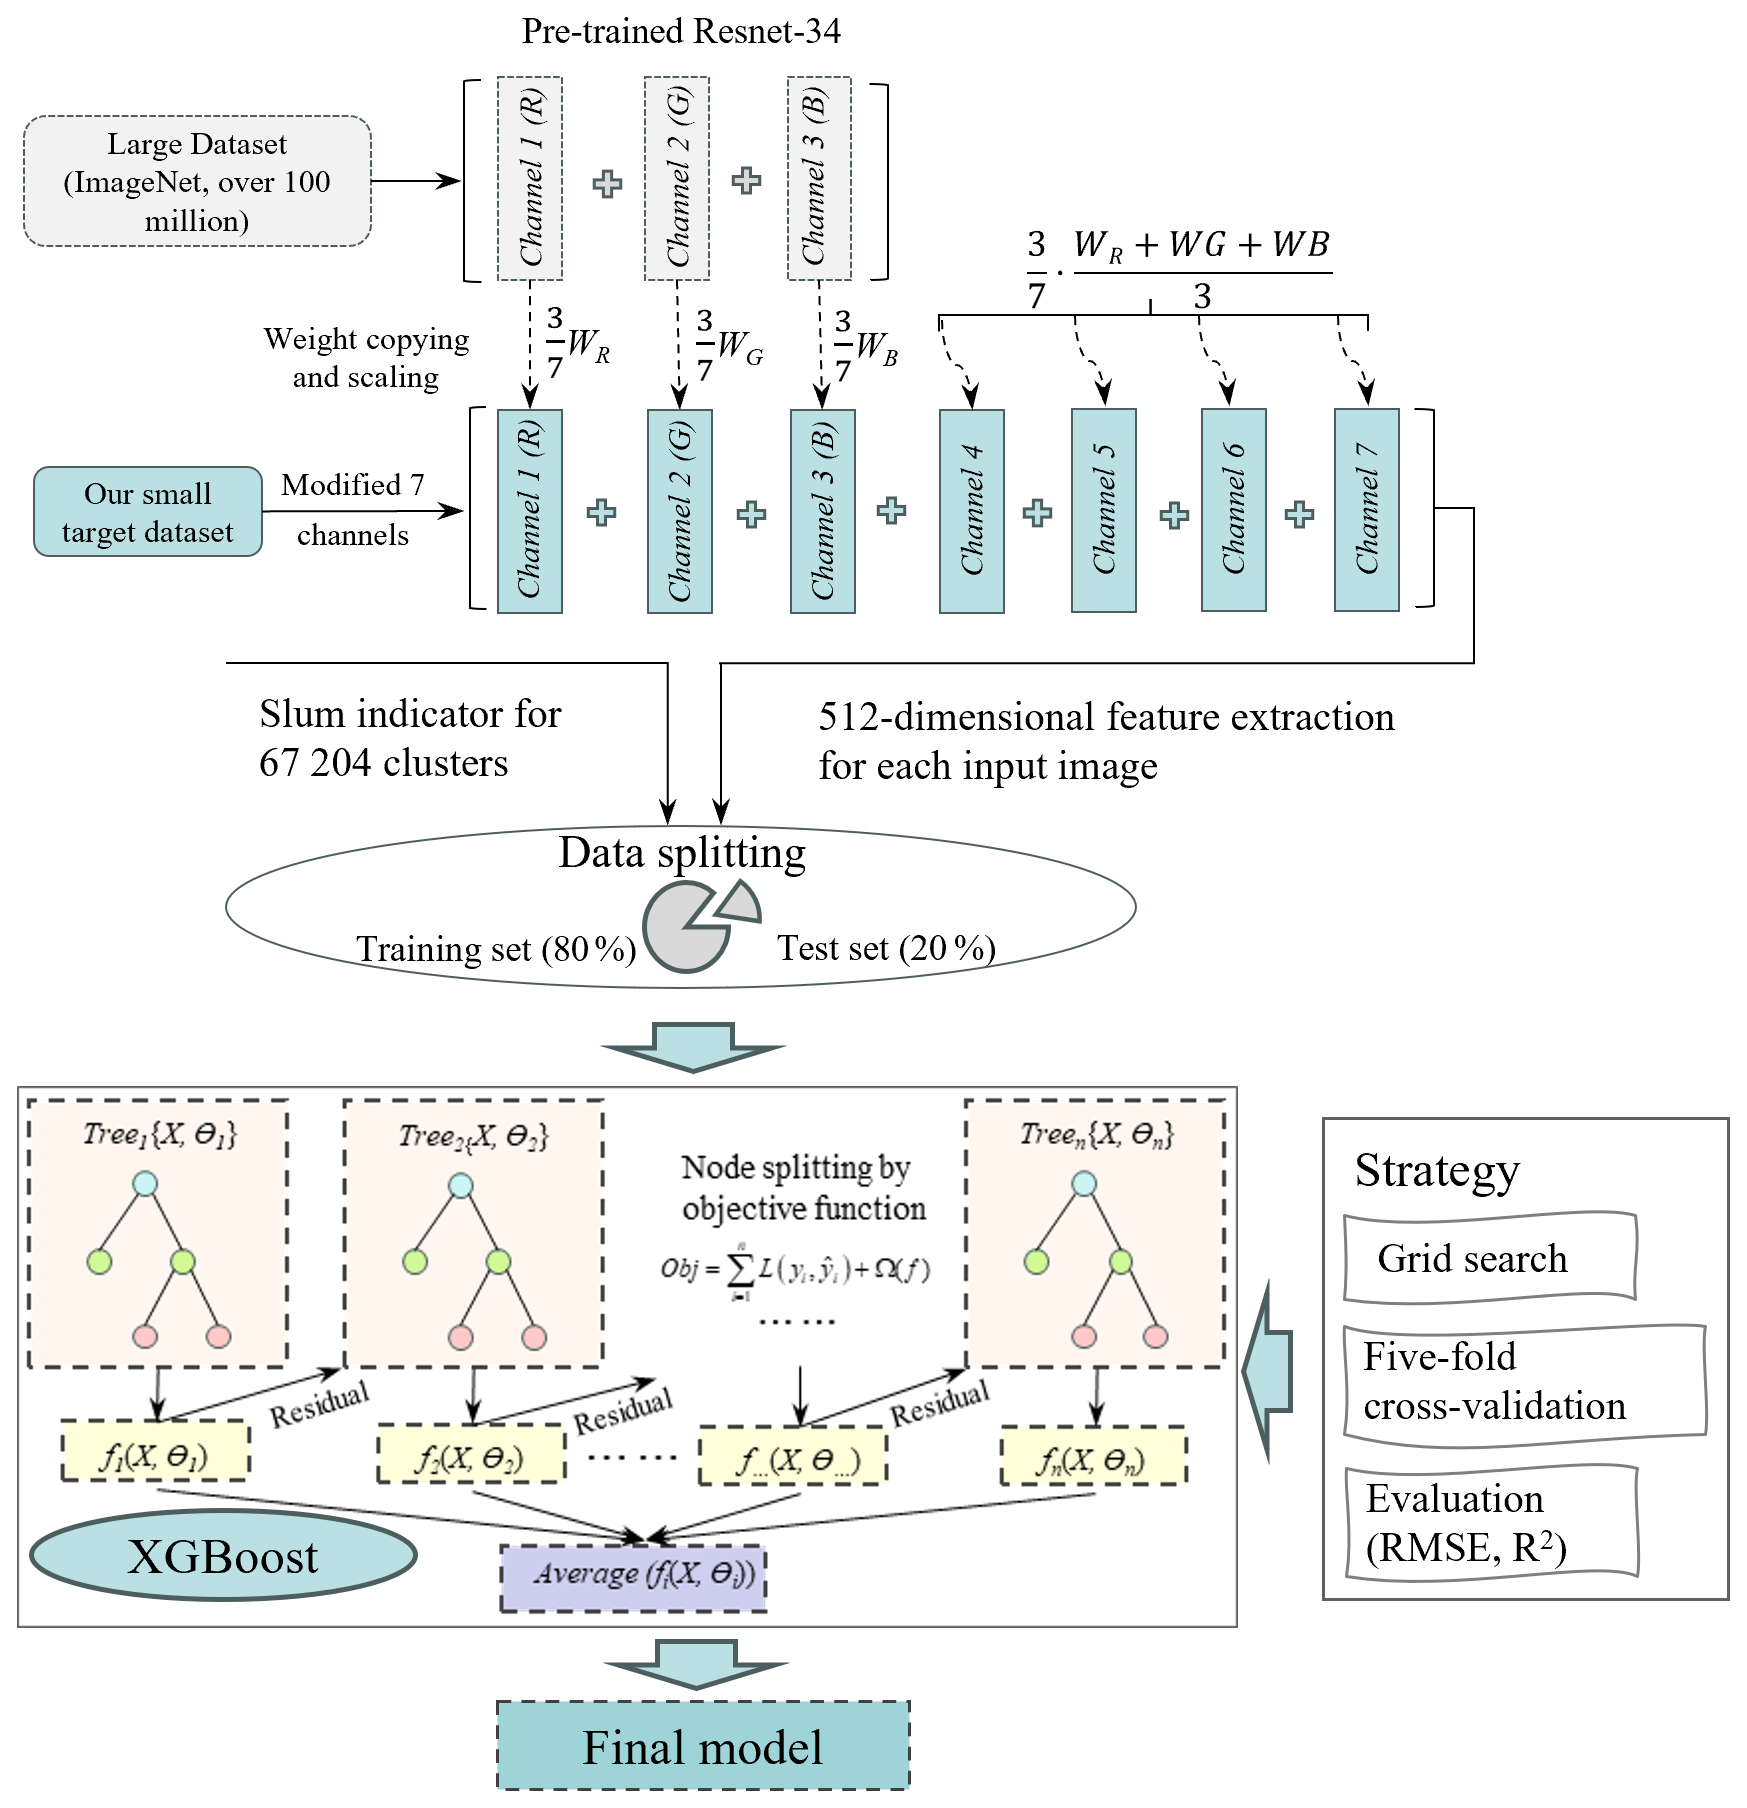
Figure 2Schematic of the proposed model architecture. It integrates transfer learning by fine-tuning ResNet-34 to extract high-dimensional spatial–spectral features from multispectral imagery, followed by XGBoost regression for predictive modeling.
For the purpose of this study, we modified the first convolutional layer to accommodate our satellite slice inputs, and the last layer to produce a continuous estimate instead of a classification. Specifically, we initialized the RGB channels with weights pre-trained on ImageNet, while for non-RGB channels, we used the average of weights for RGB weights for initialization. All weights were scaled by a factor of 3/7. Following Yeh et al. (2020), the remaining layers of the ResNet were initialized to their ImageNet values, and the weights for the final layer were initialized randomly. The model was trained using the Adam optimizer (Kingma and Ba, 2014) and a mean squared error loss function with L2 regularization. The models were trained for 120 epochs, with early stopping implemented to prevent overfitting. The hyperparameter learning rate and L2 weight regularization were ranged among 0.1, 0.01, 0.001 and 0.0001, and 1, 0.1, 0.01 and 0.001, respectively. After fine-tuning the ResNet-34 model, we leveraged it to extract 512-dimensional features from the satellite images. Here we did not incorporate other slum-related geographical characteristics, such as proximity to government agencies or educational facilities, since these quantifications are not sufficiently accurate due to the displacement of cluster locations as indicated in DHS documentation.
Subsequently, we used eXtreme Gradient Boosting tree (XGBoost), a popular and flexible supervised-learning algorithm, to predict the occurrence of slum households in each cluster from 512 features. XGBoost, introduced by Chen and Guestrin (2016), is a scalable machine learning model based on the gradient boosting framework. It builds an ensemble of decision trees by sequentially adding weak learners, each aimed at improving prediction accuracy. The first tree is constructed by splitting features to minimize the loss function, and subsequent trees are generated iteratively, correcting the residuals of previous predictions. This process continues until the stopping criteria are met. In XGBoost, the trees work together to progressively reduce residuals, with the final prediction obtained by aggregating the outputs of all trees. XGBoost is renowned for its high computational efficiency and strong predictive performance, making it particularly suitable for large datasets and high-dimensional feature spaces (Nielsen, 2016; Ramraj et al., 2016).
3.3 Model training, cross validation and testing
During the model training and cross validation phases, we divided the 53 countries with the DHS data into 9 groups based on their geographical regions and income levels (Table S3). The classification of countries by income level follows the definitions provided by the World Bank (World Bank, 2022). Since DHS cluster coordinates are randomly displaced for confidentiality purposes, with a maximum displacement of 2 km for urban clusters and 5 km for rural clusters, the approximately 6.72 km grid-cell size helps absorb part of this displacement and reduce the influence of positional uncertainty on model training and prediction. During the model development phase, we constructed regionally stratified models based on geographic location and national income level, rather than separate country-specific models, to improve generalizability and ensure consistent feature extraction across heterogeneous contexts. In other words, we trained nine separate regional models, following the flowchart in Fig. 1. To enhance the generalization ability of the models, we grouped countries for training and validation rather than training individual country-specific models, ensuring a sufficient number of samples per group. While our primary analysis focused on regional models, we also compared their performance against country-specific models to evaluate potential differences.
We evaluated model performance under two validation settings: within-country spatial prediction and out-of-country generalization. For within-country prediction, spatiotemporally matched satellite images and DHS-derived slum indicators were split at the observation level using five-fold stratified cross-validation. The folds were constructed to preserve both the urban–rural composition and the country-level representation of the samples within each regional stratum. This validation setting assesses the ability of the models to predict unsampled grid cells in countries that are represented in the training data. To further assess spatial generalizability and reduce the risk of performance inflation due to spatial autocorrelation, we implemented country-group holdout cross-validation within each regional stratum. In this setting, entire countries, rather than individual observations, were held out for testing. Where a regional stratum contained a sufficient number of countries, approximately 20 % of countries were excluded in each fold; for strata with fewer than five countries, we applied leave-one-country-out validation. All observations from the held-out country or countries were excluded from both model training and validation and were used only for final testing. This design provides a stricter evaluation of model transferability to countries not used during model fitting.
We performed a grid search to identify the optimal combinations of hyperparameters and applied L2 regularization to the loss function to prevent overfitting. The tuned hyperparameters included the learning rate (learning_rate), maximum tree depth (max_depth), fraction of training data used for building each tree (subsample), fraction of features per tree (colsample_bytree), regularization term controlling tree complexity (gamma), and number of boosting rounds (n_estimators). Table 3 lists the candidate values considered. For each hyperparameter combination, we conducted five-fold cross-validation to train the models and compute average validation performance. The combination with the highest average performance was selected as optimal. We then retrained the model on the entire training and validation dataset using these optimal hyperparameters to update its weight parameters. The final model is evaluated on the hold-out test set to assess generalization. All training, cross-validation, and testing steps were conducted independently for each of the nine regional groups, following the defined data partitioning scheme, yielding nine distinct final regional models.
Table 3Hyperparameters used in the grid search for optimizing the XGBoost model. Param_grid indicates the ranges of values explored for each hyperparameter. Best_num_boost_rounds denotes the number of boosting iterations that achieved the highest validation performance.

3.4 Out-of-samples predictions
Using our final models, we predicted slum indicators at the grid-cell level across 129 countries in the Global South. Collected satellite imagery and nighttime light data were first divided into 224×224 pixel slices. The GHS-SMOD and CGLS-LC100 datasets were then applied as spatial masks to classify urban, suburban and rural areas, and to exclude grid-cells dominated by bare ground or sparse vegetation. Based on population estimates from the GHS-POP dataset, any image slice covering an area with a total population below 1000 people was excluded to avoid unreliable predictions in very sparsely populated areas.
The remaining image slices were processed by fine-tuned ResNet-34 models to extract 512-dimensional features, which were subsequently passed to the final regional XGBoost models to generate slum indicator predictions for each 6.72 km grid cell. All auxiliary datasets were harmonized to the 6.72 km analysis grid defined by the predicted slum-indicator map. The predicted slum-indicator grid was used as the target grid for population aggregation. To preserve demographic totals, the GHS-POP raster was aggregated by summing the 1 km population counts within each 6.72 km target grid cell. No interpolation-based resampling was applied to the GHS-POP population counts. Categorical datasets, including GHS-SMOD and CGLS-LC100, were resampled using nearest-neighbor interpolation to retain categorical integrity. All datasets were projected to WGS 1984 for spatial consistency.
To produce the final map of population living in slums or slum-like conditions, we integrated the GHS-POP dataset with the predicted slum indicator map. In the absence of household-level population statistics at the grid-cell level, we assumed that slum and non-slum households have equal average household sizes within each 6.72 km grid cell. Under this assumption, the proportion of slum households corresponds to the proportion of the population living in slums or slum-like conditions. Accordingly, the aggregated and spatially aligned GHS-POP population data were multiplies by the predicted slum indicator values to generate the final grid-cell-level map of slum populations.
We further analyzed the local shares of slum population in Global South countries at a resolution of 6.72 km. This metric enabled cross-country and cross-regional comparisons while accounting for differences in population size. To capture the degree to which local populations lack adequate infrastructure and housing, we implemented a hierarchical classification of slum population share, ranging from very low to very high concentration. Specifically, concentration levels were defined by the proportion of the slum population within each grid cell: very low (<10 %), low (10 %–20 %), moderate (20 %–40 %), high (40 %–60 %) and very high (>60 %).
3.5 Evaluation approaches and robustness analysis
Our slum population framework integrated multiple data sources, making robustness and uncertainty assessment complex. To address this, we adopted a step-by-step evaluation process, which involved validating results from intermediate steps and comparing results with other statistics (Haberl et al., 2021). First, we evaluate model performance using two metrics: the coefficient of determination (R2) and root mean squared error (RMSE). The household-based slum indicator calculated from DHS data served as the ground truth, while our method generated the predicted slum household indicators. We also compared the performance of our proposed approach with baseline models trained only on RGB (Red, Green, Blue) image bands, in order to assess the added value of using additional image channels.
Second, we tested the robustness of our framework by evaluating the model performance under two alternative weighting schemes for the slum indicator: the “Basic Service” scenario and the “UN-Habitat” scenario. In the Basic Service scenario, greater emphasis was placed on water and sanitation, and energy services, with weights of 0.2, 0.4, and 0.4, respectively (Fu et al., 2019). In contrast, the UN-Habitat scenario prioritized housing and water and sanitation services, assigning weights of 0.4, 0.4, and 0.2 (Mwaniki and Ndugwa, 2021). We then calculated the percentage change in slum population estimates by aggregating the grid-level predictions to the country level, and computing the percentage difference between each alternative scheme and the equal-weight scenario. This sensitivity analysis helped determine how different weighting schemes affect the final predictions. Third, we also compared the performance of regional models with country-specific models, which were all constructed using the equal-weight scenario (0.33, 0.33, 0.33), to identify the strengths and limitations of applying a generalized model across different region/income groups. Finally, we cross-validated our mapped slum population estimates against a broad range of literature and statistical data at regional, national, and local scales. This comparison provided an additional layer of validation, helping to evaluate the consistency of our estimates with existing data.
4.1 Model performance
Our regional models demonstrate strong performance in predicting the within-country slum household indicators (Table 4 and Fig. 3), with RMSE values ranging from 5.20 % to 10.17 % and R2 values between 0.82 and 0.95 (median RMSE = 6.00 %; median R2=0.89). Specifically, the models achieve an average RMSE of 5.89 % in Africa, 6.66 % in Asia, and 8.26 % in Latin America. The optimal hyperparameters for the regional models are provided in Table S4. This performance may be attributed to the availability of labeled training data from household surveys used during the modeling process. When comparing performance across income groups, models developed for low-income and lower-middle-income groups perform better than those for upper-middle-income and high-income groups in Asia and Latin America.
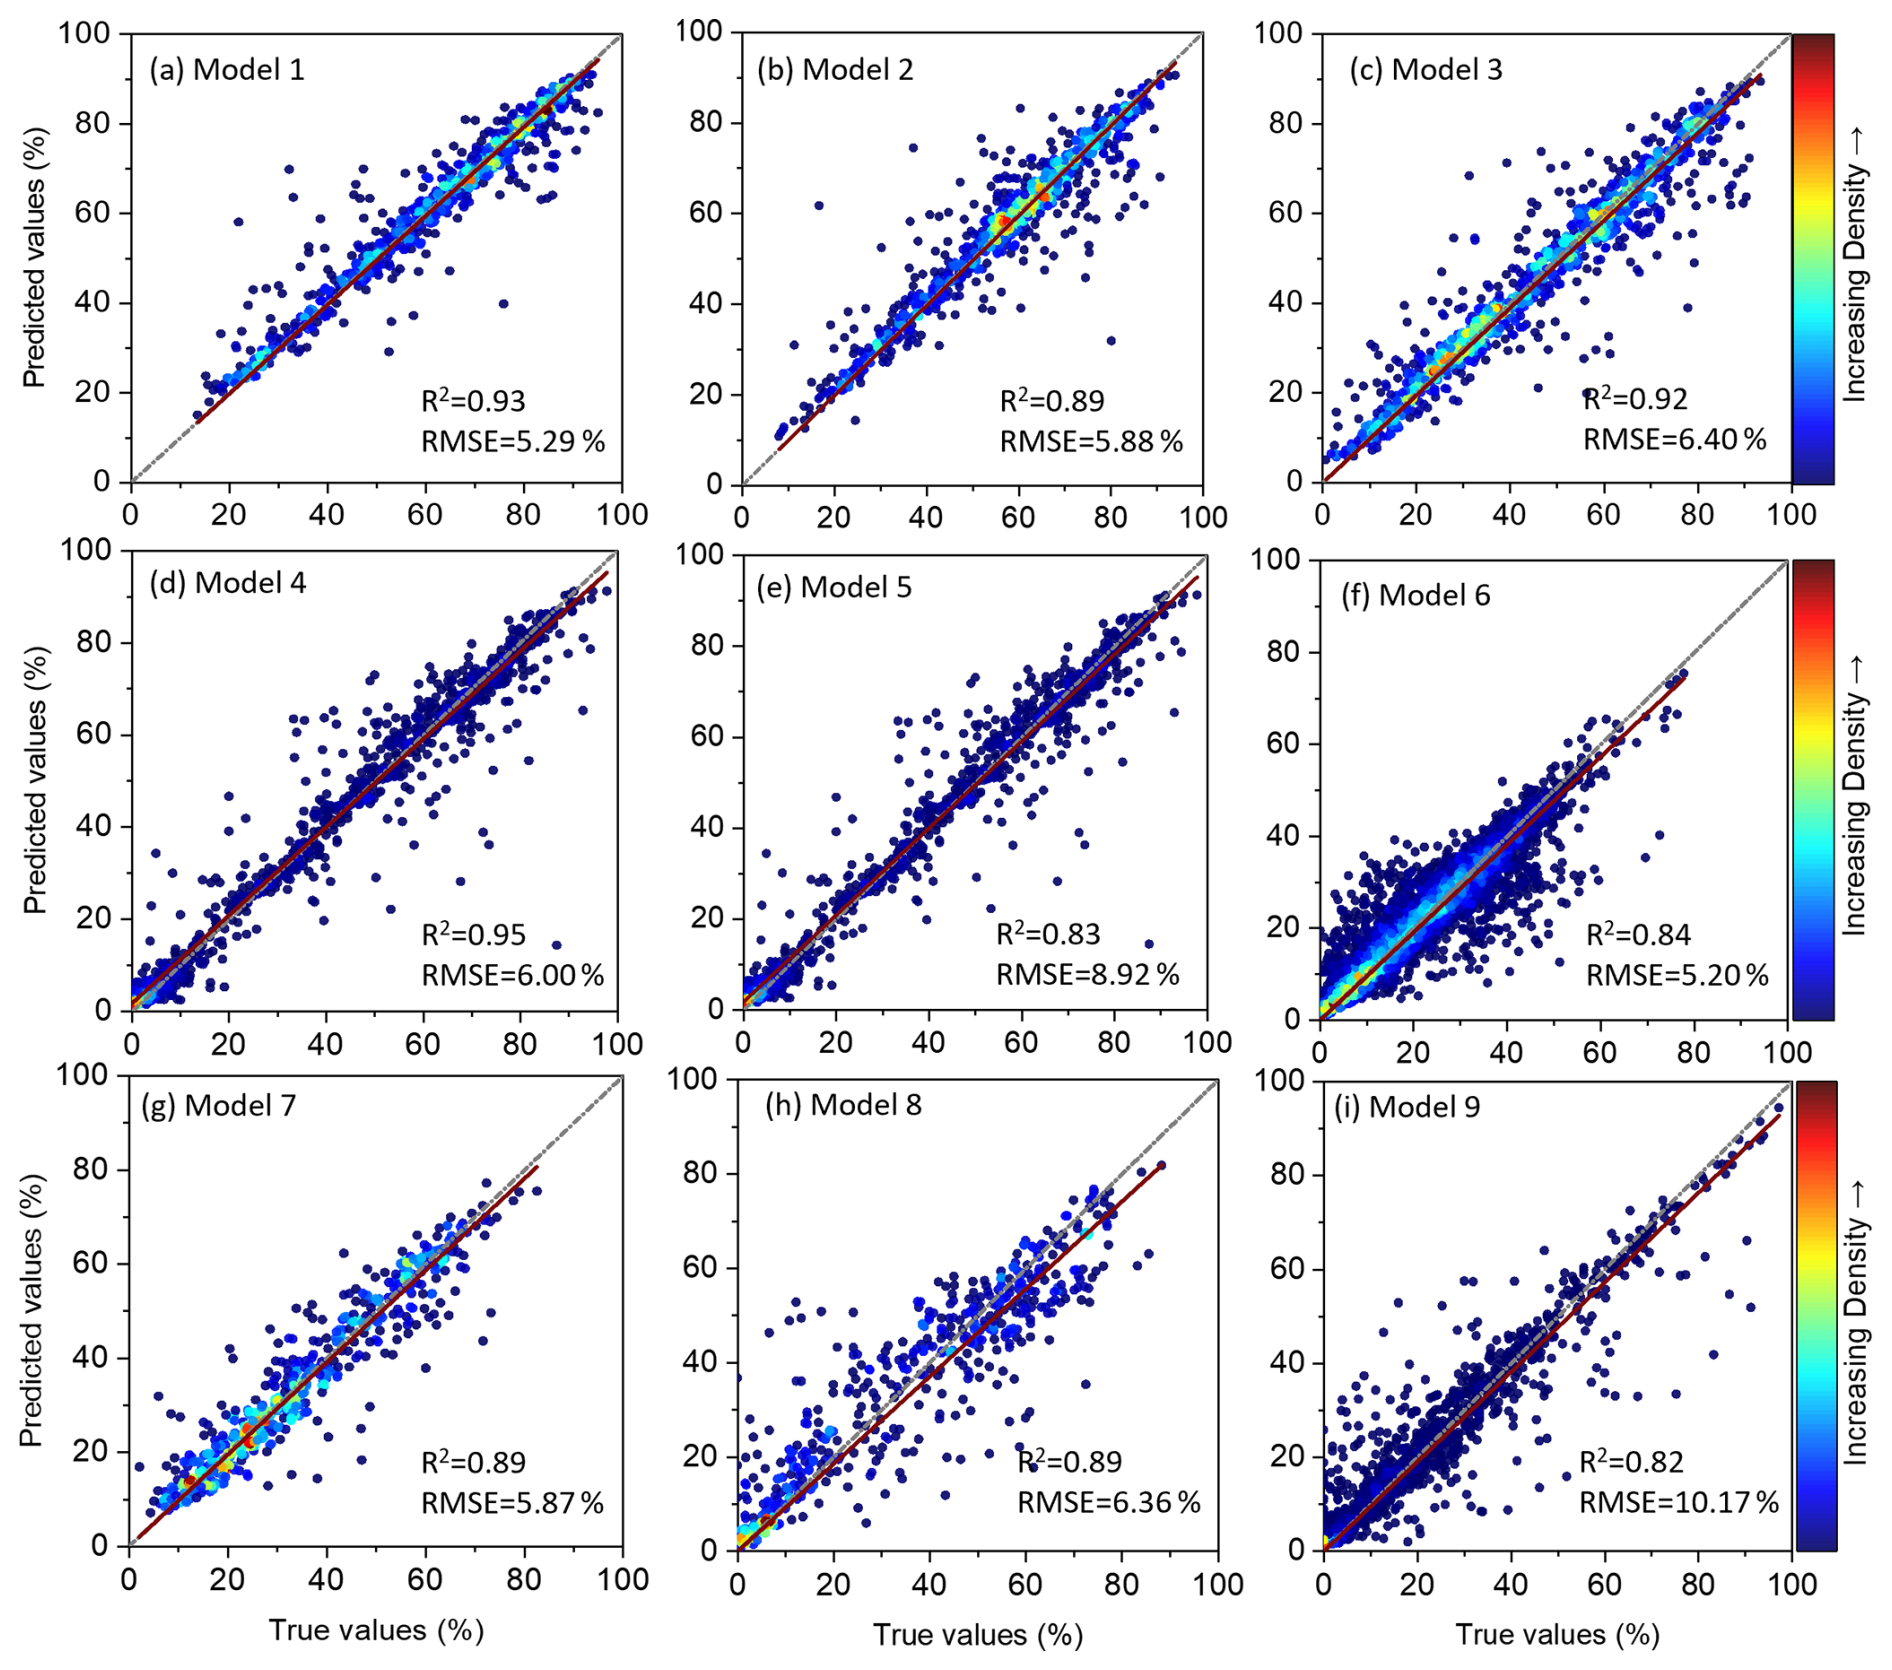
Figure 3Model performances across different geographical regions and income groups. The true values represent the slum indicator calculated from DHS data using our slum framework, while the predicted values are produced by our machine learning-based models. For each model, a linear regression line is displayed alongside a reference line with a slope of one for comparison.

Figure 4 presents the out-of-country predictive performance of the regionally stratified models evaluated using country-group holdout cross-validation. Across holdout folds, R2 values range from 0.45 to 0.91, with a median of 0.85, while RMSE values range from 4.52 % to 12.96 %, with a median of 6.89 %. Predictive performance is generally strongest for the African regional models, where several held-out-country tests yield R2 values above 0.85. By contrast, transferability is weaker in several Latin American holdout cases, where R2 values are closer to 0.50. Full validation results are provided in Table S5. Overall, these results indicate that the modelling framework can generalize to countries not used during model fitting, although predictive accuracy varies across regional contexts. The performance is broadly comparable with, and in some cases higher than, benchmarks reported in previous satellite-based socioeconomic prediction studies.
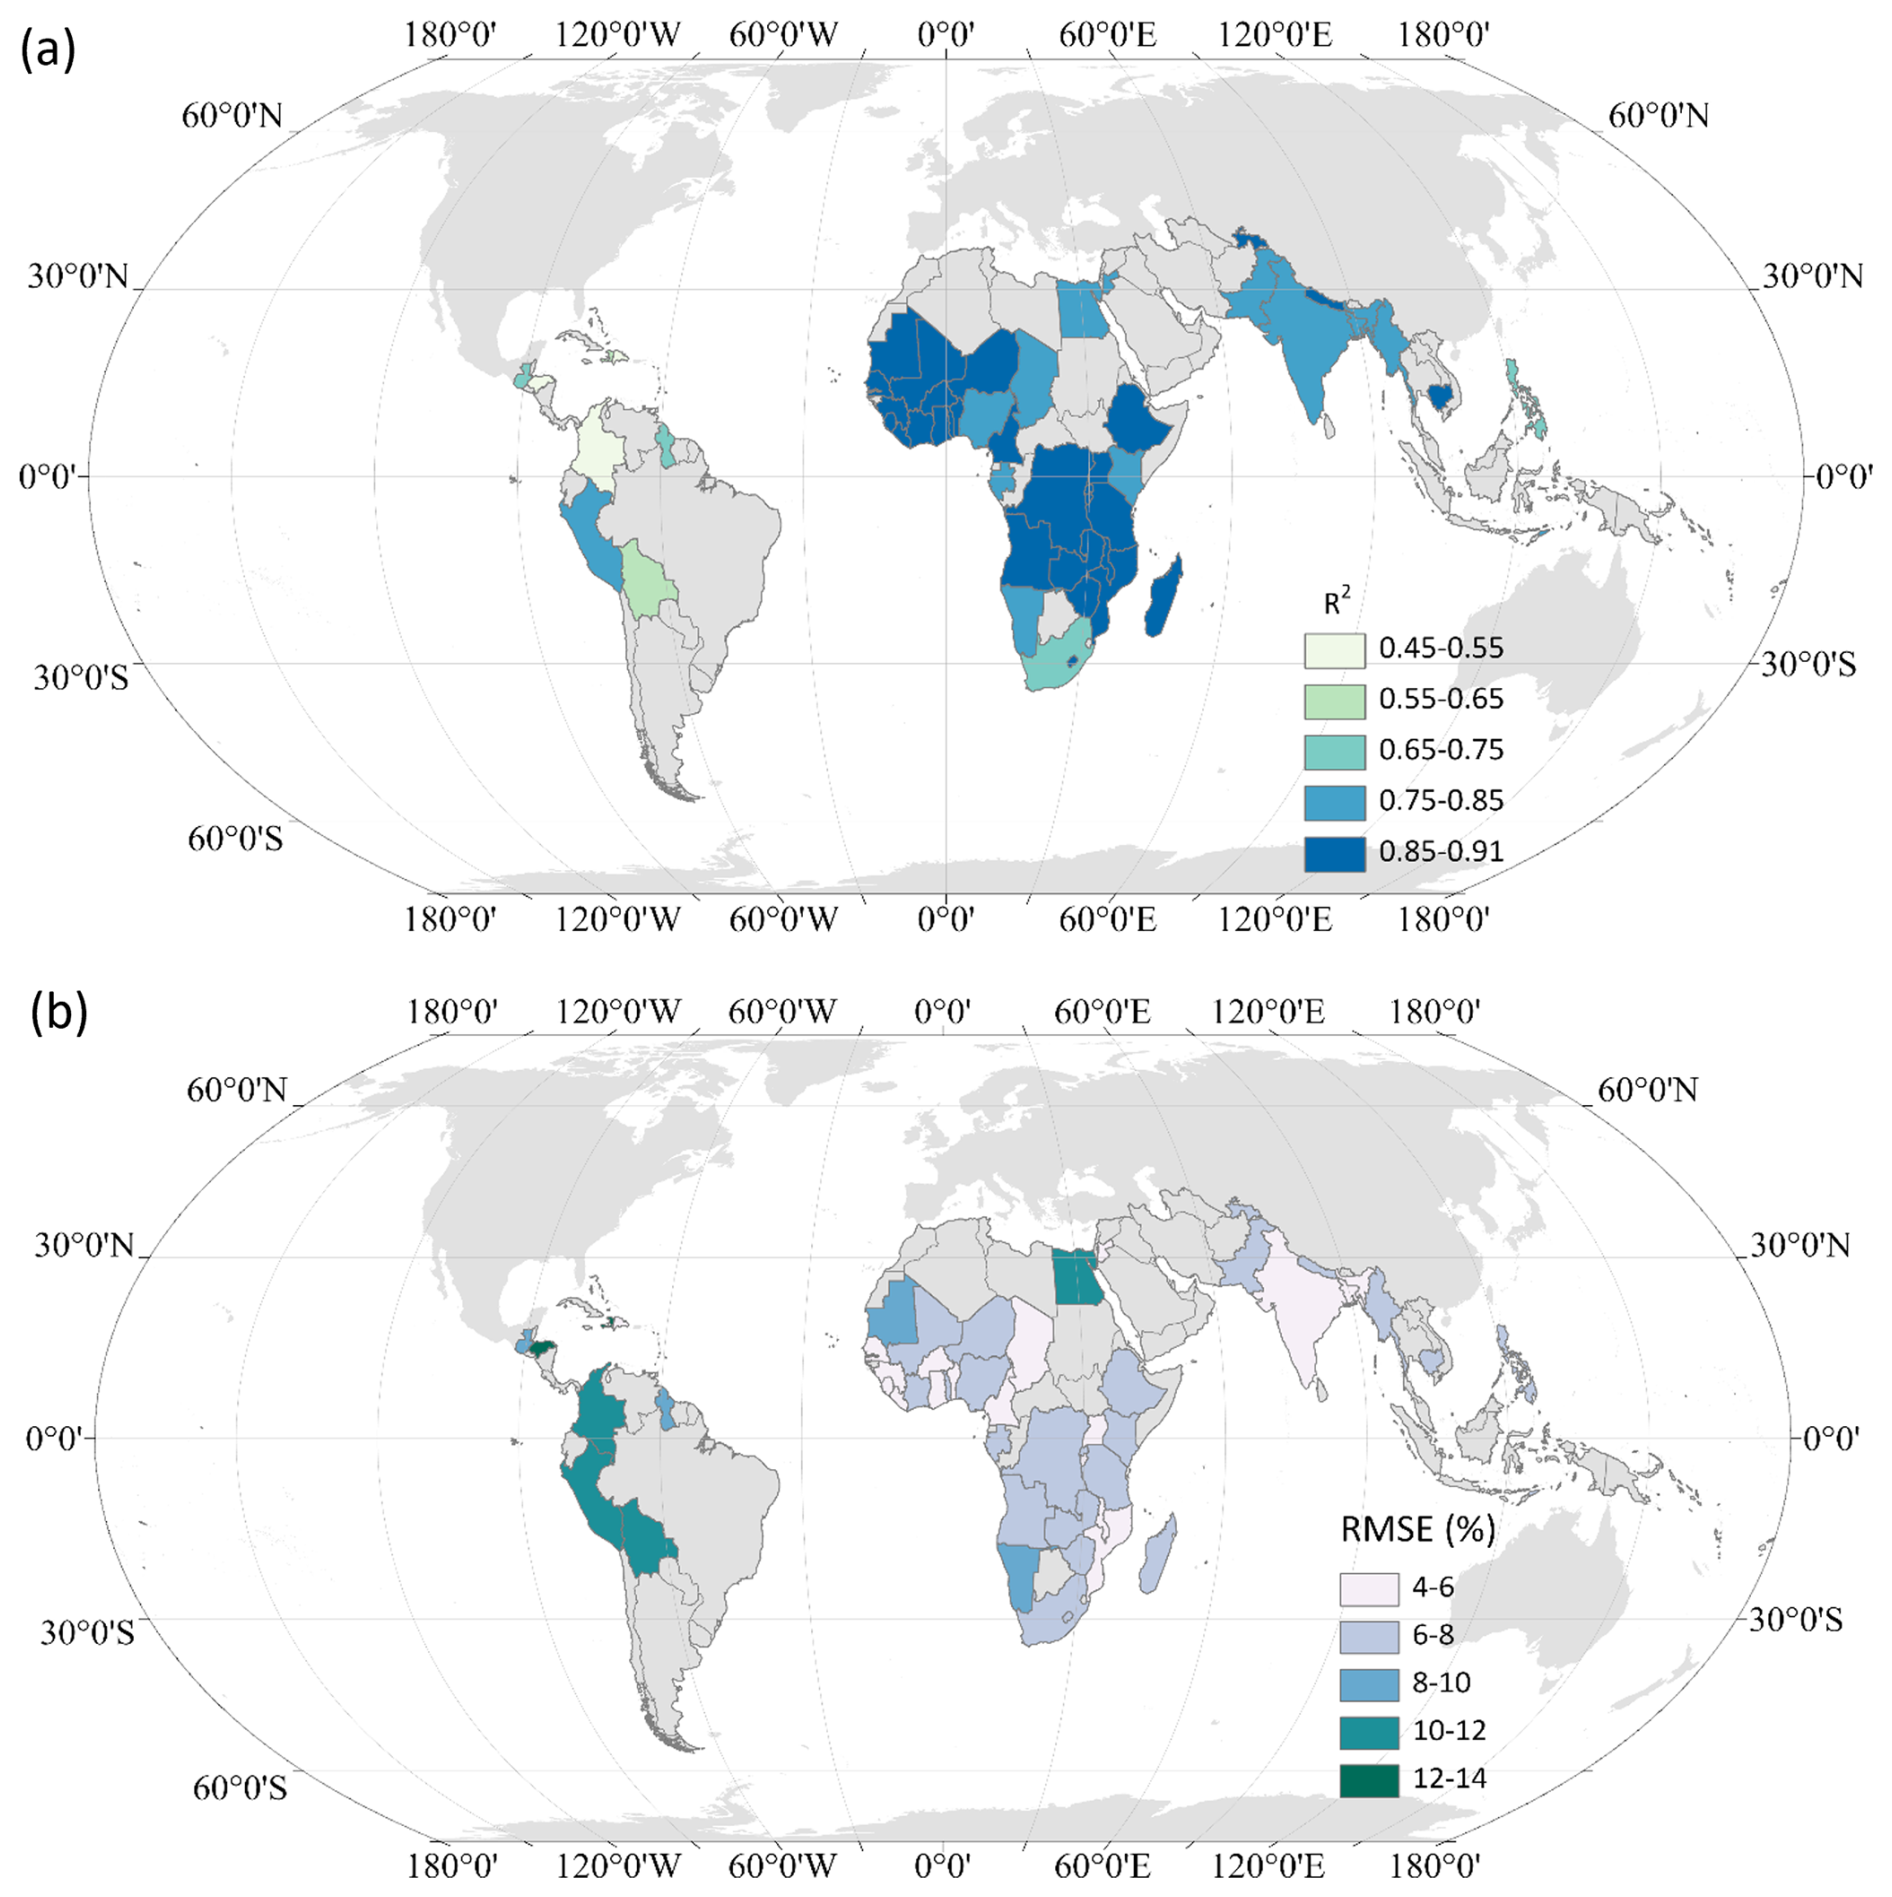
Figure 4Predictive performance of regionally stratified models under country-group holdout cross-validation. For regions with sufficient country coverage, approximately 20 % of countries were held out in each fold; for regions with fewer than five countries, leave-one-country-out cross-validation was used. Performance was measured by (a) the coefficient of determination (R2) and (b) root mean squared error (RMSE). In each validation fold, all observations from the held-out country or countries were excluded from model training, validation, and hyperparameter tuning, and were used only for testing.
4.2 Spatially explicit estimates of slum population in Global South
We apply the proposed framework to map slum population in 2018 across 129 Global South countries, including 54 in Africa, 42 in Asia and 33 in Latin America, using a spatial resolution of 6.72 km at the equator. The map is based on 6.72 km grid cells intersecting built-up areas with populations exceeding 1000, in alignment with the urban-rural delineations provided by the Global Human Settlement Layer.
Figure 5a shows the spatial distribution of slum population across Global South countries. In terms of absolute numbers, slum population is concentrated in areas with expected high population densities, such as northern India in Asia, Rwanda and northern Morocco in Africa, and the coastal regions of Rio De Janeiro in Latin America, highlighted in dark blue on the map. Notably, more than 50 % of the total slum population resides in less than 8 % of the total grid cells.
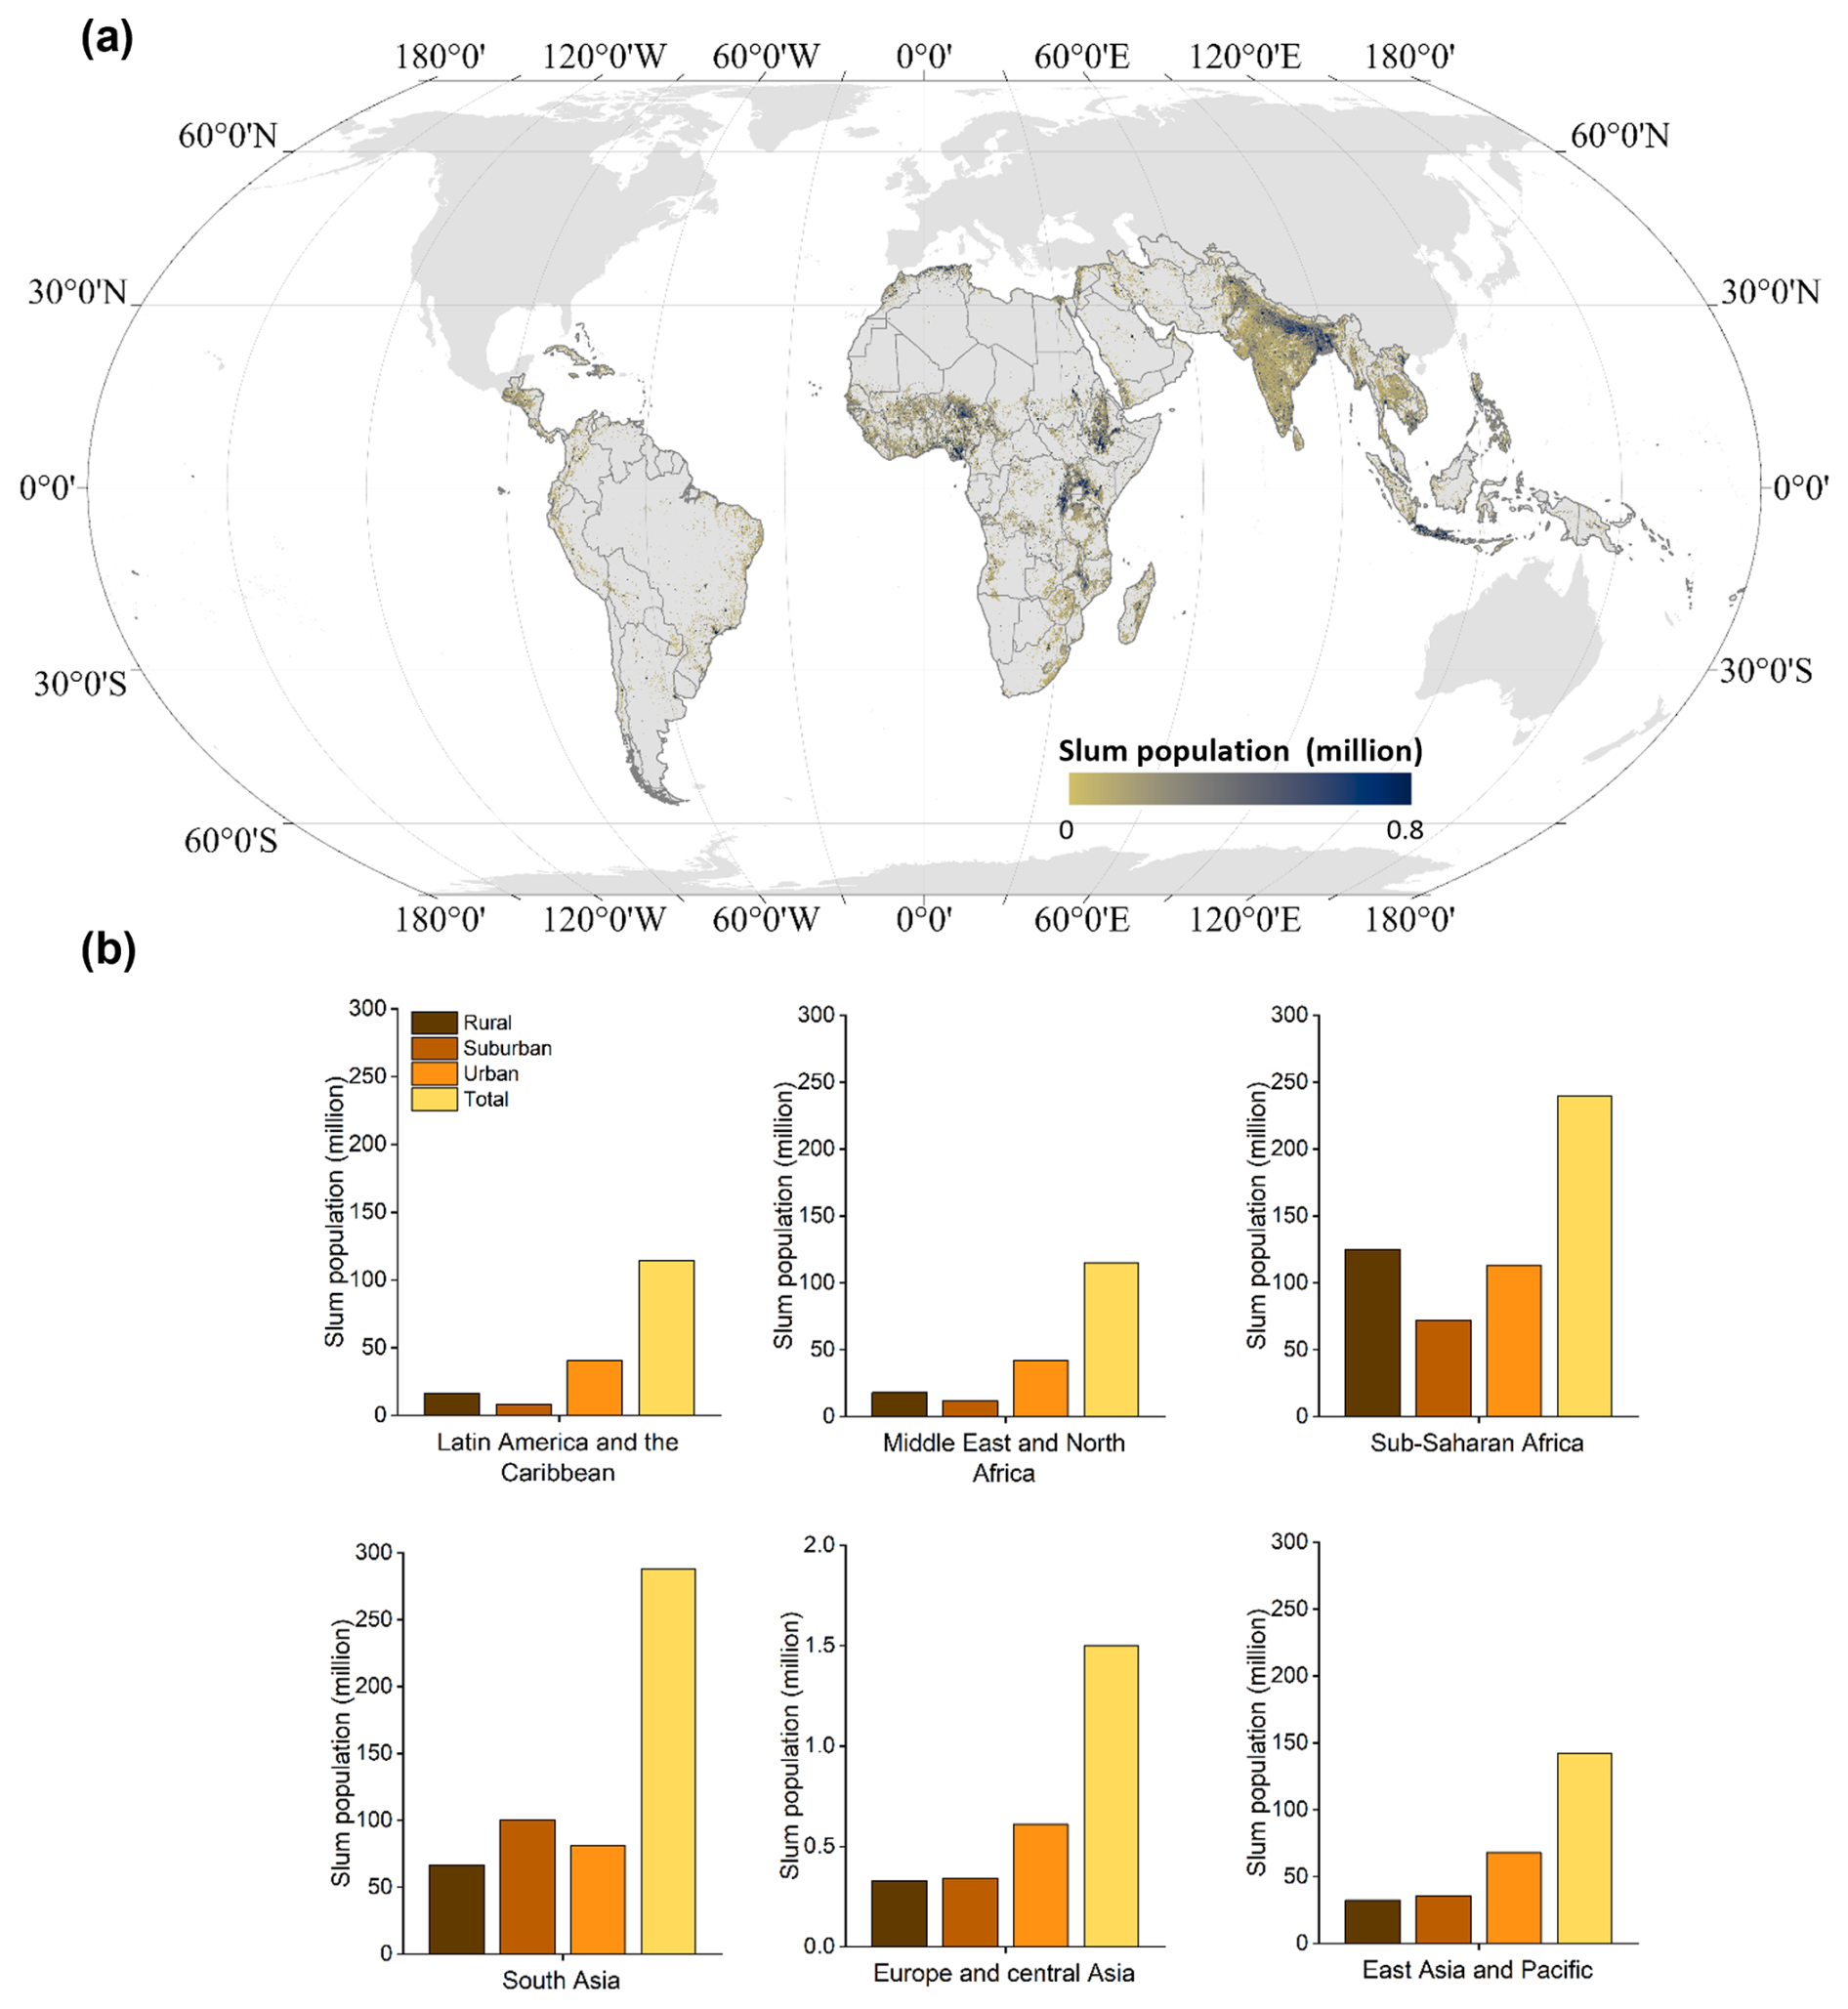
Figure 5Spatial distribution of slum population in the Global South and their geographic disparities. (a) Map of slum population with a resolution of 6.72 km. The digital version relies on color gradients; hatching or other pattern overlays are not used. Darker blue indicates a higher absolute slum population. The grid cells with a population of less than 1000 are not included. (b) Statistics of slum population across geographic regions and disparities between rural and urban areas.
Figure 5b highlights the administrative statistics and geographic disparities in slum population distribution. At the regional level, we estimate a total of over 0.80 billion people living in slums across the Global South. More than 60 % of this population resides in South Asia and Sub-Saharan Africa, followed by East Asia and the Pacific (16.3 %), the Middle East and North Africa (8.6 %), Latin America and the Caribbean (7.8 %), and Europe and Central Asia (0.15 %).
When comparing urban slum populations to those living in slum-like conditions in rural areas, distinct urban-rural differences in settlement patterns emerge. In Latin America and the Caribbean, the Middle East and North Africa, Europe and Central Asia, and East Asia and the Pacific, a higher proportion of the slum population – between 50 % and 60 % – is concentrated in urban areas. In contrast, 41 % of the slum population in South Asia is located in suburban areas, while 40 % of those in Sub-Saharan Africa live in rural regions with slum-like conditions and inadequate services.
4.3 Mapping of local shares of slum population in Global South
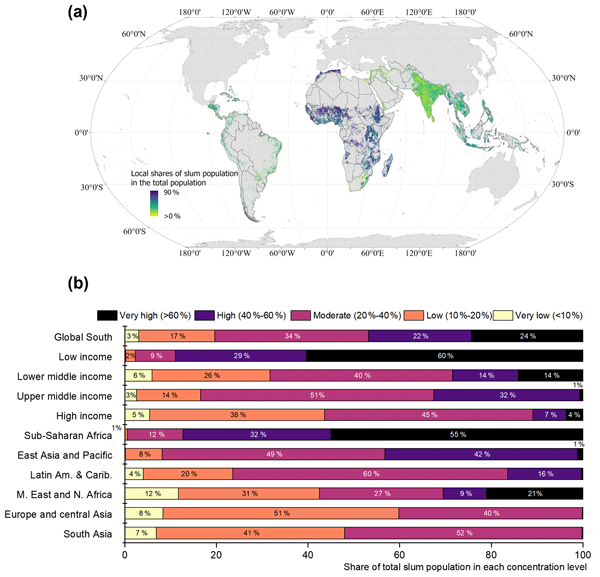
As shown in Fig. 6a, the spatial distribution of local shares provides new insights into the settlement pattern of slum population. For example, Sub-Saharan Africa exhibits notably high local shares of slum population, with 57 % of the local population living in slum conditions. Within this region, countries like Libya and Nigeria show even higher local shares, reaching 70 %. Comparatively, Latin America and the Caribbean, South Asia, and East Asia have local slum population shares of 28 %, 21 % and 39 %, respectively. Even in smaller countries such as Sierra Leone, the proportion of the population living in slums remains significant, at 60 %.
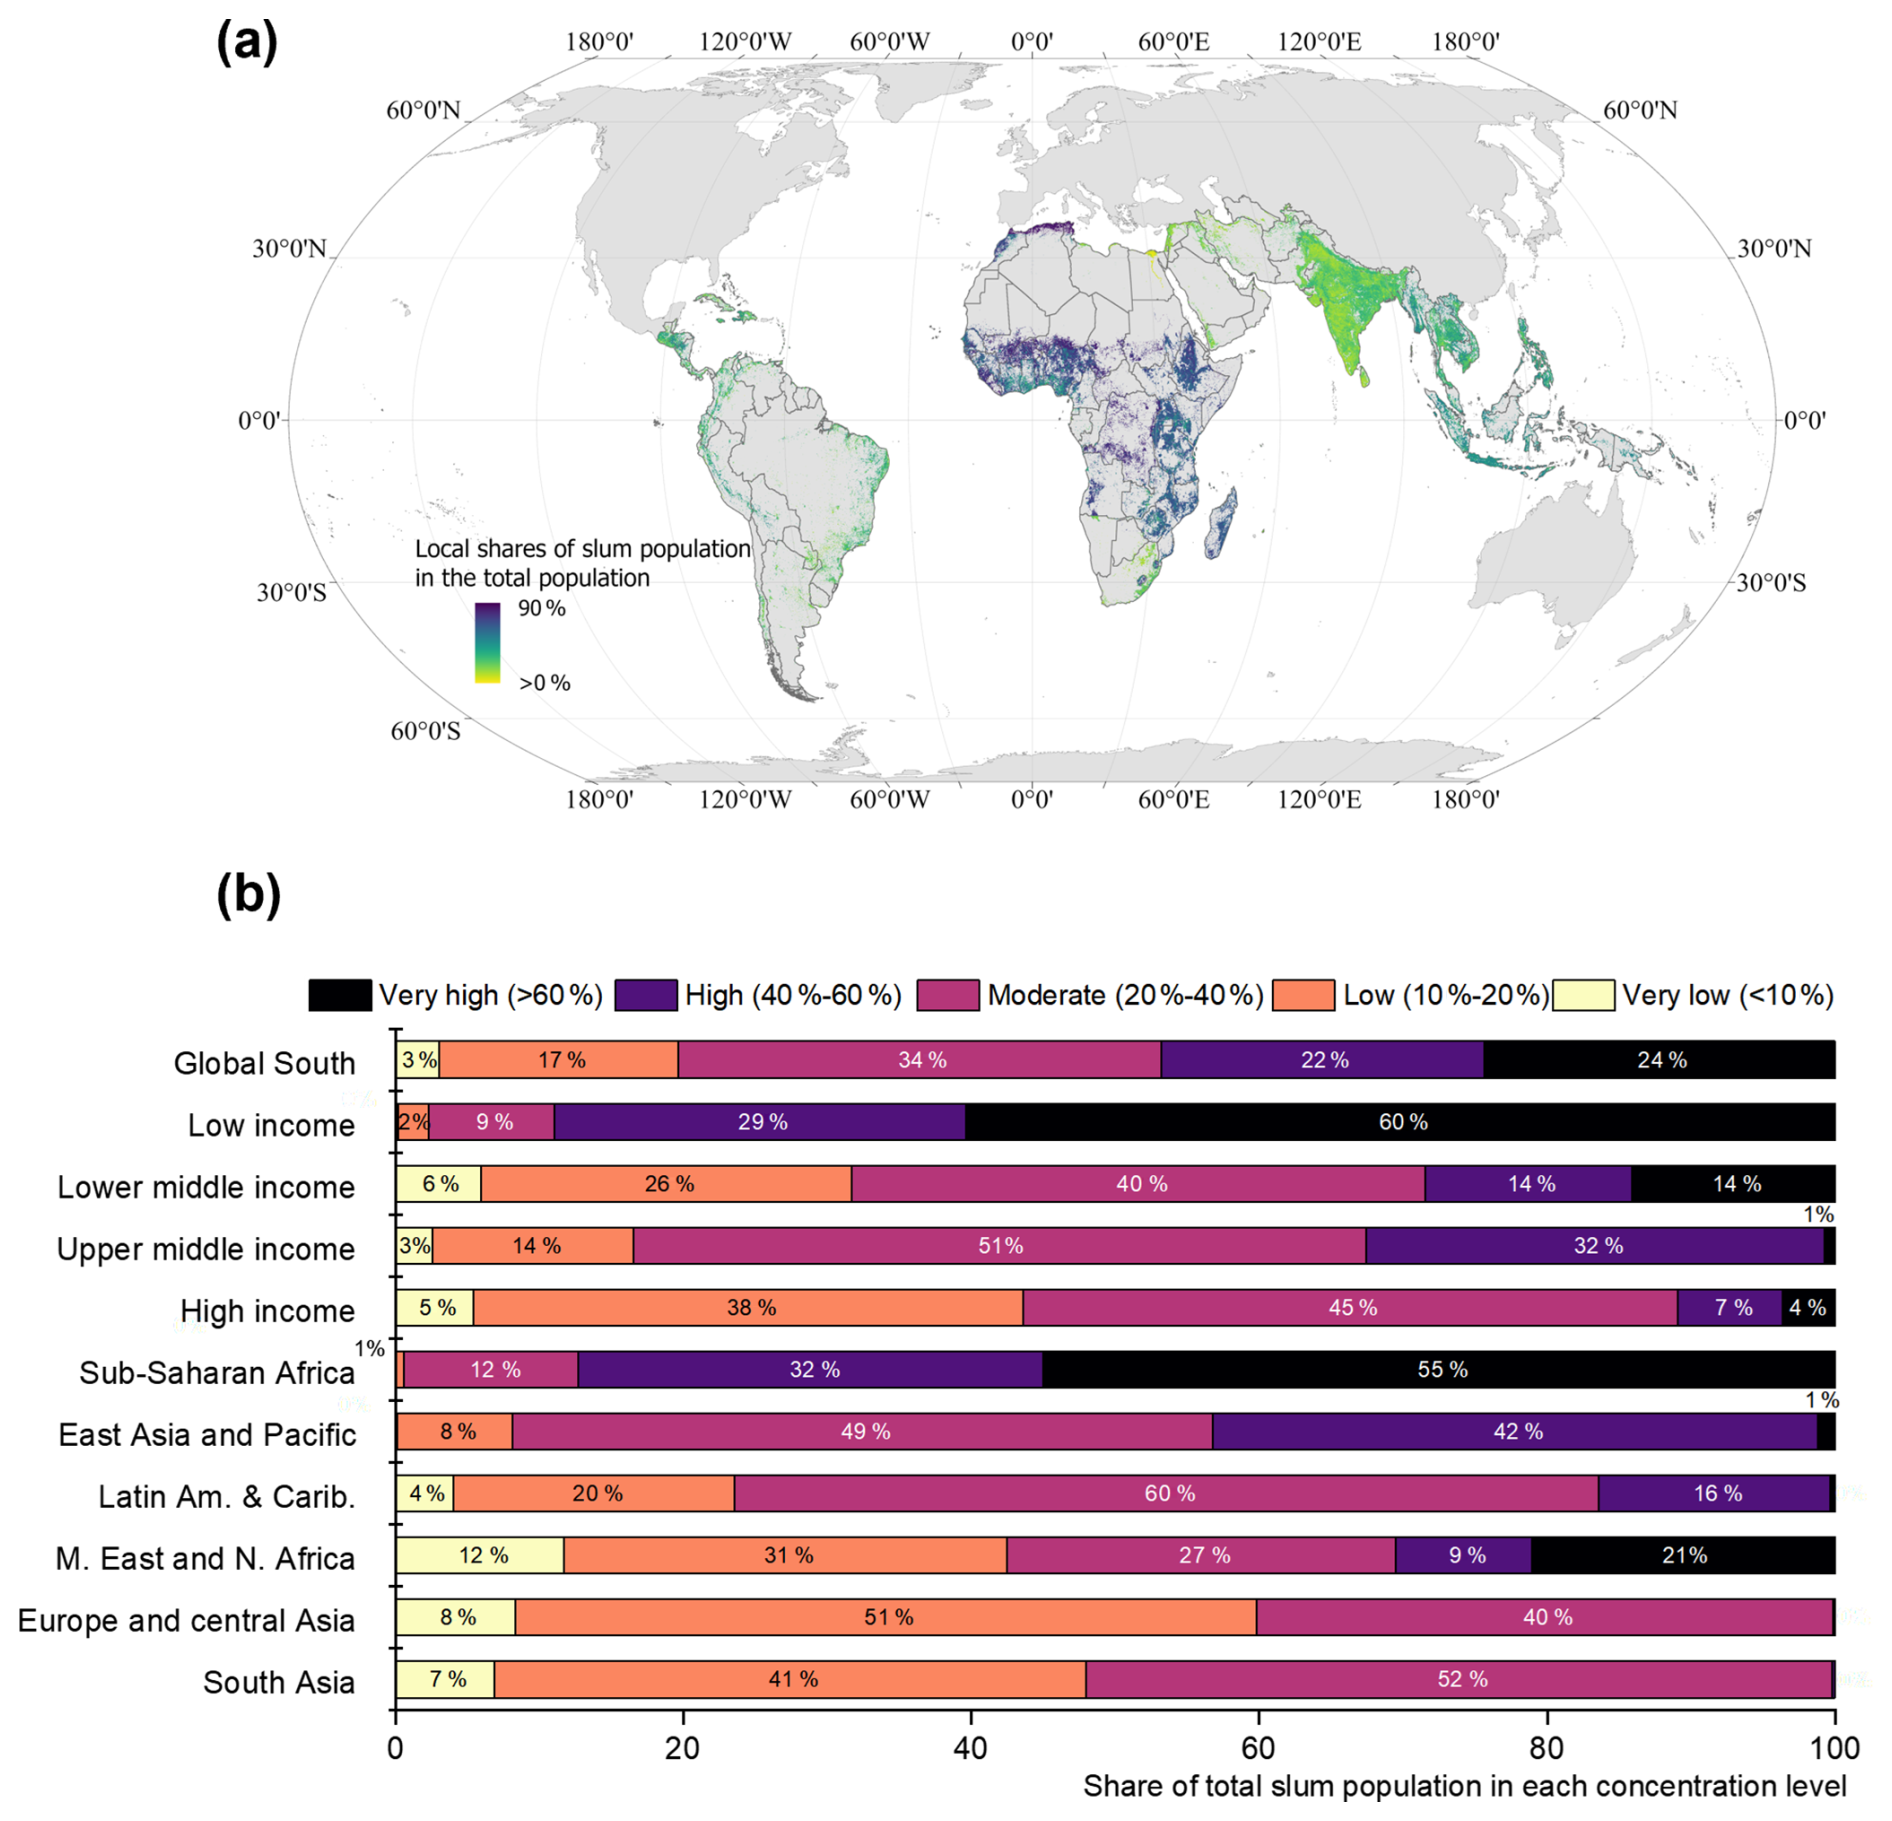
Figure 6Slum populations categorized by concentration levels, ranging from very low to very high, and their geographic and socioeconomic disparities. (a) Map displaying local shares of the slum population at a resolution of 6.72 km. The digital version relies on color gradients; hatching or other pattern overlays are not used. Darker blue indicates a higher local share of the slum population. (b) Statistical analysis of disparities in slum population concentration across different regional and income groups. Concentration levels are classified based on the proportion of the slum population within each grid cell: very low (less than 10 %), low (10 %–20 %), moderate (20 %–40 %), high (40 %–60 %) and very high (over 60 %).
We also analyze the concentration levels of slum populations, from very low to very high, across income groups and regional groups (Fig. 6b). Across the Global South, about 24 % of the slum population resides in very highly concentrated slum areas. In low-income countries, 60 % of the slum population lives in areas with very high concentration levels. In contrast, slum populations in high-income countries are less concentrated, with 45 % living in moderately concentrated areas. From a geographic perspective, Sub-Saharan Africa has the highest concentration, with 55 % of the slum population living in very highly concentrated areas. In other regions, slum populations are mainly concentrated at low or moderate levels. Figure 7 shows visual comparisons between estimated slum population distribution and conditions observed in Google Earth imagery for four representative cities in Global South. The resulting maps show consistent spatial correspondence between areas with high estimated slum populations and known locations of dense slums areas or informal settlements, supporting the reliability of our mapping results.

Figure 7Showcases of visual comparisons between estimated slum population distribution and conditions observed in Google Earth imagery for four representative Global South Cities: (a) Nairobi, Kenya, (b) Cape Town, South Africa, (c) Medellín, Colombia, and (d) Dhaka, Bangladesh. Estimated population counts are shown as circular markers overlaid on Landsat basemaps, with each marker representing a 6.72 km × 6.72 km grid cell. Red arrows indicate locations where high estimated slum populations align with visible informal settlements in Google Earth, providing visual validation of the product. Map data © 2026 Google.
Table 5Regional model performance using only RGB image bands. ΔR2 and ΔRMSE are the differences in model performance between the 7-band models and the RGB-only models.

4.4 Robustness of our regional models
Table 5 reports the performance of nine regional models trained exclusively on RGB image bands. Across all regions, the RGB-only models consistently underperform relative to the 7-band models used in our main approach. On average, RGB-only models exhibit a 6.81-unit higher RMSE and a 0.34 lower R2, indicating both reduced predictive accuracy and weaker model fit. The performance gap is particularly pronounced in regions such as West Africa and East Asia. These findings illustrate the limitations of relying solely on visible spectrum data for capturing slum-related features and underscore the value of incorporating additional spectral channels such as near-infrared and shortwave infrared to improve model robustness and predictive power.
Figure 8a and b illustrates the percentage change in the country-level slum population estimates by comparing the equal weight scenario with two alternative weighting schemes (Sect. 3.6). We observe that, in both the basic services and UN-Habitat weight scenarios, the percentage change in slum population estimates for most countries in Africa and South Asia, and Brazil in Latin America remains within ±5 %. However, in Southeast Asia and other Latin American countries, the percentage change varies from 5 % to 10 % under the basic service scenario and from −5 % to −10 % under the UN-Habitat scenario. This suggests that the basic services scenario tends to overestimate slum populations, while the UN-Habitat scenario tends to underestimate them. This means that the equal-weight scenario offers a balanced approach, avoiding the overestimations and underestimations observed in other scenarios. The three maps of slum population distribution under these three weight scenarios are provided in Fig. S4.
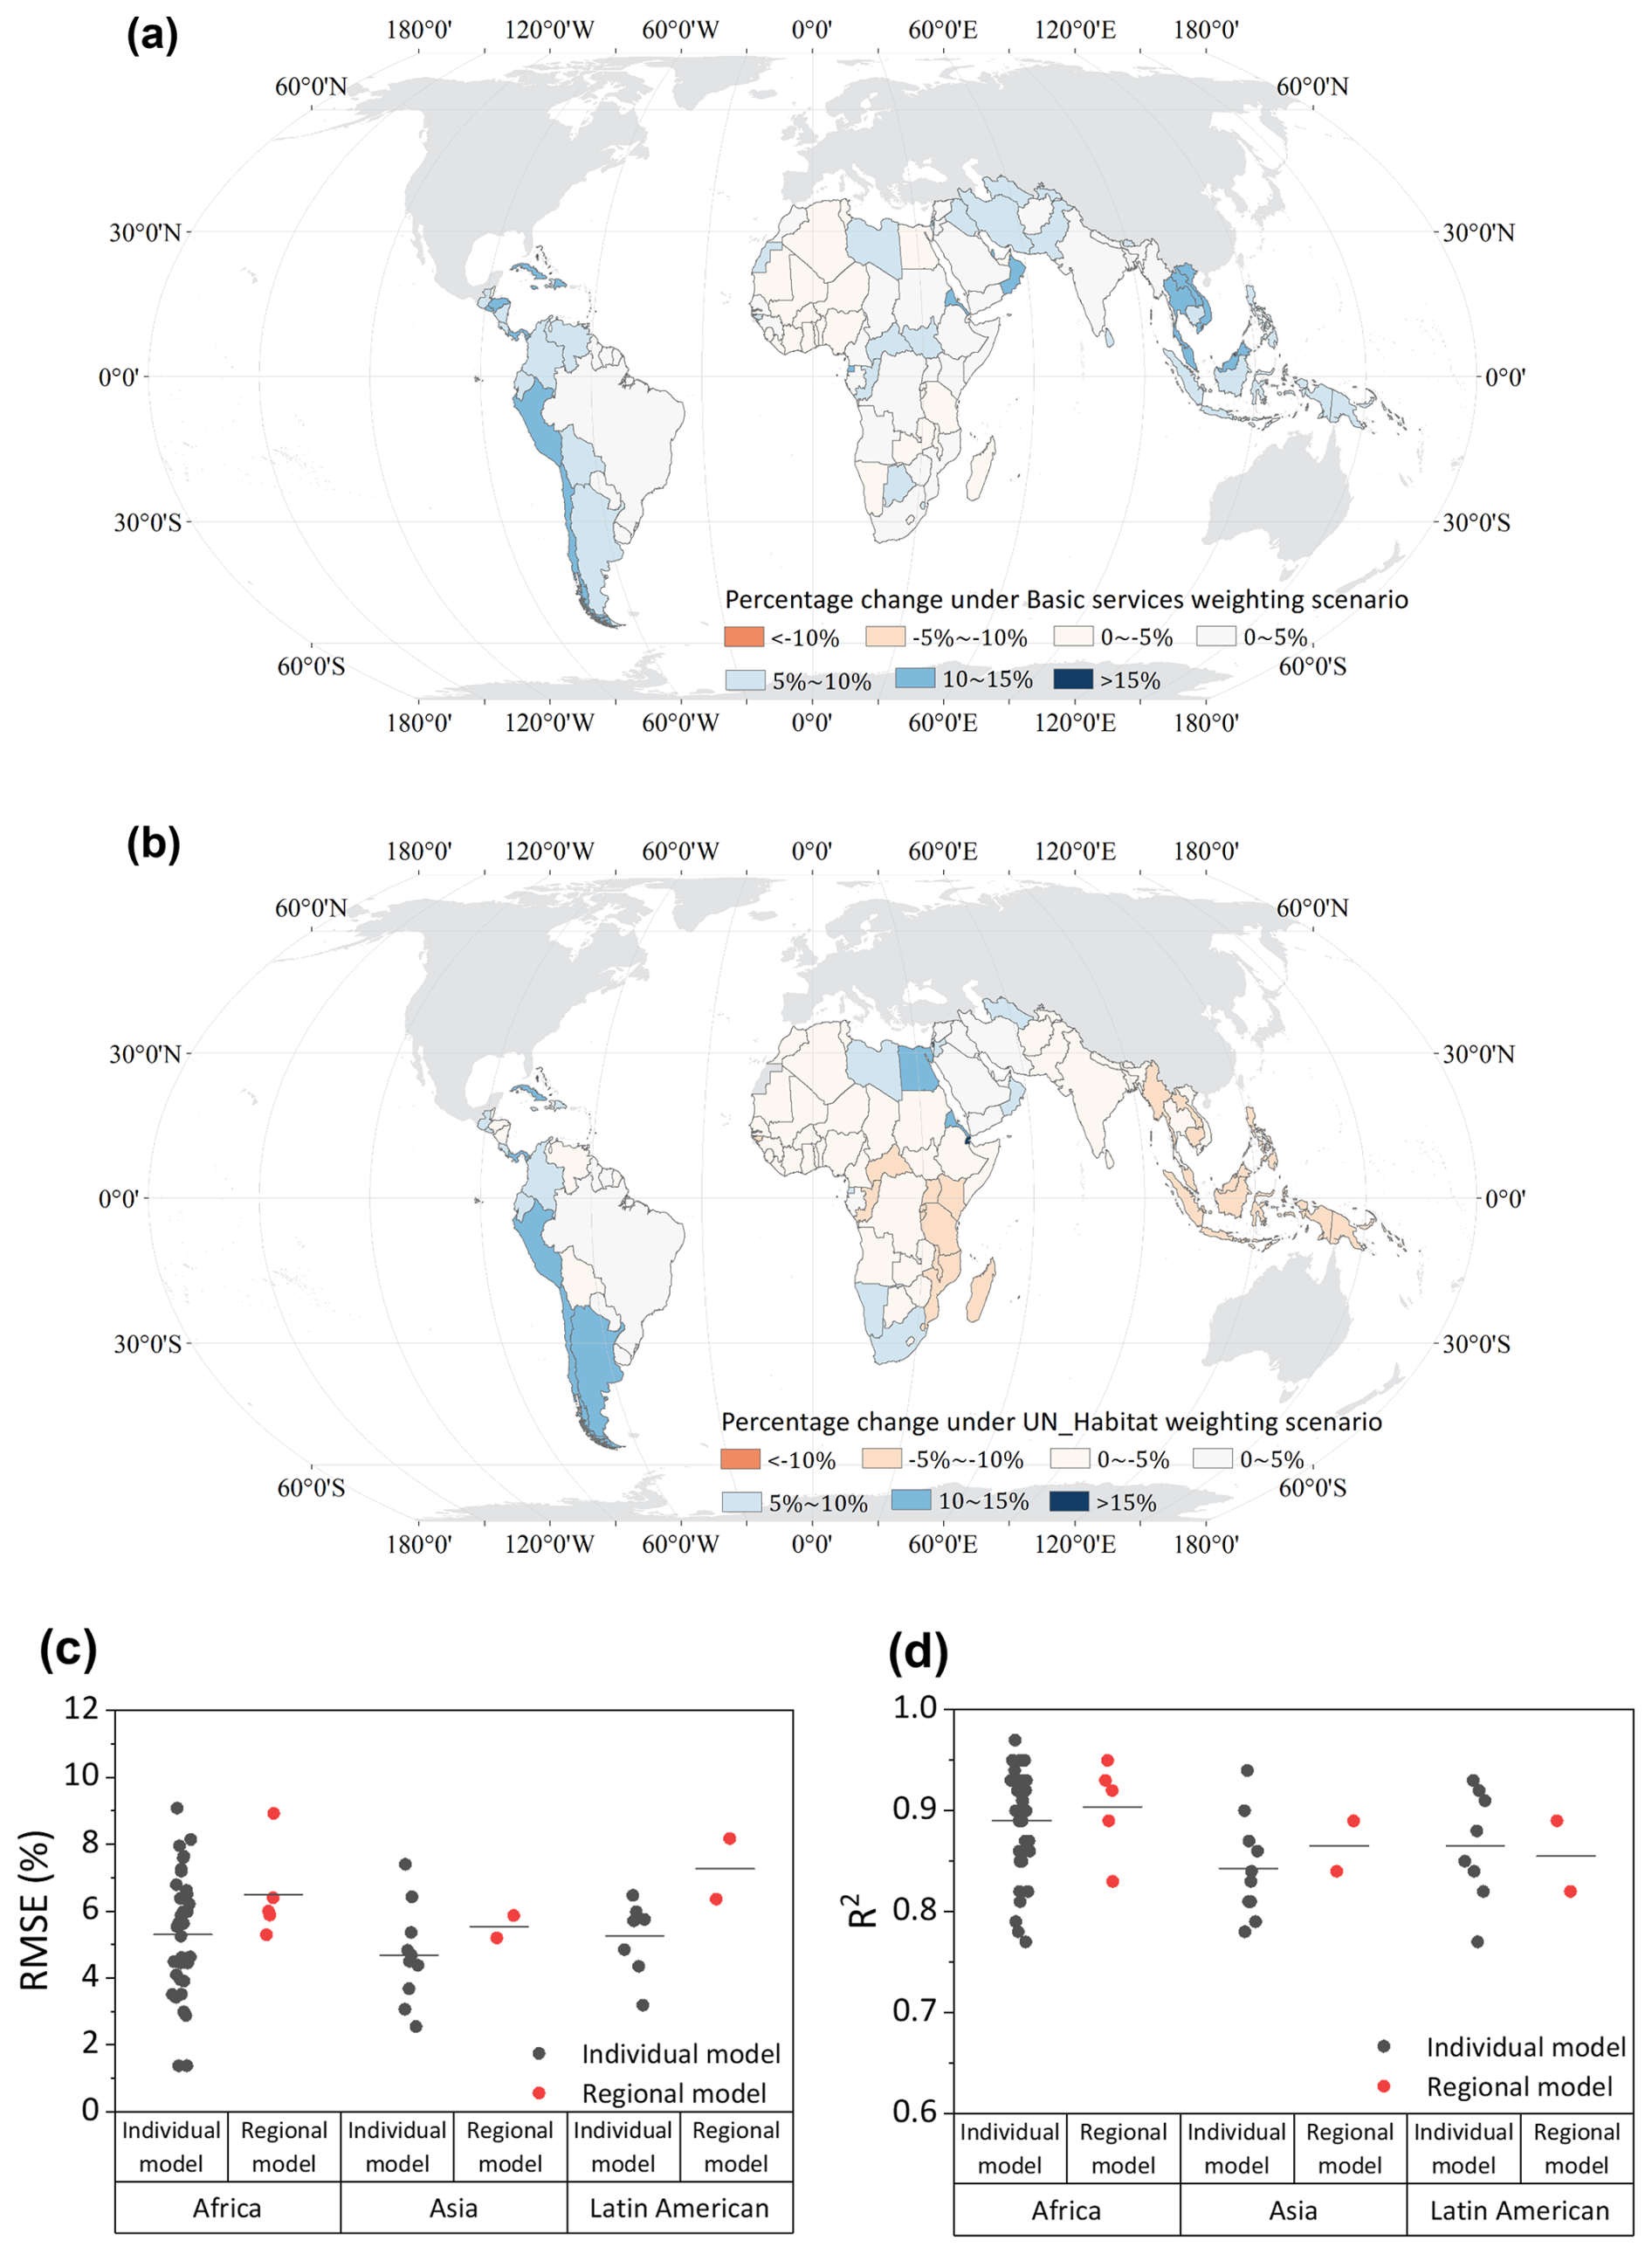
Figure 8Differences in slum population estimates across two alternative weighting schemes and comparison of model performance between regional models and country-specific models. Panels (a) and (b) show the percentage change in slum population estimates under the Basic Services scenario and the UN-Habitat scenario, respectively. Panels (c) and (d) compare model performance between regional and country-specific individual models using RMSE and R2 metrics, respectively.
Figure 8c and d compares the performance of regional models with individual country-specific models. The full list of individual model performance can be found in Table S6. While the regional models show slightly lower performance in terms of RMSE and R2 compared to single-country models, the differences are minimal and within a comparable range. This indicates that our regional models achieve both high accuracy and strong generalization ability.
To quantify the potential influence of the equal-household-size assumption, we conducted a sensitivity analysis using alternative household-size scenarios. Specifically, we assumed that slum households were, on average, either 10 % larger or 10 % smaller than non-slum households and recalculated the resulting national slum-population estimates. The results show that assuming a ±10 % difference in slum household size changes the national slum population estimates by about 8 %. Detailed results are shown in Fig. S5.
4.5 Comparison of results with statistical data
We compare our slum population estimates with previous estimates from the literature, which are derived by scaling population counts at individual slum level as well as from city-scale slum population statistics, as summarized in Table 6 (Butera et al., 2019; Byuro, 2015; Davis, 2013; Guilmoto and Rajan, 2013; Medeiros et al., 2012; Patel et al., 2019; Sabry, 2009; Taubenböck and Wurm, 2015). Figure 9a shows our estimates, indicated by an asterisk (*), fall within the range of these scaled slum population estimates. Moreover, when compared to city-scale slum population statistics, our results show strong alignment, particularly in Hyderabad, Johannesburg and São Paulo (Trindade et al., 2021) (Fig. 9b). However, for some cities, such as Dhaka, our results appear to be overestimated. Figure 9c and d presents a comparison of the relative shares of urban slum populations with the World Bank Group (2018) and UN-Habitat (2021) statistics. The results show a strong correlation at the national scale (R2>0.95) and good agreement at the regional scale, with an average RMSE of 14 % at the national level.
Table 6Comparison of model-derived slum population estimates with scaled-up figures from sampled slums and published city-level statistics, circa 2015.
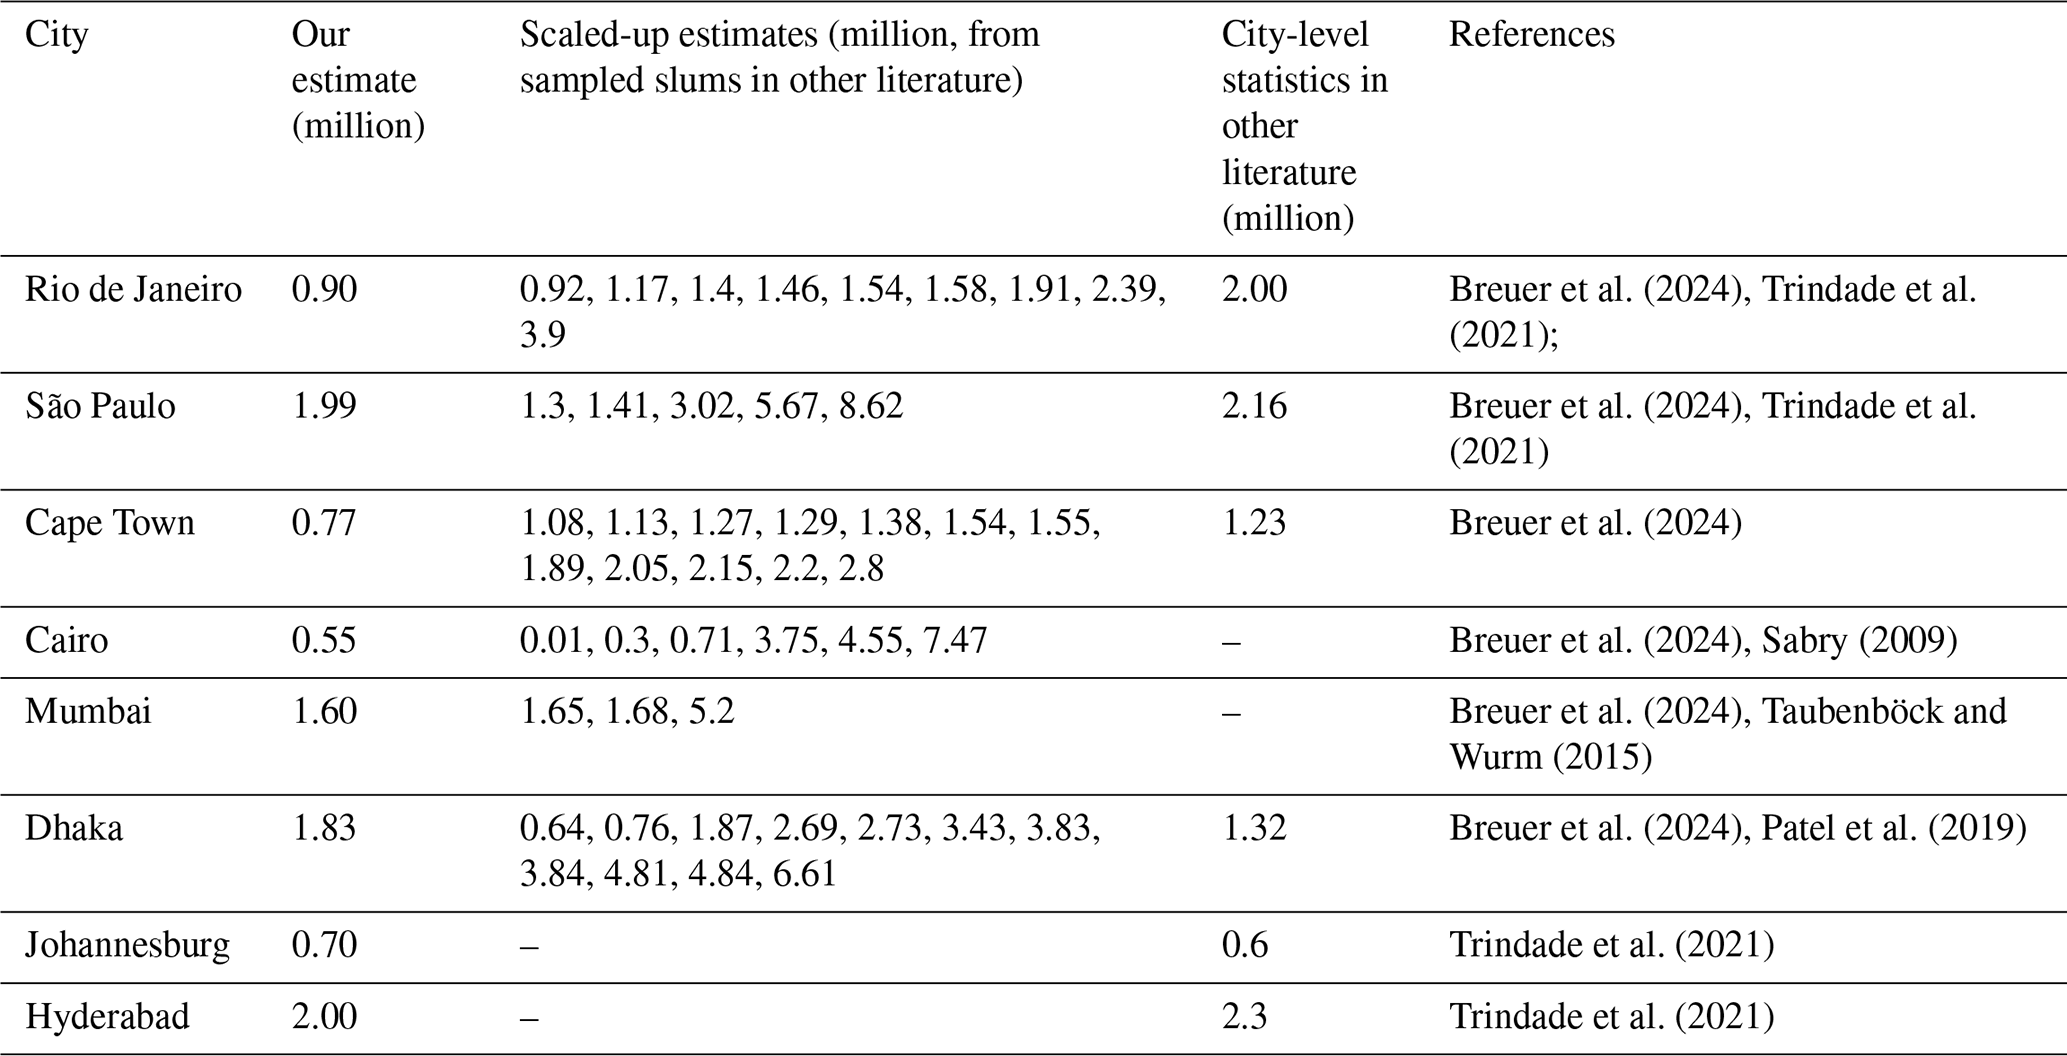
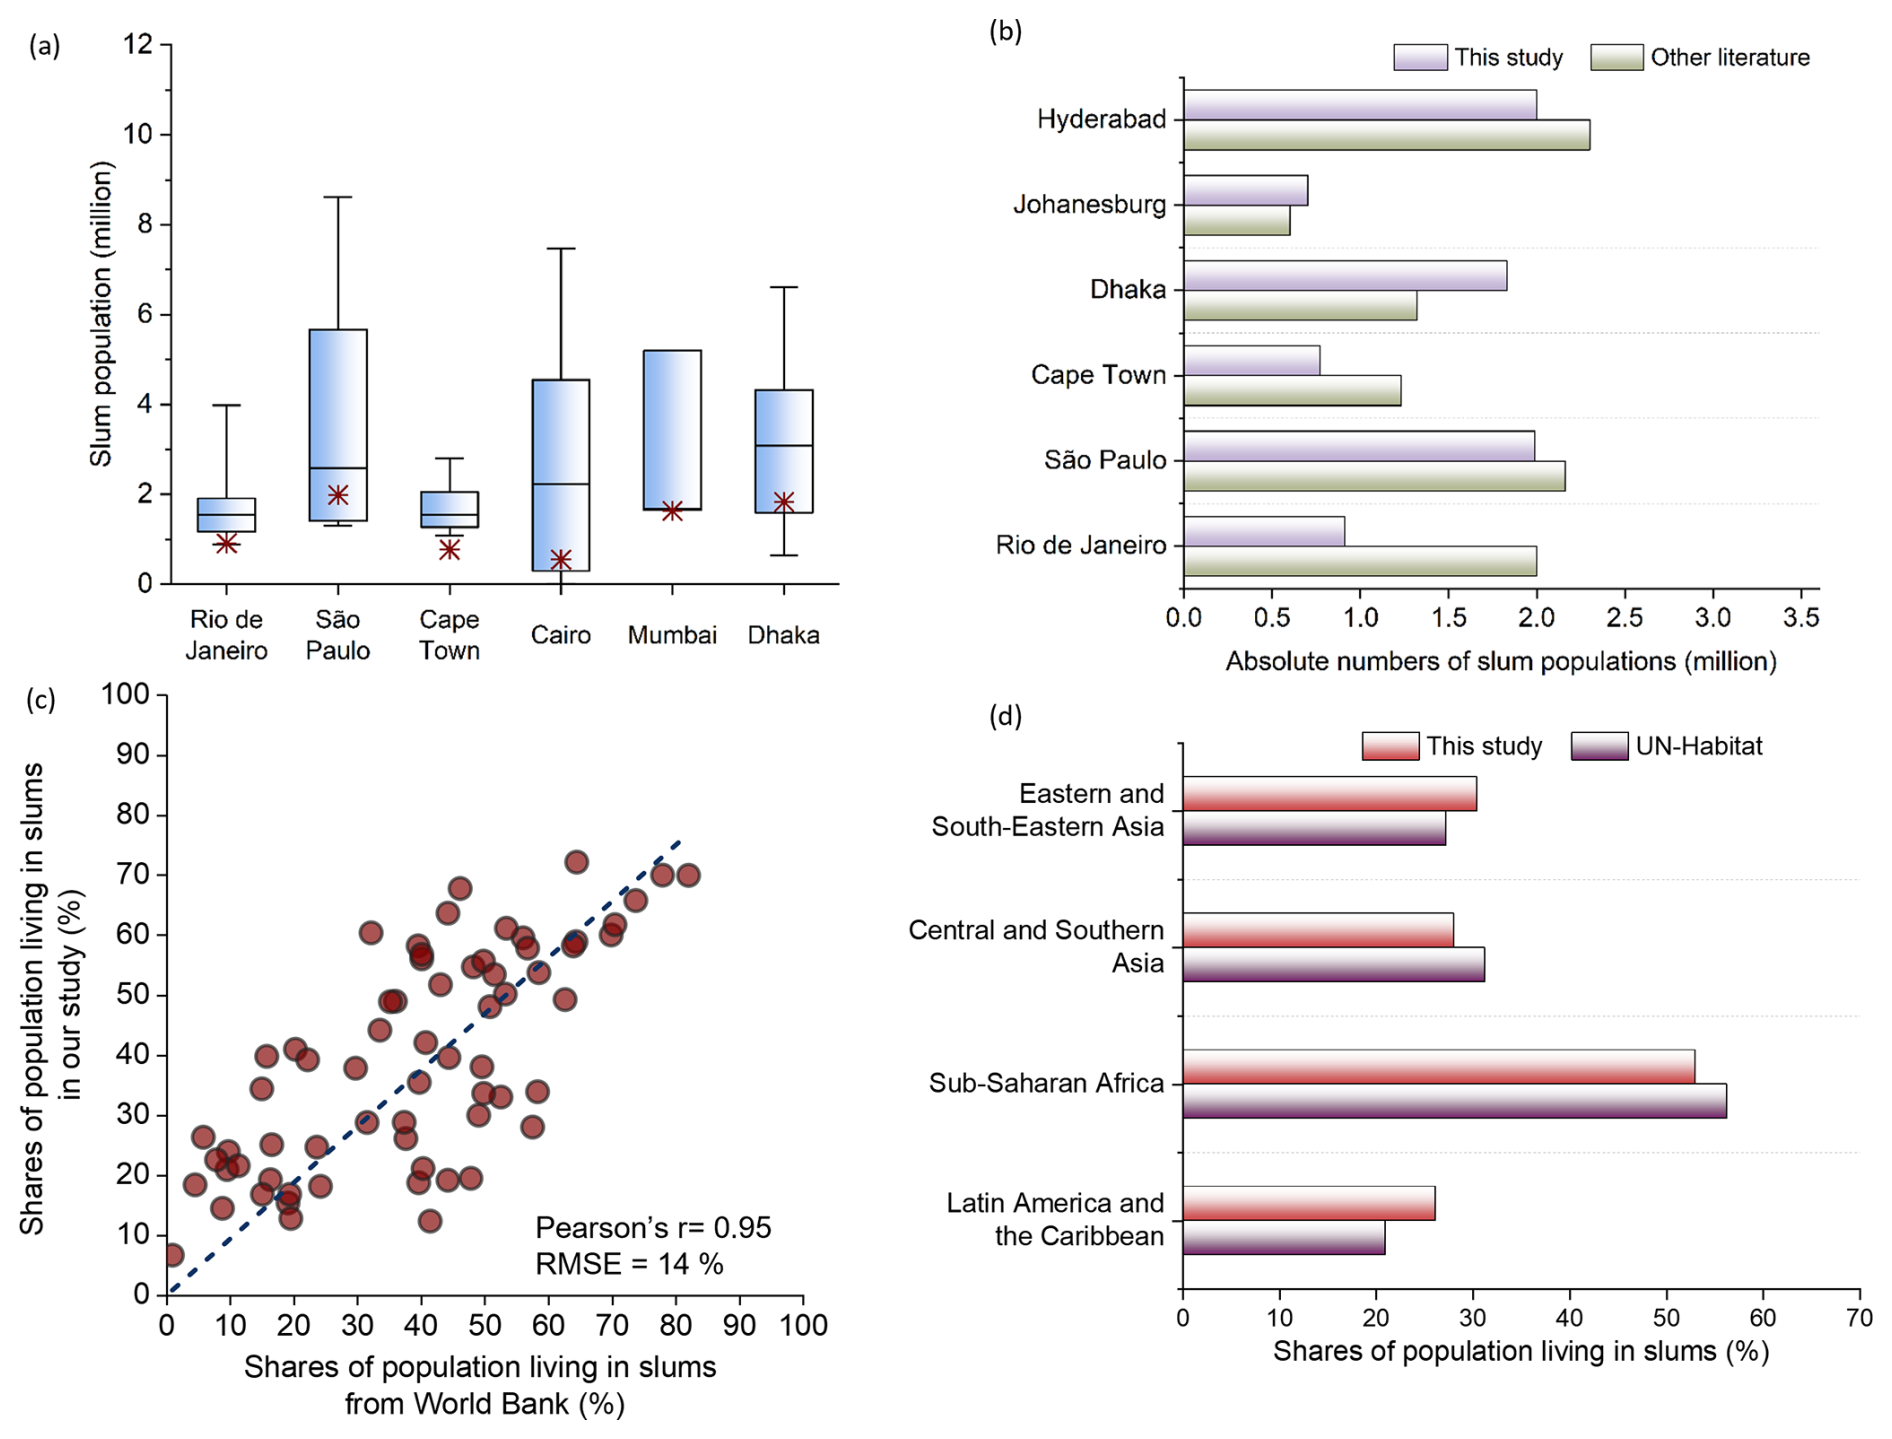
Figure 9Comparison of our slum population estimates with data from previous literature and official statistics, presented as both absolute numbers and relative shares. (a) Comparison with scaled-up values from previous studies for six cities: Rio de Janeiro (n=9), São Paulo (n=5), Cape Town (n=12), Cairo (n=6), Mumbai (n=3), and Dhaka (n=11). Scaled-up values are derived by extrapolating slum population counts from multiple sampled slums to the city level. Asterisks indicate estimates from this study. Box plots display the median (central line), interquartile range (box), and minimum-maximum range (whiskers). (b) Comparison with official city-level statistics for the same six cities. (c) Comparison of country-level slum population shares between our estimates and World Bank data; each dot represents a Global South country. (d) Comparison of regional-level slum population shares between our estimates and UN-Habitat data.
We present a unified, scalable, and operational bottom-up approach for mapping slum populations by integrating location-specific data, state-of-the-art machine learning, satellite imagery, and population datasets. The model performances demonstrate that such machine learning models are effective in capturing the complex relationships between satellite imagery and slum indicators. Building on this, our approach enables slum population mapping over large areas with high spatial details even in countries lacking survey-based data, and allows for cross-compared at both local and regional scales. It facilitates the identification of slum populations – a key indicator for estimating affordable and adequate housing, in alignment with SDG 11.1. To the best of our knowledge, this is the first large-scale, spatially explicit inventory of slum populations across the Global South countries.
5.1 Robustness and external validation
Our approach builds on well-established deep learning techniques widely used for mapping poverty, infrastructure access, and progress toward the Sustainable Development Goals (Jean et al., 2016; Chi et al., 2022). We fine-tune the ResNet-34 model on 7-band satellite imagery to more effectively capture the complex spatial-spectral patterns associated with deprived housing conditions. Rather than using ResNet-34 for direct prediction, we extract 512-dimensional embeddings from its penultimate layer and use these as inputs to an XGBoost regression model. This hybrid architecture combines the representational strength of deep CNNs with the predictive robustness of gradient-boosted trees, enabling it to model complex, non-linear relationships in the data.
Slum characteristics vary across countries and regions (da Fonseca Feitosa et al., 2021; do Nascimento et al., 2025), making consistent feature extraction at large spatial scales challenging. We address this systematically across the workflow, from data selection to model design and feature engineering. At the core we adopt transfer learning with Resnet-34 pre-trained on over 100 million ImageNet samples and adapt it to 7-channel multispectral patterns associated with deprived housing conditions. While the original RGB-pretrained ResNet-34 is optimized for general features (e.g., edges and textures), fine-tuning enables early and intermediate filters to learn context-specific cues, such as roof material, settlement density, and vegetation coverage, while leveraging the added information from near-infrared and other bands. The combination of broadly learned representations and increased spectral richness provides a robust foundation for identifying spatial and morphological signatures of slum environments. The approach outperforms RGB-only baseline, highlighting the value of multispectral fine-tuning and high-dimensional feature extraction for modeling housing-related deprivation.
The use of publicly available Landsat imagery and DHS ground-truth data provides a uniform, reproducible basis for cross-country analysis. Our design choices enable consistent and accurate slum feature extraction at scale and underpin the production of a harmonized slum population product. Our regional models demonstrate strong robustness for countries with available training data. It is important to note that countries or areas with changes exceeding ±10 % are generally those where nationwide household-based surveys are unavailable or limited, or where the geographic extent is relatively small (Table S7). Future model iterations could reduce this uncertainty by incorporating additional spatial-contextual covariates and proxy data, such as settlement morphology, built-up density, and other socioeconomic indicators.
Previous studies have addressed slum population underestimation by scaling single-slum estimates to match literature-reported values and then applying these ratios to adjust aggregated population totals (Breuer et al., 2024; Thomson et al., 2022). In contrast, we adopt a direct estimation approach that predicts the proportion of slum households within each enumeration area. First, we operationalize slums from a household perspective by constructing a household-level indicator, expressed as the share of slum households among all households in an enumeration area, and use deep learning to link this indicator directly to features extracted from remote sensing imagery. This design avoids reliance on dichotomous morphological slum maps (which are rarely unavailable at scale) and provides a more flexible, generalizable framework. Second, we use high-quality DHS survey data as labels; their standardized instruments and rigorous quality-control protocols yield valid household-level indicators essential for accurate prediction. Finally, for population distribution, we employ GHS-POP, which refines population estimates along the urban gradient and share a production framework with the GHSL datasets used in this study, thereby reducing uncertainties arising from heterogeneous sources.
Another important consideration for accuracy verification is that external validation datasets may themselves contain uncertainties and limitations, stemming from inconsistent reporting standards, heterogeneous data collection methods, or time lags in statistical updates. To address this, we minimize reliance on any single source by employing a diverse suite of validation data across multiple spatial scales. At the micro level, DHS household surveys provide standardized, representative indicators of slum households based on rigorous sampling. At the meso level, literature-reported estimates and city-level statistics, including both scaled-up values from individual slum areas and directly reported city totals, offer informative reference ranges. At the macro level, national and regional statistics from international organizations such as the World Bank and UN-Habitat provide cross-country benchmarks. Validating against multiple sources and scales strengthens robustness and reduces the risk of bias associated with any single dataset.
Given the inherent uncertainty in slum population estimates, we cross-validate our mapping results against a broad range of literature data and government statistical data across multiple scales. Several factors likely contribute to the observed discrepancy. First, this may be because the slum population figures reported in the literature are from around 2015. Factors such as population growth, migration, and slum upgrading projects may have contributed to changes in slum population over time. Additionally, a recent study indicates that relying solely on the spatial extent of morphological slums and gridded population datasets can lead to underestimation of the slum population (Breuer et al., 2024). This evidence supports the advantage of our approach.
Secondly, the definition of slum households in our study does not fully align with those used in the statistical data, which leads to differences in the selection of quantitative indicators. For example, the World Bank's statistics, based on UN-Habitat definition, adopt a broader perspective that includes housing affordability and security of tenure. Their framework encompasses additional indicators, such as the proportion of households with formal title deeds (to land and housing) and whether a household's monthly net housing expenditure exceeds 30 % of their income. Due to data limitations, these specific indicators are not quantified in our study. Instead, we include more detailed sub-indicators, such as access to safely managed drinking water and sanitation services (e.g., households with access to drinking water within a 30 min round trip), which are absent in the statistical data.
Moreover, the statistical data are compiled from various sources, such as the World Health Surveys (WHS) and Living Standards and Measurement Surveys (LSMS), while our household survey data come from a more singular source. Additionally, in our efforts to generalize a large-scale, unified framework, our regional model estimates for certain countries, especially small island nations, may exhibit bias due to the lack of specific survey data. Further research should focus on refining and validating these estimates, especially when more high-resolution reference datasets and local-scale models become available.
5.2 Spatial resolution and dataset selection
Our maps of slum population distribution and their local shares are presented at a spatial resolution of 6.72 km. The mapping resolution is primarily determined by the technical requirements of the deep learning architecture and the native spatial resolution of the satellite imagery used. Specifically, the ResNet-34 model for feature extraction requires input images in a 224x224 pixel format (Wu et al., 2019). It is also crucial to ensure spatial and temporal consistency between the satellite images and survey data, which vary across years and countries. To enrich the input feature space, we prioritize images with more spectral bands than standard RGB. Landsat imagery offers consistent temporal coverage, global reach, and multiple spectral bands at 30 m resolution, making it well suited to our task (Wulder et al., 2022). Based on these considerations, the mapping resolution is set at 6.72 km at the equator. This resolution aligns with other published maps that focus on sub-dimensions of poverty, such as the wealth index and education (Local Burden of Disease Educational Attainment Collaborators, 2020; Yeh et al., 2020), and provides more granular local insights beyond the administrative boundaries typically used in slum population statistics (Tjia and Coetzee, 2022).
Our method relies on cluster-level slum proxy indicators rather than precise morphological boundaries, which shapes the downstream policy and practical implications of the dataset. The resulting product provides estimates of slum populations at a spatial resolution of 6.72 km under current data constraints, and is therefore primarily intended for national- and regional-scale analyses. Potential applications include identifying broad vulnerability hotspots where slum-like living conditions coincide with climate-related hazards, environmental risks, or public health concerns, as well as supporting the strategic prioritization of resources for basic service provision, poverty reduction, and climate adaptation. However, because this spatial resolution cannot capture the fine-grained morphology, precise boundaries, or internal heterogeneity of slum settlements, the dataset is not intended for site-specific operational applications, such as intra-city infrastructure planning, settlement-level boundary delineation, or building-level slum upgrading. Future research could address this limitation by developing higher-resolution slum datasets and more refined approaches for delineating settlement boundaries.
The performance of any machine learning or deep-learning model relies heavily on the quality and suitability of its trained data (Meena et al., 2023). The DHS datasets provide accurate, representative, household-based survey data on demographic and socioeconomic conditions; our samples cover over 1 million households across 67 204 clusters in 53 countries of the Global South. However, a limitation of this dataset is the intentional perturbation of the latitude and longitude coordinates to protect the privacy of the surveyed households. This perturbation introduces random jitter of 2 km in urban areas and 5 km in rural areas (Owusu et al., 2021). The 6.72 km resolution of our maps strikes a balance between preserving privacy, leveraging available data, and ensuring the technological feasibility of our approach.
Gridded population data are also critical for measuring and mapping slum populations. Widely used global products, such as GPWv4.11 (CIESIN and Columbia University, 2018), GHS-POP (Pesaresi et al., 2016), and World Pop (Stevens et al., 2015), as well as regional/national products like HRSL (Smith et al., 2019), differ markedly in inputs, ancillary datasets, and dasymetric methods for redistributing population to grid cells. While regional products such as HRSL can achieve high accuracy at finer resolutions, their limited spatial coverage impedes large-scale, cross-country comparisons, especially in the Global South. Following the `fitness-for-use' principle (Juran et al., 1979), we select GHS-POP for its distinctive advantages aligned with our objectives. Because it is grounded in human-settlement information, GHS-POP effectively refines population estimates along the urban gradient, which is critical for slum population modeling. Moreover, the Global Human Settlement Layer (GHSL), which leverages Landsat imagery, aligns with the satellite images used in this study, reducing uncertainties introduced by heterogeneous sources.
5.3 Implications and future research
Our study provides a foundation for generating large-scale, spatially explicit slum population estimates, especially in data-sparse environments across Global South countries. The product advances a human-centered mapping framework, prioritizing populations living in inadequate housing rather than focusing solely on the physical delineation of slum settlements. Theoretically, it exposes gaps in progress toward the Sustainable Development Goals by providing spatially continuous, gridded estimates that directly quantify the number of people affected by deficits in water, sanitation, and electricity. These wall-to-wall estimates reveal local variation and spatial gradients that are often obscured by administrative boundaries or survey aggregates. Because the approach does not depend on pre-defined morphological slum boundaries, it supports population estimation in regions lacking boundary data and can be dynamically updated as new datasets become available.
Practically, this continuous representation enables flexible aggregation across multiple spatial scales and provides a robust, data-driven foundation for national- and regional-scale human-centered planning, targeted resource allocation, and evidence-based policy design. At this resolution, the dataset is best suited to identifying broad concentrations of slum populations for subsequent research and policy analysis. For example, one actionable research pathway is to integrate the gridded slum population estimates with commensurate-scale climate and environmental hazard maps, such as floods, heat exposure, drought, or air pollution, to assess compound risks among populations living in slum-like conditions. Another pathway is to use the dataset as a spatially explicit vulnerable-population baseline to evaluate whether public investment, health services, and climate adaptation efforts are equitably aligned with the distribution of slum populations. Together, these applications demonstrate the value of the dataset for assessing compound vulnerability and resource equity among slum populations.
Our framework is transferable and supports dynamic, temporal analyses of slum populations. It enables forward-looking predictions by leveraging patterns learned from existing datasets in combination with updated Landsat imagery and nighttime lights data. Through data-driven learning, the framework extracts informative features from satellite imagery and captures the relationships between spectral characteristics and slum household proxies, facilitating generalization to new spatial and temporal contexts. To ensure reliable predictions, input satellite datasets must be consistent in resolution and spatial extent, with preprocessing steps such as cloud masking carefully applied. Recalibration using newly released ground-truth survey data is recommended, as these labels provide an empirical benchmark to evaluate model performance and correct biases, particularly in rapidly urbanizing areas where slum populations may change significantly. By integrating spatial and temporal information, the framework provides a flexible and robust tool for rapid monitoring and spatiotemporal prediction in data-scarce and fast-changing contexts.
In this study, we assume that the proportion of slum households within each grid cell is equivalent to the proportion of the population living in slums or slum-like conditions. This assumption implies that slum and non-slum households have the same average household size within each 6.72 km grid cell. Although this is a practical approximation given the absence of spatially explicit household-size data at the grid-cell scale, it may introduce uncertainty where household sizes differ systematically between slum and non-slum populations. Evidence from the 2011 Indian National Census (Chandramouli, 2011) supports its plausibility, showing minimal differences in household size distribution between urban and slum households. For example, 1–3 member households comprise 29.0 % of urban households and 28.1 % of slum households, while 6–8 member households account for 20.6 % and 22.2 %, respectively. Nonetheless, we acknowledge this as a potential limitation. For example, the sensitivity analysis in India shows that assuming slum households to be 10 % larger would increase the national estimate by approximately 7.82 %, whereas assuming them to be 10% smaller would decrease the estimate by approximately 8.14 %. These results suggest that household-size differences can affect absolute population estimates, while also providing a quantitative bound on the uncertainty associated with this assumption. Future work incorporating spatially explicit household size data could further improve the accuracy of slum population estimates.
Overall, our study has broader implications for urban planning, resource allocation, and the improvement of human well-being among slum populations. The insights provided by our maps support evidence-based decision-making and targeted interventions aimed at achieving sustainable development goals. Since our approach is based on free and openly available data, it can be extended over time to track the dynamics of slum populations at the grid-cell level. Multi-temporal slum population maps could help uncover the underlying drivers of slum growth, in addition to the forces of local population growth and migration. With more accurate geospatial survey data and higher-resolution satellite imagery, we anticipate significant improvements in the resolution and accuracy of slum population maps. This progress will greatly enhance our understanding of the distribution and scale of slums, enabling more informed decision-making and more effective interventions.
The maps of slum populations and their local shares in Global South countries are available in the Zenodo repository at https://doi.org/10.5281/zenodo.13779002 (Li et al., 2025). All household-based data are available for downloading, free of charge by registered users, from the DHS Program (https://www.dhsprogram.com/data/, last access: 1 August 2023), satellite images and land cover layers product are download on GEE platform (https://earthengine.google.com/, last access: 21 July 2023). Global NPP-VIIRS-like nighttime light dataset is from Chen et al. (2021). The Settlement Model grid (GHS-SMOD) and Population Grid (GHS-POP) can be obtained from Global Human Settlement Layer (https://ghsl.jrc.ec.europa.eu/download.php, last access: 4 December 2023).
In this study, we develop a standardized, operational, and bottom-up framework for producing large-scale, spatially explicit estimates of slum populations. Our framework is based on SDG 11.1 slum household indicators and combines feature extraction techniques with machine learning UN-Habitat algorithms. It integrates household-based surveys, satellite imagery, and gridded population data to address the underestimation of slum populations found in prior studies, which often relied heavily on slum geometry. Our approach provides reliable slum population predictions, particularly in data-scarce environments. More than just a static map, our study provides a scalable foundation for a future monitoring system of slum populations. The framework can be readily updated with new DHS survey rounds and satellite data (e.g., forthcoming Landsat Next and Sentinel-2).
The resulting maps represent the first comprehensive inventory of slum populations across Global South countries, produced at a spatial resolution of 6.72 km at the equator. The models exhibit strong within-country and out-of-country spatial predictive performance, achieving median R2 values of 0.89 and 0.85, respectively. Our estimates fall within the range of scaled slum population estimates from existing literature and exhibit strong correlations with them at both national and regional scales. This approach offers a valuable tool for generating reliable slum population estimates, and the dataset produced will support a wide range of evidence-based decision-making and targeted interventions aimed at achieving city-level sustainable development goals.
The supplement related to this article is available online at https://doi.org/10.5194/essd-18-5969-2026-supplement.
DL designed the research. DL developed the model and datasets. LS provided guidance on data validation. LS and DL led the drafting of the manuscript. DL, LS, YY and PT contributed significantly to the final writing of the article.
The contact author has declared that none of the authors has any competing interests.
Publisher's note: Copernicus Publications remains neutral with regard to jurisdictional claims made in the text, published maps, institutional affiliations, or any other geographical representation in this paper. The authors bear the ultimate responsibility for providing appropriate place names. Views expressed in the text are those of the authors and do not necessarily reflect the views of the publisher.
This research has been supported by the National Natural Science Foundation of China (grant no. 72403147), the Natural Science Foundation of Shandong Province (grant no. ZR2023QG076), and the Taishan Scholar Youth Expert Program of Shandong Province (grant no. tsqn202507015).
This paper was edited by Yue Qin and reviewed by four anonymous referees.
Abascal, A., Rothwell, N., Shonowo, A., Thomson, D.R., Elias, P., Elsey, H., Yeboah, G., and Kuffer, M.: “Domains of deprivation framework” for mapping slums, informal settlements, and other deprived areas in LMICs to improve urban planning and policy: A scoping review, Comput. Environ. Urban Syst., 93, 101770, https://doi.org/10.1016/j.compenvurbsys.2022.101770, 2022.
Angeles, G., Lance, P., Barden-O'Fallon, J., Islam, N., Mahbub, A., and Nazem, N. I.: The 2005 census and mapping of slums in Bangladesh: design, select results and application, Int. J. Health Geogr., 8, 1–19, https://doi.org/10.1186/1476-072x-8-32, 2009.
Azzari, G. and Lobell, D.: Landsat-based classification in the cloud: An opportunity for a paradigm shift in land cover monitoring, Remote Sens. Environ., 202, 64–74, https://doi.org/10.1016/j.rse.2017.05.025, 2017.
Banerjee, A., Banerji, R., Berry, J., Duflo, E., Kannan, H., Mukerji, S., Shotland, M., and Walton, M.: From proof of concept to scalable policies: Challenges and solutions, with an application, J. Econ. Perspect., 31, 73–102, https://doi.org/10.1257/jep.31.4.73, 2017.
Baynes, J., Neale, A., and Hultgren, T.: Improving intelligent dasymetric mapping population density estimates at 30 m resolution for the conterminous United States by excluding uninhabited areas, Earth Syst. Sci. Data, 14, 2833–2849, https://doi.org/10.5194/essd-14-2833-2022, 2022.
Binzel, C. and Fehr, D.: Social distance and trust: Experimental evidence from a slum in Cairo, J. Dev. Econ., 103, 99–106, https://doi.org/10.1016/j.jdeveco.2013.01.009, 2013.
Björkman, L.: Becoming a slum: from municipal colony to illegal settlement in liberalization era Mumbai. Contesting the Indian city: global visions and the politics of the local, Wiley, 208–240, https://doi.org/10.1002/9781118295823.ch8, 2013.
Breuer, J. H. and Friesen, J.: Methods to assess spatio-temporal changes of slum populations, Cities 143, 104582, https://doi.org/10.1016/j.cities.2023.104582, 2023.
Breuer, J. H., Friesen, J., Taubenböck, H., Wurm, M., and Pelz, P. F.: The unseen population: Do we underestimate slum dwellers in cities of the Global South?, Habitat Int., 148, 103056, https://doi.org/10.1016/j.habitatint.2024.103056, 2024.
Buchhorn, M., Smets, B., Bertels, L., De Roo, B., Lesiv, M., Tsendbazar, N. E., Herold, M., and Fritz, S.: Copernicus global land service: land cover 100 m: collection 3: epoch 2019: Globe, Zenodo [data set], https://doi.org/10.5281/zenodo.3939050, 2020.
Burgert, C.R., Colston, J., Roy, T., and Zachary, B.: Geographic displacement procedure and georeferenced data release policy for the Demographic and Health Surveys, Icf International, https://doi.org/10.13140/RG.2.1.4887.6563, 2013.
Burke, M., Driscoll, A., Lobell, D. B., and Ermon, S.: Using satellite imagery to understand and promote sustainable development, Science, 371, eabe8628, https://doi.org/10.1126/science.abe8628, 2021.
Butera, F. M., Caputo, P., Adhikari, R. S., and Mele, R.: Energy access in informal settlements. Results of a wide on site survey in Rio De Janeiro, Energy Policy, 134, 110943, https://doi.org/10.1016/j.enpol.2019.110943, 2019.
Byuro, B. P. K. N.: Census of slum areas and floating population 2014, http://arks.princeton.edu/ark:/88435/dsp01wm117r42q (last access: 1 August 2024), 2015.
Chandramouli, C.: Housing stock, amenities and assets in slums – Census 2011, Office of the Registrar General and Census Commissioner, New Delhi, https://censusindia.gov.in/ (last access: 14 May 2026), 2011.
Chen, T. and Guestrin, C.: Xgboost: A scalable tree boosting system, in: Proceedings of the 22nd acm sigkdd international conference on knowledge discovery and data mining, San Francisco, California, USA, 785–794, https://doi.org/10.1145/2939672.2939785, 2016.
Chen, Z., Yu, B., Yang, C., Zhou, Y., Yao, S., Qian, X., Wang, C., Wu, B., Wu, J., Liao, L., and Shi, K.: The global NPP-VIIRS-like nighttime light data (Version 2) for 1992–2025, Harvard Dataverse, V10, https://doi.org/10.7910/DVN/YGIVCD, 2020.
Chen, Z., Yu, B., Yang, C., Zhou, Y., Yao, S., Qian, X., Wang, C., Wu, B., and Wu, J.: An extended time series (2000–2018) of global NPP-VIIRS-like nighttime light data from a cross-sensor calibration, Earth Syst. Sci. Data, 13, 889–906, https://doi.org/10.5194/essd-13-889-2021, 2021.
CIESIN – Center for International Earth Science Information Network and Columbia University: Gridded Population of the World, Version 4 (GPWv4): Population Density, Revision 11, NASA SEDAC, https://doi.org/10.7927/H4F47M65, 2018.
da Fonseca Feitosa, F., Vieira Vasconcelos, V., Moutinho Duque de Pinho, C., Frizzi Galdino da Silva, G., da Silva Gonçalves, G., Correa Danna, L. C., and Seixas Lisboa, F.: IMMerSe: An integrated methodology for mapping and classifying precarious settlements, Appl. Geogr., 133, 102494, https://doi.org/10.1016/j.apgeog.2021.102494, 2021.
Davis, M.: Planet of slums, New Perspect. Quart., 30, 11–12, https://doi.org/10.1111/npqu.11395, 2013.
Doe, B., Peprah, C., and Chidziwisano, J. R.: Sustainability of slum upgrading interventions: Perception of low-income households in Malawi and Ghana, Cities 107, 102946, https://doi.org/10.1016/j.cities.2020.102946, 2020.
do Nascimento, G. A., Giannotti, M., Regueira, T. A., and Tomasiello, D. B.: Identifying slum areas: A multidimensional analysis leveraging with explanatory machine learning techniques, Sustain. Cities Soc., 131, 106645, https://doi.org/10.1016/j.scs.2025.106645, 2025.
Elvidge, C. D., Baugh, K., Zhizhin, M., Hsu, F. C., and Ghosh, T.: VIIRS night-time lights, Int. J. Remote Sens., 38, 5860–5879, https://doi.org/10.1080/01431161.2017.1342050, 2017.
Engin, Z., van Dijk, J., Lan, T., Longley, P. A., Treleaven, P., Batty, M., and Penn, A.: Data-driven urban management: Mapping the landscape, J. Urban Manage., 9, 140–150, https://doi.org/10.1016/j.jum.2019.12.001, 2020.
Ezeh, A., Oyebode, O., Satterthwaite, D., Chen, Y.-F., Ndugwa, R., Sartori, J., Mberu, B., Melendez-Torres, G. J., Haregu, T., and Watson, S. I.: The history, geography, and sociology of slums and the health problems of people who live in slums, Lancet, 389, 547–558, https://doi.org/10.1016/s0140-6736(16)31650-6, 2017.
Fu, B., Wang, S., Zhang, J., Hou, Z., and Li, J.: Unravelling the complexity in achieving the 17 sustainable-development goals, Natl. Sci. Rev., 6, 386–388, https://doi.org/10.1093/nsr/nwz038, 2019.
Gram-Hansen, B. J., Helber, P., Varatharajan, I., Azam, F., Coca-Castro, A., Kopackova, V., and Bilinski, P.: Mapping informal settlements in developing countries using machine learning and low resolution multi-spectral data, in: Proceedings of the 2019 AAAI/ACM Conference on AI, Ethics, and Society, 361–368, https://doi.org/10.1145/3306618.3314253, 2019.
Guan, X., Wei, H., Lu, S., Dai, Q., and Su, H.: Assessment on the urbanization strategy in China: Achievements, challenges and reflections, Habitat Int., 71, 97–109, https://doi.org/10.1016/j.habitatint.2017.11.009, 2018.
Guilmoto, C. Z. and Rajan, S. I.: Fertility at the district level in India: Lessons from the 2011 census, Economic and Political weekly, 59–70, http://www.ceped.org/wp (last access: 1 August 2024), 2013.
Haberl, H., Wiedenhofer, D., Schug, F., Frantz, D., Virág, D., Plutzar, C., Gruhler, K., Lederer, J., Schiller, G., Fishman, T., and Lanau, M.: High-resolution maps of material stocks in buildings and infrastructures in Austria and Germany, Environ. Sci. Technol., 55, 3368–3379, https://doi.org/10.1021/acs.est.0c05642, 2021.
Hardoy, J. E., Mitlin, D., and Satterthwaite, D.: Environmental problems in an urbanizing world: finding solutions in cities in Africa, Asia and Latin America, Routledge, https://doi.org/10.4324/9781315071732, 2013.
He, K., Zhang, X., Ren, S., and Sun, J.: Deep residual learning for image recognition, in: Proceedings of the IEEE conference on computer vision and pattern recognition, 770–778, https://doi.org/10.1109/cvpr.2016.90, 2016.
Hohmann, J.: The right to housing: Law, concepts, possibilities, Bloomsbury Publishing, https://doi.org/10.5040/9781472566416, 2013.
Hsu, F.-C., Baugh, K. E., Ghosh, T., Zhizhin, M., and Elvidge, C. D.: DMSP-OLS radiance calibrated nighttime lights time series with intercalibration, Remote Sens., 7, 1855–1876, https://doi.org/10.3390/rs70201855, 2015.
Ibrahim, M. R., Titheridge, H., Cheng, T., and Haworth, J.: predictSLUMS: A new model for identifying and predicting informal settlements and slums in cities from street intersections using machine learning, Comput. Environ. Urban Syst., 76, 31–56, https://doi.org/10.1016/j.compenvurbsys.2019.03.005, 2019.
Jean, N., Burke, M., Xie, M., Davis, W. M., Lobell, D. B., and Ermon, S.: Combining satellite imagery and machine learning to predict poverty, Science, 353, 790–794, https://doi.org/10.1126/science.aaf7894, 2016.
Juran, J. M., Gryna, F. M., and Bingham, R. S.: Quality control handbook, McGraw-Hill, New York, ISBN 978-0-07-033175-4, 1979.
Kingma, D. P. and Ba, J. A.: A method for stochastic optimization, arXiv [preprint], arXiv:1412.6980, https://doi.org/10.48550/arXiv.1412.6980, 2014.
Li, D., Sun, L., Yu, Y., and Tian, P.: Geospatial micro-estimates of slum populations in 129 Global South countries using machine learning and public data, Zenodo [data set], https://doi.org/10.5281/zenodo.13779002, 2025.
Local Burden of Disease Educational Attainment Collaborators: Mapping disparities in education across low-and middle-income countries, Nature, 577, 235–238, https://doi.org/10.1038/s41586-019-1872-1, 2020.
Mahabir, R., Agouris, P., Stefanidis, A., Croitoru, A., and Crooks, A. T.: Detecting and mapping slums using open data: A case study in Kenya, Int. J. Digit. Earth, 13, 683–707, https://doi.org/10.1080/17538947.2018.1554010, 2020.
Marx, B., Stoker, T., and Suri, T.: The economics of slums in the developing world, J. Econ. Perspect., 27, 187–210, https://doi.org/10.1257/jep.27.4.187, 2013.
Medeiros, S. D. S., Pinto, T. F., Hernan Salcedo, I., Cavalcante, A. D. M. B., Perez Marin, A. M., and Tinôco, L. B. D. M.: Sinopse do censo demográfico para o semiárido brasileiro, INSA – Instituto Nacional de Seminário, http://livroaberto.ibict.br/handle/1/941 (last access: 1 August 2024), 2012.
Meena, S., Nava, L., Bhuyan, K., Puliero, S., Soares, L., Dias, H., Floris, M., and Catani, F.: HR-GLDD: a globally distributed dataset using generalized deep learning (DL) for rapid landslide mapping on high-resolution (HR) satellite imagery, Earth Syst. Sci. Data, 15, 3283–3298, https://doi.org/10.5194/essd-15-3283-2023, 2023.
Moreno, E. L.: Slums of the world: The face of urban poverty in the new millennium?: Monitoring the millennium development goal, target 11 – world-wide slum dweller estimation, Habitat, https://digitallibrary.un.org/record/515731 (last access: 25 October 2024), 2003.
Mwaniki, D. and Ndugwa, R.: The Global Urban Monitoring Approach Taken by UN-Habitat, Stadtentwicklung beobachten, messen und umsetzen, IzR – Informationen zur Raumentwicklung, 32–43, https://biblioscout.net/article/99.140005/izr202101003201 (last access: 25 October 2024), 2021.
Nielsen, D. Tree boosting with XGBoost: Why does XGBoost win “every” machine learning competition?, MS thesis, Norwegian University of Science and Technology, Trondheim, Norway, http://hdl.handle.net/11250/2433761 (last access: 25 October 2024), 2016.
Nowak, M.: Introduction to the international human rights regime, Brill, https://doi.org/10.1163/9789004479074, 2003.
Owusu, M., Kuffer, M., Belgiu, M., Grippa, T., Lennert, M., Georganos, S., and Vanhuysse, S.: Towards user-driven earth observation-based slum mapping, Comput. Environ. Urban Syst., 89, 101681, https://doi.org/10.1016/j.compenvurbsys.2021.101681, 2021.
Pan, S. J. and Yang, Q.: A survey on transfer learning, IEEE T. Knowl. Data Eng., 22, 1345–1359, https://doi.org/10.1109/TKDE.2009.191, 2009.
Parikh, P., Parikh, H., and McRobie, A.: The role of infrastructure in improving human settlements, Proc. Inst. Civ. Eng.-Urban Design Plan., 166, 101–118, https://doi.org/10.1680/udap.10.00038, 2013.
Patel, A., Joseph, G., Shrestha, A., and Foint, Y.: Measuring deprivations in the slums of Bangladesh: implications for achieving sustainable development goals, Hous. Soc., 46, 81–109, 2019.
Patel, N. N., Angiuli, E., Gamba, P., Gaughan, A., Lisini, G., Stevens, F. R., Tatem, A. J., and Trianni, G.: Multitemporal settlement and population mapping from Landsat using Google Earth Engine, Int. J. Appl. Earth Obs. Geoinf., 35, 199–208, https://doi.org/10.1016/j.jag.2014.09.005, 2015.
Pedro, A. A. and Queiroz, A. P.: Slum: Comparing municipal and census basemaps, Habitat Int., 83, 30–40, https://doi.org/10.1596/32084, 2019.
Persello, C. and Kuffer, M.: Towards uncovering socio-economic inequalities using VHR satellite images and deep learning, in: IGARSS 2020–2020 IEEE International Geoscience and Remote Sensing Symposium, 3747–3750, https://doi.org/10.1109/igarss39084.2020.9324399, 2020.
Pesaresi, M., Ehrlich, D., Ferri, S., Florczyk, A.J., Freire, S., Halkia, M., Julea, A., Kemper, T., Soille, P., and Syrris, V.: Operating procedure for the production of the Global Human Settlement Layer from Landsat data of the epochs 1975, 1990, 2000, and 2014, Publications Office of the European Union, Luxembourg, https://doi.org/10.2788/253582, 2016.
Ramraj, S., Uzir, N., Sunil, R., and Banerjee, S.: Experimenting XGBoost algorithm for prediction and classification of different datasets, Int. J. Control Theory Appl., 9, 651–662, 2016.
Rentschler, J., Avner, P., Marconcini, M., Su, R., Strano, E., Vousdoukas, M., and Hallegatte, S.: Global evidence of rapid urban growth in flood zones since 1985, Nature, 622, 87–92, https://doi.org/10.1038/s41586-023-06468-9, 2023.
Robinson, C., Hohman, F., and Dilkina, B.: A deep learning approach for population estimation from satellite imagery, in: Proceedings of the 1st ACM SIGSPATIAL Workshop on Geospatial Humanities, 47–54, https://doi.org/10.1145/3149858.3149863, 2017.
Rogler, L. H.: Slum Neighborhoods in Latin America, J. Inter-Am. Stud., 9, 507–528, https://doi.org/10.2307/164857, 1967.
Roy, D. P., Kovalskyy, V., Zhang, H. K., Vermote, E. F., Yan, L., Kumar, S. S., and Egorov, A.: Characterization of Landsat-7 to Landsat-8 reflective wavelength and normalized difference vegetation index continuity, Remote Sens. Environ., 185, 57–70, https://doi.org/10.1016/j.rse.2015.12.024, 2016.
Russakovsky, O., Deng, J., Su, H., Krause, J., Satheesh, S., Ma, S., Huang, Z., Karpathy, A., Khosla, A., and Bernstein, M.: Imagenet large scale visual recognition challenge, Int. J. Comput. Vision, 115, 211–252, https://doi.org/10.1007/s11263-015-0816-y, 2015.
Rutstein, S. O. and Staveteig, S.: Making the demographic and health surveys wealth index comparable, ICF international Rockville, MD, https://www.dhsprogram.com/pubs/pdf/MR9/MR9.pdf (last access: 1 August 2023), 2014.
Sabry, S.: Poverty lines in Greater Cairo: underestimating and misrepresenting poverty, IIED, https://www.iied.org/10572iied (last access: 1 August 2024), 2009.
Satterthwaite, D., Archer, D., Colenbrander, S., Dodman, D., Hardoy, J., Mitlin, D., and Patel, S.: Building resilience to climate change in informal settlements, One Earth, 2, 143–156, https://doi.org/10.1016/j.oneear.2020.02.002, 2020.
Schetke, S., Haase, D., and Kötter, T.: Towards sustainable settlement growth: A new multi-criteria assessment for implementing environmental targets into strategic urban planning, Environ. Impact Assess. Rev., 32, 195–210, https://doi.org/10.1016/j.eiar.2011.08.008, 2012.
Schiavina, M., Melchiorri, M., Pesaresi, M., Politis, P., Carneiro Freire, S., Maffenini, L., Florio, P., Ehrlich, D., Goch, K., and Tommasi, P.: GHSL data package 2022: Public release GHS P2022, KJ-07–22–357-EN-N (online), KJ-07–22–357-EN-C (print), European Union, https://doi.org/10.2760/19817, 2022.
Shi, Q., Liu, M., Marinoni, A., and Liu, X.: UGS-1m: fine-grained urban green space mapping of 31 major cities in China based on the deep learning framework, Earth Syst. Sci. Data, 15, 555–577, https://doi.org/10.5194/essd-15-555-2023, 2023.
Sietchiping, R. and Yoon, H. J.: What drives slum persistence and growth? Empirical evidence from sub-Saharan Africa, Int. J. Adv. Stud. Res. Africa, 1, 1–22, 2010.
Singh, B. N: Socio-economic conditions of slums dwellers: a theoretical study, Kaav Int. J. Arts Human. Social Sci., 3, 5–20, 2016.
Smith, A., Bates, P. D., Wing, O., Sampson, C., Quinn, N., and Neal, J.: New estimates of flood exposure in developing countries using high-resolution population data, Nat. Commun., 10, 1814, https://doi.org/10.1038/s41467-019-09282-y, 2019.
Stevens, F. R., Gaughan, A. E., Linard, C., and Tatem, A. J.: Disaggregating census data for population mapping using random forests with remotely-sensed and ancillary data, PloS One, 10, e0107042, https://doi.org/10.1371/journal.pone.0107042, 2015.
Tamiminia, H., Salehi, B., Mahdianpari, M., Quackenbush, L., Adeli, S., and Brisco, B.: Google Earth Engine for geo-big data applications: A meta-analysis and systematic review, ISPRS J. Photogram. Remote Sens., 164, 152–170, https://doi.org/10.1016/j.isprsjprs.2020.04.001, 2020.
Taubenböck, H. and Wurm, M.: Globale Urbanisierung–Markenzeichen des 21. Jahrhunderts, Globale Urbanisierung: Perspektive aus dem All, Springer, 5–10, https://doi.org/10.1007/978-3-662-44841-0_2, 2015.
Tellman, B., Sullivan, J. A., Kuhn, C., Kettner, A. J., Doyle, C. S., Brakenridge, G. R., Erickson, T. A., and Slayback, D. A.: Satellite imaging reveals increased proportion of population exposed to floods, Nature, 596, 80–86, https://doi.org/10.1038/s41586-021-03695-w, 2021.
Thomson, D. R., Linard, C., Vanhuysse, S., Steele, J. E., Shimoni, M., Siri, J., Caiaffa, W. T., Rosenberg, M., Wolff, E., and Grippa, T.: Extending data for urban health decision-making: a menu of new and potential neighborhood-level health determinants datasets in LMICs, J. Urban Health, 96, 514–536, https://doi.org/10.1007/s11524-019-00363-3, 2019.
Thomson, D. R., Kuffer, M., Boo, G., Hati, B., Grippa, T., Elsey, H., Linard, C., Mahabir, R., Kyobutungi, C., and Maviti, J.: Need for an integrated deprived area “slum” mapping system (IDEAMAPS) in low-and middle-income countries (LMICs), Social Sci., 9, 80, https://doi.org/10.3390/socsci9050080, 2020.
Thomson, D. R., Stevens, F. R., Chen, R., Yetman, G., Sorichetta, A., and Gaughan, A. E.: Improving the accuracy of gridded population estimates in cities and slums to monitor SDG 11: Evidence from a simulation study in Namibia, Land Use Policy, 123, 106392, https://doi.org/10.1016/j.landusepol.2022.106392, 2022.
Tian, P., Zhong, H., Chen, X., Feng, K., Sun, L., Zhang, N., Shao, X., Liu, Y., and Hubacek, K.: Keeping the global consumption within the planetary boundaries, Nature, 635, 625–630, https://doi.org/10.1038/s41586-024-08154-w, 2024.
Tjia, D. and Coetzee, S.: Geospatial information needs for informal settlement upgrading – A review, Habitat Int., 122, 102531, https://doi.org/10.1016/j.habitatint.2022.102531, 2022.
Trindade, T. C., MacLean, H. L., and Posen, I. D.: Slum infrastructure: Quantitative measures and scenarios for universal access to basic services in 2030, Cities, 110, 103050, https://doi.org/10.1016/j.cities.2020.103050, 2021.
UNCTAD –United Nations Conference on Trade and Development: Countries, All Groups Hierarchy, UNCTAD stat., https://unctadstat.unctad.org/EN/Classifications/DimCountries_All_Hierarchy.pdf (last access: 1 May 2025), 2025.
UN‐Habitat: The challenge of slums: global report on human settlements 2003, Manage. Environ. Qual., 15, 337–338, https://doi.org/10.1108/meq.2004.15.3.337.3, 2004.
UN-Habitat: World Cities Report 2020: The Value of Sustainable Urbanization, https://unhabitat.org/world-cities-report-2020-the-value-of-sustainable-urbanization (last access: 1 May 2025), 2020.
UN-Habitat: Urban indicators database. https://data.unhabitat.org/pages/housing-slums-and-informal-settlements (last access: 1 May 2025), 2021.
Weber, H.: Politics of `leaving no one behind': contesting the 2030 Sustainable Development Goals agenda, The Politics of Destination in the 2030 Sustainable Development Goals, Routledge, 64–79, https://doi.org/10.4324/9780429490507-4, 2018.
World Bank: World Bank country and lending groups, https://datahelpdesk.worldbank.org/knowledgebase/articles/906519 (last access: 1 August 2024), 2022.
World Bank Group: Population living in slums (% of urban population), https://data.worldbank.org/indicator/EN.POP.SLUM.UR.ZS (last access: 1 August 2024), 2018.
Wu, Z., Shen, C., and Van Den Hengel, A.: Wider or deeper: Revisiting the resnet model for visual recognition, Pattern Recog., 90, 119–133, https://doi.org/10.1016/j.patcog.2019.01.006, 2019.
Wulder, M. A., Roy, D. P., Radeloff, V. C., Loveland, T. R., Anderson, M. C., Johnson, D. M., Healey, S., Zhu, Z., Scambos, T. A., Pahlevan, N., Hansen, M., Gorelick, N., Crawford, C. J., Masek, J. G., Hermosilla, T., White, J. C., Belward, A. S., Schaaf, C., Woodcock, C. E., Huntington, J. L., Lymburner, L., Hostert, P., Gao, F., Lyapustin, A., Pekel, J.-F., Strobl, P., and Cook, B. D.: Fifty years of Landsat science and impacts, Remote Sens. Environ., 280, 113195, https://doi.org/10.1016/j.rse.2022.113195, 2022.
Wurm, M., Taubenböck, H., Weigand, M., and Schmitt, A.: Slum mapping in polarimetric SAR data using spatial features, Remote Sens. Environ., 194, 190–204, https://doi.org/10.1016/j.rse.2017.03.030, 2017.
Wurm, M., Stark, T., Zhu, X. X., Weigand, M., and Taubenböck, H.: Semantic segmentation of slums in satellite images using transfer learning on fully convolutional neural networks, ISPRS J. Photogram. Remote Sens., 150, 59–69, https://doi.org/10.1016/j.isprsjprs.2019.02.006, 2019.
Yeh, C., Perez, A., Driscoll, A., Azzari, G., Tang, Z., Lobell, D., Ermon, S., and Burke, M.: Using publicly available satellite imagery and deep learning to understand economic well-being in Africa, Nat. Commun., 11, 2583, https://doi.org/10.1038/s41467-020-16185-w, 2020.
Zhou, Y., Li, X., Chen, W., Meng, L., Wu, Q., Gong, P., and Seto, K. C.: Satellite mapping of urban built-up heights reveals extreme infrastructure gaps and inequalities in the Global South, P. Natla. Acad. Sci. USA, 119, e2214813119, https://doi.org/10.1073/pnas.2214813119, 2022.