the Creative Commons Attribution 4.0 License.
the Creative Commons Attribution 4.0 License.
 | 12 Aug 2026

OpenMesh: wireless signal dataset for opportunistic urban weather sensing in New York City
Shuyue Yu
Qianfei Hu
Zachary Hine
Rob Johnson
Jonatan Ostrometzky
Igor Kadota
Gil Zussman
Hagit Messer
We introduce OpenMesh, a publicly available dataset of wireless signal measurements from the NYC Mesh, a community-run communication network in New York City (NYC). While originally designed for affordable internet access, these links can be used opportunistically for high-resolution weather monitoring in diverse settings, including dense urban areas, providing 1 min sampling of signal strength measurements with dense spatial coverage across the study region. Spanning eight months of measurements (November 2023 to June 2024), the dataset comprises 103 wireless links in Lower Manhattan and Brooklyn, operating in three primary frequency ranges: 5–6 GHz (C-band), 24 GHz (K-band), and 58–70 GHz (V-band), part of the millimeter-wave (mmWave) spectrum.
Our analysis incorporates meteorological records from two primary sources: (1) 37 Weather Underground (WUnderground) personal weather stations (PWS) across Manhattan and Brooklyn with 5 and 15 min sampling, and (2) three Automated Surface Observing System (ASOS) stations. The study period saw total rainfall of approximately 900 mm and included diverse weather events, from intense rain to snowstorms in winter 2023–2024. These events were captured by the NYC Mesh wireless network, with intense rainfall causing attenuation up to 30 dB and frequent outages, especially on high-frequency V-band links. This highlights the trade-off of using high-frequency bands in wireless networks: while precipitation might cause severe channel disruptions, this greater sensitivity simultaneously makes them effective opportunistic weather sensors. The OpenMesh dataset is available at https://doi.org/10.5281/zenodo.15287692 (Jacoby et al., 2025b). By publishing the dataset and demonstrating its usability, we aim to encourage further research that leverages wireless networks for real-time urban weather sensing.
- Article
(7761 KB) - Full-text XML
- BibTeX
- EndNote


Opportunistic sensing (OS) uses a variety of non-traditional sensors to support environmental monitoring, such as commercial microwave links (CMLs), PWS, and satellite microwave links.
Accurate meteorological observations, including precipitation monitoring, are fundamental to decision-making across sectors, from water management and agriculture to urban planning and flood control (Stewart, 2015), with ground stations, weather radar, and satellites providing the core measurements (National Research Council, 2009; Tapiador et al., 2012). Although traditional weather measurements, such as weather radars and rain gauges (RGs), can provide broad-scale coverage, they often require costly infrastructure. Radars face clutter, path attenuation, interference, and require frequent calibration (Zawadzki, 1984), while RGs provide only point measurements with limited spatial representativeness and can be sparse in many regions (Hu et al., 2019). OS data streams can address coverage limitations of traditional observations, with dense deployments providing complementary or even alternative coverage: for example, in urban settings where fine temporal and spatial resolution is particularly valuable due to short catchment response times (5–15 min), high rainfall variability over small scales (2–3 km), and precise flood/runoff modeling needs (Schilling, 1991; Cristiano et al., 2017; Berne et al., 2004; Michelon et al., 2021). Early utilization of OS includes PWS networks providing dense observations and being explored for integration into forecasting workflows (Mandement and Caumont, 2020; Consortium, 2025), and CML networks used as standalone tools for city-scale precipitation nowcasting with lead times of a few minutes (Zhang et al., 2023b) and horizons extending up to several hours (Imhoff et al., 2020). Moreover, OS observations add local, short-term detail, can be used for data assimilation and independent evaluation, complement traditional monitoring networks, and potentially provide supplementary high-resolution inputs for deep-learning methods designed to ingest heterogeneous data sources. Still, utilizing OS sources requires addressing challenges related to variable data quality and sensor reliability (Fencl et al., 2024; Chwala and Kunstmann, 2019).
Specifically, wireless communication networks (WCNs) operating in the microwave spectrum (1–300 GHz) exemplify OS approaches by repurposing communication infrastructure as sensors to collect environmental data. By leveraging their inherent sensitivity to weather-induced variations in the propagation channel, they turn what would otherwise be a “source of error” into cost-efficient meteorological observations (Messer et al., 2006). As WCNs increasingly employ higher-frequency bands (e.g., V-Band 40–75 GHz and E-Band 71–76/81–86 GHz), the wider available spectrum supports higher data throughput and capacity, but these links also experience stronger propagation losses and atmospheric attenuation, including rain-induced fading and the oxygen-absorption resonance near 60 GHz, which challenge network reliability. However, this trend simultaneously creates novel opportunities for real-time environmental sensing, especially in urban environments (Janco et al., 2023).
A growing number of open data efforts (Fencl et al., 2024, 2025), including OpenMRG in Sweden (Andersson et al., 2022), OpenRainER in Italy (Covi and Roversi, 2024; Covi et al., 2026) and a country-wide dataset in the Netherlands (Overeem, 2023), make CML datasets openly available for hydrometeorological analysis and validation. These initiatives highlight the potential of OS to extend research in diverse climates and network topologies and to improve observational coverage. Here, we introduce a publicly available dataset from NYC Mesh, a community-operated WCN deployed across New York City's dense urban environment, representing a topology and location not previously covered in the CML literature. The published OpenMesh dataset comprises minute-scale measurements across the 5, 24, 60, and 70 GHz bands, with link lengths ranging from tens of meters to several kilometers providing a valuable test bed for OS in urban settings. We assess the OpenMesh dataset by comparing it with time-aligned meteorological records from opportunistic and standard weather stations (WS) during the study period, including WUnderground PWS and NOAA records.
Evaluation of measurements during the study period shows alignment between the link signals and reference observations, suggesting these data could contribute to urban weather monitoring analysis. By publicly sharing the OpenMesh dataset and demonstrating its applicability, we expand OS resources and illustrate how community WCNs can act as opportunistic environmental sensors in densely sampled urban settings, providing a reproducible benchmark for future dense network deployments and WCN sensing applications.
Section 2 details the dataset and its context in environmental sensing. Section 3 analyzes the data quality of the OpenMesh dataset and demonstrates its usage. Section 4 discusses the main results, challenges, opportunities, and future directions. Finally, Sects. 5 and 6 detail data and code availability, followed by concluding remarks in Sect. 7.
This section introduces the dataset, outlining its collection process and its use in environmental sensing. Figure 1 illustrates the OpenMesh network links and weather station locations used in this study. The figure shows published OpenMesh links from the broader NYC Mesh wireless network, densely concentrated between Lower Manhattan and Brooklyn within approximately 10 km2. We analyze two data types from three sources: (i) wireless signals from OpenMesh and (ii) meteorological measurements from WUnderground PWS and NOAA stations, providing both opportunistic and reference data from 29 October 2023 to 1 July 2024.

Figure 1Dataset Overview: OpenMesh NYC sublinks, PWS stations, and ASOS reference stations across the city. © OpenStreetMap contributors 2025. Distributed under the Open Data Commons Open Database License (ODbL) v1.0.
2.1 Wireless Communication Links
2.1.1 Terrestrial Microwave Links
Wireless communication links are point-to-point radio connections between two fixed locations. Terrestrial links, often employed by mobile operators and enterprises for backhaul, are also widely used in smart-city applications and community-driven initiatives (e.g., NYC Mesh), offering both commercial and public connectivity. These links span meters to kilometers and operate across a wide spectrum, from 1 up to 100 GHz, depending on usage, and are used mainly for point-to-point interconnection, with coverage and capacity determined by the frequency band and environment. Network Management Systems (NMS) typically collect link performance data to automate network monitoring and quality management, but storing or archiving these datasets is not always mandated and often depends on specific network standards and operator practices.
The following describes the structure of terrestrial wireless link elements (Fencl et al., 2024): a “site” is the physical location hosting one or more antennas; a “hop” denotes a site-to-site segment; a “sublink” is a one-directional path between antennas; and a “link” comprises the two opposite-direction sublinks between the same antenna pair, as shown in Fig. 2a.
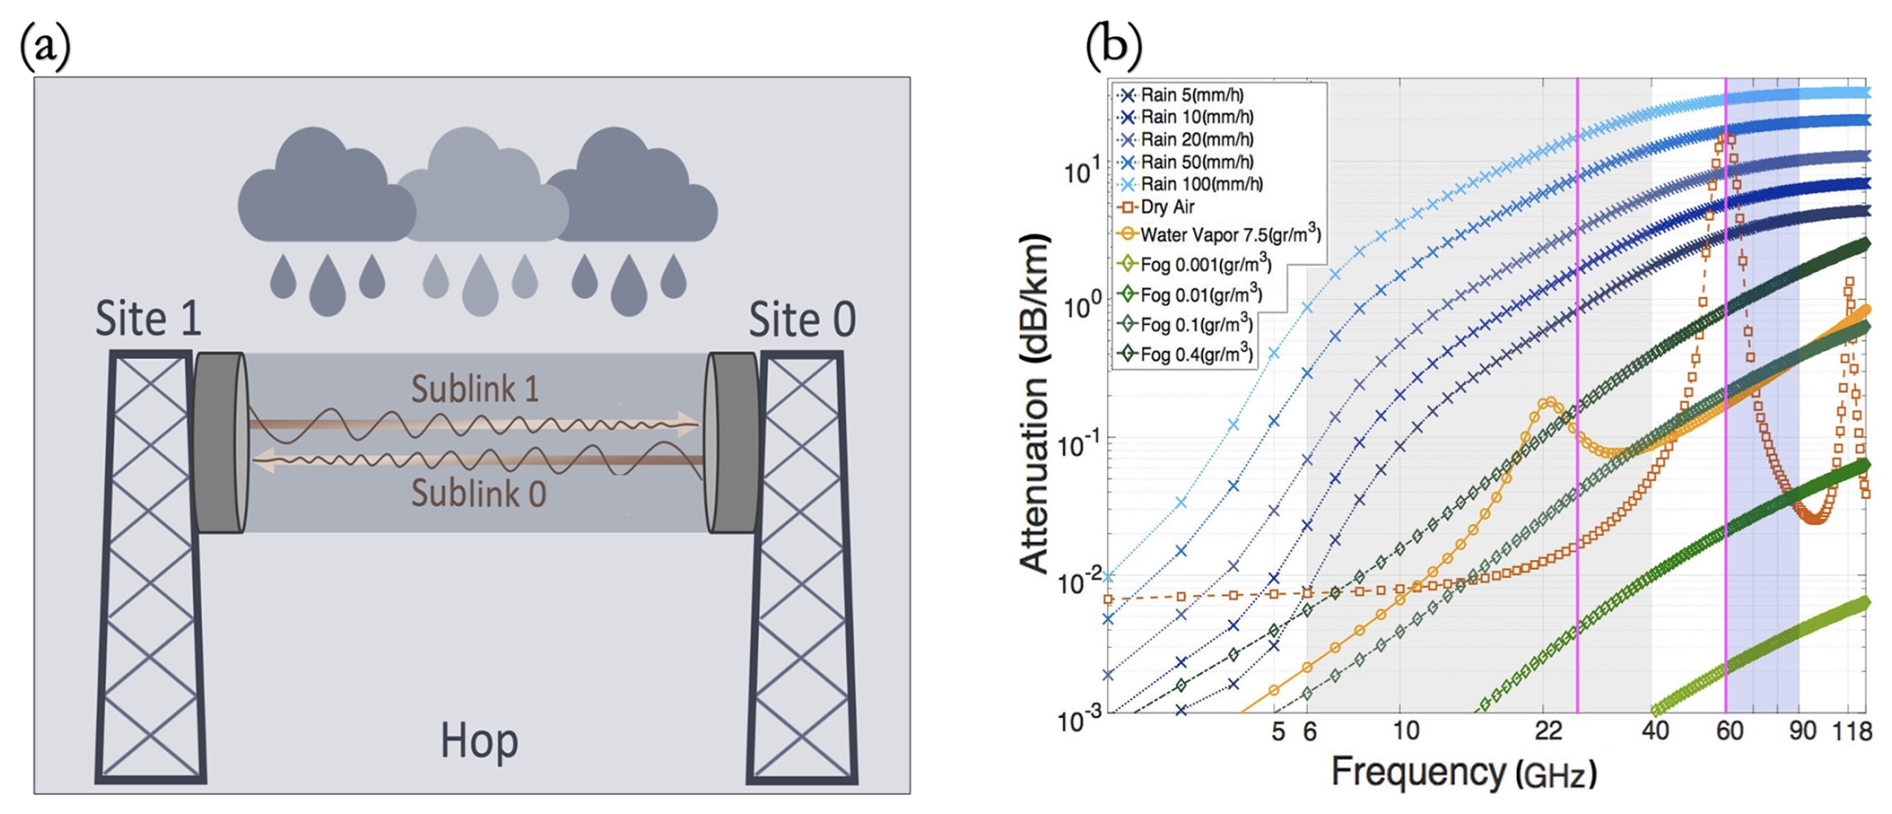
Figure 2(a) Schematic of a point-to-point wireless communication link (Fencl et al., 2024). (b) Signal attenuation per km for various atmospheric phenomena as a function of frequency (ITU-R P.530, 2017; Ostrometzky, 2017).
Wireless link measurements can originate from diverse providers, including cellular telecommunication companies, municipal smart-city operators, and community-driven networks (e.g., NYC Mesh), and each features distinct topologies and coverage densities.
Next generation networks are expected to shift to higher bands to access wide, underutilized spectrum – specifically mmWave bands such as the V-band (including 57–64 GHz) and the E-band (71–76, 81–86, 92–95 GHz) – which enable wider channels and higher capacity, supporting multi-gigabit rates for high-bandwidth applications (Ashraf et al., 2024; Brake, 2016). At higher bands, signals suffer significantly greater path loss and weather-induced attenuation (see Fig. 2b). This favors short line-of-sight links and dense site deployments, particularly in urban areas.
Signal Level Measurements
Wireless networks typically measure signals strength using two key metrics: the transmitted signal level (TSL) and the received signal level (RSL), both expressed in dBm. The difference between them, referred to as total attenuation (in dB), is given by
Depending on the operator’s protocols, TSL and RSL are often logged at intervals ranging from seconds to minutes, hours, or even days, stored either as instantaneous values or aggregated statistics (e.g., mean, minimum, or maximum) for each sampling window. In addition, these network protocols typically quantize measurements which affects data precision. Together, these factors ultimately define the dataset’s resolution and precision. The total attenuation, Atot(t), arises from multiple factors such as free-space path loss; scattering, reflection, and diffraction by obstacles (e.g., buildings or terrain) further affect the signal. Atmospheric variables (e.g., humidity, temperature inversions, gaseous absorption) further increase the specific attenuation, and when precipitation is present along the propagation path, hydrometeors add excess attenuation. In Fig. 2b, the influence of several atmospheric phenomena on the expected attenuation (in dB km−1) is illustrated (ITU-R P.838, 2005). While rainfall increasingly dominates overall attenuation at most frequencies,especially at higher bands, a pronounced absorption peak occurs near 60 GHz due to oxygen resonance (Arvas and Alsunaidi, 2019).
Environmental Monitoring with Wireless Links
Power measurements collected from communication links can effectively function as environmental sensors (Messer et al., 2006), leveraging their sensitivity to atmospheric phenomena. Within the OS approach, WCN infrastructure (e.g., CMLs) is repurposed as a cost-effective virtual sensor network for environmental monitoring (Upton et al., 2005; Overeem et al., 2011). Notably, rainfall is the most established application, with efforts worldwide leveraging WCN datasets to retrieve urban-scale and country-wide rainfall fields (Graf et al., 2020; Messer and Gazit, 2016; Overeem, 2023; Chwala and Kunstmann, 2019; Zhang et al., 2023a; Špačková et al., 2021). Beyond rain, wireless communication sensing has been explored for other atmospheric variables. For humidity, CML attenuation shows potential for near-surface humidity retrieval (Rubin et al., 2022), with links near the 22.235 GHz water-vapor line (K-band) exhibiting increased sensitivity to vapor density (Rubin et al., 2023), and at higher frequencies (E-band, 71–86 GHz) paths are typically shorter, yet water-vapor sensitivity per kilometer is higher, making them attractive for humidity sensing (Fencl et al., 2021). Furthermore, CML-based retrievals for additional atmospheric variables represent emerging applications: for air quality, signals respond to stable stratification and inversion layers that can trap pollutants, yielding indirect indicators (David and Gao, 2016). For fog, detection has been shown in analytical and event-based observations and is expected to improve with denser high-frequency deployments (David et al., 2015; Csurgai-Horváth and Bitó, 2010). Still, CML sensing of non-rain phenomena suffers from low SNR and confounding losses (wet-antenna, drift, multipath), coarse quantization, reliance on auxiliary data (e.g., temperature), and path/frequency/height mismatches, so estimates are indirect, uncertain, and often detect only strong events (e.g., dense fog) (Rubin et al., 2022; David et al., 2015). With the rapid development of dense urban deployments and greater use of higher-frequency spectrum with increased atmospheric sensitivity, emerging opportunities arise for urban OS applications – from high-resolution precipitation mapping to rain-cell front tracking (Ostrometzky and Messer, 2024; Janco et al., 2023; Zhang, 2023; Hadar et al., 2020).
The variety of OS dataset sources and methods – including wireless links – has prompted global initiatives to establish a unified reference community and standards. One such effort is the Global Microwave Link Data Collection Initiative (GMDI) (Fencl et al., 2025), established under the COST Action OPENSENSE, which serves a specific role of cataloging microwave-link datasets and harmonizing data formats to facilitate their collection and sharing.
Rain-Induced Attenuation
The k-R relationship describes rain-induced attenuation γ as a function of the rainfall rate R, typically expressed as (ITU-R P.838, 2005; Olsen et al., 1978): γr(R) = k Rα, where k is an attenuation coefficient and α is an exponent that depends on factors such as signal frequency, polarization and the drop-size distribution. The total rain-induced attenuation Ar(t) along the link’s propagation path can then be written as:
Here, γr(R(ℓ,t)) is the local specific attenuation (dB km−1) at rain rate R(ℓ,t), and the integral accumulates the total attenuation along the path. Assuming uniform rainfall along the path, the integral simplifies to a power-law (PL) relation in which the path-averaged rainfall rate and effective link length L govern attenuation – an approximation widely used in radio communications and meteorological estimation. While the link length L is typically taken as the distance from site to site and the coefficients are derived from ITU-R standards (ITU-R P.837, 2017), methods have been proposed to calibrate them, including path-length corrections (Ostrometzky et al., 2016; da Silva Mello and Pontes, 2007; Janco et al., 2022). Specifically, standard models can exhibit larger prediction errors on short paths (≲1 km) (Habi and Messer, 2020; Janco et al., 2023). This limitation is highly relevant for dense urban deployments, such as beyond 5G/6G networks and smart-city infrastructures. This challenge further motivates active research into methods for rainfall retrieval from wireless links and underscores the value of studying datasets in urban topologies, such as the OpenMesh dataset.
2.1.2 NYC Mesh Network
NYC Mesh (NYC Mesh, 2025b) is a community-driven network led by volunteers that builds and maintains a member supported network for internet connectivity in NYC. By deploying nodes on existing urban infrastructure, such as rooftops and balconies, and using a hybrid mesh, it reduces reliance on traditional internet service providers and expands local connectivity, without logging personal data. NYC Mesh is a non-commercial ISP whose participant installations form direct node-to-node links, enabling dynamic routing and resilience. Its backbone connects hubs and supernodes via point-to-point wireless (the focus of this study), while selected supernodes provide fiber uplinks and peering for upstream connectivity. Community members host local services including a node database (MeshDB), network monitoring dashboards (UISP), a community wiki, and a Slack workspace for coordination (NYC Mesh, 2025c, a, b). Wireless coverage is currently concentrated in Brooklyn and Lower Manhattan, with an ongoing expansion to the Upper West Side, Harlem, and the Bronx.
Network Configuration
NYC Mesh employs a three-tiered network architecture that combines mesh principles with a star topology (hub-and-spoke), blending the resilience of a mesh with the simplicity of a star – local nodes connect to nearby hubs, while hubs interlink to maintain redundant, mesh-like connectivity across the network. Figure 3 illustrates this architecture, showing fiber-connected Supernodes in data centers interfacing with internet exchange points and forming a partial mesh with wirelessly interconnected Hubs that serve as intermediate nodes: (i) Supernodes (Tier 1) serving as primary public Internet gateways, typically connected via fiber uplinks; (ii) Hub Nodes (Tier 2) are neighborhood level relay points, spanning basic Omni Hubs, intermediate Sector Hubs, and major Backbone Nodes, that aggregate traffic from multiple rooftop installations; and (iii) Member Nodes (Tier 3) represent the network edge, comprising both standard nodes that maintain direct uplinks to Hubs and “Omni-Only” nodes that rely on short-range mesh connections with nearby neighbors. This is a hybrid topology of fiber optic and wireless links in a distributed architecture that dynamically reroutes traffic, with fiber connections between Supernodes and central Hubs providing more reliable pathways than wireless segments, especially during weather disruptions. Wireless links, which are the core of our dataset, serve two distinct roles in the NYC Mesh network: (i) high-capacity links interconnect major hubs and supernodes to form a partially meshed backhaul, and (ii) access point links, which constitute the network's “last mile,” provide the final hop from a neighborhood hub to individual members in a point-to-multipoint configuration.
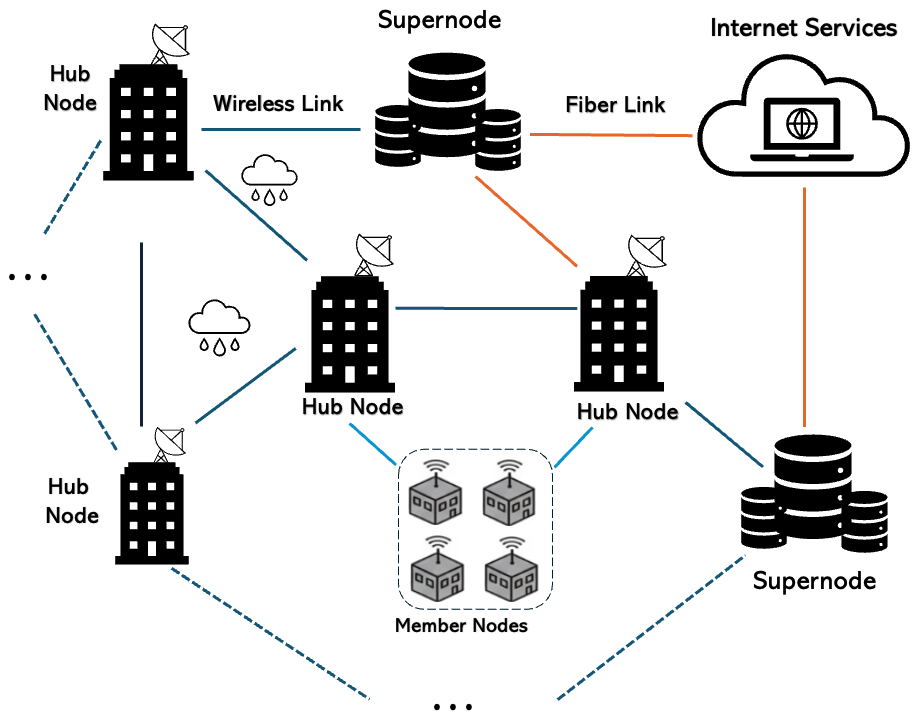
Figure 3NYC Mesh network architecture. This diagram illustrates the network's tiered hybrid topology, which combines wireless and fiber links. It shows how supernodes (Data Centers) connect to the internet via fiber and form a backbone with hubs (Mesh Nodes).
Wireless Hardware and Spectrum Allocation
NYC Mesh employs a wide range of commercial hardware from vendors such as Ubiquiti and MikroTik to build a resilient urban network and uses licensed and unlicensed spectrum bands. NYC Mesh uses available spectrum in multiple bands that balances the trade-offs between different frequency bands. The 5 GHz band is used for reliable, weather-resilient connections; the 24 GHz and unlicensed 60 GHz bands provide gigabit speeds but typically over short distances due to oxygen absorption. The 70 and recently deployed 80 GHz bands are reserved for critical backbone connections with the highest capacity. Figure 4 displays the OpenMesh deployment of the NYC Mesh network in the published dataset. Figure 4a maps OpenMesh links in the Brooklyn area, which presents the core of the NYC Mesh network, color-coded by carrier frequency (5 GHz in blue, 24 GHz in green, 60 GHz in orange, and 70 GHz in red), demonstrating the spectrum diversity of the multi-band deployment across a dense urban area (∼ 10 km2). Unlike traditional CMLs (Fig. 2b), which rely on dedicated telecommunication towers, NYC Mesh leverages existing urban infrastructure, primarily rooftops, as shown in Fig. 4a, with members mounting hardware with clear line of sight. Moreover, NYC Mesh deploys dual-band link configurations for critical hub connections, pairing high-frequency bands with 5 GHz backup links to maintain connectivity during adverse weather conditions, trading bandwidth for link availability.

Figure 4(a) OpenMesh sublinks in the Brooklyn area, color-coded by operating frequency band, with nearby PWS stations. © OpenStreetMap contributors 2025. Distributed under the Open Data Commons Open Database License (ODbL) v1.0. (b) Photographs of NYC Mesh rooftop installations illustrating directional-antenna configurations. Image credit: NYC Mesh (2025c).
Data Collection Pipeline
Wireless link metrics are collected through NYC Mesh's monitoring system, which archives telemetry from network devices. These feeds supply 1 min measurements that comprise the OpenMesh dataset. An API, maintained by NYC Mesh, is reachable from any node within the mesh's private IP space; each device's JSON payload is refreshed every minute, with a timestamp indicating the time of measurement. To fetch from NYC Mesh, we use a fully automated pipeline that runs daily: it queries the NYC Mesh inventory for active devices, fetches link metrics, including signal strength (dBm), capacity, latency, and throughput, to perform standard reliability checks, flagging and retrying failed or incomplete requests before uploading validated records to a cloud database. The pipeline interfaces with MeshDB and UISP monitoring tools, with MeshDB additionally tracking network infrastructure updates such as new node installations and topology changes.
2.1.3 Case Study
The OpenMesh dataset spans a period of eight months (29 October 2023–1 July 2024), with all timestamps in UTC. The dataset comprises two main components:
-
Raw measurements. Time-series data from NYC Mesh wireless links, providing RSL measurements at 1 min time resolution spanning the study period.
-
Metadata. Table describing link physical attributes including identifier, location, carrier frequency, and link length.
Table 1 summarizes the OpenMesh data characteristics that provide open-access RSL measurements for 103 sublinks across 75 hops, all sampled with 1 dBm quantization and vertical polarization. Among these hops, 24 contain 2 or more sublinks: 22 employ bidirectional link pairs for two-way communication between NYC Mesh nodes, and 6 use same direction dual-band configurations pairing two directional links to the same sites. This results in hops in the dataset that contain more than 2 sublinks, as they combine both dual-band and bidirectional configurations.
Table 1Dataset Overview: NYC Mesh Sublinks by Frequency and Weather Stations.
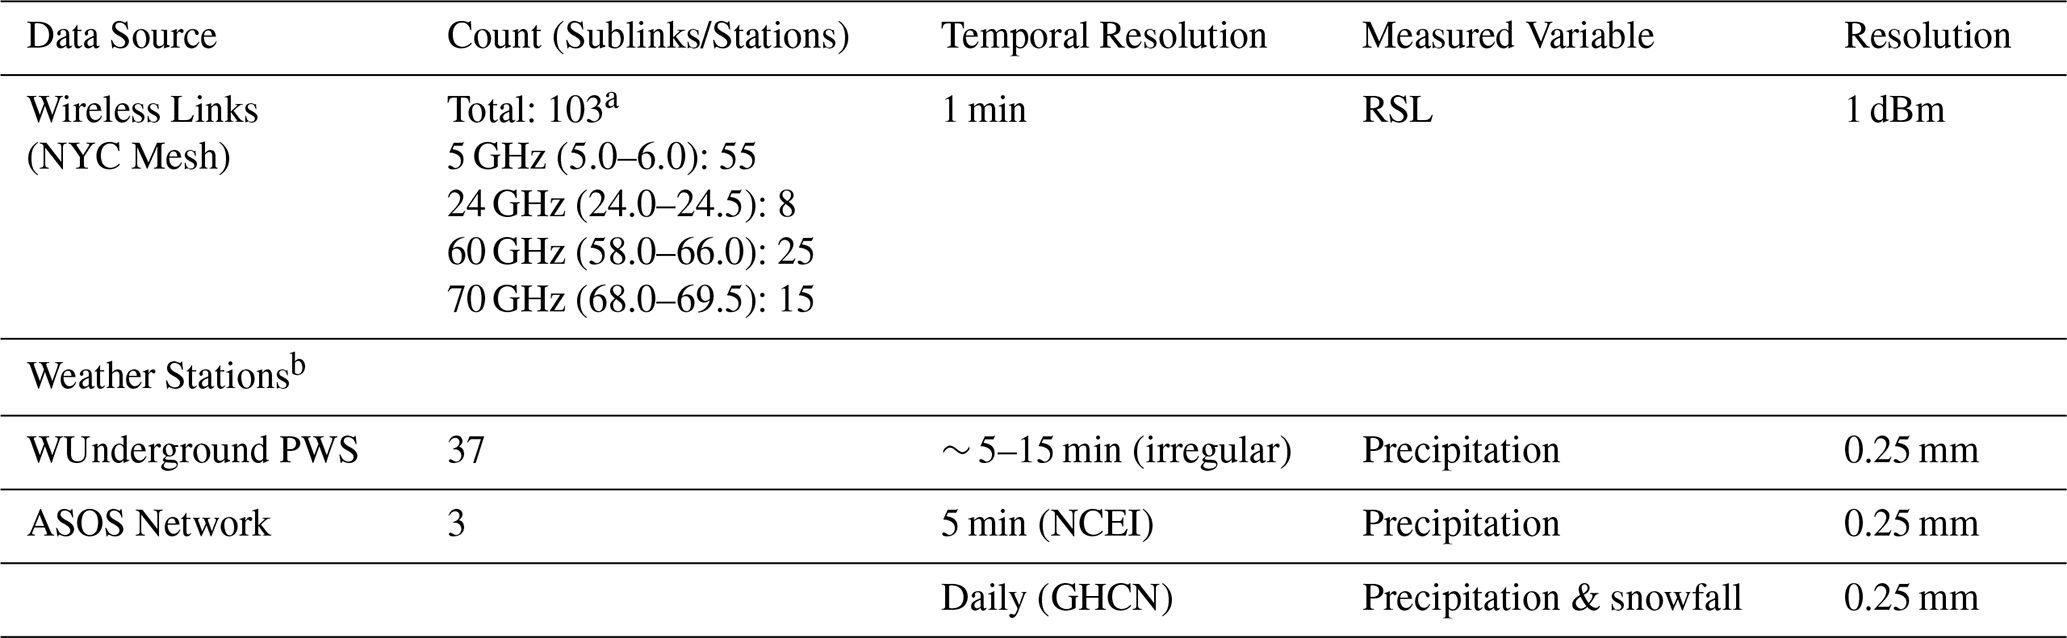
a Among these, 22 employ bidirectional pairs, and 5 use dual-band (24/60/70 GHz + 5 GHz backup) to mitigate rain fade. b Weather station data include additional meteorological variables such as temperature, humidity, wind speed and direction, air pressure.
Subnetwork Data Selection
The OpenMesh dataset is a curated subset of the broader NYC Mesh network, encompassing several hundred wireless links and continuously expanding. Figure 5 depicts carrier frequencies and path lengths (transmitter–receiver distances), highlighting the published OpenMesh sublinks within all active NYC Mesh wireless links. The released dataset comprises links selected according to these criteria: (i) Data completeness and continuity: As a community-run, evolving network, NYC Mesh is dynamic, where links are added and reconfigured over time. We prioritized links with stable logging and fewer gaps across the study window, excluding data streams with substantial outages or irregular sampling. (ii) Representativeness and relevance: To preserve weather-sensing relevance, we selected sublinks across multiple bands, prioritizing higher frequencies. These include V-band links, covering both the oxygen resonance range (∼ 60 GHz band), typically avoided in commercial backhaul due to high attenuation, and upper V-band frequencies (e.g., 69 GHz). We also selected for diversity in link lengths and included co-located dual-band pairs, offering frequency-dependent comparisons along identical paths that are rarely available in existing open microwave link datasets. Conversely, we de-prioritized very short 5 GHz links, which represent a large fraction of the network but contribute little atmospheric signal.
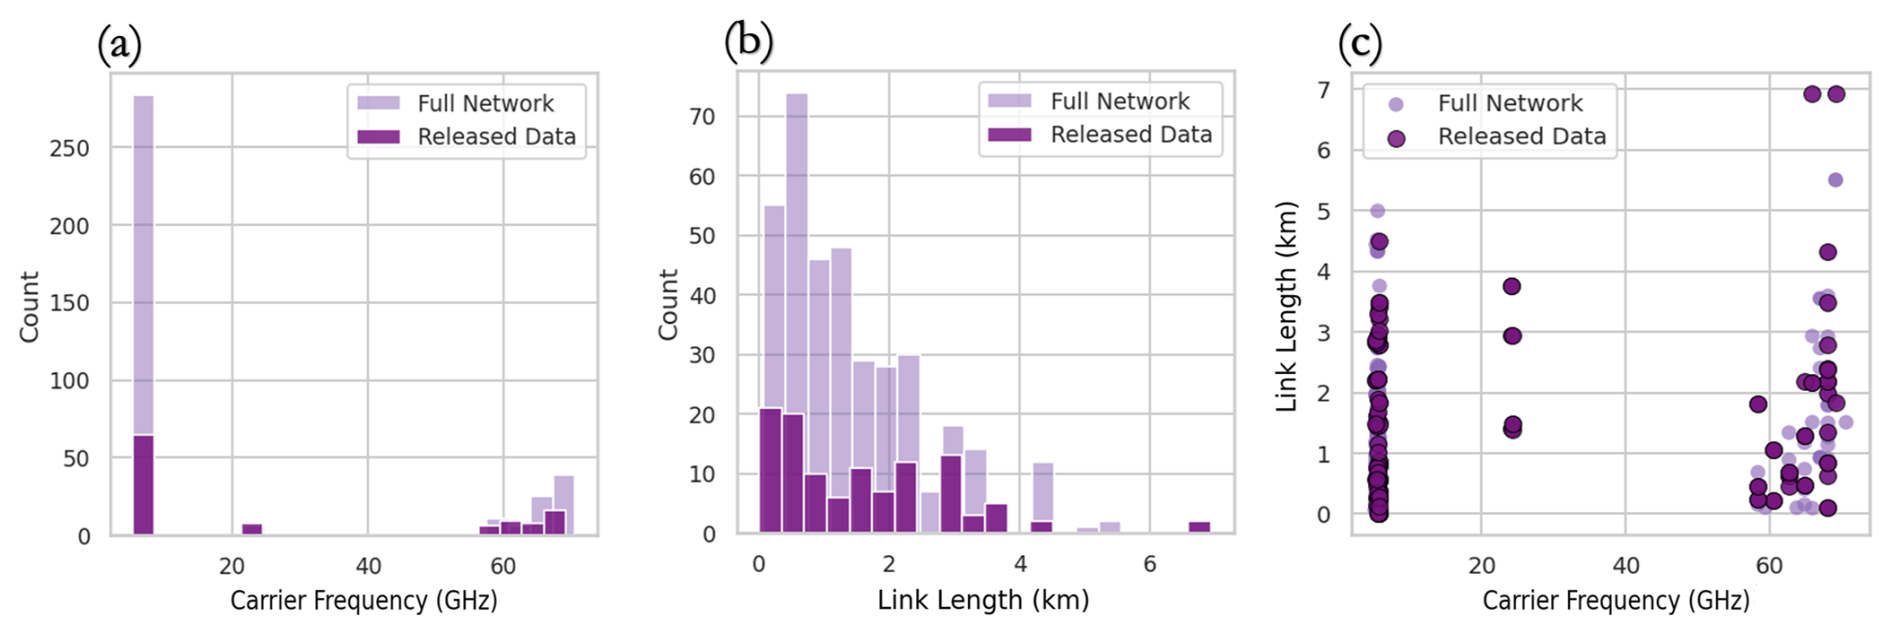
Figure 5Feature distributions of OpenMesh dataset: sublink lengths range in kilometers (km) and carrier frequencies (GHz). (a) Carrier-frequency histogram; (b) sublink-length histogram; (c) sublink length versus carrier frequency scatter.
Data Specifications and Preprocessing
Missing data appear as gaps caused by link outages, which can arise from hardware failures or due to strong weather attenuation. All such intervals are encoded as NaN in the raw RSL series and aligned to a unified 1 min sampling grid. Two notable missing-data windows are present: (i) Late startup: about 30 % of sublinks began data collection on 7 November, leaving an initial gap of 10 d after the nominal start date; and (ii) Hardware outage: during the first week of March, the NYC Mesh data collection system experienced a hardware failure lasting one week, resulting in missing or corrupted samples. NYC Mesh devices typically record RSL at 56 or 64 s intervals, with occasional missing samples or transmission errors. To ensure consistency in the published data with unified time stamps for all raw measurements: (i) Time series were resampled to a fixed 1 min interval to provide consistent temporal resolution across all data. Minor gaps (up to two minutes) were linearly interpolated to maintain continuity due to irregular time sampling, while longer sampling gaps remained as missing data and were filled with NaN.
2.2 Meteorological Data
We use meteorological data from ground-based sensors in NYC, which includes data from official WS of NOAA and data from a dense network of PWS, summarized in Table 1. WS record meteorological variables in specific locations using dedicated sensors such as thermometers (temperature), hygrometers (humidity), barometers (pressure), anemometers (wind speed and direction), and RGs for precipitation. Official WS often follow standardized protocols and guidelines from organizations like the World Meteorological Organization (WMO), ensuring consistency and comparability across different measurement systems. As a result, they provide reliable, quality-controlled data for forecasting, climate analysis, and calibrating other sensors. In the United States, for example, the primary network of official stations is the ASOS, co-managed by National Oceanic and Atmospheric Administration (NOAA) and National Weather Service (NWS) and other agencies, providing critical data for weather analysis and aviation safety. However, dedicated official stations often have sparse spatial distributions, making them insufficient to capture hyperlocal climate variability, especially in dense urban environments (Schilling, 1991; Cristiano et al., 2017). This gap has motivated the use of opportunistic data sources such as crowdsourced PWS to supplement official networks (Hahn et al., 2022; de Vos et al., 2019).
2.2.1 Personal Weather Stations
PWS, deployed by individuals or local organizations typically with low-cost instruments, collect localized meteorological data. They fill observational gaps in urban areas where official WS coverage is limited, providing near real-time data critical for capturing rapidly changing conditions. Key applications include urban climate research, urban hydrology, and potentially weather prediction model improvement through data assimilation and model bias correction (Bárdossy et al., 2021; Brousse et al., 2023). PWS have become increasingly popular for collecting precipitation data, with observations shared in real-time through online platforms such as WUnderground, Netatmo, WOW, and Weathercloud that provide access to dense international networks; however, commercial platform ownership creates third-party dependencies and uncertainties in data processing for scientific use (Fencl et al., 2024). The major drawback of PWS data is their reliability: quality can vary greatly, with common problems including faulty zeros, missing data, and bias, often stemming from non-standardized, user-operated installations and inadequate maintenance. Moreover, PWS typically use unheated tipping bucket rain gauges, which limits their utility to liquid precipitation and reduces accuracy during snow or frozen events compared to heated standard gauges. Therefore, automated Quality Control (QC) is a critical step to filter out erroneous measurements before the data is used. For precipitation, initial QC methodologies focus on detecting errors like faulty zeros and outliers through spatial consistency checks with neighboring stations (de Vos et al., 2019; El Hachem et al., 2024). This is often followed by a separate post-processing step, such as bias correction against reference gauge and radar products, to address the systematic errors. While data quality varies, PWS networks provide complementary local observations, with recent open-source QC algorithms (Consortium, 2025) and ongoing standardization efforts expanding their usability.
Weather Underground
WUnderground (Weather Underground, 2025) hosts an extensive global PWS network, currently exceeding 250 000 stations, with more than 180 000 located in the United States. The online platform aggregates real-time weather observations, forecasts, and historical records from these stations, providing users with hyperlocal forecasts, data visualizations, and other tools through its website and mobile applications. This study uses WUnderground PWS data to obtain temporally aligned weather records with OpenMesh network performance metrics, enabling examination of how meteorological conditions influence wireless signals in the NYC area. PWS in the WUnderground network typically use a self-emptying tipping bucket design, often capturing rainfall in increments of 0.25 mm. Standard, unheated PWS devices often fail to differentiate precipitation types and may lead to delayed or underreported data for non-liquid forms (snow, hail). As a result, snow or frozen-precipitation measurements may be incomplete or imprecise. We highlight these constraints in our study and emphasize the need for data validation when analyzing precipitation-related processes. Although precipitation is our primary focus, WUnderground PWS typically measure additional variables including temperature, humidity, wind, pressure, and often solar radiation, with derived quantities such as dew point.
2.2.2 Precipitation Measurements
This study primarily focuses on precipitation data, combining observations from standard WS and PWS across NYC. We leverage meteorological data from two main sources: WUnderground, offering a dense PWS network with broad spatial coverage and high sampling rates, and the NOAA, which provides officially QC measurements. We categorize two types of stations used in this study:
-
PWS (WUnderground). Data from a total of 37 PWS distributed across Brooklyn and Manhattan provide detailed meteorological variables, including precipitation measurements. We sourced PWS data via the WUnderground API; stations generally report at 5 min intervals, with observations available in near real time. Reporting times can be irregular and are not necessarily synchronized across stations, so timestamps may differ between PWS records. The WUnderground PWS network includes only basic automated quality checks, and measurements are not as rigorously controlled as those from professional stations. Nevertheless, their fine-grained temporal and spatial coverage enables analysis of urban meteorological processes at the micro-scale, supporting correlation with NYC Mesh link measurements and exploration of local weather impacts on communication links.
-
ASOS Network Observations. We utilize observations from three key ASOS stations in the NYC area: the FAA-owned sites at John F. Kennedy (KJFK) and LaGuardia (KLGA) airports, and the NWS-owned station in Central Park (KNYC). The ASOS network is operated jointly by NOAA's NWS, the FAA, and the Department of Defense (DoD). All three stations provide standardized, continuous data; the airport sites are positioned primarily to support aviation safety, while the Central Park station provides a climatological baseline from an urban park setting. Data from the ASOS network is officially archived by NOAA's NCEI (NOAA National Weather Service et al., 2005), which processes the continuous observations into distinct datasets which were employed in this study:
- –
Minute-scale observations. ASOS data at minute resolution, covering precipitation type, visibility, temperature, dew point, humidity, wind, and pressure, serve as our regional reference for the evolution of weather events. ASOS/AWOS data were obtained via the NCEI Data Access Application, which ingests official NOAA/NCEI archives and provides data exports at multiple time aggregations. These operational records receive automated checks but are not subject to the comprehensive, dataset-wide quality assurance applied to daily climatological archives.
- –
Daily Summaries (GHCN). Historical daily summaries from JFK, LGA, and Central Park are obtained through NOAA via the Global Historical Climatology Network (GHCN) database. These daily records provide separate values for total liquid-equivalent precipitation (which includes rainfall and melted frozen precipitation), new snowfall (the depth of what fell in the previous 24 h), and the total snow depth on the ground. GHCN-Daily aggregates observations from ASOS and other station networks, applies comprehensive quality assurance, and produces QC’d daily totals that we use as our baseline for day-scale validation.
- –
This section presents representative examples from the dataset, illustrating its quality and applicability for environmental monitoring. We first outline the methods used in this analysis, then provide an overview of descriptive statistics for the OpenMesh dataset. We then present unique features, illustrated through weather-signal relationships and cases from the study period.
3.1 Methods
3.1.1 Path-Averaged Attenuation
Let L (km) denote the link length, i.e., the distance between the transmitter and receiver. The path-averaged attenuation is defined by normalizing the total measured attenuation above the baseline by L:
where ΔA(t) is the total measured attenuation at time t. Specifically, the total attenuation A(t) along the path represents the cumulative effects experienced by the signal along its propagation path. Here, we simplify these accumulated effects by letting the effective link length Leff approximate the direct distance L, thereby facilitating statistical comparisons among links by minimizing distance-dependent biases.
3.1.2 Baseline Reduction
Our dataset comprises RSL measurements, from which we derive attenuation metrics. To quantify the added attenuation beyond baseline conditions, we define , where RSL(t) is the measured power at time t and RSLbaseline(t) denotes the nominal dry-weather signal level. We use a dynamic baseline approach (Ostrometzky and Messer, 2017) to determine the baseline level by using 12 h windows of past measurements.
3.1.3 Pairing Link-PWS Data
In our analysis, we paired signal measurements from sublinks with precipitation collected by nearby PWS. Each sublink is paired with spatially averaged PWS rainfall measurements from stations located within 3 km distance.
3.1.4 Aggregated Statistics
To capture both short-term fluctuations and longer-term rainfall trends, we aggregate meteorological and attenuation data over different time intervals. Instantaneous measurements at time t refer to the native sensor temporal scales (e.g., 1 min for signal measurements and 5 min for PWS data). We define ΔAm(t) as the attenuation averaged over an m-min interval ending at t. For example, we use 15 min ΔA15(t) and 60 min ΔA60(t) aggregations to reflect different insights into observed patterns. Similarly, we define σm(t) as the corresponding standard deviation (STD) of the signal within the m-min window, which can be used to quantify signal variability and has been suggested for rainfall detection (Schleiss and Berne, 2010).
3.2 Dataset Characteristics
3.2.1 Data Quality and Assessment
Figure 6 provides a histogram of data availability after preprocessing, showing the percentage of valid records relative to the total possible measurements over the study period. Most published sublinks and PWS achieved around ∼ 90 % or higher availability, with mean availabilities of 88.9 % and 88.7 %. Data availability accounts for all sources of missing data over the study period, marked by NaN values. For OpenMesh sublinks, missing data is categorized into three main categories: (i) Known system events (detailed in Sect. 2.1.3): delayed startup and week-long outage in early March; (ii) Operational issues: sporadic link outages from hardware failures or mid-period shutdowns; (iii) Environmental causes: external signal blockages or weather-induced attenuation (the focus of this study), where RSL drops below detectable levels. Despite these gaps, most OpenMesh sublinks maintain high availability, with 92 sublinks achieving above 80 % coverage (including 58 sublinks above 90 %). For PWS, availability is computed for precipitation measurements at each station's sampling interval (5 min for 34 stations, 15 min for 3 stations). The majority of PWS stations (28 of 37) achieve above 80 % availability, with 21 stations exceeding 90 % coverage.
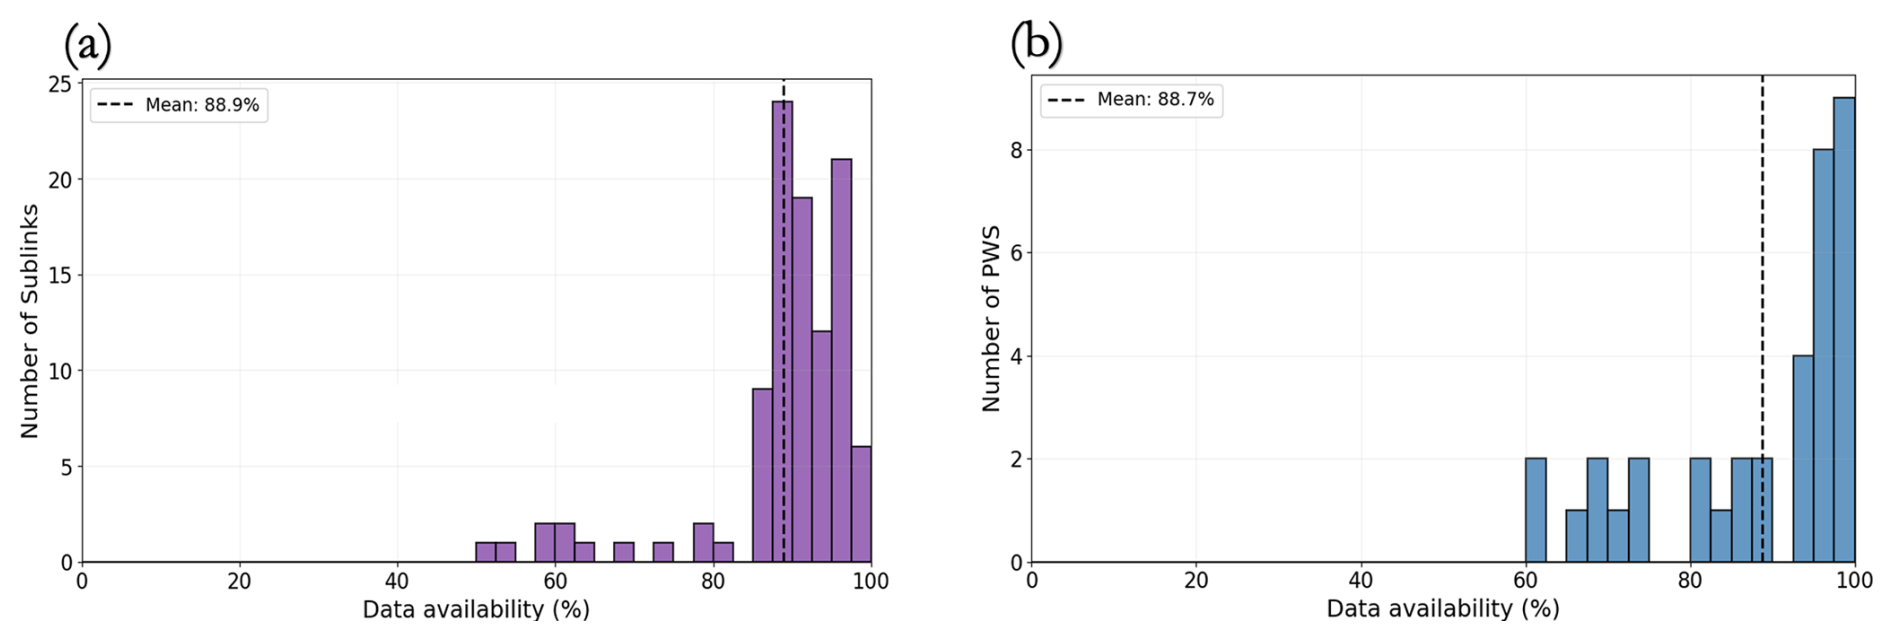
Figure 6Data availability distribution for (a) NYC Mesh sublinks and (b) WUnderground PWS during the study period. Histograms show the number of sensors at each availability percentage, calculated as valid measurements relative to total possible records.
3.2.2 RSL Statistics
Figures 7 and 8 characterize RSL properties and baseline variability in the dataset. Figure 7a shows the distribution of median RSL across sublinks, concentrated around −60 dBm and ranging from −80 to −35 dBm due to variations in transmitted power, path length, antenna configuration, and operating frequency. The median RSL represents the nominal dry-weather signal level for each sublink and serves as a simple static baseline for rain-induced attenuation estimation. Figure 7b shows the distribution of all RSL measurements (logarithmic scale), ranging from −20 to −96 dBm, with lower RSL values being more susceptible to outages that can occur during heavy rain events. Figure 8 assesses the dynamic baseline's stability, which is a prerequisite for accurate rain estimation. Figure 8a–b quantify this stability by showing the distributions of the baseline's STD and robust range (5–95 percentile), which are calculated using a 12 h window. Most sublinks exhibit a STD of less than 3 dB and a robust range of less than 5 dB, indicating the baseline is stable in most cases. High STD values can indicate non-rain attenuation from factors like atmospheric absorption or other RSL drifts and changes. Figure 8c exemplifies such an event, where the corresponding baseline (red) tracks a sudden ∼ 5 dB RSL drop around 13 May and remains low, distinguishing it from the normal, smaller-scale deviations during the series. These results are particularly relevant for the OpenMesh dataset, which contains 60 GHz links that may cause more significant dry-weather attenuation and that lack TSL values, implying that, more processing may be needed for reliable rainfall estimation.
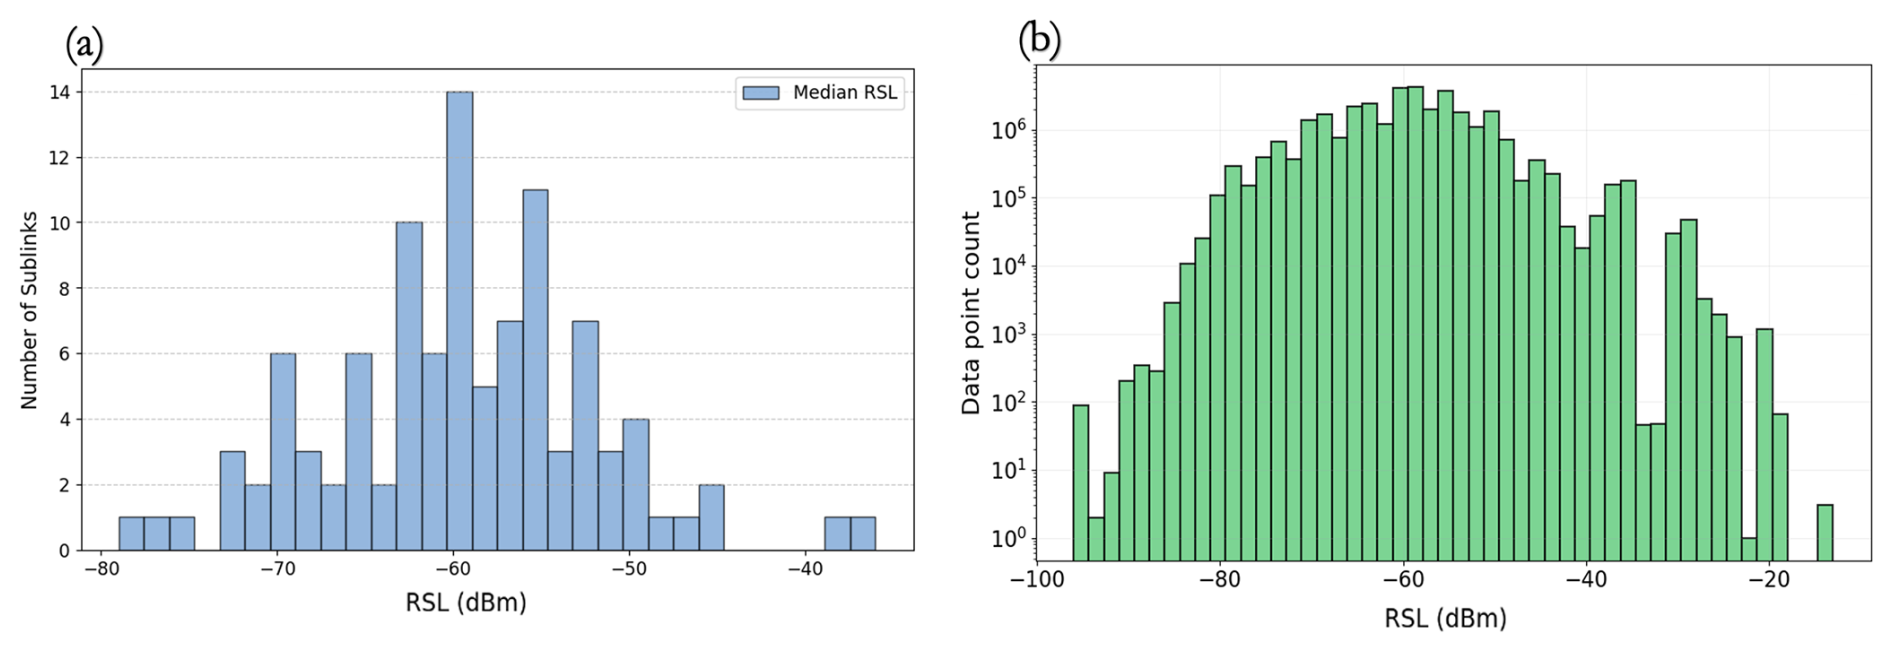
Figure 7RSL characteristics. (a) Distribution of median baseline values. (b) Distribution of all RSL measurements in logarithmic scale.
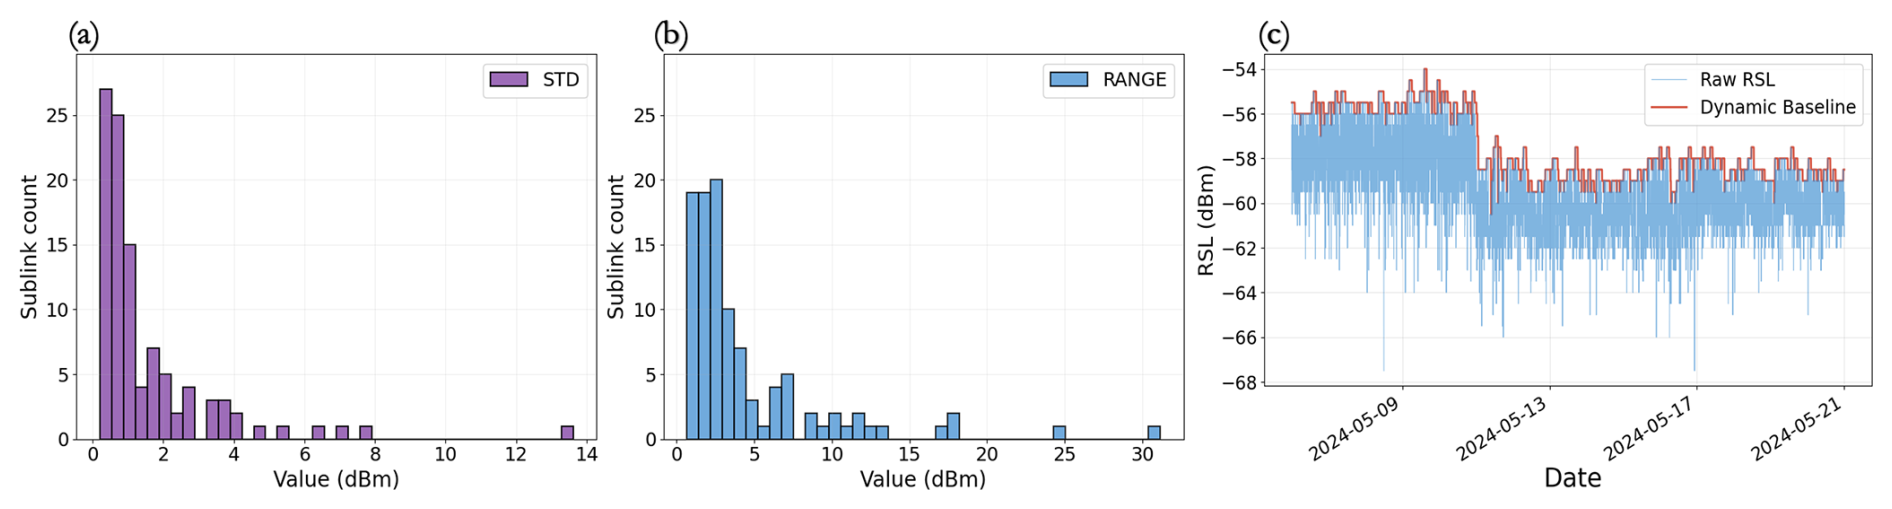
Figure 8Estimated dynamic baseline characteristics. (a) Distribution of STD across all sublinks. (b) Distribution of the range (5–95 percentile) across all sublinks. (c) Example showing baseline tracking the raw RSL (link id = 9) with a sudden baseline level shift.
3.2.3 Cumulative Rainfall Data
Figure 9 presents the cumulative rainfall from the PWS and ASOS networks over the study period. Figure 9a displays all PWS stations with available data, categorized by total accumulation. The lowest group (<400 mm) shows notable gaps and flat periods, which are due to missing data or equipment issues rather than a true absence of rain. Figure 9b compares the cumulative rainfall from the GHCN-Daily ASOS stations with the mean and median of the PWS network, omitting the low-availability group (<400 mm). This comparison shows that the PWS and ASOS networks capture similar overall trends and accumulation totals of 850 to 900 mm. Although individual PWS stations exhibit high variability and data gaps, the network’s high spatial density is a valuable asset that encourages the future application of QC methods to further refine these rainfall estimates.
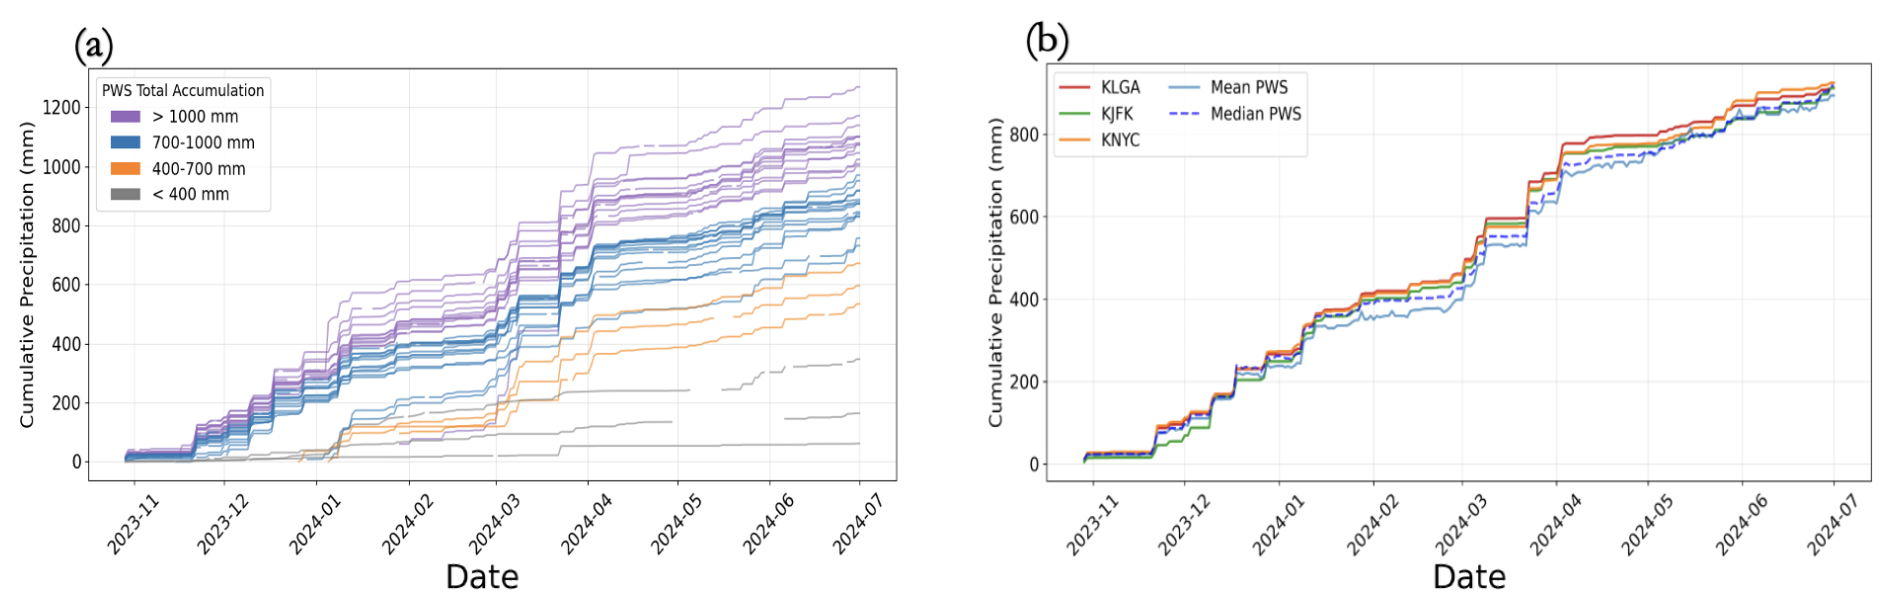
Figure 9Cumulative precipitation over the study period: (a) individual WU PWS stations color-coded by total accumulation and (b) ASOS stations compared with PWS mean and median.
3.3 Precipitation and Link Attenuation
A strong, inverse relationship exists between precipitation intensity and RSL, which is evident even in the OpenMesh dataset.
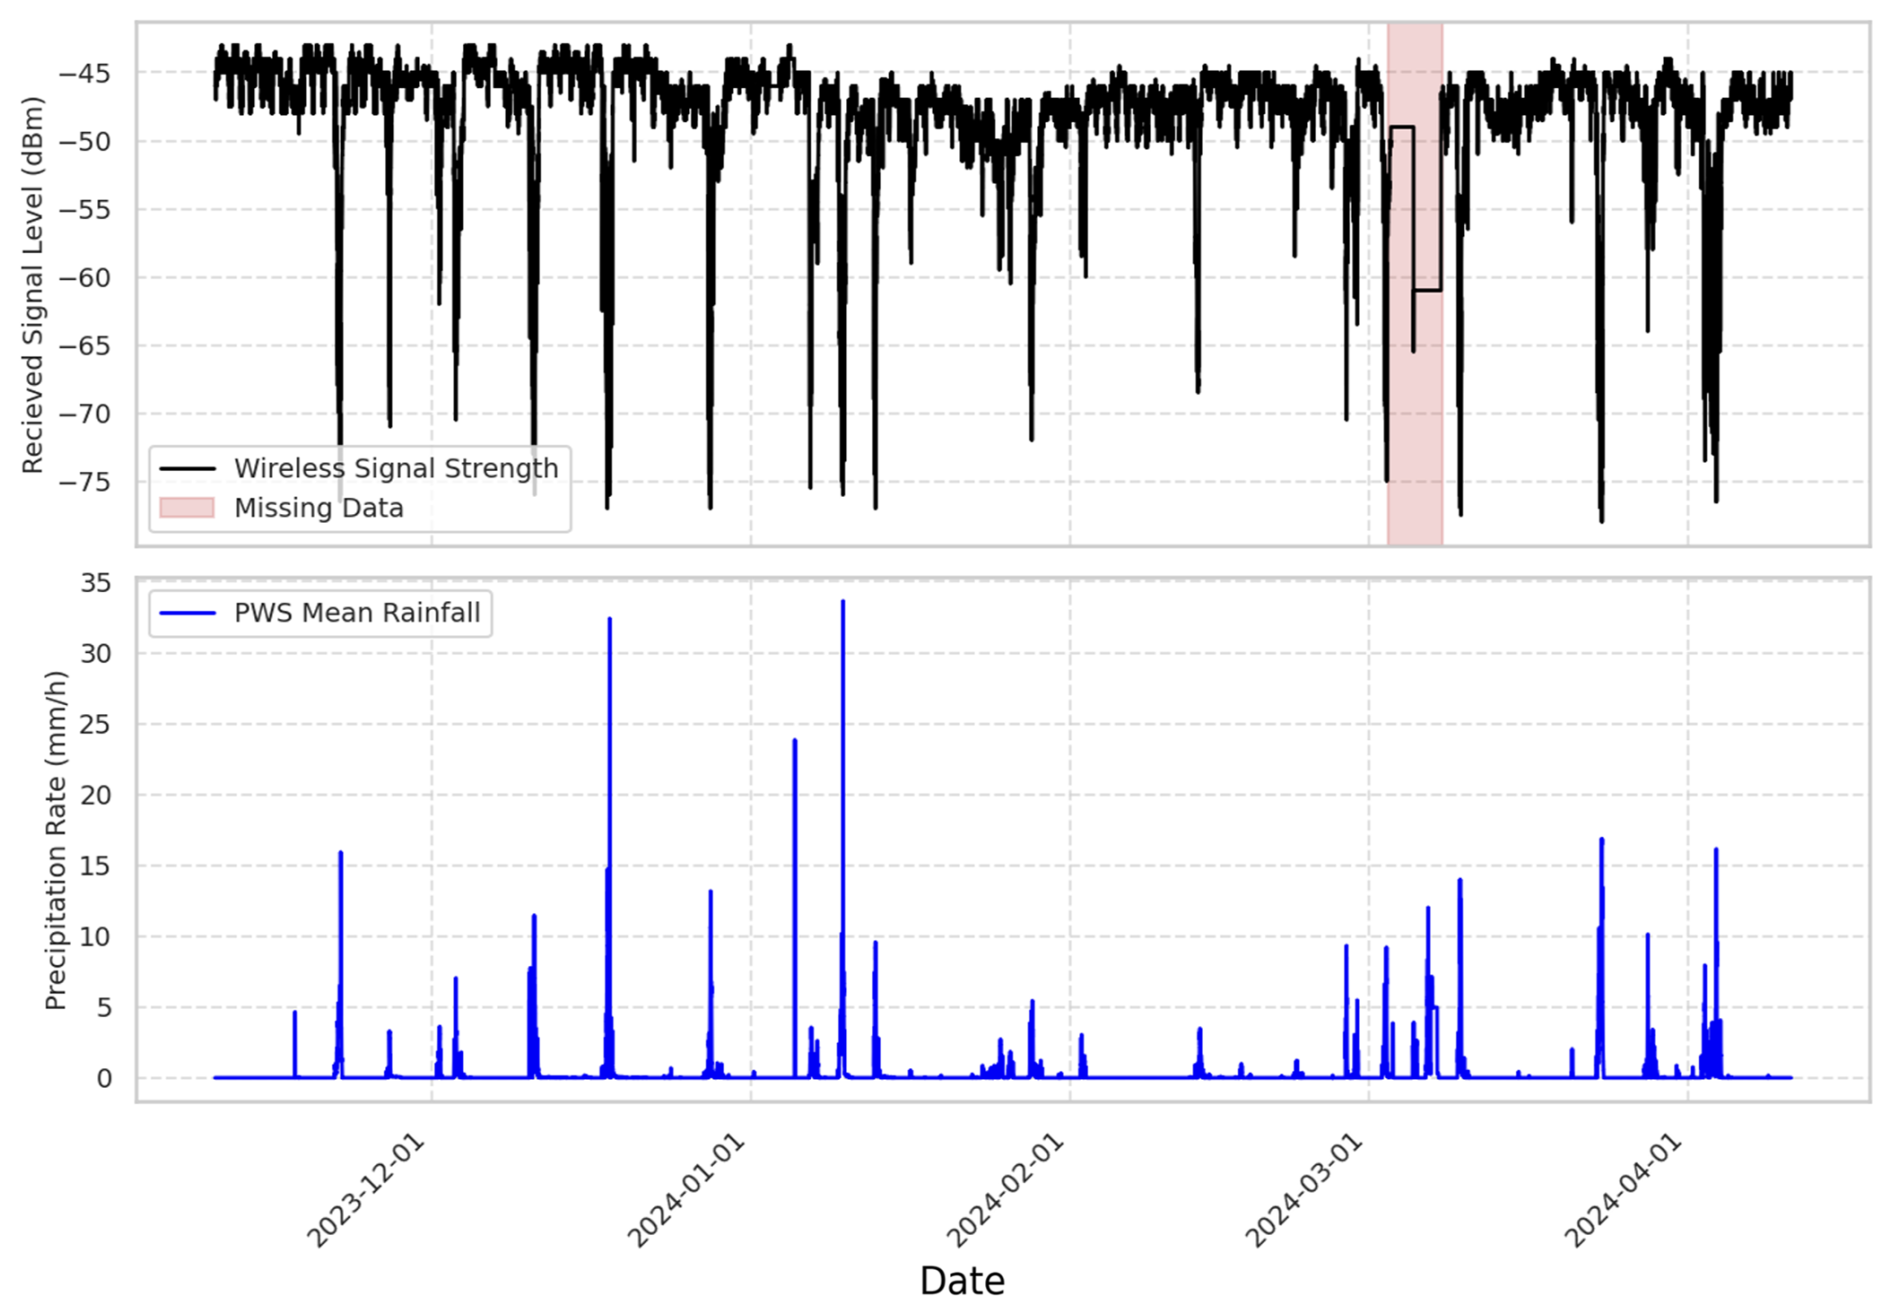
Figure 10RSL measurements (dBm) of a 69.1 GHz NYC Mesh (link id = 22) alongside the mean precipitation rate (mm h−1) recorded by a nearby PWS throughout a five-month study period.
As an example, Fig. 10 shows five months of data (10 November 2023–10 April 2024): RSL measurements (dBm) from a 69 GHz, 1.8 km sublink plotted against mean precipitation recorded by the nearby, corresponding PWS, paired to the link. Peaks in precipitation rate (mm h−1) coincide with sharp RSL drops, confirming this strong inverse relationship between precipitation intensity and signal strength. The shaded interval marks an NYC Mesh outage that produced a data gap (see Sect. 2.1.3).
3.3.1 Attenuation Across Frequency Bands
Different frequency bands inherently experience varying attenuation characteristics, so we analyze multiple bands in the NYC Mesh sublinks to capture these differences. The OpenMesh dataset allows for this analysis, as it contains sublinks from four distinct frequency bands (5, 24, 60, and 70 GHz) co-located within the same urban environment.
Figure 11 details the trends between precipitation, carrier frequency, and attenuation. For a fair comparison we show attenuation statistics for links of a similar length and normalized values.
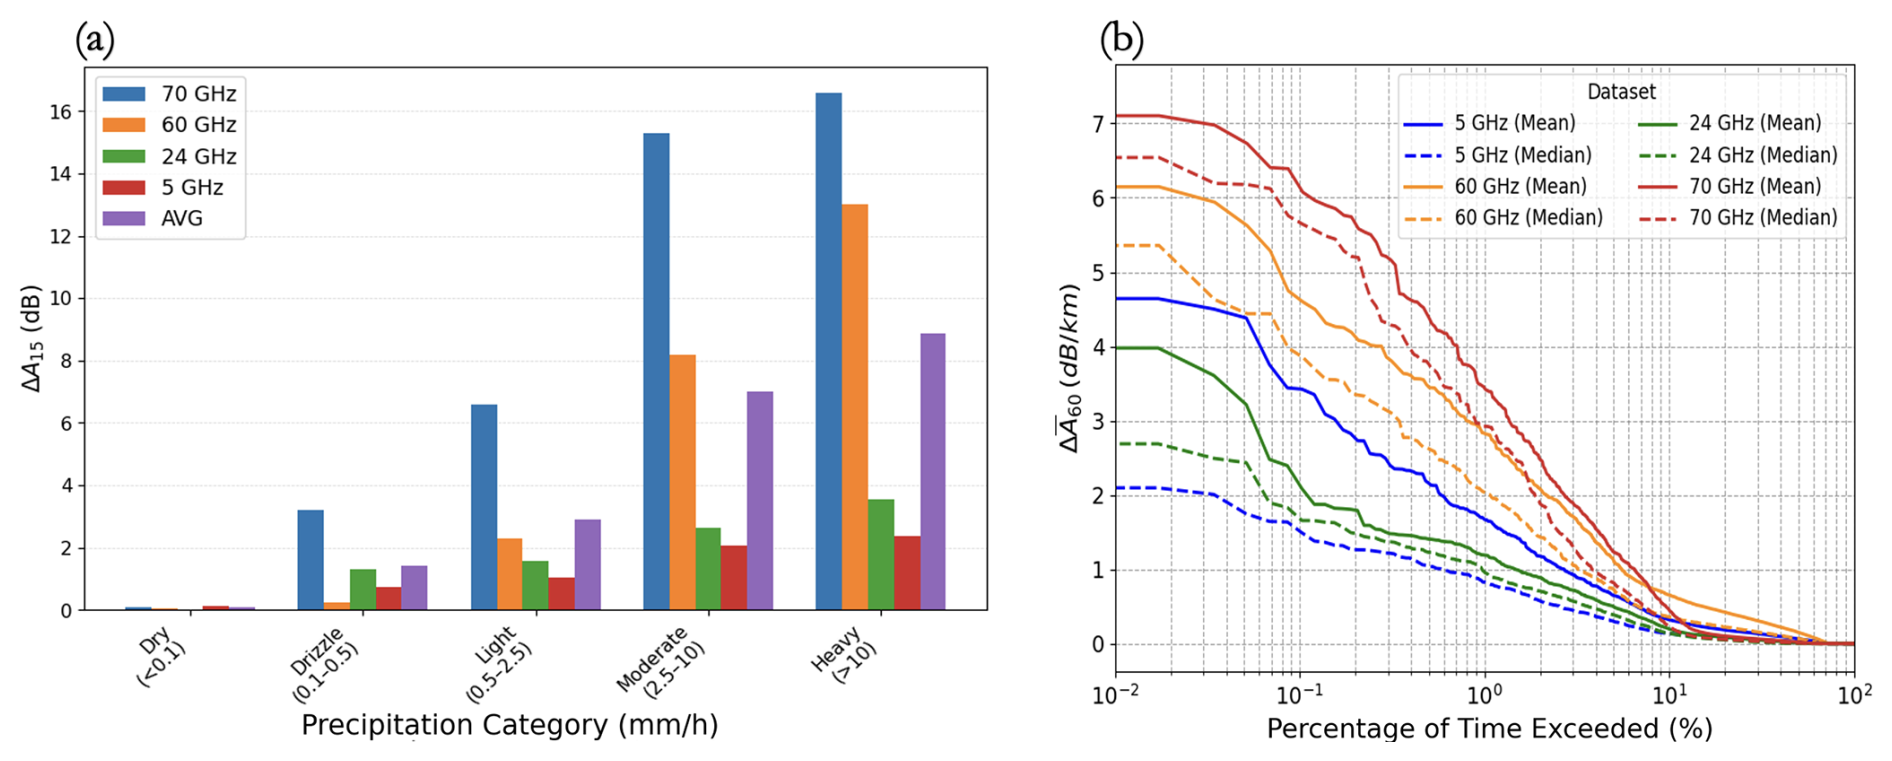
Figure 11Attenuation patterns across frequencies over the study period. (a) Attenuation for a 1.5 km sublink per frequency band, grouped by precipitation intensity (World Meteorological Organization, 2018). (b) Exceedance probability plots. The x axis shows the percentage of samples that exceed the y axis value of hourly aggregated attenuation across all sublinks, grouped by carrier frequency.
Figure 11a provides an example comparing sublinks of approximately 1.5 km in length, plotting the 15 min attenuation (ΔA15) against WMO-defined precipitation categories (World Meteorological Organization, 2018), which are determined by the mean of paired PWS data. A clear and expected trend emerges: attenuation increases significantly with both precipitation intensity and carrier frequency. Specifically, the 60 and 70 GHz bands show stronger attenuation during moderate to heavy rain compared to the 5 and 24 GHz bands. Figure 11b shows the Complementary Cumulative Distribution Function (CCDF) of hourly aggregated statistics (mean and median) of path-normalized attenuation . The plot highlights the percentage of time each attenuation threshold is surpassed. Notably, the 5 GHz mean attenuation appears to exceed the 24 GHz band, an artifact that can be attributed to normalization effects from short sublinks, which artificially increase the normalized attenuation. Moreover, this band's large size (55 sublinks) provides broader temporal and spatial coverage.
Dual-band Demonstration
Figure 12 shows a three-day interval (22–24 March) of a dual-band link from the City College of New York to a northern endpoint in Harlem, illustrating RSL attenuation across frequency bands under identical rain conditions as measured by a co-located PWS. This channel consists of two sublinks operating at a high frequency (69 GHz) and a low frequency (5.7 GHz), respectively, which follow similar paths and experience the same weather conditions yet display markedly different attenuation levels. During this period, heavy rainfall was recorded on 23 March, corresponding to substantial attenuation in both sublinks. At the peak of the rain event, the 69 GHz sublink undergoes nearly 30 dB of additional path loss – enough to cause sublink outage, while the 5.7 GHz sublink incurs only around 5 dB of loss.
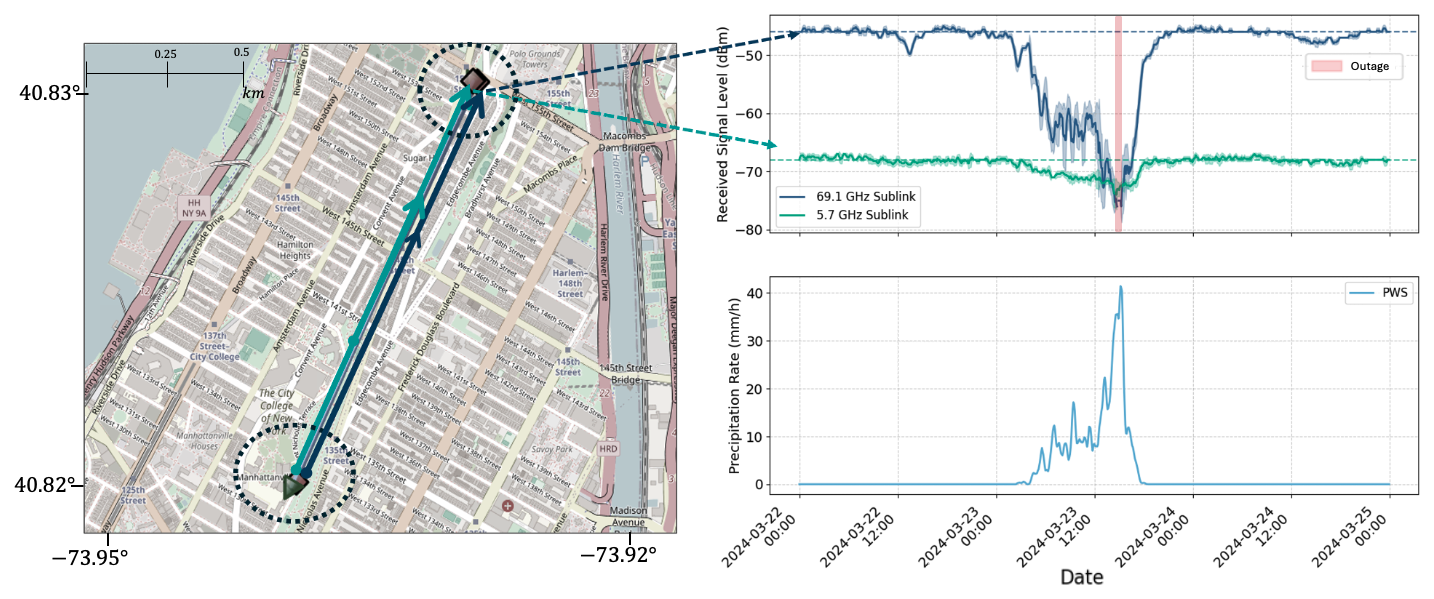
Figure 12Dual-Band Link Demonstration: The sublink at 69 GHz (blue) experiences larger attenuation than the 5.7 GHz (green) channel, as shown by the upper-right RSL plot. The lower-right plot displays average precipitation rates recorded by nearby PWS. © OpenStreetMap contributors 2025. Distributed under the Open Data Commons Open Database License (ODbL) v1.0.
3.4 Opportunistic Precipitation Sensing with OpenMesh
Here, we demonstrate the applicability of OpenMesh for opportunistic precipitation sensing, illustrating how wireless link measurements, cross-referenced with local PWS data, capture rainfall events and winter snowstorms across the study period.
3.4.1 Link-Based Rain Detection
We adopt the rolling (STD) method (Schleiss and Berne, 2010), applying a 30 min window to flag significant RSL fluctuations indicative of rain-induced attenuation using a 70 GHz band NYC Mesh sublink spanning 6.9 km. Figure 13 shows a continuous record for June 2024, comparing sublink measurements with the average rainfall intensity from paired PWS stations. The top plot shows the RSL (black line); the middle plot displays its 30 min rolling STD,σ30, (purple line); and the bottom plot indicates PWS-derived rain-intensity categories (drizzle to heavy (World Meteorological Organization, 2018), shown in Fig. 11). Red bars mark “wet” intervals based on the rolling-STD threshold. Overall, wet flags align well with periods of higher PWS rainfall intensities, especially during intense events. Still, some periods of inconsistencies arise, including false alarms and missed detection periods, suggesting that additional preprocessing and alignment are needed when using and comparing opportunistic sensors.
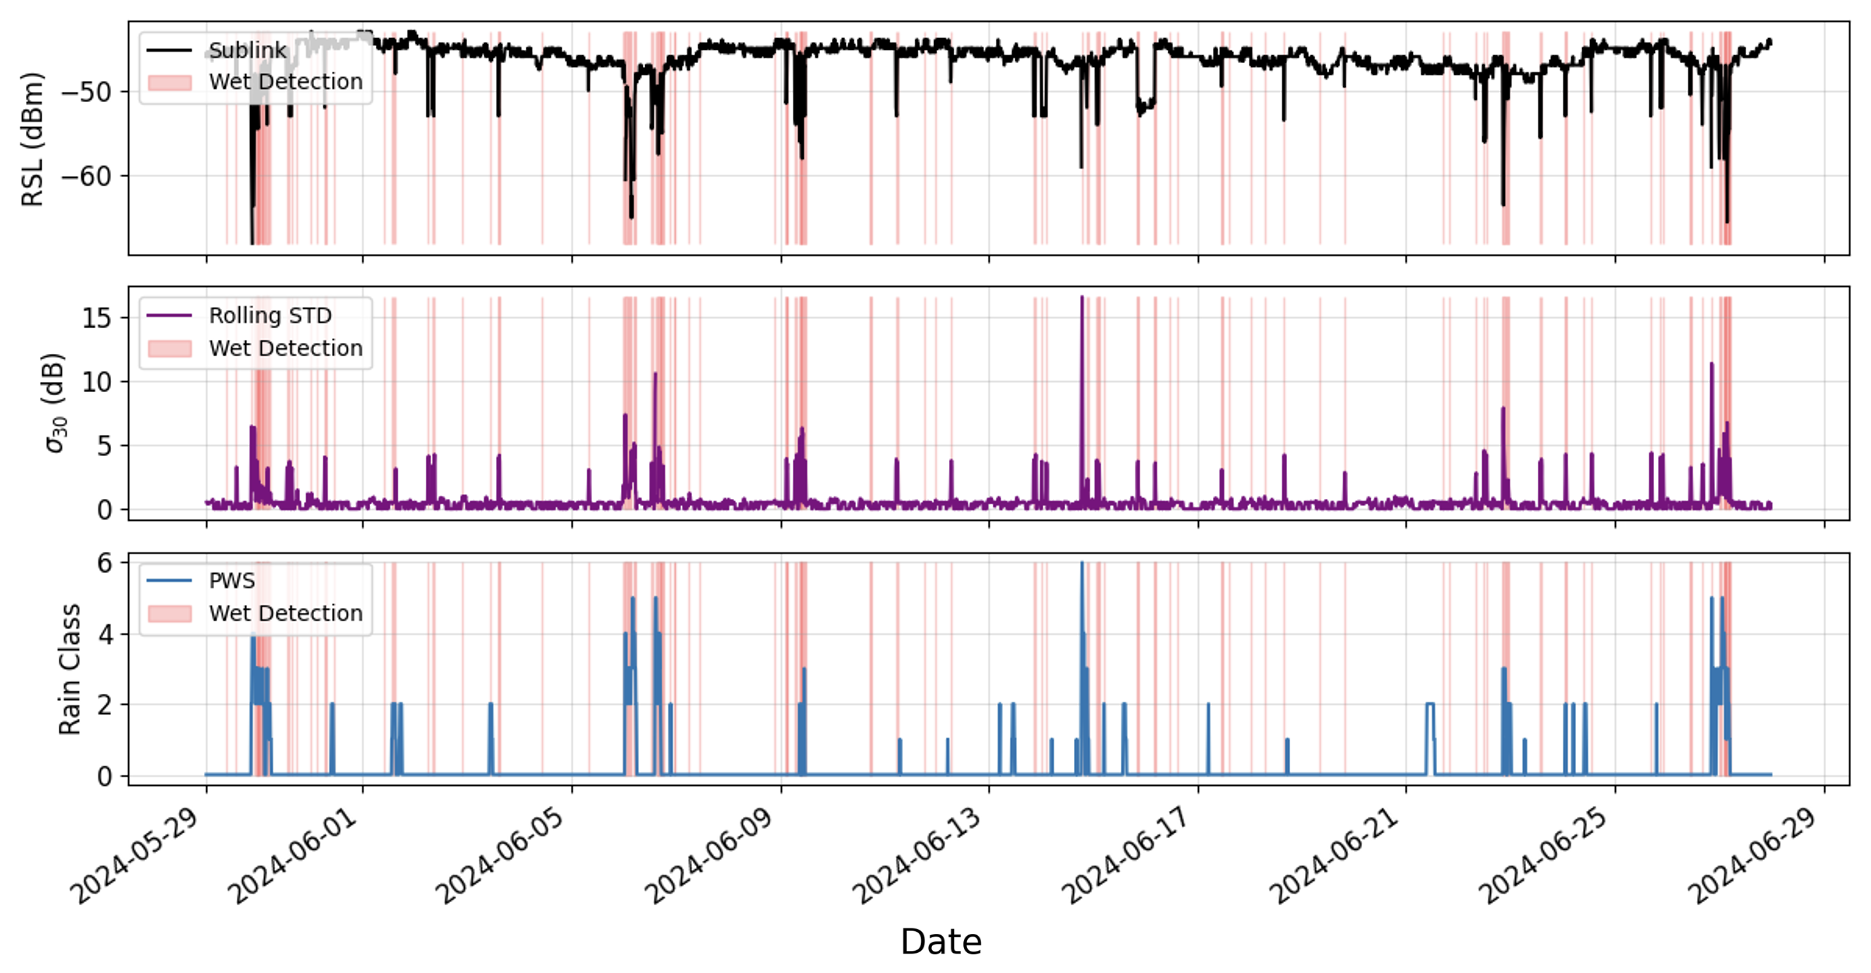
Figure 13One-month sublink sample illustrating RSL (top), rolling STD (middle), and PWS-based rain intensity categories (World Meteorological Organization, 2018) (bottom). Red intervals indicate wet detections where the STD exceeds the detection threshold.
3.4.2 Snowfall Events
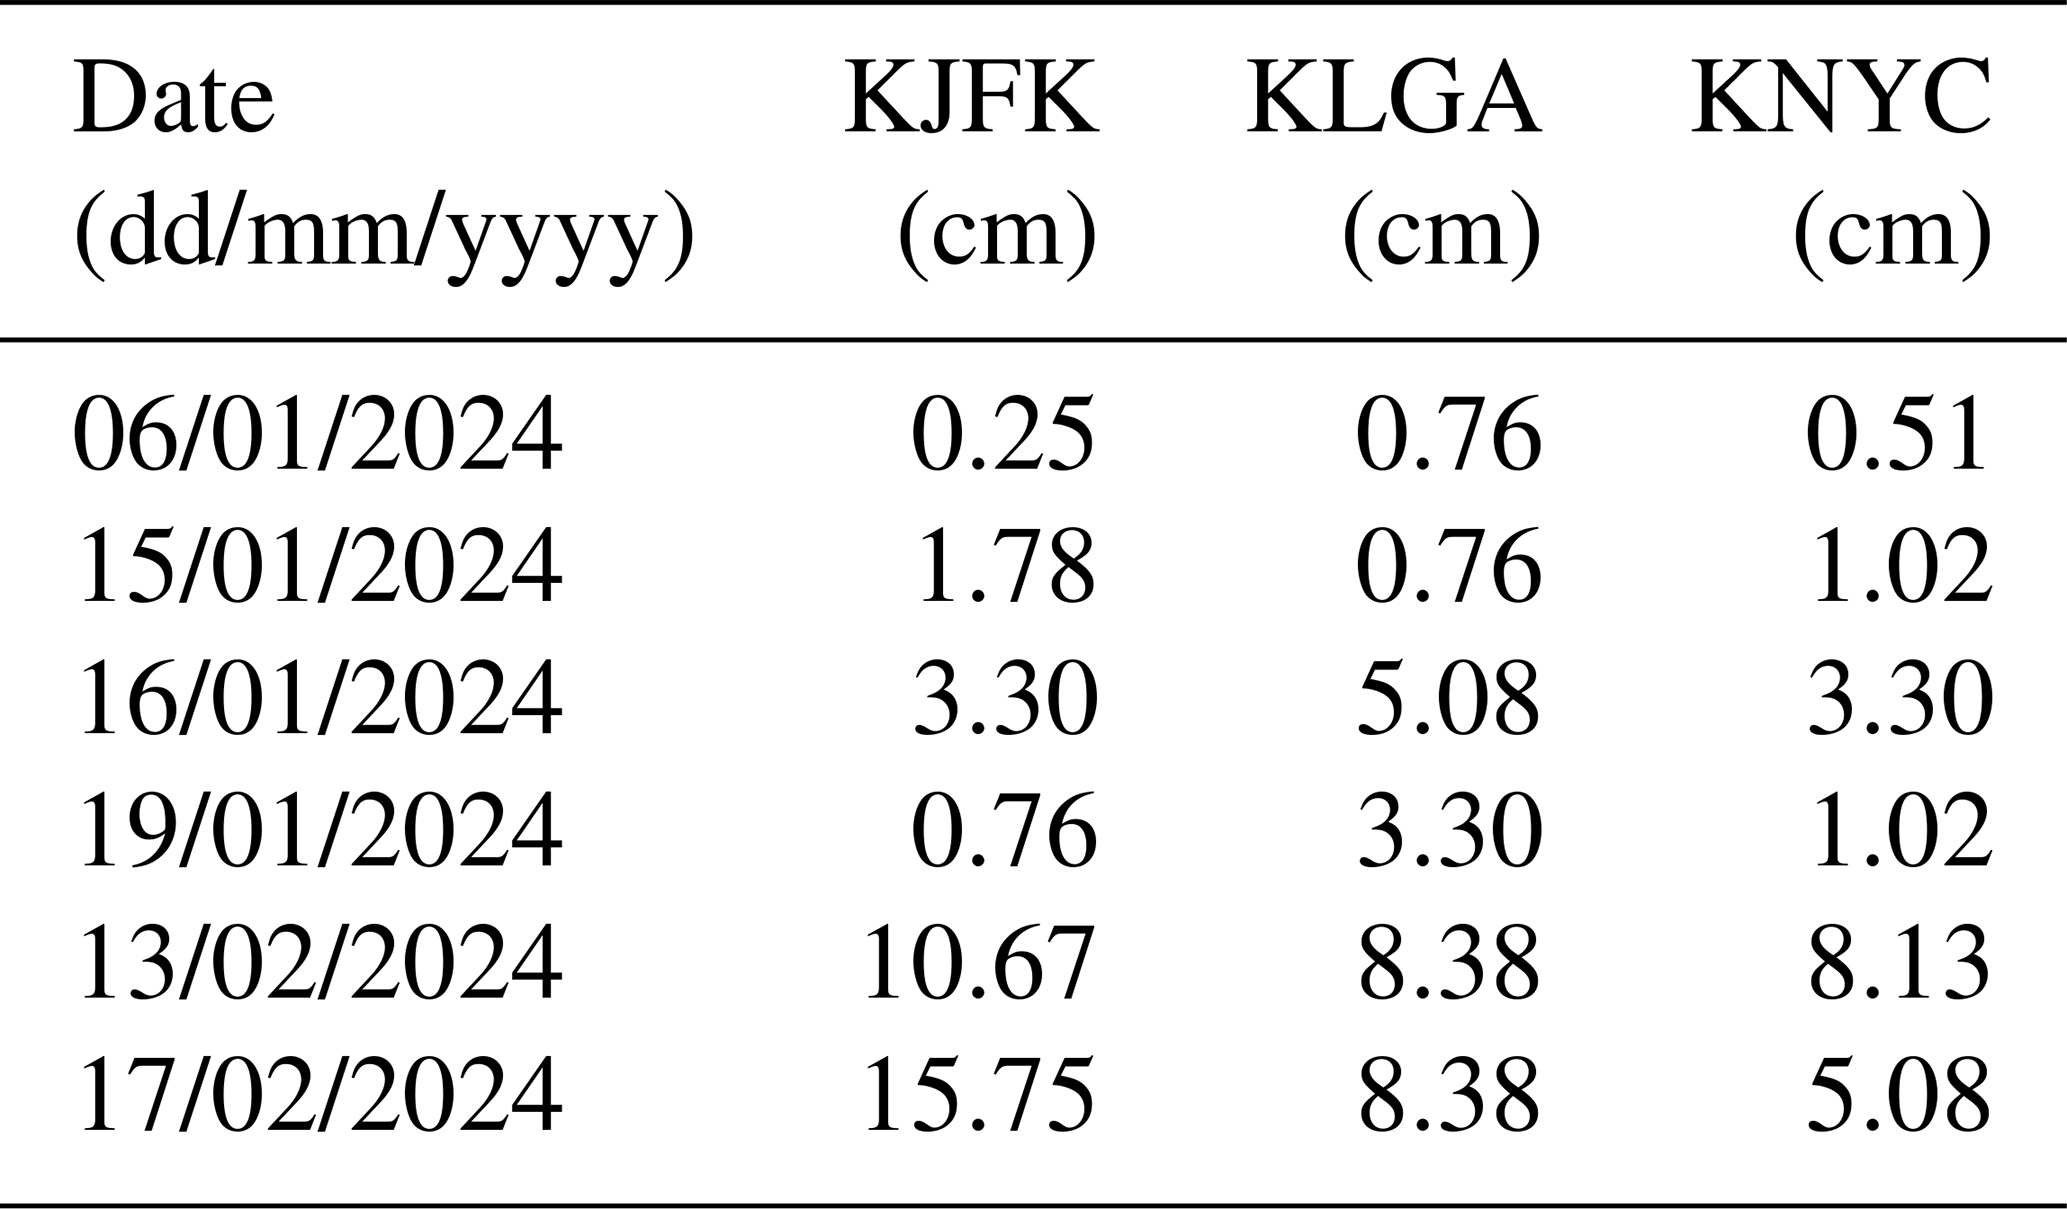
We present NYC Mesh link responses during Winter 2024 snowstorms, cross-referenced with local PWS and ASOS observations. Table 2 summarizes daily snowfall records for Winter 2024 at KJFK, KLGA, and KNYC. The table shows snowfall depths from six specific days in early 2024. The January events were generally light, with most measurements at 5.08 cm or less. The February events were much heavier, with a significant snowfall of 8–11 cm recorded at all three stations on 13 February, and a peak accumulation of 15.75 cm at KJFK on 17 February. Figure 14 shows two of these events during Winter 2024: 16 January, with an average daily accumulation across stations of 3.9 cm, and 13 February, with heavier accumulations of 9.6 cm. The bottom panel displays 5 min ASOS precipitation records for each event. Above, RSL measurements from two sublinks per frequency band (5, 60, and 70 GHz) in the Brooklyn region are shown alongside mean and median precipitation and air temperature from the local WUnderground PWS network.
All plots are color shaded by ASOS NOAA station category to reflect the reported condition at each interval: dry (white), wet (rain), wintry mix (freezing rain, freezing drizzle, or sleet), and snow, using the majority category within each hourly window. Figure 14a corresponds to the 16 January 2024 event, with ASOS stations recording snow conditions mainly in the early morning (up to 09:00 a.m.) with recorded precipitation. At the same time, no significant effect on the microwave signal was observed, and no precipitation was registered by the WUnderground PWS. These observations can be associated with the recorded subzero temperatures (–2 to –4 °C), which may suggest the presence of predominantly dry snow. Such conditions are typically transparent to microwave signals and are often not recorded by unheated PWS tipping-bucket gauges, which can be susceptible to freezing. Around 09:00, as the air temperature rose toward 0 °C, ASOS station reports shifted from “snow” to “wintry mix,” indicating mixed-phase conditions. Concurrently, NYC Mesh wireless links exhibited marked attenuation, exceeding 10 dB at higher frequencies, while co-located PWS reported only low precipitation levels. Figure 14b illustrates the 13 February event, characterized by heavier snowfall, averaging about 9 cm of snow depth across the three ASOS stations. In the morning hours, ASOS stations began recording precipitation with present weather codes indicating snow. At the same time, wireless links showed substantial attenuation across all frequency bands, including more than 20 dB on high-frequency (60–70 GHz) sublinks and some link outages. Concurrently, PWS also registered precipitation, but in low amounts, with a majority of stations reporting zero.
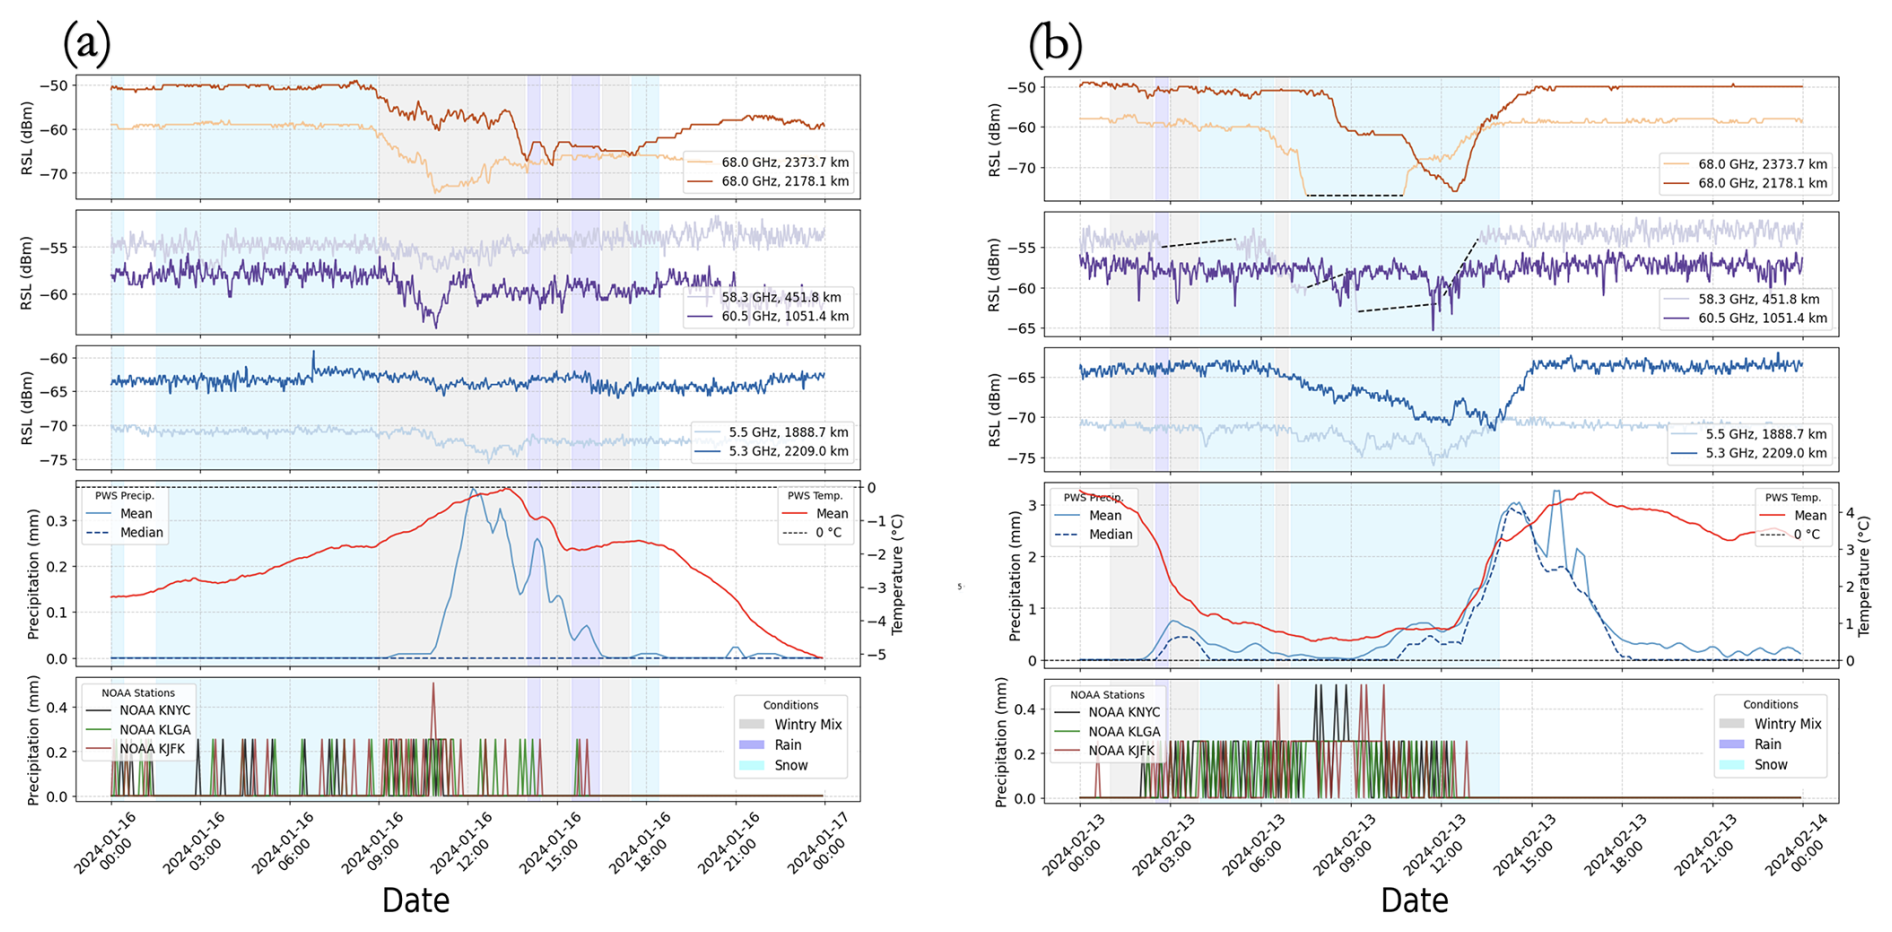
Figure 14RSL traces from two illustrative snowfall days per frequency band, shown alongside PWS mean/median precipitation (mm) and temperature (°C), and 5 min ASOS precipitation. Colored shading indicates the precipitation type from airport stations: snowfall (cyan), mixed rain/snow (gray), rainfall (blue), and dry (white).
After 13:00, wireless links showed signal recovery, returning to baseline attenuation levels that aligned with reported dry conditions. Simultaneously, the PWS network recorded spikes with high precipitation levels, even as official ASOS stations reported zero precipitation. This significant peaking lag in the PWS data, which is delayed relative to the earlier RSL attenuation and ASOS observations, may suggest it is not a new precipitation event. A possible reason for this behavior is a “melting lag,” where the unheated PWS gauges may be measuring the previously uncaptured snowpack as it melted, long after the actual snowfall had ended. Overall, OpenMesh wireless links exhibited frequency-dependent attenuation during snow storms, showing potential to complement sparse official stations for snow monitoring, and to discriminate between dry and wet snow, as suggested in Øydvin et al. (2025).
WCNs serve as valuable sources of atmospheric and hydrological data (Messer et al., 2006; Chwala and Kunstmann, 2019; Fencl et al., 2025). While most current studies have focused on CMLs traditionally employed for cellular network backhauling, new wireless data sources are emerging with increased urban deployments at higher millimeter-wave frequency bands (e.g., ∼ 60 and ∼ 70 GHz). Here, we presented OpenMesh, a new OS dataset from a community-operated WCN deployed across multiple frequency bands in NYC, representing a network type not previously covered in the CML literature. We analyzed attenuation–weather relationships in NYC by pairing OpenMesh RSL measurements from four frequency bands (5, 24, 60, and 70 GHz) with PWS and ASOS records, demonstrating the utility of this frequency diversity for opportunistic precipitation sensing. Key challenges include data availability, with high responsiveness at 70 GHz leading to outages during severe rain, along with baseline instability and variable reliability of PWS references. At the same time, the opportunistic approach, leveraging the growing number of distributed sensors including dense link deployments across multiple frequency bands (Fig. 4) and PWS stations, can mitigate these limitations, making OpenMesh a practical testbed for urban precipitation sensing. For example, the OpenMesh dataset features several dual-band links (Fig. 12), pairing high-frequency bands with a 5 GHz link along the same line of sight, which not only supports connectivity but also enables direct comparison of frequency-dependent atmospheric effects over the same channel. Beyond rainfall, the snow events (Fig. 14) illustrate that urban wireless links, particularly at higher frequency bands, can sense snowfall often missed by unheated PWS gauges. Link responses vary between dry and wet snow depending on weather conditions such as temperature, supporting earlier studies on WCNs for snow applications (Øydvin et al., 2023, 2025) and encouraging further exploration of non-rain phenomena. Moreover, as 5G and 6G architectures evolve toward Integrated Sensing and Communication (ISAC) (Kaushik et al., 2024; Dong et al., 2022), wireless infrastructure increasingly couples as an active environmental sensor. Moreover, as 5G and 6G architectures evolve toward Integrated Sensing and Communication (ISAC) (Kaushik et al., 2024; Dong et al., 2022), wireless infrastructure increasingly couples as an active environmental sensor. Aligned with the ISAC paradigm, proactive weather-aware communication resilience (Kadota et al., 2022; Jacoby et al., 2025a, 2024; Yaghoubi et al., 2018; Ahuna et al., 2019) can be achieved by learning rain-induced signal degradation patterns to directly optimize NMS decisions, as we recently demonstrated using the OpenMesh dataset (Jacoby et al., 2026).
The release of the OpenMesh dataset aligns with recent efforts to standardize and openly share OS datasets for hydrology applications, including both wireless link, satellite microwave link, and PWS observations (Fencl et al., 2025, 2024). We encourage further exploration, including advanced processing of OS datasets and trade-off analysis between sensor density and reliability for hydrological applications. Such efforts could involve applying QC and noise filtering methods to OpenMesh measurements and integrating with regional weather monitoring tools such as the NEXRAD KOKX S-band Doppler radar (Upton, NY) serving the NYC area and MRMS reanalysis gridded products, to leverage OS measurement diversity for environmental monitoring and specifically urban weather sensing.
The OpenMesh dataset comprising NYC Mesh wireless link measurements is publicly available on Zenodo under https://doi.org/10.5281/zenodo.15287692 (Jacoby et al., 2025b) under the Creative Commons Attribution 4.0 License (CC BY 4.0). The measurements and a two-week January sample of PWS data are both provided in NetCDF format, fully compliant with their respective OpenSense standards, CML specifications v1.1 for standardized metadata and PWS conventions for irregular time steps, accompanying the white paper on opportunistic rainfall-sensor data (Fencl et al., 2024). Meteorological raw observations for the entire period (including ASOS 5 min and daily, and WUnderground PWS) are accessible through their respective online platforms and API access. The attached repository contains the relevant scripts used to derive raw and meta dataset from both sources.
Scripts and notebooks are available on GitHub, archived at Zenodo under https://doi.org/10.5281/zenodo.18510358 (Jacoby, 2025). The repository includes examples of data reading and analysis, data fetching modules for NOAA and WUnderground observations, and is actively being expanded with additional processing scripts and results. The NetCDF dataset aligns with the OpenSense specification and interoperates with the opportunistic-hydrology codebase (https://github.com/OpenSenseAction, OpenSense Action, 2024). Community contributions are welcome.
As in-city wireless deployments grow denser and adopt higher frequency bands, emerging opportunities such as smart cities and community-driven infrastructures, like NYC Mesh, offer a path to capture high-resolution urban precipitation mapping at minimal additional cost. These networks provide high temporal sampling and dense spatial coverage that can support existing and future monitoring systems. Growing initiatives to openly share OS datasets for weather monitoring reflect a broader shift toward leveraging diverse sensor networks alongside traditional tools. OpenMesh exemplifies this through collaboration between a community-operated network and researchers, offering a replicable model for open, low-cost urban environmental sensing. Challenges remain, including data availability gaps, link outages during intense rain, and variability in data quality. Nevertheless, the public release of OpenMesh contributes to the growing body of openly available OS datasets, supporting further research into wireless networks as urban weather monitoring platforms.
DJ conceived the overall dataset framework, led software development, performed data preprocessing, conducted formal analysis and visualization, and wrote the original manuscript draft. SY contributed to software development, data curation, and reviewed and edited the manuscript. QH contributed to data collection, analysis, and implementation. ZH contributed to software development and data collection. RJ provided access to network resources, contributed to data validation, and reviewed the manuscript. JO, IK, GZ, and HM supervised the research, contributed to methodology, and critically reviewed and edited the manuscript.
The contact author has declared that none of the authors has any competing interests.
Publisher's note: Copernicus Publications remains neutral with regard to jurisdictional claims made in the text, published maps, institutional affiliations, or any other geographical representation in this paper. The authors bear the ultimate responsibility for providing appropriate place names. Views expressed in the text are those of the authors and do not necessarily reflect the views of the publisher.
We thank the NYC Mesh community for providing their network data and invaluable support, which made this research possible, with a special thanks to Olivier Morf for his continuous collaboration and technical assistance. We also appreciate the support of the OpenSense community (COST Action CA20136), whose collaborative efforts helped shape both this dataset and the study.
This research has been supported by the National Science Foundation (grant nos. CNS-1910757, EEC-2133516, AST-2132700, AST-2232455, CNS-2433807, and CNS-2450567), the EU HORIZON EUROPE Digital, Industry and Space (grant no. 101134993), the Next Generation Internet (NGI) initiative through the NGI Enrichers program (EU-funded project No. 101070125), and the US-Israel Binational Science Foundation (BSF Prof. Rahamimoff Grant T-2025115).
This paper was edited by Tobias Gerken and reviewed by two anonymous referees.
Ahuna, M. N., Afullo, T. J., and Alonge, A. A.: Rain Attenuation Prediction Using Artificial Neural Network for Dynamic Rain Fade Mitigation, SAIEE Africa Research Journal, 110, https://doi.org/10.23919/SAIEE.2019.8643146, 2019. a
Andersson, J. C. M., Olsson, J., van de Beek, R. (C. Z.), and Hansryd, J.: OpenMRG: Open data from Microwave links, Radar, and Gauges for rainfall quantification in Gothenburg, Sweden, Earth Syst. Sci. Data, 14, 5411–5426, https://doi.org/10.5194/essd-14-5411-2022, 2022. a
Arvas, M. and Alsunaidi, M.: Analysis of oxygen absorption at 60 GHz frequency band, in: 2019 IEEE International Symposium on Antennas and Propagation and USNC-URSI Radio Science Meeting, IEEE, 2127–2128, https://doi.org/10.1109/APUSNCURSINRSM.2019.8888884, 2019. a
Ashraf, S., Sheikh, J. A., Ashraf, A., and Rasool, U.: 5g millimeter wave technology: An overview, Intelligent signal processing and RF energy harvesting for state of art 5G and B5G networks, Springer, Singapore, 97–112, https://doi.org/10.1007/978-981-99-8771-9_6, 2024. a
Bárdossy, A., Seidel, J., and El Hachem, A.: The use of personal weather station observations to improve precipitation estimation and interpolation, Hydrol. Earth Syst. Sci., 25, 583–601, https://doi.org/10.5194/hess-25-583-2021, 2021. a
Berne, A., Delrieu, G., Creutin, J.-D., and Obled, C.: Temporal and spatial resolution of rainfall measurements required for urban hydrology, J. Hydrol., 299, 166–179, https://doi.org/10.1016/j.jhydrol.2004.08.002, 2004. a
Brake, D.: 5G and next generation wireless: Implications for policy and competition, Information Technology & Innovation Foundation, 22 pp., https://www2.itif.org/2016-5g-next-generation.pdf (last access: 22 July 2026), 2016. a
Brousse, O., Simpson, C. H., Kenway, O. A., Martilli, A., Krayenhoff, E. S., Zonato, A., and Heaviside, C.: Spatially Explicit Correction of Simulated Urban Air Temperatures Using Crowdsourced Data, J. Appl. Meteorol. Clim., 62, 1539–1572, https://doi.org/10.1175/JAMC-D-22-0142.1, 2023. a
Chwala, C. and Kunstmann, H.: Commercial microwave link networks for rainfall observation: Assessment of the current status and future challenges, Wiley Interdisciplinary Reviews: Water, 6, e1337, https://doi.org/10.1002/wat2.1337, 2019. a, b, c
Consortium, C.: COSMO Priority Project: APOCS – Application of Personal Weather Station and Opportunistic Sensor Data CrowdSourcing, Tech. rep., COSMO Consortium, https://www.cosmo-model.org/content/tasks/priorityProjects/apocs/pp-apocs.pdf (last access: 22 July 2026), 2025. a, b
Covi, E. and Roversi, G.: OpenRainER, Zenodo [data set], https://doi.org/10.5281/zenodo.10593848, 2024. a
Covi, E., Roversi, G., and Nebuloni, R.: OpenRainER: an open-source dataset for studying the opportunistic sensing of rainfall in Emilia-Romagna, Italy, Earth Syst. Sci. Data Discuss. [preprint], https://doi.org/10.5194/essd-2026-160, in review, 2026. a
Cristiano, E., ten Veldhuis, M.-C., and van de Giesen, N.: Spatial and temporal variability of rainfall and their effects on hydrological response in urban areas – a review, Hydrol. Earth Syst. Sci., 21, 3859–3878, https://doi.org/10.5194/hess-21-3859-2017, 2017. a, b
Csurgai-Horváth, L. and Bitó, J.: Fog Attenuation on V Band Terrestrial Radio and a Low-Cost Measurement Setup, in: Future Network and Mobile Summit, IEEE, 9 pp., ISBN 978-1-905824-16-8, 2010. a
da Silva Mello, L. and Pontes, M.: Prediction of rain attenuation in terrestrial links with the full rainfall rate distribution, in: 2nd European Conference on Antennas and Propagation (EuCAP 2007), IET, https://doi.org/10.1049/ic.2007.0872, 2007. a
David, N. and Gao, H. O.: Using cellular communication networks to detect air pollution, Environ. Sci. Technol., 50, 9442–9451, https://doi.org/10.1021/acs.est.6b00681, 2016. a
David, N., Sendik, O., Messer, H., and Alpert, P.: Cellular network infrastructure: The future of fog monitoring?, B. Am. Meteorol. Soc., 96, 1687–1698, https://doi.org/10.1175/BAMS-D-13-00292.1, 2015. a, b
de Vos, L. W., Leijnse, H., Overeem, A., and Uijlenhoet, R.: Quality control for crowdsourced personal weather stations to enable operational rainfall monitoring, Geophys. Res. Lett., 46, 8820–8829, https://doi.org/10.1029/2019GL083731, 2019. a, b
Dong, F., Liu, F., Cui, Y., Wang, W., Han, K., and Wang, Z.: Sensing as a Service in 6G Perceptive Networks: A Unified Framework for ISAC Resource Allocation, IEEE T. Wirel. Commun., 22, 3522–3536, https://doi.org/10.1109/TWC.2022.3219463, 2022. a, b
El Hachem, A., Seidel, J., O'Hara, T., Villalobos Herrera, R., Overeem, A., Uijlenhoet, R., Bárdossy, A., and de Vos, L.: Technical note: A guide to using three open-source quality control algorithms for rainfall data from personal weather stations, Hydrol. Earth Syst. Sci., 28, 4715–4731, https://doi.org/10.5194/hess-28-4715-2024, 2024. a
Fencl, M., Dohnal, M., and Bareš, V.: Retrieving Water Vapor From an E-Band Microwave Link With an Empirical Model Not Requiring In Situ Calibration, Earth and Space Science, 8, e2021EA001911, https://doi.org/10.1029/2021EA001911, 2021. a
Fencl, M., Nebuloni, R., Andersson, J. C. M., Bareš, V., Blettner, N., Cazzaniga, G., Chwala, C., Colli, M., de Vos, L., El Hachem, A., Galdies, C., Giannetti, F., Graf, M., Jacoby, D., Habi, H. V., Musil, P., Ostrometzky, J., Roversi, G., Sapienza, F., Seidel, J., Špačková, A., van de Beek, R. C. Z., Walraven, B., Wilgan, K., and Zheng, X.: Data formats and standards for opportunistic rainfall sensors, Open Research Europe, 3, 169, https://doi.org/10.12688/openreseurope.16068.2, 2024. a, b, c, d, e, f, g
Fencl, M., Bareš, V., Ostrometzky, J., Messer, H., Winterrath, T., Priestley, A., and Chwala, C.: A new initiative to facilitate the global collection of microwave link data and its use in hydrometeorology, B. Am. Meteorol. Soc., https://doi.org/10.1175/BAMS-D-24-0346.1, 2025. a, b, c, d
Graf, M., Chwala, C., Polz, J., and Kunstmann, H.: Rainfall estimation from a German-wide commercial microwave link network: optimized processing and validation for 1 year of data, Hydrol. Earth Syst. Sci., 24, 2931–2950, https://doi.org/10.5194/hess-24-2931-2020, 2020. a
Habi, H. V. and Messer, H.: Uncertainties in short commercial microwave links fading due to rain, in: ICASSP 2020–2020 IEEE International Conference on Acoustics, Speech and Signal Processing (ICASSP), IEEE, 9006–9010, https://doi.org/10.1109/ICASSP40776.2020.9053814, 2020. a
Hadar, M., Ostrometzky, J., and Messer, H.: Parameter estimation of in-city frontal rainfall propagation, in: ICASSP 2020–2020 IEEE International Conference on Acoustics, Speech and Signal Processing (ICASSP), IEEE, 4910–4914, https://doi.org/10.1109/ICASSP40776.2020.9053572, 2020. a
Hahn, C., Garcia-Marti, I., Sugier, J., Emsley, F., Beaulant, A.-L., Oram, L., Strandberg, E., Lindgren, E., Sunter, M., and Ziska, F.: Observations from personal weather stations – EUMETNET interests and experience, Climate, 10, 192, https://doi.org/10.3390/cli10120192, 2022. a
Hu, Q., Li, Z., Wang, L., Huang, Y., Wang, Y., and Li, L.: Rainfall spatial estimations: A review from spatial interpolation to multi-source data merging, Water, 11, 579, https://doi.org/10.3390/w11030579, 2019. a
Imhoff, R., Overeem, A., Brauer, C., Leijnse, H., Weerts, A., and Uijlenhoet, R.: Rainfall nowcasting using commercial microwave links, Geophys. Res. Lett., 47, e2020GL089365, https://doi.org/10.1029/2020GL089365, 2020. a
ITU-R P.530: Propagation data and prediction methods required for the design of terrestrial line-of-sight systems, ITU-R Recommendation P.530-17, https://www.itu.int/rec/R-REC-P.530-17-201712-S/en (last access: 22 July 2026), 2017. a
ITU-R P.837: Characteristics of precipitation for propagation modelling, ITU-R Recommendation P.837-7, https://www.itu.int/rec/R-REC-P.837-7-201706-S/en (last access: 22 July 2026), 2017. a
ITU-R P.838: Specific attenuation model for rain for use in prediction methods, ITU-R Recommendation P.838-3, https://www.itu.int/rec/R-REC-P.838-3-200503-I/en (last access: 22 July 2026), 2005. a, b
Jacoby, D.: OpenMesh: Code Repository, Zenodo [code], https://doi.org/10.5281/zenodo.18510358, 2025. a
Jacoby, D., Ostrometzky, J., and Messer, H.: Hybrid hierarchical models for ISAC predictions with wireless links, in: 2024 32nd European Signal Processing Conference (EUSIPCO), IEEE, 1982–1986, https://doi.org/10.23919/eusipco63174.2024.10715001, 2024. a
Jacoby, D., Messer, H., and Ostrometzky, J.: Spatio-temporal model for predicting multivariate weather-induced attenuation in wireless networks, IEEE T. Instrum. Meas., https://doi.org/10.1109/TIM.2025.3555716, 2025a. a
Jacoby, D., Yu, S., Ostrometzky, J., Kadota, I., Zussman, G., and Messer, H.: OpenMesh Dataset – Wireless Signal Dataset for Opportunistic Urban Weather Sensing in New York City, Zenodo [data set], https://doi.org/10.5281/zenodo.15287692, 2025b. a, b
Jacoby, D., Li, Y., Yu, S., Di Cicco, N., Messer, H., Zussman, G., and Kadota, I.: AWaRe-SAC: Proactive Slice Admission Control under Weather-Induced Capacity Uncertainty, arXiv [preprint], https://doi.org/10.48550/arXiv.2601.05978, 2026. a
Janco, R., Ostrometzky, J., and Messer, H.: Rain estimation from smart city’s E-band links, in: 2022 IEEE 14th Image, Video, and Multidimensional Signal Processing Workshop (IVMSP), IEEE, 5 pp., https://doi.org/10.1109/IVMSP54334.2022.9816243, 2022. a
Janco, R., Ostrometzky, J., and Messer, H.: In-City Rain Mapping from Commercial Microwave Links – Challenges and Opportunities, Sensors, 23, 4653, https://doi.org/10.3390/s23104653, 2023. a, b, c
Kadota, I., Jacoby, D., Messer, H., Zussman, G., and Ostrometzky, J.: Switching in the rain: Predictive wireless x-haul network reconfiguration, Proceedings of the ACM on Measurement and Analysis of Computing Systems, 6, 1–26, https://doi.org/10.1145/3570616, 2022. a
Kaushik, A., Singh, R., Dayarathna, S., Senanayake, R., Di Renzo, M., Dajer, M., Ji, H., Kim, Y., Sciancalepore, V., Zappone, A., et al.: Toward Integrated Sensing and Communications for 6G: Key Enabling Technologies, Standardization, and Challenges, IEEE Communications Standards Magazine, 8, 52–59, https://doi.org/10.1109/MCOMSTD.0007.2300043, 2024. a, b
Mandement, M. and Caumont, O.: Contribution of personal weather stations to the observation of deep-convection features near the ground, Nat. Hazards Earth Syst. Sci., 20, 299–322, https://doi.org/10.5194/nhess-20-299-2020, 2020. a
Messer, H. and Gazit, L.: From cellular networks to the garden hose: Advances in rainfall monitoring via cellular power measurements, in: 2016 IEEE Global Conference on Signal and Information Processing (GlobalSIP), IEEE, 1012–1016, https://doi.org/10.1109/GlobalSIP.2016.7905994, 2016. a
Messer, H., Zinevich, A., and Alpert, P.: Environmental monitoring by wireless communication networks, Science, 312, 713–713, https://doi.org/10.1126/science.1120034, 2006. a, b, c
Michelon, A., Benoit, L., Beria, H., Ceperley, N., and Schaefli, B.: Benefits from high-density rain gauge observations for hydrological response analysis in a small alpine catchment, Hydrol. Earth Syst. Sci., 25, 2301–2325, https://doi.org/10.5194/hess-25-2301-2021, 2021. a
National Research Council: Observing weather and climate from the ground up: A nationwide network of networks, National Academies Press, https://doi.org/10.17226/12540, 2009. a
NOAA National Weather Service, U.S. Federal Aviation Administration, U.S. Department of Defense, and NOAA National Centers for Environmental Information: 5-Minute Surface Weather Observations from the Automated Surface Observing Systems (ASOS) Network, https://www.ncei.noaa.gov/access/metadata/landing-page/bin/iso?id=gov.noaa.ncdc:C00418 (last access: 22 July 2026), 2005. a
NYC Mesh: NYC Mesh, GitHub [code], https://github.com/nycmeshnet (last access: 15 October 2025), 2025a. a
NYC Mesh: NYC Mesh, https://www.nycmesh.net/ (last access: 31 March 2026), 2025b. a, b
NYC Mesh: NYC Mesh Wiki, https://wiki.nycmesh.net/ (last access: 15 October 2025), 2025c. a, b
Olsen, R., Rogers, D., and Hodge, D.: The aRb relation in the calculation of rain attenuation, IEEE T. Antenn. Propag., 26, 318–329, https://doi.org/10.1109/TAP.1978.1141845, 1978. a
OpenSense Action: Opportunistic Hydrology Codebase, https://github.com/OpenSenseAction (last access: 11 November 2025), 2024. a
Ostrometzky, J.: Statistical signal processing of extreme attenuation measurements taken by commercial microwave links for rain monitoring, PhD thesis, Tel Aviv University, https://web2.eng.tau.ac.il/wtest/rainlinklab/wp-content/uploads/2020/07/Jonathan_Ostrometzky_Phd_Dissertation_Nov17_FINALSmallFileSize.pdf (last access: 22 July 2026), 2017. a
Ostrometzky, J. and Messer, H.: Dynamic determination of the baseline level in microwave links for rain monitoring from minimum attenuation values, IEEE J. Sel. Top. Appl., 11, 24–33, https://doi.org/10.1109/JSTARS.2017.2752902, 2017. a
Ostrometzky, J. and Messer, H.: Opportunistic Weather Sensing by Smart City Wireless Communication Networks, Sensors, 24, 7901, https://doi.org/10.3390/s24247901, 2024. a
Ostrometzky, J., Raich, R., Eshel, A., and Messer, H.: Calibration of the attenuation-rain rate power-law parameters using measurements from commercial microwave networks, in: 2016 IEEE International Conference on Acoustics, Speech and Signal Processing (ICASSP), IEEE, 3736–3740, https://doi.org/10.1109/ICASSP.2016.7472375, 2016. a
Overeem, A.: Commercial microwave link data for rainfall monitoring, 4TU.ResearchData [data set], https://doi.org/10.4121/7a692e36-c32f-4916-813b-c62d2566e8d8, 2023. a, b
Overeem, A., Leijnse, H., and Uijlenhoet, R.: Measuring urban rainfall using microwave links from commercial cellular communication networks, Water Resour. Res., 47, https://doi.org/10.1029/2010WR010350, 2011. a
Øydvin, E., Hagland, R. F., Nilsen, V., Wolff, M. A., and Kitterød, N.-O.: Classification of snow and rainfall using commercial microwave links, EGU General Assembly 2023, Vienna, Austria, 24–28 Apr 2023, EGU23-12061, https://doi.org/10.5194/egusphere-egu23-12061, 2023. a
Øydvin, E., Gaban, R., Andersson, J., (C. Z.) van de Beek, R., Wolff, M. A., Kitterød, N.-O., Chwala, C., and Nilsen, V.: Combining commercial microwave links and weather radar for classification of dry snow and rainfall, Atmos. Meas. Tech., 18, 2279–2293, https://doi.org/10.5194/amt-18-2279-2025, 2025. a, b
Rubin, Y., Rostkier-Edelstein, D., Chwala, C., and Alpert, P.: Challenges in diurnal humidity analysis from cellular microwave links (CML) over Germany, Remote Sens., 14, 2353, https://doi.org/10.3390/rs14102353, 2022. a, b
Rubin, Y., Sohn, S., and Alpert, P.: High-resolution humidity observations based on commercial microwave links (cml) data – case of tel aviv metropolitan area, Remote Sens., 15, 345, https://doi.org/10.3390/rs15020345, 2023. a
Schilling, W.: Rainfall data for urban hydrology: what do we need?, Atmos. Res., 27, 5–21, https://doi.org/10.1016/0169-8095(91)90003-F, 1991. a, b
Schleiss, M. and Berne, A.: Identification of dry and rainy periods using telecommunication microwave links, IEEE Geosci. Remote S., 7, 611–615, https://doi.org/10.1109/LGRS.2010.2043052, 2010. a, b
Špačková, A., Bareš, V., Fencl, M., Schleiss, M., Jaffrain, J., Berne, A., and Rieckermann, J.: A year of attenuation data from a commercial dual-polarized duplex microwave link with concurrent disdrometer, rain gauge, and weather observations, Earth Syst. Sci. Data, 13, 4219–4240, https://doi.org/10.5194/essd-13-4219-2021, 2021. a
Stewart, B.: Measuring what we manage – the importance of hydrological data to water resources management, P Int. Ass. Hydrol. Sci., 366, 80–85, https://doi.org/10.5194/piahs-366-80-2015, 2015. a
Tapiador, F. J., Turk, F. J., Petersen, W., Hou, A. Y., García-Ortega, E., Machado, L. A. T., Angelis, C. F., Salio, P., Kidd, C., Huffman, G. J., and de Castro, M.: Global precipitation measurement: Methods, datasets and applications, Atmos. Res., 104, 70–97, https://doi.org/10.1016/j.atmosres.2011.10.021, 2012. a
Upton, G., Holt, A., Cummings, R., Rahimi, A., and Goddard, J.: Microwave links: The future for urban rainfall measurement?, Atmos. Res., 77, 300–312, https://doi.org/10.1016/j.atmosres.2004.10.009, 2005. a
Weather Underground: Weather Underground, https://www.wunderground.com/ (last access: 29 October 2025), 2025. a
World Meteorological Organization: Guide to Instruments and Methods of Observation, Tech. rep., World Meteorological Organization, https://library.wmo.int/records/item/68695-guide-to-instruments-and-methods-of-observation (last access: 22 July 2026), 2018. a, b, c, d
Yaghoubi, F., Furdek, M., Rostami, A., Öhlén, P., and Wosinska, L.: Consistency-aware weather disruption-tolerant routing in SDN-based wireless mesh networks, IEEE T. Netw. Serv. Man., 15, 582–595, https://doi.org/10.1109/TNSM.2018.2795748, 2018. a
Zawadzki, I.: Factors affecting the precision of radar measurements of rain, in: 22nd Conference on Radar Meteorology, Zurich, Switzerland, 251–256, https://www.ametsoc.org/ (last access: 22 July 2026), 1984. a
Zhang, P., Liu, X., and Pu, K.: Precipitation monitoring using commercial microwave links: current status, challenges and prospectives, Remote Sens., 15, 4821, https://doi.org/10.3390/rs15194821, 2023a. a
Zhang, P., Liu, X., and Zou, M.: Reconstructing and nowcasting the rainfall field by a CML network, Earth and Space Science, 10, e2023EA002909, https://doi.org/10.1029/2023EA002909, 2023b. a
Zhang, Q. S.: Environment Pollution Analysis on Smart Cities Using Wireless Sensor Networks, Strategic Planning for Energy and the Environment, 42, 239–262, https://doi.org/10.13052/spee1048-5236.42112, 2023. a
We present a dataset of signal strength measurements from 103 wireless links in a community internet network in New York City, paired with data from 37 personal weather stations. By tracking how rain and snow weaken these signals at one-minute intervals across Manhattan and Brooklyn, we show that community networks can serve as low-cost weather sensing systems. The dataset and analysis demonstrate its use for real-time precipitation monitoring in cities.
We present a dataset of signal strength measurements from 103 wireless links in a community...