the Creative Commons Attribution 4.0 License.
the Creative Commons Attribution 4.0 License.
 | 16 Jul 2026
PlanetGSD 1.0: a cross-planetary grain-size distribution dataset from the Earth, the Moon, and the Mars
Jun Zhang
Comparative studies of surface processes across planetary bodies are hindered by the lack of consistently parameterized, openly accessible soil data, especially the grain-size distributions (GSDs) data. Here we present PlanetGSD 1.0, the first standardized and unified cross-planetary GSD database. It comprises 6527 measurements from Earth (4419 samples, 20 geomorphic settings), the Moon (379 samples, 8 missions), and Mars (1729 rover-derived estimates, 4 landing areas), covering seven orders of magnitude in grain size (0.0001–600 mm). The textural fractions have been transferred into a unique parameter set (μ, Dc, n) derived from the unified GSD (UGSD) function, accompanied by quality metrics, georeferenced metadata, site-level statistics, and open-source analysis codes. Technical validation confirms high fitting quality across all samples (97.8 % with R2>0.95) and robust inter-operator reproducibility for Martian image-derived measurements (coefficient of variation < 8.3 % for key parameters). The complete dataset is openly available on Figshare (https://doi.org/10.6084/m9.figshare.32362083, Zhang, 2026a) under the CC BY 4.0 license. PlanetGSD 1.0 enables robust cross-planetary comparison of regolith properties, benchmarking of simulants, and data-driven landing site assessment, establishing a foundational resource for planetary science.
- Article
(6706 KB) - Full-text XML
-
Supplement
(5126 KB) - BibTeX
- EndNote


The GSD of soil governs the mechanical and hydraulic properties; GSD data under a unified framework are crucial for comparative planetology, geotechnical engineering, and the planning of future exploration missions (Carrier III, 2003; Fedo et al., 2015; Iverson and Vallance, 2001). On Earth, GSD classification underpins soil taxonomy and geotechnical site characterization (Carrier III, 2003; Das, 2019). On the Moon, GSD controls regolith trafficability, dust mobilization, and the design of in-situ resource utilization (ISRU) systems (Colwell et al., 2007; Luo et al., 2026). On Mars, GSD provides important constraints on the transition from volcanic to sedimentary surface processes and on past hydrological activity (Rivera-Hernández et al., 2020). Importantly, primary volcanic deposits tend to be poorly sorted with unimodal or bimodal distributions, whereas reworked aeolian or fluvial deposits exhibit better sorting and distinct Weibull shape parameters. The Medusae Fossae Formation – a > 5000 km-long deposit of friable, fine-grained materials – exemplifies this volcanic-to-sedimentary transition, interpreted as a pyroclastic deposit from explosive volcanism (Ojha et al., 2018; Wilson and Head, 2007), subsequently shaped by aeolian erosion into yardangs and other wind-carved landforms.
However, existing GSD datasets remain fragmented across disciplines and planetary targets, with no unified analytical framework for cross-body comparison. Terrestrial soil databases (e.g., ISRIC-WISE, HWSD, POLARIS; Batjes, 2009; Chaney et al., 2016; Shangguan et al., 2014) provide broad geographic coverage but report only texture-class percentages and use Earth-centric schemes (USDA, FAO) that are not transferable to extraterrestrial contexts. Complementary large-scale resources such as the global SoilGrids product and the Webb et al. (2000) soil texture database offer additional spatial coverage but report only texture classes rather than complete GSD curves. Lunar GSD data are scattered across mission-specific catalogs (Graf, 1993; Heiken et al., 1991), with varying sieve protocols and no unified parameterization; recent Chang'e-5/-6 measurements (Li et al., 2022, 2024; Zhang et al., 2022) remain isolated from the Apollo/Luna corpus. Martian GSD estimates derived from rover imaging at four landing sites (Gale, Jezero, Gusev, Meridiani) employ site-specific protocols and resolution limits (Fedo et al., 2015; Stack et al., 2020; Weitz et al., 2018), and no cross-site compilation exists. Compounding this fragmentation, conventional GSD descriptors (percentile indices, moment statistics) reduce continuous distributions to summary values without direct links to physical processes, while standard unimodal fitting functions (lognormal, Rosin–Rammler, Fredlund) cannot represent the multimodal, polygenetic distributions common in natural regolith (Bittelli et al., 1999). The universal GSD (UGSD) function (Yong et al., 2013, 2017) addresses these limitations through a flexible four-parameter formulation capable of capturing multimodal curves, but has not previously been applied as a unified cross-planetary framework.
Here we present PlanetGSD 1.0, a standardized database of 6527 GSD measurements compiled from Earth (4419 samples, 20 geomorphic settings, 18 countries), the Moon (379 samples from Apollo, Luna, and Chang'e missions), and Mars (1729 rover-derived estimates from Gale, Jezero, Gusev, and Meridiani), covering seven orders of magnitude in grain size (0.0001–600 mm). The GSD measurements derive from distinct techniques – laboratory sieving/laser diffraction for Earth, dry sieving for lunar returned samples, and image-based segmentation for Mars – introducing method-specific biases (Martian right-censoring below 40–150 µm; lunar loss of fines due to clogging; terrestrial laser diffraction sensitivity to grain shape). All samples have been harmonized using the UGSD function (Zhang et al., 2023), achieving a median fitting R2 of 0.988. Compared with existing resources, PlanetGSD 1.0 provides four key advances: (i) the first unified parameterization across three planetary bodies; (ii) complete raw GSD cumulative curves (mass percentage passing) retained alongside fitted parameters; (iii) site-level statistics (see Sect. 2.4 for full definition, formula, and application to grain size analysis) enabling stochastic field generation (see Sect. 2.5 for detailed methodology); and (iv) fully open data, codes, and metadata under the CC BY 4.0 license. The UGSD harmonization framework provides a common parametric language that retains method-specific biases as explicitly documented limitations. Future work (PlanetGSD 2.0) will integrate thermal inertia and photometric datasets to enable regional-to-global extrapolation.
PlanetGSD 1.0 is designed to serve three primary objectives: (i) to enable cross-body comparative analysis of GSDs under a unified parametric framework; (ii) to support planetary mapping and process identification by linking site-level GSD parameters to geologic units, depositional environments (aeolian, fluvial, impact, volcanic), and surface processes; and (iii) to provide a quantitative benchmark for regolith simulant development for future lunar and Martian missions. Recent analysis of Chang'e-6 farside samples (Qi et al., 2026, Xu et al., 2026) reveals finer-grained, more poorly sorted, and more cohesive regolith than nearside sites, underscoring the need for a systematic, cross-mission GSD database to enable robust cross-planetary comparison of regolith properties and data-driven landing-site assessment.
This paper is organized as follows. Section 2 describes the data acquisition methods for each planetary body. Section 3 presents the data records, including dataset structure, content summaries, and key fields. Section 4 reports the technical validation results. Section 5 provides illustrative applications and identifies open questions. Sections 6 and 7 are usage notes and conclusions, respectively.
2.1 Overview of the PlanetGSD dataset
The PlanetGSD dataset comprises 6527 soil samples from three planetary bodies – Earth, Moon, and Mars – integrated within a unified analytical framework based on the UGSD function. This compilation enables systematic comparison of granular characteristics across terrestrial and extraterrestrial environments with contrasting surface processes, climatic regimes, and geological histories. The database is organized with multi-level metadata, including geographic coordinates, geomorphic context, mission information, and original data sources, all standardized to facilitate cross-planetary analysis.
-
Earth component. The terrestrial samples represent the full spectrum of Earth's surface environments, spanning five continents and encompassing 20 distinct geomorphic settings. These include gravity-driven deposits (debris flows, landslides, moraines), fluvial systems (river valleys, floodplains), aeolian environments (deserts, loess), pedogenic landscapes (vegetated slopes, grasslands), and coastal zones. This diversity captures grain-size signatures associated with major process regimes, providing a comprehensive terrestrial reference for comparison with extraterrestrial materials. The Earth data integrate field-collected samples and literature-derived measurements, all processed using standardized laboratory protocols (sieving and laser diffraction).
-
Lunar component. The lunar samples originate from eight sample-return missions conducted between 1969 and 2024, including Apollo (USA), Luna (USSR), and Chang'e (China) programs. These missions provide geographic coverage of major lunar geological provinces, including mare basalts, highland terrains, and the farside South Pole-Aitken basin. All samples are regolith materials processed by impact gardening and space weathering, with grain-size distributions originally measured by dry sieving. The lunar data are harmonized from multiple mission catalogs, enabling consistent cross-mission comparison.
-
Martian component. The Martian samples are derived from high-resolution rover imagery at four NASA landing sites: Gale Crater (Curiosity), Jezero Crater (Perseverance), Gusev Crater (Spirit), and Meridiani Planum (Opportunity). These sites represent diverse Martian geological environments, including lacustrine mudstones and deltaic deposits (Gale, Jezero), weakly altered olivine basalt plains (Gusev), and sulfate-rich evaporite sequences (Meridiani), spanning from Noachian to Amazonian periods. Grain-size distributions were obtained through semi-automated image segmentation, capturing grain sizes from silt to gravel.
-
Database structure. All samples in PlanetGSD 1.0 are standardized to a consistent framework: raw cumulative GSD curves are preserved in their original bin resolutions, and each sample is fitted to the UGSD function to extract interpretable parameters (μ, Dc, n). Site-level statistics, including three-parameter Weibull distributions for μ populations, are provided to enable stochastic field generation and comparative analysis. Detailed sample-level metadata, including geographic coordinates, geomorphic setting, mission information, and original data citations, are provided in Tables S1–S6 in the Supplement.
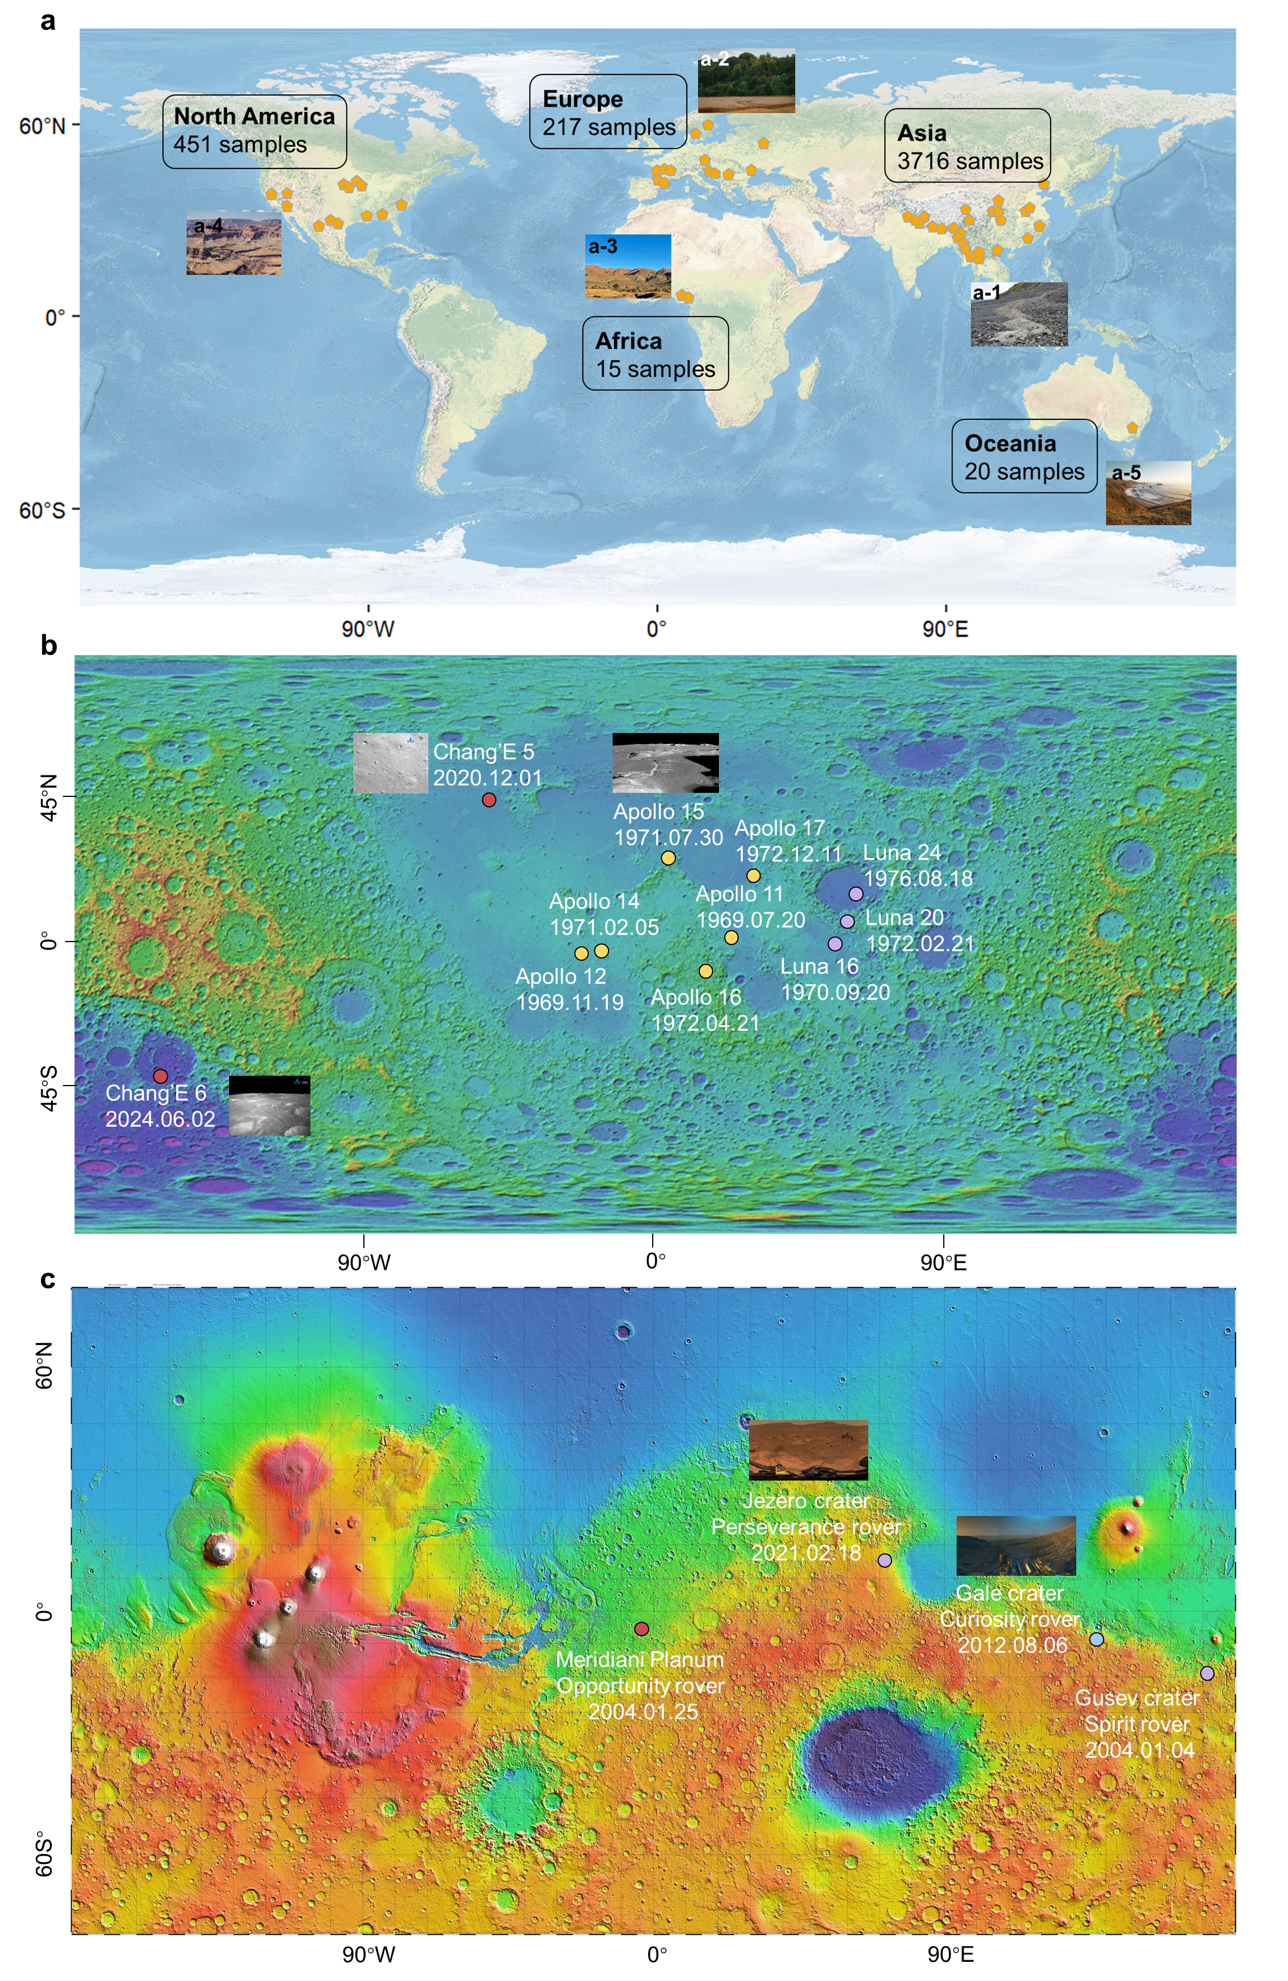
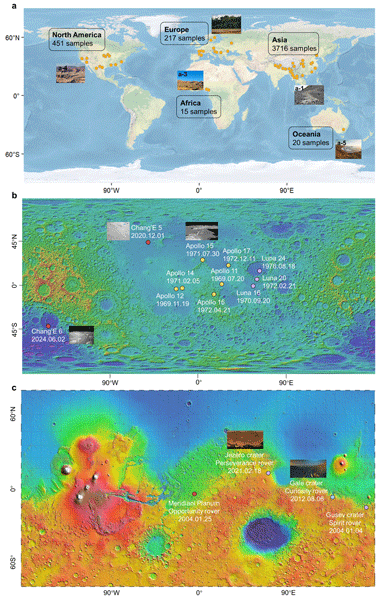
Figure 1Global distribution of three terrestrial planetary soil sampling sites and representative photographic images. (a) Sampling locations across 18 countries on five continents: Asia (China, Singapore, South Korea, Thailand, Iran), Europe (Finland, Sweden, France, Bulgaria, Romania, Poland, Germany, Russia), Africa (Nigeria), North America (USA, Canada), and Australia. Representative soil environments are shown: (a-1) wide-graded debris-flow deposits (Jiangjia Gully, Southwest China); (a-2) arable land (Sweden); (a-3) gully terrain (Nigeria); (a-4) canyon (USA); and (a-5) coastal beach (Australia). (b) Sampling locations of lunar soils, predominantly collected near spacecraft landing sites. The insets show surface images from Apollo 15, CE-5, and CE-6, with mission dates annotated. The topographic basemap is the Lunar Reconnaissance Orbiter Laser Altimeter (LRO LOLA) color shaded relief (388 m resolution). Images courtesy of the China National Space Administration (CNSA). (c) Sampling locations of Martian soils across four distinct regions, with insets showing overviews of Gale and Jezero Craters. The basemap is the Mars Orbiter Laser Altimeter (MOLA) shaded relief topography. Images courtesy of NASA.
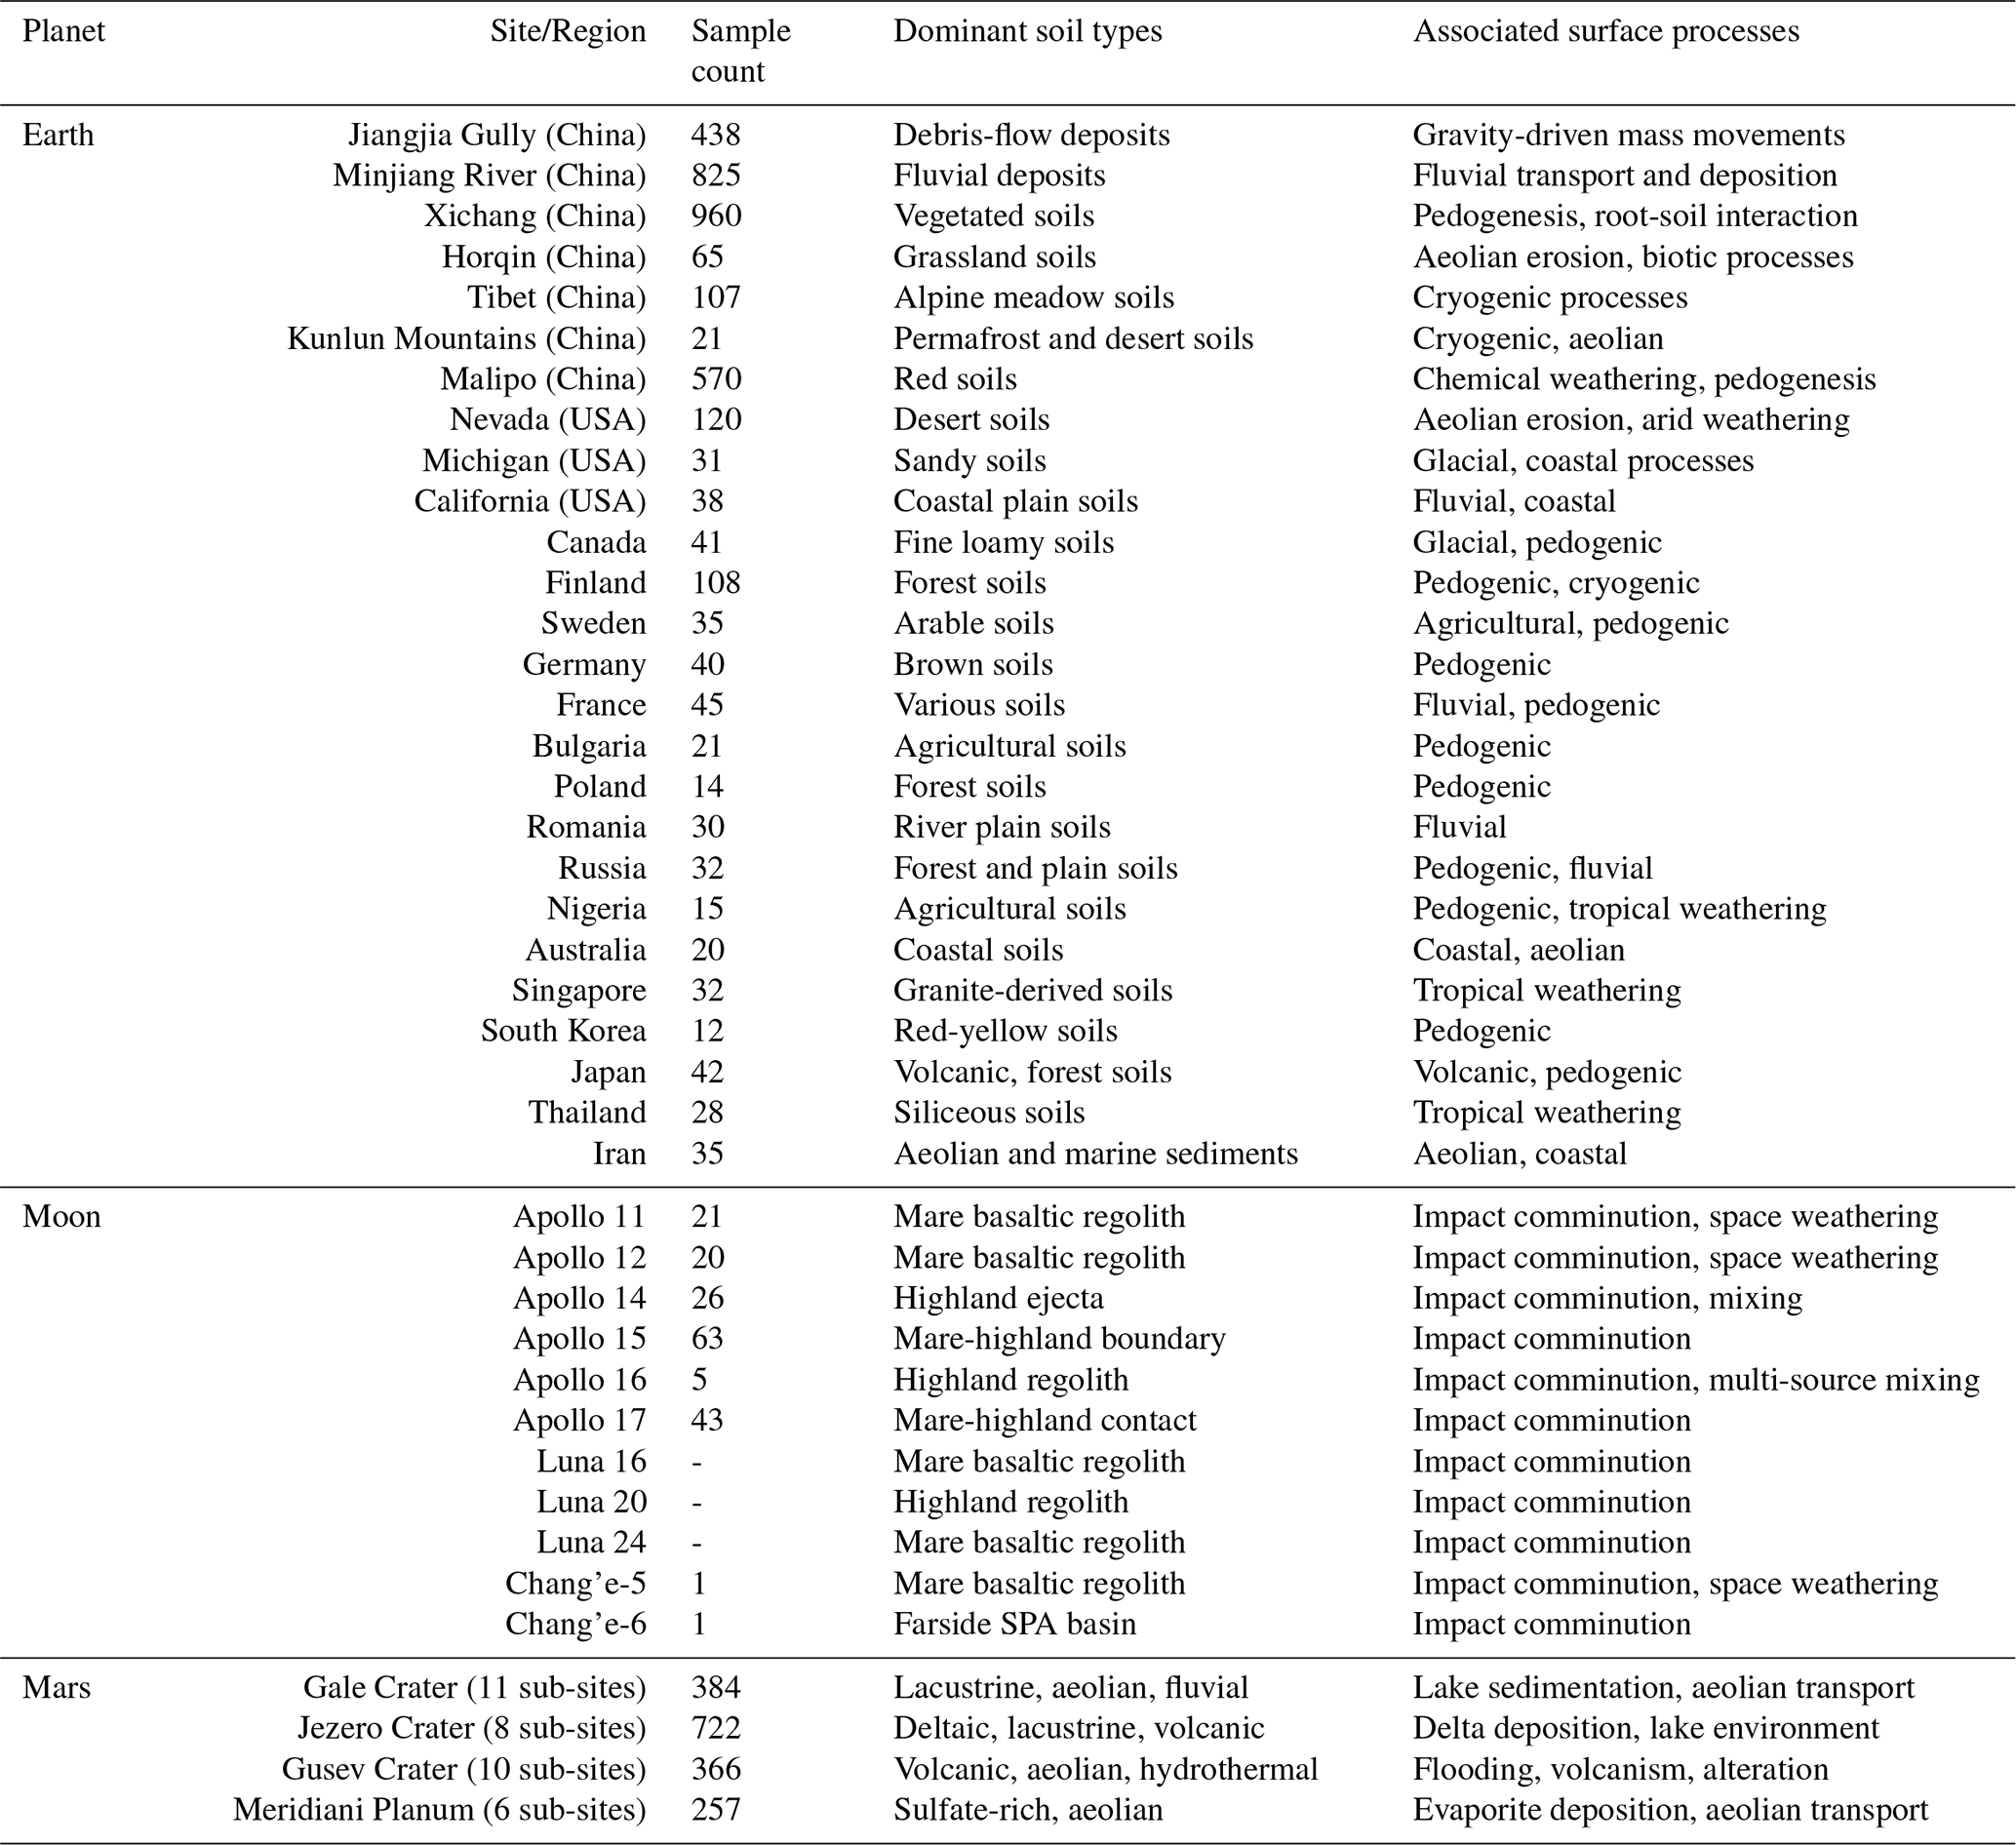
Table 1 summarizes the key characteristics of the three planetary datasets, including sample size, geographic coverage, analytical methods, grain-size ranges, and data sources. Table 2 provides detailed information for each sampling site, including sample counts, dominant soil types, and associated surface processes.
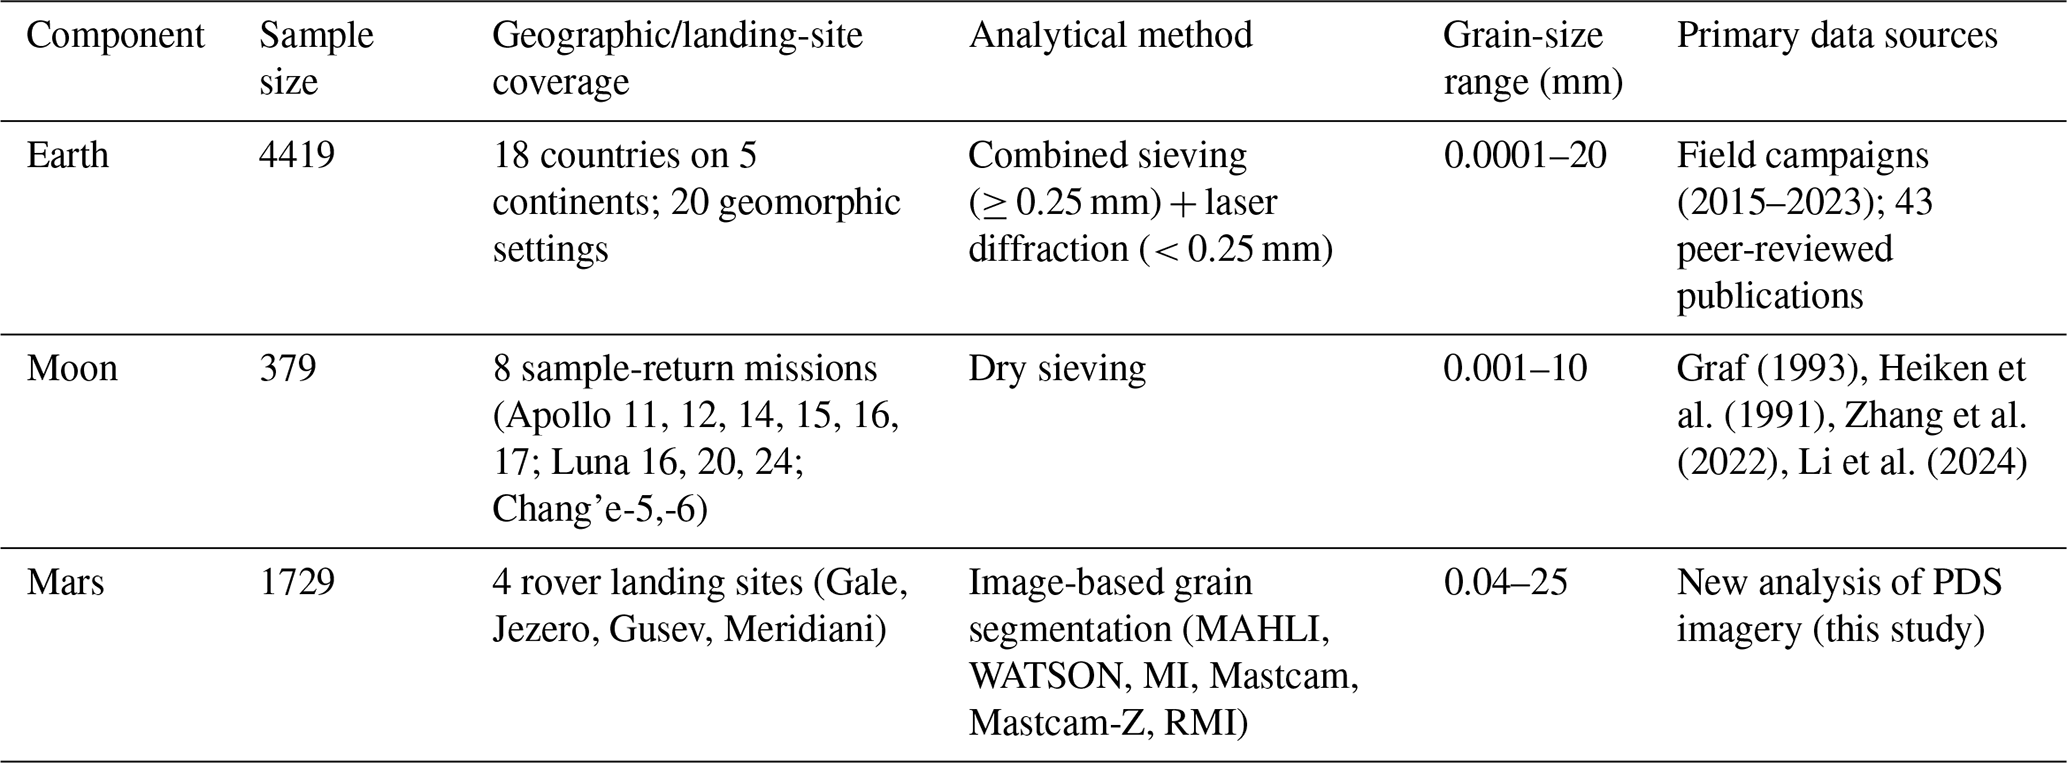
Table 2Sampling sites, sample counts, dominant soil types, and associated surface processes.
2.2 Data acquisition methods
2.2.1 Field sampling (Earth)
Terrestrial field samples (2847) were collected during campaigns conducted between 2015 and 2023 across 18 countries on five continents (Fig. 1a; Tables S1–S5). Sampling targeted the upper 10 cm of the surface layer to ensure consistency with the actively weathering zone and to facilitate comparison with orbital remote sensing data. At vegetated sites, surface organic litter was removed prior to sampling.
The sampling strategy was tailored to geomorphic context: systematic grid-based transects for homogeneous terrain (plains, grasslands, deserts) and targeted sampling of distinct geomorphic units for heterogeneous environments (debris-flow deposits, landslides, moraines). Individual sample mass ranged from 200 g to 2 kg (median 500 g) to ensure sufficient material for grain-size analysis and representative sampling of heterogeneous deposits. Samples were sealed in polyethylene bags with GPS coordinates recorded, transported to the laboratory, and stored at 4 °C prior to analysis.
All field-collected samples were processed following standardized protocols (BS 1377-2, ASTM D422-63, ASTM D6913-04, ISO 11277:2009) using combined sieving and laser diffraction methods, as detailed in Sect. 2.3.1. Complete instrument specifications and quality control procedures are provided in Sect. S1. No additional replicate analyses or certified reference material measurements were performed specifically for this study.
2.2.2 Literature compilation (Earth and Moon)
-
Terrestrial literature data. In addition to field-collected samples, we compiled grain-size distribution data for 1572 terrestrial samples from 43 peer-reviewed publications. These samples expand the geographic and environmental coverage of the terrestrial component, including soils from Europe (Finland, Sweden, France, Germany, Poland, Romania, Russia), North America (USA, Canada), Asia (China, Japan, South Korea, Thailand, Iran), Australia, and Africa (Nigeria). The compiled data represent diverse surface environments such as forested hillslopes, agricultural lands, grassland soils, desert regions, coastal zones, and loess-mantled terrains, complementing the field-collected samples and enhancing the representation of major process regimes (Sect. S2).
-
Lunar mission data. Lunar grain-size distributions were compiled from eight sample-return missions (Apollo, Luna, Chang'e) spanning 1969–2024. Data were digitized from the NASA Lunar Soils Grain Size Catalog (Graf, 1993) for Apollo and Luna samples, and from mission-specific publications for Chang'e-5 (Zhang et al., 2022) and Chang'e-6 (Li et al., 2024). All lunar samples were originally analyzed using standardized dry sieving protocols. Detailed mission information, sample counts, and metadata are provided in Table 1, with the full GSD data available in Table S2 and site descriptions in Table S5.
2.2.3 Image-based analysis (Mars)
Martian GSD data were derived from high-resolution rover images for 1729 sampling targets at four NASA landing sites: Gale Crater (Curiosity), Jezero Crater (Perseverance), Gusev Crater (Spirit), and Meridiani Planum (Opportunity). All images were obtained from NASA's Planetary Data System (PDS) Imaging Node (https://pds-imaging.jpl.nasa.gov/, last access: 18 March 2026). Source image identifiers (PDS Product IDs) for all 1729 samples are provided in Dataset S3.
-
Imaging systems. Grain-size measurements utilized both arm-mounted close-range imagers and mast-mounted cameras. Close-range systems include the Mars Hand Lens Imager (MAHLI) on Curiosity (Edgett et al., 2012), the Wide Angle Topographic Sensor for Operations and Engineering (WATSON) on Perseverance, and the Microscopic Imager (MI) on Spirit and Opportunity (Herkenhoff, 2004). These instruments achieve pixel scales of 13–32 µm at working distances of 2–5 cm, enabling resolution of sand-sized grains down to approximately 40 µm. Mast-mounted systems – Mastcam on Curiosity (Bell III et al., 2017), Mastcam-Z on Perseverance (Bell III et al., 2021), and SuperCam Remote Micro-Imager (RMI) on Perseverance (Wiens et al., 2021) – provide pixel scales of 74–450 µm depending on focal length and target distance, limiting grain-size resolution to medium sand and coarser fractions (> 150 µm). Table 3 summarizes the key characteristics, resolution limits, and detection thresholds for all imaging systems used in this study.
-
Image selection and analysis. A total of 2160 images meeting quality criteria (known target distance, viewing angle < 30° from vertical, solar elevation > 20°) were selected from the PDS archive. Grain-size distributions were measured using semi-automated image segmentation software developed by Shi et al. (2021) and Zhao et al. (2023), implemented in Mathematica. The software's grain identification capability has been validated using three approaches (Karunatillake et al., 2014; Zhao et al., 2021). First, it was qualitatively compared with BASEGRAIN, ImageJ WEKA, and ENVI tools on 57 MAHLI and MI images from Mars, showing superior accuracy and speed. Second, using terrestrial basaltic sand (0.1–1.0 mm) as a known analog with manually placed pebbles (5–10 mm), the algorithm successfully segmented foreground pebbles while excluding background sand (Karunatillake et al., 2014, Part 2, Sect. 3.4). Third, the same study demonstrated that the algorithm provides consistent results across repeated runs, whereas manual segmentation yields substantial internal inconsistency (areal mismatch of 35 %–50 %). The software identifies individual grains through edge detection and watershed segmentation, calculates equivalent circular diameter (ECD) for each grain, and constructs cumulative size distributions after binning into logarithmic size classes (Chen et al., 2022). For each image, 150–500 grains (median 280) were segmented. The geographic distribution of all four landing sites is shown in Fig. 2. Complete image selection criteria, analysis protocols, resolution limits, and uncertainty estimates are provided in Sect. S3
Table 3Martian rover imaging systems and grain-size detection limits.
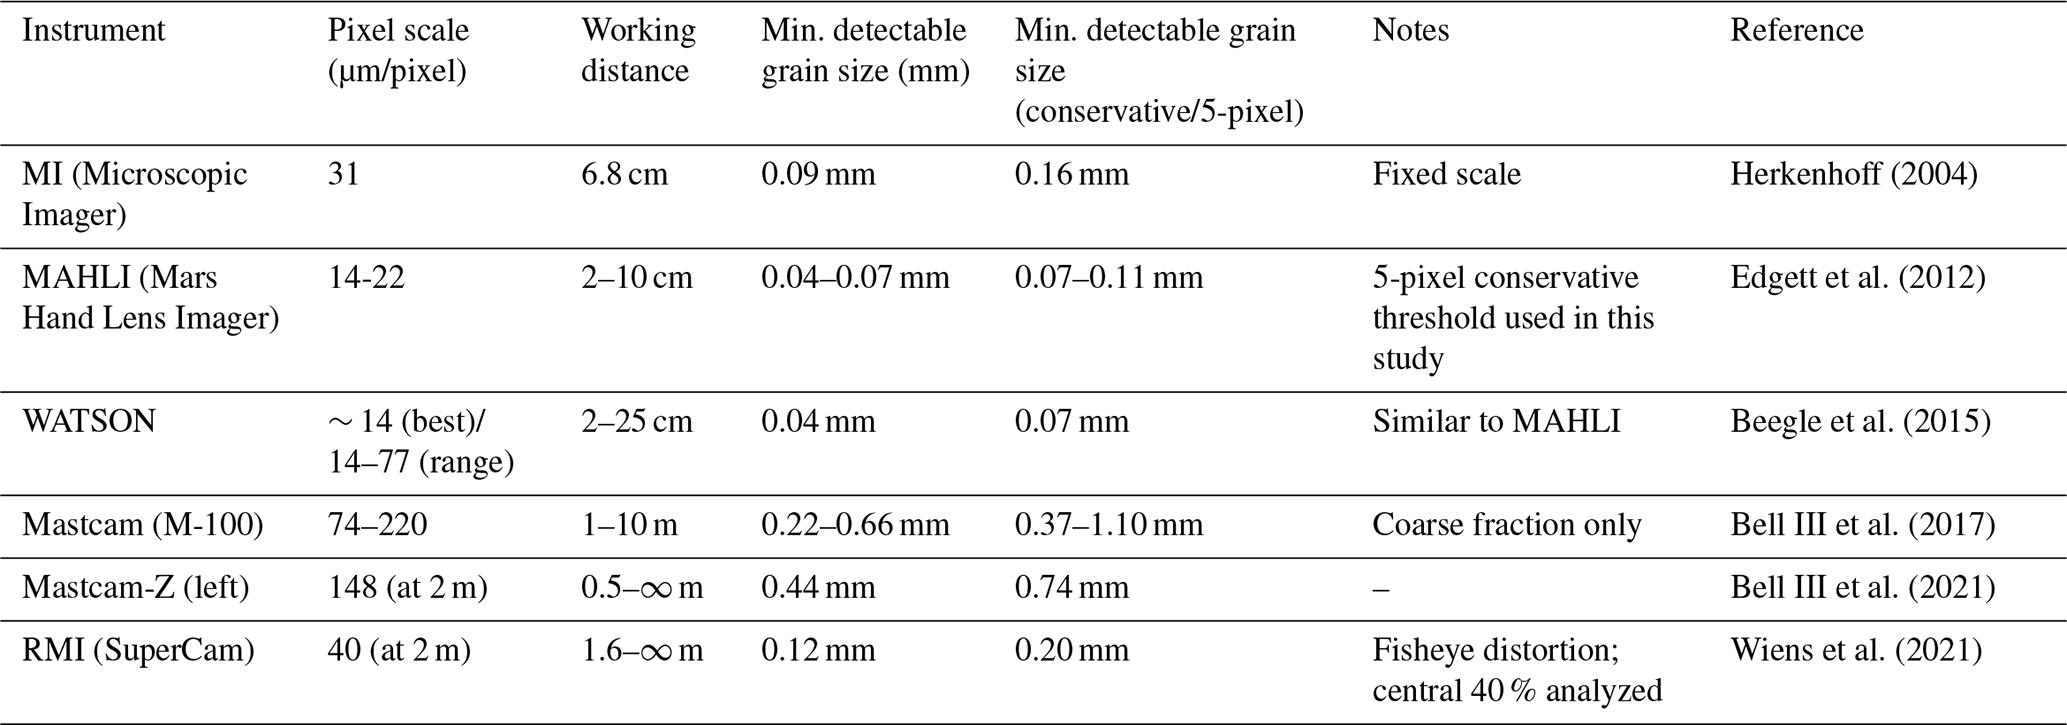
Note: Minimum detectable grain size is estimated as 3× pixel scale (optimistic) and 5× pixel scale (conservative). Following Karunatillake et al. (2014) and Shi et al. (2024), we adopt the conservative 5-pixel threshold due to the point spread function (PSF) of the optics and the ubiquitous presence of Martian dust, which reduces effective contrast. For MAHLI at 14 µm px−1, this yields a practical lower bound of ∼ 70 µm rather than the theoretical 40 µm.
2.2.4 Instrument-specific processing protocols
Different imaging instruments require tailored preprocessing before grain segmentation (Kozakiewicz, 2018):
-
MAHLI and WATSON (color, arm-mounted). These instruments acquire images at variable working distances (2–25 cm) with corresponding pixel scales of 14–77 µm px−1 (Aileen Yingst et al., 2014). We exclusively use the highest-resolution images available for each target (working distance ≤ 10 cm, pixel scale ≤ 32 µm px−1). The focus motor count recorded in image metadata enables scale calculation using the empirical relationship p= 6.90 + 3.52 ×w (where p= µm px−1, w= working distance in cm; Minitti et al., 2013). When available, images acquired after dust removal tool (DRT) brushing are prioritized to minimize dust obscuration (Sacks et al., 2016).
-
RMI (grayscale, mast-mounted, fisheye). RMI images exhibit barrel distortion, particularly toward the field edges. To minimize geometric bias, we analyze only the central 40 % of the field of view where distortion is < 2 % based on calibration target measurements. Grayscale images require contrast enhancement (adaptive histogram equalization) prior to segmentation. Resolution at typical working distances (2–5 m) yields pixel scales of 40–100 µm px−1, limiting grain detection to medium sand and coarser.
-
Cross-instrument consistency. For 30 targets imaged by both MAHLI and RMI at the same location, we find median D50 agreement within ±12 % (see Sect. 4.4), confirming that instrument-specific processing yields comparable results.
2.2.5 Discrimination of composite grains
A critical step in image-based granulometry is distinguishing discrete detrital grains from composite features (e.g., small grains sitting on larger grains, grain aggregates, or surface coatings). Our protocol follows a two-step approach:
-
Algorithmic segmentation. The watershed algorithm identifies individual grains based on local intensity minima, effectively separating touching grains. However, this algorithm may fail when grains partially overlap or when a small grain lies atop a larger one.
-
Manual inspection and correction. After automated segmentation, each image is visually inspected by the operator. For ambiguous cases – where a small grain appears embedded within or attached to a larger grain – the following rules are applied:
- –
If ≥ 50 % of the small grain's perimeter is visible and distinct from the underlying grain, it is counted as a separate grain.
- –
If the feature is a surface texture, cement, alteration rind, or dust aggregate, it is not counted as a discrete grain.
- –
If the visible perimeter is < 50 % (e.g., a partially buried grain), it is considered part of the larger grain.
- –
Additionally, following Shi et al. (2024), images where foreground coverage (e.g., coarse granules or pebbles overlying finer matrix) exceeds 5 % are excluded from analysis, as such high-contrast composite textures compromise reliable grain boundary detection.
This two-step protocol ensures consistent discrimination across the 1729 Martian samples. Complete operator guidelines are provided in Sect. S3.
2.3 Grain-size analysis and harmonization
2.3.1 Granulometric analysis methods
The dataset integrates GSDs obtained through three granulometric methods: combined sieving-laser diffraction (terrestrial field samples and literature), dry sieving (lunar missions), and image-based segmentation (Mars rovers). Table 4 summarizes the principles, grain-size ranges, advantages, and limitations of each method.
Table 4Comparison of GSD analytical methods for grain-size determination across the three planetary datasets.
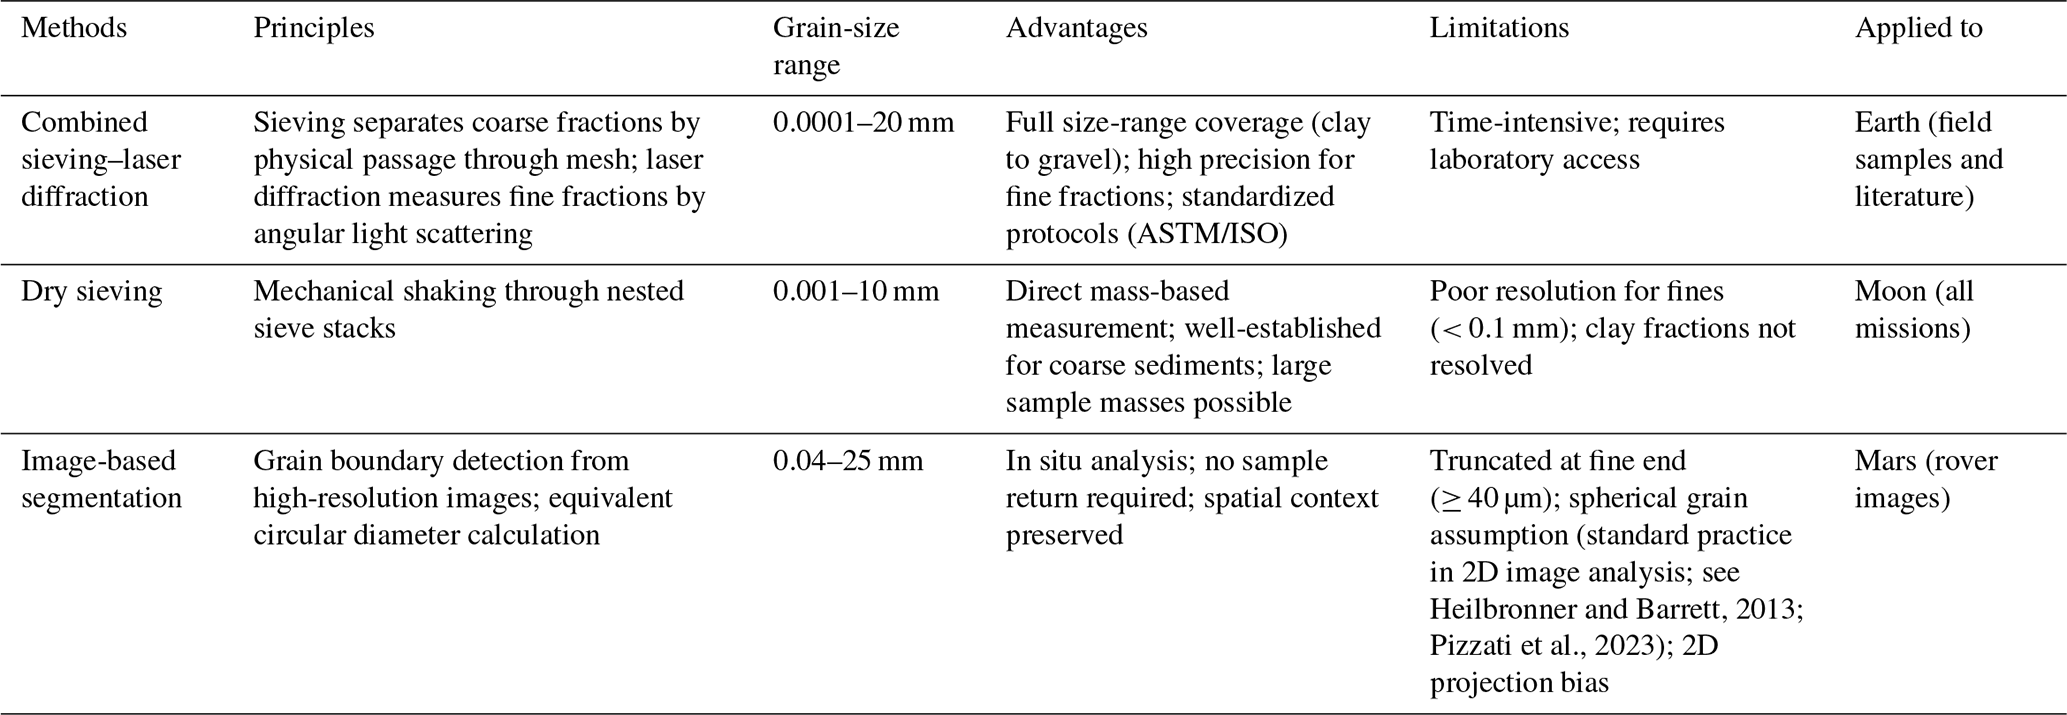
Note: (1) Mars imaging data are right-censored below 40–150 µm (depending on the instrument), meaning that fitted μ values may systematically underestimate fine-grain content; (2) Earth data are from combined sieving and Malvern laser diffraction. The Malvern instrument is based on the principle of laser diffraction and is sensitive to grain shape; non-spherical grains introduce systematic bias; (3) Lunar sieving provides mass-based grain-size distributions down to ∼ 1 µm but captures no shape information (e.g., aspect ratios, roundness, sphericity). Fine fractions (< 0.1 mm) suffer from poor resolution due to sieve clogging and electrostatic adhesion.
Although the raw data are measured by different methods, the UGSD function provides a unified flexible parametric framework to fit the measurements and transfer the textural fractions to a unique parameter set (μ, Dc, n), which enables comparative analysis while preserving method-specific biases as quantifiable uncertainties. Critically, Martian image-based data are right-censored below 40–150 µm (Table 4), so fitted μ values may systematically underestimate fine-grain content. Lunar sieving resolves grains down to ∼ 1 µm but misses clay morphology; terrestrial laser diffraction covers the full range but is shape-sensitive.
Figure 2 shows representative GSD patterns from each planetary body, illustrating the range of shapes captured in the dataset. With the x axis of all subfigures standardized to the same range (0.001–1000 mm), the GSDs are more directly comparable. The terrestrial examples (Fig. 2(a-1)) exhibit the widest size range (0.001–1000 mm) and display multi-peak patterns. Specifically, poorly sorted landslide deposits, bimodal debris-flow materials, and finer-grained vegetated soils are included, and the cumulative probability curves of mass movements (landslides and debris flows) samples are relatively scattered (Fig. 2(a-2)). Lunar samples (Fig. 2(b-1)) are very fine (< 4 mm), showing the relatively narrow, fine-grained distributions characteristic of impact-comminuted regolith; however, the cumulative probability curves of different lunar soils are very close to each other (Fig. 2(b-2)). Martian samples (Fig. 2(c-1)) thus exhibit a very narrow range (0.3–2 mm), with all curves showing a multi-modal pattern; notably, the cumulative curves of Martian soils are almost straight lines (Fig. 2(c-2)). Martian samples thus exhibit intermediate characteristics: some sites (e.g., Meridiani Planum) show well-sorted distributions indicative of aeolian sorting (Kozakiewicz et al., 2025), while others (e.g., Gale Crater) preserve multi-modal or poorly sorted signatures reflecting primary sedimentary textures (Kapui et al., 2018; Milliken et al., 2014).
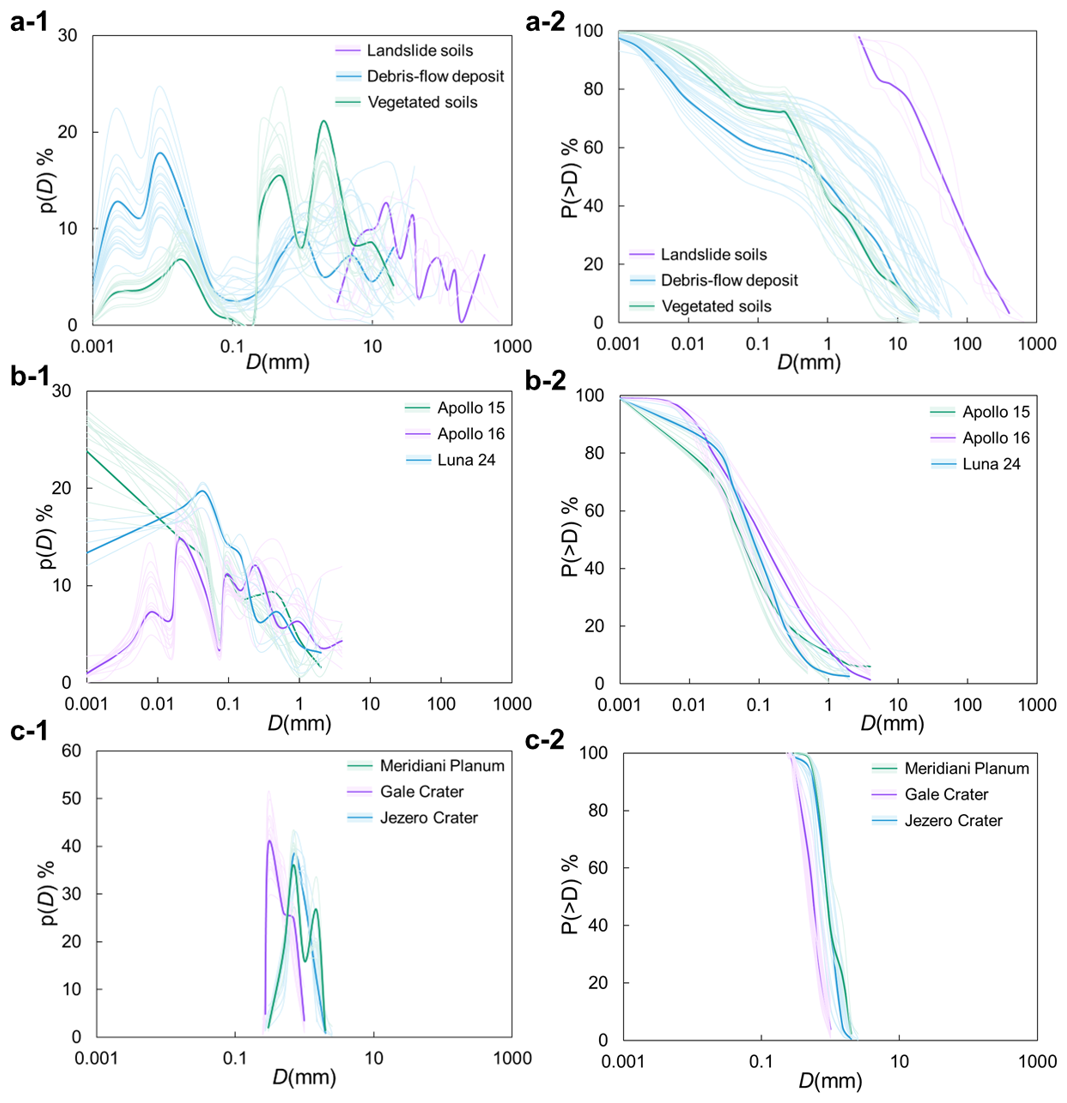
Figure 2Representative GSD curves from each planetary body. Left column: frequency curves (y axis: mass percentage of grains within each bin); right column: cumulative curves (y axis: cumulative percentage passing). (a) Terrestrial: landslide deposits, debris-flow deposits, and vegetated soils; (b) Lunar: Apollo 15, Apollo 16, and Luna 24; (c) Martian: Meridiani Planum, Gale Crater, and Jezero Crater.
The diversity of grain-size curves across and within planetary bodies – ranging from unimodal to multimodal distributions, with varying degrees of sorting and skewness – highlights the complexity of natural granular materials. Traditional descriptors such as percentile-based indices (D10, D50, D90) or unimodal distribution models (e.g., lognormal, Weibull) are insufficient to capture this variability in a standardized manner, particularly for cross-planetary comparison where analytical methods and size ranges differ fundamentally. To address this limitation, we employ the Universal Grain-Size Distribution (UGSD) function (Sect. 2.3.2), which provides a flexible, four-parameter formulation capable of representing diverse curve shapes within a unified framework, enabling systematic comparison of granular characteristics across the planetary bodies.
2.3.2 Data harmonization
Cross-planetary comparison requires harmonization of data collected using different methods with distinct size ranges and bin resolutions. Rather than applying interpolation or re-binning, which could introduce artifacts, we employ the UGSD function to fit the measured GSD data.
The UGSD function, developed and validated in our previous work (Yong et al., 2013, 2017; Zhang et al., 2023, 2025), describes the cumulative GSD as:
where μ is a power exponent positively correlated with fine-grain content, Dc is the characteristic grain size, the normalized coefficient f(μ)=a exp(−bμ), with empirically determined constants a and b); and n is a shape exponent controlling the coarse-tail steepness.
All 6527 samples were fitted to the UGSD function (Eq. 3) using nonlinear least-squares optimization. Figure 3 shows the rescaled UGSD curves for Earth (a), Moon (b), and Mars (c), demonstrating the unified fitting performance across planetary bodies. Median R2 values are 0.991 (Earth), 0.989 (Moon), and 0.983 (Mars), with 97.8 % of all samples yielding R2>0.95 (Table 9). The terrestrial and lunar populations exhibit strongly left-skewed R2 distributions, with > 85 % of samples achieving R2>0.98. The slightly lower Martian median is attributable to the truncation of the fine tail below ∼ 0.04–0.15 mm imposed by imaging resolution limits (Table 3), which reduces the number of constraining data points available for curve fitting.
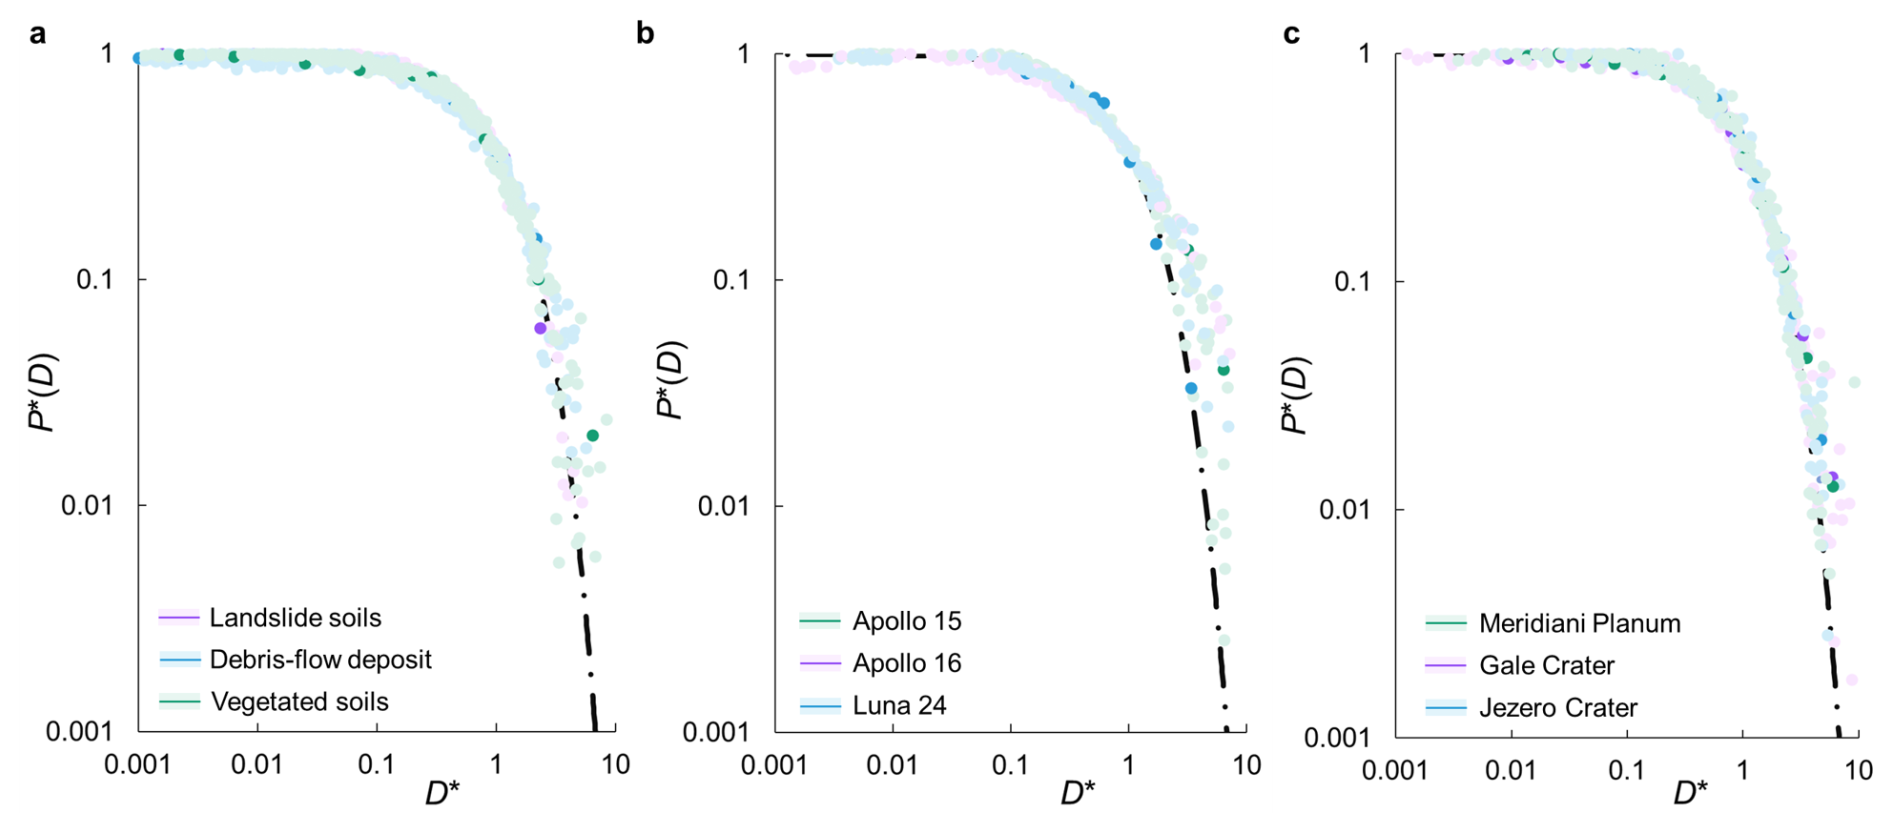
Figure 3Rescaled UGSD fitting performance across the three planetary bodies. Each panel shows all measured cumulative GSD curves collapsed onto dimensionless axes by normalizing grain size D by the fitted characteristic size Dc and plotting the rescaled cumulative percentage against (. (a) Earth; (b) Moon; (c) Mars.
All samples included in the dataset contain sufficient size fractions for reliable UGSD fitting (minimum five data points per sample). For curves truncated at coarse or fine ends (e.g., Martian samples missing fractions < 40 µm), fitting is performed on the available portion, and truncation thresholds are documented in the metadata (Dataset S4). Complete quality control protocols and uncertainty estimate for all datasets are provided in Sects. S1–S4. Parameter definitions and typical ranges for the dataset are summarized in Table 5.

For Martian image-derived data, all grain-size distributions are truncated at the instrument-specific minimum detectable grain size, defined as three times the pixel scale (Table 3). Grains smaller than this threshold are not resolvable and are therefore excluded from the fitted GSD curves. Rather than extrapolating or interpolating across the unresolved fine tail, we retain the truncation as a conservative lower bound: cumulative percentages at the smallest size bin are treated as “≥” values, and the fitted UGSD parameters are reported with a quality flag indicating right-censoring. This approach follows the reviewer's recommendation to truncate rather than extrapolate across unconstrained size ranges. All truncated fractions are documented in Dataset S3 metadata.
Comparison with alternative parameterizations. To demonstrate the advantage of the UGSD function, we fitted all 6527 samples to three alternative models (lognormal, Rosin-Rammler, and Fredlund three-parameter) and found that UGSD achieved higher median R2 values than all three alternatives.
2.3.3 Harmonization across 2D and 3D methods
A fundamental challenge in cross-planetary comparison is the incompatibility between 2D image-based measurements (Mars) and 3D mass-based measurements (Earth dry sieving + laser diffraction; Lunar dry sieving). Rather than attempting direct conversion of raw percentages, we adopt a three-pronged harmonization strategy:
-
Comparative framework. All Martian samples are analyzed exclusively through the same image-based method, enabling internal comparisons across landing sites. Lunar and terrestrial data remain mass-based. Cross-method comparisons are performed only at the parameter level (UGSD μ, Dc, n) rather than raw cumulative percentages, as these parameters have been shown to be more robust to methodological differences (Kozakiewicz, 2018).
-
Stereological conversion where applicable. For direct comparisons between 2D ECD (equivalent circular diameter) distributions and 3D sieve data, we apply a shape correction factor of 1.3–1.5 following terrestrial studies (Heilbronner and Barrett, 2013; Pizzati et al., 2023). This converts 2D measurements to estimated 3D grain sizes. The correction factor is applied only in interpretive discussions (Sect. 5) and is clearly flagged as an approximation.
-
Uncertainty propagation. The inter-operator variability documented in Sect. 4.4 (CV ≈ 5 %–8 % for key parameters) implicitly captures the combined effects of the 2D-to-3D approximation and operator-dependent grain delineation. This uncertainty is reported alongside all fitted parameters in Dataset S4.
2.4 Probability Distribution of UGSD Parameters
The UGSD provide quantitative constraints on method-induced variability. Rather than erasing method differences, the UGSD framework makes them explicit and traceable by transferring the measured textural fractions to the parameter set (μ, Dc, n). Moreover, as discussed below, the probability distribution of the exponent μ provides a potential method to recover the “loss” of fine content in the sampling methods, e.g., as in the case of Mars.
The UGSD parameters (μ, Dc, n) exhibit spatial variability across sampling sites, reflecting the inherent heterogeneity of granular materials under different surface processes. Among these, the exponent μ – which correlates positively with fine-grain content – serves as the most sensitive indicator of local textural characteristics and is therefore the primary focus of our probabilistic analysis. The characteristic size Dc also varies spatially and its distribution can be analyzed similarly, while the shape exponent n primarily reflects broad-scale differences between planetary bodies or major process regimes (e.g., n≈ 1 for Earth and Moon, n>1 for Mars) and is not considered for site-scale probability distributions. Figure 4a displays the (μ, Dc) points of all the samples from the three bodies. Soils from the Earth, Moon, and Mars. The cluster of the Earth covers soils of almost all the types from continents, while clusters of the Moon and Mars are limited to samples in the landing sites. Future explorations of the Moon and Mars are expected to fill the data gaps.
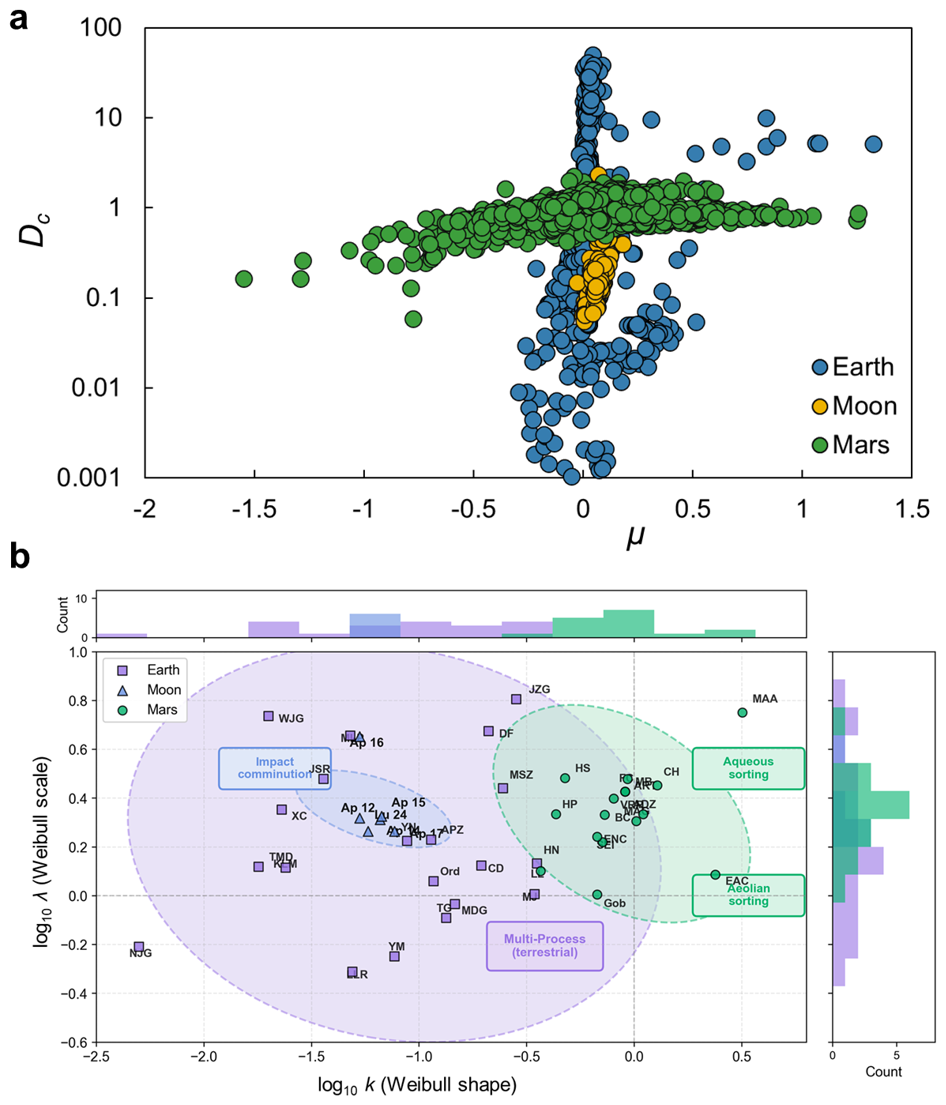
Figure 4Clustering of UGSD parameters (μ, Dc) and Weibull distribution parameter (k, λ) for the PlanetGSD 1.0 sites. (a) (μ, Dc) clustering in the Earth, Moon, and Mars. (b) (k, λ) clustering for the three bodies. The marginal histograms show the distribution of k (top) and λ (right) for each planetary body. Notably, some terrestrial sites (e.g., mass movement deposits and periglacial colluvium) plot within the lunar field. These terrestrial samples are dominated by physical comminution with minimal chemical weathering, producing k–λ signatures similar to lunar impact-gardened regolith. This overlap does not indicate identical surface processes, but rather demonstrates that the Weibull parameter space captures textural similarity across different genetic environments. Full site acronyms and geological descriptions are provided in Table S5 (Zhang, 2026a).
The (μ, Dc) value can be assigned to each point in principle; while for a target area, no matter of the scale, they present a probability distribution. For example, at the site level, the population of μ values is found to follow the three-parameter Weibull distribution:
where μ0 is the location parameter (the minimum measured μ value), λ is the scale parameter (characteristic spread), and k is the shape parameter (controlling distribution tail behavior). The three-parameter form was adopted because it provides greater flexibility than the two-parameter version, accommodating potential shifts in the minimum μ value that may arise from site-specific depositional or weathering histories. Fitting was performed using maximum likelihood estimation (scipy.stats.weibull_min.fit in Python).
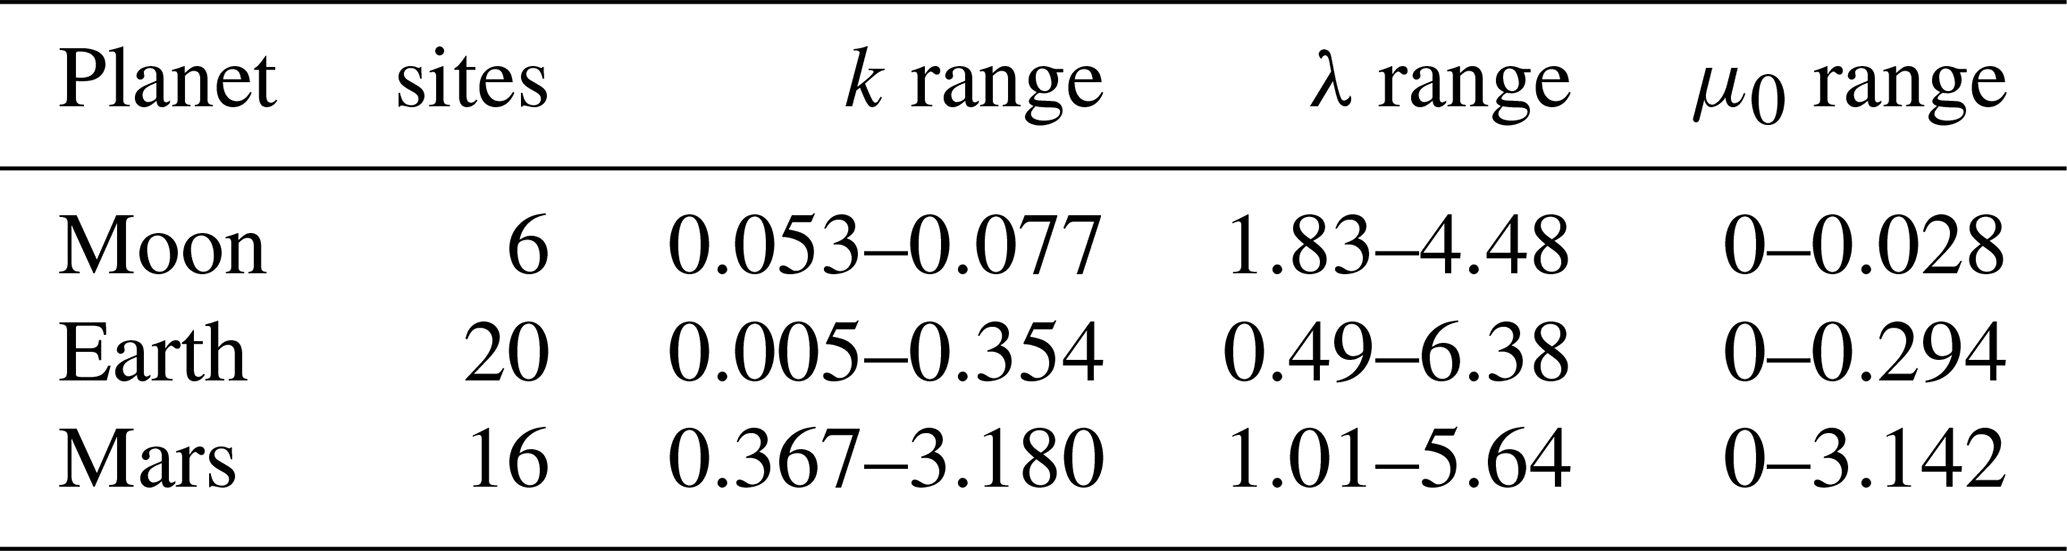
Table 6 summarizes the ranges of fitted Weibull parameters across the three planetary bodies, and Fig. 4b displays the site-level (k, λ) points for all 42 locations of the samples in the dataset. One sees distinct point groups for the three planetary bodies, supporting the utility of the k–λ parameter pair as a diagnostic descriptor for cross-planetary comparison. Complete site-level Weibull parameters, including geological context and dominant process annotations, are provided in Dataset S4 (Sheet 2).
2.5 From GSD measurements to random parameter fields
The preceding sections established a two-step transformation of raw grain-size measurements into a unified probabilistic framework (Fig. 5). First, the UGSD function converts the original GSD curves into a compact set of interpretable parameters (μ, Dc, n), reducing high-dimensional textural data to physically meaningful indices (Sect. 2.3). Second, at each sampling site, the population of μ values is characterized by a three-parameter Weibull distribution (Sect. 2.4), capturing the local spatial variability of fine-grain content in a probabilistic form.
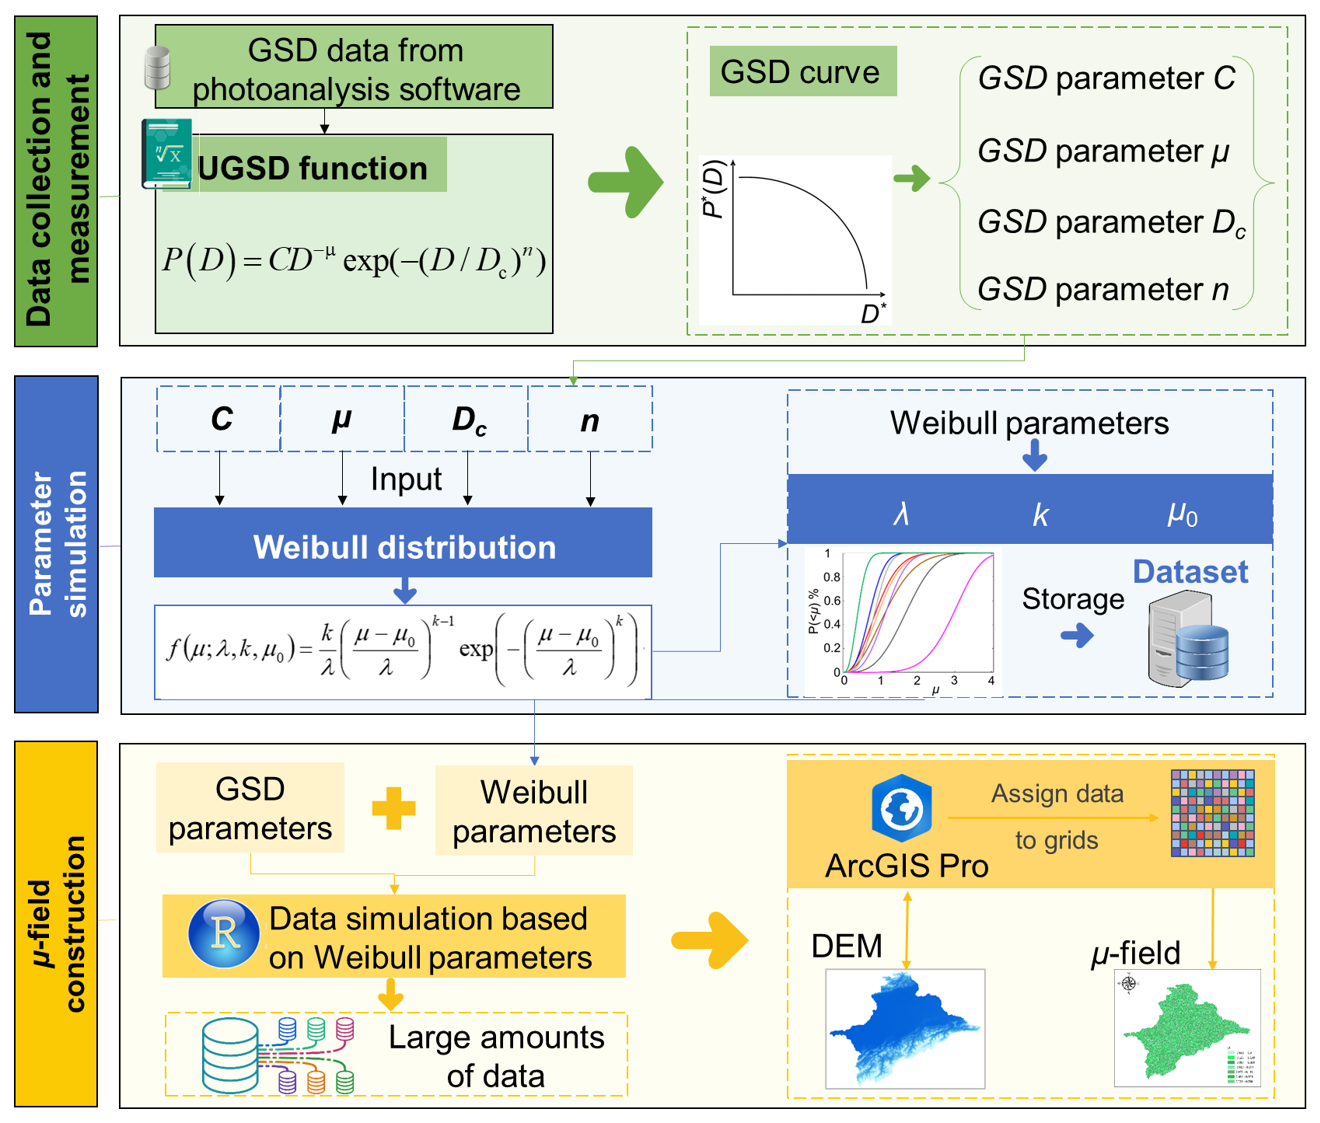
Figure 5Workflow for generating spatially continuous μ-fields from raw GSD measurements. The process involves three stages: (1) UGSD fitting to extract μ for each sample; (2) Weibull parameterization of site-level μ populations and Monte Carlo simulation of random μ values; (3) IDW interpolation onto DEM grids to produce continuous μ-fields. This transformation converts conventional observational data into a probabilistic parameter library, enabling stochastic simulation and cross-site comparison.
This transformation fundamentally changes the nature of the dataset: from a conventional collection of discrete observations to a probabilistic GSD parameter library. In this library, each site is represented not by individual measurements but by the probability distribution of its granular characteristics (μ0, k, λ), enabling stochastic simulation and extrapolation beyond the original sampling locations.
The probabilistic parameterization naturally leads to the concept of granular fields – spatially continuous representations of soil heterogeneity derived from the site-level Weibull parameters. Following the workflow of Zhang et al. (2022), μ-fields are generated through a three-step Monte Carlo procedure:
UGSD fitting of measured GSD data to obtain μ for each sample (as described in Sect. 2.3).
Weibull parameterization and Monte Carlo simulation – For each sampling site, the population of μ values is fitted to the three-parameter Weibull distribution (Sect. 2.4). An ensemble of N random μ values is then generated by sampling from this fitted distribution, with N specified by the user (default N= 1000).
Spatial interpolation – The simulated μ values are assigned to a Digital Elevation Model (DEM)-registered grid via inverse-distance-weighted (IDW) interpolation (power = 2).
To ensure that the generated μ-fields respect realistic spatial continuity – an essential characteristic of geological and geomorphic units – the IDW interpolation is applied within spatial autocorrelation constraints defined by an exponential variogram model, with correlation length empirically determined from field observations (10 grid units at hillslope scale, 50 m at watershed scale). Users can specify DEM resolution, interpolation radius, and the number of Monte Carlo realizations.
The resulting μ-fields provide spatially explicit estimates of grain-size characteristics that preserve local heterogeneity while enabling upscaling to regional scales. Because soil properties such as porosity, permeability, and shear strength can be expressed as functions of μ (Jiang et al., 2024), these granular fields can be further transformed into property fields for hydro-geophysical modeling, rover mobility simulation, or in-situ resource utilization assessment. The complete workflow, from raw measurements to μ-fields, is illustrated in Fig. 5, and the implementation codes are provided in Codes S1–S3.
Importantly, the probabilistic framework presented here – specifically, the finding that site-level μ populations follow a three-parameter Weibull distribution – offers a principled way to partially overcome the spatial sampling bias inherent in mission-specific datasets. Because the Weibull model captures the statistical variability of GSD parameters, it enables stochastic simulation of grain-size characteristics for unsampled terrains (e.g., Martian highlands or dune fields not yet visited by rovers). Thus, while PlanetGSD 1.0 does not eliminate spatial bias, it provides a probabilistic pathway to propagate observed heterogeneity to unobserved locations – a point we return to in Sect. 6.3.
The UGSD function has harmonized the textural data to a set of analytical parameters (μ, Dc, n), while preserving the integrity of the measurements. This allows to construct a new-type dataset of soil from the traditional measured data of texture or moisture of soils.
3.1 Database structure and file inventory
3.1.1 Folder organization
All datasets are provided in Microsoft Excel format (.xlsx) to accommodate multi-sheet structures that organize GSD curves, metadata, and quality flags within single files. The complete PlanetGSD 1.0 database is organized in a hierarchical folder structure with separate directories for data files, analysis codes, and documentation:
-
PlanetGSD_v1.0.0/
-
|– data/
-
|– codes/
-
|– README.txt.
3.1.2 File inventory
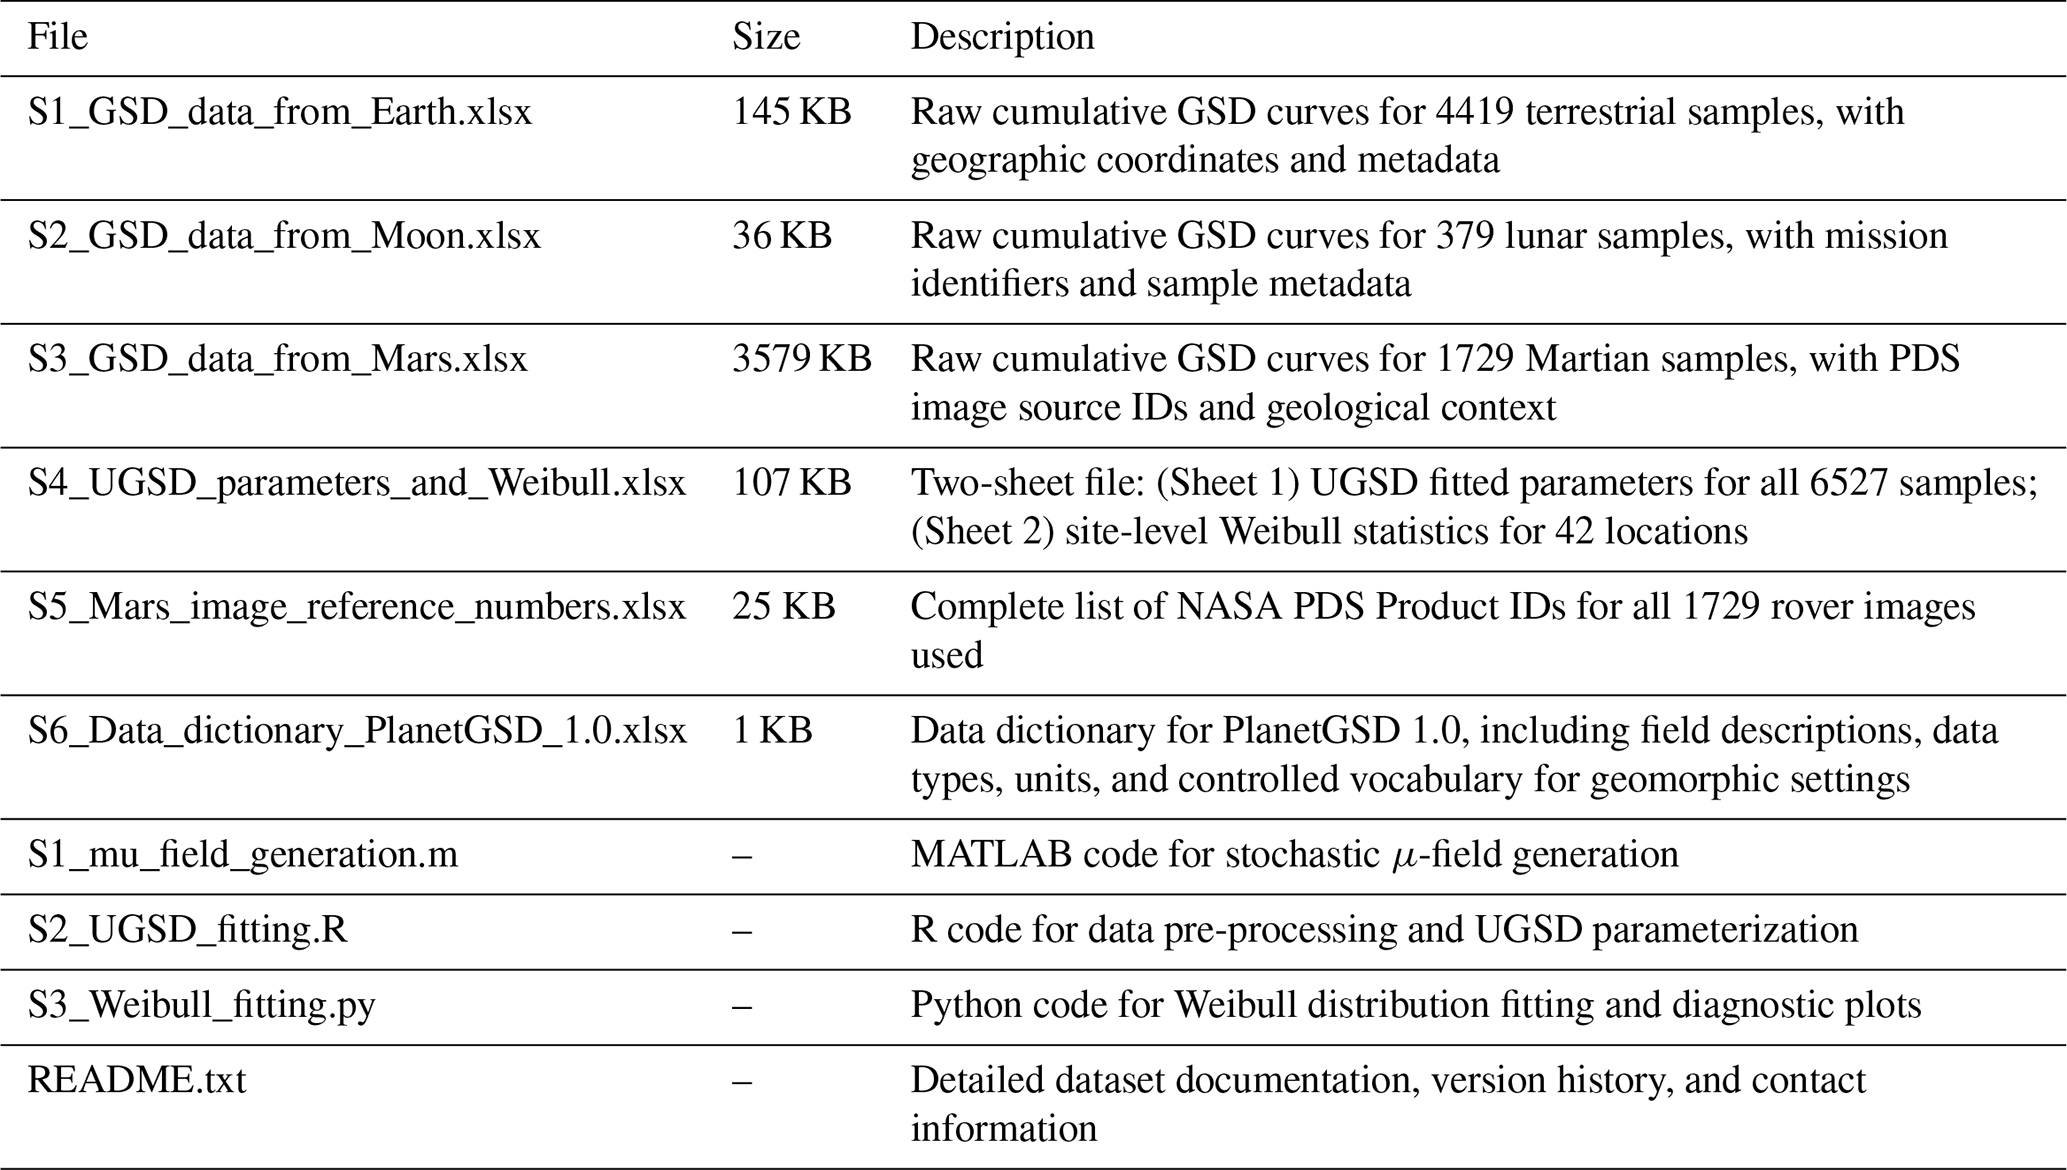
A complete inventory of all files in the PlanetGSD 1.0 repository is provided in Table 7, including file names, sizes, and brief descriptions.
3.2 Database structure overview
The PlanetGSD 1.0 database is organized into five core datasets (Tables S1–S5), each containing raw GSD measurements, fitted parameters, and associated metadata:
-
Dataset S1 (Earth GSD) contains 4419 terrestrial grain-size distributions with complete cumulative curves (17 size fractions from 0.0001 to 20 mm) and georeferenced metadata, integrating field-collected samples (2847) and literature-derived data (1572).
-
Dataset S2 (Lunar GSD) comprises 379 lunar grain-size distributions from eight sample-return missions (Apollo, Luna, Chang'e), with 9–15 size fractions per sample depending on mission protocol.
-
Dataset S3 (Mars GSD) provides 1729 grain-size distributions derived from semi-automated analysis of 2160 rover images, with 8 logarithmic size bins (0.04–25 mm) and full PDS image traceability.
-
Dataset S4 (UGSD and Weibull parameters) contains fitted UGSD parameters (C, μ, Dc, n) for all 6527 samples (Sheet 1) and site-level three-parameter Weibull statistics (μ0, k, λ) for 42 sampling locations (Sheet 2), with quality flags and geological context annotations.
-
Dataset S5 (Site descriptions, acronyms, and dominant surface processes) provides a comprehensive list of all 42 sampling locations across Earth, the Moon, and Mars. For each site, the dataset includes: planet, acronym, full site name, geomorphic setting, and dominant surface process(es).
All datasets are provided in Microsoft Excel format (.xlsx) with multi-sheet structures to organize raw data, metadata, and quality flags within single files. Users are referred to the Figshare repository Zhang (2026a) for direct data access.
3.3 Data dictionary
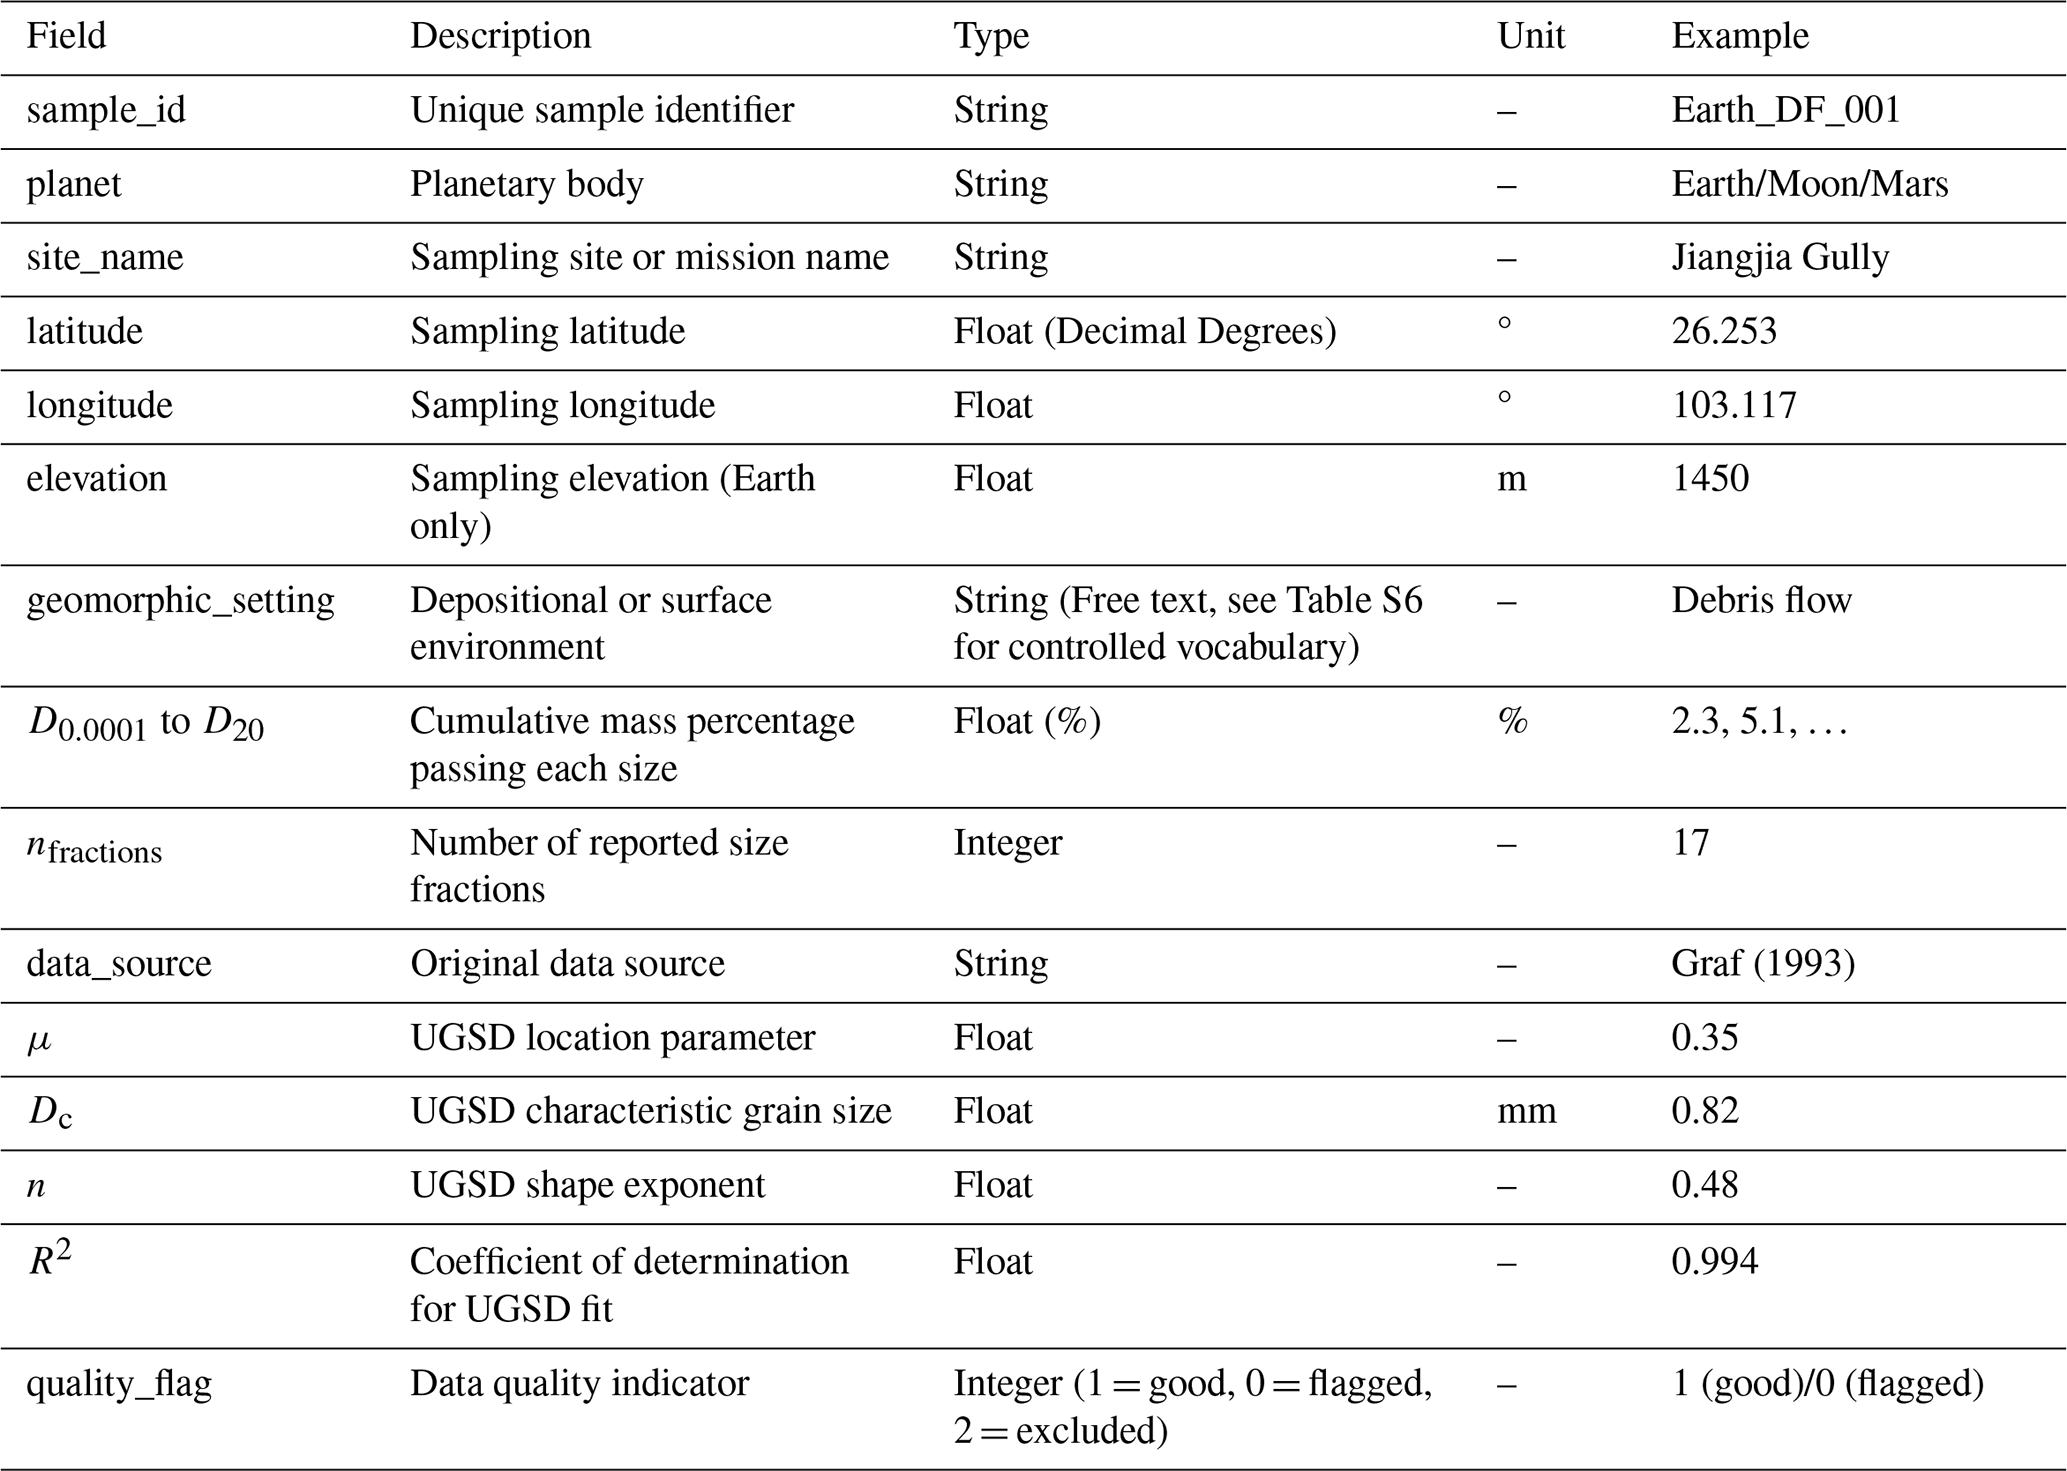
To facilitate correct interpretation and usage of the PlanetGSD 1.0 datasets, Table 8 provides complete field definitions for all variables appearing in Datasets S1–S5. The table includes field names, descriptions, data types, units, and example values, serving as a detailed reference to complement the database structure overview in Sect. 3.2.
The validation of PlanetGSD 1.0 was conducted through a four-step procedure: (1) assessing UGSD fitting quality across all 6527 samples; (2) evaluating Weibull parameterization quality at the site level; (3) verifying compiled data against original source publications; and (4) assessing inter-operator reproducibility for Martian image-derived measurements.
4.1 UGSD fitting quality
All 6527 samples were fitted to the UGSD function (Eq. 3) using nonlinear least-squares optimization. Goodness-of-fit was quantified using the coefficient of determination (R2). Figure 3 shows the rescaled UGSD curves for Earth (a), Moon (b), and Mars (c), demonstrating the unified fitting performance across planetary bodies.
Median R2 values are 0.991 (Earth), 0.989 (Moon), and 0.983 (Mars), with 97.8 % of all samples yielding R2>0.95 (Table 9). The terrestrial and lunar populations exhibit strongly left-skewed R2 distributions, with > 85 % of samples achieving R2>0.98. The slightly lower Martian median is attributable to the truncation of the fine tail below ∼ 0.04–0.15 mm imposed by imaging resolution limits, which reduces the number of constraining data points available for curve fitting. Although a small number of lunar data points in Fig. 3b deviate slightly from the reference curve, these points correspond predominantly to coarse grains (D>1). Because soil physical properties are governed primarily by fine grains (Zhang et al., 2025), these minor deviations have negligible influence on the overall validity of our approach.
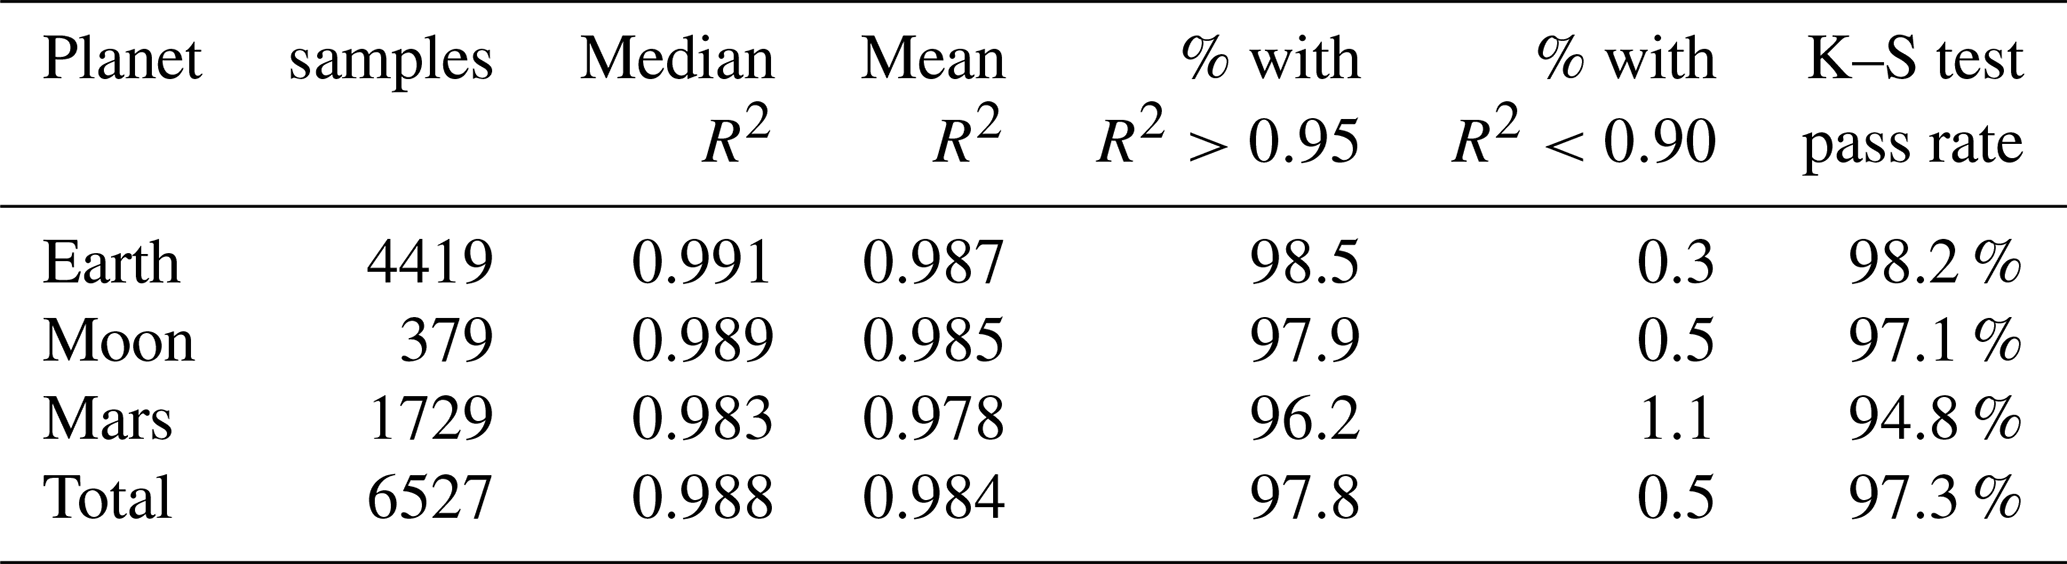
Following the outlier screening protocol (Sect. 2.3.2), 23 samples (0.4 % of total) with R2<0.94 were excluded after manual review due to data-entry errors or highly irregular curve shapes inconsistent with natural GSD. An additional 24 samples (0.4 %) with 0.90 were retained but flagged (quality_flag = 0) in Dataset S4 for user awareness. The remaining 6480 samples (99.3 %) carry quality_flag = 1 and are recommended for analysis without restriction.
Comparison with alternative parameterizations. To demonstrate the advantage of the UGSD function, we fitted all 6527 samples to three alternative models (lognormal, Rosin-Rammler, and Fredlund three-parameter) and found that UGSD achieved higher median R2 values than all three alternatives.
Kolmogorov-Smirnov test at significance level α= 0.05; pass rate indicates percentage of samples where the UGSD fit is not significantly different from the measured distribution (p>0.05).
The physical interpretation of UGSD parameters is supported by controlled experiments and field observations (Yong et al., 2017; Zhang et al., 2023): μ increases with fine-grain content (with μ>1 typical of aeolian settings, μ≈ 0.5 for fluvial-aeolian transitions, and μ<0.5 for lag or impact-mixed deposits), Dc marks the grain-size break point related to transport energy, and n reflects coarse-tail sorting efficiency. All four UGSD parameters are physically constrained (C>0, Dc>0, n>0); μ has no sign constraint because grain sizes below 1 µm yield negative ln(diameter) values, which is common in fine-grained samples. Statistically, the model is well-constrained: each GSD curve is fitted from > 10 independent size fractions (Earth/Moon) or > 150 grain measurements (Mars), and subsampling cross-validation confirms that the fitted UGSD parameters are stable, with standard deviations substantially smaller than the site-level variability across samples.
4.2 Weibull parameterization quality
Three-parameter Weibull distributions were fitted to site-level μ populations for all 42 sites (20 Earth, 6 Moon, 16 Mars). Fit quality was assessed using two complementary approaches: the Kolmogorov–Smirnov (K–S) goodness-of-fit test at significance level α= 0.05, and visual inspection of Q–Q (quantile-quantile) plots comparing observed μ quantiles against theoretical Weibull quantiles.
Of the 42 sites, 39 (93 %) passed the K–S test, indicating that the three-parameter Weibull model adequately describes the μ population structure at most sampling locations. The three sites that did not pass are all terrestrial (MJ, DF, JZG) and exhibit bimodal μ distributions attributable to the mixing of geomorphically distinct lithological units within a single sampling area. Their Weibull parameters are retained in Dataset S4 (Sheet 2) with explanatory notes in the geological_description field; users may choose to exclude these sites or to fit separate Weibull distributions to the identified sub-populations.
4.3 Verification against published values
To verify the accuracy of compiled and processed data, we cross-checked subsets of samples from each planetary body against original source publications. This procedure tests for systematic errors introduced during data transcription, digitization, and processing.
-
Lunar samples. Median grain sizes (D50) for 50 Apollo samples were compared with values reported in the Lunar Sourcebook (Heiken et al., 1991). The mean absolute deviation between our compiled values and the Lunar Sourcebook was 4.2 µm (range: 0.3–11.8 µm), within the reported measurement uncertainty of ±5 µm for the original sieving analyses (Graf, 1993). No systematic bias was observed (mean signed deviation: +0.8 µm), confirming that digitization from the NASA Lunar Soils Grain Size Catalog did not introduce directional errors.
-
Martian samples. D50 values for 30 Gale Crater samples were compared with those reported by Fedo et al. (2015) and Weitz et al. (2018) for overlapping locations. The mean absolute deviation was 0.08 mm (range: 0.01–0.22 mm), consistent with the inter-operator variability of ±15 % documented for image-based grain-size measurements (see Sect. 4.4). No systematic offset was detected between our measurements and published values (mean signed deviation: −0.02 mm).
-
Terrestrial samples. For 100 randomly selected literature-derived samples with data available in the original publications, we verified cumulative grain-size percentages at the D10, D50, and D90 percentile levels. All values matched within rounding error (mean absolute difference: 0.3 %; maximum: 0.8 %). For the subset of 127 samples where original studies used hydrometer rather than laser diffraction methods, clay content (< 2 µm) agreed within ±2.1 % (mean absolute deviation) when cross-validated against laser diffraction measurements in overlapping datasets, consistent with known inter-method variability (Konert and Vandenberghe, 1997).
These checks confirm that data transcription and processing introduced no systematic errors into PlanetGSD 1.0.
4.4 Inter-operator reproducibility of Martian measurements
Because all Martian GSD data were derived from semi-automated image analysis, inter-operator variability represents an important component of measurement uncertainty. To quantify this variability, three independent analysts processed identical image sets (n= 30 images spanning all four landing sites) using the same grain-segmentation software (Shi et al., 2021; Zhao et al., 2023).
Results are summarized in Table 10. Inter-operator agreement was assessed using three metrics: (i) the coefficient of variation (CV) of D50 across the three analysts; (ii) the mean absolute percentage difference in cumulative grain-size fractions; and (iii) the resulting variation in fitted UGSD parameters.
Table 10Inter-operator reproducibility for Martian image-based grain-size measurements (n= 30 images, 3 analysts).

The primary source of inter-operator variability is grain boundary delineation for overlapping or partially obscured grains. Images with > 30 % grain overlap showed systematically higher CV (mean: 14.2 %) compared to images with < 10 % overlap (mean: 3.8 %). This operator-dependent uncertainty is propagated into the UGSD parameter confidence intervals reported in Dataset S4.
These inter-operator variability estimates (CV ≈ 5 %–8 % for key parameters) are comparable to those reported in previous Mars grain-size studies using similar methods (Fedo et al., 2015; Weitz et al., 2018) and are substantially smaller than the inter-site variability observed across the four Martian landing sites, confirming that measurement uncertainty does not obscure geological signal in the dataset. However, caution is warranted in attributing the observed inter-site variability solely to geological signals. Alternative factors may also contribute to the relatively small variability observed among the four Martian landing sites.
First, the inherent resolution limits of image-based measurements (Table 3) truncate the fine tail of all Martian GSD curves below ∼ 0.04–0.15 mm, depending on the instrument. This right-censoring reduces the number of constraining size fractions available for UGSD fitting, which may artificially reduce apparent inter-site variability in the derived parameters – meaning that some of the observed similarity across sites could reflect what the instruments cannot resolve, rather than a true geological signal.
Second, the four landing sites – Gale, Jezero, Gusev, and Meridiani – are all located in low-latitude regions with broadly similar aeolian regimes. This geographic concentration does not capture the full range of Martian surface textural diversity (e.g., high-latitude mantling terrains, dust-dominated regions, or polar layered deposits).
We note that while Martian dust storms are known to mobilize and transport fine grains globally (Kahre et al., 2017; Senel et al., 2021), the grain-size fractions most affected by this process (silt and clay, < 62 µm) are below the detection limits of the rover imagers used in this study (Table 3). Therefore, the potential homogenizing effect of dust storms cannot be directly evaluated with our data and is not invoked as an explanation for the observed inter-site variability.
The inter-operator variability reported above (CV ≈ 5 %–8 %) inherently captures the combined effects of operator-dependent grain boundary delineation and the spherical shape approximation, as both contribute to the observed dispersion in fitted parameters.
This section demonstrates three representative applications of PlanetGSD 1.0 and identifies open questions for future research.
5.1 Cross-planetary comparison of GSD signatures and μ-field generation
The UGSD parameterization enables not only direct comparison of GSD characteristics but also continuous representations of spatial heterogeneity. Using the site-level Weibull statistics derived in Sect. 2.4 and the Monte Carlo workflow described in Sect. 2.5, we generated μ-fields – spatially explicit maps of the UGSD parameter μ – for three representative sites, one from each planetary body (Fig. 6).
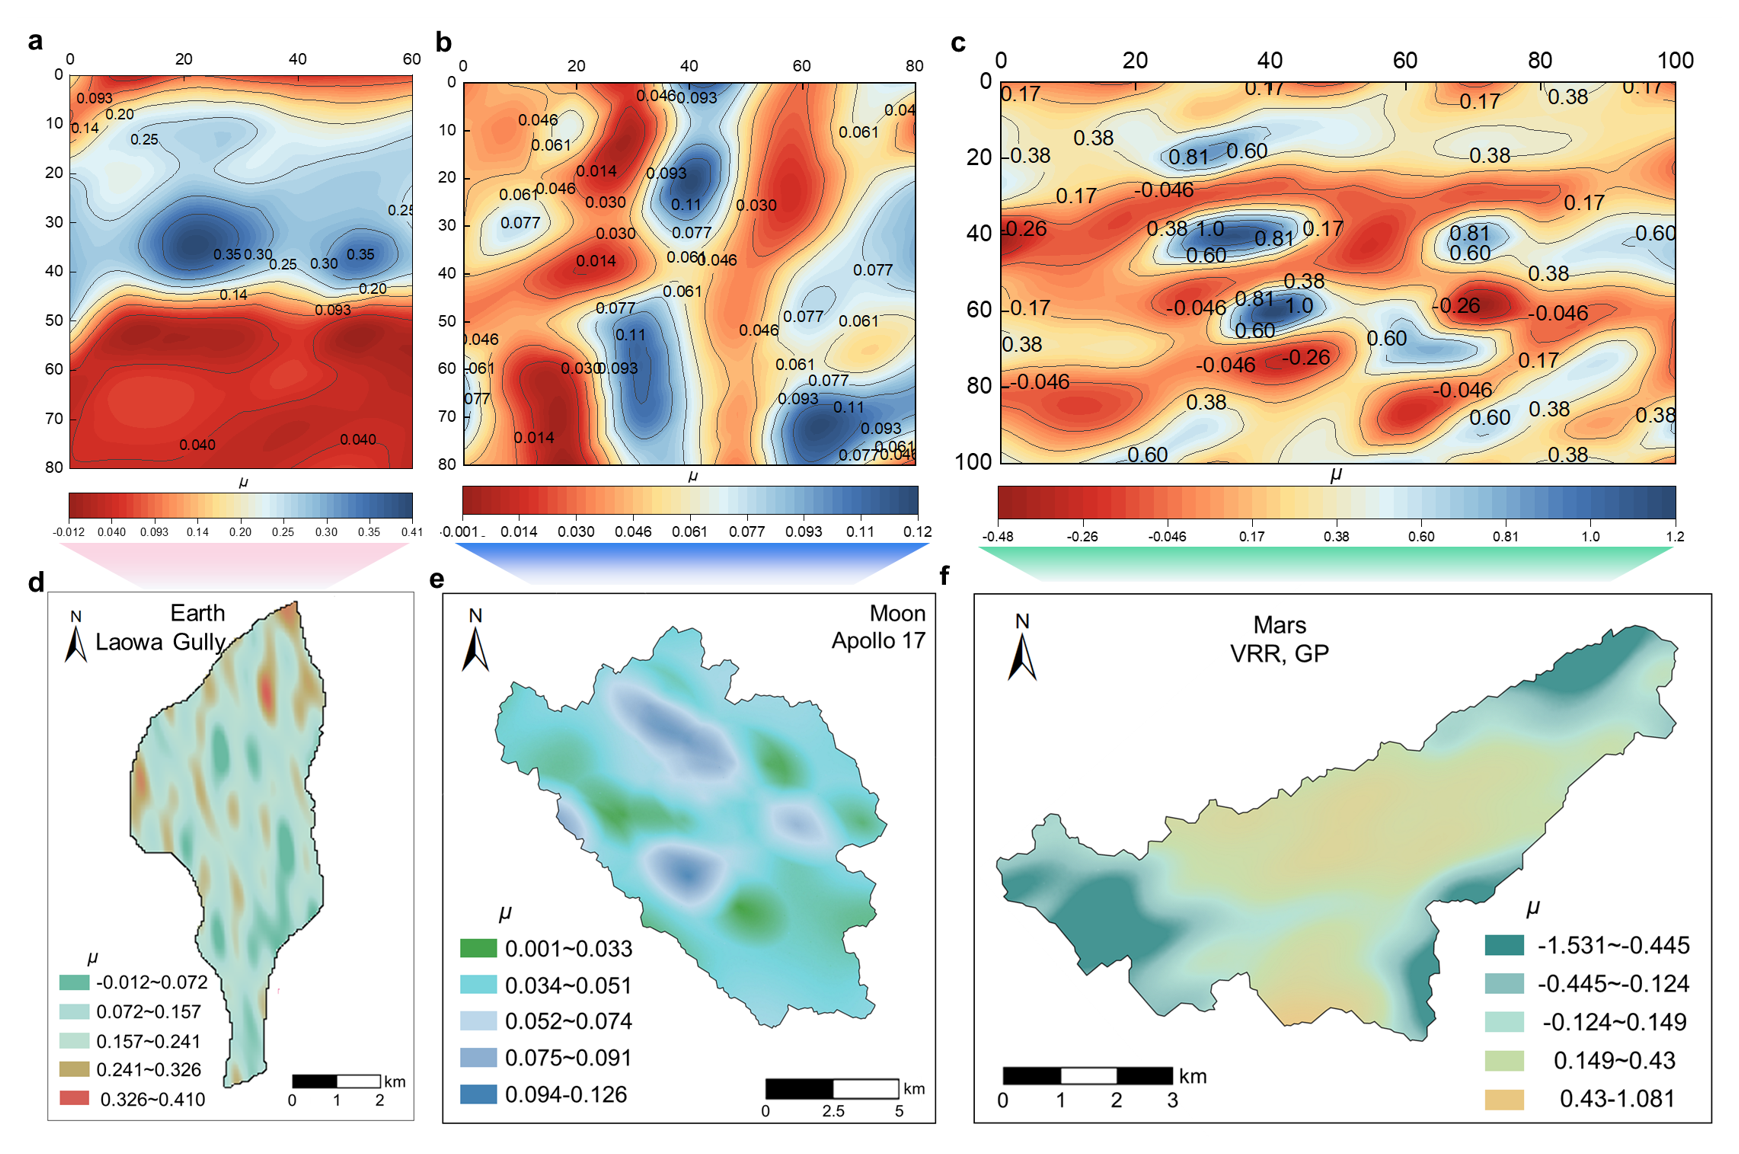
Figure 6Spatial distribution of the UGSD parameter μ across three planetary bodies. The top row (a–c) shows μ-field maps for representative sites: (a) Laowa Gully, Earth; (b) Apollo 17 Taurus-Littrow valley, Moon; (c) Vera Rubin Ridge–Greenheugh Pediment area, Gale Crater, Mars. The bottom row (d–f) displays enlarged views of the corresponding areas at higher spatial resolution: (d) Laowa Gully; (e) Apollo 17 site; (f) Vera Rubin Ridge–Greenheugh Pediment area.
The Laowa Gully (Earth) simulation produces a spatially homogeneous μ-field (range = 0.422), representing the null hypothesis of uniform grain-size distribution under uniform pedogenic processes (Zhang et al., 2022). This pattern can serve as a baseline for detecting anthropogenically-induced or naturally-occurring spatial heterogeneity in regions where limited field data suggest uniformity. The Apollo 17 Taurus-Littrow valley (Moon) simulation exhibits fine-scale random heterogeneity (∼ 100 m correlation length) without persistent spatial gradients (range = 0.125, Moran's I = 0.08). This pattern represents the stochastic mixing expected from impact gardening – dominant regolith – forming process on airless bodies – where meteoroid bombardment produces spatially uncorrelated grain-size distributions (McKay et al., 1991; Szalay et al., 2019). The Vera Rubin Ridge–Greenheugh Pediment area in Gale Crater (Mars) simulation shows a pronounced spatial gradient (range = 1.612, Moran's I = 0.76). This pattern demonstrates how directional geomorphic features (e.g., valley networks, crater rims, or lithological contacts extracted from DEMs) can induce systematic spatial organization in modeled grain-size distributions.
These contrasting patterns illustrate the flexibility of our spatial parameterization approach (Sect. 2.4) in generating diverse heterogeneity patterns under varying geomorphic constraints. While direct field validation of these simulations remains challenging for planetary surfaces due to the scarcity of in-situ grain-size transects at comparable scales, the demonstrated patterns provide testable hypotheses for future mission targets. For terrestrial applications (e.g., Laowa Gully), the same methodology can generate spatially explicit heterogeneity fields when user-provided DEM data are available, with field validation deferred to future work. The provided code (Code S1) enables users to generate analogous μ-fields for any study site using their own DEM data.
The overlap between the lunar field and a subset of terrestrial sites (e.g., Jiangjia Gully, Kunlun Mountains) in Fig. 4 warrants explanation. Lunar regolith is dominated by impact comminution (Devine et al., 1982; King, 1977), producing extremely fine grained, poorly sorted distributions with low μ values (Table 5). The overlapping terrestrial samples are dominated by physical fragmentation under cold or arid conditions (e.g., glacial till, periglacial colluvium, debris flow deposits), where chemical weathering is minimal (Attal et al., 2015; Weinman et al., 2011). Their Weibull parameters (low k, low μ) quantitatively mirror the textural signature of impact dominated fragmentation. This overlap thus highlights a fundamental insight: different geological processes that share a dominance of physical comminution over chemical alteration can produce similar grain size distribution fingerprints (Ovalle and Dano, 2011; Toneva and Peukert, 2007). The parameter space therefore discriminates process regimes (physical vs. chemical weathering) rather than planetary provenance per se. We have elaborated this interpretation in the revised Fig. 4 caption and Sect. 6.3.
For a complementary view of the parameter space itself, the three planetary populations occupy largely distinct domains: Earth spans the μ range from −0.012 to +0.41, Moon occupies a narrow near-zero range (0.001 to 0.126), and Mars displays the broadest μ range (from −1.531 to +1.081). The non-overlapping Weibull shape parameter k ranges (Table 6) further confirm systematic differences among the three bodies, supporting the utility of the k–λ parameter pair as a diagnostic descriptor for cross-planetary discrimination.
5.2 Regolith simulant benchmarking and spatial visualization
PlanetGSD 1.0 provides reference GSD parameters against which lunar and Martian simulant materials can be quantitatively evaluated. Users can compute the UGSD and Weibull parameters of candidate simulants using the provided analysis codes (Codes S1–S3) and compare them with the site-level parameter ranges documented in Dataset S4. For example, the Weibull parameters for Apollo mare sites (k= 0.053–0.077, λ= 1.83–4.48) define a target envelope for lunar simulants intended to replicate mare regolith; simulants falling outside this envelope can be identified as texturally non-representative. Table 11 provides example analog matches linking target terrains to PlanetGSD reference sites to facilitate such comparisons.
Table 11Example analog matches for landing-site GSD estimation.

It is important to note that Fig. 6 presents an interpolated μ field generated from the Monte Carlo workflow described in Sect. 2.5, which already accounts for spatial autocorrelation via an exponential variogram model to ensure realistic spatial continuity.
However, even with spatial autocorrelation, the current interpolation does not explicitly incorporate mapped geologic or geomorphic boundaries (e.g., lithological contacts, fault lines, or geomorphic units). Purely statistical spatial correlation without such contextual constraints is of limited value for predictive mapping, especially with sparse data points.
Therefore, the μ field in Fig. 6 is presented as a continuous visual summary of sparse point measurements, not as a final predictive soil map. It serves two modest but necessary purposes: (i) it provides an intuitive, spatially continuous visualization of the general trend of grain size, helping to generate hypotheses or guide future sampling; and (ii) it offers a baseline continuous covariate for future geostatistical models (e.g., kriging with external drift) or machine-learning approaches that will explicitly integrate geologic units, geomorphic boundaries, or remote-sensing data (planned for PlanetGSD 2.0).
Future work (PlanetGSD 2.0) will explicitly incorporate such spatial constraints to generate more robust, context-aware predictions.
5.3 Open questions and future directions
PlanetGSD 1.0 opens several avenues for future research, but it also has limitations that should guide its use and development:
-
Gaps in geologic and environmental representation. The terrestrial component is dominated by gravity-driven and fluvial deposits (debris flows, landslides, alluvial fans), while other geomorphic settings remain underrepresented. These include playa lakes, aeolian dune fields, glacial outwash plains, coastal sediments, tropical weathering profiles, and cold-desert soils (e.g., Antarctic dry valleys). The current geographic bias toward Asia (73 % of samples) is less critical than the underrepresention of these process-based endmembers. Lunar samples are predominantly from nearside mare regions, with limited representation of highland, farside, and polar materials. Martian samples are limited to four low-latitude landing sites, lacking high-latitude and dust-dominated terrains. Priority targets for future data collection include underrepresented geomorphic settings on Earth (as listed above), lunar farside and polar regions, and new Martian landing sites (e.g., Zhurong at Utopia Planitia, and high-latitudes sites such as Arcadia Planitia). A future version of PlanetGSD (e.g., PlanetGSD 2.0) should further expand farside and polar lunar sampling beyond the current CE-6 sample and include Martian terrains that have not yet been visited by rovers (e.g., highlands, polar regions, dune fields).
-
Analytical resolution limits. Martian GSD curves are right-censored below 40–150 µm depending on imaging instrument, truncating the fine tail of distributions. Validation against in-situ measurements from future sample-return missions will be essential to quantify systematic biases introduced by this truncation.
-
Process attribution. While μ shows strong empirical correlations with depositional environments (e.g., μ>1.0 for aeolian-dominated settings; μ<0.5 for lag deposits), the mechanistic links between UGSD parameters and specific surface processes remain incompletely understood. The overlapping parameter fields observed in Fig. 4 (e.g., lunar samples falling within the terrestrial envelope) indicate that the k–λ space captures textural similarity across different genetic environments rather than providing unambiguous process discrimination. Such overlaps should not be overinterpreted as evidence of identical formative processes. The primary value of the PlanetGSD parameterization lies in (i) compact representation of GSDs, (ii) quantitative cross-comparison across planetary bodies and analytical methods, and (iii) stochastic field generation (Sect. 2.5). Robust process attribution requires integration with independent geological, mineralogical, and geochemical context.
-
Integration with remote sensing. Orbital datasets (thermal inertia, hyperspectral mineralogy, radar backscatter) provide indirect constraints on surface texture at global scales. Calibrating these proxies against UGSD parameters could enable planetary-scale mapping of grain-size characteristics beyond the spatial reach of rover-based measurements.
-
Climate change effects. Long-term terrestrial GSD records may capture the influence of changing precipitation patterns and temperature regimes on weathering and sediment transport. Coupling PlanetGSD with climate datasets could provide insights into how surface processes respond to environmental forcing – a question relevant to both Earth system science and interpreting Martian paleoclimate records.
-
Coupling with orbital remote sensing. Future versions of PlanetGSD should integrate thermal inertia and photometric datasets (see limitation 7 in Sect. 6.3). Key open questions include: Can thermal inertia predict the UGSD parameter μ at rover landing sites? Do photometric phase curves correlate with Weibull k or λ? Answering these questions would enable extrapolation of GSD characteristics from point-scale measurements to regional and global scales.
6.1 Recommended applications
PlanetGSD 1.0 is designed to support the following research applications:
-
Comparative planetology. The unified UGSD parameterization enables direct comparison of grain-size signatures across Earth, Moon, and Mars. The k–λ parameter domains (Fig. 4) provide a quantitative framework for classifying samples by planetary provenance.
-
Regolith simulant benchmarking. Lunar and Martian simulants can be quantitatively compared with natural planetary materials by computing their UGSD and Weibull parameters using Codes S2 and S3. Dataset S4 provides reference parameter values for all sampled sites to facilitate such comparisons.
-
Landing site assessment. While geologic mapping and remote sensing analyses (e.g., spectroscopy, thermal inertia) remain the primary methods for determining geological context, pre-landing GSD estimates can be generated as ancillary data by identifying PlanetGSD entries with geological context similar to candidate landing sites. Such estimates provide additional constraints on surface mechanical properties (e.g., trafficability, drilling resistance) that are not directly accessible from orbital data alone. Table 11 provides example analog matches to illustrate this approach.
-
Stochastic granular field generation. Using Code S1 and the fitted Weibull parameters (Dataset S4), users can generate spatially continuous μ-fields for geotechnical modeling, rover mobility simulation, or landscape evolution studies. The workflow accepts user-supplied DEM data and outputs μ-fields as GeoTIFF files compatible with standard Geographic Information System (GIS) software. Users can specify DEM resolution, interpolation radius, and the number of Monte Carlo realizations.
-
Integration with remote sensing. The μ-field framework provides sub-pixel grain-size information that complements orbital datasets such as thermal inertia and radar backscatter. Coupling μ-fields with geophysical transfer functions enables the derivation of spatially continuous porosity and cohesion estimates for engineering applications at future landing sites.
6.2 Methodological guidance for users
To ensure robust application of PlanetGSD 1.0, users should consider the following guidance:
-
Parameter interpretation. While the UGSD parameter μ correlates positively with fine-grain content and the Weibull shape parameter k reflects the width of the μ distribution, these are empirical descriptors derived from curve fitting. Direct translation of μ to physical quantities such as porosity, permeability, or shear strength should be undertaken with caution. Such applications are most robust when μ is coupled with complementary site-specific data or established geotechnical transfer functions (e.g., Zhang et al., 2022; Jiang et al., 2024). The parameters are primarily intended for comparative purposes – e.g., ranking sites by relative fineness or sorting – rather than for absolute grain-size inference.
-
Martian data handling. All Martian GSD curves are right-censored below instrument-specific resolution limits (Table 2). Users conducting analyses sensitive to the fine fraction (< 0.1 mm) should treat cumulative percentages in the smallest size bin as lower bounds rather than absolute values. For statistical applications, we recommend incorporating the truncation thresholds (provided in Dataset S3 metadata) into uncertainty estimates. Sample-return measurements will be essential for future validation of these image-derived GSDs.
-
Lunar sample mass. Lunar samples with mass < 5 g are flagged (quality_flag = 0) in Dataset S2 metadata due to potential sampling bias toward coarser fractions. Users requiring unbiased fine-fraction statistics should apply mass-based filtering to retain only quality_flag = 1 samples.
6.3 Limitations and caveats
Users should be aware of three principal limitations when using PlanetGSD 1.0, organized around data completeness, data integrity, and appropriate application scale.
6.3.1 Data completeness: sampling bias and future refinements
PlanetGSD 1.0 reflects the historical focus of planetary exploration. Lunar samples are predominantly from nearside, low-latitude mare regions, with highland and farside materials underrepresented. Martian grain-size estimates are restricted to rover-accessible terrains (often flat, low-risk, and rock-free surfaces). The terrestrial component is biased toward poorly sorted deposits (debris flows, colluvium, moraines), with well-sorted aeolian dunes and littoral sands underrepresented.
-
Implication for users. This sampling is not spatially random and does not represent the full geological diversity of either body. However, rather than ignoring this bias, PlanetGSD 1.0 makes it explicit: each sample retains its geographic metadata and landing-site context; site-level Weibull parameters describe local μ variability without extrapolating to unsampled landscapes. The unified UGSD framework renders this bias visible and quantifiable – a prerequisite for addressing it in future versions.
-
Future refinements. As more samples become available – particularly from the lunar highlands, lunar farside (e.g., Chang'e-6), and diverse Martian sedimentary environments (e.g., Jezero delta, Medusae Fossae Formation) – the (μ, Dc) and (k, λ) points for each planetary body are expected to enlarge the converge (cf. Fig. 4a and b), enabling more robust probabilistic comparisons. Two important remote-sensing techniques not yet incorporated – thermal inertia (Fergason et al., 2006; Mellon et al., 2000) and photometric Hapke modeling (Hayne et al., 2017) – offer complementary constraints on effective grain size at regional to global scales. Coupling PlanetGSD 1.0 with these datasets is a high-priority direction for PlanetGSD 2.0.
6.3.2 Data integrity: missing and censored grain-size fractions
GSDs in PlanetGSD 1.0 are incomplete in two distinct ways: physical absence of certain size fractions due to surface processes, and censoring due to instrument resolution limits.
-
Physical missing fractions. In some environments, specific grain-size classes may be genuinely absent from the sediment (e.g., the 2–4 mm gap in Jiangjia Gully debris-flow deposits). Such physical gaps are not measurement errors but real textural signatures. Users should be aware that these physical gaps may affect the shape of the grain-size distribution and, consequently, the fitted UGSD parameters (μ, Dc, n). When such gaps are present, the three-parameter Weibull distribution may provide a poorer fit, and users are encouraged to inspect the per-site grain-size curves directly rather than relying solely on summary parameters.
-
Instrument-induced censoring. All Martian GSD curves are right-censored below instrument-specific detection limits (Table 2). No current Martian imager can resolve clay-sized grains (< 2 µm) or silt-sized grains (< 40–150 µm depending on the instrument). Applying a conservative 5-pixel threshold to MAHLI at 14 µm px−1 yields a practical lower bound of ∼ 70 µm, meaning very fine sand (62.5–125 µm) is only marginally resolvable. The presence of ubiquitous Martian dust further degrades effective resolution: dust aggregates (< 100 µm) on grain surfaces obscure true boundaries, and uniform dust mantling reduces image contrast, making segmentation thresholds less reliable. To mitigate these effects, we use images acquired after dust removal tool (DRT) brushing when available; for unbrushed targets, we manually mask regions with obvious dust aggregates. The fine tail (< minimum detectable size) is truncated, not extrapolated (Sect. 2.3.2). Users should treat fine-fraction statistics as conservative lower bounds.
-
Implication for UGSD and Weibull parameters. Censoring affects μ (which correlates with fine-grain content) more severely than Dc or n. The three-parameter Weibull fit partially accommodates this through the location parameter μ0 – a shifted minimum μ value that reflects the effective lower bound of the measurement. Anomalously high μ0 values for Martian sites (Table 6) directly encode instrument-induced censoring, making the bias explicit rather than hidden.
6.3.3 Application scale: distribution parameters vs. site-specific transfer functions
PlanetGSD 1.0 supports two distinct modes of use, corresponding to different spatial scales and scientific questions. Regional-scale (cross-planetary) comparison.
-
Regional-scale (cross-planetary) comparisons. Users should rely on Weibull distribution parameters (k, λ) aggregated at the site or sample level. These parameters describe the shape and spread of μ distributions across multiple samples within a geomorphic or geological unit. Their strength is that they capture textural similarity across different genetic environments (e.g., terrestrial physical comminution sites overlapping with lunar impact-gardened regolith in k–λ space), enabling process-independent comparative planetology. Users should not interpret individual μ or Dc values at this scale, as these are sensitive to local sampling and measurement bias.
-
Local-scale (process) analysis. At the scale of individual sampling sites or sub-meter transects, users should use raw UGSD parameters (μ, Dc, n) or the full grain-size distribution curves. These can serve as input to transfer functions that relate grain-size statistics to specific surface processes. For example, the ratio may discriminate between debris-flow and fluvial deposits; the shape exponent n distinguishes impact-dominated regolith (n≈ 1) from aeolian-reworked sediments (n>1). However, as noted in Sect. 5.3, mechanistic attribution of specific surface processes from UGSD or Weibull parameters alone is not yet reliable without site-specific validation (e.g., independent geomorphic or geochemical evidence).
-
What not to do. Spatial extrapolation beyond sampled locations (e.g., using the μ-fields generated by Code S3) is provided for visualization and hypothesis generation only. In areas with sparse sampling or complex lithological boundaries, interpolated values may not accurately represent local grain-size characteristics. Users requiring spatially continuous predictions should couple PlanetGSD 1.0 with orbital remote-sensing data (thermal inertia, photometry) as planned for PlanetGSD 2.0.
6.4 Data updates and community contributions
PlanetGSD is conceived as a living database that will evolve with new missions and community input. Future versions (e.g., PlanetGSD 2.0) will incorporate:
-
Additional terrestrial environments (aeolian dunes, glacial outwash, coastal sediments, loess sequences);
-
Samples from ongoing and future missions (Mars Sample Return, Artemis lunar samples, OSIRIS-REx and Hayabusa2 asteroid samples);
-
Extended grain-size ranges from improved analytical techniques;
-
User-contributed datasets meeting quality standards.
Researchers wishing to contribute data should follow the standardized format:
-
Complete cumulative grain-size percentages at standard size classes (or at original measured sizes with clear documentation);
-
Geographic coordinates (WGS84 for Earth, Moon 2000/Mars 2000 for extraterrestrial bodies);
-
Site metadata (geomorphic setting, sampling depth, lithology, depositional environment);
-
Clear documentation of analytical methods and quality control procedures.
All contributed datasets will undergo the same validation and quality control checks applied to the original PlanetGSD compilation (see Technical Validation) before inclusion. Version history and a detailed changelog will be maintained in the repository README file.
The complete PlanetGSD 1.0 database is openly available at Figshare (https://doi.org/10.6084/m9.figshare.32362083, Zhang, 2026a) under the Creative Commons Attribution 4.0 International License (CC BY 4.0). During peer review, the data can be accessed anonymously via the same URL. The repository contains five Excel files:
-
“S1_GSD_data_from_Earth.xlsx”. 4419 terrestrial samples with cumulative curves and metadata,
-
“S2_GSD_data_from_Moon.xlsx”. 379 lunar samples from eight sample-return missions,
-
“S3_GSD_data_from_Mars.xlsx”. 1729 Martian samples derived from rover image analysis,
-
“S4_UGSD_parameters_and_Weibull.xlsx”. UGSD parameters for all samples and site-level Weibull statistics,
-
“S5_Mars_image_reference_numbers.xlsx”. PDS image Product IDs for all 1729 Mars samples,
-
“S6_Data_dictionary_PlanetGSD_1.0.xlsx”. Data dictionary for PlanetGSD 1.0.
All analysis codes are openly available in the PlanetGSD 1.0 repository at Figshare (https://doi.org/10.6084/m9.figshare.31569616, Zhang, 2026b). The repository contains three Python codes:
-
Code S1 (MATLAB). Stochastic μ-field generation (requires MATLAB R2020a or later),
-
Code S2 (R). Data pre-processing and UGSD parameterization (requires R ≥ 4.0),
-
Code S3 (Python). Weibull distribution fitting and diagnostic plots (requires Python ≥ 3.9 with NumPy, SciPy, Matplotlib, and Pandas).
The codes require Python ≥ 3.9 with NumPy, SciPy, Matplotlib, and Pandas. Version history is maintained in the Figshare repository.
The PlanetGSD 1.0 dataset establishes a unified framework for characterizing grain-size distributions across Earth, the Moon, and Mars, revealing that soils from these disparate planetary bodies conform to a single functional form – the Universal Grain-Size Distribution (UGSD). Key conclusions include:
-
UGSD universality. The UGSD function fits 6,527 samples from three planets with a median R2= 0.988, demonstrating that granular configuration transcends genetic and environmental differences. The exponent n serves as a scaling factor that classifies soils into categories that reflect textural organization inherited from formation processes.
-
μ as process indicator. The UGSD parameter μ effectively discriminates among depositional environments: μ>1.0 (aeolian-dominated), μ≈ 0.5 (fluvial-aeolian transition), μ<0.5 (lag deposits, impact-influenced mixtures). Negative μ values record fine-fraction deficiencies resulting from winnowing or analytical truncation.
-
Probabilistic behavior. Site-level μ populations follow three-parameter Weibull distributions, enabling the stochastic generation of spatially continuous μ-fields that preserve local heterogeneity while allowing upscaling to regional scales.
-
Cross-planetary comparison. The μ–Dc parameter space clusters soils by planetary body and process regime: Earth spans the widest range (diverse processes); the Moon occupies a narrow, near-zero μ range (impact comminution); Mars displays the broadest μ range (complex aqueous-aeolian-volcanic interactions).
-
Applications. Granular fields support hydro-geophysical modeling, ISRU targeting, and mission planning by providing spatially explicit estimates of soil properties derived from limited point measurements.
The UGSD framework thus provides a quantitative, mechanistically grounded approach to soil characterization that unifies terrestrial and extraterrestrial regolith studies. By reducing high-dimensional texture data to interpretable indices and enabling probabilistic field generation, it bridges the gap between limited point measurements and spatially explicit process modeling, offering a new paradigm for planetary surface science.
Table S1 provides detailed site metadata for terrestrial samples organized by geographic region, Table S2 for lunar samples, and Table S3 for Martian samples. Table S4 compiles the unimodal grain size distribution (UGSD) parameters and associated Weibull parameters for soils from all three planetary bodies. Table S5 is site descriptions, acronyms, and dominant surface processes for all sampling locations. Table S6 provides a complete data dictionary for all fields in the accompanying data files (Tables S1–S5). The geomorphological contexts of the terrestrial, lunar, and Martian sampling sites are described in Sects. S1, S2, and S3, respectively, with Table S3 additionally detailing the sub-site distribution and geological setting for Mars. Codes S1, S2, and S3 are provided for simulating grain size distribution (GSD) data, calculating Weibull parameters, and generating grain fields, respectively. The supplement related to this article is available online at https://doi.org/10.5194/essd-18-4983-2026-supplement.
JZ: Conceptualization, Data curation, Formal analysis, Software, Visualization, Writing – Original Draft. YL: Data curation, Validation, Writing – Review & Editing.
The contact author has declared that neither of the authors has any competing interests.
Publisher's note: Copernicus Publications remains neutral with regard to jurisdictional claims made in the text, published maps, institutional affiliations, or any other geographical representation in this paper. The authors bear the ultimate responsibility for providing appropriate place names. Views expressed in the text are those of the authors and do not necessarily reflect the views of the publisher.
This research has been supported by the National Youth Science Foundation (grant no. 42501091), the Open Funds of the Key Laboratory of Mountain Hazards and Engineering Resilience, CAS (grant no. KLMHER-K22), the Ministry of Science and Technology’s Key R&D Program of China (grant no. 2023YFC3206204), and the National Natural Science Foundation of China (grant nos. 42322703, 42271092).
This paper was edited by Giulio G. R. Iovine and reviewed by R. Aileen Yingst and one anonymous referee.
Aileen Yingst, R., Edgett, K., Williams, R., Hamilton, V., Mangold, N., and Bridges, N.: The texture of Mars: observations of rock and outcrop targets over 360 Martian sols at the Gale field site, EGU General Assembly Conference Abstracts, 7263, https://meetingorganizer.copernicus.org/EGU2014/EGU2014-7263.pdf (last access: 15 February 2026), 2014.
Attal, M., Mudd, S. M., Hurst, M. D., Weinman, B., Yoo, K., and Naylor, M.: Impact of change in erosion rate and landscape steepness on hillslope and fluvial sediments grain size in the Feather River basin (Sierra Nevada, California), Earth Surf. Dynam., 3, 201–222, https://doi.org/10.5194/esurf-3-201-2015, 2015.
Batjes, N. H.: Harmonized soil profile data for applications at global and continental scales: updates to the WISE database, Soil Use Manage., 5, 124–127, https://doi.org/10.1111/j.1475-2743.2009.00202.x, 2009.
Beegle, L., Bhartia, R., White, M., DeFlores, L., Abbey, W., Wu, Y. H., Cameron, B., Moore, J., Fries, M., Burton, A., Edgett, K. S., Ravine, M. A., Schaffner, J. A., Harker, R. D., and Sobron, P.: SHERLOC: scanning habitable environments with Raman & luminescence for organics & chemicals, in: 2015 IEEE Aerospace Conference, Big Sky, MT, USA, IEEE, 11 pp., https://doi.org/10.1109/AERO.2015.7119105, 2015.
Bell III, J. F., Godber, A., McNair, S., Caplinger, M. A., Maki, J. N., Lemmon, M. T., Van Beek, J., Malin, M. C., Wellington, D., Kinch, K. M., Madsen, M. B., Hardgrove, C., Ravine, M. A., Jensen, E., Harker, D., Anderson, R. B., Herkenhoff, K. E., Morris, R. V., Cisneros, E., and Deen, R. G.: The Mars Science Laboratory Curiosity rover Mastcam instruments: preflight and in-flight calibration, validation, and data archiving, Earth Space Sci., 4, 396–452, https://doi.org/10.1002/2016ea000219, 2017.
Bell III, J. F., Maki, J. N., Mehall, G. L., Ravine, M. A., Caplinger, M. A., Bailey, Z. J., Brylow, S., Schaffner, J. A., Kinch, K. M., Madsen, M. B., Winhold, A., Hayes, A. G., Corlies, P., Tate, C., Barrington, M., Cisneros, E., Jensen, E., Paris, K., Crawford, K., Rojas, C., Mehall, L., Joseph, J., Proton, J. B., Cluff, N., Deen, R. G., Betts, B., Cloutis, E., Coates, A. J., Colaprete, A., Edgett, K. S., Ehlmann, B. L., Fagents, S., Grotzinger, J. P., Hardgrove, C., Herkenhoff, K. E., Horgan, B., Jaumann, R., Johnson, J. R., Lemmon, M., Paar, G., Caballo-Perucha, M., Gupta, S., Traxler, C., Preusker, F., Rice, M. S., Robinson, M. S., Schmitz, N., Sullivan, R., and Wolff, M. J.: The Mars 2020 Perseverance rover mast camera zoom (Mastcam-Z) multispectral, stereoscopic imaging investigation, Space Sci. Rev., 217, 24, https://doi.org/10.1007/s11214-020-00755-x, 2021.
Bittelli, M., Campbell, G. S., and Flury, M.: Characterization of grain-size distribution in soils with a fragmentation model, Soil Sci. Soc. Am. J., 63, 782–788, https://doi.org/10.2136/sssaj1999.634782x, 1999.
Carrier III, W. D.: Grain size distribution of lunar soil, J. Geotech. Geoenviron., 129, 956–959, 2003.
Chaney, N. W., Wood, E. F., McBratney, A. B., Hempel, J. W., Nauman, T. W., Brungard, C. W., and Odgers, N. P.: POLARIS: a 30-meter probabilistic soil series map of the contiguous United States, Geoderma, 274, 54–67, https://doi.org/10.1016/j.geoderma.2016.03.025, 2016.
Chen, X., Hassan, M. A., and Fu, X.: Convolutional neural networks for image-based sediment detection applied to a large terrestrial and airborne dataset, Earth Surf. Dynam., 10, 349–366, https://doi.org/10.5194/esurf-10-349-2022, 2022.
Colwell, J. E., Batiste, S., Horányi, M., Robertson, S., and Sture, S.: Lunar surface: dust dynamics and regolith mechanics, Rev. Geophys., 45, https://doi.org/10.1029/2005rg000184, 2007.
Das, B. M.: Advanced soil mechanics, CRC Press, https://doi.org/10.1201/9781351215183, 2019.
Devine, J. M., McKay, D. S., and Papike, J. J.: Lunar regolith: petrology of the < 10 µm fraction, J. Geophys. Res.-Sol. Ea., 87, A260–A268, https://doi.org/10.1029/JB087iS01p0A260, 1982.
Edgett, K. S., Yingst, R. A., Ravine, M. A., Caplinger, M. A., Maki, J. N., Ghaemi, F. T., and Goetz, W.: Curiosity's Mars hand lens imager (MAHLI) investigation, Space Sci. Rev., 170, 259–317, https://doi.org/10.1007/s11214-012-9910-4, 2012.
Fedo, C. M., McGlynn, I. O., and McSween Jr., H. Y.: Grain size and hydrodynamic sorting controls on the composition of basaltic sediments: implications for interpreting Martian soils, Earth Planet. Sc. Lett., 423, 67–77, https://doi.org/10.1016/j.epsl.2015.03.052, 2015.
Fergason, R. L., Christensen, P. R., Bell III, J. F., Golombek, M. P., Herkenhoff, K. E., and Kieffer, H. H.: Physical properties of the Mars Exploration Rover landing sites as inferred from Mini-TES-derived thermal inertia, J. Geophys. Res.-Planet., 111, https://doi.org/10.1029/2005je002583, 2006.
Graf, J. C.: Lunar soils grain size catalog, NASA-RP-1265, National Aeronautics and Space Administration, https://ntrs.nasa.gov/citations/19930012474 (last access: 15 February 2026), 1993.
Hayne, P. O., Bandfield, J. L., Siegler, M. A., Vasavada, A. R., Ghent, R. R., Williams, J. P., Greenhagen, B. T., Aharonson, O., Elder, C. M., Lucey, P. G., and Paige, D. A.: Global regolith thermophysical properties of the Moon from the Diviner Lunar Radiometer Experiment, J. Geophys. Res.-Planet., 122, 2371–2400, https://doi.org/10.1002/2017je005387, 2017.
Heiken, G., Vaniman, D., French, B. M., and Schmitt, J.: Lunar sourcebook: a user’s guide to the Moon, Cambridge University Press, ISBN 0-521-33444-6, 1991.
Heilbronner, R. and Barrett, S.: Image analysis in earth sciences: microstructures and textures of earth materials, Vol. 129, Springer, https://doi.org/10.1007/978-3-642-10343-8, 2013.
Herkenhoff, K. E.: High-resolution textures of soils and rocks at Gusev Crater and Meridiani Planum from the Mars Exploration Rover microscopic imagers, AGU Fall Meeting Abstracts, P13B02, https://ui.adsabs.harvard.edu/abs/2004AGUFM.P13B..02H/abstract (last access: 15 February 2026), 2004.
Iverson, R. M. and Vallance, J. W.: New views of granular mass flows, Geology, 29, 115–118, https://doi.org/10.1130/0091-7613(2001)029<0115:nvogmf>2.0.co;2, 2001.
Jiang, H., Li, Y., Zou, Q., Zhang, J., Cui, J., Cheng, J., Zhou, B., Chen, S., Zhou, W., and Yao, H.: A GSD-driven approach to deriving stochastic soil strength parameters under hybrid machine learning models, Eur. J. Soil Sci., 75, e70009, https://doi.org/10.1111/ejss.70009, 2024.
Kahre, M. A., Murphy, J. R., Newman, C. E., Wilson, R. J., Cantor, B. A., Lemmon, M. T., and Wolff, M. J.: The Mars dust cycle, in: The atmosphere and climate of Mars, Cambridge University Press, https://doi.org/10.1017/9781139060172, 2017.
Kapui, Z., Kereszturi, A., Kiss, K., Szalai, Z., Újvári, G., Hickman-Lewis, K., Foucher, F., and Westall, F.: Fluvial or aeolian grains? Separation of transport agents on Mars using earth analogue observations, Planet. Space Sci., 163, 56–76, 2018.
Karunatillake, S., Wray, J. J., Gasnault, O., McLennan, S. M., Rogers, A. D., Squyres, S. W., Boynton, W. V., Skok, J. R., Ojha, L., and Olsen, N.: Sulfates hydrating bulk soil in the Martian low and middle latitudes, Geophys. Res. Lett., 41, 7987–7996, https://doi.org/10.1002/2014GL061136, 2014.
King, E. A.: The lunar regolith: physical characteristics and dynamics, Philos. T. R. Soc. A, 285, 273–278, https://doi.org/10.1098/rsta.1977.0065, 1977.
Konert, M. and Vandenberghe, J. E. F.: Comparison of laser grain size analysis with pipette and sieve analysis: a solution for the underestimation of the clay fraction, Sedimentology, 44, 523–535, https://doi.org/10.1046/j.1365-3091.1997.d01-38.x, 1997.
Kozakiewicz, J.: Image analysis algorithm for detection and measurement of Martian sand grains, Earth Sci. Inform., 11, 257–272, https://doi.org/10.1007/s12145-018-0333-y, 2018.
Kozakiewicz, J., Maj, D., Mol, S., Sobucki, M., Michaels, T., and Frodyma, N.: Seasonality of aeolian landforms on Meridiani Planum, Mars, Icarus, 425, 116325, https://doi.org/10.1016/j.icarus.2024.116325, 2025.
Li, C., Hu, H., Yang, M. F., Pei, Z. Y., Zhou, Q., Ren, X., Liu, B., Liu, D., Zeng, X., Zhang, G., Zhang, H., Liu, J., Wang, Q., Deng, X., Xiao, C., Yao, Y., Xue, D., Zuo, W., Su, Y., Wen, W., and Ouyang, Z.: Characteristics of the lunar samples returned by the Chang'E-5 mission, Natl. Sci. Rev., 9, nwab188, https://doi.org/10.1093/nsr/nwab188, 2022.
Li, C., Hu, H., Yang, M. F., Liu, J., Zhou, Q., Ren, X., and Ouyang, Z.: Nature of the lunar far-side samples returned by the Chang'E-6 mission, Natl. Sci. Rev., 11, nwae328, https://doi.org/10.1093/nsr/nwae328, 2024.
Luo, A., Cui, Y., Wang, G., Nie, J., Xu, C., Zhang, Z., Zhang, J., Li, Y., Zhao, Q., and He, H.: Saturation of space weathering in shaping lunar regolith particle morphology, Nat. Commun., 17, 2220, https://doi.org/10.1038/s41467-026-68824-3, 2026.
McKay, D. S., Heiken, G., Basu, A., Blanford, G., Simon, S., Reedy, R., French, B. M., and Papike, J.: The lunar regolith, in: Lunar sourcebook, Cambridge University Press, https://www.lpi.usra.edu/publications/books/lunar_sourcebook/pdf/Chapter07.pdf (last access: 15 February 2026), 1991.
Mellon, M. T., Jakosky, B. M., Kieffer, H. H., and Christensen, P. R.: High-resolution thermal inertia mapping from the Mars Global Surveyor thermal emission spectrometer, Icarus, 148, 437–455, https://doi.org/10.1006/icar.2000.6503, 2000.
Milliken, R. E., Ewing, R. C., Fischer, W. W., and Hurowitz, J.: Wind-blown sandstones cemented by sulfate and clay minerals in Gale Crater, Mars, Geophys. Res. Lett., 41, 1149–1154, https://doi.org/10.1002/2013GL059097, 2014.
Minitti, M. E., Kah, L. C., Yingst, R. A., Edgett, K. S., Anderson, R. C., Beegle, L. W., Carsten, J. L., Deen, R. G., Goetz, W., Hardgrove, C., Harker, D. E., Herkenhoff, K. E., Hurowitz, J. A., Jandura, L., Kennedy, M. R., Kocurek, G., Krezoski, G. M., Kuhn, S. R., Limonadi, D., Lipkaman, L., Madsen, M. B., Olson, T. S., Robinson, M. L., Rowland, S. K., Rubin, D. M., Seybold, C., Schieber, J., Schmidt, M., Sumner, D. Y., Tompkins, V. V., Van Beek, J. K., and Van Beek, T.: MAHLI at the Rocknest sand shadow: science and science-enabling activities, J. Geophys. Res.-Planet., 118, 2338–2360, https://doi.org/10.1002/2013JE004426, 2013.
Ojha, L., Lewis, K., Karunatillake, S., and Schmidt, M.: The Medusae Fossae Formation as the single largest source of dust on Mars, Nat. Commun., 9, 2867, https://doi.org/10.1038/s41467-018-05291-5, 2018.
Ovalle, C. and Dano, C.: A model of confined comminution for granular materials, in: 2nd International Symposium on Computational Geomechanics, https://publications.polymtl.ca/41669/ (last access: 15 February 2026), 2011
Pizzati, M., Mantovani, L., Lisotti, A., Storti, F., and Balsamo, F.: Particle size distributions in Earth Sciences: a review of techniques and a new procedure to match 2D and 3D analyses, EGUsphere [preprint], https://doi.org/10.5194/egusphere-2023-2636, 2023.
Qi, S., Li, L., Hou, X., Qiao, S., Ma, X., Lu, X., Cong, J., Hao, R., Zhang, C., Li, J., Elsworth, D., Yang, W., Li, X.-H., and Wu, F.-Y.: Strongly cohesive lunar soil identified at the Chang'E-6 landing site, Nat. Astron., 10, 214–223, https://doi.org/10.1038/s41550-025-02715-3, 2026.
Rivera-Hernández, F., Sumner, D. Y., Mangold, N., Banham, S. G., Edgett, K. S., Fedo, C. M., Gupta, S., Gwizd, S., Heydari, E., Maurice, S., Nachon, M., Newsom, H., Schieber, J., Stack-Morgan, K., Stein, N., and Wiens, R. C.: Grain size variations in the Murray formation: stratigraphic evidence for changing depositional environments in Gale crater, Mars, J. Geophys. Res.-Planet., 125, e2019JE006230, https://doi.org/10.1029/2019JE006230, 2020.
Sacks, L. E., Edgar, L. A., Edwards, C. S., and Anderson, R. B.: Grain-scale analyses of Curiosity data at Marias Pass, Gale crater, Mars: methods comparison and depositional interpretation, AGU Fall Meeting Abstracts, P23B-2166, https://ui.adsabs.harvard.edu/abs/2016AGUFM.P23B2166S/abstract, (last access: 15 February 2026), 2016.
Senel, C. B., Temel, O., Lee, C., Newman, C. E., Mischna, M. A., Muñoz-Esparza, D., Sert, H., and Karatekin, Ö.: Interannual, seasonal and regional variations in the Martian convective boundary layer derived from GCM simulations with a semi-interactive dust transport model, J. Geophys. Res.-Planet., 126, e2021JE006965, https://doi.org/10.1029/2021JE006965, 2021.
Shangguan, W., Gong, P., Liang, L., Dai, Y., and Zhang, K.: Soil diversity as affected by land use in China: consequences for soil protection, Sci. World J., 2014, 913852, https://doi.org/10.1155/2014/913852, 2014.
Shi, Y., Zhao, S., Karunatillake, S., and Xiao, L.: Semi-automated Image Segmenting Software for Martian Soil Granulometry, EGU General Assembly 2021, online, 19–30 Apr 2021, EGU21-7872, https://doi.org/10.5194/egusphere-egu21-7872, 2021.
Shi, Y., Zhao, S., Karunatillake, S., Cousin, A., Zhao, J., and Xiao, L.: Sorting and weathering trends of soil at Gale Crater, Mars: implications for regional pedological processes, J. Geophys. Res.-Planet., 129, e2024JE008598, https://doi.org/10.1029/2024JE008598, 2024.
Stack, K. M., Williams, N. R., Calef III, F., Sun, V. Z., Williford, K. H., Farley, K. A., Eide, S., Flannery, D., Hughes, C., Jacob, S. R., Kah, L. C., Meyen, F., Molina, A., Nataf, C. Q., Rice, M., Russell, P., Scheller, E., Seeger, C. H., Abbey, W. J., Adler, J. B., Amundsen, H., Anderson, R. B., Angel, S. M., Arana, G., Atkins, J., Barrington, M., Berger, T., Borden, R., Boring, B., Brown, A., Carrier, B. L., Conrad, P., Dypvik, H., Fagents, S. A., Gallegos, Z. E., Garczynski, B., Golder, K., Gomez, F., Goreva, Y., Gupta, S., Hamran, S.-E., Hicks, T., Hinterman, E. D., Horgan, B. N., Hurowitz, J., Johnson, J. R., Lasue, J., Kronyak, R. E., Liu, Y., Madariaga, J. M., Mangold, N., McClean, J., Miklusicak, N., Nunes, D., Rojas, C., Runyon, K., Schmitz, N., Scudder, N., Shaver, E., SooHoo, J., Spaulding, R., Stanish, E., Tamppari, L. K., Tice, M. M., Turenne, N., Willis, P. A., and Yingst, R. A.: Photogeologic map of the Perseverance rover field site in Jezero Crater constructed by the Mars 2020 Science Team, Space Sci. Rev., 216, 127, https://doi.org/10.1007/s11214-020-00739-x, 2020.
Szalay, J. R., Pokorný, P., Sternovsky, Z., Kupihar, Z., Poppe, A. R., and Horanyi, M.: Impact ejecta and gardening in the lunar polar regions, J. Geophys. Res.-Planet., 124, 143–154, https://doi.org/10.1029/2018JE005756, 2019.
Toneva, P. and Peukert, W.: A general approach for the characterization of fragmentation problems, Adv. Powder Technol., 18, 39–51, https://doi.org/10.1163/156855207779768160, 2007.
Webb, R., Rosenzweig, C. E., and Levine, E. R.: Global soil texture and derived water-holding capacities (Webb et al.), ORNL DAAC [data set], https://doi.org/10.3334/ORNLDAAC/548, 2000.
Weinman, B. A., Yoo, K., Mudd, S. M., Attal, M., Hurst, M. D., Maher, K., Kouba, C. M., Bern, C., and Singhvi, A. K.: Chemical vs. physical contributions to grainsize distributions in hillslope soils along a denudation gradient in the Sierra Nevada, California, AGU Fall Meeting Abstracts, EP53A-02, https://ui.adsabs.harvard.edu/abs/2011AGUFMEP53A..02W/abstract (last access: 15 February 2026), 2011.
Weitz, C. M., Sullivan, R. J., Lapotre, M. G., Rowland, S. K., Grant, J. A., Baker, M., and Yingst, R. A.: Sand grain sizes and shapes in eolian bedforms at Gale Crater, Mars, Geophys. Res. Lett., 45, 9471–9479, https://doi.org/10.1029/2018GL078972, 2018.
Wiens, R. C., Maurice, S., Robinson, S. H., Nelson, A. E., Cais, P., Bernardi, P., Newell, R. T., Clegg, S., Sharma, S. K., Storms, S., Deming, J., Beckman, D., Ollila, A. M., Gasnault, O., Anderson, R. B., André, Y., Angel, S. M., Arana, G., Auden, E., Beck, P., Becker, J., Benzerara, K., Bernard, S., Beyssac, O., Borges, L., Bousquet, B., Boyd, K., Caffrey, M., Carlson, J., Castro, K., Celis, J., Chide, B., Clark, K., Cloutis, E., Cordoba, E. C., Cousin, A., Dale, M., Deflores, L., Delapp, D., Deleuze, M., Dirmyer, M., Donny, C., Dromart, G., Duran, M. G., Egan, M., Ervin, J., Fabre, C., Fau, A., Fischer, W., Forni, O., Fouchet, T., Fresquez, R., Frydenvang, J., Gasway, D., Gontijo, I., Grotzinger, J., Jacob, X., Jacquinod, S., Johnson, J. R., Klisiewicz, R. A., Lake, J., Lanza, N., Laserna, J., Lasue, J., Le Mouélic, S., Legett IV, C., Leveille, R., Lewin, E., Lopez-Reyes, G., Lorenz, R., Lorigny, E., Love, S. P., Lucero, B., Madariaga, J. M., Madsen, M., Madsen, S., Mangold, N., Manrique, J. A., Martinez, J. P., Martinez-Frias, J., McCabe, K. P., McConnochie, T. H., McGlown, J. M., McLennan, S. M., Melikechi, N., Meslin, P.-Y., Michel, J. M., Mimoun, D., Misra, A., Montagnac, G., Montmessin, F., Mousset, V., Murdoch, N., Newsom, H., Ott, L. A., Ousnamer, Z. R., Pares, L., Parot, Y., Pawluczyk, R., Peterson, C. G., Pilleri, P., Pinet, P., Pont, G., Poulet, F., Provost, C., Quertier, B., Quinn, H., Rapin, W., Reess, J.-M., Regan, A. H., Reyes-Newell, A. L., Romano, P. J., Royer, C., Rull, F., Sandoval, B., Sarrao, J. H., Sautter, V., Schoppers, M. J., Schröder, S., Seitz, D., Shepherd, T., Sobron, P., Dubois, B., Sridhar, V., Toplis, M. J., Torre-Fdez, I., Trettel, I. A., Underwood, M., Valdez, A., Valdez, J., Venhaus, D., and Willis, P.: The SuperCam instrument suite on the NASA Mars 2020 rover: body unit and combined system tests, Space Sci. Rev., 217, https://doi.org/10.1007/s11214-020-00777-5, 2021.
Wilson, L. and Head, J. W.: Explosive volcanic eruptions on Mars: tephra and accretionary lapilli formation, dispersal and recognition in the geologic record, J. Volcanol. Geoth. Res., 163, 83–97, https://doi.org/10.1016/j.jvolgeores.2007.03.007, 2007.
Xu, C., Cui, Y., Luo, A., Wang, G., Jing, L., and Nie, J.: Influence of mineral content on Angle of Repose on the farside of moon: insight from laboratory and numerical approach based on Chang’e 6 samples, J. Geophys. Res.-Planet., in press, 2026.
Yong, L., Xiaojun, Z., Pengcheng, S., Yingde, K., and Jingjing, L.: A scaling distribution for grain composition of debris flow, Geomorphology, 192, 30–42, https://doi.org/10.1016/j.geomorph.2013.03.015, 2013.
Yong, L., Chengmin, H., Baoliang, W., Xiafei, T., and Jingjing, L.: A unified expression for grain size distribution of soils, Geoderma, 288, 105–119, https://doi.org/10.1016/j.geoderma.2016.11.011, 2017.
Zhang, H., Zhang, X., Zhang, G., Dong, K., Deng, X., Gao, X., Yang, Y., Xiao, Y., Bai, X., Liang, K., Liu, Y., Ma, W., Zhao, S., Zhang, C., Zhang, X., Song, J., Yao, W., Chen, H., Wang, W., Zou, Z., and Yang, M.: Size, morphology, and composition of lunar samples returned by Chang'E-5 mission, Sci. China Phys. Mech., 65, 1–8, https://doi.org/10.1007/s11433-021-1818-1, 2022.
Zhang, J.: Dataset for “PlanetGSD 1.0: a cross-planetary grain-size distribution dataset from Earth, the Moon, and Mars”, figshare [data set], https://doi.org/10.6084/m9.figshare.32362083, 2026a.
Zhang, J.: GSD data from Earth, Moon, and Mars; Python code to simulater GSD dataset, calculate weibull parameters (for μ), and to create granular-field, figshare [code], https://doi.org/10.6084/m9.figshare.31569616.v3, 2026b.
Zhang, J., Li, Y., Liu, D., Jiang, N., Yang, T., Guo, X., and Yao, Y.: The probability-based granular field of vegetated soils, Earth Surf. Proc. Land., 47, 3100–3116, https://doi.org/10.1002/esp.5446, 2022.
Zhang, J., Li, Y., Yang, T., Liu, J., Guo, X., and Yao, Y.: A universal grain-size distribution of soil with scaling invariance, Eur. J. Soil Sci., 74, e13354, https://doi.org/10.1111/ejss.13354, 2023.
Zhang, J., Li, Y., Cui, Y., Wu, Z., Xue, Y., Cheng, J., Jiang, H., Li, Y., Guo, J., Nie, J., Wang, G., and Luo, A.: Unity of terrestrial and extraterrestrial soils in granular configuration, Earth Planet. Sc. Lett., 654, 119239, https://doi.org/10.1016/j.epsl.2025.119239, 2025.
Zhao, S., Shi, Y., Karunatillake, S., and Xiao, L.: Computational photoanalysis software for Martian soil granulometry, 52nd Lunar and Planetary Science Conference, 1959, https://www.hou.usra.edu/meetings/lpsc2021/pdf/1959.pdf (last access: 15 February 2026), 2021.
Zhao, S., Karunatillake, S., and Shi, Y.: Semi-automated granulometry software for Martian soil analysis (beta), Zenodo [code], https://doi.org/10.5281/zenodo.7998487, 2023.