the Creative Commons Attribution 4.0 License.
the Creative Commons Attribution 4.0 License.
 | 14 Jul 2026
A long-term dataset on hydrology and suspended sediments in the Kamech catchment from the OMERE Observatory
Radhouane Hamdi
Insaf Mekki
Mohamed Gasmi
Jean Albergel
The Mediterranean region is characterized by a highly variable climate marked by prolonged dry spell interspersed with intense rainfall events mainly in autumn. Understanding the dynamics of water and sediment fluxes in this climatic context is crucial for recommending effective management strategies to mitigate erosion and runoff impacts. However, high-frequency datasets for both hydrology and sediment fluxes are often lacking for small Mediterranean catchments in North Africa, thus rendering these processes poorly understood.
In this context, the Kamech Critical Zone Observatory was established in 2004 to document high-frequency rainfall, discharge, and sediment fluxes across the 2.63 km2 Kamech catchment in Cape Bon, Tunisia. The landscape is characterised by hilly terrain, and the soil type is dominated by Vertisols, which crack for approximately half of the year. This catchment's land is mainly used to cultivate annual cereals and leguminous crops. The monitoring system comprises four nested hydrological stations, ranging in scale from a 1.3 ha plot to the outlet of the 263 ha catchment area. The longest time series covers almost 30 years. This article synthesizes the datasets of the observatory related to evaporation, rainfall, discharge and suspended sediment concentration. It describes the methodologies used to collect and process the data, including procedures for assessing data quality. It also suggests additional homogenized time series to facilitate subsequent hydrological analysis. Finally, it presents some preliminary explorations of the datasets and it suggests avenues for further studies. All datasets referenced in this work are openly accessible via the repository: https://doi.org/10.23708/PPPPDL (Raclot and Hamdi, 2025).
- Article
(3950 KB) - Full-text XML
- BibTeX
- EndNote


Mediterranean areas face major challenges linked to soil erosion by water, due to their marked relief, frequently sparse vegetation caused by drought or fire, high frequency of intense rainfall and lithologies that are sensitive to meteorological conditions (García-Ruiz et al., 2013). These challenges are also induced by a long history of human occupation with cultivation prone to erosion such as vineyards (Cerdan et al., 2010). Furthermore, the shift from extensive to intensive agriculture during the 20th century has further exacerbated flood and erosion phenomena in some places (Patault, 2018). All these natural and anthropogenic factors explain that sediment yield in watercourses are ranked among the highest in the world (Woodward, 1995; Vanmaercke et al., 2011), generating sedimentation in water bodies, reducing dam capacity, safety and cost effectiveness (Palmieri et al., 2001) and impacting long-term water availability (de Araújo et al., 2014).
The global changes taking place in the Mediterranean region are likely to amplify the threat to water and soil resources (Raclot et al., 2018). In a recent study, Vicente-Serrano et al. (2025) showed that the Mediterranean region is undergoing a process of increasing climatic aridity due to stationary annual precipitation and a significant increase in atmospheric evaporative demand. Although precipitation remained largely stationary from 1871 to 2020, the authors identified significant multi-decadal and interannual variability. Moreover, Diodato and Bellocchi (2014) identified a significant increase in extreme precipitation. Long-term data sets from observatories are one of the most effective means of understanding the impact of climate change on the hydrological response and anticipating and adapting to future conditions (Vallebona et al., 2015; Cid et al., 2017; Folton et al., 2020).
Long-term hydrological monitoring infrastructures have been developed to document the hydrological response and the key factors and processes involved. They aim to provide a solid basis for anticipating the hydro-erosive risk and defining mitigation strategies to reduce these negative impacts. Among them, we may cite the “Critical Zone Collaborative Network” (CZNet, https://criticalzone.org/, last access: 1 July 2026), which is the next phase of NSF's Critical Zone research initiative, or the “Critical Zone Observatories: Research and Application (OZCAR, https://www.ozcar-ri.org/, last access: 1 July 2026), which is a French distributed research infrastructure dedicated to the observation and monitoring of the Critical Zone.
In Mediterranean catchments, interest in hydro-sedimentary observations stems from the complex interaction between climate, geological composition, agricultural practices, and hydrological dynamics in a context of intermittent regime. Although several comprehensive hydro-sedimentary datasets covering watercourses in the Mediterranean region have already been published (e.g., Nord et al., 2017; Francke et al., 2018; Müller et al., 2021; Klotz et al., 2023; Matthews et al., 2023), it appears that the southern part of the Mediterranean region is severely under-represented, or even entirely absent, when looking for multi-year data series.
OMERE observatory (https://www.obs-omere.org/, last access: 1 July 2026) is a long-term observatory of soil and water resources, in interaction with agricultural and land management in Mediterranean hilly catchments. It was created in 2002 to fill the lack of long-term environmental observatories in the Mediterranean region (Molénat et al., 2018). It is part of the French network of critical zone observatories OZCAR (Gaillardet et al., 2018) and the European eLTER (European Long-Term Ecosystem, critical zone and socio-ecological Research) network. The OMERE observatory is composed of two Mediterranean agricultural catchments, the Roujan catchment located in France and the Kamech catchment located in Tunisia. Molénat et al. (2018) detailed the specificities and complementarities of these two catchments. A significant feature of the Kamech catchment is the high proportion of vertisols, which exhibit shrinkage cracks for much of the year as a result of swelling and shrinkage processes (Inoubli et al., 2016).
As continuous hydro-sedimentary measurements covering almost thirty years are extremely rare in small southern Mediterranean catchments, it is important to make these observations publicly available. Indeed, it will provide the international scientific community, where comparable datasets are scarce, with a valuable reference for comparative studies, model calibration and designing management and adaptation strategies.
In this paper, we present the data related to hydrological and suspended-sediment fluxes at four nested hydrometrics stations in the Kamech catchment, as well as the precipitation and evaporation data related to climatic forcing. The paper first describes the study site and the monitoring system. It then details the monitoring and data-processing procedures, by describing how the data is collected and processed, the types of instruments used, the acquisition protocol, the pre-processing procedures (e.g., using height-discharge rating curve or a water balance model, when applicable) and the assessment of data quality. A first exploration of the database then provides some key elements on the hydro-erosive response observed in the Kamech catchment. In the final section, the interest of the data presented is highlighted by a selection of previous studies and open questions.
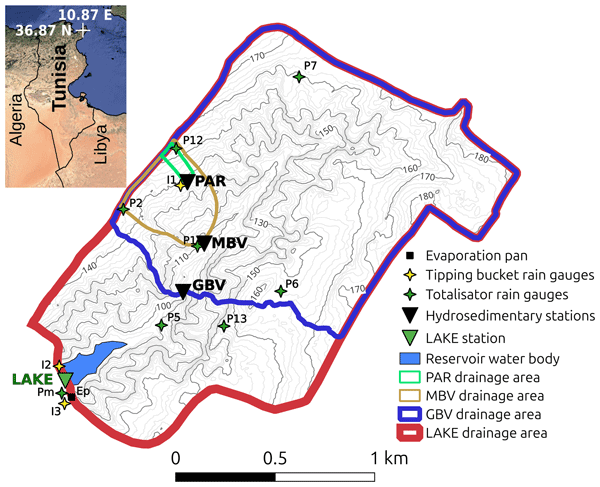
The Kamech catchment area (36.877° N, 10.878° E) is located on the Cap Bon peninsula in northern Tunisia (Fig. 1).
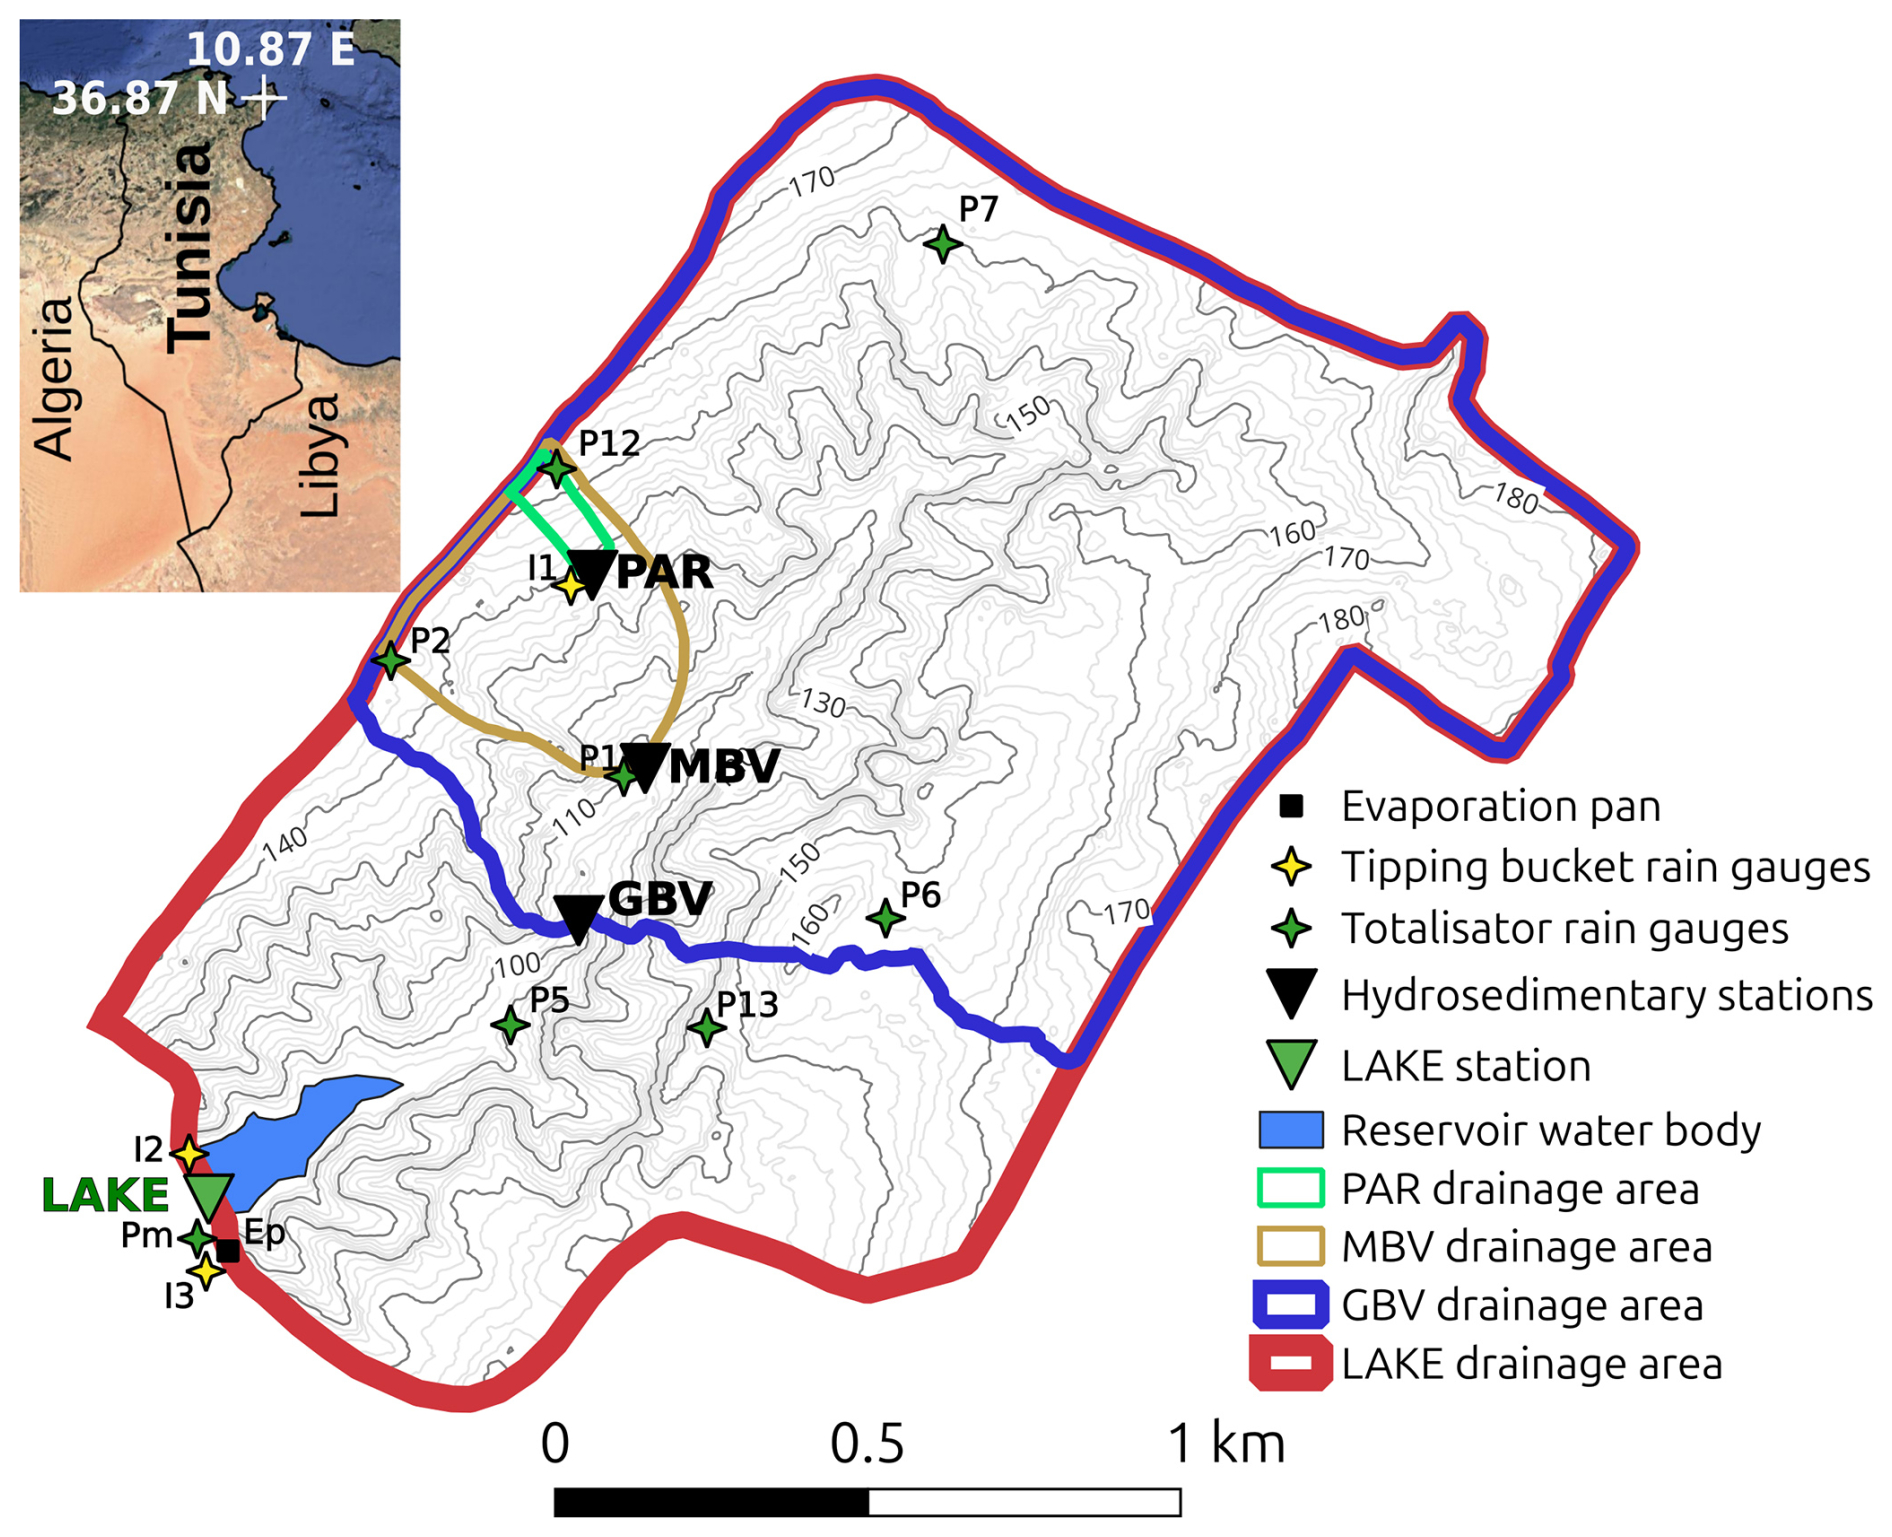
Figure 1Long-term monitoring infrastructure related to rainfall, discharge and suspended sediment in the Kamech catchment (OMERE observatory).
The Kamech catchment area features a hilly landscape, with altitudes ranging from 95 to 190 m and with a moderate to fairly steep relief including slopes that locally exceed 100 %. The main parent material in the region is a slightly calcareous laminated mudstone inherited from Miocene marine deposits. The top of the slopes is made up of sandstone outcrops inherited from intercalations of hard sandstone in the parent material. The soils along the hillslopes are directly developed mainly with colluvial processes over and from the Miocene deposits. In descending order of importance, soils can be classified as Vertisols, Calcisols, Cambisols and Leptosols (IUSS Working Group WRB, 2022). According to Khairallah et al. (2025), “soils in the study site area are very clayey (mean and median value to 49 and 53 %, respectively), with a very low fraction of coarse elements (mean and median value to 1.7 and 0.6 %, respectively), with pH ranging from 8 to 9, and very low to moderate soil inorganic carbon content varying from 1 to 30 g kg−1”. Approximately two-thirds of the soils in the catchment show shrink-swell processes that significantly impact water and sediment delivery (Inoubli et al., 2016). This high proportion of soils dominated by shrink-swell processes makes Kamech an original observatory among existing Mediterranean agro-hydrological observatories. Land use is dominated by annually tilled farmland, including cereal crops and, to a lesser extent, leguminous crops. The remaining area consists of more or less degraded rangelands, housing, tracks and a small water reservoir at the catchment outlet. This reservoir was built in 1994 with an initial storage capacity of 142 000 m3. Its main function is to trap sediment and protect the larger, multi-purpose Lebna reservoir, which is located further downstream. By 2023, it had lost around half of its initial storage capacity. The regulation of the reservoir is limited to opening a bottom gate when there is a significant risk of overflow. Only a small amount of the water stored in the reservoir is used, and this is for very localised irrigation and for providing water for a small number of livestock. The climate is Mediterranean, predominantly semi-arid, and characterised by pronounced seasonal variations. Summer is very dry, with daily temperatures often exceeding 30 °C and winter is rainy with temperatures averaging around 15 °C. Mean annual rainfall is 620 mm. More details on the rainfall dataset are given in Sect. 3.2.
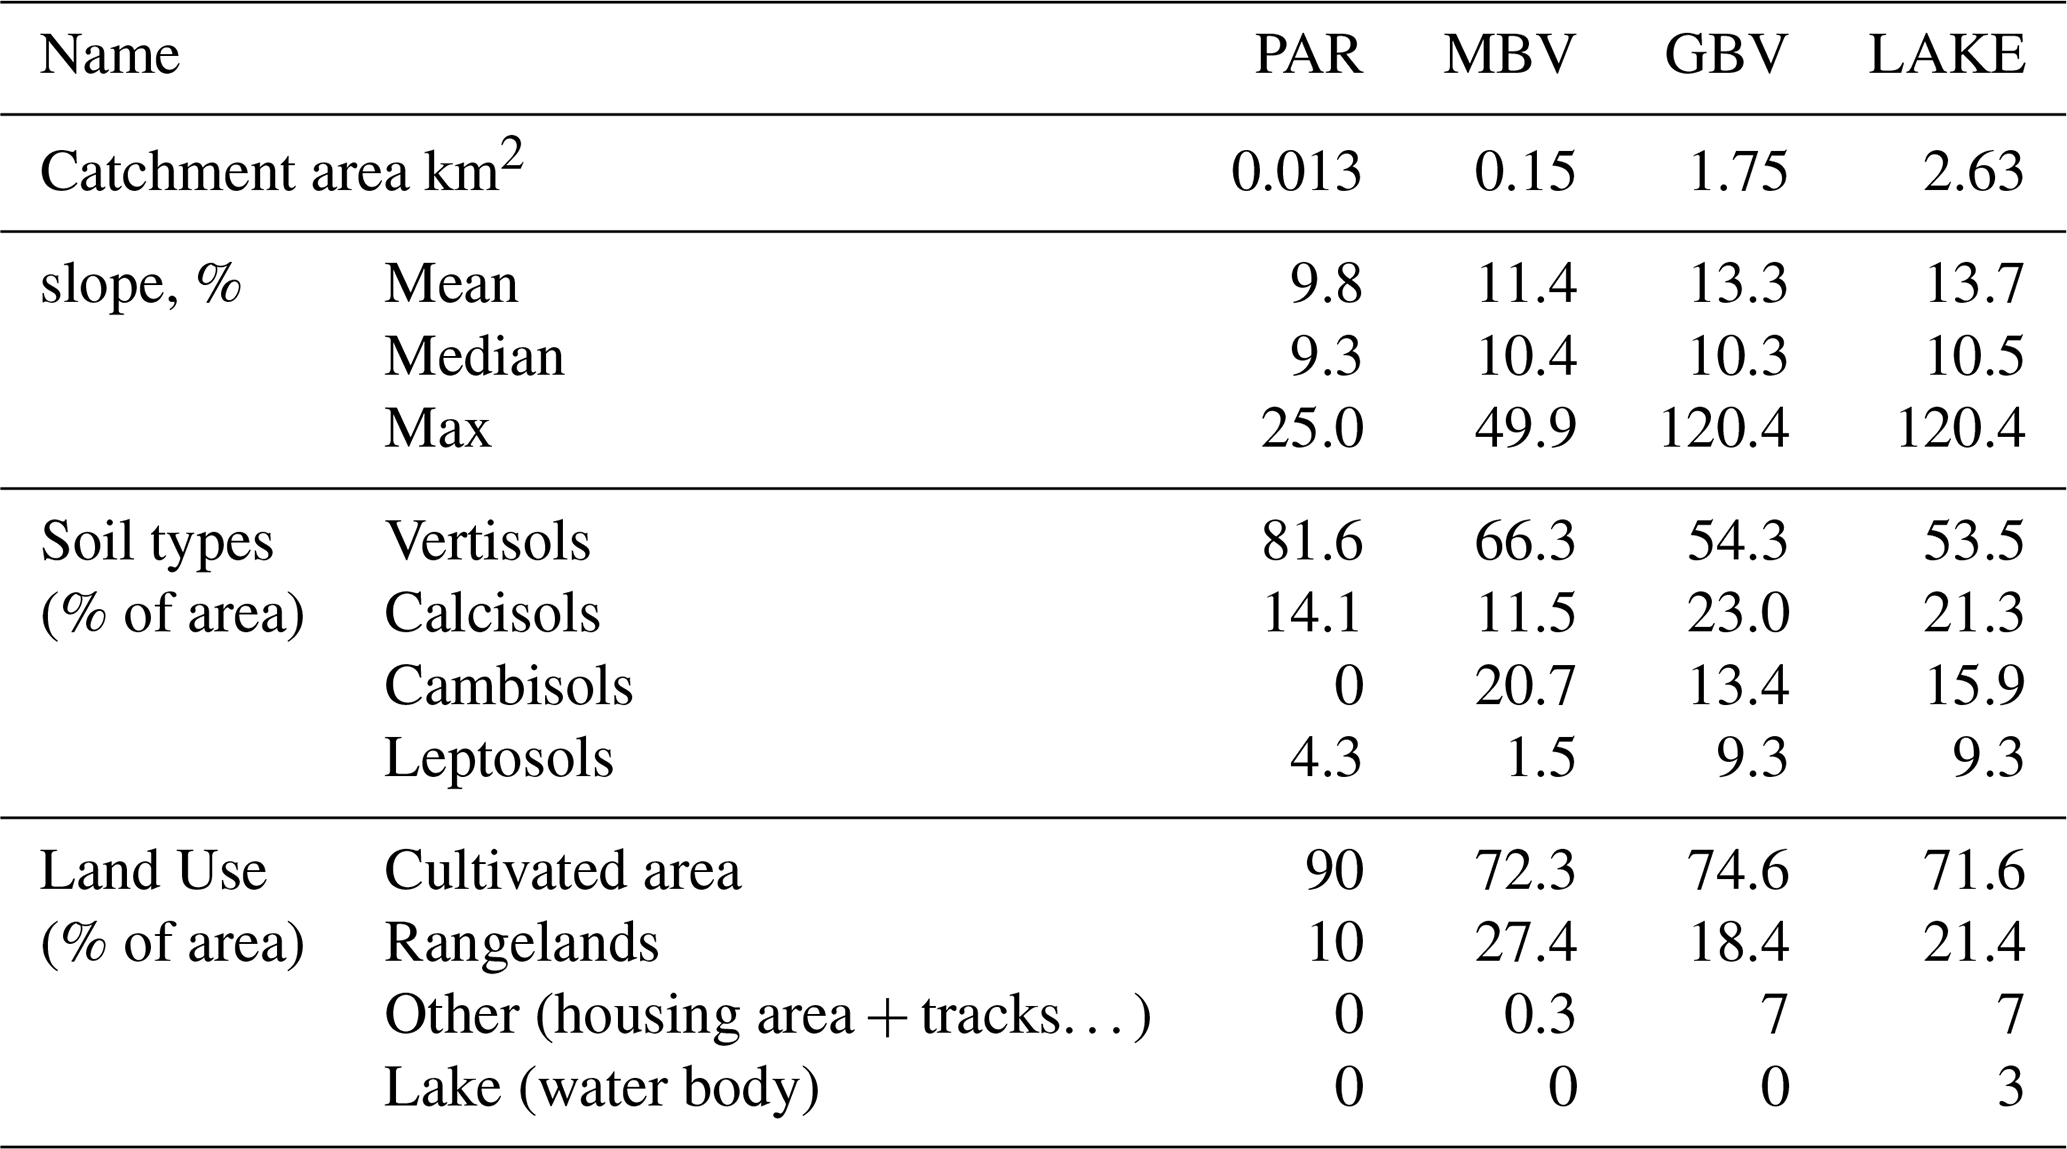
The strategy for observing water and sediment flows involves high-frequency acquisition of water levels and concentrations of suspended matter in runoff water. This is achieved using four hydrometric stations that monitor nested areas ranging from a single 1.3 ha cultivated plot to the entire 263 ha catchment area, as shown in Fig. 1. The four hydrometric stations are illustrated in Fig. 2 and the main morphometric characteristics and soil properties of their catchment area are summarised in Table 1.
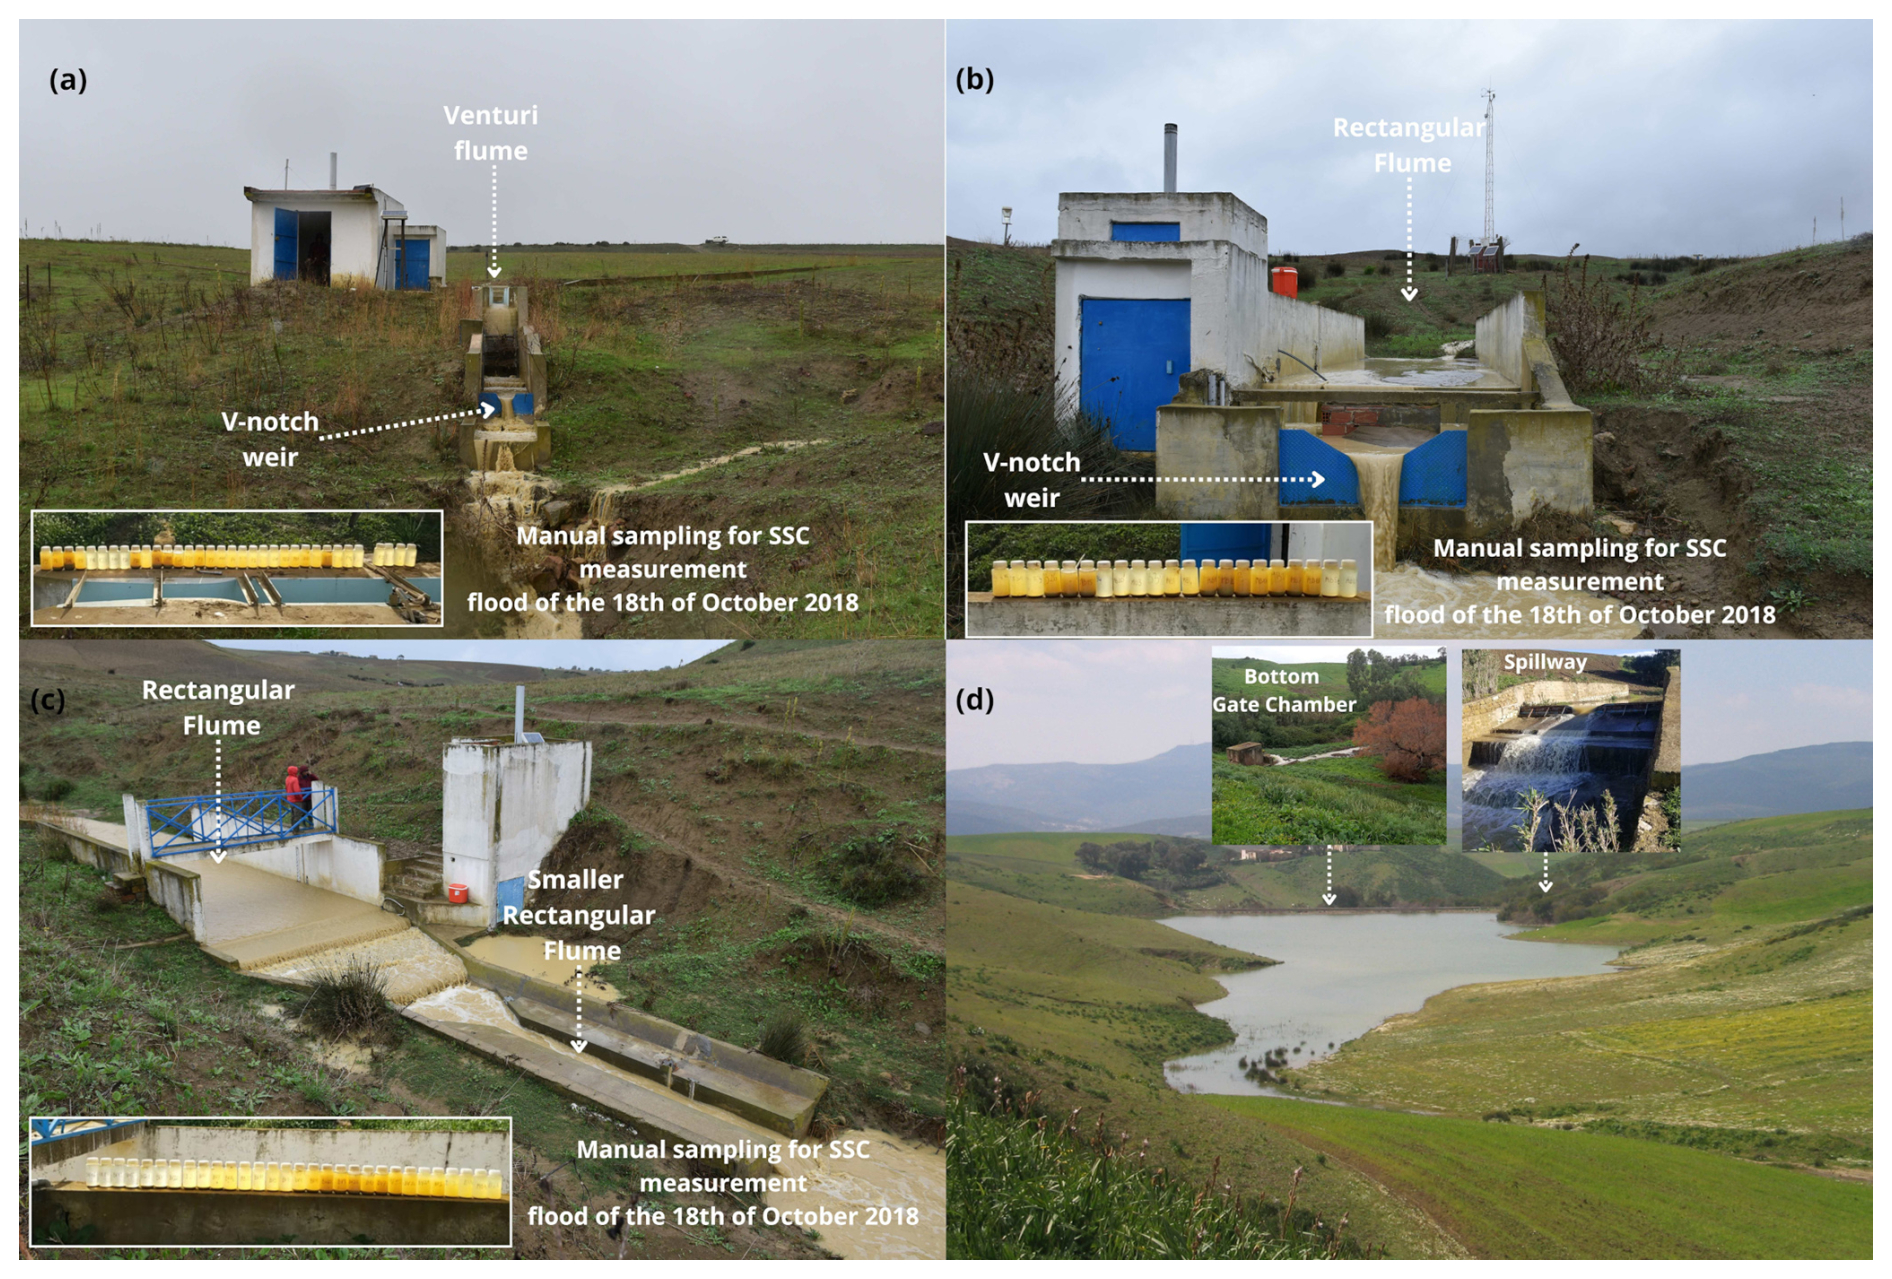
Figure 2Series of photos illustrating the four hydrometric stations in the Kamech catchment observatory: (a) PAR station, (b) MBV station, (c) GBV station, (d) LAKE station.
Table 1Main characteristics of the catchment drainage area for the four hydrometric stations.
This section describes the data relating to precipitation, evaporation and water and suspended-sediment fluxes measured on a nested observation system in the Kamech catchment. The summary of the whole measured variables with acquisition periods is presented in Fig. 3. All the automatic devices are equipped with solar panels and batteries. They are all connected to data loggers (CR1000 or CR300 models, Campbell Scientific, UK) which controls the acquisition of the sensors, stores the data and, since 2018, uploads them remotely to a server.
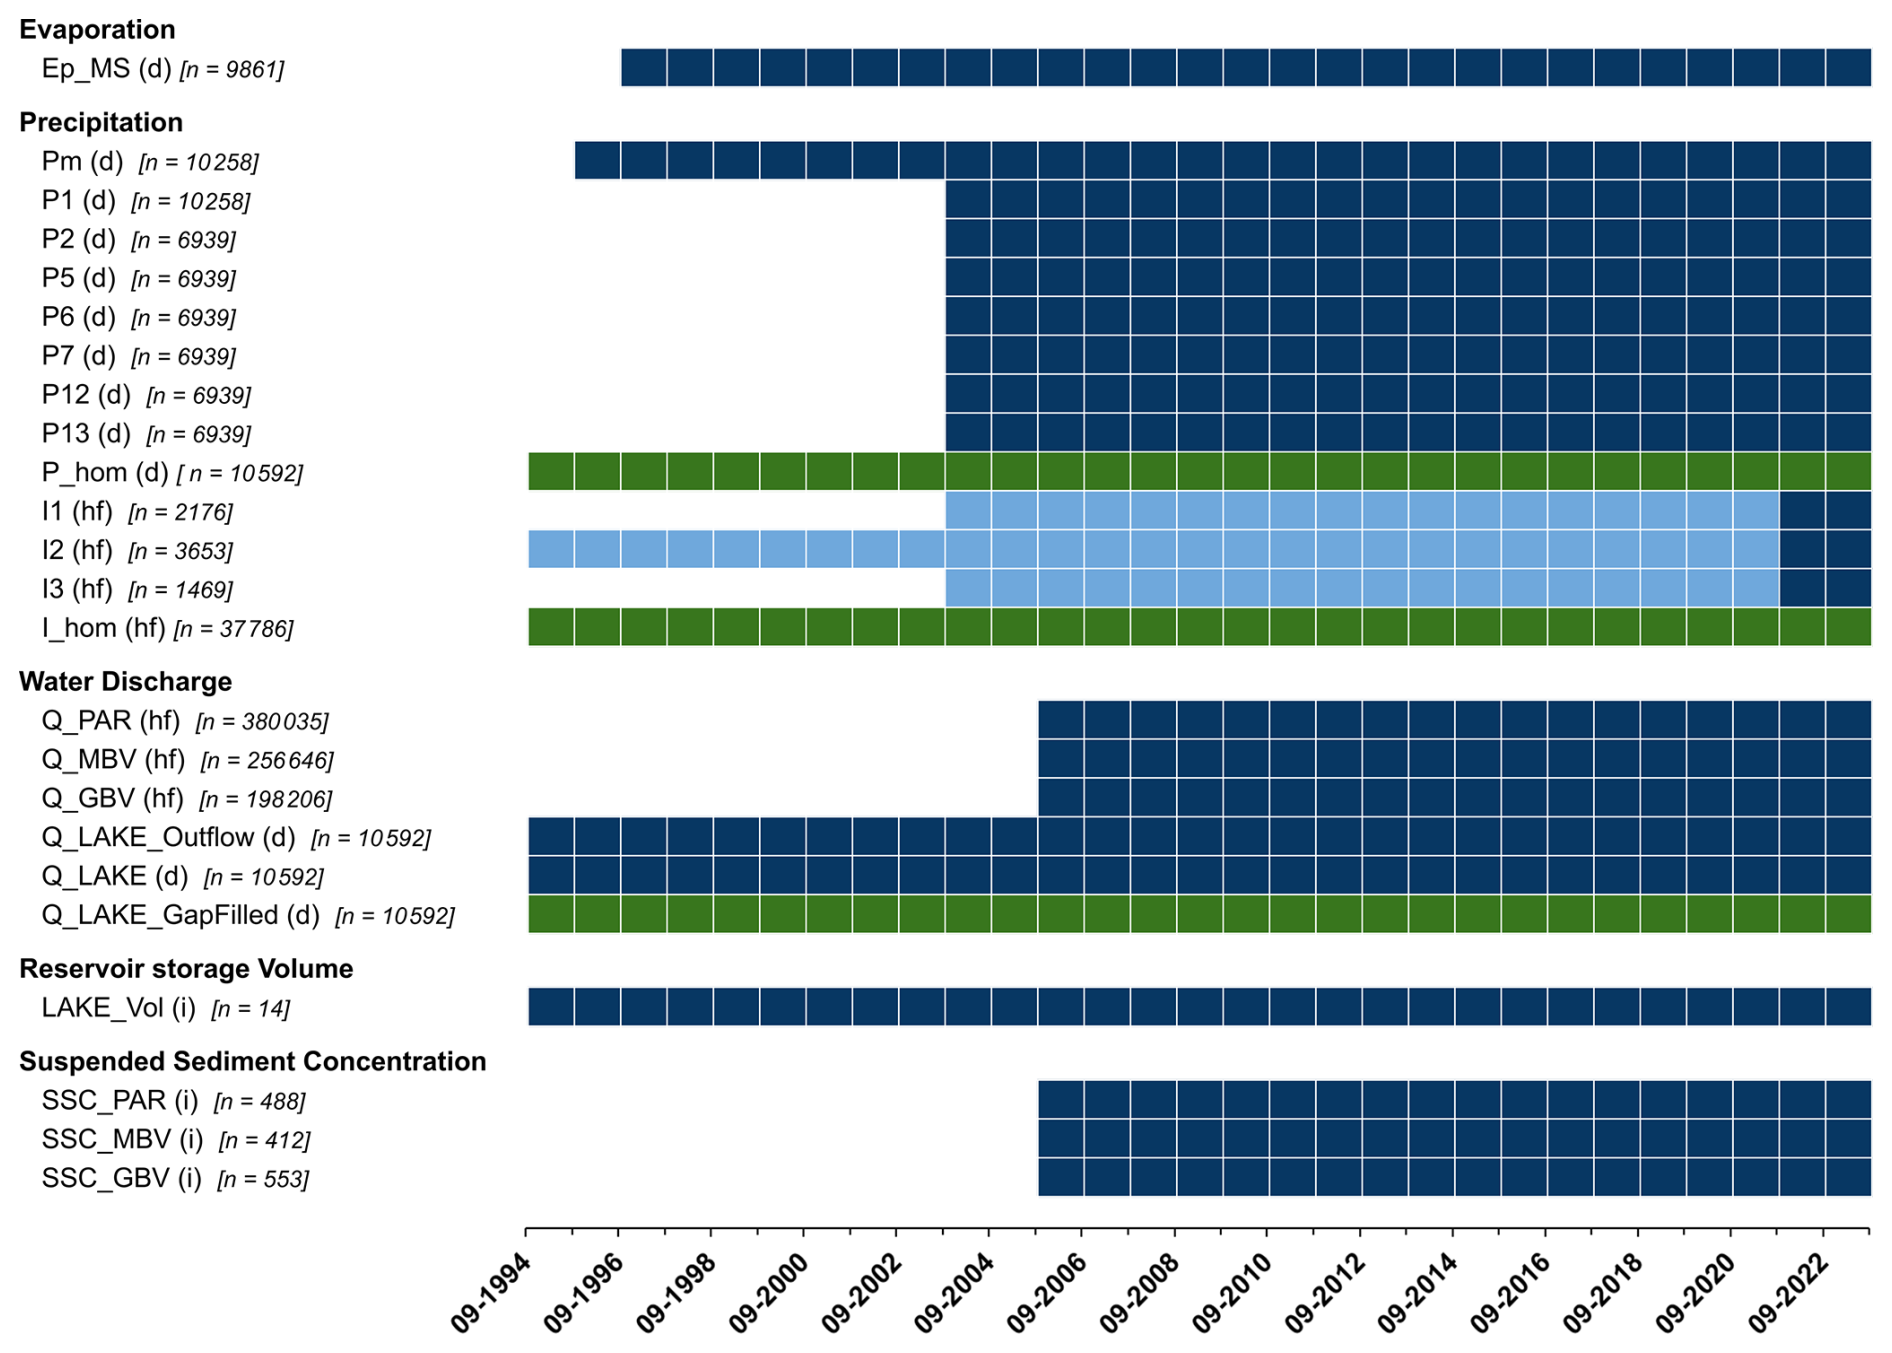
Figure 3Overview of the acquisition periods for each variable in the dataset. The periods shown in dark blue or dark green correspond to the data in the shared database. Light blue indicates data that is still being qualified and has not yet been entered into the shared database. Dark green indicates homogenized time series. See Fig. 1 for the location of each acquisition device. The text “(d)” is specified for daily time series, “(i)” stands for intermittent time series, and “(hf)” for high-frequency time series, i.e., with a variable sampling interval to capture temporal dynamics at fine temporal resolution (typically 5 min). The number given in brackets corresponds to the total number of records in each time series in the database.
Codes for sources and quality qualification are presented in Table 2. Most of the data are qualified with a RAW source, meaning that the data are from raw measurement. For data that have undergone corrections, a distinction is made between low- and high-magnitude corrections (i.e., LoC and HiC source code, respectively). Data that are calculated from raw data, such as discharge which is derived from water level measurement, are qualified with the CALC source code. Five quality codes have been distinguished to provide qualitative information on the level of data reliability as described in Table 2.
Table 2Codes to indicate the quality and source of each dataset.

To facilitate future analysis of the dataset, this paper also proposed additional homogenized precipitation and discharge time series, which are developed from a combination of several individual variables or derived from gap-filled procedures.
3.1 Evaporation
3.1.1 Measurement
Daily evaporation is manually measured using a 1 m2 Colorado-type evaporation pan, which is labelled Ep in Fig. 1. Every day around 08:00 a.m. UTC, an operator measures the volume of water that needs to be added or removed to return to a reference level in the tank of the evaporation pan.
3.1.2 Data processing and qualification
Daily evaporation amount (in mm) is then evaluated as the difference between the volume of water measured each day in the evaporation pan and the daily rainfall measured locally in Pm (see Fig. 1). Measurement accuracy is estimated at 0.5 mm.
By default, measurements are qualified with a RAW source code and a F3 quality code. On the infrequent days when the operator has been unable to take the measurement, a value of NA is indicated with an IND source code and an IND quality code. The daily evaporation value for the day following a period with NA is indicated with a RAW source code and a NF quality code, and a comment is added to clarify that it is a cumulative value.
3.2 Precipitation
3.2.1 Measurement
The measurement of rainfall began in 1994 using a tipping bucket rain gauge (tipping threshold: 0.5 mm), and a totalisator rain gauge, which are labelled I2 and Pm, respectively, in Fig. 1. The measuring equipment was subsequently supplemented in 2003 by a series of 2 additional tipping bucket rain gauges (I1 and I3, with tipping threshold of 0.5 and 0.2 mm, respectively) and a series of 7 additional totalisator rain gauges within the catchment area (i.e., P1; P2; P5; P6; P7; P12 and P13). The model is “SPIEA, FR” for totalisator rain gauges and “PRECIS MECANIQUE #3029, FR” for tipping bucket rain gauges. All the rain gauges have a receiving cone surface of 400 cm2. Data for tipping bucket rain gauges are stored in a logger system that records tipping times. Measures of standard totalisator rain gauges are made daily at around 09:00 a.m. local time (i.e., 08:00 a.m. UTC) by an operator, providing a daily rainfall measurement with an accuracy of 0.25 mm up to 10 mm and 0.5 mm for larger daily amounts. All tipping bucket rain gauges are checked frequently and cleaned if necessary to prevent clogging.
3.2.2 Data processing and qualification
By default, all daily rainfall amounts recorded by the operator are qualified with a RAW source code and considered as reliable (F3 quality code). A checking procedure consisting of visually comparing the amount of daily rainfall between all the other rain gauges enables anomalies, such as reading or data entry errors, to be identified manually. Data detected as anomalous is given an NF quality code. The daily rainfall value for the periods when a totalisator rain gauge is not operational due to vandalism, for example, is indicated as NA, with an IND quality code. On the infrequent days when the operator has been unable to take the measurement, a value of NA is indicated with an IND quality code. The daily rainfall amount for the day following a period with NA is indicated with a RAW source code and a NF quality code, and a comment indicating that the value corresponds to a cumulative value is added.
By default, all high-frequency rainfall records are qualified with a RAW source code and a F3 quality code. The measurements corresponding to the calibration tests are first removed from the time series. A two-step checking procedure is then applied to identify periods of failure. The first step consists in comparing the daily accumulated values derived from the rain gauge tipping buckets with the daily rainfall amounts derived from all rain gauges. The second step consists in comparing the 5 min rainfall intensities between the tipping bucket rain gauges to identify failures such as partial or complete clogging. For periods of complete failure, 2 consecutive records with NA as values and IND as source and quality codes are entered in the measurement file to the start and end of the failure. For periods of malfunction, the raw recordings are kept and the NF quality code is assigned. Note that every malfunction identified by the operator during his recurring visits is also recorded in the field notebook, enabling particular attention to be paid to the quality of the data concerned.
3.2.3 Additional homogenized rainfall time series
A high-frequency homogenized time series and a daily homogenized time series of rainfall measurements over the entire 1994–2023 period are provided in addition to the previous individual daily or high-frequency rainfall time series.
The homogenized daily rainfall time series (from 08:00 a.m. to 08:00 a.m. UTC the following day) is produced using the average of all reliable daily rainfall records provided from the eight totalisator rain gauges and calculated from the three tipping-bucket rain gauges. On the rare days when the operator was unable to take the measurement, the cumulative daily rainfall recorded on the totalisator rain gauge on the day following the NA period was first distributed over the days without recording using the daily rainfall distribution derived from tipping bucket rain gauges. The daily homogenized time series is qualified with a CALC source code and a F3 quality code, except for the period prior to 1 September 2004 for which an IND quality code is assigned because there were not enough rain gauges to guarantee reliable daily rainfall value.
The homogenized rainfall time series is compiled from the three rainfall tipping bucket rain gauges, retaining only reliable values, and applying the following order of priority from 2003 onwards: I1 > I2 > I3. This choice is based on the fact that the I1 rain gauge is slightly more centrally located in the catchment area than the two others. The homogenized time series is qualified with a RAW source code and a F3 quality code, except for the period prior to 1 September 2004 for which an IND quality code is assigned because there was only one operational tipping bucket rain gauge in the catchment.
3.3 Water discharges at hydrosedimentary stations
3.3.1 Measurement
Each hydrosedimentary station has been designed to measure water levels at two points, one suitable for low flows (LQ) and the other for high flows (HQ), as illustrated in Fig. 2. For the PAR station, the gauging system is a Venturi flume for HQ and a V-notch weir for LQ. For the MBV station, the gauging system is a rectangular flume for HQ and a V-notch weir for LQ. For the GBV station, the gauging system is a rectangular flume for HQ and a smaller rectangular flume for LQ. Water levels for each station are recorded using digital piezoresistive pressure transducers (CS451, Campbell Scientific, UK) at these two measurement points. Measurements are taken with a time step of 1 min and recorded when height variations exceed 5 mm or systematically every 30 min. Water level sensors are accurate to within a few millimetres. Each measuring point is equipped with a limnimetric scale, i.e., a metal ruler, so that an operator can manually read the water level on a daily basis, or even more frequently in the event of flooding.
3.3.2 Data processing and qualification
The time series of raw water levels are first compared with the scales readings in order to identify any biases. Biases are mainly induced by changes in the vertical position of the digital sensors during cleaning operations, for example. A piecewise bias-correction is then made to the raw water levels to bring them into line with the scale readings. When necessary, corrections are generally less than one or two centimetres.
Flow discharges are then derived from bias-corrected water levels using a rating curve specifically elaborated for each monitoring point. The rating curves were all based on information supplied by the manufacturer (e.g., for the Venturi flume) or theoretical laws (e.g., for the V-notch weir), then adjusted locally by episodic discharge measurements taken during floods. The latter were carried out on several occasions in order to cover the full range of possible flow rates. They were carried out by recording the time required to fill a container of known volume for low flow rates, and by measuring the velocity profile across cross-sections using a portable FLO-MATE electromagnetic current meter (Model 2000, Marsh-McBirney, USA) for high flow rates. The water discharge time series for each hydrosedimentary station was compiled from a combination of the LQ and HQ discharge time series, using the most accurate measurement source at each instant.
By default, the origin and quality of the water discharge time series for each hydrosedimentary station are set to LoC and F3. If there are gaps at the measurement point suitable for low discharges (LQ), it may be necessary to use the HQ discharge values, but in this case the quality code has been changed from F3 to F2 for the PAR station (because the Venturi flume provides an accurate discharge rate even for low values); and from F3 to F1 for the MBV or GBV stations. If there are gaps at the HQ measurement point, a gap period is inserted (NA value at the start and end) for the corresponding periods. In some cases, discharge values exist for the appropriate discharge range but they are derived from water levels of altered quality. This happens, for example, when there are heavy deposits of sediment at the point where the water level is measured. These periods of flow obstruction are detected through reports made by the operator during their regular site visits and through visual analysis of water level fluctuations. If this is the case for LQ discharges, either the code source was changed from F3 to F2 or from F3 to F1 depending on the estimated level of distortion, or the HQ discharge values were used and the quality code was modified according to the rule mentioned above. If this is the case for HQ discharges, either the quality code was changed from F3 to F2 or from F3 to F1 depending on the estimated level of distortion. Where distortions were considered too great, a gap period has been introduced.
3.4 Runoff depths at the LAKE station
3.4.1 Measurement
The water level in the outlet reservoir, i.e., at the LAKE station, is monitored using a digital piezoresistive pressure transducer (CS451, Campbell Scientific, UK). Raw measurements are made every 5 min and they are recorded when height variations exceed 10 mm or systematically every 60 min. The outlet reservoir is equipped with a limnimetric scale so that an operator can manually read the water level on a daily basis, or even more frequently in the event of flooding. The spillway has been designed so that the overflow discharge can be accurately estimated from the water level using a rating table. This table was made up of two theoretical curves: one for the V section, adjusted locally by flow control measurements, and one for the water level over the V section of the spillway. The periods during which the bottom gate is open are recorded manually, enabling the flow rate discharged to be estimated from the water level using a theoretical curve adjusted locally by flow control measurements. Lastly, the depth/volume and depth/surface curves of the reservoir are established on the basis of topo-bathymetric surveys carried out every 2 to 5 years.
3.4.2 Data processing and qualification
As with the hydrosedimentary stations, the time series of raw water levels are first compared with the scale readings and a piecewise bias correction is then applied to the raw water levels to bring them into line with the scale readings. Then daily runoff entering into the reservoir (Q_LAKE) could be derived using an hydrologic budget as described in Albergel et al. (1998). Basically, the flow into the lake is evaluated as the variation in the stock of water in the reservoir, to which is added the volume of water leaving through overflow, the bottom gate and evaporation, and from which is subtracted the volume of rainwater falling directly onto the water body. The hydrological balance was established on a daily time step, with the value for day D corresponding to the daily runoff entering the reservoir between day D at 08:00 a.m. UTC and day D+1 at 08:00 a.m. UTC, in order to be in line with the operator's field surveys.
By default, Q_LAKE is qualified with a CALC source code and a F3 quality code, except for the period with overflow or bottom discharge for which a F2 quality code is assigned because the corresponding terms in the hydrological budget are estimated less accurately. When there are gaps in the time series of water levels (e.g., sensor failure) and overflow or bottom discharge occurs, the daily runoff entering the reservoir is set to NA, with an IND code source and an IND quality code. The daily time series of outflow from the reservoir via the spillway and/or bottom gate, labelled Q_LAKE_Outflow, is also provided. By default, it has a CALC source code and a F2 quality code. In the LAKE_Vol time series, we also shared the evolution of the reservoir's water storage volume, established from the 14 bathymetric surveys conducted between 1994 and 2023. By default, it has a CALC source code and a F2 quality code.
3.4.3 Additional homogenized time series of daily runoff
A gap-filled time series of daily runoff depth is proposed for the lake station over the entire 1994–2023 period. Gap-filling was realized using the GR5J model and the procedure available in the baseflow R package (Coron et al., 2017; Pelletier and Andréassian, 2020). The daily gap-filled time series is qualified with the same source code and quality code as the water discharge values for the day in question. The gap-filled values are qualified with a CALC source code and an IND quality code. A specific comment is also added to indicate the values derived from the GR5J gap-filling procedure.
3.5 Suspended sediment concentration
3.5.1 Measurement
Manual and automatic water samples are used to evaluate suspended sediment concentrations (SSC) in runoff water at each hydrosedimentary station. Automatic samples are taken using a 24-vial sequential sampler (SIGMA 900P or AS950, Hach-Lange, USA), the sampling of which is controlled by the flow rate. The capacity of each vial is either 350 mL for glass vials or 500 mL for plastic vials. They are supplemented by manual sampling of approximately 500 mL when an operator is present at the site during flooding. Samples were transported after each flood to the laboratory for oven drying (48 h at 105 °C, without prior decanting or filtration) and weighing.
3.5.2 Data processing and qualification
SSC is calculated as the ratio of the dry weight to the sample volume. The measurement uncertainty associated with the SSC is estimated at 5 % maximum.
The SSC values are all qualified by default with a RAW source code and a F3 quality code. The quality code was modified in NF for a few values deemed unreliable, in particular very high concentrations at the end of major floods when it is suspected that the sample taken is affected by the deposit of sediment at the strainer. An additional comment indicates for each SSC value whether the value comes from a manual or automatic sample.
In this section, we propose characterising the key elements of the hydro-sedimentary regime and investigating trends in rainfall, runoff and erosion time series using the database presented in this paper. In addition, we also combined the time series of discharge and suspended sediment concentration at the GBV station to evaluate the daily sediment yield (in t ha−1) over an 18-year period (from 2005 to 2023) to be used for the time compression and trends analysis for erosion. This required the development of a specific regression-based gap-filling procedure, the description of which is beyond the scope of this paper.
4.1 Runoff depth at the four nested stations
Figure 4 presents the matrix of pair plots with the runoff depth measured at the four hydrometric stations between 2005 and 2023. The upper part of the matrix corresponds to pair plots computed from daily data, while the lower part shows those obtained at the monthly scale. Overall, the runoff recorded at the four stations are strongly correlated, which suggests that the main driving factors of runoff generation are likely very similar from field to catchment outlets. Differences in soil type, land use or surface condition between catchment areas are among the factors that may explain the observed patterns of dispersion.
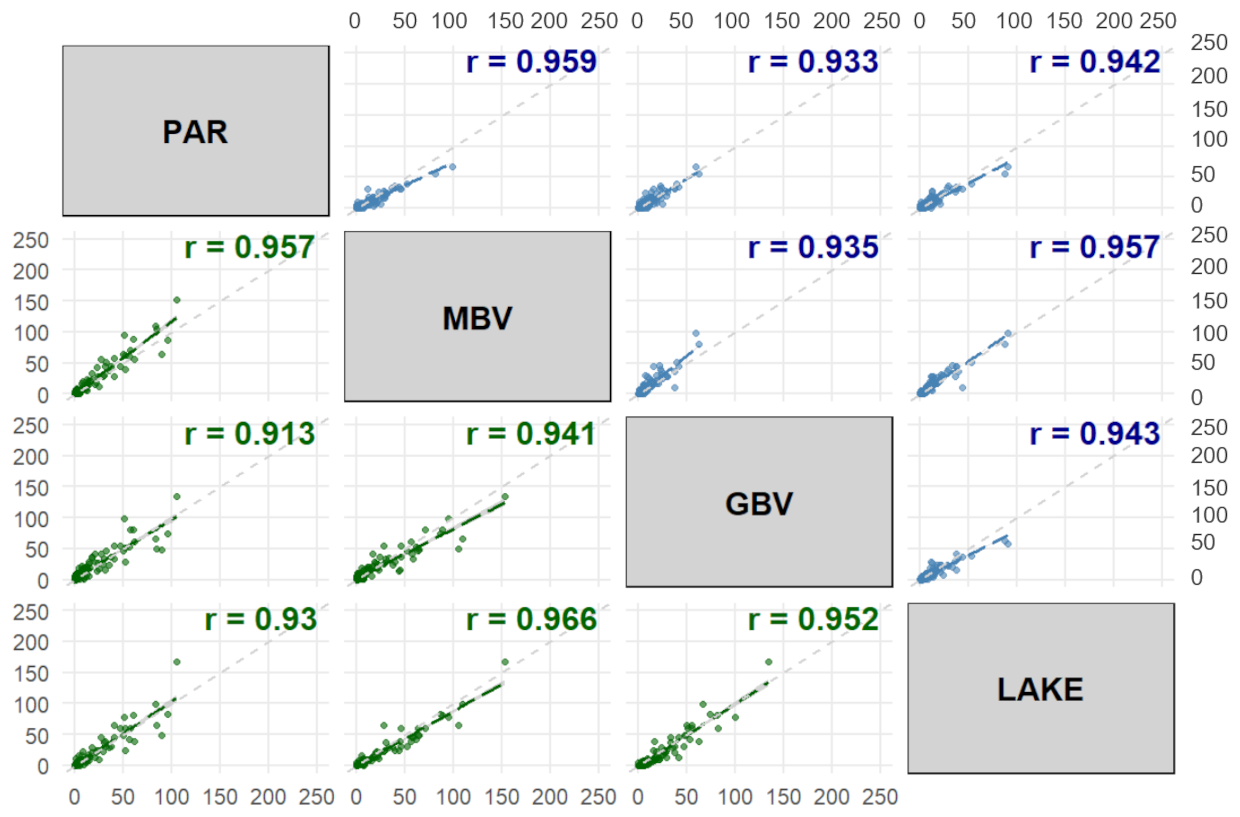
Figure 4Correlation matrix of runoff depth (in mm) for the four stations over an 18-year period: upper triangle for monthly values (n=216), lower triangle for daily values (n=6574). The red dashed line indicates y=x.
4.2 Hydro-sedimentary regime
4.2.1 Interannual and intrannual variability
Figure 5a depicts the interannual variability of the rainfall regime in the Kamech catchment. Annual rainfall amounts range from a minimum of 395 mm yr−1 to a maximum of 1036 mm yr−1, resulting in a range of 642 mm. The standard deviation is approximately 150 mm around an interannual mean of 618 mm. Annual runoff rates range from 2.2 to 275.5 mm, with a standard deviation of 84.5 mm around a mean close to 108 mm yr−1 at the LAKE Station. The annual runoff coefficient, defined as the ratio of annual discharge to annual precipitation, exhibits considerable variability, with a standard deviation of 10.8 %, an interannual mean around 16 %, and a range from 0.5 % to 38 %.
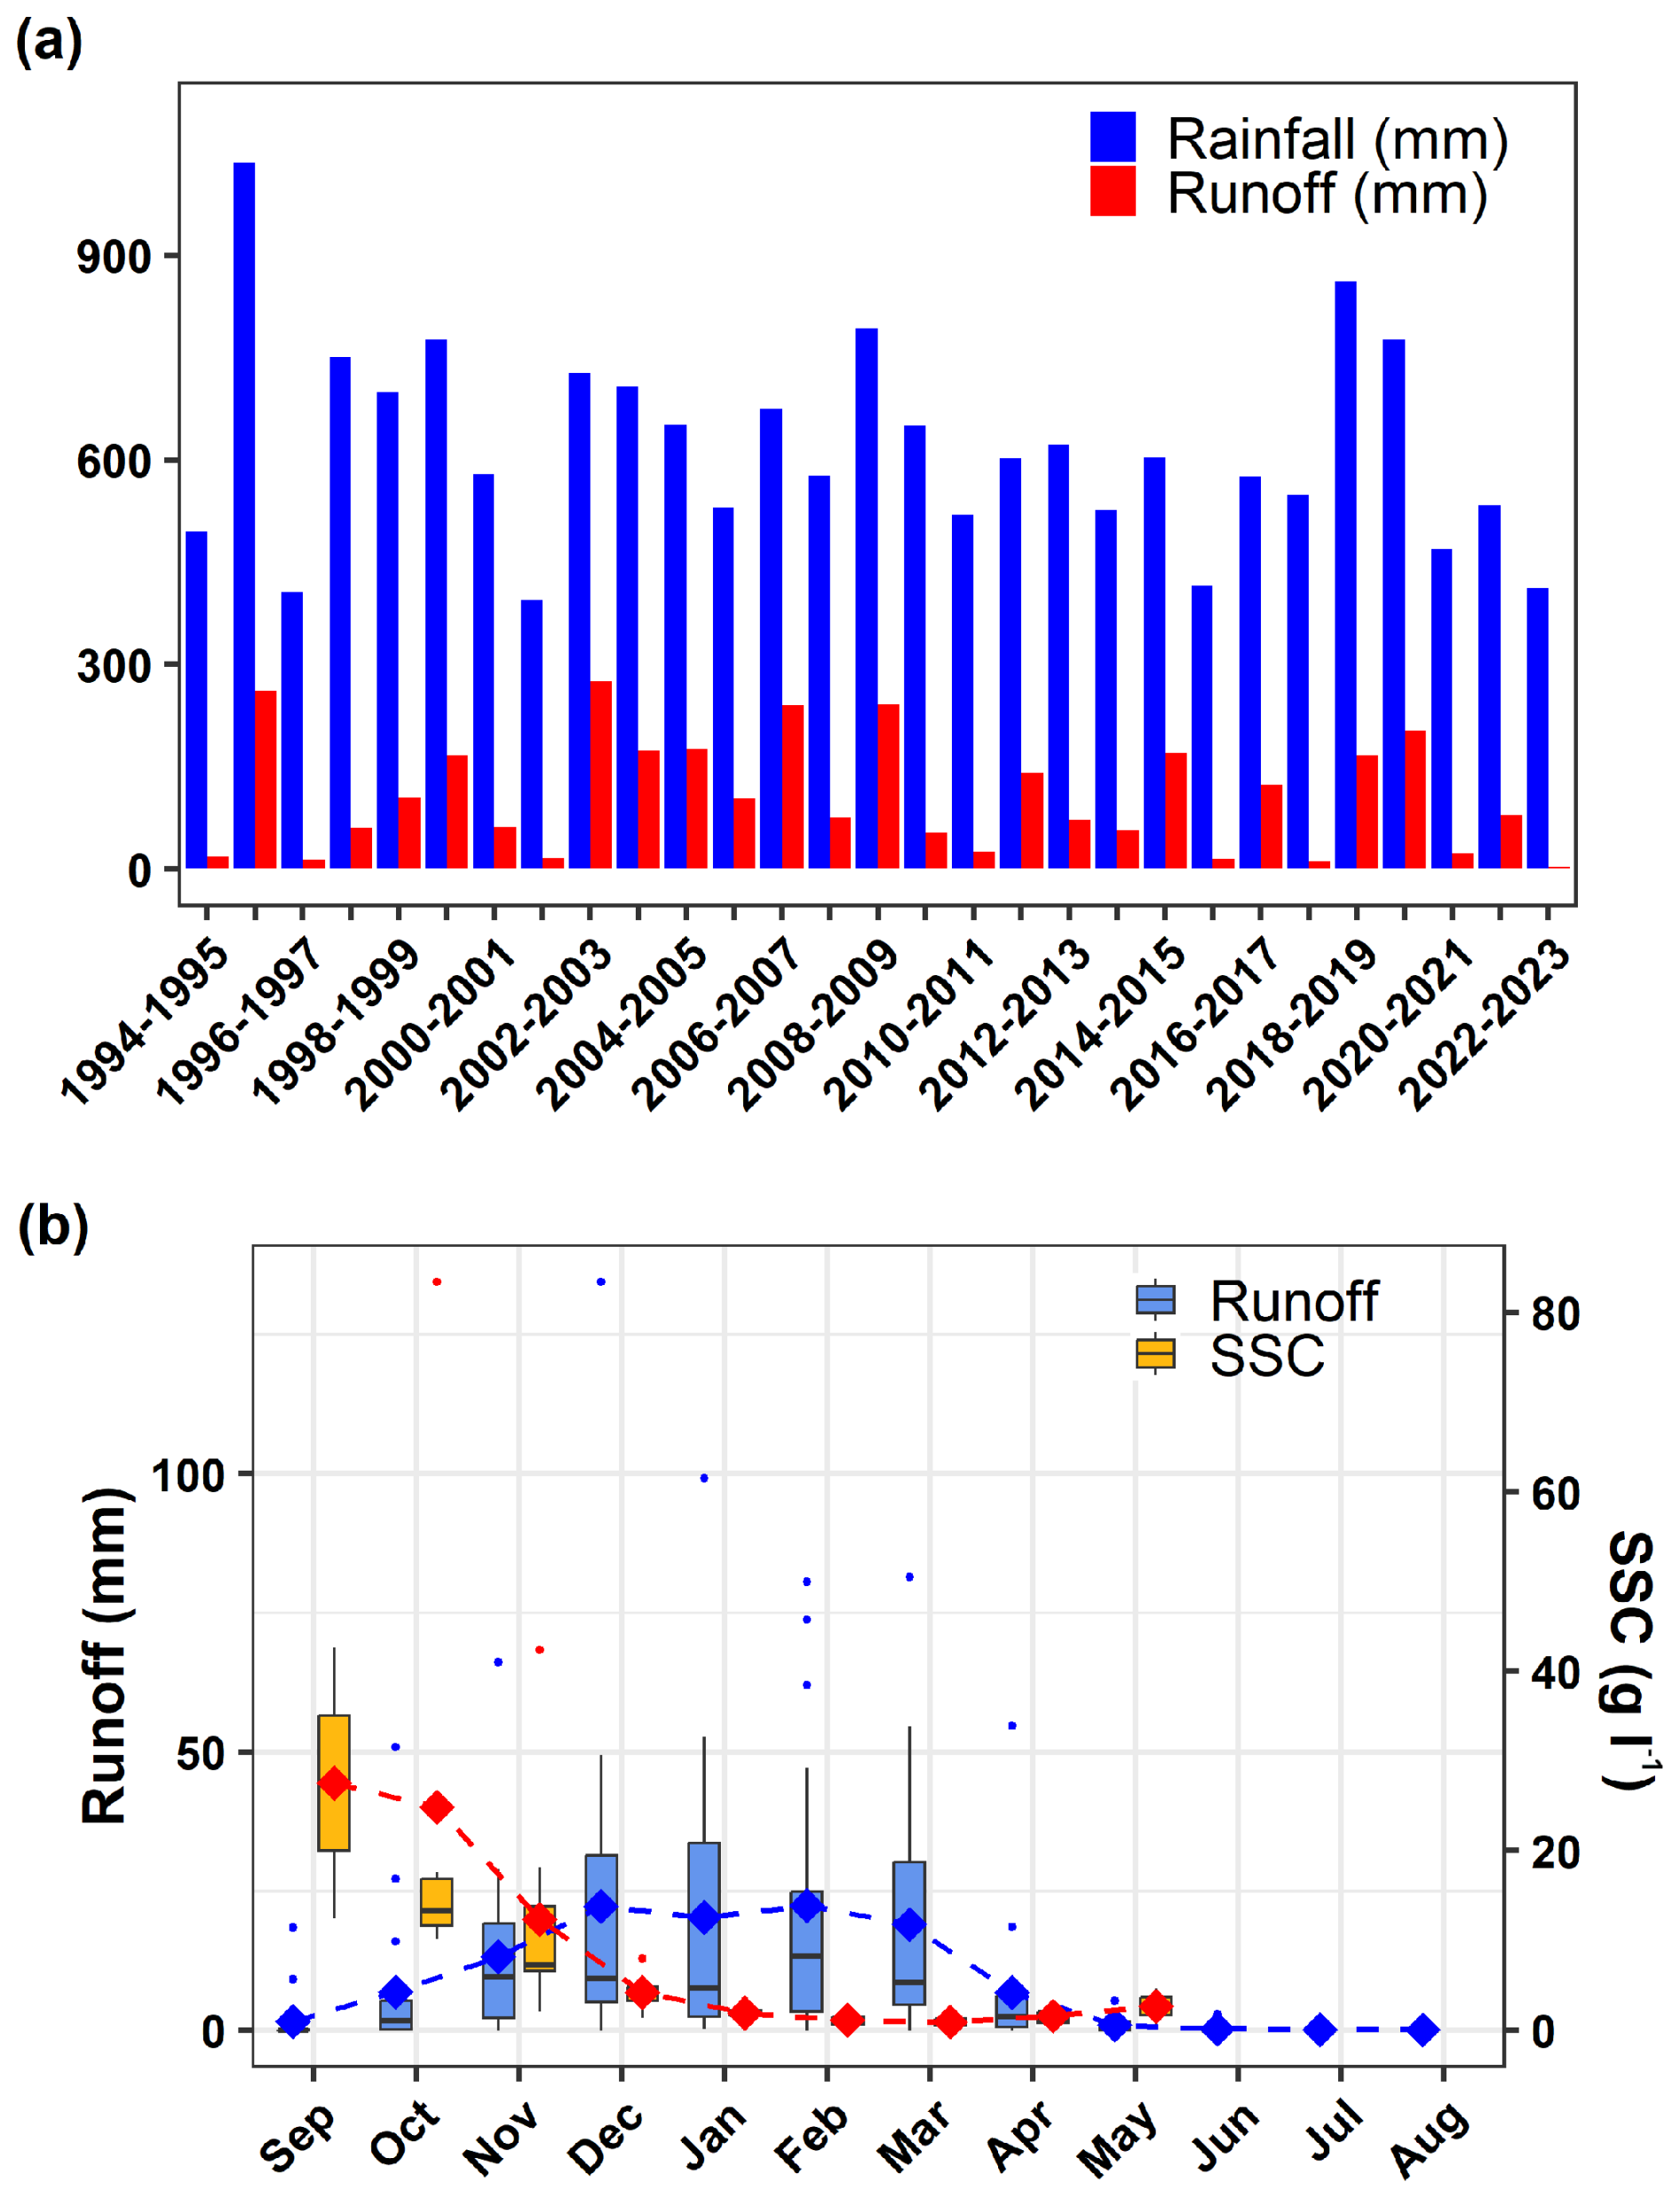
Figure 5(a) Interannual variability of rainfall and runoff at the LAKE Station between 1994 and 2023; (b) Monthly variability of runoff and SSC at the GBV station between 2005 and 2023.
Figure 5b shows the intra-annual variations of runoff discharge and suspended sediment concentration (SSC) at GBV hydrometric station. For runoff, maximum rates are observed from December to March, with intermediate values in November. For SSC, maximum values are observed in September and October, and then quickly decrease, with intermediate values in November. As a result, there is a significant seasonal lag between runoff rates and suspended sediment concentrations, which greatly affects sediment yield dynamics in the catchment area.
4.2.2 No flow occurrence
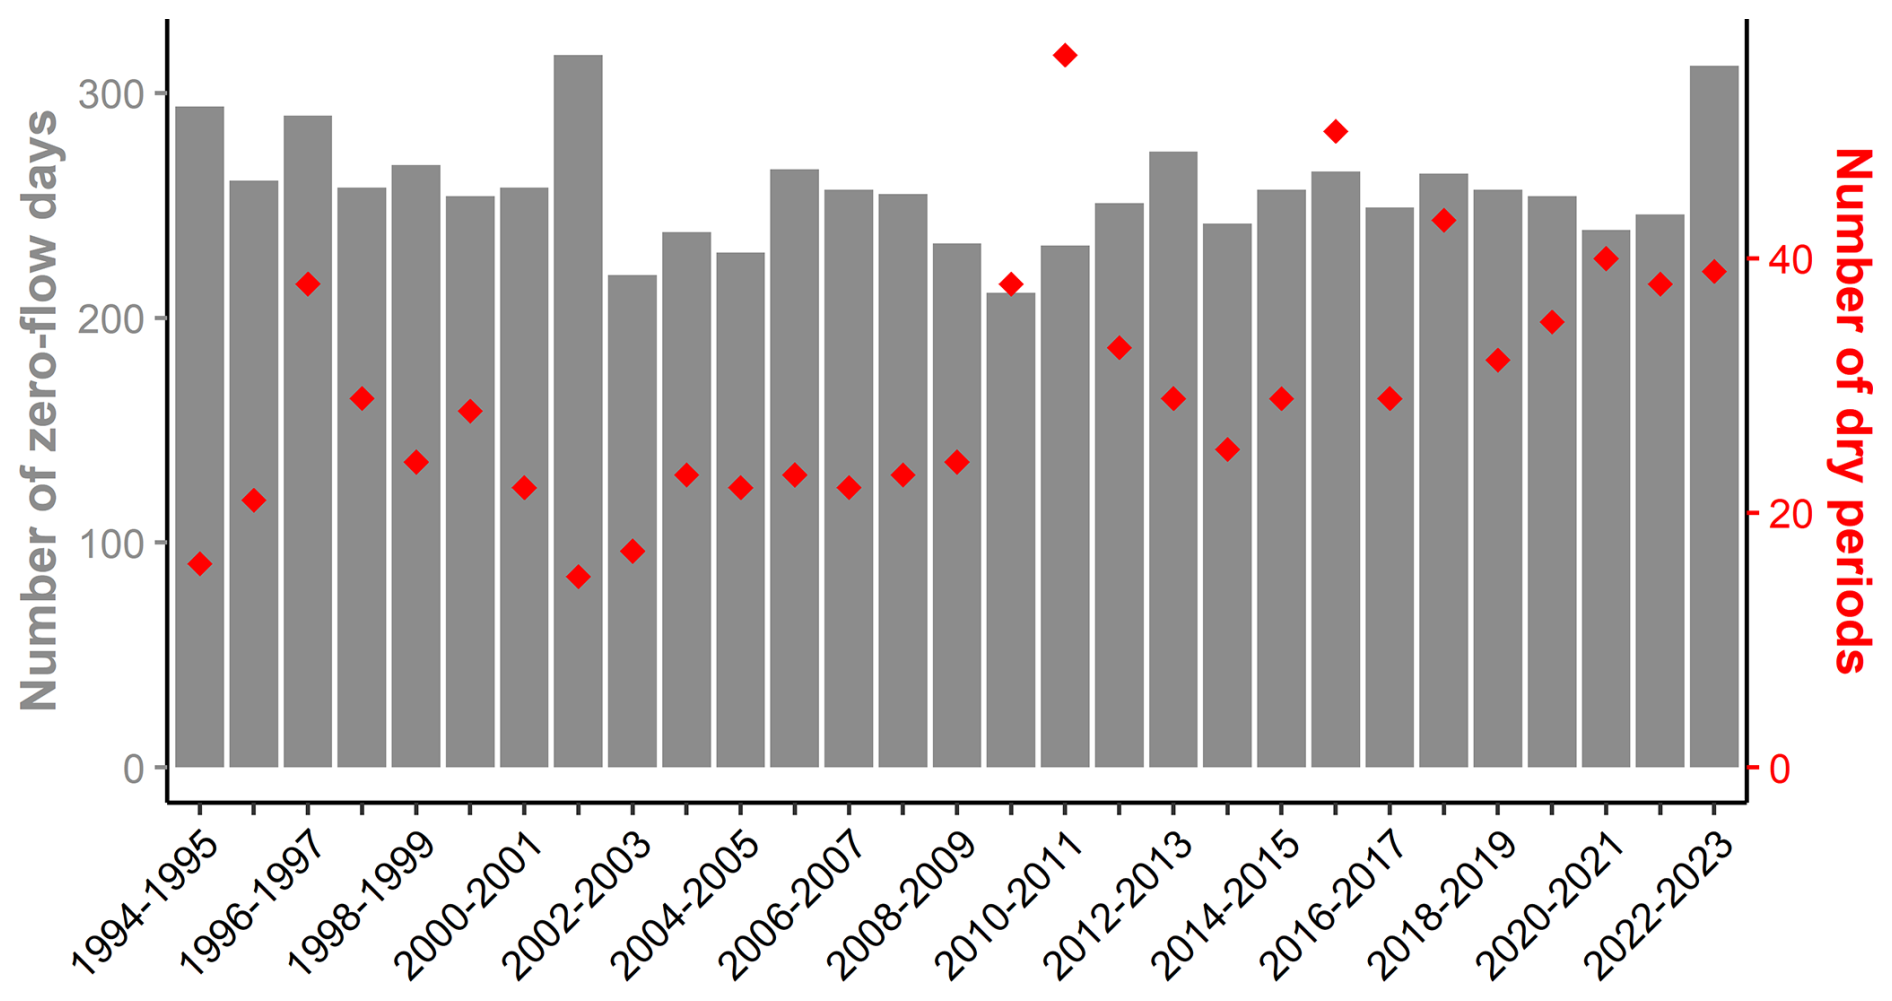
The analysis of the daily discharge time series at the catchment outlet (i.e., Q_LAKE) shows a mean of 258 d with zero-flow per year over the period 1994–2023 (Fig. 6). Notably, discharge from the catchment is highly intermittent, as it only occurs 30 % of the time. Figure 4 also indicates the number of dry periods, a dry period being defined as consecutive days without flow discharge at the catchment outlet. The number of dry periods per year ranged from 15 to over 50, highlighting the very frequent changes between periods of flow and no flow.
Analysis of the cross-correlation between precipitation and discharge enables a rapid estimate of the lag time (tlag), which is a measure of how quickly a stream responds to runoff-producing rainfall (Sultan et al., 2022). According to these authors, the lag time corresponds to about two-thirds of the time of concentration. Figure 7 shows the cross-correlogram drawn up for the 2005–2023 period using the precipitation and discharge time series at the GBV station at 5 min time steps. It highlights narrow peaks with very low time lag ranging from 15 min in autumn to 50 min in spring. These results show that the Kamech catchment is highly reactive, with sub-hourly lag time.
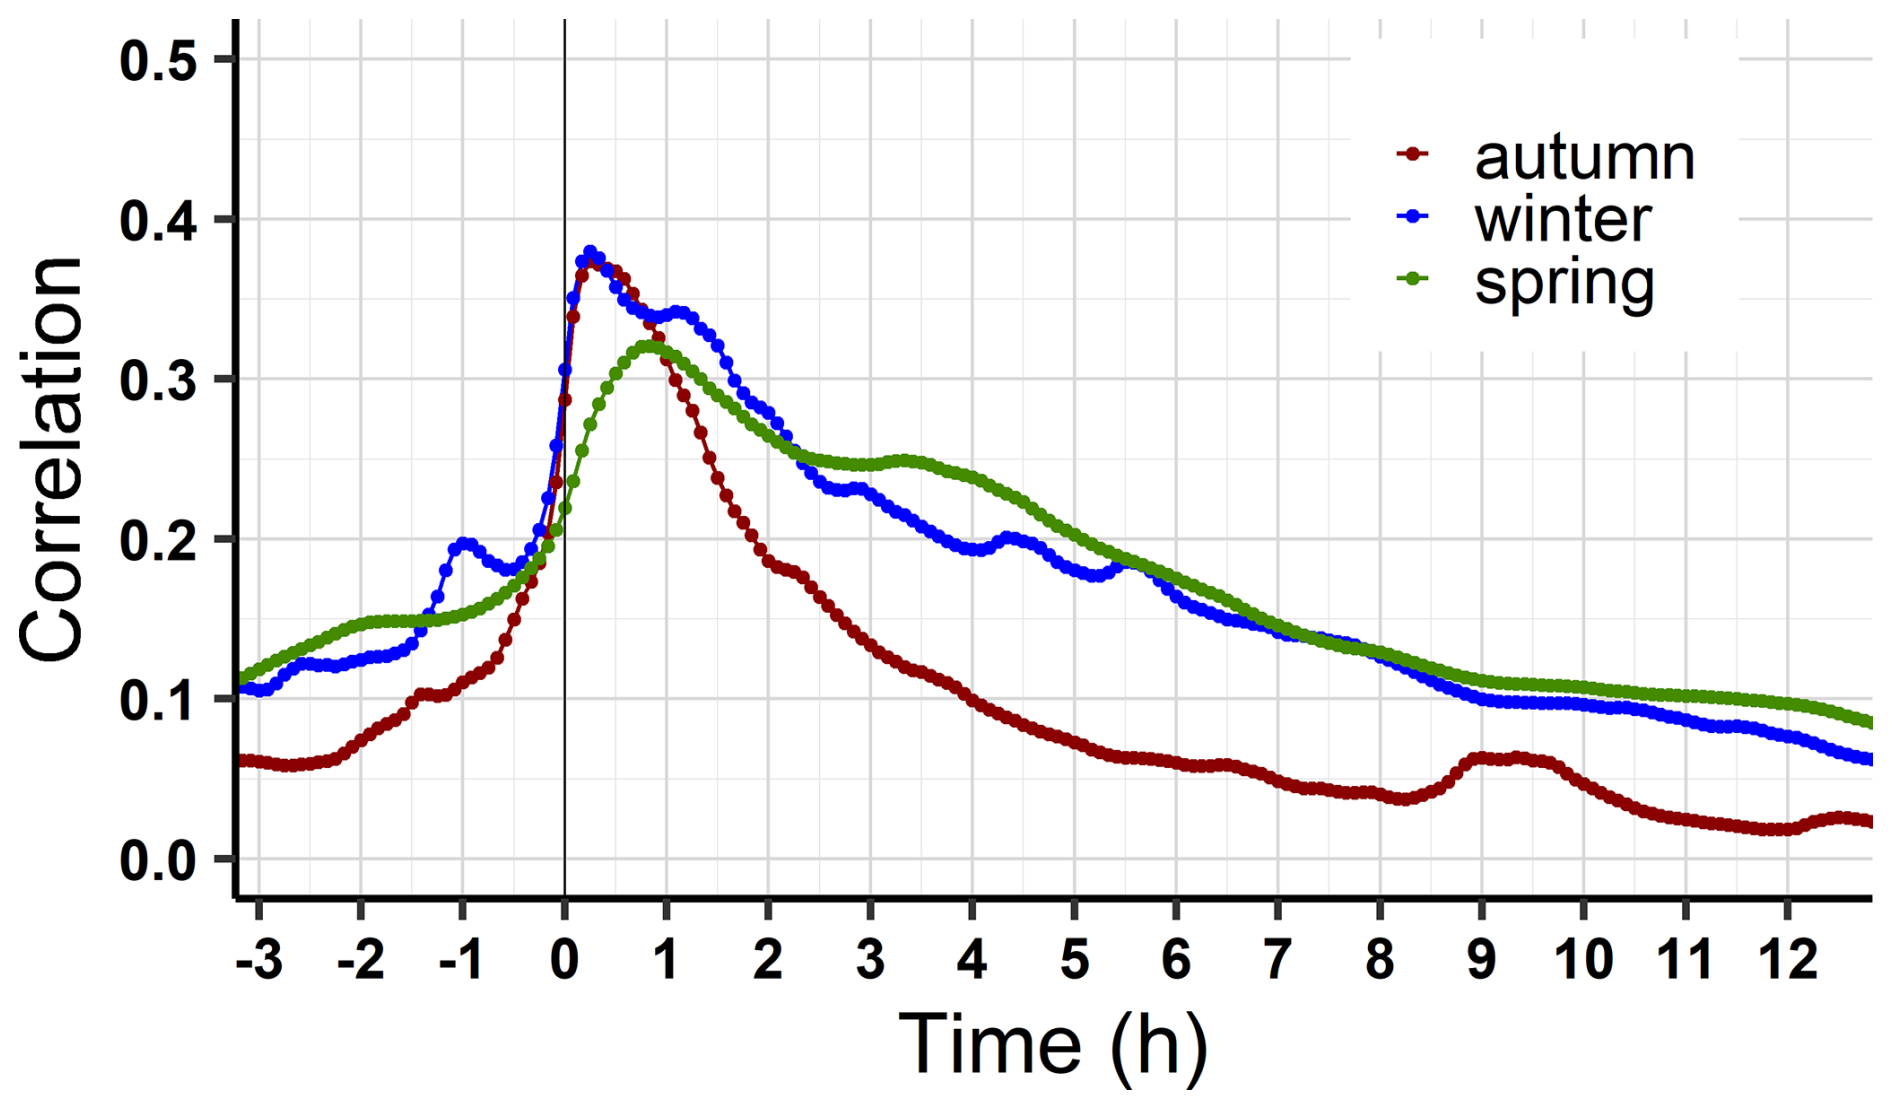
Figure 7Seasonal cross-correlation between precipitation and discharge at the GBV station elaborated with time series at 5 min time steps. Note that the summer season is excluded because there are few runoff events during this time.
4.2.3 Baseflow contribution
A series of base flow separation methods (Table 3) was applied to the daily discharge entering the outlet reservoir (Q-LAKE time series) to derive the baseflow index, which represents the percentage of slow or delayed components to the streamflow. Five hydrograph separation methods come from the R “grwat” package (Rets et al., 2022). They were applied with the default parameters proposed in the package. A sixth one comes from the baseflow package (Pelletier and Andréassian, 2020), and is considered more impartial as it integrates a way to estimate the parameters entering in the flow separation procedure. As shown in Table 3 below, the contribution of baseflow varies depending on the algorithm applied from 3 % to 14 %, confirming the very high reactivity of the Kamech catchment, and therefore a presumed very low contribution of groundwater to the streamflow.
Table 3Estimation of the slow or delayed flow contribution to streamflow at the Kamech outlet.

4.2.4 Duration curves
In this paper we characterized the duration curves in the Kamech catchment during the 18-year period between 2005 and 2023 using the gap-filled daily runoff depth and specific sediment yield at the GBV station (Fig. 8). The results show that a runoff depth over 10 mm d−1 occurred less than 1 % of the time, which equates to 42 d during the 18-year period or an average of 2.3 d yr−1. The average number of annual days decreases to less than 1 when considering a threshold of 20 mm d−1, whereas one day exceeded 60 mm during the considered period. During the 18-year period, only 44 d exceeded 0.5 t ha−1, 30 d exceeded 1 t ha−1, 12 d exceeded 2 t ha−1 and one day exceeded 10 t ha−1. Results also show that 75 % of flow and sediment yield occurred during only 302 d, and 28 d, respectively, representing 4.6 %, and 0.4 % of the period considered.
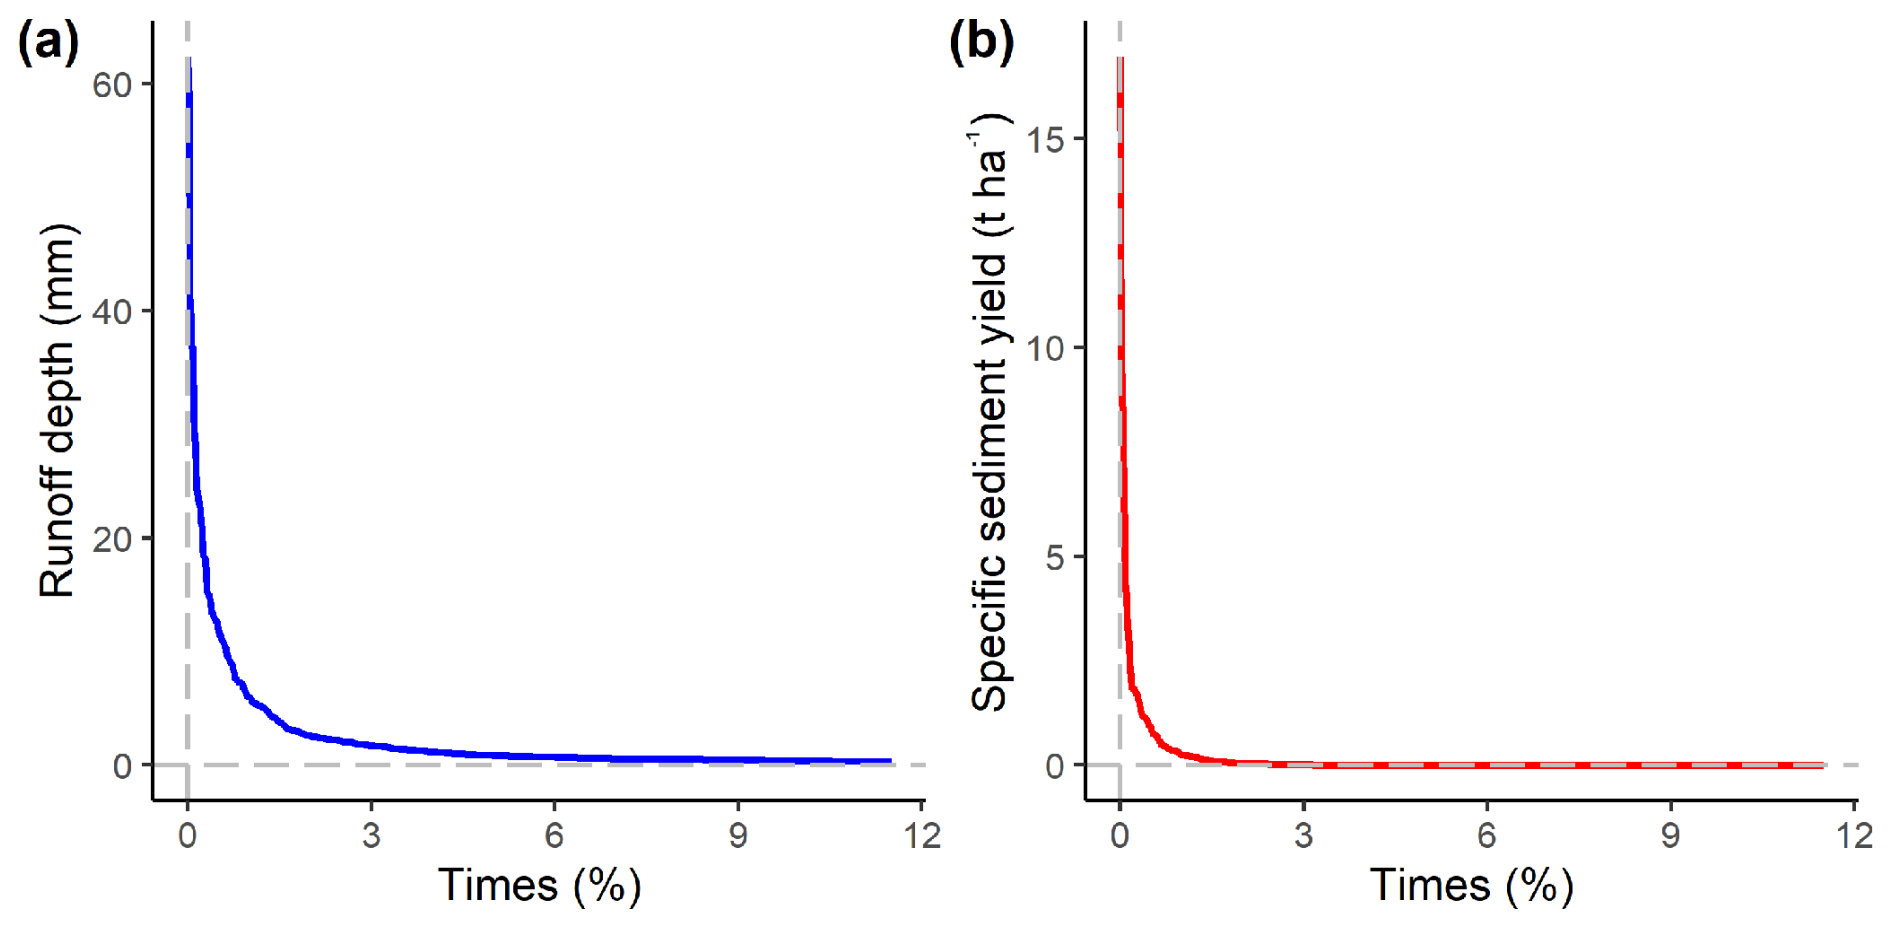
Figure 8Percentage of time exceeding a daily runoff threshold (a) and a daily sediment yield threshold (b) at the GBV station during the 18-year period between 2005 and 2023.
The hydro-erosive regime in Kamech catchment is clearly non-perennial, it can be classified as ephemeral according to the classification proposed by Busch et al. (2020). Indeed, our preliminary analysis shows that streamflow occurs during a very short percentage of time and almost exclusively in response to precipitation events. The very significant compression in time of the runoff and the sediment yield in the catchment emphasised the importance of accurately and comprehensively documenting the response of extreme events, which are rare but account for most of the runoff and sediment fluxes in a Mediterranean context as already shown by Gonzalez-Hidalgo et al. (2007).
The dataset presented in this paper has multiple applications for addressing questions related to hydrological risks, including flood events and severe erosion, as well as risks to agricultural production associated with the frequency of drought episodes. As briefly described below, several studies already used them for these purposes.
For example, Ben Slimane et al. (2013) combined the dataset from the LAKE station with sediment archives extracted from the sediment trapped into the reservoir to identify the main erosive processes in the catchment. Using a fingerprinting method based on several tracers, including radionuclides, they showed that sediment trapped in the reservoir mainly originated from agricultural topsoils, indicating that interill and rill erosion was more involved than gully erosion in the silting up of the reservoir since its construction in 1994. Combining the OMERE monitoring and morphometric analysis of gullies from photographic imagery, Ben Slimane et al. (2018) confirmed the predominance of interrill and rill erosion processes. They estimated that 70 % to 80 % of the sediments reaching the reservoir came from surface soils (diffuse erosion), while only 20 % to 30 % came from banks and ravines. Thus, this dataset, combined with other data, has enabled a better understanding of the sediment sources contributing to the reservoir siltation, which is highly valuable for more effectively targeting recommended soil and water conservation measures.
Inoubli et al. (2016) investigated the impact of shrinking-swell soils dynamics on the dynamics of water and sediment exports at the PAR station. They first observed that the cracks remained open for over six months of the year. This finding is consistent with the conclusion of Mekki et al. (2006) that a threshold of approximately 200 mm of cumulative precipitation since the beginning of the hydrological year is necessary to induce significant runoff in the Kamech catchment. Inoubli et al. (2016) concluded that crack dynamics are likely the main drivers explaining the time lag between runoff flows and suspended matter concentrations observed at the experimental plot outlet. Inoubli et al. (2017) also showed that a seasonal time lag between runoff and erosive response existed at the MBV station, with shrink–swell processes as the most likely driver of this time lag. In this study, we showed that a similar shift is also observed at the GBV station (Fig. 5b), suggesting that crack dynamics can strongly influence runoff response across the entire catchment.
The proposed dataset has also been analyzed in the framework of environmental research catchment networks. For example, Smetanová et al. (2018) analyzed a comprehensive dataset comprising a total of 104 years of sediment yield records from eight small catchments, including Kamech. The study reported a wide range of sediment yield variability (0–271 t ha−1 yr−1 and 0–116 t ha−1 month−1). Considering the eight catchments, they identified that intense time compression was observed in catchments with low sediment yield during spring and summer, whereas low time compression was linked to very high soil loss, low runoff and sediment production thresholds, and high connectivity. These authors also demonstrated that identifying periods of high sediment production is essential for defining management strategies, and that these periods can be predicted by analysing intra-annual variability, seasonality and time compression. Another study conducted by Peña-Angulo et al. (2019) enabled a detailed examination of the spatial variability in hydro-sedimentary variables throughout the Mediterranean basin. This study involved data from 68 research sites (including Kamech) in nine Mediterranean countries, totaling 22 458 events. The study revealed that a small subset of weather types could be responsible for a large proportion of total precipitation, runoff, and sediment yield, suggesting that variations in the frequency of these weather types in the context of climate change could have a significant impact on hydrological responses and sediment transport in the Mediterranean basin.
However, the high temporal variability observed in the study catchment, which is strongly influenced by a few rare events, is likely to alter the previous conclusions. It is therefore important to continue collecting monitoring data and to pursue studies by analyzing longer time series. An ongoing study involves comparing sediment data from core sampling in the reservoir with sediment flows derived from in situ monitoring in order to assess the ability of sediment deposits to estimate the intensity of past floods. Future studies may lie on a variety of questions concerning critical zone processes and the interactions between chemical, physical and biotic components in headwater Mediterranean catchments. A major step forward would be to better understand and prioritize the factors that control water and sediment flows in the Kamech catchment area. Among the main challenges are the need to (i) distinguish the effects of climate variability or climate change from those related to land use and management, (ii) study the interactions between vegetation, carbon, and erosion or between flows and crack dynamics, (iii) better understanding the impact of intermittency on the response of watersheds in terms of water and sediments, etc. Future studies could also focus on exploring modelling strategies aimed at improving water and sediment export from the event scale to longer time scales, and helping to identify land management practices that preserve water and soil resources in changing and uncertain environmental conditions.
All datasets referenced in this work are openly accessible via the repository: https://doi.org/10.23708/PPPPDL (Raclot and Hamdi, 2025). All the monitoring data files are in text format, with a semicolon as the field separator and a “.” as the decimal separator. The geodata are in Esri shapefile format and use the EPSG 32632 projection system. For more details on format, units and conventions, please refer to the “Read_me.txt” file included in this repository. We also encourage users to visit https://www.obs-omere.org/ (currently in French, but available in English in the future, last access: 1 July 2026), which also provides access to metadata and supplementary useful information, such as meteorological data and geodata. It will also host future data, as monitoring will continue as long as our institutions can fund it.
This paper presents a comprehensive database of rainfall measurements and hydro-erosive fluxes collected over nearly 30 years in an agricultural catchment under a Mediterranean climate and vertic soils. These data were acquired as part of the Mediterranean Observatory for Environmental Research (OMERE). In addition to providing a detailed description of the data acquisition protocols, we implemented rigorous quality checking and validation procedures to ensure the usability of the data.
The paper also included a characterization of the hydro-erosive regime in the Kamech catchment, indicating an ephemeral regime with high temporal variability and time compression. The data analysis shows a strong correlation between the runoff rates measured at the different stations. It also highlights the complexity of the hydrological and erosive response, with a significant time lag between runoff flows and suspended matter concentrations throughout the year.
Beyond the detailed description of the monitoring protocols and the initial analyses presented, this work highlights the irreplaceable value of maintaining long-term observations in small Mediterranean agricultural catchments subject to intense climatic variability. Only continuous datasets extending over several decades make it possible to disentangle short-term fluctuations from multi-decadal trends, to detect subtle changes in hydro-sedimentary regimes, and to attribute them to climate variability, climate change, or land management practices.
In regions such as the southern Mediterranean, where extreme events dominate water and sediment fluxes, such sustained monitoring is essential for understanding the frequency, magnitude, and timing of rare but high-impact events. The temporal depth, spatial resolution, and data quality of this dataset thus provide a unique empirical basis for scientific research, the calibration and validation of predictive models, and the design of effective adaptation and conservation strategies. This long-term commitment also ensures that policy-makers and stakeholders can rely on robust evidence to guide decision-making in increasingly uncertain environmental conditions.
RH, DR, IM and JA conceptualized the paper. RH and DR criticized and validated the data. RH and DR analyzed the data. The original draft was prepared by RH and DR, while IM, MG and JA contributed to review and editing.
The contact author has declared that none of the authors has any competing interests.
Publisher's note: Copernicus Publications remains neutral with regard to jurisdictional claims made in the text, published maps, institutional affiliations, or any other geographical representation in this paper. The authors bear the ultimate responsibility for providing appropriate place names. Views expressed in the text are those of the authors and do not necessarily reflect the views of the publisher.
We gratefully acknowledge the Ministry of Agriculture, Water Resources and Fisheries (MARHP) of Tunisia, and in particular its Directorate General for Agricultural Land Management and Conservation (DG ACTA), for its responsibility in the national programme on small dams and hillside lakes. We also thank the Regional Agricultural Development Office (CRDA of Nabeul) for its support in the management of agricultural affairs in the Lebna watershed, where the Kamech catchment is located.
The establishment of the OMERE observatory was made possible through the European research programmes Hydromed (FP4) and SOWAMED (Soil and water in the Mediterranean) (FP6), which provided the initial funding for research facilities on small dams, including the Kamech catchment. It is part of OZCAR research infrastructure, which is supported by the French Ministry of Research, French Research Institutions and Universities. We are also indebted to the research institutes that have continuously supported this observatory since its creation, namely INRGREF (Institut National de Recherche en Génie Rural et Eaux et Forêts) and INAT (Institut National Agronomique de Tunisie) in Tunisia, and IRD (Institut de Recherche pour le Développement) and INRAE (Institut National de Recherche pour l'Agriculture, l'Alimentation et l'Environnement) in France, as well as to the Tunisian and French laboratories that have hosted and managed OMERE activities in Tunisia, including the relevant departments at INRGREF and INAT, UMR LISAH (Unité Mixte de Recherche Laboratoire d'étude des Interactions entre Sol-Agrosystème et Hydrosystème), the joint international laboratory Naïla, and the international research network RHYMA-CES.
We warmly thank the farmers and residents of Kamech, without whose long-standing collaboration this observatory would not exist. We also extend our gratitude to the many researchers, engineers, and observers who contributed to the design, installation, and maintenance of the experimental equipment. It is impossible to name them all individually, but we wish to pay tribute to colleagues who passed away during their careers, including Mekki Ben Youssef (DG ACTA), Slah Nasri (INRGREF), Rawdha Mougou (INRGREF), as well as to those who accompanied the observatory until retirement, such as Ali Dababria (DG ACTA), Henri Camus (IRD), Jean Collinet (IRD) and Noel Guiguen (IRD).
We would like to express our sincere gratitude to the successive coordinators of the OMERE long-term monitoring programme – Jean Albergel, Netij Ben Mechlia, Mohamed Boufaroua, Jérome Molénat, Damien Raclot, Marc Voltz, and Rim Zitouna – who have ensured and continue to ensure its development. We would also like to thank Denis Feurer, Olivier Grunberger, Claude Hammecker and Guillaume Coulouma for their involvement in managing the OMERE catchments.
We thank all those who participated in the installation of the hydrometric stations and the collection of data, including OMERE staff, with special thanks to Mohamed Ben Younes Louati, who managed all fieldwork for two decades; the many students and international civilian volunteers of IRD, and in particular Kilani Ben Hzez, who has carried out daily site measurements with remarkable dedication.
Finally, we would like to thank the University of Bizerte, who took an interest in the work of this observatory and welcomed Hamdi Radhouane as a PhD student.
This paper was edited by Christof Lorenz and reviewed by Giulio Castelli and one anonymous referee.
Albergel, J., Nasri, S., and Boufaroua, M.: Small dams water balance: experimental conditions, data processing and modeling in arid and semiarid areas, in: Proceedings of the International Seminar Rain Water Harvesting and Management of SmallReservoirs in Arid and Semiarid Areas, An Expert Meeting within the EU-INCO Collaboration HYDROMED, edited by: Berndtsson, R., Department of WaterResources Engineering, Lund Institute of Technology, Lund, 45–48, https://www.documentation.ird.fr/hor/fdi:010023962 (last access: 13 July 2026), 1998.
Ben Slimane, A., Raclot, D., Evrard, O., Sanaa, M., Lefèvre, I., Ahmadi, M., Tounsi, M., Rumpel, C., Ben Mammou, A., and Le Bissonnais, Y.: Fingerprinting sediment sources in the outlet reservoir of a hilly cultivated catchment in Tunisia, J. Soils Sediments, 13, 801–815, https://doi.org/10.1007/s11368-012-0642-6, 2013.
Ben Slimane, A., Raclot, D., Rebai, H., Le Bissonnais, Y., Planchon, O., and Bouksila, F.: Combining field monitoring and aerial imagery to evaluate the role of gully erosion in a Mediterranean catchment (Tunisia), Catena, 170, 73–83, https://doi.org/10.1016/j.catena.2018.05.044, 2018.
Boughton, W. C.: A Hydrograph-based model for estimating the water yield of ungauged catchments, Hydrology and Water Resources Symposium, Newcastle, IEAust, https://toolkit.ewater.org.au/Tools/DownloadPublication.aspx?id=1000117 (last access: 11 July 2026), 1993.
Busch, M. H., Costigan, K. H., Fritz, K. M., Datry, T., Krabbenhoft, C. A., Hammond, J. C., Zimmer, M., Olden, J. D., Burrows, R. M., Dodds, W. K., Boersma, K. S., Shanafield, M., Kampf, S. K., Mims, M. C., Bogan, M. T., Ward, A. S., Perez Rocha, M., Godsey, S., Allen, G. H., Blaszczak, J. R., Jones, C. N., and Allen, D. C.: What's in a Name? Patterns, Trends, and Suggestions for Defining Non-Perennial Rivers and Streams, Water, 12, 1980, https://doi.org/10.3390/w12071980, 2020.
Cerdan, O., Govers, G., Le Bissonnais, Y., Van Oost, K., Poesen, J., Saby, N., Gobin, A., Vacca, A., Quinton, J., Auerswald, K., Klik, A., Kwaad, F. J. P. M., Raclot, D., Ionita, I., Rejman, J., Rousseva, S., Muxart, T., Roxo, M. J., and Dostal, T.: Rates and spatial variations of soil erosion in Europe: A study based on erosion plot data, Geomorphology, 122, 167–177, https://doi.org/10.1016/j.geomorph.2010.06.011, 2010.
Chapman, T. G.: Comment on “Evaluation of automated techniques for base flow and recession analyses” by R. J. Nathan and T. A. McMahon, Water Resour. Res., 27, 1783–1784, https://doi.org/10.1029/91wr01007, 1991.
Chapman, T. G. and Maxwell, A. I.: Baseflow separation-comparison of numerical methods with tracer experiments, in: Hydrology and water resources symposium 1996: Water and the environment, Institution of Engineers, Australia, 539–545, 1996.
Cid, N., Bonada, N., Carlson, S., Grantham, T., Gasith, A., and Resh, V.: High Variability Is a Defining Component of Mediterranean-Climate Rivers and Their Biota, Water, 9, 52, https://doi.org/10.3390/w9010052, 2017.
Coron, L., Thirel, G., Delaigue, O., Perrin, C., and Andréassian, V.: The suite of lumped GR hydrological models in an R package, Environ. Modell. Softw., 94, 166–171, https://doi.org/10.1016/j.envsoft.2017.05.002, 2017.
de Araújo, J. C., Batalla, R. J., and Bronstert, A.: Special issue: analysis and modelling of sediment transfer in Mediterranean river basins, J. Soils Sediments, 14, 1905–1908, https://doi.org/10.1007/s11368-014-1000-7, 2014.
Diodato, N. and Bellocchi, G.: Landscape Scales of Erosive Storm Hazard Across the Mediterranean Region, in: Storminess and Environmental Change: Climate Forcing and Responses in the Mediterranean Region, edited by: Diodato, N. and Bellocchi, G., Springer Netherlands, Dordrecht, 101–116, https://doi.org/10.1007/978-94-007-7948-8_7, 2014.
Folton, N., Martin, É., Arnaud, P., and Tolsa, M.: Fifty years of hydrological processes observed in small Mediterranean catchments: towards a scarcity of water resources, La Houille Blanche, 106, 17–27, https://doi.org/10.1051/lhb/2020048, 2020.
Francke, T., Foerster, S., Brosinsky, A., Sommerer, E., Lopez-Tarazon, J. A., Güntner, A., Batalla, R. J., and Bronstert, A.: Water and sediment fluxes in Mediterranean mountainous regions: comprehensive dataset for hydro-sedimentological analyses and modelling in a mesoscale catchment (River Isábena, NE Spain), Earth Syst. Sci. Data, 10, 1063–1075, https://doi.org/10.5194/essd-10-1063-2018, 2018.
Gaillardet, J., Braud, I., Hankard, F., et al.: OZCAR: The French Network of Critical Zone Observatories, Vadose Zone J., 17, 180067, https://doi.org/10.2136/vzj2018.04.0067, 2018.
García-Ruiz, J. M., Nadal-Romero, E., Lana-Renault, N., and Beguería, S.: Erosion in Mediterranean landscapes: Changes and future challenges, Geomorphology, 198, 20–36, https://doi.org/10.1016/j.geomorph.2013.05.023, 2013.
Gonzalez-Hidalgo, J. C., Pena-Monne, J. L., and de Luis, M.: A review of daily soil erosion in Western Mediterranean areas, Catena, 71, 193–199, https://doi.org/10.1016/j.catena.2007.03.005, 2007.
Inoubli, N., Raclot, D., Moussa, R., Habaieb, H., and Le Bissonnais, Y.: Soil cracking effects on hydrological and erosive processes: a study case in Mediterranean cultivated vertisols, Hydrol. Process., 30, 4154–4167, https://doi.org/10.1002/hyp.10928, 2016.
Inoubli, N., Raclot, D., Mekki, I., Moussa, R., and Le Bissonnais, Y.: A Spatiotemporal Multiscale Analysis of Runoff and Erosion in a Mediterranean Marly Catchment, Vadose Zone J., 16, vzj2017.06.0124, https://doi.org/10.2136/vzj2017.06.0124, 2017.
IUSS Working Group WRB: World Reference Base for Soil Resources. International soil classification system for naming soils and creating legends for soil maps, 4th edn., International Union of Soil Sciences (IUSS), Vienna, Austria, https://www.isric.org/sites/default/files/WRB_fourth_edition_2022-12-18.pdf (last access: 9 April 2025), 2022.
Jakeman, A. J. and Hornberger, G. M.: How much complexity is warranted in a rainfall-runoff model, Water Resour. Res., 29, 2637–2649, https://doi.org/10.1029/93wr00877, 1993.
Khairallah, W., Raclot, D., Annabi, M., Coulouma, G., Guenet, B., Rumpel, C., and Bahri, H.: Evidence of high carbon biodegradability in the subsoil of Mediterranean croplands, Geoderma, 455, 117212, https://doi.org/10.1016/j.geoderma.2025.117212, 2025.
Klotz, S., Le Bouteiller, C., Mathys, N., Fontaine, F., Ravanat, X., Olivier, J.-E., Liébault, F., Jantzi, H., Coulmeau, P., Richard, D., Cambon, J.-P., and Meunier, M.: A high-frequency, long-term data set of hydrology and sediment yield: the alpine badland catchments of Draix-Bléone Observatory, Earth Syst. Sci. Data, 15, 4371–4388, https://doi.org/10.5194/essd-15-4371-2023, 2023.
Lyne, V. and Hollick, M.: Stochastic Time-Variable Rainfall-Runoff Modeling, Australian National Conference Publication, 79, 89–92, 1979.
Mekki, I., Albergel, J., Ben Mechlia, N., and Voltz, M.: Assessment of overland flow variation and blue water production in a farmed semi-arid water harvesting catchment, Phys. Chem. Earth, 31, 1048–1061, https://doi.org/10.1016/j.pce.2006.07.003, 2006.
Matthews, F., Verstraeten, G., Borrelli, P., et al.: EUSEDcollab: a network of data from European catchments to monitor net soil erosion by water, Sci. Data 10, 515, https://doi.org/10.1038/s41597-023-02393-8, 2023.
Molénat, J., Raclot, D., Zitouna, R., Andrieux, P., Coulouma, G., Feurer, D., Grunberger, O., Lamachère, J. M., Bailly, J. S., Belotti, J. L., Ben Azzez, K., Ben Mechlia, N., Ben Younès Louati, M., Biarnès, A., Blanca, Y., Carrière, D., Chaabane, H., Dagès, C., Debabria, A., Dubreuil, A., Fabre, J. C., Fages, D., Floure, C., Garnier, F., Geniez, C., Gomez, C., Hamdi, R., Huttel, O., Jacob, F., Jenhaoui, Z., Lagacherie, P., Le Bissonnais, Y., Louati, R., Louchart, X., Mekki, I., Moussa, R., Negro, S., Pépin, Y., Prévot, L., Samouelian, A., Seidel, J. L., Trotoux, G., Troiano, S., Vinatier, F., Zante, P., Zrelli, J., Albergel, J., and Voltz, M.: OMERE: A Long-Term Observatory of Soil and Water Resources, in Interaction with Agricultural and Land Management in Mediterranean Hilly Catchments, Vadose Zone J., 17, 180086, https://doi.org/10.2136/vzj2018.04.0086, 2018.
Müller, G., Middelburg, J. J., and Sluijs, A.: Introducing GloRiSe – a global database on river sediment composition, Earth Syst. Sci. Data, 13, 3565–3575, https://doi.org/10.5194/essd-13-3565-2021, 2021.
Nord, G., Boudevillain, B., Berne, A., Branger, F., Braud, I., Dramais, G., Gérard, S., Le Coz, J., Legoût, C., Molinié, G., Van Baelen, J., Vandervaere, J.-P., Andrieu, J., Aubert, C., Calianno, M., Delrieu, G., Grazioli, J., Hachani, S., Horner, I., Huza, J., Le Boursicaud, R., Raupach, T. H., Teuling, A. J., Uber, M., Vincendon, B., and Wijbrans, A.: A high space–time resolution dataset linking meteorological forcing and hydro-sedimentary response in a mesoscale Mediterranean catchment (Auzon) of the Ardèche region, France, Earth Syst. Sci. Data, 9, 221–249, https://doi.org/10.5194/essd-9-221-2017, 2017.
Palmieri, A., Shah, F., and Dinar, A.: Economics of reservoir sedimentation and sustainable management of dams, J. Environ. Manage., 61, 149–163, https://doi.org/10.1006/jema.2000.0392, 2001.
Patault, E.: Analyse multi-échelle des processus d'érosion hydrique et de transferts sédimentaires en territoire agricole : exemple du bassin versant de la Canche (France), Thèse de doctorat, Ecole nationale supérieure Mines-Télécom Lille Douai, https://doi.org/10.70675/9420bba2zab38z4ee9z93cbzc2b4df8cc412, 2018.
Pelletier, A. and Andréassian, V.: Hydrograph separation: an impartial parametrisation for an imperfect method, Hydrol. Earth Syst. Sci., 24, 1171–1187, https://doi.org/10.5194/hess-24-1171-2020, 2020.
Peña-Angulo, D., Nadal-Romero, E., Gonzalez-Hidalgo, J. C., Albaladejo, J., Andreu, V., Bagarello, V., Barhi, H., Batalla, R. J., Bernal, S., Bienes, R., Campo, J., Campo-Bescos, M. A., Canatario-Duarte, A., Canton, Y., Casali, J., Castillo, V., Cerda, A., Cheggour, A., Cid, P., Cortesi, N., Desir, G., Diaz-Pereira, E., Espigares, T., Estrany, J., Fernandez-Raga, M., Ferreira, C. S. S., Ferro, V., Gallarty, F., Gimenez, R., Gimeno, E., Gomez, J. A., Gomez-Gutierrez, A., Gomez-Macpherson, H., Gonzalez-Pelayo, O., Hueso-Gonzalez, P., Kairis, O., Karatzas, G. P., Klotz, S., Kosmas, C., Lana-Renault, N., Lasanta, T., Latron, J., Lazaro, R., Le Bissonnais, Y., Le Bouteiller, C., Licciardello, F., Lopez-Tarazon, J. A., Lucia, A., Marin, C., Marques, M. J., Martinez-Fernandez, J., Martinez-Mena, M., Martinez-Murillo, J. F., Mateos, L., Mathys, N., Merino-Martin, L., Moreno-de las Heras, M., Moustakas, N., Nicolau, J. M., Novara, A., Pampalone, V., Raclot, D., Rodriguez-Blanco, M. L., Rodrigo-Comino, J., Romero-Diaz, A., Roose, E., Rubio, J. L., Ruiz-Sinoga, J. D., Schnabel, S., Senciales-Gonzalez, J. M., Simonneaux, V., Sole-Benet, A., Taguas, E., V., Taboada-Castro, M. M., Taboada-Castro, M. T., Todisco, F., Ubeda, X., Varouchakis, E. A., Vericat, D., Wittenberg, L., Zabaleta, A., and Zorn, M.: Spatial variability of the relationships of runoff and sediment yield with weather types throughout the Mediterranean basin, J. Hydrol., 571, 390–405, https://doi.org/10.1016/j.jhydrol.2019.01.059, 2019.
Raclot, D. and Hamdi, R.: OMERE Observatory – A long-term dataset on hydrology and suspended sediments in the Kamech catchment (1994–2023), DataSuds [data set], https://doi.org/10.23708/PPPPDL, 2025.
Raclot, D., Le Bissonnais, Y., Annabi, M., Sabir, M., and Smetanova, A.: Main Issues for Preserving Mediterranean Soil Resources From Water Erosion Under Global Change, Land Degrad. Dev., 29, 789–799, https://doi.org/10.1002/ldr.2774, 2018.
Rets, E., Kireeva, M., Samsonov, T., Ezerova, N., Gorbarenko, A., and Frolova, N.: Algorithm grwat for Automated Hydrograph Separation by B.I. Kudelin's Method: Problems and Perspectives, Water Resour., 49, 23–37, https://doi.org/10.1134/S0097807822010146, 2022.
Smetanová, A., Le Bissonnais, Y., Raclot, D., Pedro Nunes, J., Licciardello, F., Le Bouteiller, C., Latron, J., Rodríguez Caballero, E., Mathys, N., Klotz, S., Mekki, I., Gallart, F., Solé Benet, A., Pérez Gallego, N., Andrieux, P., Moussa, R., Planchon, O., Santos, J. M., Alshihabi, O., Chikhaoui, M., and Follain, S.: Temporal variability and time compression of sediment yield in small Mediterranean catchments: impacts for land and water management, Soil Use Manage., 34, 388–403, https://doi.org/10.1111/sum.12437, 2018.
Sultan, D., Tsunekawa, A., Tsubo, M., Haregeweyn, N., Adgo, E., Meshesha, D. T., Fenta, A. A., Ebabu, K., Berihun, M. L., and Setargie, T. A.: Evaluation of lag time and time of concentration estimation methods in small tropical watersheds in Ethiopia, Journal of Hydrology: Regional Studies, 40, 101025, https://doi.org/10.1016/j.ejrh.2022.101025, 2022.
Vallebona, C., Pellegrino, E., Frumento, P., and Bonari, E.: Temporal trends in extreme rainfall intensity and erosivity in the Mediterranean region: a case study in southern Tuscany, Italy, Climatic Change, 128, 139–151, https://doi.org/10.1007/s10584-014-1287-9, 2015.
Vanmaercke, M., Poesen, J., Verstraeten, G., de Vente, J., and Ocakoglu, F.: Sediment yield in Europe: Spatial patterns and scale dependency, Geomorphology, 130, 142–161, https://doi.org/10.1016/j.geomorph.2011.03.010, 2011.
Vicente-Serrano, S. M., Tramblay, Y., Reig, F., González-Hidalgo, J. C., Beguería, S., Brunetti, M., Kalin, K. C., Patalen, L., Kržič, A., Lionello, P., Lima, M. M., Trigo, R. M., El-Kenawy, A. M., Eddenjal, A., Türkes, M., Koutroulis, A., Manara, V., Maugeri, M., Badi, W., Mathbout, S., Bertalanič, R., Bocheva, L., Dabanli, I., Dumitrescu, A., Dubuisson, B., Sahabi-Abed, S., Abdulla, F., Fayad, A., Hodzic, S., Ivanov, M., Radevski, I., Peña-Angulo, D., Lorenzo-Lacruz, J., Domínguez-Castro, F., Gimeno-Sotelo, L., García-Herrera, R., Franquesa, M., Halifa-Marín, A., Adell-Michavila, M., Noguera, I., Barriopedro, D., Garrido-Perez, J. M., Azorin-Molina, C., Andres-Martin, M., Gimeno, L., Nieto, R., Llasat, M. C., Markonis, Y., Selmi, R., Ben Rached, S., Radovanović, S., Soubeyroux, J.-M., Ribes, A., Saidi, M. E., Bataineh, S., El Khalki, E. M., Robaa, S., Boucetta, A., Alsafadi, K., Mamassis, N., Mohammed, S., Fernández-Duque, B., Cheval, S., Moutia, S., Stevkov, A., Stevkova, S., Luna, M. Y., and Potopová, V.: High temporal variability not trend dominates Mediterranean precipitation, Nature, 639, 658–666, https://doi.org/10.1038/s41586-024-08576-6, 2025.
Woodward, J. C.: Patterns of erosion and suspended sediment yield in Mediterranean river basins, in: Sediment and Water Quality in River Catchments, edited by: Foster, I. D. L., Gurnell, A. M., and Webb, B. W., Wiley, Chichester, 365–389, https://scispace.com/pdf/patterns-of-erosion-and-suspended-sediment-yield-in-20pqwmz27q.pdf (last access: 13 July 2026), 1995.
- Abstract
- Introduction
- Presentation of the Kamech catchment and the monitoring infrastructure
- Data
- Preliminary explorations of the database
- Examples of previous studies and open questions
- Data availability
- Conclusion
- Author contributions
- Competing interests
- Disclaimer
- Acknowledgements
- Review statement
- References
- Abstract
- Introduction
- Presentation of the Kamech catchment and the monitoring infrastructure
- Data
- Preliminary explorations of the database
- Examples of previous studies and open questions
- Data availability
- Conclusion
- Author contributions
- Competing interests
- Disclaimer
- Acknowledgements
- Review statement
- References