the Creative Commons Attribution 4.0 License.
the Creative Commons Attribution 4.0 License.
 | 03 Jul 2026
Mapping global onshore wind turbines using multi-source remote sensing images and hybrid learning approaches
Shujun Li
Yongze Song
Peng Wang
Wind power serves as a vital zero-carbon alternative to fossil fuels for climate change mitigation. Nevertheless, the vast expansion of wind turbine installation requires extensive terrestrial resources, raising wide concerns regarding land use competition and ecological impacts. Quantifying these effects necessitates near real-time geospatial data on wind turbine placement and density. However, current methods remain inadequate for monitoring the fast-growing wind turbine deployment. Here, we developed an integrated framework that combines OpenStreetMap (OSM) data with multi-source remote sensing images (Google Earth and Sentinel-1/2), and deep learning and traditional machine learning models (ResNet-18 and Random Forest) to map global onshore wind turbines. Our models achieve validation accuracy > 97 % while enabling cost-effective, timely updates of global onshore wind turbines. Eventually, we established a geographical dataset (GonshoreWT2024) covering a total of 416 532 wind turbines globally by 2024. This dataset represents a tenfold expansion over global wind turbine inventories as of 2020, and updates 42 955 more onshore wind turbines compared to the Global Renewables Watch based on lower computational requirements. In addition, we found that 87 % of wind turbines are situated on cropland and grassland, followed by forest and bare ground. This dataset facilitates essential studies on renewable energy land management, ecological impact analysis, and data-driven energy transition policies. The codes and dataset of the global onshore wind turbines are available at the Zenodo link: https://doi.org/10.5281/zenodo.18984175 (Shujun et al., 2026).
- Article
(11384 KB) - Full-text XML
- BibTeX
- EndNote


Wind energy will increase substantially over the coming decades to meet clean energy targets (Mckenna et al., 2025). Under the 1.5° scenario, global installed wind power capacity is projected to reach nearly 10 300 GW by 2050, with onshore wind comprising 75 % of total installations (Raimi et al., 2023). Compared to other energy technologies, wind power exhibits relatively low land use efficiency when accounting for wind turbine spacing requirements (Dai et al., 2024). Accordingly, meeting future deployment targets will necessitate substantial land allocations, raising pressing concerns about land-use conversion and biodiversity loss that demand urgent attention (Kati et al., 2021; Rinne et al., 2018). However, detailed geospatial data at the facility level is particularly required for the quantification of these impacts (Kruitwagen et al., 2021).
Indeed, asset-level data and facility arrangement are essential for power generation nowcasting and forecasting, as well as for decision-making by grid operators and energy stakeholders (Calvert et al., 2013; Tavakkoli et al., 2021). For instance, geospatial analysis of historical placements can inform wind turbine siting decisions by revealing both human and environmental landscape factors (Roddis et al., 2018). Previous research confirmed that substantial positional errors exist in the current available wind facility records, especially pronounced in high-growth renewable energy markets (Cerri et al., 2024; Effenberger and Ludwig, 2022). A timely geospatial data set is critically needed to maintain accurate records of wind energy infrastructure, given its unprecedented growth rate. The dataset could also support data-driven metrics for Sustainable Development Goals (SDGs) (Mishra et al., 2024), including SDG 7 (Affordable and Clean Energy), SDG 13 (Climate Action), and SDG 15 (Life on Land).
Despite the demonstrated importance of location data, only a few spatially explicit datasets are publicly available. At the global scale, a geospatial wind turbine dataset for 2020 is introduced (Dunnett et al., 2020), but its update mechanism depends entirely on OpenStreetMap (OSM), a crowdsourced data derived from heterogeneous contributors that could introduce significant uncertainty. Meanwhile, while multiple frameworks exist for updating global offshore wind turbine data (Hoeser et al., 2022; Zhang et al., 2021), onshore wind turbine updating methods remain underdeveloped due to their greater spatial distribution and environmental variability. Recently, Microsoft and Planet's Global Renewables Watch platform employs deep learning for global wind and solar monitoring (Robinson et al., 2025), but it demands massive computing resources for data updates. At the national level, there are geospatial datasets for the United States (Rand et al., 2020), Germany (Manske et al., 2022), Italy (Smeraldo et al., 2020), and South Africa (Kleebauer et al., 2025). However, inconsistent data collection methods across datasets with delays in update frequencies could hinder their systematic comparability. Currently, the research community lacks both a unified methodology and accessible datasets for tracking worldwide onshore wind turbine deployments.
To address these gaps, our study presents a hybrid framework combining deep learning and a traditional machine learning framework for updating global onshore wind turbine data. By integrating multi-source remote sensing data (Google Earth high-resolution images, Sentinel-1, and Sentinel-2), our workflow systematically detects and validates global onshore wind turbines to generate a 2024 geodatabase (GonshoreWT2024). With OSM wind turbine locations as initial inputs, the two-stage locating process involves: (1) training a deep learning classifier (ResNet-18) on Google high-resolution images to identify and correct erroneous OSM records, followed by (2) detecting omitted wind turbines with Sentinel-1/2 spectral features and a Random Forest model trained on Google Earth Engine (GEE). Additionally, we examined worldwide land use characteristics of wind turbine sites and their national distribution patterns to assess current wind energy spatial utilization. Our study delivers comprehensive monitoring tools and datasets essential for tracking wind energy growth, enabling data-driven policy decisions to advance sustainable wind power development worldwide.
2.1 Framework
The proposed framework combines OSM's crowdsourced geospatial data with a two-stage deep learning/traditional machine learning pipeline (Fig. 1) to locate a global onshore wind turbine dataset for 2024. The first part involves utilizing OSM wind turbine coordinates to extract high-resolution Google Earth images, then training a ResNet-18 convolutional neural network to classify and flag erroneous wind turbines in the OSM dataset. The second part employs confirmed wind turbine locations to train a Random Forest classifier for potential omitted wind turbines using Sentinel-1/2 features at GEE, combining with validation through our pre-trained ResNet-18 model applied to Google high-resolution images of the potential points. The integrated output merges error-corrected OSM data with supplemented wind turbine omissions, generating an enhanced global dataset that demonstrates improved spatial accuracy and comprehensive operational wind turbine coverage. This framework reduces barriers to entry by using publicly available platforms, offering a cost-saving and resource-efficient alternative.
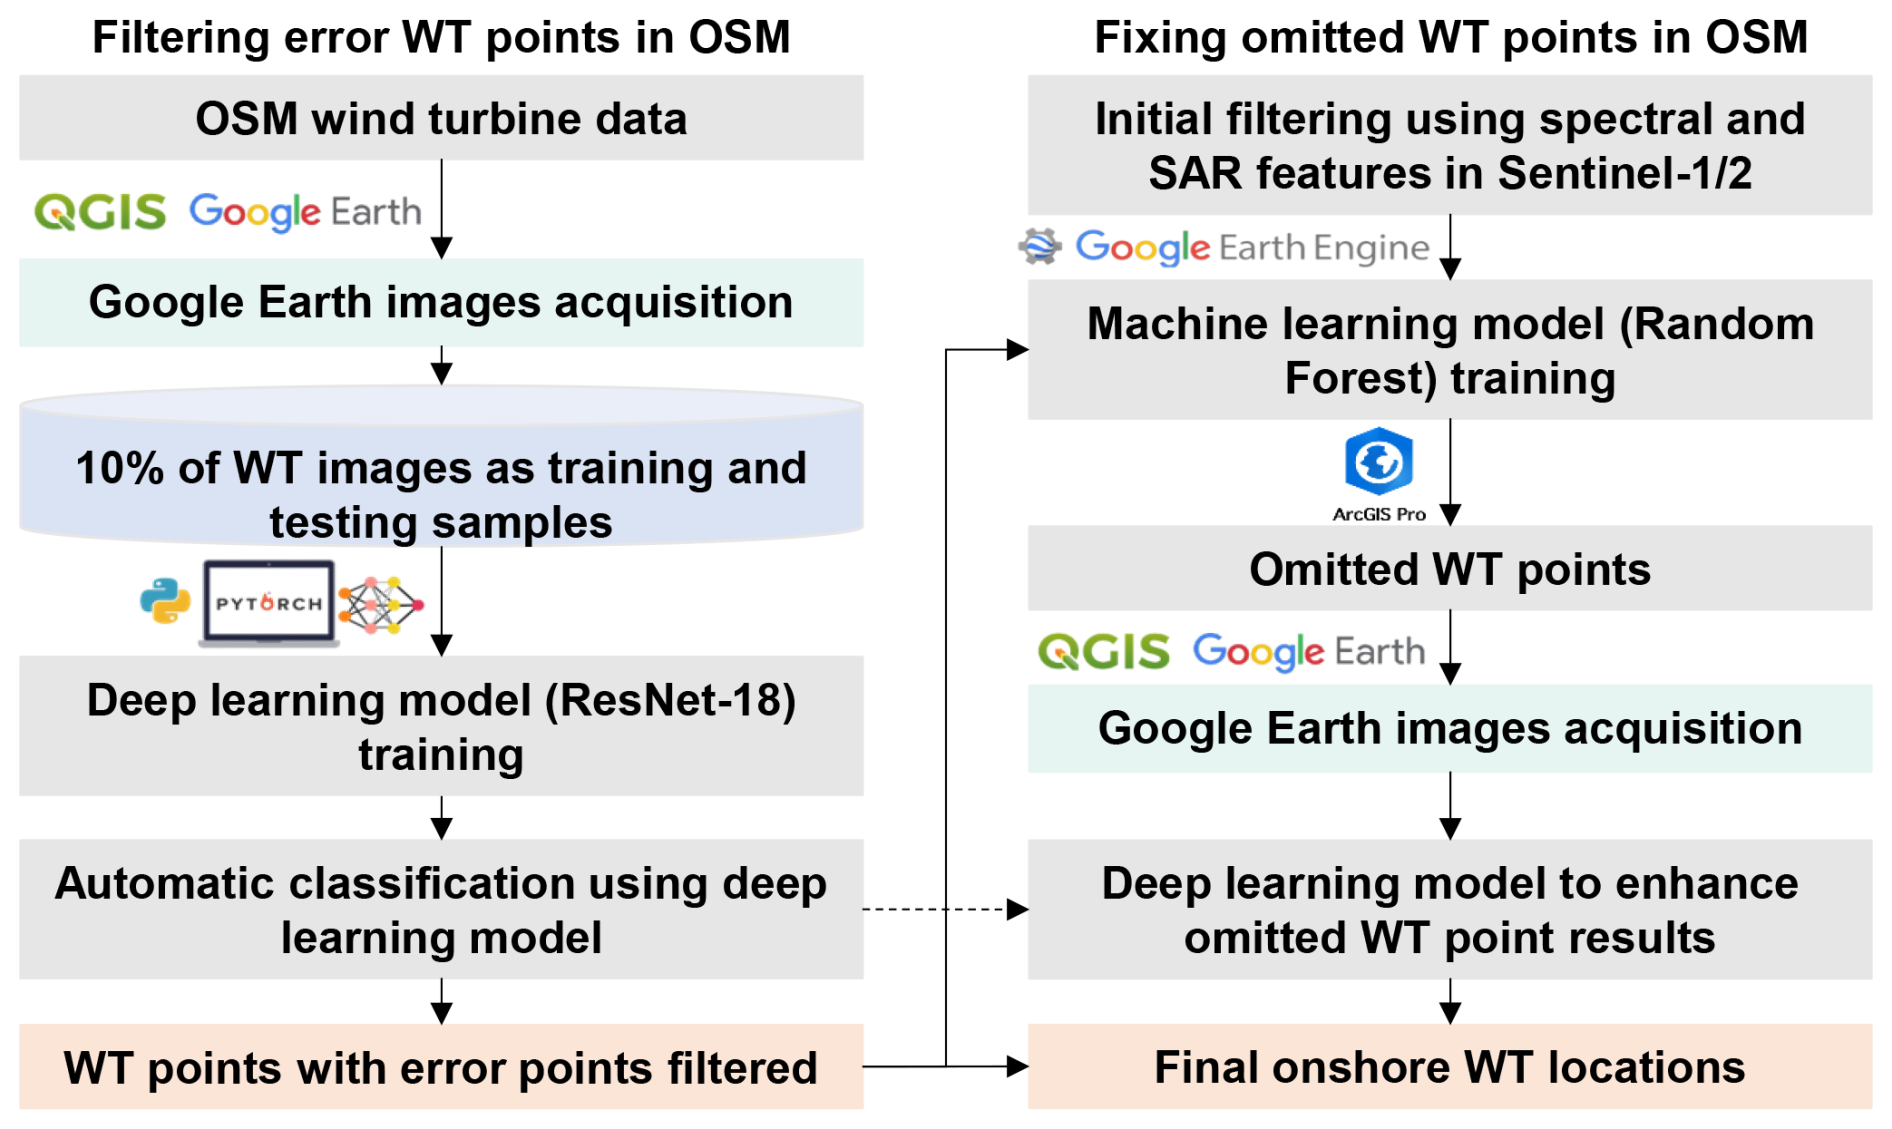
Figure 1Framework for mapping global onshore wind turbines. Where the WT represents wind turbines, OSM represents OpenStreetMap (© OpenStreetMap contributors, https://www.openstreetmap.org/copyright, last access: 25 June 2026). The third-party logos shown in this figure are used only to identify the software and platforms used in the workflow. All logos, trademarks, and copyrights belong to their respective owners.
2.2 Two-phase approach for global onshore wind turbine mapping
2.2.1 Filtering of erroneous data with deep learning model
We obtained the baseline OSM 2024 wind turbine dataset through the QuickOSM plugin (based on the Overpass API) in QGIS software with the query parameter: generator: source=wind. Given our focus on the individual wind turbine level, we utilized this query filter for nodes representing wind turbines in the format of point features. Since we focus on onshore wind turbines, the OSM land polygon derived from https://osmdata.openstreetmap.de/data/land-polygons.html (last access: 25 June 2026) is used to define the study extent and refine the dataset, and a preliminary global inventory of 377 154 geolocated onshore wind turbines with complete metadata records was produced. Given OSM's crowdsourced feature due to unverified contributors, the extracted wind turbine locations serve as initial references that demand thorough validation. Subsequent analysis addressed both commission errors (false positives) and omission errors (omitted wind turbines) through technical verification.
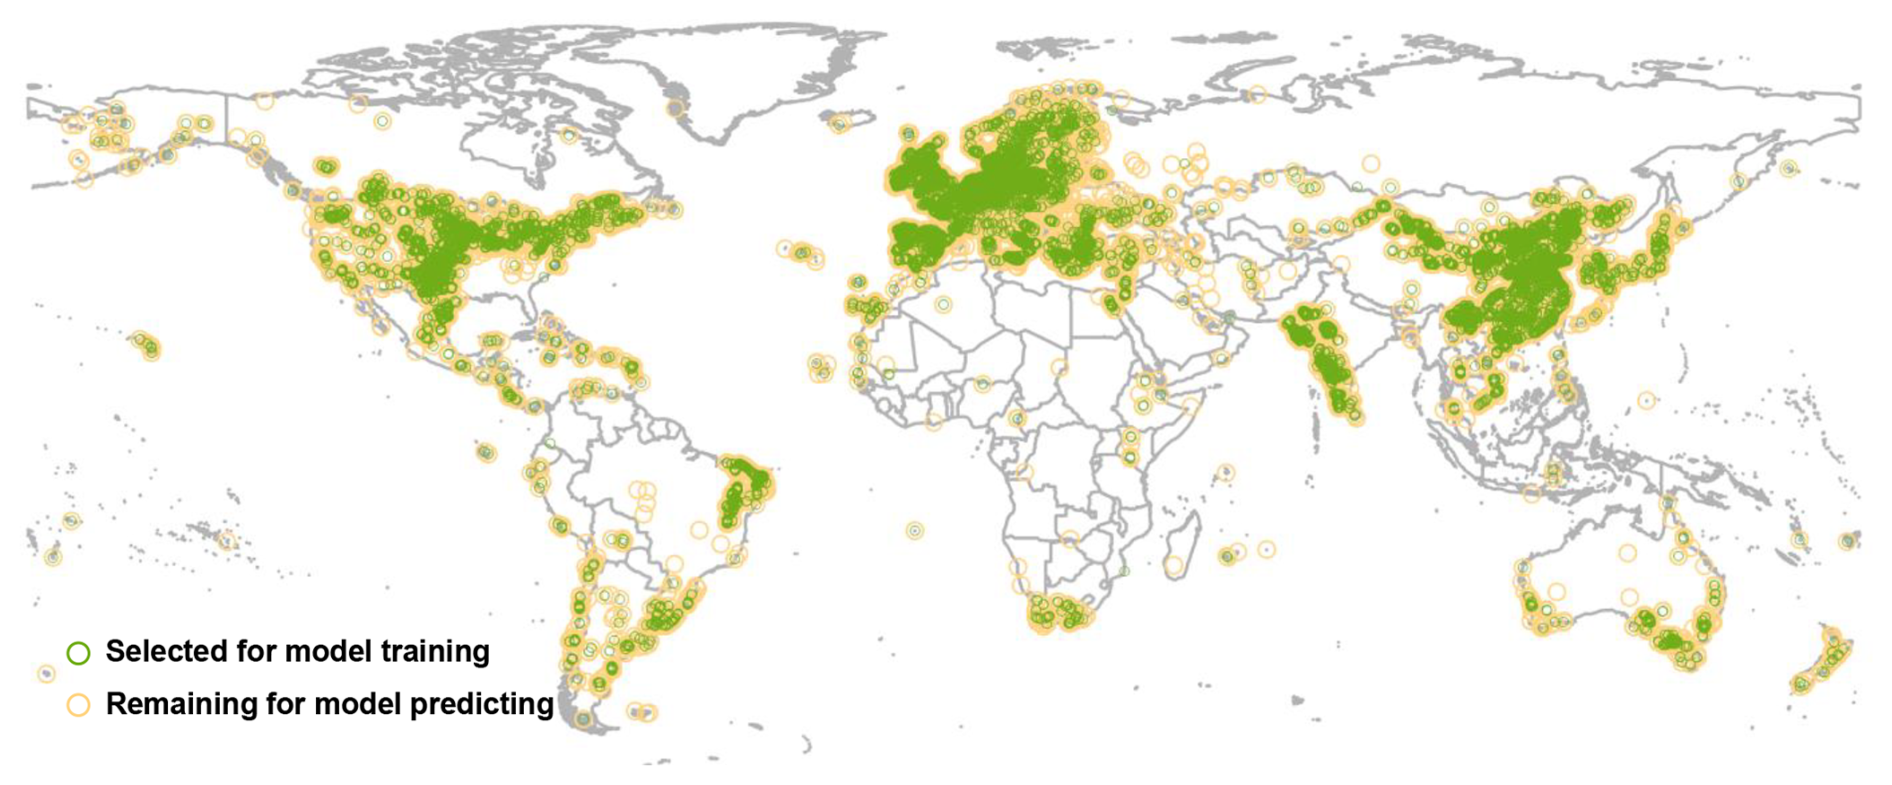
Figure 2Spatial distribution of training samples (green points).
Based on the OSM-derived wind turbine coordinates, we generated 500 m × 500 m extraction zones to acquire high-resolution Google Earth images through the Buffer Tool in QGIS software. This conservative spatial buffer accounts for maximum wind turbine diameters (≤ 200 m) while guaranteeing full rotor coverage (Muller et al., 2024). The image tiles were resized to a standardized 256 × 256-pixel format, maintaining optimal input dimensions for our ResNet-18 architecture while retaining essential wind turbine characteristics. For model construction, we employed a strategically sampled 10 % subset (37 285 images) from the complete dataset, which balances representativeness with computational constraints during training. The spatial distribution of sampled wind turbine points exhibits balanced representation across global regions in Fig. 2, confirming our stratified random sampling approach effectively maintained geographic diversity. This subset was manually annotated with labels for “wind turbines” and “non-turbines”. The labeled data was then split into a training set (60 %, 22 372 images), a testing set (20 %, 7457 images), and a validation set (20 %, 7456 images) for our OSM error classification model. Representative samples of the buffered wind turbine images are displayed in Fig. 3. The visual data reveal that wind turbines are distributed across diverse landscapes, including grasslands, bare land, cropland, and forests, with occasional installations near water bodies and built environments.
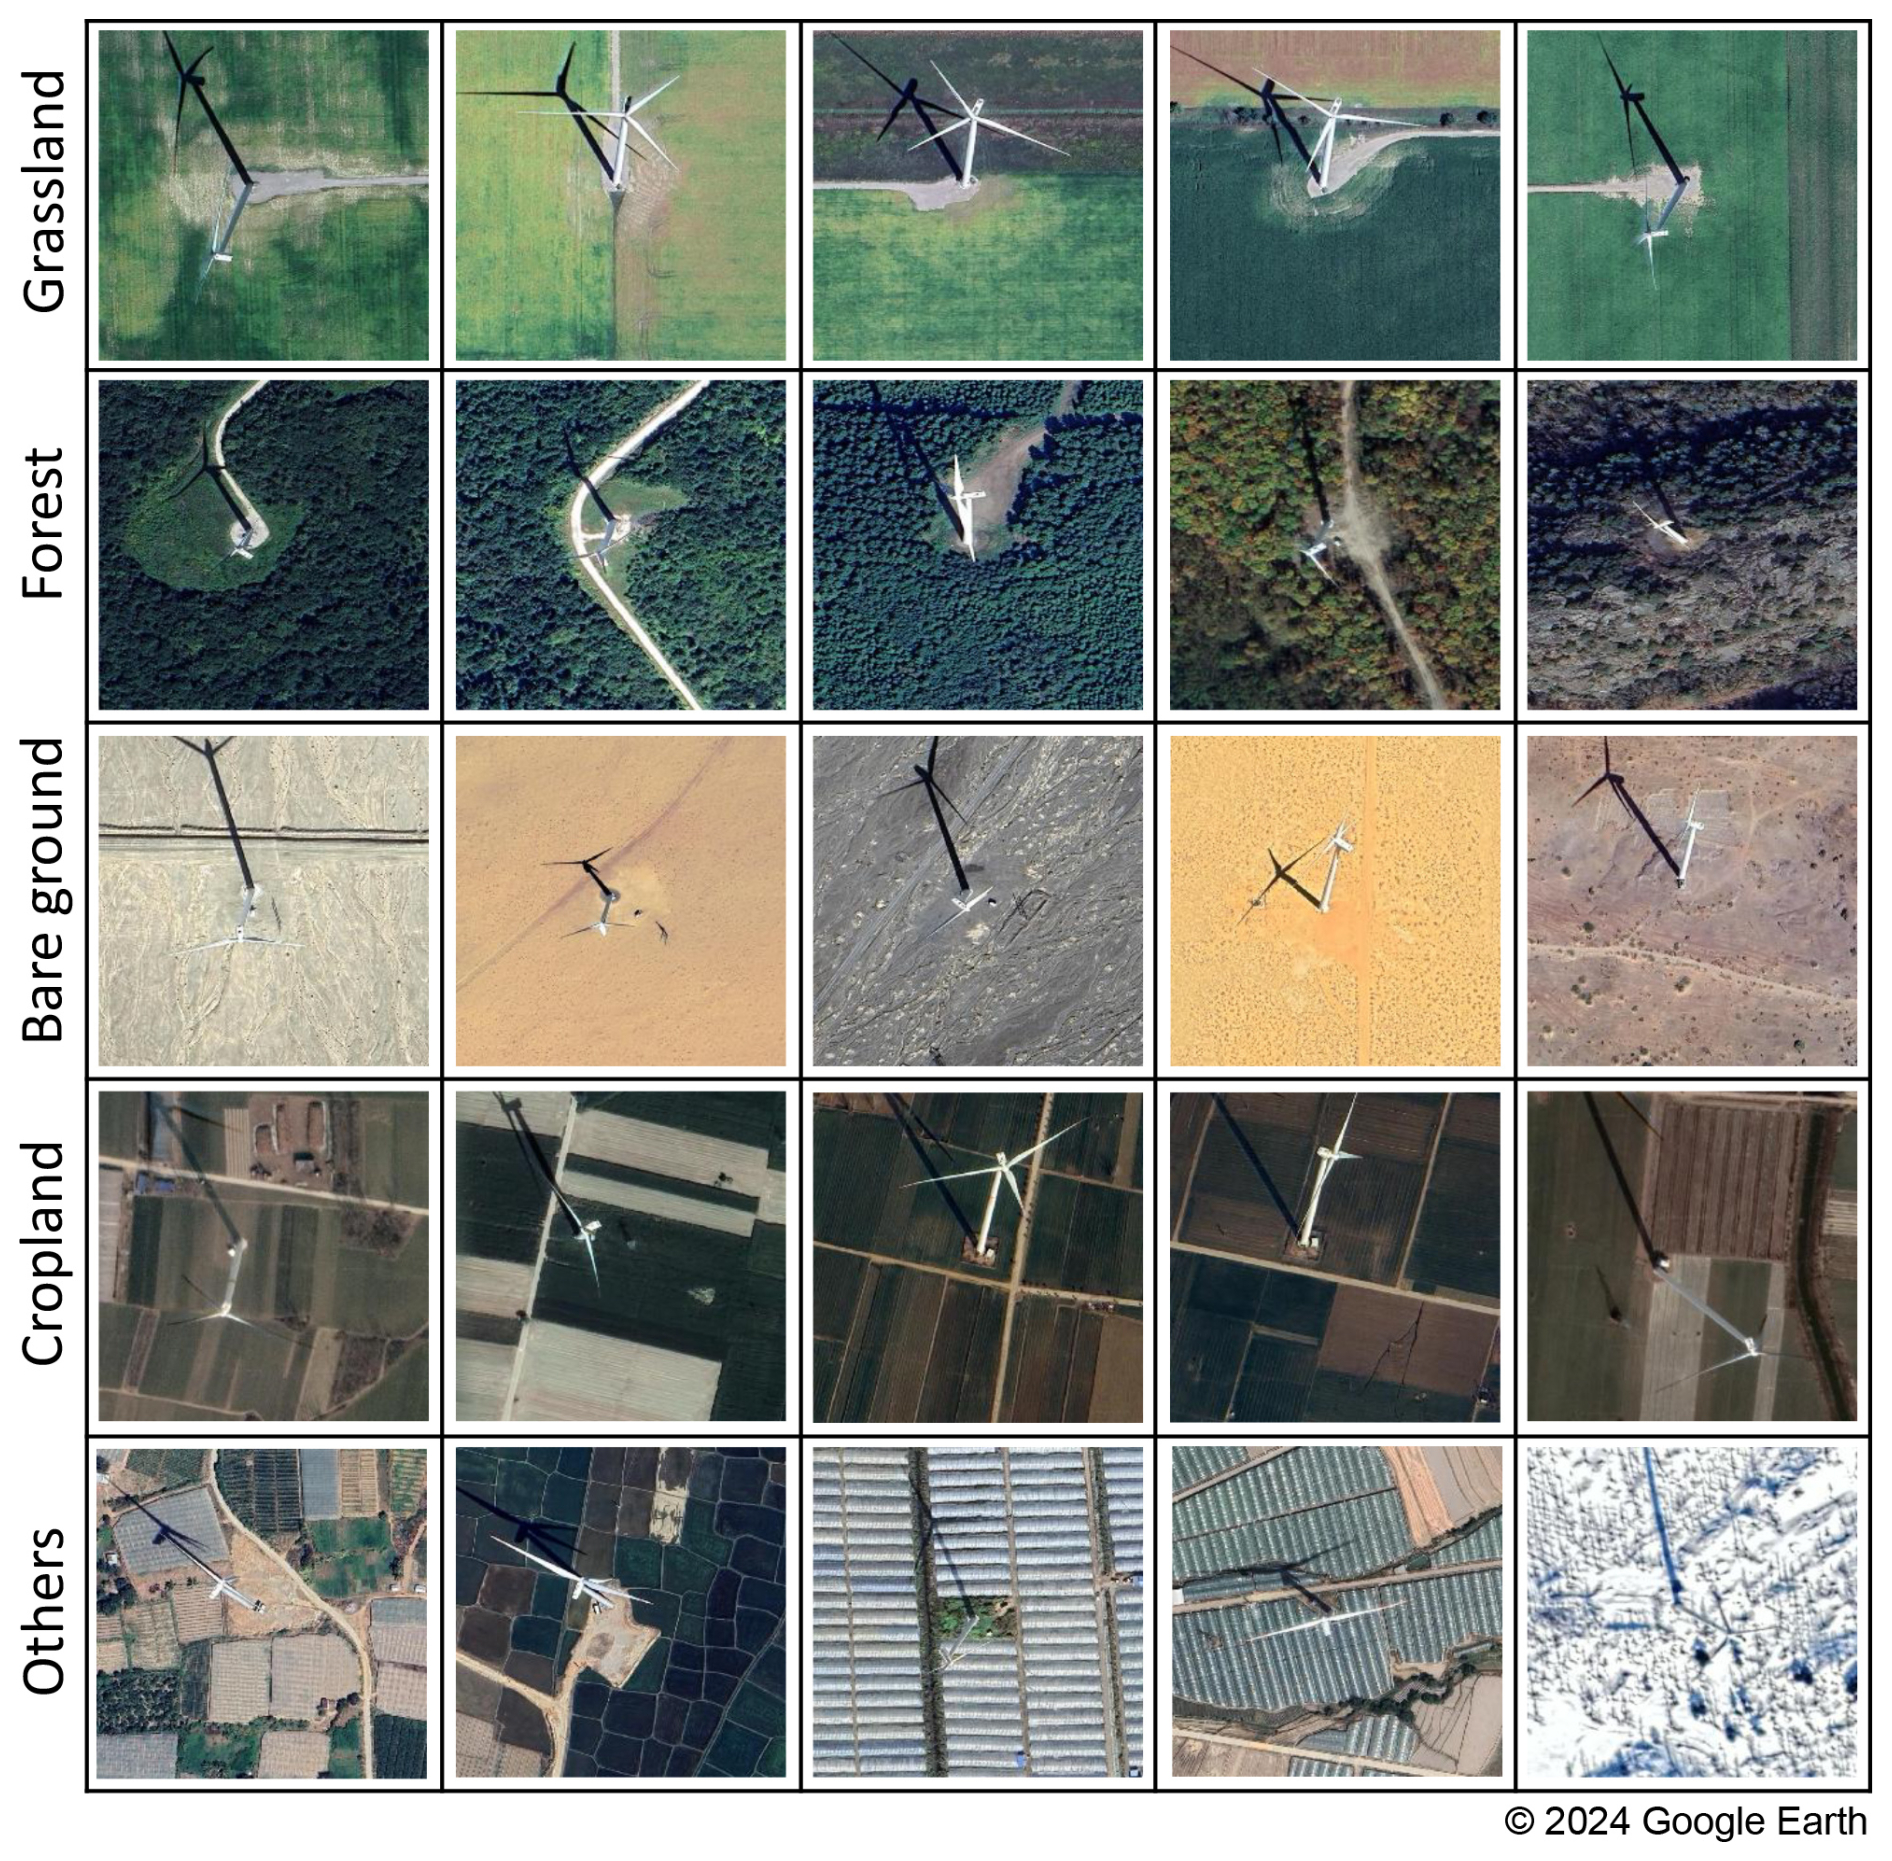
Figure 3Different land types of onshore wind turbines in Google Earth images (Imagery © 2024 Vantor, Map data © 2024 Google, Maxar Technologies).
For automated classification of OSM wind turbine data, we employed the ResNet-18 architecture (He et al., 2016), leveraging its demonstrated image classification capabilities while ensuring computational efficiency for geospatial applications at scale. Our optimized ResNet-18 model processed all 339 869 candidate images, identifying 291 501 confirmed wind turbine locations (85.8 % positive rate) while classifying 48 368 as non-turbine cases (14.2 %). All negative classifications underwent rigorous cross-platform verification using Google Earth, Bing Maps, and Sentinel-2 images, enabling the removal of inaccurate OSM entries. These validated results were then integrated with the training data to generate an enhanced global wind turbine dataset with improved accuracy. The dataset and codes for training the model are available at the Zenodo website: https://doi.org/10.5281/zenodo.18984175 (Shujun et al., 2026).
2.2.2 Supplementing omitted data with traditional machine learning model
Based on the deep learning-classified OSM wind turbine dataset and satellite images, we developed an optimized Random Forest model for omission detection (Rigatti, 2017). The Random Forest model was trained on GEE using verified wind turbine locations from OSM, alongside globally sampled negative samples (Fig. 4). We employ a global-scale uniform random sampling strategy. This ensured sufficient spatial separation and geographic diversity among samples, minimizing spatial dependency and maintaining sample independence. Besides, we apply a 30 m buffer around all existing wind turbine locations (positive samples). These buffered areas are then masked out from the global sampling pool to ensure that no negative samples are drawn within this exclusion zone. Accordingly, we trained the Random Forest model with 10 000 globally distributed wind turbine locations (positive samples) and 20 000 non-turbine points (negative samples). The negative samples are obtained via globally uniform random sampling to ensure spatial objectivity. The resulting dataset encompasses diverse land-cover categories, including grasslands, bare land, cropland, and forests. The dataset was then split into 70 % training and 30 % testing sets as illustrated in Fig. 5.
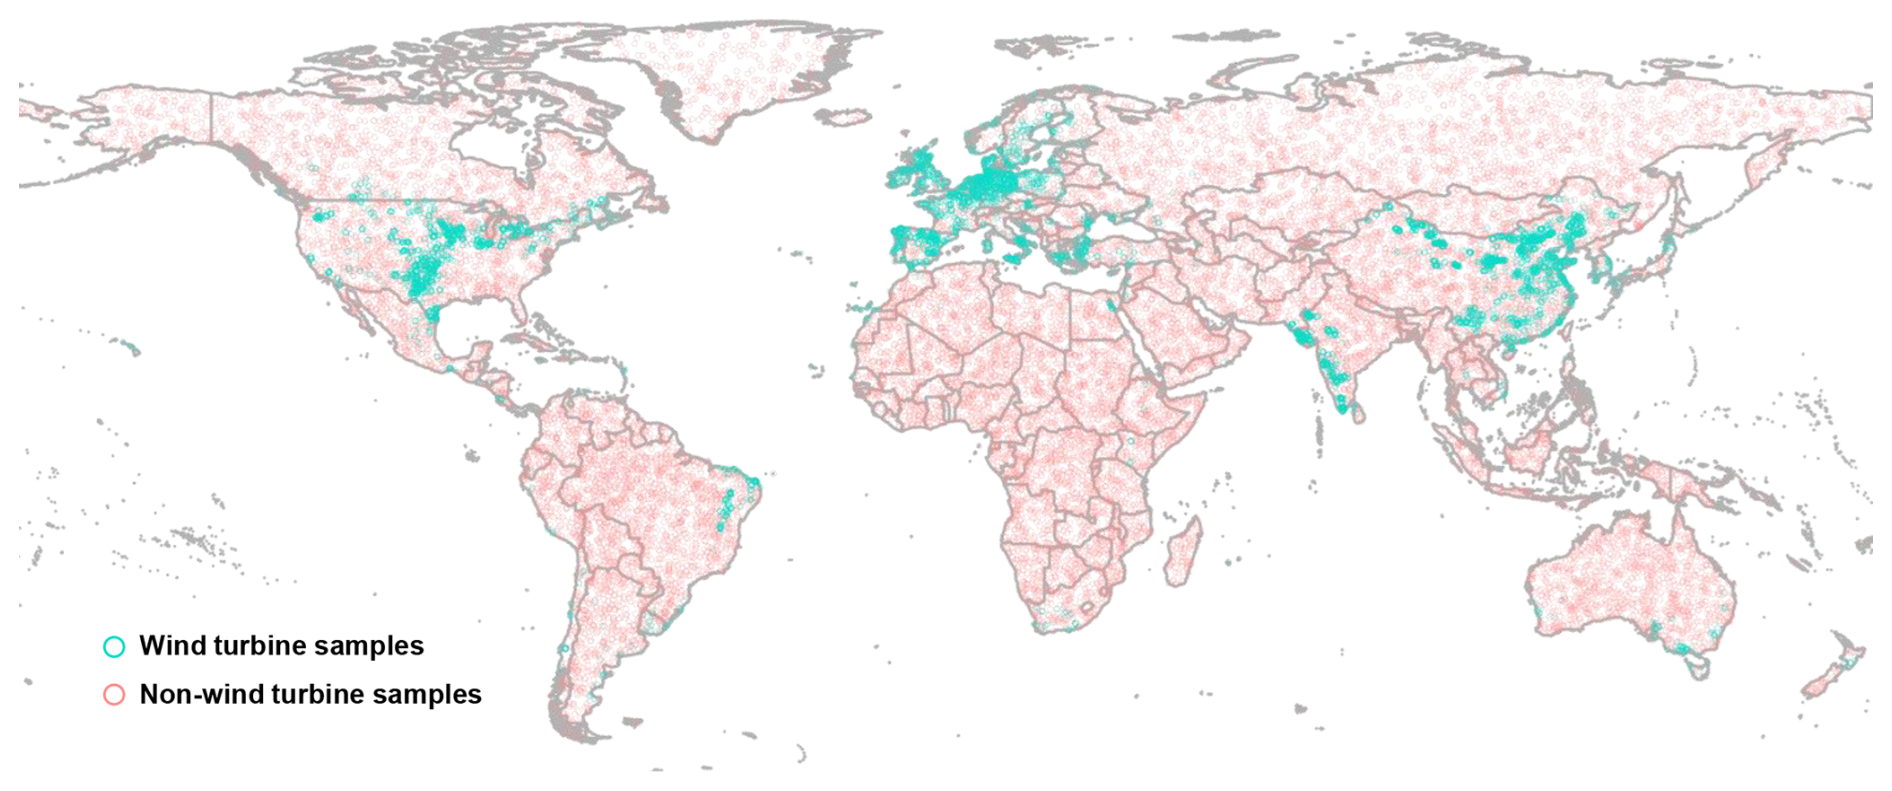
Figure 4Spatial distribution of wind turbine (positive) and non-turbine (negative) training samples for machine learning.
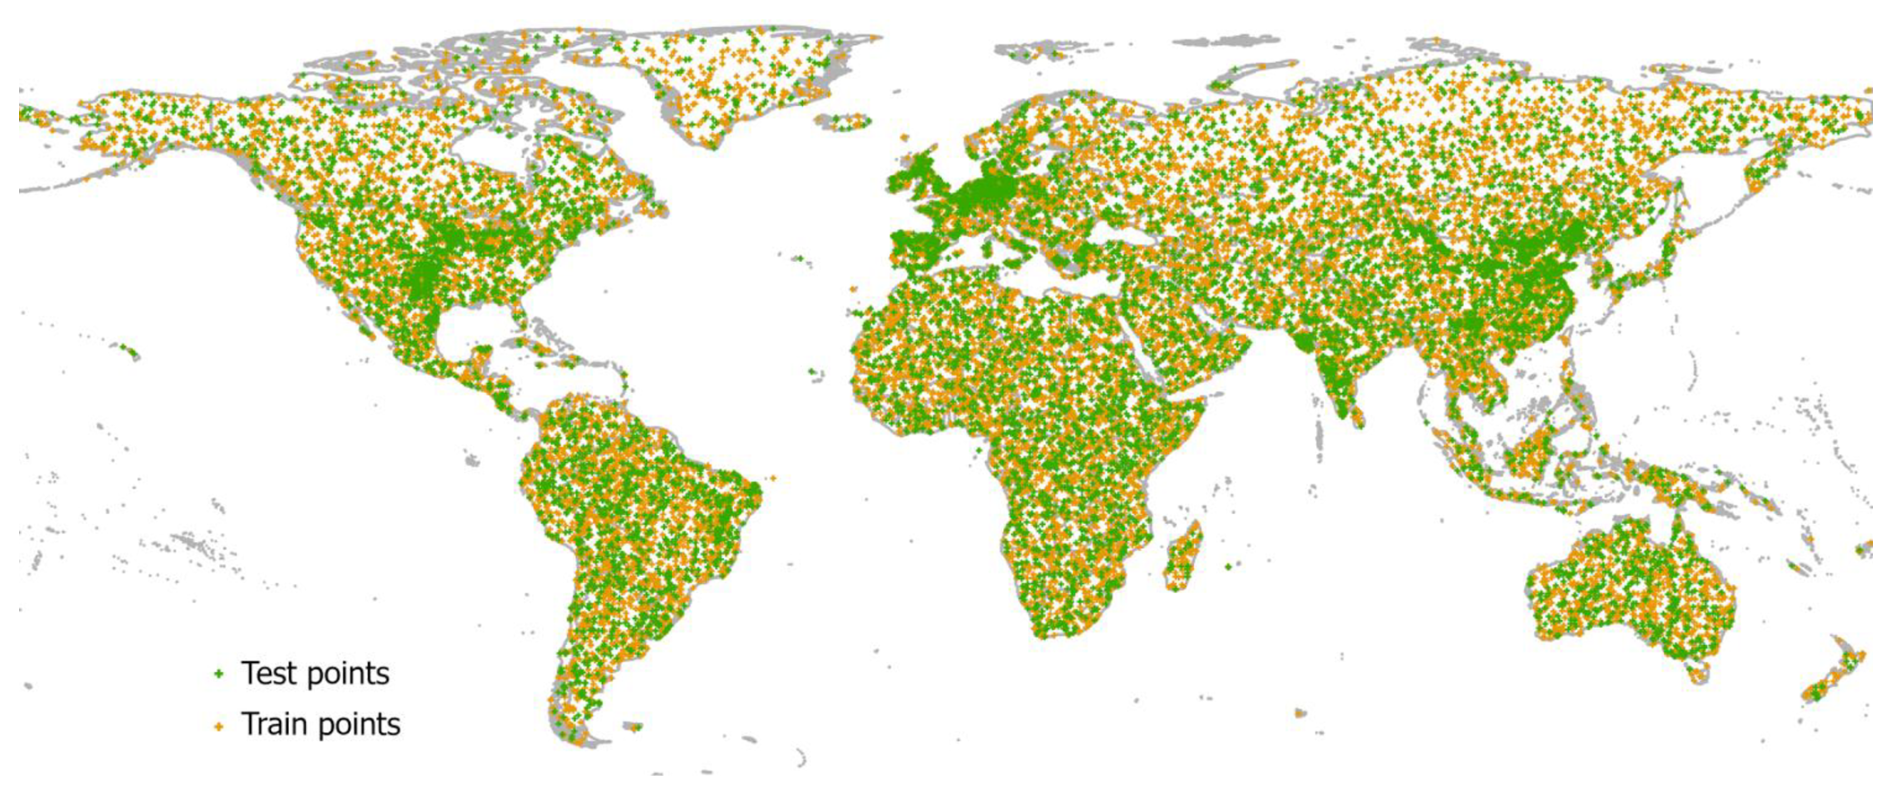
Figure 5Spatial distribution of train and test datasets for the Random Forest model. The green ones represent the points selected for model training, and the orange ones represent the points selected for model testing.
We constructed a comprehensive feature set for machine learning based on Sentinel-1 and Sentinel-2 satellite imagery integrated via the GEE platform. We utilized the Sentinel-1 Ground Range Detected (GRD) dataset (COPERNICUS/S1_GRD), extracting the VV and VH polarization bands. We employed the Sentinel-2 Surface Reflectance collection (COPERNICUS/S2_SR_HARMONIZED), which includes the visible and near-infrared (NIR) bands. To ensure data quality, we applied the QA60 band for cloud masking in Sentinel-2 images. Both datasets were processed using a median reducer across the entire year of 2024 to generate cloud-free, representative composites. All spectral bands and backscatter coefficients were then normalized to a range of [0, 1] to mitigate effects from illumination conditions and sensor characteristics. Finally, these processed layers were stacked into a unified feature collection to serve as input for the machine learning models.
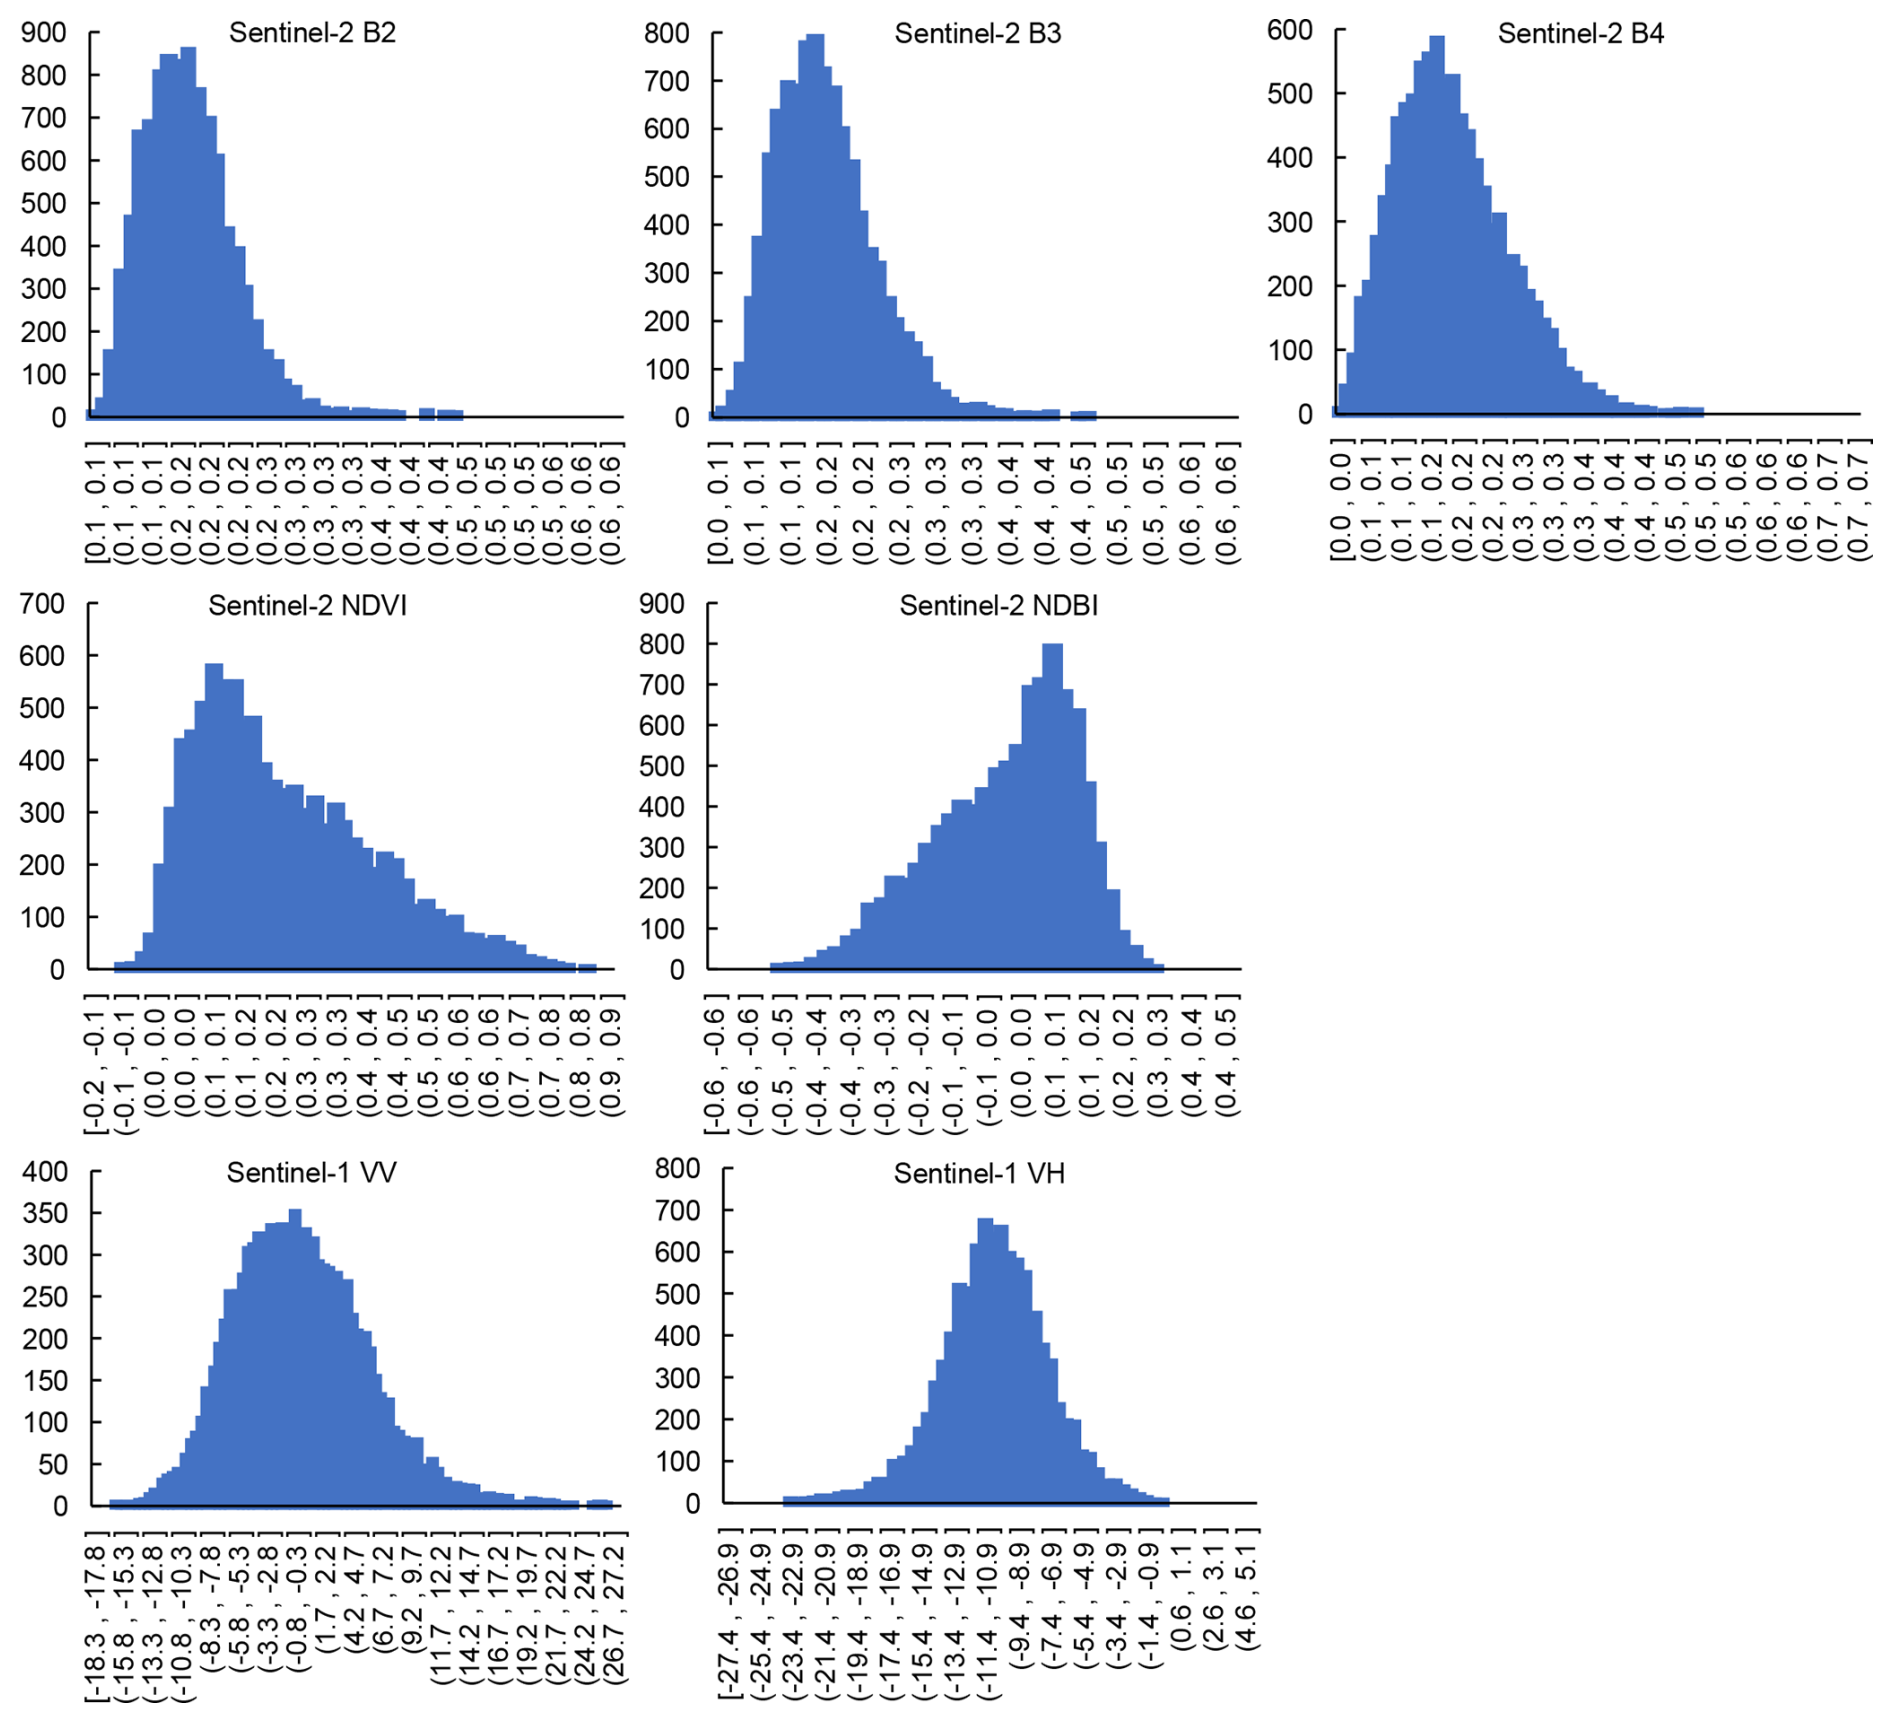
In addition to the original bands from Sentinel-1 and Sentinel-2, we incorporated the Normalized Difference Vegetation Index (NDVI) (Huang et al., 2021) and the Normalized Difference Built-up Index (NDBI) (Zha et al., 2003) to enhance the differentiation between wind turbines and their background features based on the original bands from Sentinel-2. For comprehensive feature characterization, we implemented a random sampling strategy across 10 000 wind turbine locations, while covering all major wind development regions for reliable spectral analysis. Figure 6 presents seven selected spectral feature value distributions of wind turbines, revealing distinct characteristic ranges for turbine signatures across different sensor bands. This demonstrates the effectiveness of different band features in wind turbine classification. To reduce the computational load of the Random Forest model, we excluded the 800 m buffer area of already validated wind turbines and then defined upper and lower threshold boundaries to filter out non-turbine areas during the initial processing stage. These thresholds include Sentinel-2's B2 [0, 0.3], B3 [0, 0.3], B4 [0, 0.3], NDVI [0, 0.7], NDBI [0, 0.7], and Sentinel-1's VV [−18, 18] and VH [−25, 1].
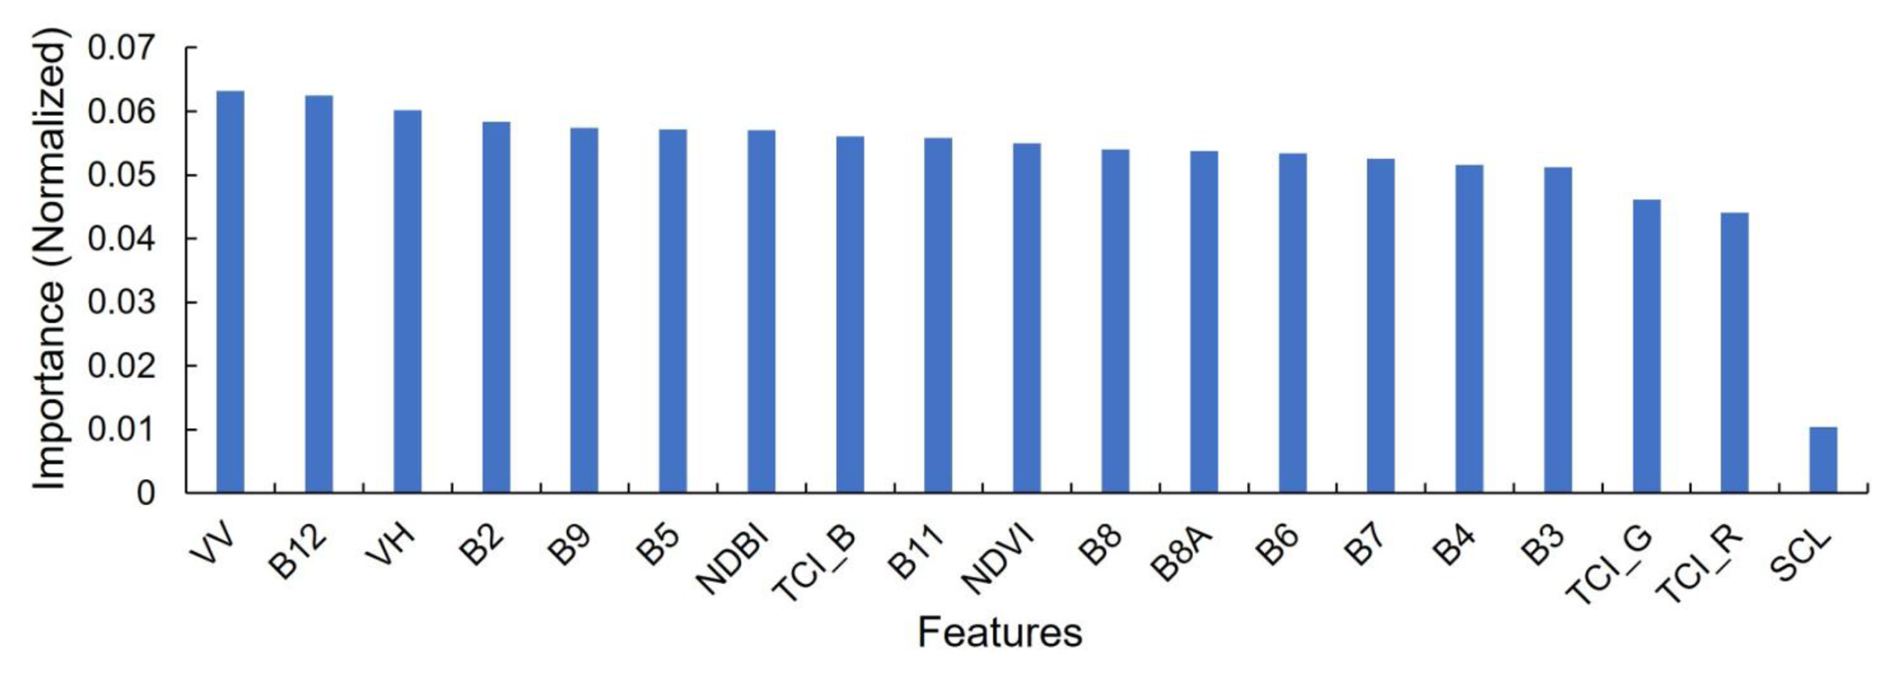
The final dataset incorporated 19-dimensional feature data for each sample point, which was utilized for training the model to detect omitted wind turbine points. Our feature importance ranking of the 19-dimensional feature space (Fig. 7) revealed that Sentinel-1's VV and VH polarization bands are particularly effective for identifying the wind turbines. This could contribute to the band's high sensitivity to vertical metallic structures such as wind turbine towers, as these act as corner reflectors that generate distinct bright signatures in SAR imagery. The Sentinel-2's B12 and B2 bands also show a strong response to wind turbine structures, which enhances their contrast against natural backgrounds like vegetation, soil, and water.
2.3 Classification accuracy assessment of models
We evaluated the performance of both deep learning and traditional machine learning models using standard classification metrics computed from confusion matrices, namely precision, recall, and F1-score, as shown in Eqs. (1)–(3), as based on an independent test and validation set (Congalton, 1991; Goutte and Gaussier, 2005) to ensure the model's generalizability and avoid over-optimization on training data. Producer's accuracy (recall) quantifies the proportion of actual wind turbine locations correctly detected, while user's accuracy (precision) represents the fraction of predicted wind turbines that are true positives. The precision equals the number of true positives (TP) divided by the sum of true positives (TP) and false positives (FP), and the recall equals the number of true positives (TP) divided by the sum of true positives (TP) and false negatives (FN). The F1-score harmonizes these metrics, providing particularly valuable evaluation for imbalanced wind turbine detection scenarios where background features significantly outnumber target objects.
Based on our updated wind turbine dataset, we evaluated the data accuracy and errors within the OSM wind turbine records. We calculated omission and commission errors using a spatial proximity analysis in ArcGIS Pro with a 30 m tolerance buffer. We applied a 30 m buffer to our generated points and performed a spatial selection on the OSM reference points to calculate the omission error. And the OSM points not captured within these buffers were classified as omissions. Conversely, to calculate the commission error, we buffered the OSM points and identified our generated points that fell outside these zones. The respective error rates were derived by dividing the count of omitted or committed points by the total number of OSM wind turbines. Finally, these two rates were summed to provide a total error rate.
2.4 Land use occupation analysis of onshore wind turbines
We utilize ESRI's 2023 Land Use/Land Cover (LULC) dataset (Karra et al., 2021), derived from ESA Sentinel-2 images at 10 m resolution for analyzing the land use surrounding onshore wind turbines. The LULC composite maps integrate annual predictions for nine defined categories, namely cropland, rangeland, forest, built-up areas, bare ground, water bodies, flooded vegetation, snow/ice cover, and cloud cover. By conducting spatial overlay analysis between our finalized global onshore wind turbine dataset and the LULC classification within GEE, we characterized land occupation patterns through the extraction of underlying land use types at wind turbine sites. Additionally, we evaluated wind turbine land use impacts by conducting an 800 m buffer around wind turbines (Dunnett et al., 2020), and converting the results to raster format for spatial assessment.
3.1 Evaluation results
Figure 8a displays the deep learning model's performance for onshore wind turbine error filtering, achieving exceptional precision (99.2 %), recall (97.4 %), and F1-score (98.3 %), respectively. The Random Forest model demonstrated equally strong performance, achieving 99.8 % recall, 99.0 % precision, and 99.4 % F1-score (Fig. 8b). Importantly, the deep learning classifier achieved an 86 % reduction in required manual verification (291 501 of 339 869 images). Meanwhile, our analysis revealed an 18.5 % error rate in OSM's global wind turbine dataset. The calculated discrepancy is yielded from the omission and commission error rates of 14.4 % and 4.1 %, respectively. It is worth noting that this error rate represents global averages, and significant regional variations could exist as the OSM data fluctuates across different countries due to varying mapping efforts. While this validates its reliability for macro-scale trend analysis, the findings underscore inherent limitations of data directly obtained from OSM for precision-critical wind energy applications.
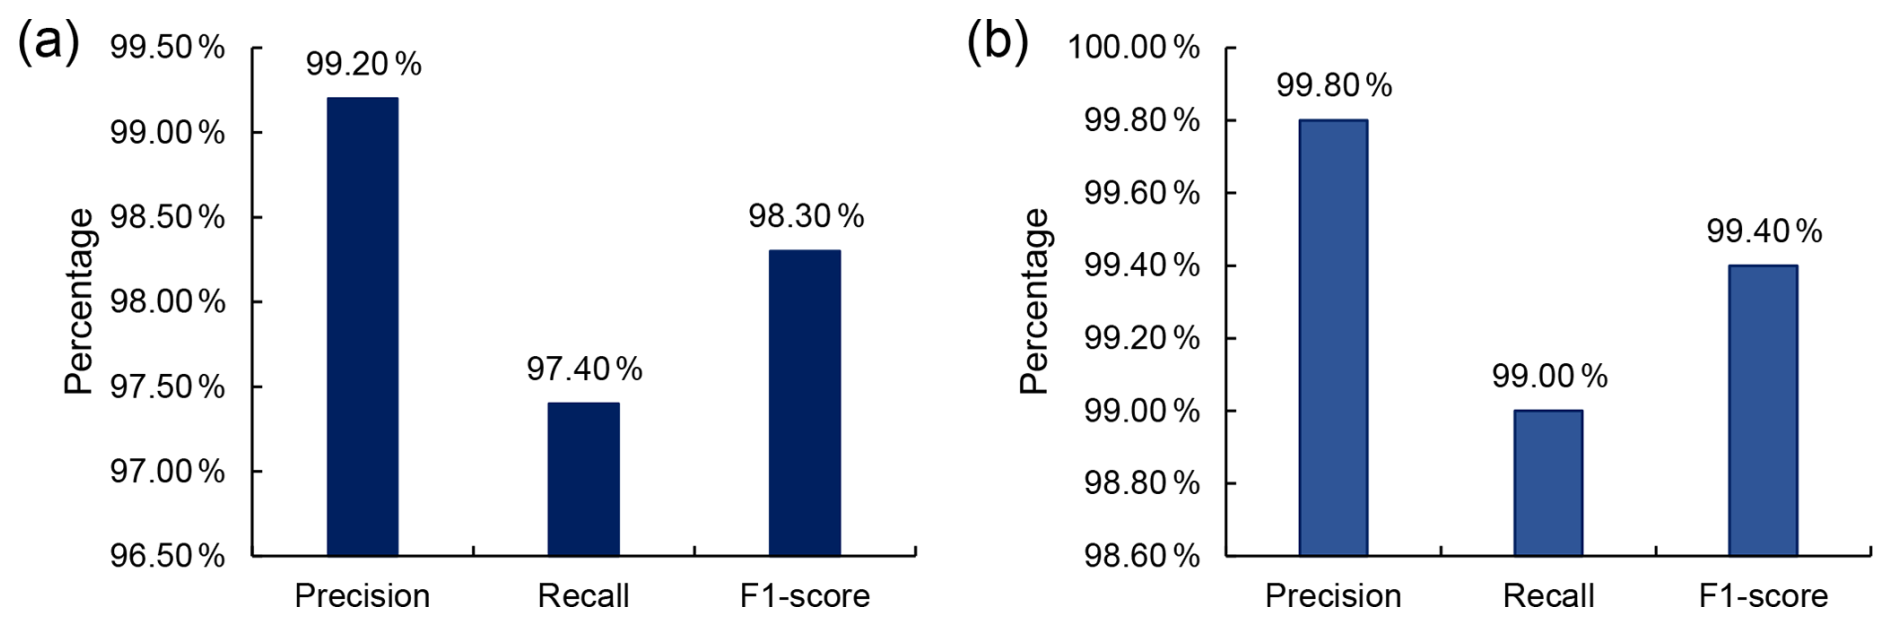
Figure 8Evaluation results of two models for wind turbine classification. (a) Precision, recall, and F1-score of the deep learning model. (b) Precision, recall, and F1-score of the traditional machine learning model.
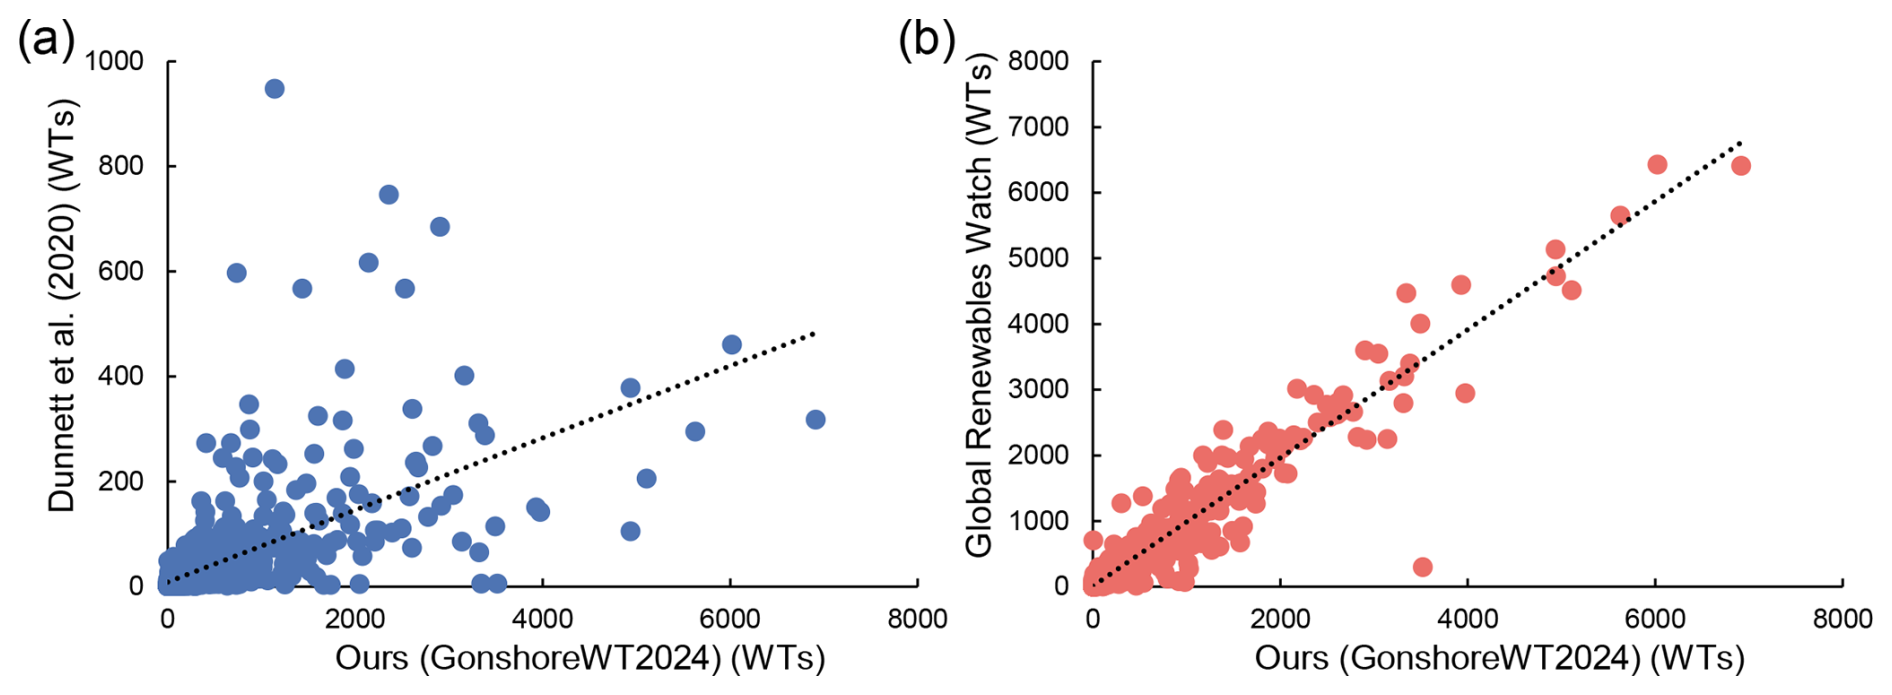
Figure 9Global grid-based (2° × 2°) correlation analysis of our dataset (GonshoreWT2024) and existing benchmarks. (a) Distribution of grid-level wind turbine counts between our dataset (GonshoreWT2024) and Dunnett et al. (2020). (b) Distribution of grid-level wind turbines between our dataset (GonshoreWT2024) and Global Renewables Watch.
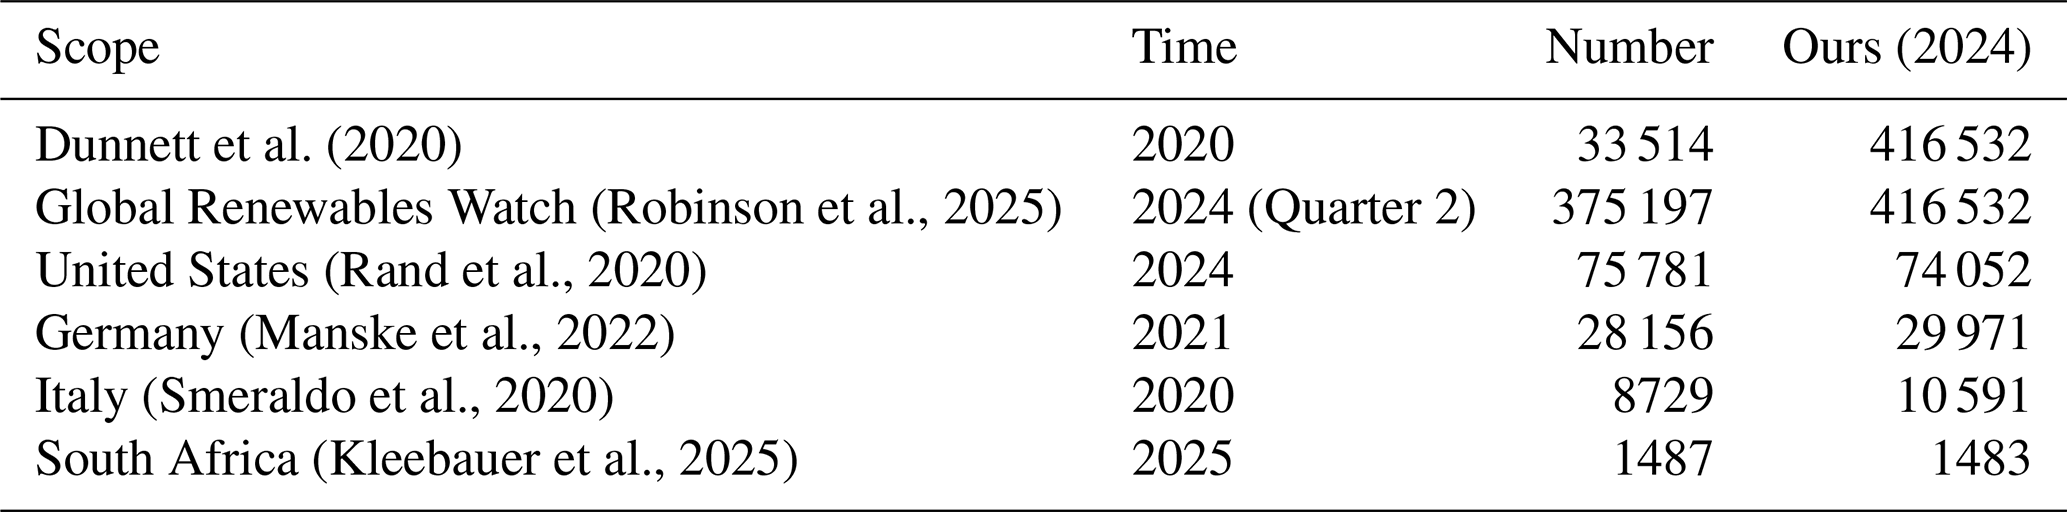
Table 1Comparison of open-source datasets of wind turbines with our results.
3.2 Comparison with open-source datasets
To validate the accuracy of our wind turbine records, we cross-validated them against multiple authoritative geospatial datasets, including the 2020 global wind and solar dataset (Dunnett et al., 2020), along with official and research-based wind turbine inventories from the United States (Rand et al., 2020), Italy (Smeraldo et al., 2020), Germany (Manske et al., 2022), and South Africa (Kleebauer et al., 2025). Our dataset (GonshoreWT2024) documents 416 532 wind turbines (Table 1), representing a tenfold expansion from the 2020 baseline of 33 514 wind turbines. The wind turbine counts of GonshoreWT2024 closely align with Global Renewables Watch (375 197 wind turbines), with a 9.9 % variance. The consistency between our estimates and official records for temporally comparable years is high, with discrepancies of less than 2.3 % in the United States and less than 0.3 % in South Africa. This also provides strong validation of our methodology's precision. Our cross-validation across multiple data sources and regions reveals both remarkable consistency and a substantial quantity of previously unrecorded wind turbine installations.
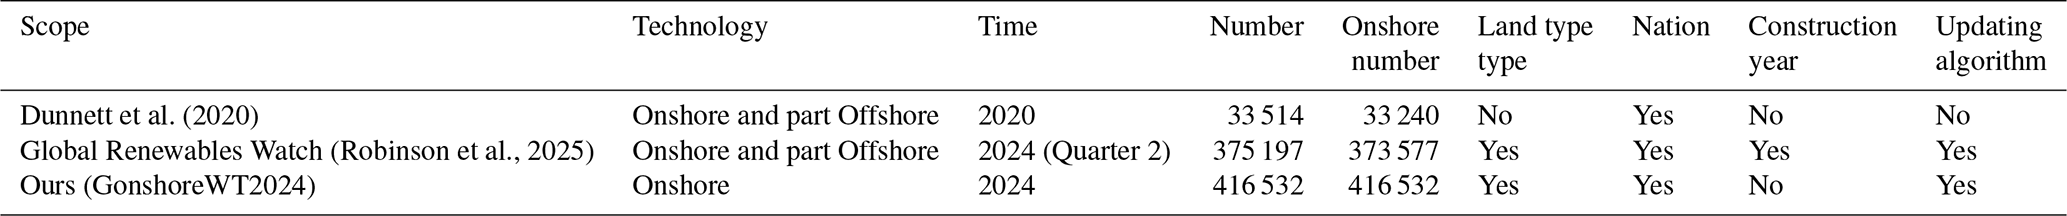
We further benchmark our dataset against the current global-scale wind turbine datasets, including Dunnett et al. (2020) and Global Renewables Watch (Table 2). Results show that our dataset contains the largest number of identified onshore wind turbines while maintaining nation-level coverage and land type classification compared to Dunnett et al. (2020). In terms of data records, the Global Renewables Watch is updated to the second quarter of 2024 with 375 197 wind turbines and includes a limited number of offshore wind turbines that are not comprehensive. Our dataset focuses on onshore wind turbines and incorporates additional updates by the end of 2024. Methodologically, the Global Renewables Watch requires massive training datasets and substantial computational resource budget exceeding 650 V100 GPU hours to process around 14 terapixels of satellite imagery (Robinson et al., 2025). In contrast, our hybrid framework utilizes medium-to-high resolution imagery to enable global-scale updates with significantly lower computational demands. By leveraging publicly available platforms, this framework lowers the barrier to entry through a cost-effective and resource-efficient alternative.
Table 2Comparisons with current global-scale wind turbine datasets.
We also conducted a spatial distribution analysis to assess the correlation between our dataset and existing benchmarks, including the Dunnett et al. (2020) and Global Renewables Watch. Specifically, the global study area was partitioned into 2° × 2° grid cells to calculate wind turbine counts. We then employed scatter plots to evaluate the spatial consistency of our dataset relative to Dunnett et al. (2020) and the Global Renewables Watch (Fig. 9). Subsequently, Pearson's r2 is calculated to quantify the correlation between the datasets. Our dataset shows a moderate correlation with Dunnett et al. (2020) (Fig. 9a), with a Pearson's r2 of 0.4, primarily due to the significantly expanded coverage of our dataset. In contrast, our dataset shows a high correlation with Global Renewables Watch with a Pearson r2 of 0.93, indicating a high degree of geospatial consistency (Fig. 9b).
Additionally, we quantified the mutual global underreporting between Global Renewables Watch and ours, which is around 20 %. Global Renewables Watch has 72 304 more different wind turbines than ours, and we have 80 532 more different wind turbines than theirs. We further conduct manual verification to quantify omission and commission rates of our dataset in these wind turbines. Final verification shows a 59 % validity rate (43 011/72 304) for unique wind turbine entries of Global Renewables Watch, compared to a 92 % validity rate (74 458/80 532) for ours. We further updated our dataset to a final global count of 416 532 wind turbines based on manual verification.
3.3 Global onshore wind turbine installation distribution
The finalized global dataset (GonshoreWT2024) contains 416 532 georeferenced wind turbines exhibiting pronounced concentration across northern hemisphere regions (Fig. 10a), particularly in North America, Europe, and East Asia. Regional deployment patterns also show clear geographic concentrations (Fig. 10b). China dominates global wind energy deployment, with 138 486 wind turbines representing 33.2 % of worldwide installations. The United States ranks second (74 051 wind turbines), followed by India (35 783), Germany (29 970), and Spain (21 543), collectively representing the top five national markets (Fig. 10c). China and India, representing 75 % of Asia's wind turbine installations, and the United States and Brazil together comprise 77 % of American deployments. Europe's wind energy deployment is primarily concentrated in Germany, Spain, and Italy, which account for 40 % of European installations.
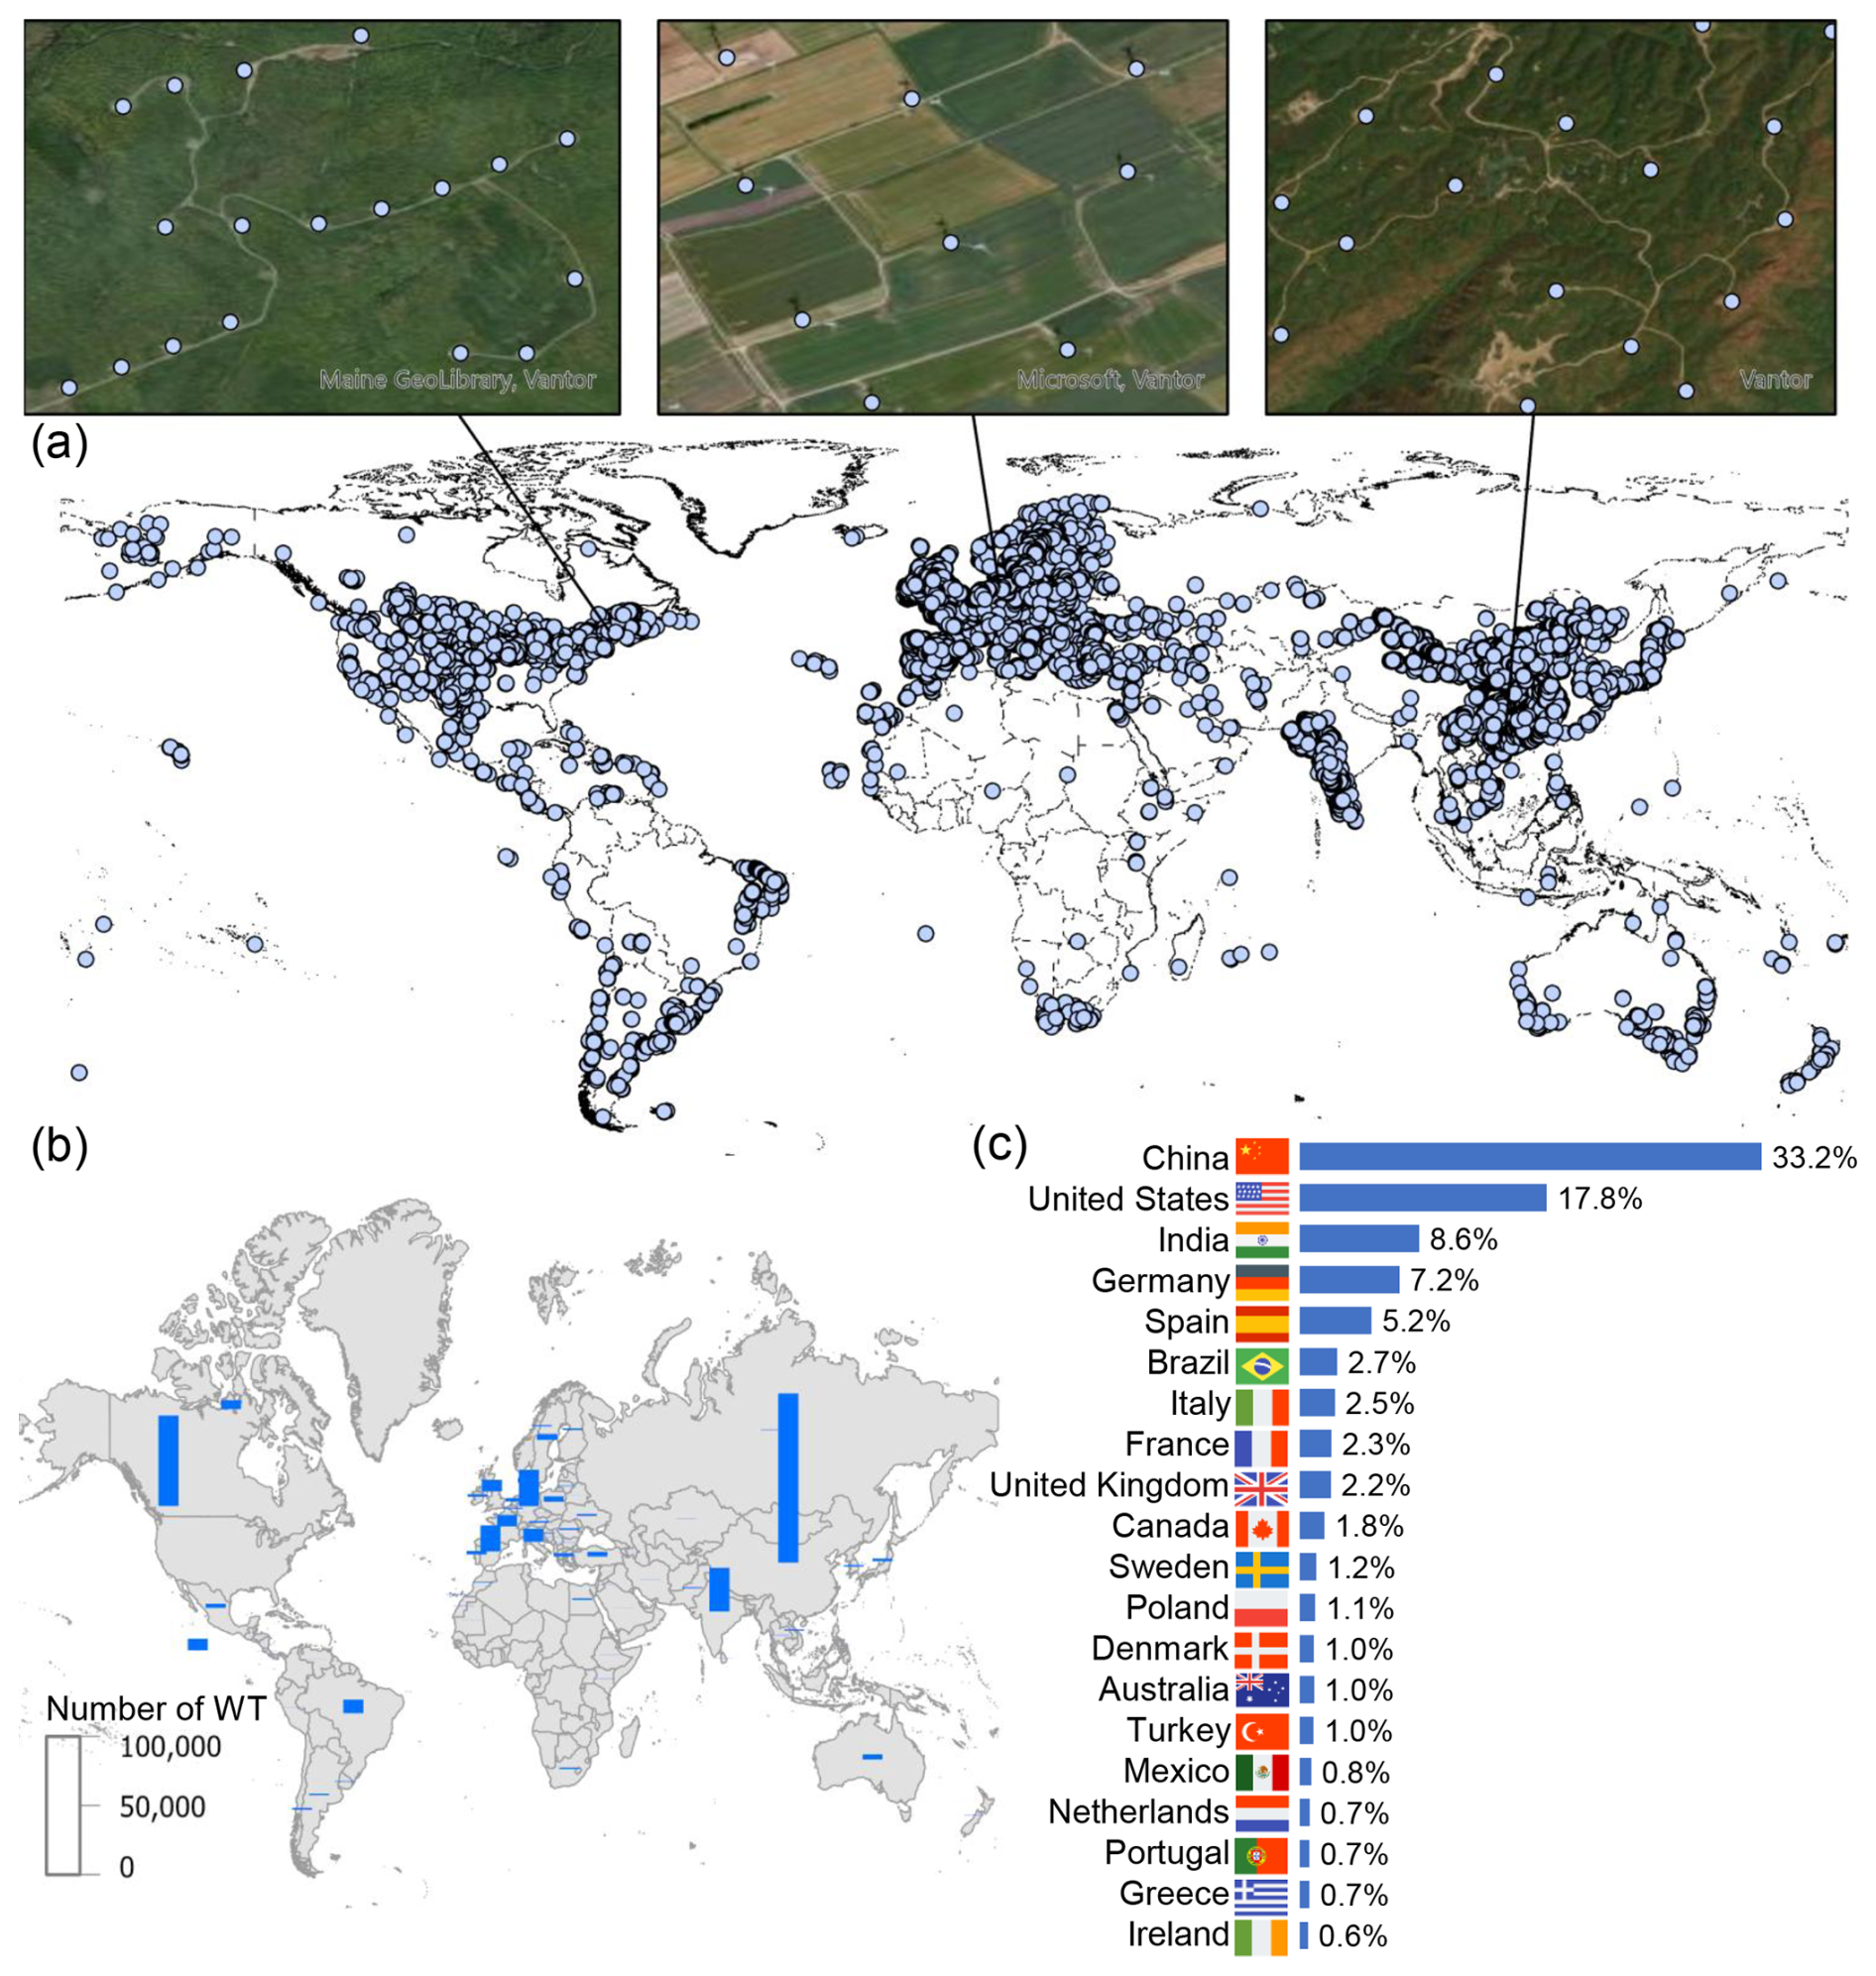
Figure 10Global onshore wind turbine installation records and spatial distribution. (a) Global onshore wind turbine by 2024. The zoomed-in panels show wind turbine locations overlaid on Google Earth imagery (Imagery © 2024 Vantor, Map data © 2024 Google, Maxar Technologies). (b) Spatial distribution of wind turbine installation statistics by country. (c) Percentage ranking of wind turbines for top 20 countries.
3.4 Land use types and spatial distribution of global onshore wind turbines
Our global assessment quantifies a total impacted area of 367 132 km2 of the wind turbines, which is estimated with an 800 m buffer around wind turbine locations (Dunnett et al., 2020). Among the affected areas, 87 % of wind turbines are located within cropland and grassland ecosystems (Fig. 11c). Specifically, croplands represent the predominant land use at 45 % (165 209 km2), followed by grasslands for 42 % (154 195 km2), and forests for 14 % (51 398 km2). These proportions, however, exhibit substantial variation across national boundaries (Fig. 11a, b). China, the global leader in wind capacity, exhibits unique siting patterns with over 50 % of wind turbines deployed in grasslands, followed by croplands (20 %) and forests (16 %). China demonstrates a notably higher reliance on forested areas for wind turbine siting compared to global patterns, particularly in its southern provinces (Fig. 11a), warranting careful ecological assessment (Enevoldsen, 2016). In contrast, the United States distributes roughly half (50 %) of its wind turbines across croplands, supplemented by grassland deployments. Germany displays the most extreme geographic specialization, with over 90 % of its wind turbines sited exclusively on agricultural lands. These pronounced regional variations in wind turbine siting patterns carry significant implications for both renewable energy development and landscape management policies.
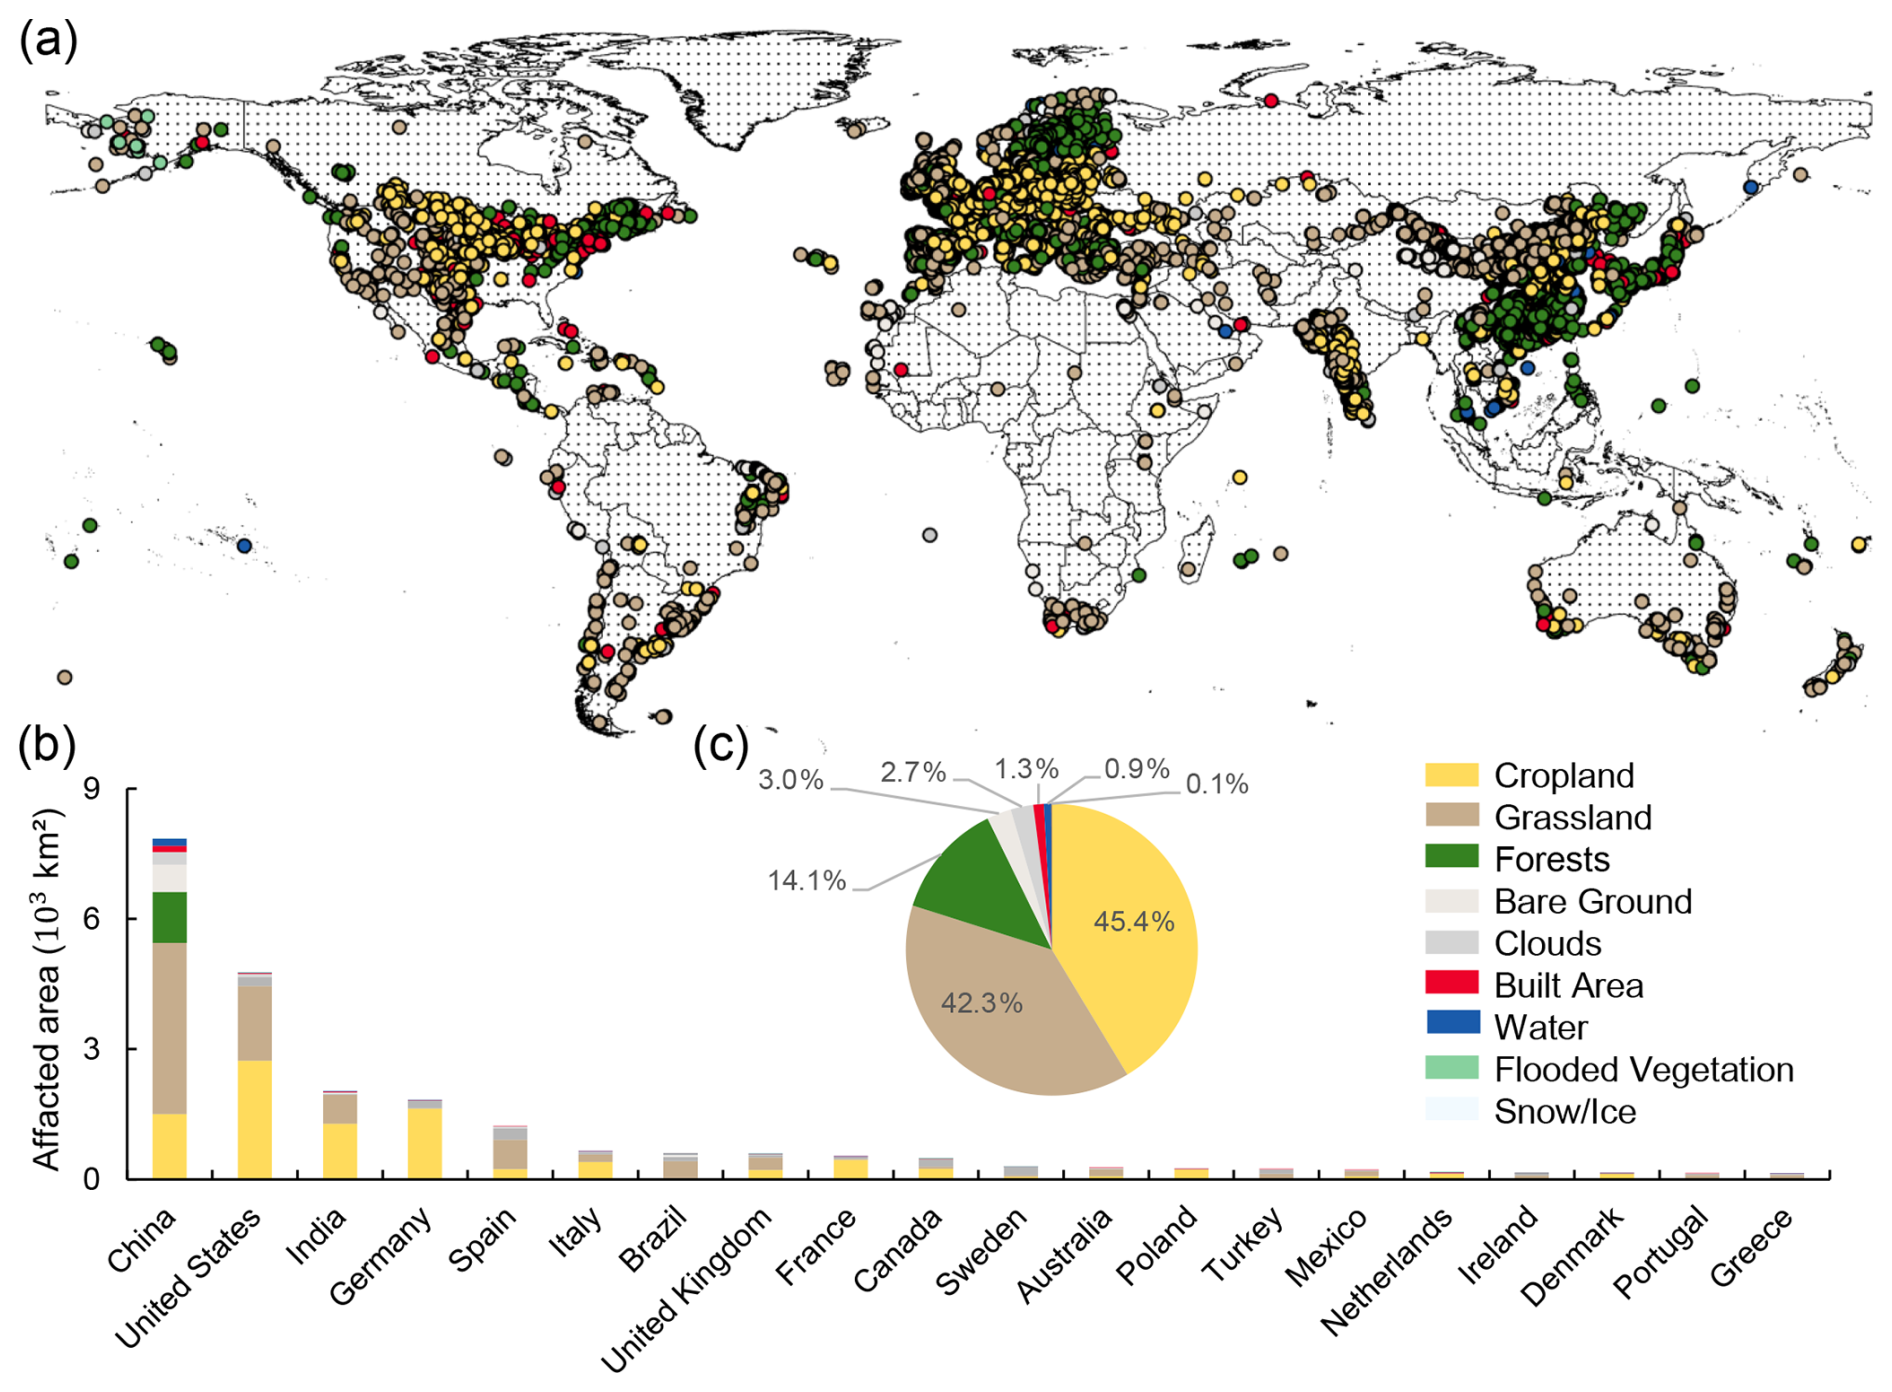
Figure 11Land use distribution of global onshore wind turbines. (a) Land use distribution of global onshore wind turbines. (b) Land use area statistics occupied by onshore wind turbines by country. (c) Percentages of difference in land use deployed by onshore wind turbines.
3.5 Potential applications of the dataset
This open-access global onshore wind turbine dataset (GonshoreWT2024) could establish a critical foundation for interdisciplinary research, facilitating integrated studies in energy infrastructure planning, ecological impact evaluation, and land use optimization. First, the geospatial wind turbine dataset enables rigorous biodiversity impact assessments, including wildlife disturbance patterns and habitat fragmentation analysis around wind energy installations (Bopucki and Perzanowski, 2018; Mckay et al., 2024). Particularly, studies have demonstrated that turbine blade rotation creates distinct mortality patterns across bird and bat species (Marques et al., 2020; Millon et al., 2018). Our precisely geolocated turbine records enable exact spatial correlation between wind infrastructure and vulnerable species' high-activity areas, facilitating data-driven assessments of avian and chiropteran collision risks.
Second, wind farm construction and associated infrastructure development induce significant ecological disruptions through multiple pathways (Xia et al., 2025). Integrating high-precision turbine locations with remote sensing data allows systematic evaluation of wind energy's environmental footprint, including deforestation patterns (Enevoldsen, 2018), soil erosion (Ma et al., 2023), carbon sink loss (Gao et al., 2023), and waste impacts (Chen et al., 2026). Our dataset provides a robust data foundation for both evaluating the cumulative ecological impacts of existing wind farms and optimizing future turbine siting to balance energy production with ecosystem conservation.
These open-access data resources could help promote transparent and just sustainable wind energy development, and enable detailed feature extraction and spatial analysis for future wind energy research. The global onshore wind turbine dataset (GonshoreWT2024) is freely available from the Zenodo website at: https://doi.org/10.5281/zenodo.18984175 (Shujun et al., 2026).
The dataset includes:
-
A comprehensive global inventory of 416 532 onshore wind turbines in the format of a geospatial shapefile. The dataset includes geolocation coordinates for all wind turbines, along with corresponding nation (Field: “Nation”) and land use classification (Field: “landtype”) for each wind turbine.
The code is also available via the link https://doi.org/10.5281/zenodo.18984175 (Shujun et al., 2026). The code file includes:
-
A PyTorch-based ResNet-18 implementation for classifying onshore wind turbines in Google Earth images, including codes for model architecture and pre-trained weights.
-
The GEE-based code for the Random Forest model, including sample point splitting (training/test sets) and model training.
This study introduces an advanced geospatial approach that integrates high-resolution Google Earth images with multi-source satellite observations to construct a refined global inventory of onshore wind turbines. Our dataset provides more timely data that represents a tenfold expansion over the global wind turbine inventories as of 2020 compared to the current datasets of available global onshore wind turbines. Importantly, in mapping methodology, we propose a reproducible and straightforward approach to identify renewable infrastructure, which can be applied in future studies and in countries or regions with limited computational resources compared to the Global Renewables Watch. The datasets and resulting 2024 global inventory document 416 532 onshore wind turbines, serving as a critical resource for renewable energy infrastructure planning and ecological impact studies.
The global analysis demonstrates significant spatial aggregation of wind turbines, with the densest concentrations occurring in northern mid-latitude zones, particularly high-density concentrations in Europe, North America, and East Asia. This spatial concentration pattern stems from factors including optimal wind resources (Davis et al., 2023; Liu et al., 2023), supportive policy frameworks (Godby et al., 2025; Kumar et al., 2022; Liao, 2016), and established energy infrastructure networks (Oró et al., 2015; Rochmińska, 2023) prevalent in these mid-latitude zones. Notably, the global wind energy has developed across 367 132 km2 of land, with croplands (45 %) and grasslands (42 %) hosting the majority (87 %) of turbine installations. This distribution reflects a strategic preference for siting turbines in previously developed or ecologically low-sensitivity areas. However, the associated ecological impacts, particularly habitat fragmentation and soil disturbance, require thorough environmental evaluation and mitigation planning (Moore O'Leary et al., 2017).
Wind turbines primarily appear as point features in satellite images, presenting significant challenges for automated large-scale detection (Zhai et al., 2024). These detection challenges are further intensified by visually similar infrastructure, particularly high-voltage transmission lines and isolated structures that mimic turbine signatures. Our proposed solution combines hybrid machine/deep learning architectures with systematic sampling approaches to enable reliable turbine identification across diverse terrain types. Looking ahead, sustainable renewable energy development, including wind, solar, and hydropower, requires continuous innovation and open geospatial data to enhance planning transparency and governance. Overall, our framework offers a novel approach and solution for cost-effective, timely updates of global onshore wind turbine data.
SL and PW designed the study and wrote the original manuscript. SL designed the methods and carried out the experiments and validation. JQ and YS edited and revised the paper.
The contact author has declared that none of the authors has any competing interests.
Publisher's note: Copernicus Publications remains neutral with regard to jurisdictional claims made in the text, published maps, institutional affiliations, or any other geographical representation in this paper. The authors bear the ultimate responsibility for providing appropriate place names. Views expressed in the text are those of the authors and do not necessarily reflect the views of the publisher.
The authors are grateful to the ESA's Copernicus program for providing free access to the Sentinel-1/2 data and the Google Earth Engine platform for preprocessing and making the data accessible. We also thank OpenStreetMap for providing global onshore wind turbine locations and the land polygon data.
This study was financially supported by Jing-Jin-Ji Regional Integrated Environmental Improvement-National Science and Technology Major Project (grant no. 2025ZD1202900), Natural Science Foundation of China (grant nos. 72274187 and 72534006), Deep Earth Probe and Mineral Resources Exploration – National Science and Technology Major Project (grant no. 2025ZD1007007).
This paper was edited by Yuhan (Douglas) Rao and reviewed by Maximilian Kleebauer and one anonymous referee.
Bopucki, R. and Perzanowski, K.: Effects of wind turbines on spatial distribution of the European hamster, Ecol. Indic., 84, 433–436, https://doi.org/10.1016/j.ecolind.2017.09.019, 2018.
Calvert, K., Pearce, J. M., and Mabee, W. E.: Toward renewable energy geo-information infrastructures: applications of geoscience and remote sensing that build institutional capacity, Renew. Sust. Energ. Rev., 18, 416–429, https://doi.org/10.1016/j.rser.2012.10.024, 2013.
Cerri, J., Costantino, C., De Rosa, D., Banič, D. A., Urgeghe, G., Fozzi, I., Echeverria, J., Aresu, M., and Berlinguer, F.: Widely used datasets of wind energy infrastructures can seriously underestimate onshore turbines in the Mediterranean, Biol. Conserv., 300, 110870, https://doi.org/10.1016/j.biocon.2024.110870, 2024.
Chen, P., Sheng, N., Song, Q. and Li, J. Under net-zero ambitions and decent living standards: Turning to a regional synergistic plastic waste management system from the linear system, Environ. Impact Asses., 120, 108472, https://doi.org/10.1016/j.eiar.2026.108472, 2026.
Congalton, R. G.: A review of assessing the accuracy of classifications of remotely sensed data, Remote Sens. Environ., 37, 35–46, https://doi.org/10.1016/0034-4257(91)90048-B, 1991.
Dai, T., Jose Valanarasu, J. M., Zhao, Y., Zheng, S., Sun, Y., Patel, V. M., and Jordaan, S. M.: Land resources for wind energy development requires regionalized characterizations, Environ. Sci. Technol., 58, 5014–5023, https://doi.org/10.1021/acs.est.3c07908, 2024.
Davis, N. N., Badger, J., Hahmann, A. N., Hansen, B. O., Mortensen, N. G., Kelly, M., Larsén, X. G., Olsen, B. T., Floors, R., and Lizcano, G.: The global wind atlas: a high-resolution dataset of climatologies and associated web-based application, B. Am. Meteorol. Soc., 104, E1507–E1525, https://doi.org/10.1175/BAMS-D-21-0075.1, 2023.
Dunnett, S., Sorichetta, A., Taylor, G., and Eigenbrod, F.: Harmonised global datasets of wind and solar farm locations and power, Sci. Data, 7, 130, https://doi.org/10.1038/s41597-020-0469-8, 2020.
Effenberger, N. and Ludwig, N.: A collection and categorization of open-source wind and wind power datasets, Wind Energy, 25, 1659–1683, https://doi.org/10.1002/we.2766, 2022.
Enevoldsen, P.: Onshore wind energy in northern European forests: reviewing the risks, Renew. Sust. Energ. Rev., 60, 1251–1262, https://doi.org/10.1016/j.rser.2016.02.027, 2016.
Enevoldsen, P.: A socio-technical framework for examining the consequences of deforestation: a case study of wind project development in northern Europe, Energy Policy, 115, 138–147, https://doi.org/10.1016/j.enpol.2018.01.007, 2018.
Gao, L., Wu, Q., Qiu, J., Mei, Y., Yao, Y., Meng, L., and Liu, P.: The impact of wind energy on plant biomass production in China, Sci. Rep., 13, 22366, https://doi.org/10.1038/s41598-023-49650-9, 2023.
Godby, R., Cook, B., Holland, M., and Kjorstad, T.: State incentives: impact on wind energy costs and policy development, Renew. Sust. Energ. Rev., 215, 115572, https://doi.org/10.1016/j.rser.2025.115572, 2025.
Goutte, C. and Gaussier, E.: A probabilistic interpretation of precision, recall and f-score, with implication for evaluation, in: European Conference on Information Retrieval, Springer, 345–359, https://doi.org/10.1007/978-3-540-31865-1_25, 2005.
He, K., Zhang, X., Ren, S., and Sun, J.: Deep residual learning for image recognition, in: Proceedings of the IEEE conference on computer vision and pattern recognition, IEEE, Las Vegas, NV, USA, 770–778, https://doi.org/10.1109/CVPR.2016.90, 2016.
Hoeser, T., Feuerstein, S., and Kuenzer, C.: DeepOWT: a global offshore wind turbine data set derived with deep learning from Sentinel-1 data, Earth Syst. Sci. Data, 14, 4251–4270, https://doi.org/10.5194/essd-14-4251-2022, 2022.
Huang, S., Tang, L., Hupy, J. P., Wang, Y., and Shao, G.: A commentary review on the use of normalized difference vegetation index (NDVI) in the era of popular remote sensing, J. For. Res., 32, 1–6, https://doi.org/10.1007/s11676-020-01155-1, 2021.
Karra, K., Kontgis, C., Statman-Weil, Z., Mazzariello, J. C., Mathis, M., and Brumby, S. P.: Global land use/land cover with Sentinel 2 and deep learning, in: 2021 IEEE international geoscience and remote sensing symposium IGARSS, IEEE, Brussels, Belgium, 4704–4707, https://doi.org/10.1109/IGARSS47720.2021.9553499, 2021.
Kati, V., Kassara, C., Vrontisi, Z., and Moustakas, A.: The biodiversity-wind energy-land use nexus in a global biodiversity hotspot, Sci. Total Environ., 768, 144471, https://doi.org/10.1016/j.scitotenv.2020.144471, 2021.
Kleebauer, M., Karamanski, S., Callies, D., and Braun, M.: A wind turbines dataset for South Africa: OpenStreetMap data, deep learning-based geo-coordinate correction and capacity analysis, ISPRS Int. J. Geo-Inf., 14, 232, https://doi.org/10.3390/ijgi14060232, 2025.
Kruitwagen, L., Story, K. T., Friedrich, J., Byers, L., Skillman, S., and Hepburn, C.: A global inventory of photovoltaic solar energy generating units, Nature, 598, 604–610, https://doi.org/10.1038/s41586-021-03957-7, 2021.
Kumar, A., Pal, D., Kar, S. K., Mishra, S. K., and Bansal, R.: An overview of wind energy development and policy initiatives in India, Clean Technol. Environ. Policy, 24, 1337–1358, https://doi.org/10.1007/s10098-021-02248-z, 2022.
Liao, Z.: The evolution of wind energy policies in China (1995–2014): an analysis based on policy instruments, Renew. Sust. Energ. Rev., 56, 464–472, https://doi.org/10.1016/j.rser.2015.11.097, 2016.
Liu, Y., Feng, S., Qian, Y., Huang, H., and Berg, L. K.: How do North American weather regimes drive wind energy at the sub-seasonal to seasonal timescales?, Npj Clim. Atmos. Sci., 6, 100, https://doi.org/10.1038/s41612-023-00403-5, 2023.
Ma, B., Yang, J., Chen, X., Zhang, L., and Zeng, W.: Revealing the ecological impact of low-speed mountain wind power on vegetation and soil erosion in south China: a case study of a typical wind farm in Yunnan, J. Clean. Prod., 419, 138020, https://doi.org/10.1016/j.jclepro.2023.138020, 2023.
Manske, D., Grosch, L., Schmiedt, J., Mittelstädt, N., and Thrän, D.: Geo-locations and system data of renewable energy installations in Germany, Data, 7, 128, https://doi.org/10.3390/data7090128, 2022.
Marques, A. T., Santos, C. D., Hanssen, F., Muñoz, A. R., Onrubia, A., Wikelski, M., Moreira, F., Palmeirim, J. M., and Silva, J. P.: Wind turbines cause functional habitat loss for migratory soaring birds, J. Anim. Ecol., 89, 93–103, https://doi.org/10.1111/1365-2656.12961, 2020.
Mckay, R. A., Johns, S. E., Bischof, R., Matthews, F., van der Kooij, J., Yoh, N., and Eldegard, K.: Wind energy development can lead to guild-specific habitat loss in boreal forest bats, Wildlife Biol., 2024, e1168, https://doi.org/10.1002/wlb3.01168, 2024.
Mckenna, R., Lilliestam, J., Heinrichs, H. U., Weinand, J., Schmidt, J., Staffell, I., Hahmann, A. N., Burgherr, P., Burdack, A., and Bucha, M.: System impacts of wind energy developments: key research challenges and opportunities, Joule, 9, https://doi.org/10.1016/j.joule.2024.11.016, 2025.
Millon, L., Colin, C., Brescia, F., and Kerbiriou, C.: Wind turbines impact bat activity, leading to high losses of habitat use in a biodiversity hotspot, Ecol. Eng., 112, 51–54, https://doi.org/10.1016/j.ecoleng.2017.12.024, 2018.
Mishra, M., Desul, S., Santos, C. A. G., Mishra, S. K., Kamal, A. H. M., Goswami, S., Kalumba, A. M., Biswal, R., Da Silva, R. M., and Dos Santos, C. A. C.: A bibliometric analysis of sustainable development goals (SDGs): a review of progress, challenges, and opportunities, Environment, Develop. Sustain., 26, 11101–11143, https://doi.org/10.1007/s10668-023-03225-w, 2024.
Moore O'Leary, K. A., Hernandez, R. R., Johnston, D. S., Abella, S. R., Tanner, K. E., Swanson, A. C., Kreitler, J., and Lovich, J. E.: Sustainability of utility-scale solar energy–critical ecological concepts, Front. Ecol. Environ., 15, 385–394, https://doi.org/10.1002/fee.1517, 2017.
Muller, E., Gremmo, S., Houtin-Mongrolle, F., Duboc, B., and Bénard, P.: Field-data-based validation of an aero-servo-elastic solver for high-fidelity large-eddy simulations of industrial wind turbines, Wind Energ. Sci., 9, 25–48, https://doi.org/10.5194/wes-9-25-2024, 2024.
Oró, E., Depoorter, V., Garcia, A., and Salom, J.: Energy efficiency and renewable energy integration in data centers. Strategies and modelling review, Renew. Sust. Energ. Rev., 42, 429–445, https://doi.org/10.1016/j.rser.2014.10.035, 2015.
Raimi, D., Zhu, Y., Newell, R. G., Prest, B. C., and Bergman, A.: Global energy outlook 2023: sowing the seeds of an energy transition, Resour. Future, 1, 1–44, 2023.
Rand, J. T., Kramer, L. A., Garrity, C. P., Hoen, B. D., Diffendorfer, J. E., Hunt, H. E., and Spears, M.: A continuously updated, geospatially rectified database of utility-scale wind turbines in the United States, Sci. Data, 7, 15, https://doi.org/10.1038/s41597-020-0353-6, 2020.
Rigatti, S. J.: Random Forest, J. Insurance Medicine, 47, 31–39, 2017.
Rinne, E., Holttinen, H., Kiviluoma, J., and Rissanen, S.: Effects of turbine technology and land use on wind power resource potential, Nat. Energy, 3, 494–500, https://doi.org/10.1038/s41560-018-0137-9, 2018.
Robinson, C., Ortiz, A., Kim, A., Dodhia, R., Zolli, A., Nagaraju, S. K., Oakleaf, J., Kiesecker, J., and Ferres, J. M. L.: Global renewables watch: a temporal dataset of solar and wind energy derived from satellite imagery, Arxiv [preprint], https://doi.org/10.48550/arXiv.2503.14860, 2025.
Rochmińska, A.: Wind energy infrastructure and socio-spatial conflicts, Energies, 16, 1032, https://doi.org/10.3390/en16031032, 2023.
Roddis, P., Carver, S., Dallimer, M., Norman, P., and Ziv, G.: The role of community acceptance in planning outcomes for onshore wind and solar farms: an energy justice analysis, Appl. Energy, 226, 353–364, https://doi.org/10.1016/j.apenergy.2018.05.087, 2018.
Shujun, L., Jianchuan, Q., Yongze, S., and Wang, P.: Mapping global onshore wind turbines using multi-source remote sensing images and hybrid learning approaches, Zenodo [code and data set], https://doi.org/10.5281/zenodo.18984175, 2026.
Smeraldo, S., Bosso, L., Fraissinet, M., Bordignon, L., Brunelli, M., Ancillotto, L., and Russo, D.: Modelling risks posed by wind turbines and power lines to soaring birds: the black stork (Ciconia nigra) in Italy as a case study, Biodivers. Conserv., 29, 1959–1976, https://doi.org/10.1007/s10531-020-01961-3, 2020.
Tavakkoli, S., Macknick, J., Heath, G. A., and Jordaan, S. M.: Spatiotemporal energy infrastructure datasets for the United States: a review, Renew. Sust. Energ. Rev., 152, 111616, https://doi.org/10.1016/j.rser.2021.111616, 2021.
Xia, Z., Li, Y., Guo, S., Zhang, X., Pan, X., Fang, H., Chen, R., and Du, P.: Assessment of forest disturbance and soil erosion in wind farm project using satellite observations, Resour. Conserv. Recy., 212, 107934, https://doi.org/10.1016/j.resconrec.2024.107934, 2025.
Zha, Y., Gao, J., and Ni, S.: Use of normalized difference built-up index in automatically mapping urban areas from TM imagery, Int. J. Remote Sens., 24, 583–594, https://doi.org/10.1080/01431160304987, 2003.
Zhai, Y., Chen, X., Cao, X., and Cui, X.: Identifying wind turbines from multiresolution and multibackground remote sensing imagery, Int. J. Appl. Earth Obs. Geoinf., 126, 103613, https://doi.org/10.1016/j.jag.2023.103613, 2024.
Zhang, T., Tian, B., Sengupta, D., Zhang, L., and Si, Y.: Global offshore wind turbine dataset, Sci. Data, 8, 191, https://doi.org/10.1038/s41597-021-00982-z, 2021.