the Creative Commons Attribution 4.0 License.
the Creative Commons Attribution 4.0 License.
 | 02 Jul 2026
A consolidated database of mercury observations for permafrost regions
Christine L. Olson
Kevin Schaefer
Alyssa Azaroff
Hélène Angot
Sasiri Bandara
Thomas A. Douglas
Bo Elberling
Maria Florencia Fahnestock
Xinbin Feng
Charlotte Haugk
Gustaf Hugelius
Erfan Jahangir
Sofi Jonsson
Shichang Kang
Adam Kirkwood
Jennifer Korosi
Igor Lehnherr
Artem Lim
Rinat Manasypov
Dmitriy Moskovchenko
Mina Nasr
Daniel Obrist
David Olefeldt
Connor Olson
Oleg Pokrovsky
Laura Sereni
Sarah Shakil
M. Isabel Smith
Jens Søndergaard
Jeroen Sonke
Kasia Staniszewska
Jens Strauss
Kyra St. Pierre
Lauren Thompson
Andrey Yurtaev
Yanxu Zhang
Scott Zolkos
Soils across permafrost regions are one of the largest terrestrial pools of mercury (Hg) in the world, storing an estimated 500–1500 Gg of Hg in the top three meters of soil. Ongoing climate-driven thaw threatens to release this legacy Hg into the environment. Efforts to quantify and model this pool have been hindered by a lack of harmonized, spatially resolved observations. To address this, we compiled a database of 117,802 Hg observations collected between 1988 and 2022 from 59 studies across Arctic, sub-Arctic, and alpine permafrost regions of the Northern Hemisphere, including North America, northern Europe, Eurasia and the Tibetan Plateau. The database includes Hg concentration measurements in solid materials – such as soil, leaves, roots, and wood – as well as in water samples from soil porewater, lakes, and rivers across the northern hemisphere permafrost domain. The database enables cross-site synthesis, model calibration and evaluation, and environmental assessments by standardizing and harmonizing data from diverse sources. Data standardization included unit conversion, categorization of observations by type, and quality-control procedures to ensure consistency across studies. Analytical uncertainty was preserved where reported in source studies, and quality control indicators – including range and outlier flags – were applied to support data screening and interpretation. Mercury concentrations vary widely across observations, with lake sediment showing the highest median values (70 ng g−1, IQR: 45–116), followed by soil (50 ng g−1, IQR: 32-90), and vegetation (15 ng g−1, IQR: 9–33). Water observations (total Hg) had a median of 2 ng L−1 (IQR: 2–6). Statistically significant differences in Hg concentrations among observation types were observed at both global and regional scales, generally following the pattern: lake sediment > soil > vegetation, although this ordering is sensitive to regional sampling distribution. These patterns, along with spatial and observation-type biases, highlight the need for improved coverage in underrepresented regions such as Eurasia. The database is freely accessible through Zenodo under the concept https://doi.org/10.5281/zenodo.18300989 (all versions; Olson et al., 2026a), to support ongoing research and model development in Arctic and sub-Arctic Hg cycle studies.
- Article
(3854 KB) - Full-text XML
- BibTeX
- EndNote


Permafrost-region soils contain the largest terrestrial pool of Hg in the world (Schuster et al., 2018; Olson et al., 2018; Lim et al., 2020). Anthropogenic activities and natural sources such as volcanoes and rock weathering release Hg into the environment (Fitzgerald and Lamborg, 2014). Mercury in permafrost primarily originates from long-range atmospheric transport of Hg from lower latitudes (Dastoor et al., 2022). About two-thirds of Hg in remote permafrost regions is deposited to terrestrial ecosystems where it accumulates in soils via vegetation uptake and transfer through litterfall and throughfall (Obrist et al., 2017; Olson et al., 2018, 2019). As permafrost thaws, Hg bound to organic rich matter may become mobilized into terrestrial and aquatic ecosystems (Chételat et al., 2022; Jonsson et al., 2022; St. Pierre et al., 2018). In addition to thaw-driven mobilization, rapid Arctic landscape change, including thermokarst development, erosion, and shifting sediment transport pathways, may further alter Hg redistribution and export across northern river and coastal systems (Tian et al., 2026). Once mobilized, it can be transported to wetlands, rivers (Fabre et al., 2024; Zolkos et al., 2020), lakes (MacMillan et al., 2015; Varty et al., 2021), and coastal (Giest et al., 2025) environments where microbial processes can convert it to methylmercury (MeHg) – a highly toxic and bioaccumulative form (Jonsson et al., 2022). As climate warming accelerates, this sequence of thaw-driven mobilization, transport, and methylation could trigger a permafrost–Hg feedback with far-reaching implications for ecosystem and human health, particularly for Arctic and sub-Arctic communities reliant on aquatic foods as a dietary staple (Schaefer et al., 2020; Basu et al., 2022; Gartler et al., 2025). Understanding the complete terrestrial Hg budget – including vegetation-mediated inputs – is critical for projecting how climate change will alter global Hg cycling.
Permafrost regions play a critical role in regulating both local and global Hg cycling. Despite its importance, observational data from these regions remain spatially limited and are rarely synthesized across media (e.g., soil, vegetation, water sediments). As a result, many global Hg budgets either exclude these areas or rely on highly uncertain estimates (Outridge et al., 2018; Sonke et al., 2023; Zhang et al., 2023). Although measurements exist, they are dispersed in the literature and have not been integrated into forms usable for larger-scale modeling or policy assessments. Current global budgets incorporate detailed estimates of anthropogenic and natural emissions, wet and dry deposition fluxes, and reservoirs in the ocean, land, and vegetation, yet cold-region biogeochemistry and permafrost processes are inadequately represented. An improved understanding of the global Hg cycle – especially in permafrost – is critical to our understanding of the global Hg cycle and to effectively monitor reduction efforts under international frameworks such as the Minamata Convention on Mercury. An integrated database of available Hg observations in permafrost regions is needed to better represent this outsized global pool.
Mercury measurements in permafrost regions remain spatially limited, fragmented across observation types, and largely unintegrated across studies (AMAP, 2021). Permafrost soil inventories vary widely – from 500–1500 Gg of Hg in the top three meters of soil – due to sparse and spatially unevenly distributed measurements (Schuster et al., 2018; Olson et al., 2018; Lim et al., 2020). Large-scale extrapolations like these rely on the upscaling of localized data using carbon content and Hg-to-carbon ratios from a few accessible regions, leading to geographic biases in global estimates (Lim et al. 2020). In addition, insufficient stratification of observations by ecosystem or soil type (e.g., organic vs. mineral soils) limits the accuracy of Hg storage estimates and the ability to capture spatial heterogeneity. Expanding observational coverage across permafrost regions and ensuring representation across key soil types in permafrost regions are essential to constrain these estimates and reduce uncertainty. Vegetation measurements are even more rare and not co-located with soil Hg measurements, despite vegetation being a key pathway for Hg deposition and transfer to soils through litterfall and wood decomposition. This process plays a crucial role in the accumulation of Hg in permafrost over time, as plant-derived organic matter – and its associated Hg – is buried and frozen. Without co-located vegetation and soil measurements, it is difficult to reconstruct historical Hg inputs and constrain the drivers of current permafrost Hg inventories. Aquatic systems are another critical component, acting as downstream receptors of Hg mobilized from thawing permafrost. In these environments, certain conditions promote the microbial conversion of inorganic Hg to MeHg – a potent neurotoxin that bioaccumulates in food webs and poses the greatest risk to wildlife and human health. Distinct methylation hotspots have been identified in wetlands (Thompson et al., 2025), ponds (MacMillan et al., 2015), and lakes (Jonsson et al., 2022); however, limited data on Hg inputs and outputs hinders our ability to quantify fluxes and establish clear linkages with surrounding terrestrial sources. In permafrost regions, rivers such as the Yukon, Mackenzie, and Ob show high seasonal variability in Hg fluxes, peaking during spring thaw and snowmelt (Sonke et al., 2018; Zolkos et al., 2020). Exports of Hg from streams and rivers in permafrost are sparse and vary widely, driven by differences in land cover, geology, and watershed complexity. This lack of integrated data across observation types hinders our ability to predict future ecological impacts and to quantify the growing contribution of thawing permafrost Hg to the global budget. Consolidating existing observations is therefore a critical first step towards improving predictive models, monitoring strategies, and broader scientific analyses (Horsburgh et al., 2009).
This paper introduces the PermHg database, developed through an extensive effort to compile, standardize, and harmonize Hg observations from permafrost-affected environments. The database includes both published and unpublished data on Hg concentrations in soil, aquatic systems, and vegetation across permafrost regions. The goal is to support synthesis efforts, model development, and risk assessment. By improving access to Hg observations in cold-region systems, the PermHg database provides a robust, centralized platform that can be used to enhance our understanding of permafrost landscapes and to help identify implications for northern high-latitude ecosystems.
We compiled Hg observations by surveying peer-reviewed literature via Web of Science and other scholarly databases, supplemental materials, and open-access data repositories, as well as incorporating unpublished measurements contributed directly by collaborating researchers. The PermHg database is the result of numerous research groups from around the world combining original measurements collected in permafrost regions. We sought to prioritize primary observations, although some observations are from prior synthesis papers. All observations are linked to their original source through a paper identifier and are documented in a comprehensive data source inventory provided with the database. During compilation, records were screened for duplication using site information, coordinates, and reported values; no duplicate records were identified. Data inclusion required sufficient metadata (e.g., location and units), and records lacking essential information were excluded during initial data extraction. All nomenclature, units, and formats were standardized into a single harmonized database for general use. While the database is comprehensive, its completeness is limited by geographic bias in the published record, variable reporting standards, and uneven coverage across ecosystem types. Descriptions of observation types, standardization procedures, and methodologies are detailed below. This will be one of the first open sources, integrated global permafrost Hg databases combining soil, sediment, aquatic systems, and vegetation observations on a large scale.
In addition to primary literature sources, a subset of soil permafrost mercury observations was sourced from an independently curated database developed by the Bolin Centre for Climate Research (https://doi.org/10.17043/azaroff-2026-permafrost-mercury-1, Azaroff et al., 2026). These data are archived separately and contribute harmonized permafrost mercury observations and associated metadata that complement the broader PermHg compilation.
2.1 Study Area
The database includes observations from Arctic, sub-Arctic, and alpine permafrost regions in the Northern Hemisphere, including the Tibetan Plateau. Site selection was based on geographic and climatic criteria guided by the modeled permafrost extent and ground temperature map of Obu et al. (2019). Specifically, we included areas with a modeled probability of permafrost occurrence ≥ 10 % and mean annual ground temperature below 0 °C, capturing a range of permafrost zones from continuous to isolated (Obu et al., 2019). Lower probability isolated permafrost patches (< 10 %) shown in Fig. 1 were included only as part of the background permafrost map visualization and were not used during database screening.
Vegetation cover types for plant Hg data were classified using the circumpolar vegetation map from the ABCflux database (Virkkala et al., 2022). These include land cover classes such as mixed and needleleaf forests, boreal and tundra wetlands, and shrub and barren tundra. Observation locations were overlain on the land cover map to assign the dominant vegetation type for each observation. This enables grouping of observations by ecosystem, which may aid in identifying Hg uptake patterns across different environmental conditions. Note that spatial resolution of the land cover database may be limited in some areas; however, using a standardized land cover supports future ecological comparisons and model parameterization efforts.
A map of the geographic domain is provided in Fig. 1 to visualize the spatial distribution of data points and overall coverage of the study. The figure includes a map of Hg observations, with spatial coverage differentiated by observation type. Circle size and embedded numbers indicate observation density, while circle color indicates observation type (e.g., soil, water, vegetation, or lake sediment). The background shading represents the likelihood of permafrost occurrence, based on the probabilistic map from Obu et al. (2019).
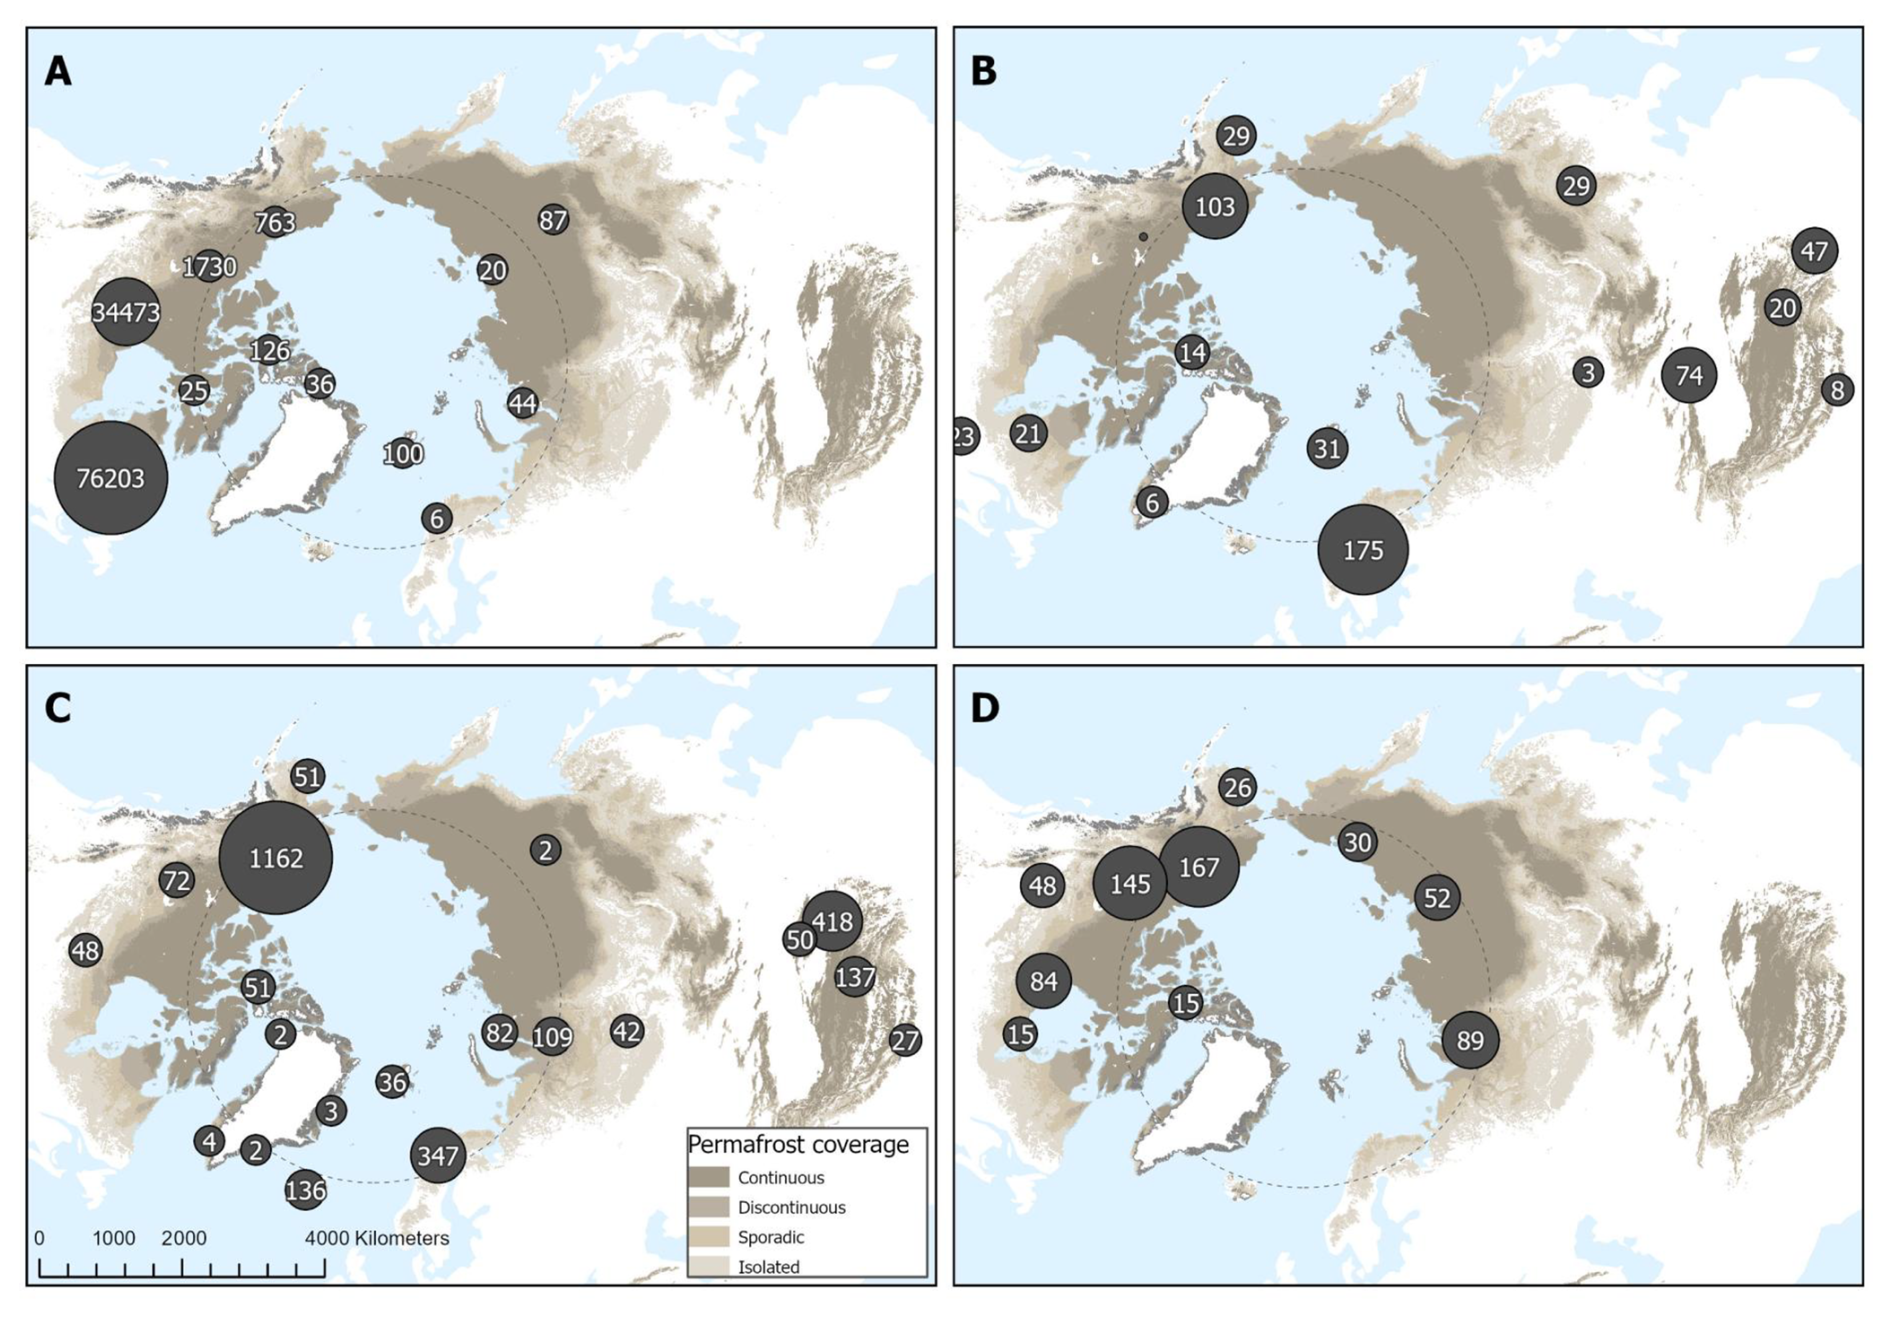
Figure 1The map shows the global PermHg observation locations for (a), lake sediment, (b) vegetation, (c) soil and (d) water. Water data includes observations in lakes, rivers, creeks, oceans, wetlands, ponds, and soil porewater. Circle size and numbers show observation density or counts per area. The background shading shows the modeled probability permafrost occurrence based on Obu et al. (2019). Permafrost is classified by probability: continuous (> 0.9), discontinuous (0.5–0.9), sporadic (0.1–0.5), and isolated patches (0.001–0.1). These categories, shown in varying shades of brown, indicate the likelihood that permafrost is present at a given location.
2.2 Data Description
We focused on extracting Hg measurements from environmental compartments most relevant to the terrestrial biosphere and Hg cycling models including soil, lake sediment, water, and vegetation. Water data includes observations in lakes, rivers, creeks, oceans, wetlands, ponds, and soil porewater. All observations include the following metadata: the original observation identifier if available, site name, country, sample number, date of collection, laboratory, contact name, contact email, paper identifier, latitude and longitude, measurement instrument, including the analytical technique used for Hg quantification (e.g., ICP-MS, DMA, CVAAS) where available, as well as total Hg concentration, total Hg measurement error, notes, collector, range flag, and outlier flag. Reference lists for each observation type are provided as structured .bib files in the project repository and archived with the database. A “ReadMe tab” is included on Zenodo (https://doi.org/10.5281/zenodo.18300989, concept DOI) for each database type, providing detailed descriptions of all column variables and units (Olson et al., 2026a). Additional metadata specific to the observation type is detailed in the following paragraphs. Duplicate records across sources were screened during compilation using site identifiers, geographic coordinates (latitude/longitude), and reported values, and none were identified. The database may include repeat sampling at the same or nearby locations across different time periods; however, repeated measurements are not explicitly flagged as time series. Users can identify potential repeat observations using combinations of site identifiers, geographic coordinates (latitude/longitude), and sampling dates provided for each record. As a result, while the dataset supports exploratory temporal analysis, it is not structured as a formal time-series dataset and should be used with caution for trend analysis.
Soil data include available information on soil type, horizon, vegetation type, sample depth, bulk density, loss-on-ignition (LOI; as a proxy for organic matter), soil organic carbon content, hg-to-carbon ratio, and volumetric water content. Soil horizon and depth information help distinguish surface organic layers from mineral soils, which can be markedly different in Hg concentration (Lim et al., 2020). Bulk soil density and organic carbon (OC) measurements are used to calculate Hg stocks, and pairing Hg with OC enables upscaling across permafrost regions where OC data are widely available. LOI provides a complementary proxy for total organic matter, helping to capture variability in Hg–organic matter associations. Volumetric water contents are helpful for determining MeHg production potential and possibly redox states. Collectively, these parameters support assessment of Hg partitioning, transportation, and transformation.
Lake sediment data provides a long-term archive of Hg deposition and accumulation, capturing both historical and more recently derived inputs. Surface sediments are also an important site of Hg methylation and are critical to understanding Hg loading to aquatic food webs. Lake sediment data includes information on sampling location and context, such as soil type (for porewater samples), vegetation type, location description, catchment size, wetland cover, depth of sample, soil organic carbon, and Hg to carbon ratios. These metadata help us interpret how Hg is retained or transported, potential Hg sources, methylation potential, and deposition timeline.
Water data includes observations in lakes, rivers, creeks, oceans, wetlands, ponds, and soil porewater. Water data also includes information on sampling location of the catchments such as soil type (for porewater observations), vegetation type, site description, catchment size, wetland cover, depth of sample, dissolved Hg concentration, MeHg concentration, total organic carbon, dissolved organic carbon, Hg to carbon ratio, turbidity, pH, electrical conductivity, alkalinity, total phosphorus, chloride, sulfate, and total dissolved solids. These water chemistry measurements were included to help evaluate Hg concentrations and relevant processes in aquatic systems including transformation, sources, mobility, bioavailability, binding, speciation, and methylation. While multiple Hg species (e.g., dissolved Hg and methylmercury) are included in the database where available, all analyses presented in this study use total Hg concentrations to ensure consistency across observation types.
Vegetation data include scientific and common species names, vegetation type, above ground biomass, and sampled components such as leaves, roots, and woody tissue, including tree-ring samples that can provide temporal records of Hg accumulation (Zhang et al., 1995; Kang et al., 2022). Inclusion of these variables allows for comparison of Hg concentrations across plant species functional types and environmental conditions. Tree-ring data are useful for understanding historical trends in atmospheric Hg, allowing for records of Hg uptake over decades to centuries. This is particularly helpful in remote regions, where long-term monitoring is lacking.
Together, these metadata and Hg measurements provide critical context for understanding Hg fate, transport, and transformation across various ecosystems. By standardizing and compiling these parameters, the database enables cross-site comparison, model development, and process-based investigations of Hg cycling in permafrost-affected landscapes. While Hg measurements and location were the primary focus of this synthesis effort, we also incorporated additional environmental parameters where available to support broader application and interpretation.
2.3 Data Standardization
The database follows a standardized file and metadata structure, with clearly defined columns, data types, and consistent formats for easy integration and use. Here, standardization refers to the alignment of data from multiple sources through unit conversion, consistent formatting, and categorization. Unit conversion was applied to ensure all measurements are reported in standard units and maintain consistency across studies. This includes ng g−1 dry weight for solids (soil, lake sediment, vegetation) and ng L−1 for liquids (water). When uncertainty estimates were available, they were converted to the same units. Latitude and longitude are reported in decimal degrees using the World Geodetic System 1984 (WGS 84) coordinate reference system. The database includes core identifiers such as site, location, and sample ID, collection date, laboratory name, contact person and email, sample collector information, and additional notes relevant to data interpretation.
A uniform classification standard was implemented for vegetation observations. These include vegetation type – the 12 vegetation classes defined in Virkkala et al. (2022), including boreal wetland, mixed forest, deciduous needleleaf forest, evergreen forest, deciduous broadleaf forest, sparse boreal vegetation, wetland tundra, shrub tundra, prostrate shrub tundra, graminoid tundra, and barren tundra. If the vegetation type could not be distinguished, “NA” is reported. The vegetation observations also contain a standardized “Component” column that specifies whether the observations were moss, lichen, grass, root, leaf, needle, stem, twig, bole wood, bark, or litterfall. Litterfall observations were included within the vegetation category due to their origin as plant material; however, these represent a small subset of the dataset (n=8) and are unlikely to influence overall vegetation statistics.
Missing metadata, such as unreported sample depths or inferred vegetation types, were handled through reasonable assumptions based on available information and clearly flagged to document associated uncertainty and ensure transparency. Missing data are reported as “NA” for text cells and “−999” for numeric fields. No log-transformations, dry-weight recalculations, or normalization procedures were performed. Outlier and range thresholds were applied only as quality-control flags (Sect. 2.4) and did not modify original data values. A complete description of variables and units for each observation type is provided in the metadata file through the project repository. The implications of these assumptions, variable uncertainty reporting, and methodological heterogeneity across studies are further evaluated through uncertainty indicators and validation checks described in Sect. 2.4.
2.4 Uncertainty and Quality Control
Uncertainty in the PermHg database arises primarily from heterogeneity in sampling methods, analytical techniques, reporting standards, and metadata completeness across contributing studies. Where available, analytical method information is included to provide transparency on measurement techniques (e.g., ICP-MS, CVAAS, DMA) and to allow users to consider potential differences in detection limits and analytical precision across studies. Because the database compiles previously published observations rather than generating new measurements, uncertainty characterization focuses on identifying potential sources of variability and providing transparent indicators to support cautious interpretation, rather than re-evaluating analytical accuracy.
Cross-study consistency and potential uncertainty were assessed using range checks and statistical outlier flagging. Range flags are numerical indicators assigned to a data point based on whether the values fall outside predefined conservative screening thresholds. For this database, we use a conservative upper bound of 500 ng g−1 for soil, lake sediment, and vegetation observations and 100 ng L−1 for water observations. Any observation above these values was assigned a “1” in the range flag column to indicate that it surpassed the screening threshold. Observations that fell below these range flags were assigned a “0”. The thresholds were selected based on published ranges reported in global and regional studies and were intended to represent conservative screening values broadly consistent with concentrations observed in many non-impacted systems (Lu et al., 2016; Olson et al., 2022; Wohlgemuth et al., 2022). Any outlier exceeding three times the interquartile range (difference between first and third quartile) was flagged and assigned a “1”. All other values not exceeding 3xIQR were assigned “0”. These flags are intended as screening indicators rather than measures of analytical uncertainty; for example, a value assigned a range flag of “1” exceeds conservative screening thresholds, while an outlier flag of “1” indicates values exceeding three times the interquartile range. These indicators do not imply data removal or correction but are provided to support user interpretation.
Analytical uncertainty was included for total Hg, MeHg, dissolved Hg, total organic carbon, dissolved organic carbon, soil organic carbon, Hg to carbon ratio, volumetric water content, and bulk density when such information was reported in the source studies. However, uncertainty reporting was inconsistent across publications, and many observations lack explicit error estimates or detection limits. As a result, uncertainty cannot be uniformly quantified across the entire dataset. Analytical uncertainties were therefore retained as reported in the original studies and were not aggregated or standardized across the dataset. To address this limitation, qualitative uncertainty information and assumptions made during data extraction (e.g., inferred coordinates or sample depths) were documented in a notes field associated with each observation type to provide users with additional context regarding potential sources of uncertainty or bias.
2.5 Data Analysis
We used several tools to analyze the PermHg database. To visualize the spatial distribution and density of Hg observations globally, we used point clustering in ArcGIS Pro to generate plots where observations were aggregated into circular clusters of varying size, with each circle scaled to represent the number of observations within a given area. Boxplots were generated using Python (version 3.13.3) with the Seaborn and Matplotlib libraries to visualize the distribution of Hg concentrations across observation types and regions. Microsoft Excel was used to generate column charts and explore the distribution of Hg concentrations across observation types. Summary statistics, including count, mean, geometric mean, standard deviation, first quartile (Q1), and third quartile (Q3), were calculated using built-in Excel functions. These built-in functions provided a preliminary assessment of central tendency, spread, and skewness within each observation type.
Validation of the PermHg database focuses on assessing internal coherence and plausibility of the compiled observations rather than independent verification of individual measurements. As the database aggregates previously published data, validation is based on consistency across studies, agreement with established environmental patterns, and transparent documentation of uncertainty and quality indicators (Sect. 2.3–2.4).
Across observation types and geographic subsets, the compiled data exhibit internally consistent and environmentally plausible patterns. Summary statistics and distributional analyses (Sect. 4; Figs. 2 and 4) show relative mercury concentrations among lake sediment, soil, vegetation, and water that align with well-established mercury partitioning and accumulation processes in terrestrial and aquatic systems (Sect. 2.4). No systematic contradictions or study-level anomalies were identified that would indicate errors arising from data compilation or standardization.
Validation does not assess the analytical accuracy of individual measurements, which remains the responsibility of the original studies. Instead, the combination of standardized data structures, uncertainty indicators, range and outlier flags, and cross-study consistency supports the use of the PermHg database for synthesis, comparative analyses, and model applications, provided users account for documented limitations and uncertainty from each respective study.
4.1 Data Summary
Table 1 below details the observation count, median, geometric mean, standard deviation, and upper and lower quartiles for each sample medium. These values highlight the variability and distribution of Hg concentrations within each medium. A total of 30 papers were included for the vegetation observations, five papers for the lake sediment observations, 28 papers for the soil observations, and 10 papers for the water observations. A small subset of unpublished data was included for some observation types, comprising approximately 68 sediment observations and 75 water observations. The studies included in the database are summarized in a table, with full citation details provided in Zenodo under the concept https://doi.org/10.5281/zenodo.18300989 (Olson et al., 2026a).
Table 1Summary statistics of Hg observations in permafrost-dominated regions including lake sediment (ng g−1), soil (ng g−1), vegetation (ng g−1), and water (ng L−1, total Hg). The minimum, 25th percentile, median, 75th percentile, maximum, geometric mean, standard deviation, and count are included for each medium type.
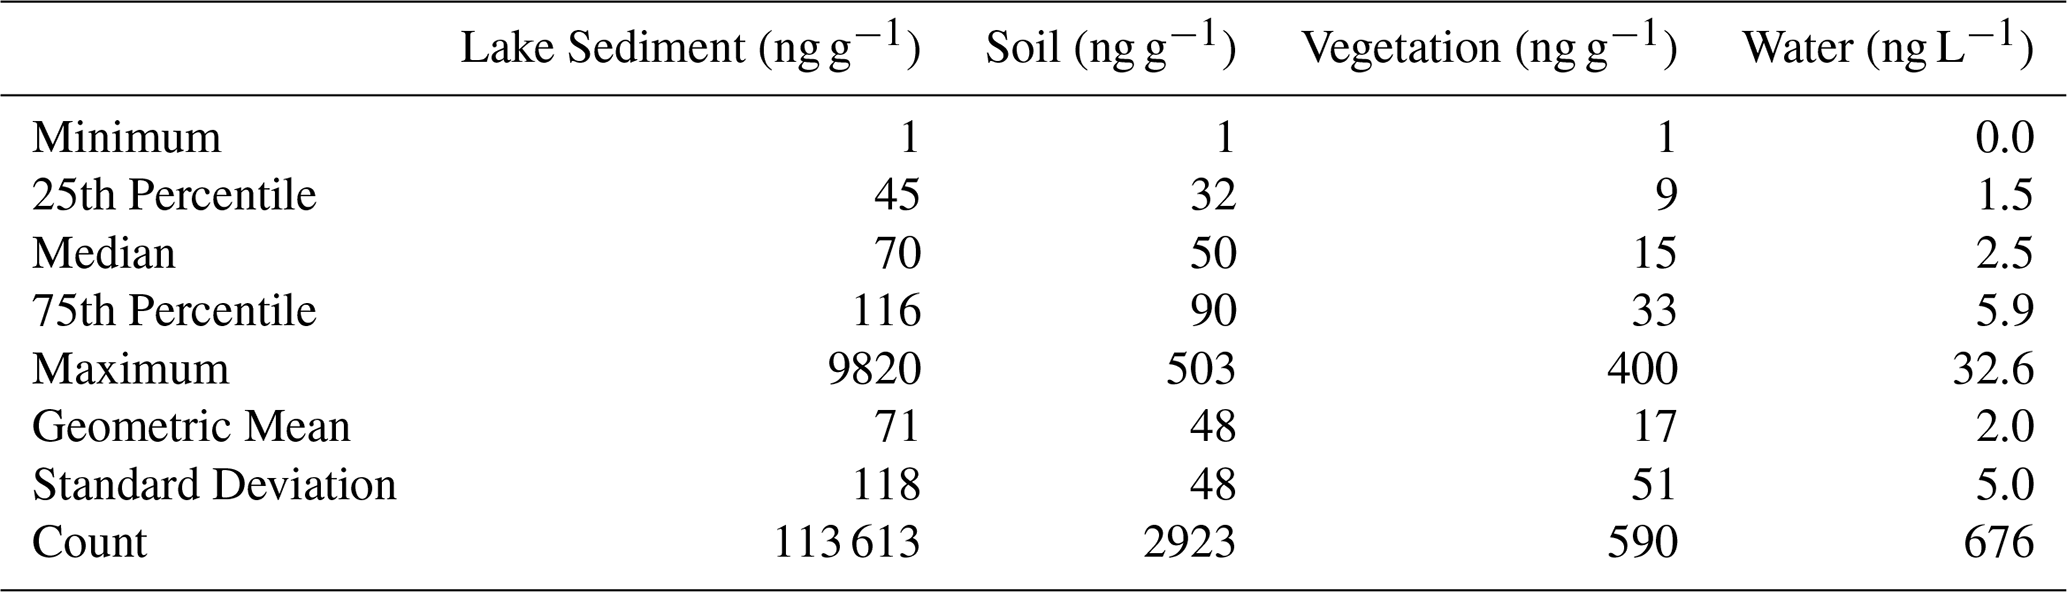
Mercury concentrations across the four observation types – lake sediment, soil, vegetation, and water–displayed positively skewed distributions (Fig. 2). Lake sediment and soil observations showed higher median Hg concentrations compared to vegetation and water, consistent with their roles as primary Hg reservoirs. Vegetation exhibited the lowest concentrations overall, while water Hg concentrations, though generally low, spanned a relatively wide range. The skewness in all matrices highlights that low-to-moderate concentration observations are more common than extreme high values.
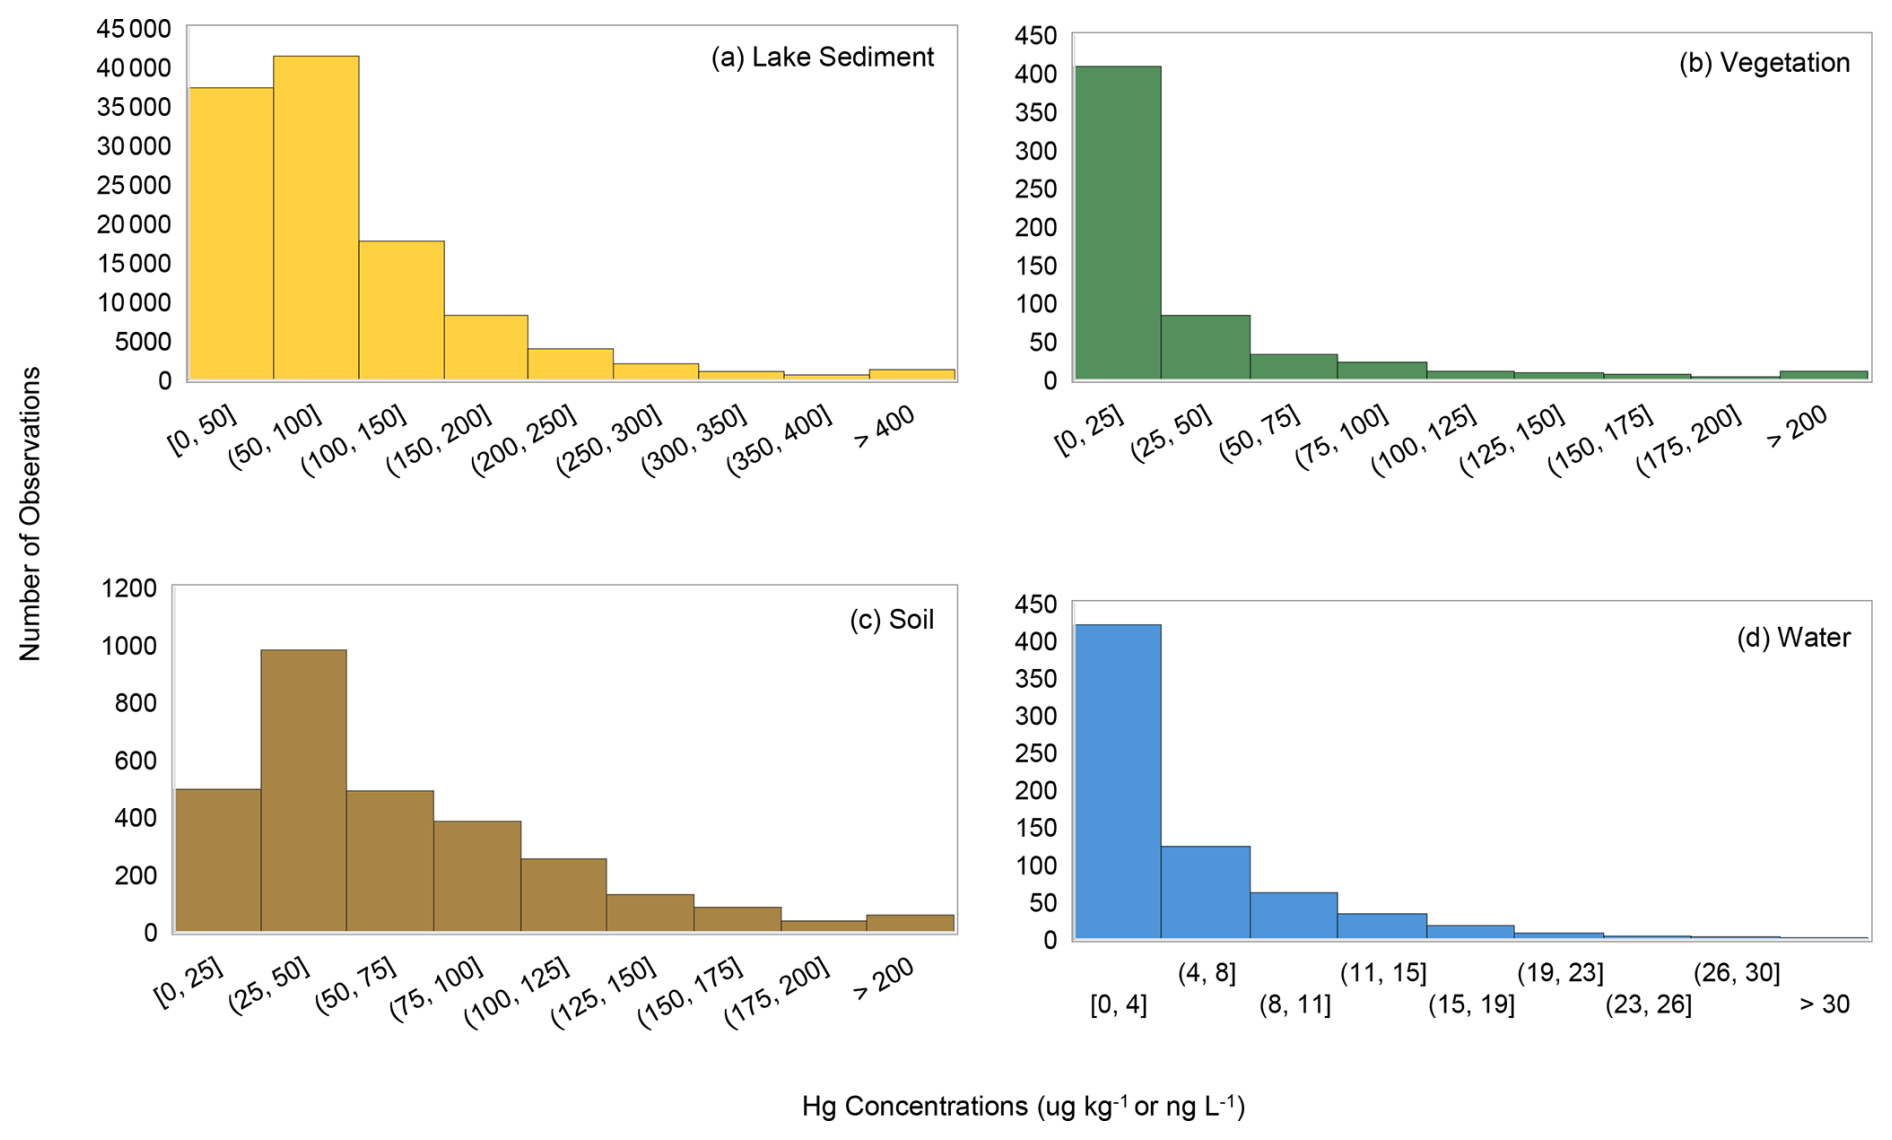
Figure 2Histogram distributions of mercury concentrations in (a) lake sediment, (b) vegetation, (c) soil, and (d) water (total Hg). All matrices show positively skewed distributions, with lake sediment and soil exhibiting higher median concentrations than vegetation and water. Water concentrations (total Hg) are plotted on a separate y-axis scale to accommodate lower values relative to solid matrices.
Figure 1 shows the geographic distribution of data points on a global map, illustrating the spatial spread of measurements across the study region. Circle size and numbers within the circles show observation density. Lake sediment observations are largely concentrated in Canada, particularly towards the eastern side of the country. Some lake sediment observations also occurred in the Canadian Arctic Archipelago and northern Russia. Vegetation observations are concentrated in central Alaska, the Tibetan Plateau, and northern Europe. Some vegetation observations are also visible in northern China, Greenland, Russia, and Canada. Soil observations are highly concentrated in Alaska, the Tibetan Plateau, western Canada and northern Europe, with clusters also existing in western Russia and the Rocky Mountains of the United States. Water observations were the sparsest, with sampling clustered in the north slope of Alaska and along major Arctic Rivers – the Ob, Mackenzie, Yukon, Lena, and Kolyma. Some water observations are also present in the Hudson Bay of Canada.
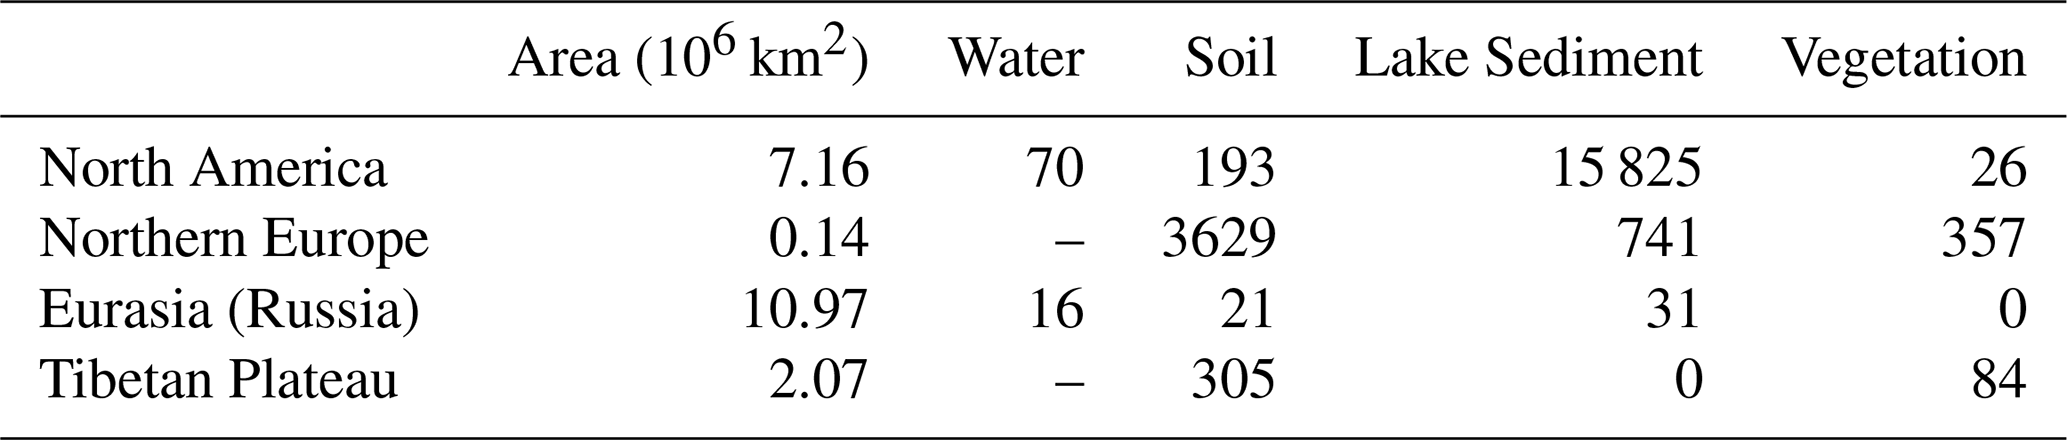
To quantitatively assess spatial representativeness, Table 2 summarizes sampling density as the number of observations per 106 km2 of permafrost area by region and observation type. Permafrost area is defined following Gruber (2012) as land area actually underlain by permafrost. Sampling density varies substantially across regions, with North America exhibiting the highest observation density across most media (e.g., 70 water and 193 soil observations per 106 km2), while Eurasia, represented by Russia, remains comparatively underrepresented (16 water and 21 soil observations per 106 km2). Northern Europe and the Tibetan Plateau show intermediate sampling densities, with variability depending on observation type (e.g., high soil density in northern Europe but limited water observations). Differences among environmental media are also evident. Soil and vegetation observations are relatively well distributed, whereas water observations remain sparse across all regions. Lake sediment observations show the highest apparent sampling densities, particularly in North America (15 825 observations per 106 km2); however, these values reflect multiple samples collected at individual sites (e.g., sediment cores) and therefore are not directly comparable to other media in terms of spatial coverage.
Table 2Sampling density (observations per 106 km2 of permafrost area) by region and medium.
The temporal distribution of Hg observations in the PermHg database is shown in Fig. 3, highlighting the years in which samples were collected for each observation type. Lake sediment observations span from 1995 to 2022, with notable peaks in sampling effort in 2004 and again in 2022. Soil observations cover the period from 2001 to 2022, with steadily increasing sample counts that peak in 2017 and 2022; 81 % of these records include a collection date. Vegetation observations had the longest temporal range, spanning from 1988 to 2020, with a prominent peak in 2018. Nearly all vegetation observations (94 %) are associated with a specific year. Water observations were collected between 1991 and 2019, with a sharp spike in 2005 that far exceeds sampling effort in other years. These records are the most complete in terms of temporal metadata, with over 98 % including a collection date.
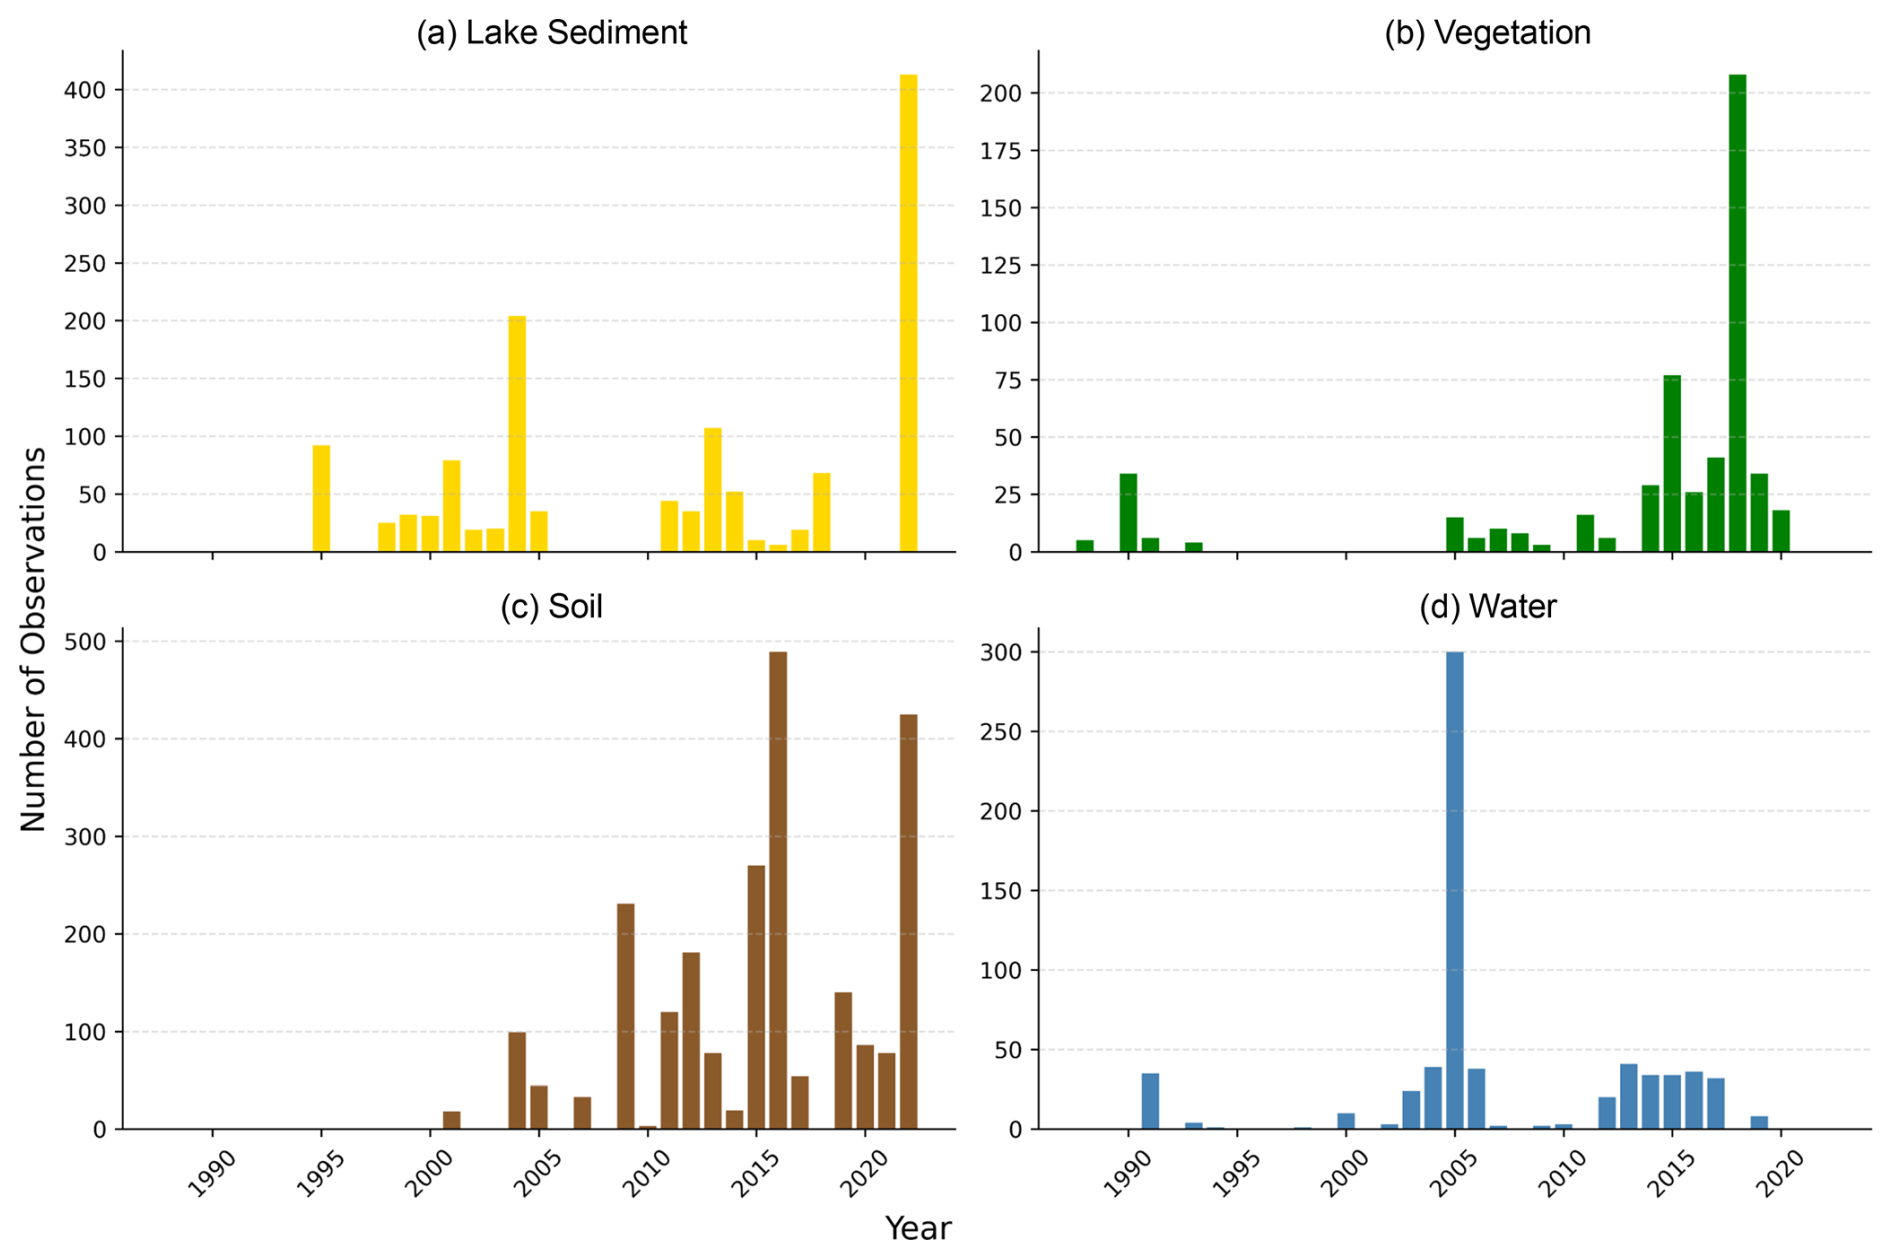
Figure 32D column chart showing the number of observations collected over time for (a) lake sediment, (b) vegetation, (c) soil, and (d) water Hg observations in the PermHg database.
4.2 Data Analysis
Overall, the observation distribution is heavily biased by both matrix type and geographic region. Lake sediment observations account for over 90 % of all data points, highlighting a strong skew toward this medium relative to soil, vegetation, and water. Geographically, the majority of observations exist in Canada and across the Western Hemisphere, with Canada alone contributing over 90 % of the total observations. In contrast, there are significant spatial gaps in Eurasia, particularly across Russia and northern China. This uneven distribution may reflect differences in research funding, accessibility, existing monitoring programs, and the composition of author teams. In addition, data availability may be limited in some countries where observations are not routinely shared publicly or translated into English. As a result, care should be taken when extrapolating trends across under-represented regions or observation types.
Boxplots were used to visualize Hg concentration distributions across lake sediment, soil, vegetation, and water observations at both global and regional scales (Fig. 4). Across all subsets, lake sediment exhibited the highest median concentrations, followed by soil, with vegetation consistently showing the lowest values. Mercury concentrations in water are reported in ng L−1 and are plotted on a secondary y-axis to account for the differing units, while concentrations in sediment, soil, and vegetation are reported in µg kg−1 dry weight. Across both global and Canadian subsets, Hg concentrations follow a consistent pattern by matrix: lake sediment > soil > vegetation. In contrast, observations from all other countries followed the order soil > lake sediment > vegetation, which may be a result of the reversal of sample size for lake sediment and soil observations. The exclusion of Canada in this comparison is intentional, as Canada contains the vast majority of lake sediment observations and accounts for over 90 % of the total dataset, with sample sizes differing by orders of magnitude across matrices (Fig. 4; e.g., sediment n=113 613 vs. vegetation n=590). The shift in ordering outside of Canada highlights the sensitivity of cross-matrix comparisons to dataset composition and uneven sampling.
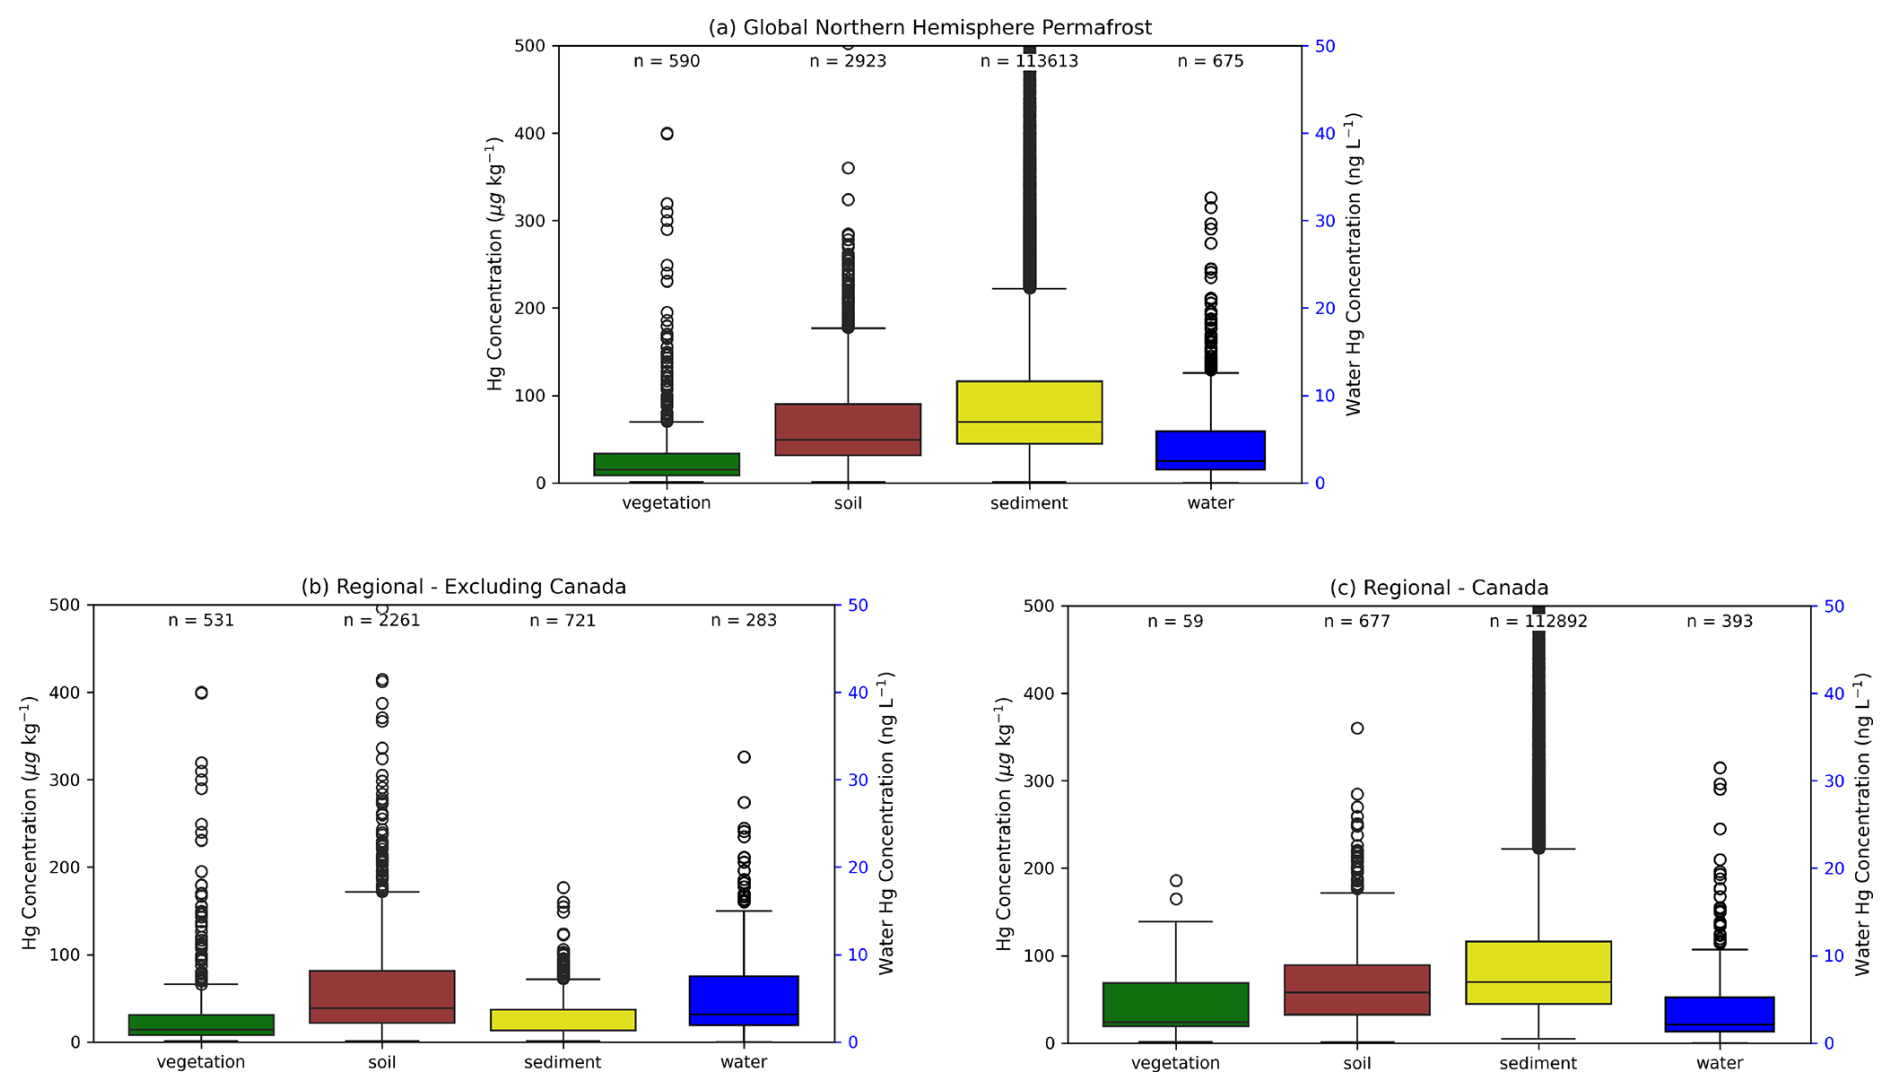
Figure 4Boxplots of Hg concentrations across lake sediment, soil, vegetation and water observation types for (a) Global Northern Hemisphere Permafrost, (b) Regional – Excluding Canada, and (c) Regional – Canada. T-tests within each grouping showed statistically significant differences among most observation types, except between vegetation and sediment for countries outside Canada. Water Hg concentrations (total Hg) are shown on a separate y-axis due to differing units (ng L−1 vs. µg kg−1 dry weight) and are not directly comparable to the other matrices.
We used two sample t-tests to assess whether differences in Hg concentrations between pairs of observation types were statistically significant, considering only two groups at a time. Mercury concentrations across all observation types were positively skewed, with most values being low to moderate in concentration and a small number of high values elevating the mean. F-tests were first used to assess the equality of variances before choosing a two-sample t-test. Variances were unequal for all comparisons except between vegetation and soil (p=0.013 globally; p=0.071 within Canadian observations), so Welch's t-test (assuming unequal variances) was used in most cases. Both global and regional analyses revealed statistically significant differences in Hg concentrations among observation types, with the exception noted above. Overall, these results generally support the pattern of lake sediment > soil > vegetation, although, as noted above, this ordering is sensitive to dataset composition. This hierarchy is broadly consistent with observations from non-permafrost regions, suggesting that these concentration patterns may reflect general biogeochemical processes rather than being unique to permafrost-affected environments (Gworek et al., 2016, 2020).
The PermHg database should be useful to a wide audience including researchers and scientists, policymakers, regulators, environmental managers, educators, and the public. Regarding scientific research, this database may be useful for a broad range of studies including environmental fate and transport, contaminant modeling, risk assessment, climate change impacts, remote sensing, earth system modeling, ecotoxicology, and food web studies. Potential applications include but are not limited to calibration and validation of atmospheric and terrestrial models, future global Hg budget studies, identifying global trends and regional hotspots, biogeochemical controls, and assessing human and ecosystem health risks from Hg exposure pathways. The database is also recommended for use in spatial analysis by providing empirical constraints for satellite-based observations and synthesis reviews to support integrated Hg research in permafrost regions. PermHg provides a baseline for future observations and for tracking Hg levels and trends over time. It can also serve as a valuable guide for research teams working in Arctic regions, helping identify where new measurements could have the most impact and inform future field collection efforts.
Outside of the scientific research community, this database can help assess whether Hg concentrations exceed regional regulatory limits or advisories and support compliance with international agreements like the Minamata Convention on Mercury. PermHg may aid in identifying contaminated sites or regions needing additional intervention or monitoring and help guide additional sampling or mitigation based on spatial and observation type gaps. The database may also support baseline environmental studies for infrastructure development or resource extraction. We hope this database will serve the public interest through real-world examples of pollutant pathways and highlight global and local Hg concerns, especially in Arctic or Indigenous communities where some country foods are at risk of elevated Hg concentrations (AMAP, 2021).
Despite these broad applications, several limitations should be considered when using the database. These include uneven spatial and temporal coverage, with sampling efforts concentrated in certain regions (e.g., Canada and the Western Hemisphere) and time periods, leaving notable gaps in underrepresented areas such as Russia or China. Temporal coverage of observations is sparse before the 1990s, and some observation types include extended gaps in coverage (e.g., 3–5 years). A significant portion of the measurements lack reported uncertainty or quality assurance information, limiting the ability to assess data precision and comparability across studies. Variation in sampling methods, analytical techniques, temporal heterogeneity in sampling period (e.g., day, month, season), and detection limits may also contribute to inconsistencies and should be accounted for when interpreting or modeling Hg in permafrost regions.
The PermHg database is best suited for large-scale synthesis, model calibration and evaluation, and identification of broad spatial patterns in Hg distribution across permafrost regions. It may be less suitable for analyses requiring balanced representation across environmental media (e.g., direct comparisons among soil, vegetation, and aquatic systems), fine-scale process studies, or site-specific assessments of Hg cycling. In particular, the dominance of lake sediment observations and geographic clustering of data may limit its applicability for tightly coupled vegetation–soil interactions, or studies requiring co-located multi-compartment measurements. Users are therefore encouraged to subset the data and evaluate representativeness relative to their specific research question. Future database development could also incorporate additional Hg characterization metrics, including Hg speciation, organic versus inorganic fractions, bioavailable Hg pools, and stable isotope measurements where available, to support more process-based investigations of Hg cycling in permafrost systems.
To support long-term growth and community engagement, the database is maintained as an open, version-controlled database with permanent archiving and community contribution mechanisms (see Sect. 6). A contribution guide provides instructions for submitting new data and ensuring consistent quality control. Ongoing oversight could be coordinated through a lightweight advisory mechanism, potentially under the International Permafrost Association or Arctic Monitoring and Assessment Programme, to maintain data quality and guide updates. By facilitating community-driven expansion in a structured, open-access format, the PermHg database can contribute to international Hg monitoring efforts, including supporting effectiveness evaluation under the Minamata Convention.
In alignment with open science principles, the PermHg dataset and its accompanying documentation are hosted on GitHub (https://github.com/IGE-mercury/PermHg, last access: 29 June 2026) and archived on Zenodo under the concept DOI https://doi.org/10.5281/zenodo.18300989, which links all released versions of the dataset (Olson et al., 2026a). The specific version used and described in this manuscript is archived as https://doi.org/10.5281/zenodo.18483492 (Olson et al., 2026b). Users are encouraged to cite both this data paper and the appropriate Zenodo DOI when using the dataset.
GitHub serves as the platform for community contributions and version control, with updates tracked and periodic releases archived on Zenodo under unique DOIs to ensure reproducibility and long-term accessibility. Contributions of new data can be submitted through the repository workflow described in the project documentation on GitHub or via email (permhg@univ-grenoble-alpes.fr). Long-term stewardship of the database is maintained by the authors, with ongoing updates supported through community contributions and collaborative oversight (Sect. 5).
The database includes a wide range of metadata fields that allow users to filter observations based on data completeness and quality. Key attributes such as geographic coordinates, sampling date, laboratory information, and analytical uncertainty are available for many records, although completeness varies by observation type (see metadata documentation). For example, soil-specific variables such as horizon and organic carbon content are included where reported, while water and vegetation datasets include additional parameters relevant to those systems. Users are therefore encouraged to subset the dataset based on the availability of required metadata for their specific application.
A subset of the soil permafrost mercury observations included in the PermHg compilation (n=1752 records) originates from a curated permafrost mercury database hosted by the Bolin Centre for Climate Research. These data are archived separately and will be cited via a dedicated digital object identifier (https://doi.org/10.17043/azaroff-2026-permafrost-mercury-1, Azaroff et al., 2026).
This study compiles one of the most comprehensive publicly available database of Hg concentrations in permafrost-affected environments to date. PermHg addresses a longstanding data gap of Hg concentrations in Arctic and sub-Arctic regions, allowing the opportunity to analyze spatial patterns, assess climate change impacts, and model biogeochemical cycling at regional to global scales. This database can inform monitoring programs, support regulatory frameworks like the Minamata Convention, and guide international efforts to mitigate Hg exposure in northern communities.
The development of this database was made possible through collaborative contributions from a broad scientific community and is intended to support researchers, decision makers, and the public. Its standardized format supports integration into Earth system models, remote sensing products, and other geospatial datasets to track and predict Hg behavior in response to environmental change. This database provides a critical foundation for future integrated Hg research across high-latitude ecosystems.
The database is archived and accessible through a GitHub repository linked to Zenodo (concept https://doi.org/10.5281/zenodo.18300989), supporting continued development, citation, and reuse (Olson et al., 2026a). While current data coverage is uneven, PermHg highlights key areas where future field sampling and monitoring could have the greatest impact, including Russia and China. The incorporation of additional soil, vegetation, and water observations will also be essential to providing a more balanced database across observation types. As permafrost regions continue to warm, this database lays the foundation for more interdisciplinary investigations of Hg cycling and implications to human and ecosystem health.
CLO, KS, AA, LT, and DO led the conceptualization of the study. CLO prepared the original draft of the manuscript. All authors contributed data to the PermHg database and participated in data curation and quality control. CLO and KS acquired financial support for the project. EJ, CLO, and HA contributed to database curation, including preparation of metadata and uploading data products to GitHub and Zenodo. All authors reviewed and edited the manuscript and approved the final version.
The contact author has declared that none of the authors has any competing interests.
Publisher's note: Copernicus Publications remains neutral with regard to jurisdictional claims made in the text, published maps, institutional affiliations, or any other geographical representation in this paper. The authors bear the ultimate responsibility for providing appropriate place names. Views expressed in the text are those of the authors and do not necessarily reflect the views of the publisher.
The authors used ChatGPT (OpenAI, GPT-5-mini) to assist with language editing and clarity of the manuscript. All scientific content, interpretations, and data were authored and verified by the authors.
Financial support for this work was provided by the International Permafrost Association Action Group Award in 2024 (https://www.permafrost.org/group/permhg-a-global-database-of-mercury-concentrations-in-permafrost-and-active-layer-soils/, last access: 29 June 2026). LS, EJ, and HA received funding from the ANR ATOX project (ANR-24-CE01-7616). GH acknowledges funding support from the Nunataryuk and ILLUQ projects under the European Union's Horizon Europe Research and Innovation Programme and the Swedish Research Council VR (grant no. 2022-04839).
This paper was edited by Dalei Hao and reviewed by two anonymous referees.
AMAP: AMAP Assessment 2021: Mercury in the Arctic, Arctic Monitoring and Assessment Programme (AMAP), Tromsø, Norway, x+240 pp., 2021.
Azaroff, A., Thompson, L., Haugk, C., Arp, P., Douglas, T., Fahnestock, F., Hugelius, G., Korosi, J., Nasr, M., Natalie, S., Olefeldt, D., Olson, C., Schaefer, K., Saint Pierre, K., Shakil, S., Sunderland, E., Zolkos, S., and Jonsson, S.: Arctic permafrost soil mercury-carbon synthesis dataset, 2004–2025, Dataset version 1, Bolin Centre Database [data set], https://doi.org/10.17043/azaroff-2026-permafrost-mercury-1, 2026.
Basu, N., Abass, K., Dietz, R., Krümmel, E., Rautio, A., and Weihe, P.: The impact of mercury contamination on human health in the Arctic: A state of the science review, Sci. Total Environ., 831, 154793, https://doi.org/10.1016/j.scitotenv.2022.154793, 2022.
Chételat, J., McKinney, M. A., Amyot, M., Dastoor, A., Douglas, T. A., Heimbürger-Boavida, L.-E., Kirk, J., Kahilainen, K. K., Outridge, P. M., Pelletier, N., Skov, H., St. Pierre, K., Vuorenmaa, J., and Wang, F.: Climate change and mercury in the Arctic: Abiotic interactions, Sci. Total Environ., 824, 153715, https://doi.org/10.1016/j.scitotenv.2022.153715, 2022.
Dastoor, A., Angot, H., Bieser, J., Christensen, J. H., Douglas, T. A., Heimbürger-Boavida, L.-E., Jiskra, M., Mason, R. P., McLagan, D. S., Obrist, D., Outridge, P. M., Petrova, M. V., Ryjkov, A., St. Pierre, K. A., Schartup, A. T., Soerensen, A. L., Toyota, K., Travnikov, O., Wilson, S. J., and Zdanowicz, C.: Arctic mercury cycling, Nat. Rev. Earth Environ., 3, 270–286, https://doi.org/10.1038/s43017-022-00269-w, 2022.
Fabre, C., Sonke, J. E., Tananaev, N., and Teisserenc, R.: Organic carbon and mercury exports from pan-Arctic rivers in a thawing permafrost context – A review, Sci. Total Environ., 954, 176713, https://doi.org/10.1016/j.scitotenv.2024.176713, 2024.
Fitzgerald, W. F. and Lamborg, C. H.: 11.4 – Geochemistry of Mercury in the Environment in: Treatise on Geochemistry, Elsevier Ltd., 91–129, https://doi.org/10.1016/B978-0-08-095975-7.00904-9, 2014.
Gartler, S., Scheer, J., Meyer, A., Abass, K., Bartsch, A., Doloisio, N., Falardeau, J., Hugelius, G., Irrgang, A., Haukur Ingimundarson, J., Jungsberg, L., Lantuit, H., Nymand Larsen, J., Lodi, R., Martin, V. S., Mercer, L., Nielsen, D., Overduin, P., Povoroznyuk, O., Rautio, A., Schweitzer, P., Speetjens, N. J., Tomaškovičová, S., Timlin, U., Vanderlinden, J.-P., Vonk, J., Westerveld, L., and Ingeman-Nielsen, T.: A transdisciplinary, comparative analysis reveals key risks from Arctic permafrost thaw, Commun. Earth Environ., 6, 21, https://doi.org/10.1038/s43247-024-01883-w, 2025.
Giest, F. P., Jenrich, M., Grosse, G., Jones, B. M., Mangelsdorf, K., Windirsch, T., and Strauss, J.: Organic carbon, mercury, and sediment characteristics along a land–shore transect in Arctic Alaska, Biogeosciences, 22, 2871–2887, https://doi.org/10.5194/bg-22-2871-2025, 2025.
Gruber, S.: Derivation and analysis of a high-resolution estimate of global permafrost zonation, The Cryosphere, 6, 221–233, https://doi.org/10.5194/tc-6-221-2012, 2012.
Gworek, B., Bemowska-Kalabun, O., Kijenska, M., and Wrzosek-Jakubowska, J.: Mercury in Marine and Oceanic Waters – a Review, Water Air Soil Pollut., 227, https://doi.org/10.1007/s11270-016-3060-3, 2016.
Gworek, B., Dmuchowski, W., and Baczewska-Dąbrowska, A. H.: Mercury in the terrestrial environment: a review, Environ. Sci. Eur., 32, 128, https://doi.org/10.1186/s12302-020-00401-x, 2020.
Horsburgh, J. S., Tarboton, D. G., Piasecki, M., Maidment, D. R., Zaslavsky, I., Valentine, D., and Whitenack, T.: An integrated system for publishing environmental observations data, Environ. Modell. Softw., 24, 879–888, https://doi.org/10.1016/j.envsoft.2009.01.002, 2009.
Jonsson, S., Mastromonaco, M. N., Wang, F., Bravo, A. G., Cairns, W. R. L., Chételat, J., Douglas, T. A., Lescord, G., Ukonmaanaho, L., and Heimbürger-Boavida, L.-E.: Arctic methylmercury cycling, Sci. Total Environ., 850, 157445, https://doi.org/10.1016/j.scitotenv.2022.157445, 2022.
Kang, H., Liu, X., Guo, J., Zhang, Q., Wang, Y., Huang, J., Xu, G., Wu, G., Ge, W., and Kang, S.: Long-term mercury variations in tree rings of the permafrost forest, northeastern China, Sci. China Earth Sci., 65, 1328–1338, https://doi.org/10.1007/s11430-021-9886-1, 2022.
Lim, A. G., Jiskra, M., Sonke, J. E., Loiko, S. V., Kosykh, N., and Pokrovsky, O. S.: A revised pan-Arctic permafrost soil Hg pool based on Western Siberian peat Hg and carbon observations, Biogeosciences, 17, 3083–3097, https://doi.org/10.5194/bg-17-3083-2020, 2020.
Lu, M., Wang, X., Feng, X., and Luo, J.: Spatial distribution and source/ sink characteristic of mercury in the water samples from the Mt. Gongga area in the Tibetan Plateau, Huanjing Huaxue-Environmental Chemistry, 35, 1549–1556, https://doi.org/10.7524/j.issn.0254-6108.2016.08.2015122301, 2016.
MacMillan, G. A., Girard, C., Chételat, J., Laurion, I., and Amyot, M.: High Methylmercury in Arctic and Subarctic Ponds is Related to Nutrient Levels in the Warming Eastern Canadian Arctic, Environ. Sci. Technol., 49, 7743–7753, https://doi.org/10.1021/acs.est.5b00763, 2015.
Obrist, D., Agnan, Y., Jiskra, M., Olson, C. L., Colegrove, D. P., Hueber, J., Moore, C. W., Sonke, J. E., and Helmig, D.: Tundra uptake of atmospheric elemental mercury drives Arctic mercury pollution, Nature, 547, 201–204, https://doi.org/10.1038/nature22997, 2017.
Obu, J., Westermann, S., Bartsch, A., Berdnikov, N., Christiansen, H., Dashtseren, A., Delaloye, R., Elberling, B., Etzelmüller, B., Kholodov, A., Khomutov, A., Kääb, A., Leibman, M., Lewkowicz, A., Panda, S., Romanovsky, V., Way, R., Westergaard-Nielsen, A., Wu, T., Yamkhin, J., and Zou, D.: Northern Hemisphere permafrost map based on TTOP modelling for 2000–2016 at 1 km2 scale, Earth-Sci. Rev., 193, 299–316, https://doi.org/10.1016/j.earscirev.2019.04.023, 2019.
Olson, C. I., Geyman, B., Thackray, C., Krabbenhoft, D., Tate, M., Sunderland, E., and Driscoll, C.: Mercury in soils of the conterminous United States: patterns and pools, Environ. Res. Lett., 17, https://doi.org/10.1088/1748-9326/ac79c2, 2022.
Olson, C. L., Jiskra, M., Biester, H., Chow, J., and Obrist, D.: Mercury in Active-Layer Tundra Soils of Alaska: Concentrations, Pools, Origins, and Spatial Distribution, Global Biogeochem. Cy., 32, 1058–1073, https://doi.org/10.1029/2017GB005840, 2018.
Olson, C. L., Jiskra, M., Sonke, J. E., and Obrist, D.: Mercury in tundra vegetation of Alaska: Spatial and temporal dynamics and stable isotope patterns, Sci. Total Environ., 1502–1512, https://doi.org/10.1016/j.earscirev.2019.04.023, 2019.
Olson, C. L., Schaefer, K., Azaroff, A., Angot, H., Bandara, S., Douglas, T. A., Elberling, B., Fahnestock, M. F., Feng, X., Haugk, C., Hugelius, G., Jahangir, E., Jonsson, S., Kang, S., Kirkwood, A., Korosi, J., Lehnherr, I., Lim, A., Manasypov, R., Moskovchenko, D., Nasr, M., Obrist, D., Olefeldt, D., Olson, C. I., Pokrovsky, O., Sereni, L., Shakil, S., Smith, M. I., Søndergaard, J., Sonke, J., Staniszewska, K., Strauss, J., St. Pierre, K., Thompson, L., Yurtaev, A., Zhang, Y., and Zolkos, S.: A Consolidated Database of Mercury Observations for Permafrost Regions, Zenodo [data set], https://doi.org/10.5281/zenodo.18300989, 2026a.
Olson, C. L., Schaefer, K., Azaroff, A., Angot, H., Bandara, S., Douglas, T. A., Elberling, B., Fahnestock, M. F., Feng, X., Haugk, C., Hugelius, G., Jahangir, E., Jonsson, S., Kang, S., Kirkwood, A., Korosi, J., Lehnherr, I., Lim, A., Manasypov, R., Moskovchenko, D., Nasr, M., Obrist, D., Olefeldt, D., Olson, C. I., Pokrovsky, O., Sereni, L., Shakil, S., Smith, M. I., Søndergaard, J., Sonke, J., Staniszewska, K., Strauss, J., St. Pierre, K., Thompson, L., Yurtaev, A., Zhang, Y., and Zolkos, S.: A Consolidated Database of Mercury Observations for Permafrost Regions (V1.0), Zenodo [data set], https://doi.org/10.5281/zenodo.18483492, 2026b.
Outridge, P. M., Mason, R. P., Wang, F., Guerrero, S., and Heimbürger-Boavida, L. E.: Updated Global and Oceanic Mercury Budgets for the United Nations Global Mercury Assessment 2018, Environ. Sci. Technol., 52, 11466–11477, https://doi.org/10.1021/acs.est.8b01246, 2018.
Schaefer, K., Elshorbany, Y., Jafarov, E., Schuster, P. F., Striegl, R. G., Wickland, K. P., and Sunderland, E. M.: Potential impacts of mercury released from thawing permafrost, Nat. Commun., 11, 4650, https://doi.org/10.1038/s41467-020-18398-5, 2020.
Schuster, P. F., Schaefer, K. M., Aiken, G. R., Antweiler, R. C., Dewild, J. F., Gryziec, J. D., Gusmeroli, A., Hugelius, G., Jafarov, E., Krabbenhoft, D. P., Liu, L., Herman-Mercer, N., Mu, C., Roth, D. A., Schaefer, T., Striegl, R. G., Wickland, K. P., and Zhang, T.: Permafrost Stores a Globally Significant Amount of Mercury, Geophys. Res. Lett., 45, 1463–1471, https://doi.org/10.1002/2017GL075571, 2018.
Sonke, J., Teisserenc, R., Heimbürger-Boavida, L., Petrova, M., Marusczak, N., Le Dantec, T., Chupakov, A., Li, C., Thackray, C., Sunderland, E., Tananaev, N., and Pokrovsky, O.: Eurasian river spring flood observations support net Arctic Ocean mercury export to the atmosphere and Atlantic Ocean, P. Natl. Acad. Sci. USA, 115, E11586–E11594, https://doi.org/10.1073/pnas.1811957115, 2018.
Sonke, J., Angot, H., Zhang, Y., Poulain, A., Björn, E., and Schartup, A.: Global change effects on biogeochemical mercury cycling, Ambio, https://doi.org/10.1007/s13280-023-01855-y, 2023.
St. Pierre, K. A., Zolkos, S., Shakil, S., Tank, S. E., St. Louis, V. L., and Kokelj, S. V.: Unprecedented Increases in Total and Methyl Mercury Concentrations Downstream of Retrogressive Thaw Slumps in the Western Canadian Arctic, Environ. Sci. Technol., 52, 14099–14109, https://doi.org/10.1021/acs.est.8b05348, 2018.
Thompson, L. M., Shewan, R., Mangal, V., Harris, L. I., Cheng, C. H., Braga, L. P. P., Kolmakova, O., Tanentzap, A. J., Knorr, K. H., Kuhn, M. A., Haugk, C., Azaroff, A., Jonsson, S., St. Louis, V. L., Lehnherr, I., Quinton, W. L., Sonnentag, O., and Olefeldt, D.: Production of Methylmercury in Peatlands Following Permafrost Thaw Increases along a Trophic Gradient, Environ. Sci. Technol., 59, 19457–19467, https://doi.org/10.1021/acs.est.5c04510, 2025.
Tian, S., Li, D., Zhang, T., McClelland, J. W., Overeem, I., Lane, S. N., Spencer, R. G. M., Wohl, E., Sha, A., Zhao, Y., Miao, C., Ning, M., Yuan, L., and Ni, J.: Increasing river sediment concentration and flux across the pan-Arctic, Nat. Geosci., 1–8, https://doi.org/10.1038/s41561-026-01960-z, 2026.
Varty, S., Lehnherr, I., St. Pierre, K., Kirk, J., and Wisniewski, V.: Methylmercury Transport and Fate Shows Strong Seasonal and Spatial Variability along a High Arctic Freshwater Hydrologic Continuum, Environ. Sci. Technol., 55, 331–340, https://doi.org/10.1021/acs.est.0c05051, 2021.
Virkkala, A.-M., Natali, S. M., Rogers, B. M., Watts, J. D., Savage, K., Connon, S. J., Mauritz, M., Schuur, E. A. G., Peter, D., Minions, C., Nojeim, J., Commane, R., Emmerton, C. A., Goeckede, M., Helbig, M., Holl, D., Iwata, H., Kobayashi, H., Kolari, P., López-Blanco, E., Marushchak, M. E., Mastepanov, M., Merbold, L., Parmentier, F.-J. W., Peichl, M., Sachs, T., Sonnentag, O., Ueyama, M., Voigt, C., Aurela, M., Boike, J., Celis, G., Chae, N., Christensen, T. R., Bret-Harte, M. S., Dengel, S., Dolman, H., Edgar, C. W., Elberling, B., Euskirchen, E., Grelle, A., Hatakka, J., Humphreys, E., Järveoja, J., Kotani, A., Kutzbach, L., Laurila, T., Lohila, A., Mammarella, I., Matsuura, Y., Meyer, G., Nilsson, M. B., Oberbauer, S. F., Park, S.-J., Petrov, R., Prokushkin, A. S., Schulze, C., St. Louis, V. L., Tuittila, E.-S., Tuovinen, J.-P., Quinton, W., Varlagin, A., Zona, D., and Zyryanov, V. I.: The ABCflux database: Arctic–boreal CO2 flux observations and ancillary information aggregated to monthly time steps across terrestrial ecosystems, Earth Syst. Sci. Data, 14, 179–208, https://doi.org/10.5194/essd-14-179-2022, 2022.
Wohlgemuth, L., Rautio, P., Ahrends, B., Russ, A., Vesterdal, L., Waldner, P., Timmermann, V., Eickenscheidt, N., Fürst, A., Greve, M., Roskams, P., Thimonier, A., Nicolas, M., Kowalska, A., Ingerslev, M., Merilä, P., Benham, S., Iacoban, C., Hoch, G., Alewell, C., and Jiskra, M.: Physiological and climate controls on foliar mercury uptake by European tree species, Biogeosciences, 19, 1335–1353, https://doi.org/10.5194/bg-19-1335-2022, 2022.
Zhang, L., Qian, J.-L., and Planas, D.: Mercury concentration in tree rings of black spruce (Picea mariana Mill. B.S.P.) in boreal Quebec, Canada, Water Air Soil Pollut., 81, 163–173, https://doi.org/10.1007/BF00477263, 1995.
Zhang, Y., Zhang, P., Song, Z., Huang, S., Yuan, T., Wu, P., Shah, V., Liu, M., Chen, L., Wang, X., Zhou, J., and Agnan, Y.: An updated global mercury budget from a coupled atmosphere-land-ocean model: 40 % more re-emissions buffer the effect of primary emission reductions, One Earth, 6, 316–325, https://doi.org/10.1016/j.oneear.2023.02.004, 2023.
Zolkos, S., Krabbenhoft, D. P., Suslova, A., Tank, S. E., McClelland, J. W., Spencer, R. G. M., Shiklomanov, A., Zhulidov, A. V., Gurtovaya, T., Zimov, N., Zimov, S., Mutter, E. A., Kutny, L., Amos, E., and Holmes, R. M.: Mercury Export from Arctic Great Rivers, Environ. Sci. Technol., 54, 4140–4148, https://doi.org/10.1021/acs.est.9b07145, 2020.