the Creative Commons Attribution 4.0 License.
the Creative Commons Attribution 4.0 License.
 | 25 Jun 2026
Global Ocean data set of marine aerosol properties
Patricia K. Quinn
Timothy S. Bates
Derek J. Coffman
James E. Johnson
Lucia M. Upchurch
Hanna Best
NOAA's Pacific Marine Environmental Laboratory (PMEL) has made measurements of aerosol chemical, microphysical, optical, and cloud nucleating properties onboard research cruises since 1991. The twenty-five cruises have covered all of the world's oceans – the Pacific, Atlantic, Indian, Arctic, and Southern. The result is the most comprehensive, publicly available database of aerosol properties in the marine atmosphere to date. The database also contains gas-phase species (O3, SO2), Radon, and dimethylsulfide (DMS), seawater species (DMS, , , and chlorophyll a), and meteorological parameters. Details of the cruises (locations, dates, and objectives), parameters measured, instrumentation used, and data availability are provided here. Also included are PMEL's high-level major findings and past usage of the data by others. The goal of this paper is to promote broader awareness of the database to the atmospheric aerosol in situ measurement, satellite, and modelling communities. Data are publicly available at NOAA's National Centers for Environmental Information (NCEI) data archive (https://www.ncei.noaa.gov/, NOAA, 2025) (see also the list of all data sets in Table 7). Links to the Digital Object Identifiers (DOIs) for each cruise are provided herein.
- Article
(2281 KB) - Full-text XML
- BibTeX
- EndNote


Aerosol particles influence Earth's radiation budget directly by scattering and absorbing incoming solar radiation and indirectly by acting as cloud condensation nuclei (CCN) and impacting cloud properties including reflectivity, lifetime, and spatial extent. The concentration and composition of aerosol particles vary both geographically and temporally, leading to a wide range of local and global climate impacts. Over oceans, aerosol particles have both continental and oceanic sources. Particles emitted from continental sources, including fossil fuel combustion, biomass burning, dust, and biogenic emissions, can be transported hundreds to thousands of kilometers over oceans either in the boundary layer or the free troposphere (FT) (Clarke et al., 2013). Aerosol number and mass concentrations, chemical composition, and optical and cloud-nucleating properties are impacted by transport events and vary with distance from shore (Quinn et al., 2015). The ocean itself is a source of aerosol particles through wave-breaking at the surface and subsequent bubble bursting (De Leeuw et al., 2011). In addition, marine vessel emissions also contribute to the aerosol population over oceans, particularly in coastal regions and major shipping lanes (Corbett et al., 2007). Marine aerosol is defined here as particles in the atmosphere over oceans regardless of origin.
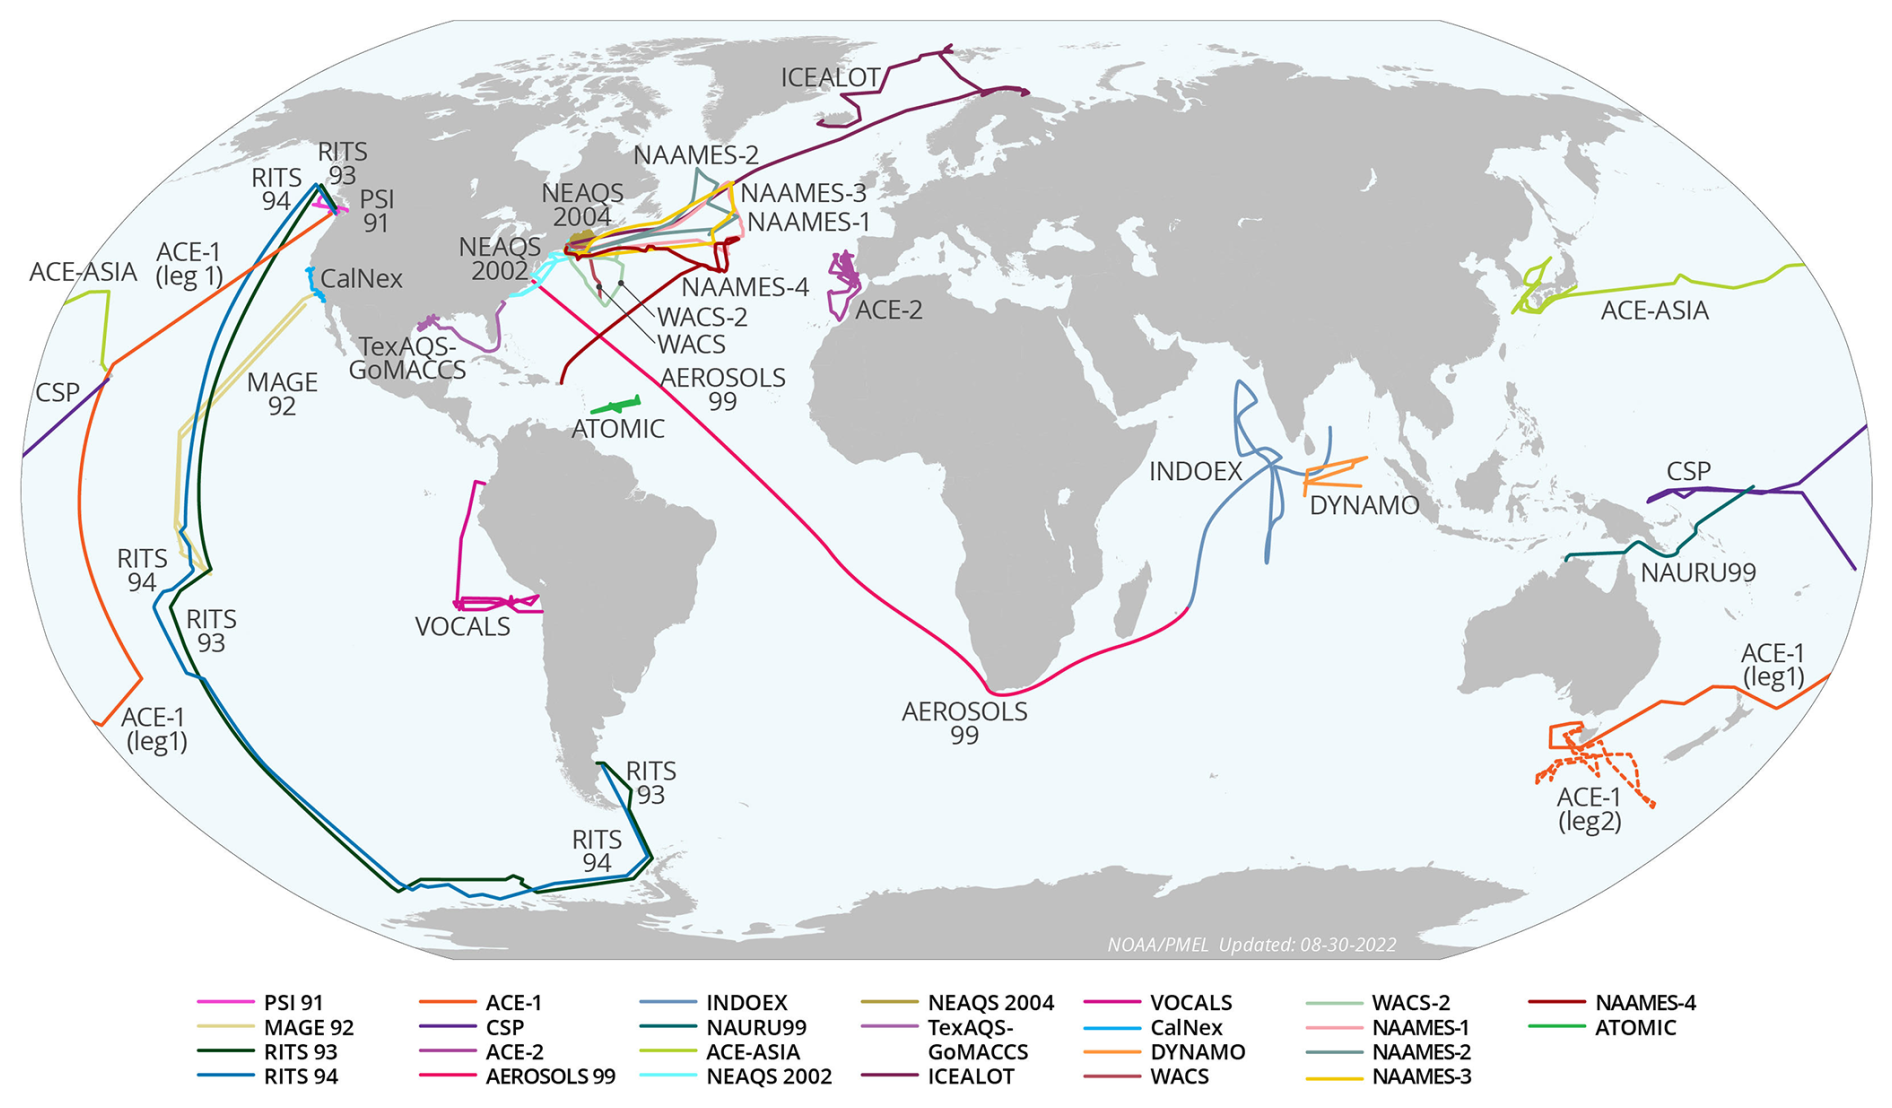
Figure 1Cruise tracks for PMEL cruises between 1991 and 2020.
Observations of aerosol properties in the marine atmosphere are required to improve the accuracy of model simulations of their radiative effects. Satellite observations provide broad spatial and temporal coverage of the atmospheric aerosol burden over the world's oceans and reveal information about seasonally persistent transport from continents. Examples include the transport of African dust westward across the Atlantic every summer (Kaufman et al., 2005) and transport of Asian dust and pollution eastward across the Pacific during the spring (Logan et al., 2010). While satellite observations have the advantage of providing global coverage, in situ observations have the highest level of accuracy available to constrain radiative forcing and reduce uncertainties in forcing estimates (Li et al., 2022). As such, in situ measurements provide detailed information about the processes controlling variability in aerosol properties due to complex particle and gas phase precursor sources, transport pathways, and removal processes.
Cruises conducted since 1991 by PMEL cover all of the world's oceans providing the most comprehensive, publicly available global database to date of marine aerosol microphysical, chemical, optical, and cloud-nucleating properties. The data set is unique in that standardized methods and sampling protocols were employed including particle size cuts at a common relative humidity upstream of instrumentation and particle collection devices. This approach eliminates biases in the data and allows for direct comparison of measured regional properties between cruises. The global nature of the data set makes it well-posed to address current scientific priorities including reducing uncertainties in aerosol radiative forcing and links between ocean biology and climate. The details provided here describing the measurements in depth are intended to increase the usability of the data.
The cruises were process oriented geared toward understanding the effects of formation, emission, atmospheric transformation and removal on aerosol properties. Some of the cruises were conducted during the time of the year when a targeted plume was expected to be most pronounced. For those cruises, the range of reported values most likely is skewed toward higher values that are typical of seasonally maximum plumes. In addition, reported variability in the data are based on a snapshot during the short-lived campaigns. Objectives are described and references are cited to provide context for each cruise.
This paper describes the measurements in detail, the data that are available for each cruise, PMEL's major findings, and data usage by others. The goal is to provide information about data availability and to advance the widespread use of the data to the atmospheric aerosol in situ measurement, satellite, and modelling communities. Section 2 describes the cruises and Sect. 3 describes the methods. PMEL's major findings are summarized in Sect. 4 and data usage by others in Sect. 5. Data availability is described in Sect. 6 and a brief summary is presented in Sect. 7.
Ship tracks of PMEL's cruises between 1991 and 2020 are shown in Fig. 1. A list of the cruises with start and stop dates, departure and arrival ports, location, and relevant references is provided in Table 1. A complete list of instrumentation on each cruise is presented in Sect. 3. Each cruise is briefly described in the following paragraphs.
Table 1PMEL's cruises between 1991 and 2020 with start and stop dates, departure and arrival ports, ocean, and relevant references.
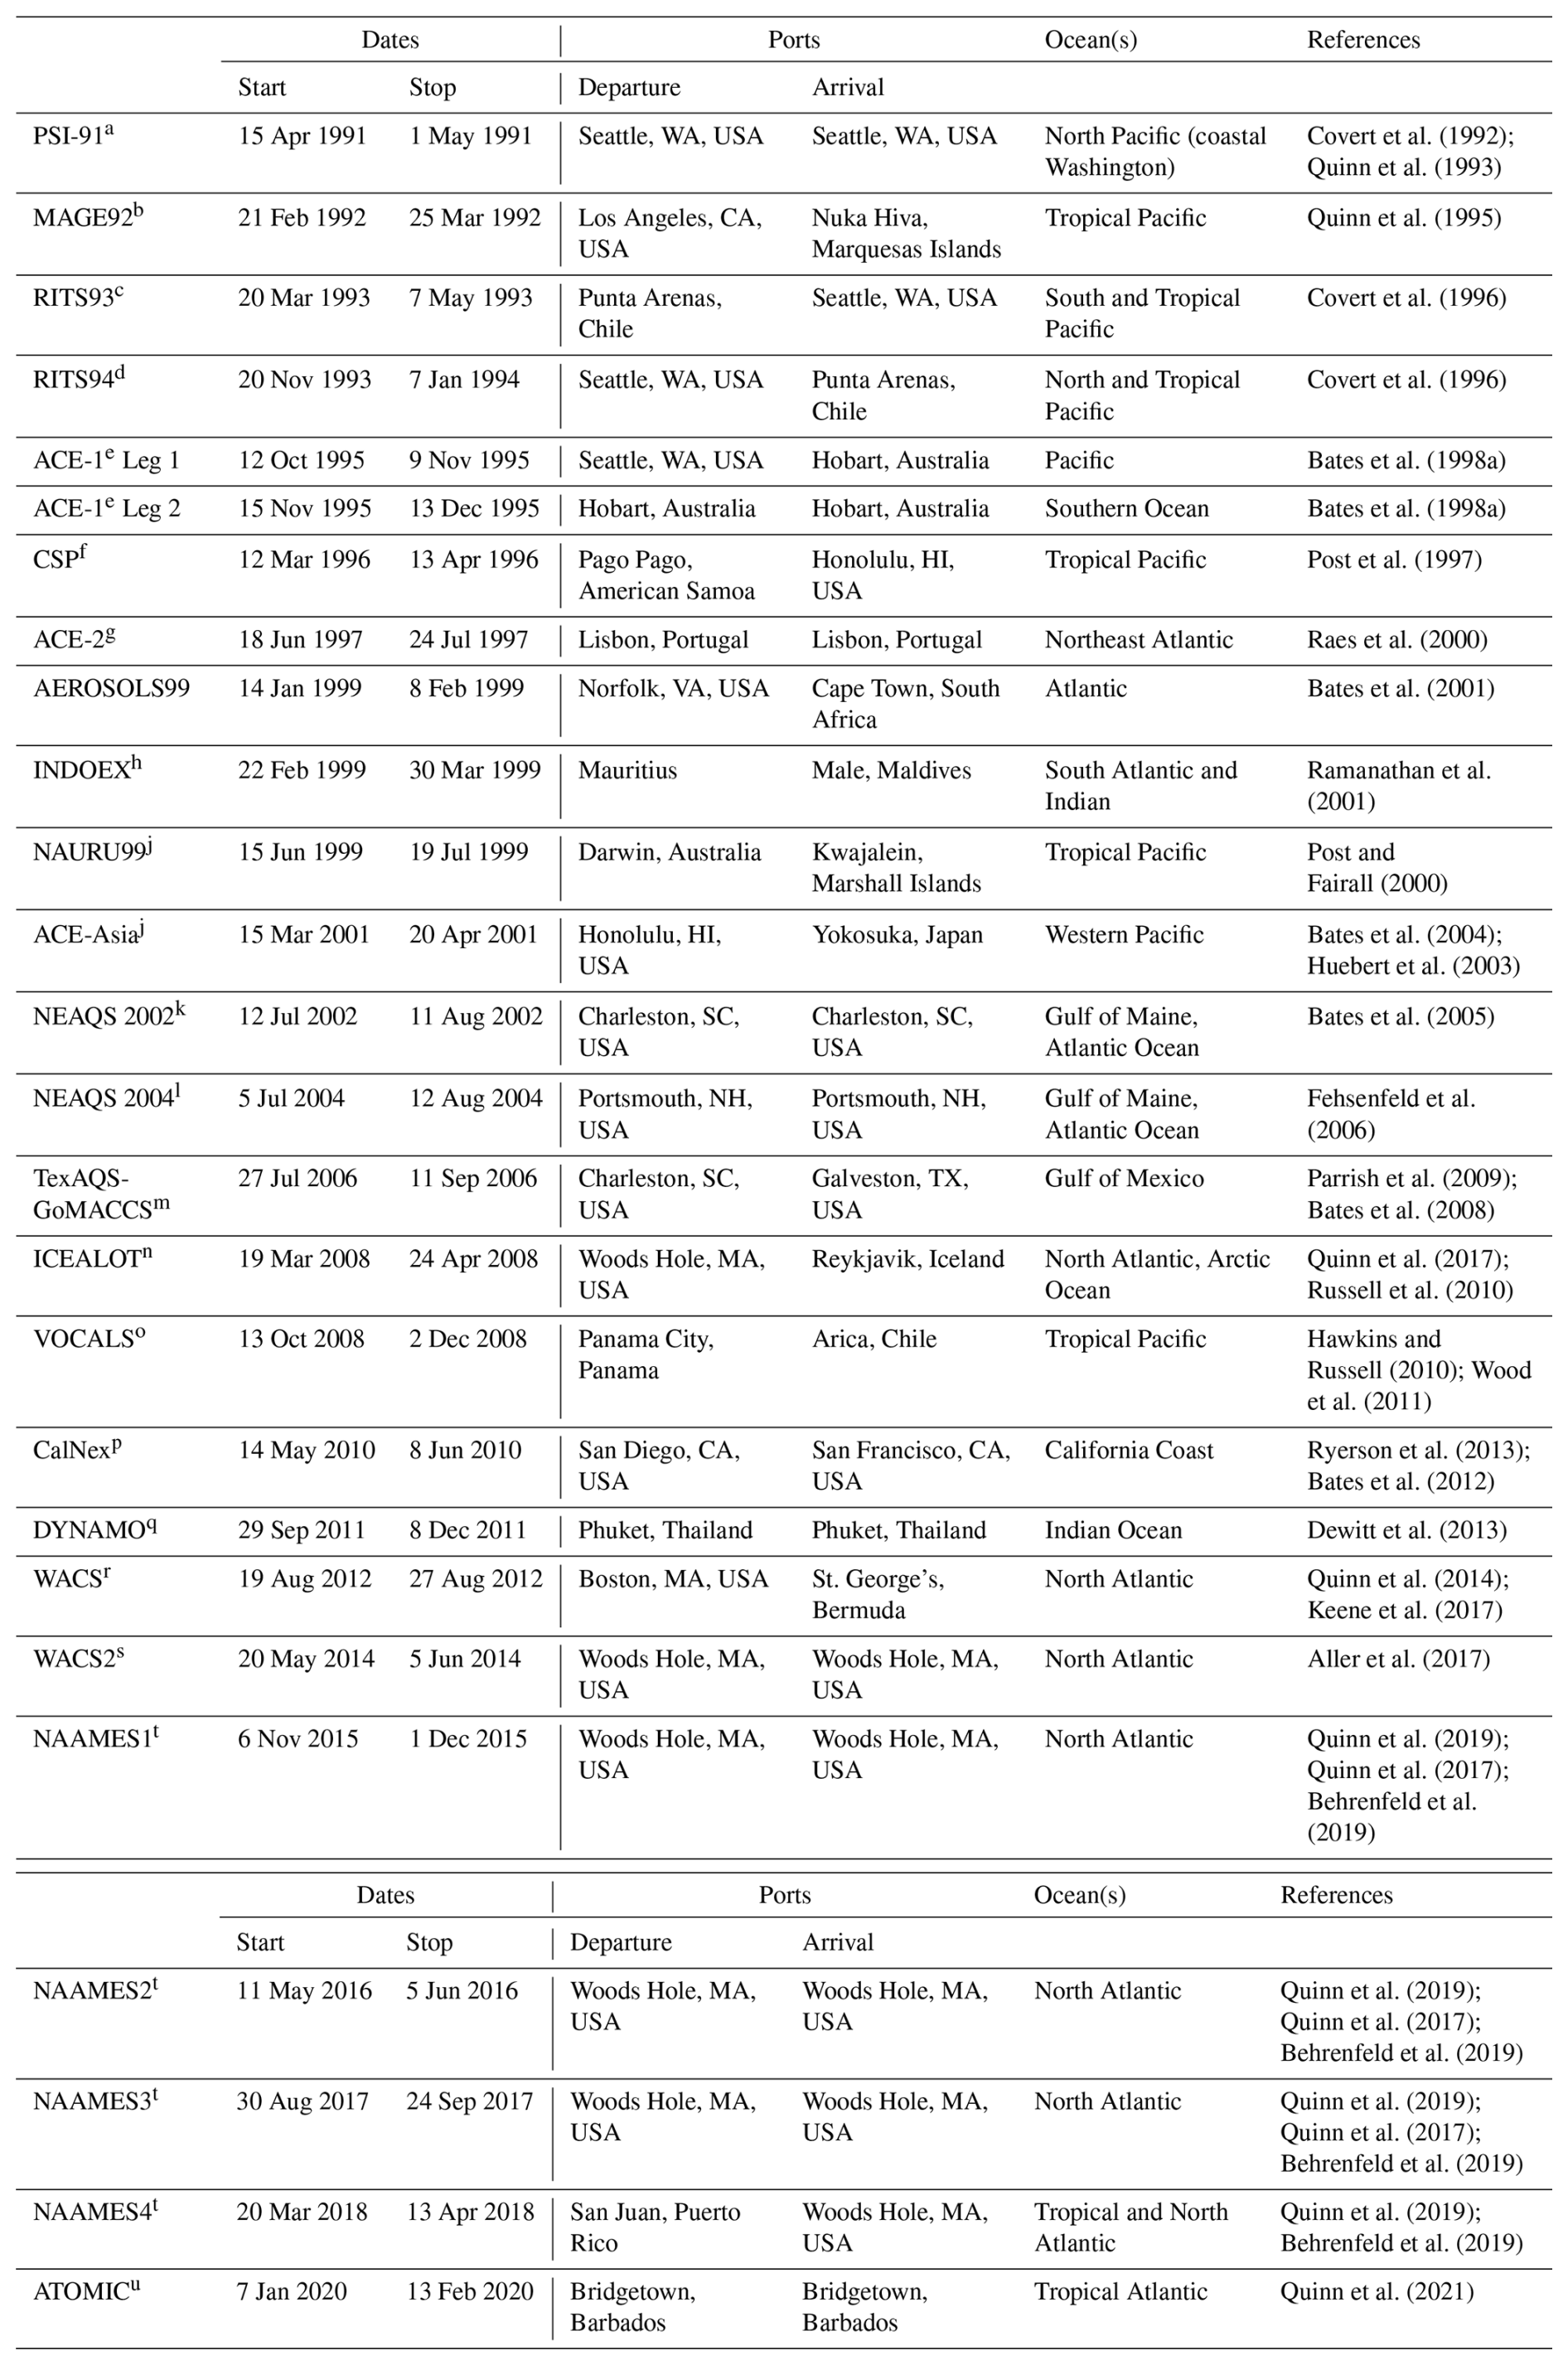
a Pacific Stratus Sulfur Investigation 1991, b Marine Aerosol and Gas Exchange 1992, c Radiatively Important Trace Species 1993, d Radiatively Important Trace Species 1994, e Aerosol Characterization Experiment-1 (https://data.eol.ucar.edu/project/ACE-1, last access: 15 September 2025), f Combined Sensor Program (https://psl.noaa.gov/psd3/air-sea/csp/, last access: 15 September 2025), g Aerosol Characterization Experiment-2, h Indian Ocean Experiment (https://www.eol.ucar.edu/field_projects/indoex, 15 September 2025) , i https://psl.noaa.gov/psd3/air-sea/nauru99/ (last access: 15 September 2025), j Aerosol Characterization Experiment-Asia (https://www.eol.ucar.edu/field_projects/ace-asia, last access: 15 September 2025), k New England Air Quality Study 2002 (https://csl.noaa.gov/projects/neaqs/, last access: 15 September 2025), l New England Air Quality Study and International Consortium for Atmospheric Research on Transport and Transformation 2004 (https://csl.noaa.gov/projects/icartt/, last access: 15 September 2025), m Texas Air Quality Study/Gulf of Mexico Atmospheric Composition and Climate Study (https://csl.noaa.gov/projects/2006/, last access: 15 September 2025), n International Chemistry Experiment in the Arctic Lower Troposphere, o VAMOS Ocean-Cloud-Atmosphere-Land Study (https://www.eol.ucar.edu/field_projects/vocals, last access: 15 September 2025), p California Research at the Nexus of Air Quality and Climate Change (https://csl.noaa.gov/projects/calnex/, last access: 15 September 2025), q Dynamics of the Madden-Julian Oscillation (https://www.eol.ucar.edu/field_projects/dynamo, last access: 15 September 2025), r Western Atlantic Climate Study 2012, s Western Atlantic Climate Study 2014 (https://saga.pmel.noaa.gov/field_WACS2, last access: 15 September 2025), t The North Atlantic Aerosols and Marine Ecosystem Study-1 (https://science.larc.nasa.gov/NAAMES/, last access: 15 September 2025), u Atlantic Tradewind Ocean-Atmosphere Mesoscale Interaction Campaign (https://psl.noaa.gov/atomic/, last access: 15 September 2025).
The Pacific Stratus Sulfur Investigation, PSI-91 is the first cruise reported here. It took place in spring of 1991 in the eastern North Pacific off the coast of Washington state with the NOAA R/V Discoverer leaving from Seattle, WA in mid-April and returning in early May. Measurements focused on the role of DMS oxidation products in new particle production versus particle growth (Quinn et al., 1993; Covert et al., 1992) and the seawater sulfur cycle (Bates et al., 1994).
The Marine Aerosol and Gas Exchange cruise (MAGE92) took place in the tropical Pacific in 1992 with the USC R/V John Vickers leaving from Los Angeles, CA in mid-February, transiting to Nuka Hiva in the Marquesas Islands, and then returning to Los Angeles in late March. Similar to PSI-91, the goals of MAGE92 were to assess the seawater sulfur cycle and processes controlling the atmospheric aerosol particle number size distribution in the marine boundary layer (MBL) (Covert et al., 1996). In addition, instrumentation was augmented to include an integrating nephelometer to measure the aerosol light scattering coefficient at 550 nm (Charlson et al., 1967). The measurements were used to assess variability in aerosol chemical, microphysical, and optical properties relevant to direct radiative forcing (Quinn et al., 1995).
The Radiatively Important Trace Species (RITS) cruises, RITS93 and RITS94, took place between March and May 1993 and November 1993 and January 1994, respectively. During RITS93, the NOAA R/V Surveyor went from Palmer Station, Antarctica to the Gulf of Alaska while RITS94 went in the opposite direction. These cruises extended the measurements made during MAGE92 to the central Pacific between 55° N and 70° S (Quinn et al., 1996; Covert et al., 1996; Anderson et al., 1996).
In 1995, a series of Aerosol Characterization Experiments (ACE) was initiated under the auspices of the International Global Atmospheric Chemistry (IGAC) Project. The overall goal of ACE was to quantify the chemical and physical processes controlling the properties and evolution of aerosol particles relevant to radiative forcing and climate. Each experiment was multi-platform (research ships, aircraft, and ground stations) with international participation. The first Aerosol Characterization Experiment (ACE-1) took place in the Southern Ocean to target aerosol in a remote, minimally polluted marine atmosphere as a reference for future experiments (Bates et al., 1998a). PMEL conducted measurements onboard the NOAA R/V Discoverer during Leg 1 from Seattle, WA, USA to Hobart, Australia and then Leg 2 in the Southern Ocean in and out of Hobart, Australia. ACE-1 extended earlier Pacific measurements to the Southern Ocean and augmented the characterization of optical properties through the addition of a single wavelength (550 nm) Particle Soot Absorption Photometer (PSAP) (Quinn et al., 1998).
Subsequent ACEs were conducted downwind of continents to characterize changes in aerosol properties with advection over the ocean. ACE-2 was conducted in June and July of 1997 over the sub-tropical northeast Atlantic to characterize pollution and dust aerosol as it was advected from Europe and Africa and mixed into the marine atmosphere (Raes et al., 2000). PMEL made measurements onboard the Institute of Biology of the Southern Seas (IBSS) R/V Professor Vodyanitskiy leaving from and returning to Lisbon, Portugal. Background marine, anthropogenic, and dust aerosol were encountered (Bates et al., 2000). Instrumentation was unchanged from that of previous cruises.
The third experiment in the series was the Indian Ocean Experiment (INDOEX) which targeted the Indo-Asian haze during the Northern Hemisphere dry monsoon as it was advected over the Indian Ocean (Ramanathan et al., 2001). PMEL participated onboard the NOAA R/V Ronald H. Brown in a leg which brought the ship from Norfolk, VA to Mauritius during January and February of 1999. This leg was named AEROSOLS99. The second leg, officially INDOEX, took the ship from Mauritius northeast throughout the South Atlantic and Indian Oceans and ended in the Maldives during February and March of 1999. During both legs, marine background, anthropogenic, dust, and biomass burning aerosol were measured (Quinn et al., 2001). Trace element concentrations able to identify and quantify dust were added to the PMEL instrument payload for AEROSOLS99 and INDOEX.
ACE-Asia, the fourth and final of the ACEs, was conducted in March through May of 2001 downwind of eastern Asia to target seasonal outbreaks of Asian dust associated with frontal systems moving to the east through dust-producing regions (Huebert et al., 2003). PMEL sampled onboard the NOAA R/V Ronald H. Brown from mid-March to mid-April in 2001 as the ship transited from Honolulu, HI to the western Pacific and then spent time east of Japan and in the Sea of Japan. Between Honolulu and 3200 km east of Japan, marine air minimally impacted by continental emissions was sampled. West onward from that point, air masses heavily influenced by Asian emissions were sampled (Bates et al., 2004). Measurements of organic carbon (OC) and elemental carbon (EC) were added to the instrument payload for ACE-Asia.
During the ACE years, PMEL participated in two other cruises, the Combined Sensor Program (CSP) in March and April 1996 and NAURU99 in June and July of 1999. CSP took place in the central and tropical western Pacific with the NOAA R/V Discoverer leaving from Pago Pago, American Samoa in mid-March and arriving in Honolulu, HI in mid-April. The overarching goal of CSP was to better understand relationships between atmospheric and oceanic variables that affect radiative balance, including aerosol particles (Post et al., 1997). NAURU99 took place onboard the NOAA R/V Ronald H. Brown in the southwestern Pacific in the vicinity of Nauru Island in Papua New Guinea. NAURU99 had similar scientific goals as CSP and, in addition, was conducted to assess how representative measurements made on the islands of Nauru and Manus were of the surrounding ocean (Post and Fairall, 2000). The ship left Darwin, Australia in mid-June and arrived in Kwajalein in the Marshall Islands in mid-July.
In 2002, a series of air quality and climate field campaigns was initiated by NOAA with other agency and academic partners. These campaigns were designed to determine the atmospheric processes that control the production and distribution of air pollutants that impact air quality and climate in and downwind of several U.S. regions. These campaigns involved, to varying degrees, a combination of shipboard, aircraft, and ground-based measurements. The New England Air Quality Study in 2002 (NEAQS 2002) targeted factors controlling air quality in New England with measurements at a network of ground stations and a ship (Bates et al., 2005). The NOAA R/V Ronald H. Brown departed Charleston, SC in mid-July 2002 and transited northeast up the coast to New York City, Boston, and Acadia National Park in Maine. The ship returned to Charleston in mid-August 2002.
A second NEAQS in 2004 (NEAQS 2004) was conducted in conjunction with the joint North American and European International Consortium for Atmospheric Research on Transport and Transformation (ICARTT). The focus was on emissions from North America and their chemical transformations and removal during transport over the North Atlantic (Fehsenfeld et al., 2006). The NOAA R/V Ronald H. Brown left Portsmouth, NH in early July, made several transits along the coasts of Massachusetts, New Hampshire, and Maine, and across the Gulf of Maine toward Nova Scotia (Quinn et al., 2006). A Quadruple Aerosol Mass Spectrometer (Q-AMS) (Jayne et al., 2000) was added to the PMEL instrument payload for the measurement of nonrefractory (NR) species where NR refers to chemical components that vaporize (<5 s) at the vaporizer temperature of ∼550 °C.
The next in the series of Air Quality – Climate cruises was the Texas Air Quality – Gulf of Mexico Atmospheric Composition and Climate Study (TexAQS/GoMACCS) between July and September in 2006. The goal was to assess the factors that control the formation and transport of air pollutants along the Gulf Coast of south eastern Texas and the impact the resulting species have on the radiative forcing of climate regionally and globally (Parrish et al., 2009). The NOAA R/V Ronald H. Brown left Charleston, SC at the end of July, headed south along the coast of Florida, transited across the Gulf of Mexico, and spent several weeks along the coast of Texas including in the Houston Ship Channel (Bates et al., 2008). The cruise ended mid-September in Galveston, TX. Measurements of the relative humidity dependence of light scattering and cloud condensation nuclei (CCN) concentrations were added to the existing PMEL instrument payload.
The final Air Quality – Climate field campaign was the 2010 California Research at the Nexus of Air Quality and Climate Change (CalNex) study. An emphasis was put on issues that are simultaneously relevant to both air pollution and climate including emission inventories, atmospheric transport and dispersion, atmospheric processing, and aerosol direct and indirect radiative effects (Ryerson et al., 2013). The Woods Hole Oceanographic Institution (WHOI) R/V Atlantis left from San Diego, CA in mid-May 2020, transited northward up the coast of California with incursions into the Ports of Los Angeles, Long Beach, San Francisco, and Oakland, and a trip up the Sacramento River (Bates et al., 2012).
In between TexAQS-GoMACCS and CalNex, PMEL participated in two other cruises. The International Chemistry Experiment in the Arctic Lower Troposphere (ICEALOT) took place as part of the 2008 International Polar Year (Russell et al., 2010). The focus was on the sources, transport, and climate impact of anthropogenic aerosol and gas phase species in an ice-free region of the Arctic. The WHOI R/V Knorr left Woods Hole, MA mid-March, transited across the North Atlantic to the coast of Norway, then northwest to Svalbard, and southwest to Reykjavik, Iceland where the cruise concluded at the end of April.
The VAMOS Ocean-Cloud-Atmosphere-Land Study Regional Experiment (VOCALS), where VAMOS stands for Variability of the American Monsoon Systems, took place in October and November of 2008. VOCALs focused on assessing links between aerosols, clouds and precipitation and their impacts on marine stratocumulus radiative properties and couplings between the upper ocean and lower atmosphere (Wood et al., 2011). The NOAA R/V Ronald H. Brown left Panama City, Panama in mid-October, conducted several transits in the vicinity of 20° S from the coast to 85° W, and ended the cruise in Arica, Chile at the beginning of December (Hawkins et al., 2010).
DYNAMO, the Dynamics of the Madden-Julian Oscillation (MJO) field campaign was conducted to collect in situ observations to advance our understanding of MJO initiation processes and to improve MJO prediction (Yoneyama et al., 2013). PMEL's research focused on the effect of MJO-associated convection anomalies on aerosols in the marine boundary layer (Dewitt et al., 2013). The Scripps Institution of Oceanography R/V Roger Revelle left Phuket, Thailand at the end of September 2011 and transited to the vicinity of 0.1° N and 80.5° E where it was stationed for most of the experiment. The ship returned to Phuket on 8 December.
Between 2012 and 2018, PMEL participated in a series of cruises to investigate the impacts of marine ecosystems on primary sea spray aerosol (SSA) and its cloud-nucleating properties. During each of these cruises a portion of the time was spent generating and sampling nascent primary SSA with Sea Sweep (Bates et al., 2012). The Sea Sweep data are available in the referenced data sets for WACS, WACS-2, and all four NAAMES cruises. These data are not discussed further since the emphasis here is on ambient aerosol. Data from the ambient atmospheric marine aerosol that was sampled when Sea Sweep was not in use are discussed here. The first Western Atlantic Climate Study (WACS) took place in 2012 and focused on the high-chlorophyll, biologically productive region of Georges Bank off the coast of Cape Cod and the low-chlorophyll, oligotrophic Sargasso Sea (Quinn et al., 2014; Kawamura et al., 2017). The NOAA R/V Ronald H. Brown left Boston, MA in mid-August, spent time at the high- and low-chlorophyll stations, and arrived at St. George's Bermuda at the end of August.
The second WACS (WACS2) took place in 2014. The WHOI R/V Knorr left Woods Hole, MA in mid-May, went east to 60° W and south to 33° S stopping for stations at a range of low to high biologically productive surface seawater. Atmospheric sampling took place between stations. The ship arrived back in Woods Hole in the beginning of June (Aller et al., 2017).
PMEL participated in the NASA sponsored North Atlantic Aerosols and Marine Ecosystems Study (NAAMES), a series of field campaigns conducted to assess the seasonal impact of the western subarctic North Atlantic phytoplankton bloom on aerosols and clouds (Behrenfeld et al., 2019). Four cruises, onboard the WHOI R/V Atlantis, took place between November 2015 and April 2018, with each cruise targeting specific seasonal phases of the annual plankton cycle (Quinn et al., 2019). The general cruise track included a transit from Woods Hole, MA to 40° N and 40° W, a northward transit with several stations to 55° N across a range of stages in each plankton seasonal cycle, followed by a return to Woods Hole. The exception was NAAMES-4, which left from San Juan, Puerto Rico and ended in Woods Hole. In seasonal but not chronological order, NAAMES-1 took place in November 2015 targeting the initiation of the phytoplankton blooming phase, NAAMES-4 in March and April 2018 targeting the accumulation phase, NAAMES-2 in May and June targeting the bloom climax, and NAAMES-3 in September 2017 targeting the declining phase of the bloom. To accommodate Sea Sweep sampling, atmospheric sampling of trace elements, NR chemical species, and total aerosol mass was not conducted during any of the NAAMES cruises.
The final cruise in the global data set to date is the Atlantic Tradewind Ocean-Atmosphere Mesoscale Interaction Campaign (ATOMIC) which took place in the tropical North Atlantic east of Barbados in early 2020 (Stevens et al., 2021). The NOAA R/V Ronald H. Brown left Bridgetown, Barbados in early January and spent time between Barbados and the Northwest Tropical Atlantic Station (NTAS) buoy 500 nm to the northeast to gather information on shallow atmospheric convection, the effects of aerosols and clouds on the ocean surface energy budget, and mesoscale oceanic processes (Quinn et al., 2022). Measurements of trace element and total aerosol mass concentrations were reinstated for ATOMIC but concentrations of NR chemical species were not.
Sampling methods evolved between 1991 and 2020 as the number of parameters to be measured increased and the technical capabilities of instrumentation improved. In addition, instruments were added or removed from the PMEL payload depending on the goals of each cruise. Instrumentation and its evolution are described in detail below including the sampling inlet and methods for the measurement of aerosol microphysical, chemical, optical, and cloud-nucleating properties. In addition, measurement methods of gas phase species and surface seawater properties are provided. Parameters measured during each cruise are listed in Table 2 (aerosol microphysical and cloud-nucleating), Table 3 (aerosol chemical composition), Table 4 (aerosol optical), and Table 5 (gas phase and seawater species).
Table 2Microphysical and cloud-nucleating properties measured on each cruise and the instrumentation used.
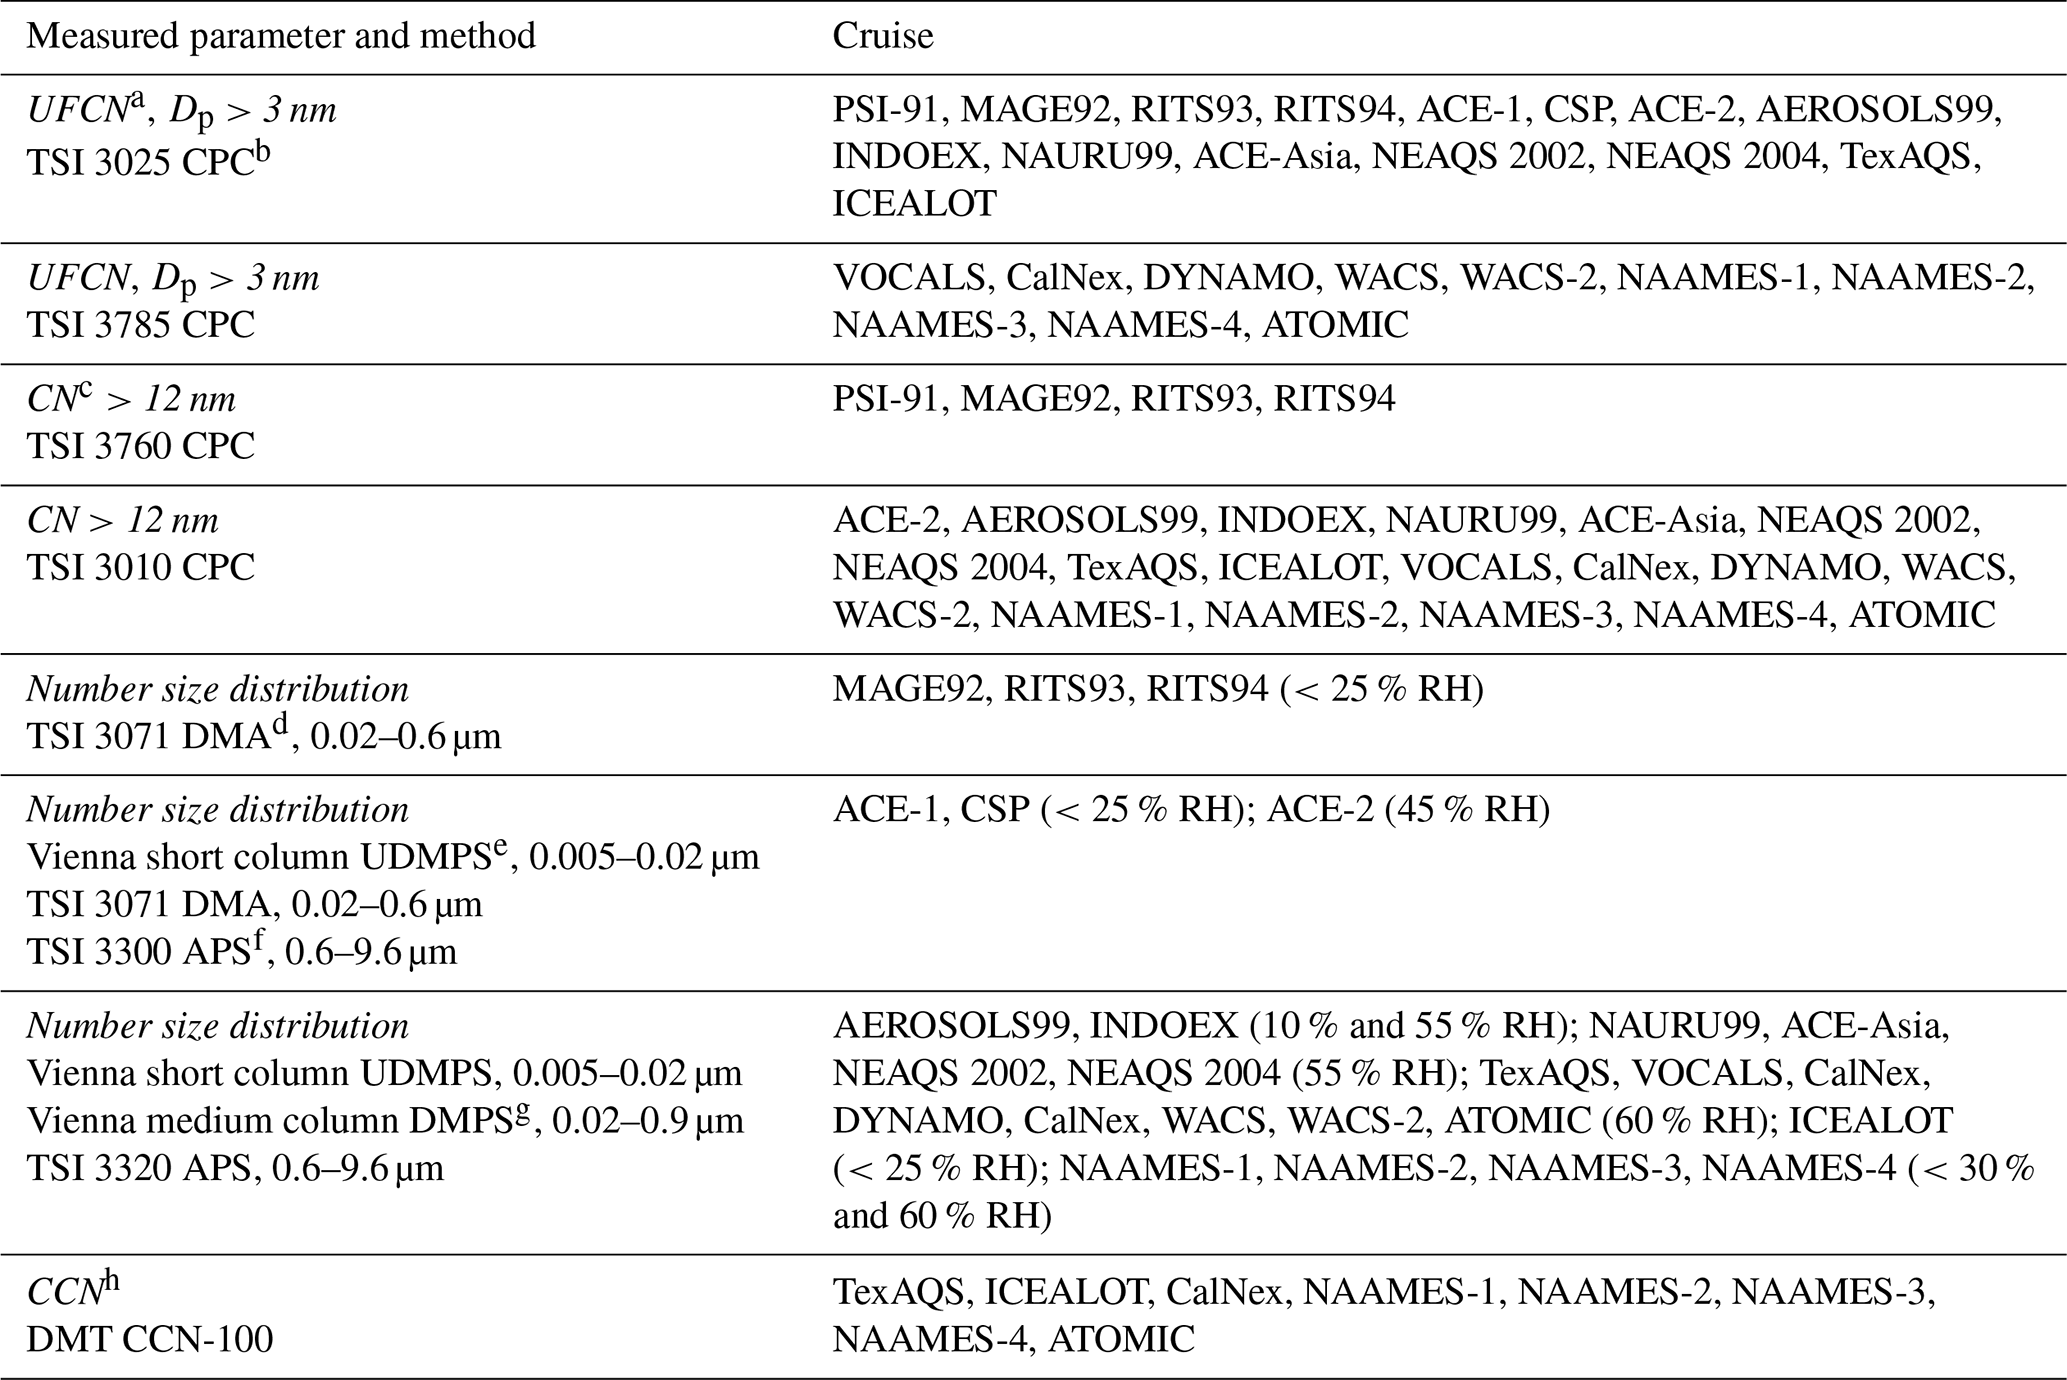
a Ultrafine Condensation Nuclei, b Condensation Particle Counter, c Condensation Nuclei, d Differential Mobility Analyzer, e Ultrafine Differential Mobility Particle Sizer, f Aerodynamic Particle Sizer, g Differential Mobility Particle Sizer, h Cloud Condensation Nuclei.
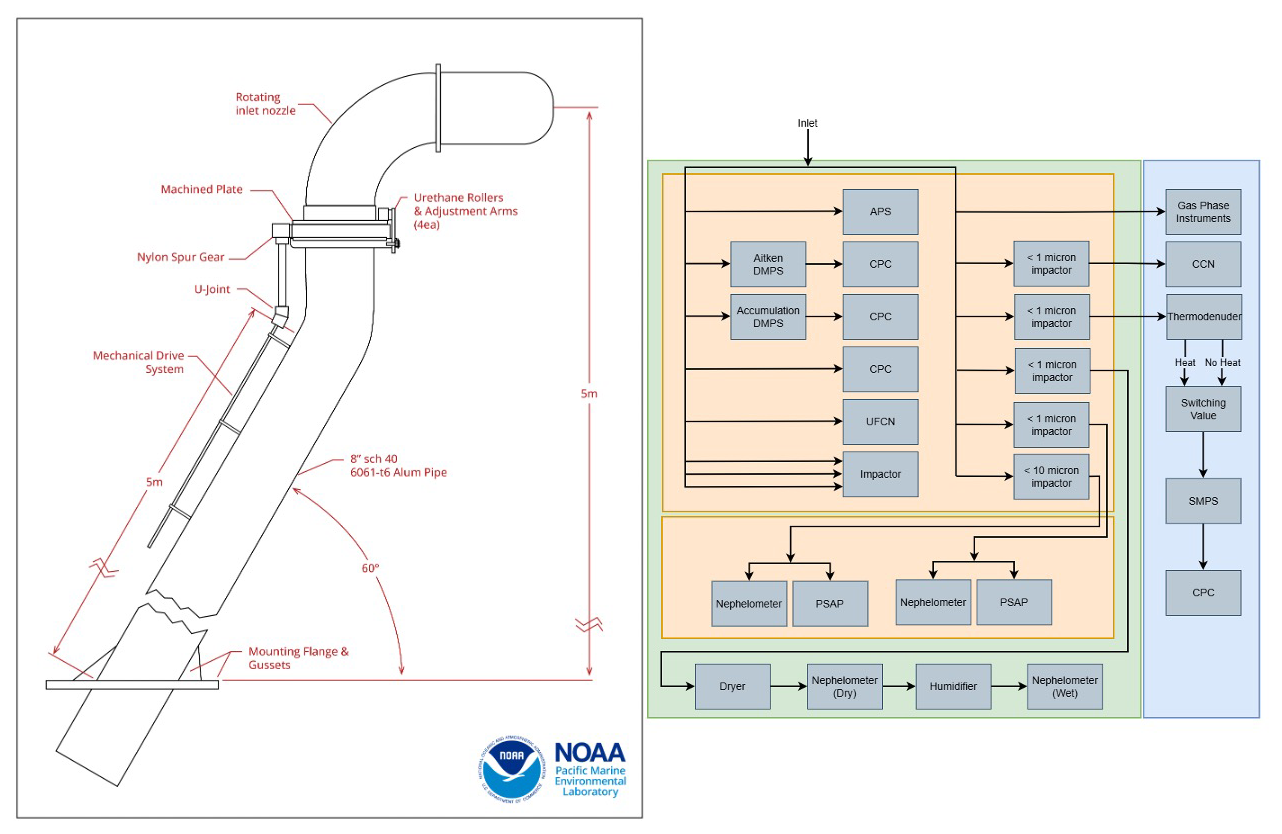
Figure 2Shown are schematics of the aerosol sampling inlet (left) and a flow chart indicating the flow of sample air from the inlet to the instrumentation (right). This flow chart depicts the maximum number of instruments deployed. Green represents the van the inlet is mounted on, orange represents the temperature controlled box at the base of the inlet, and blue represents the van next door housing additional real time instruments.
Table 3Measurements of aerosol chemical composition on each cruise and the instrumentation used.
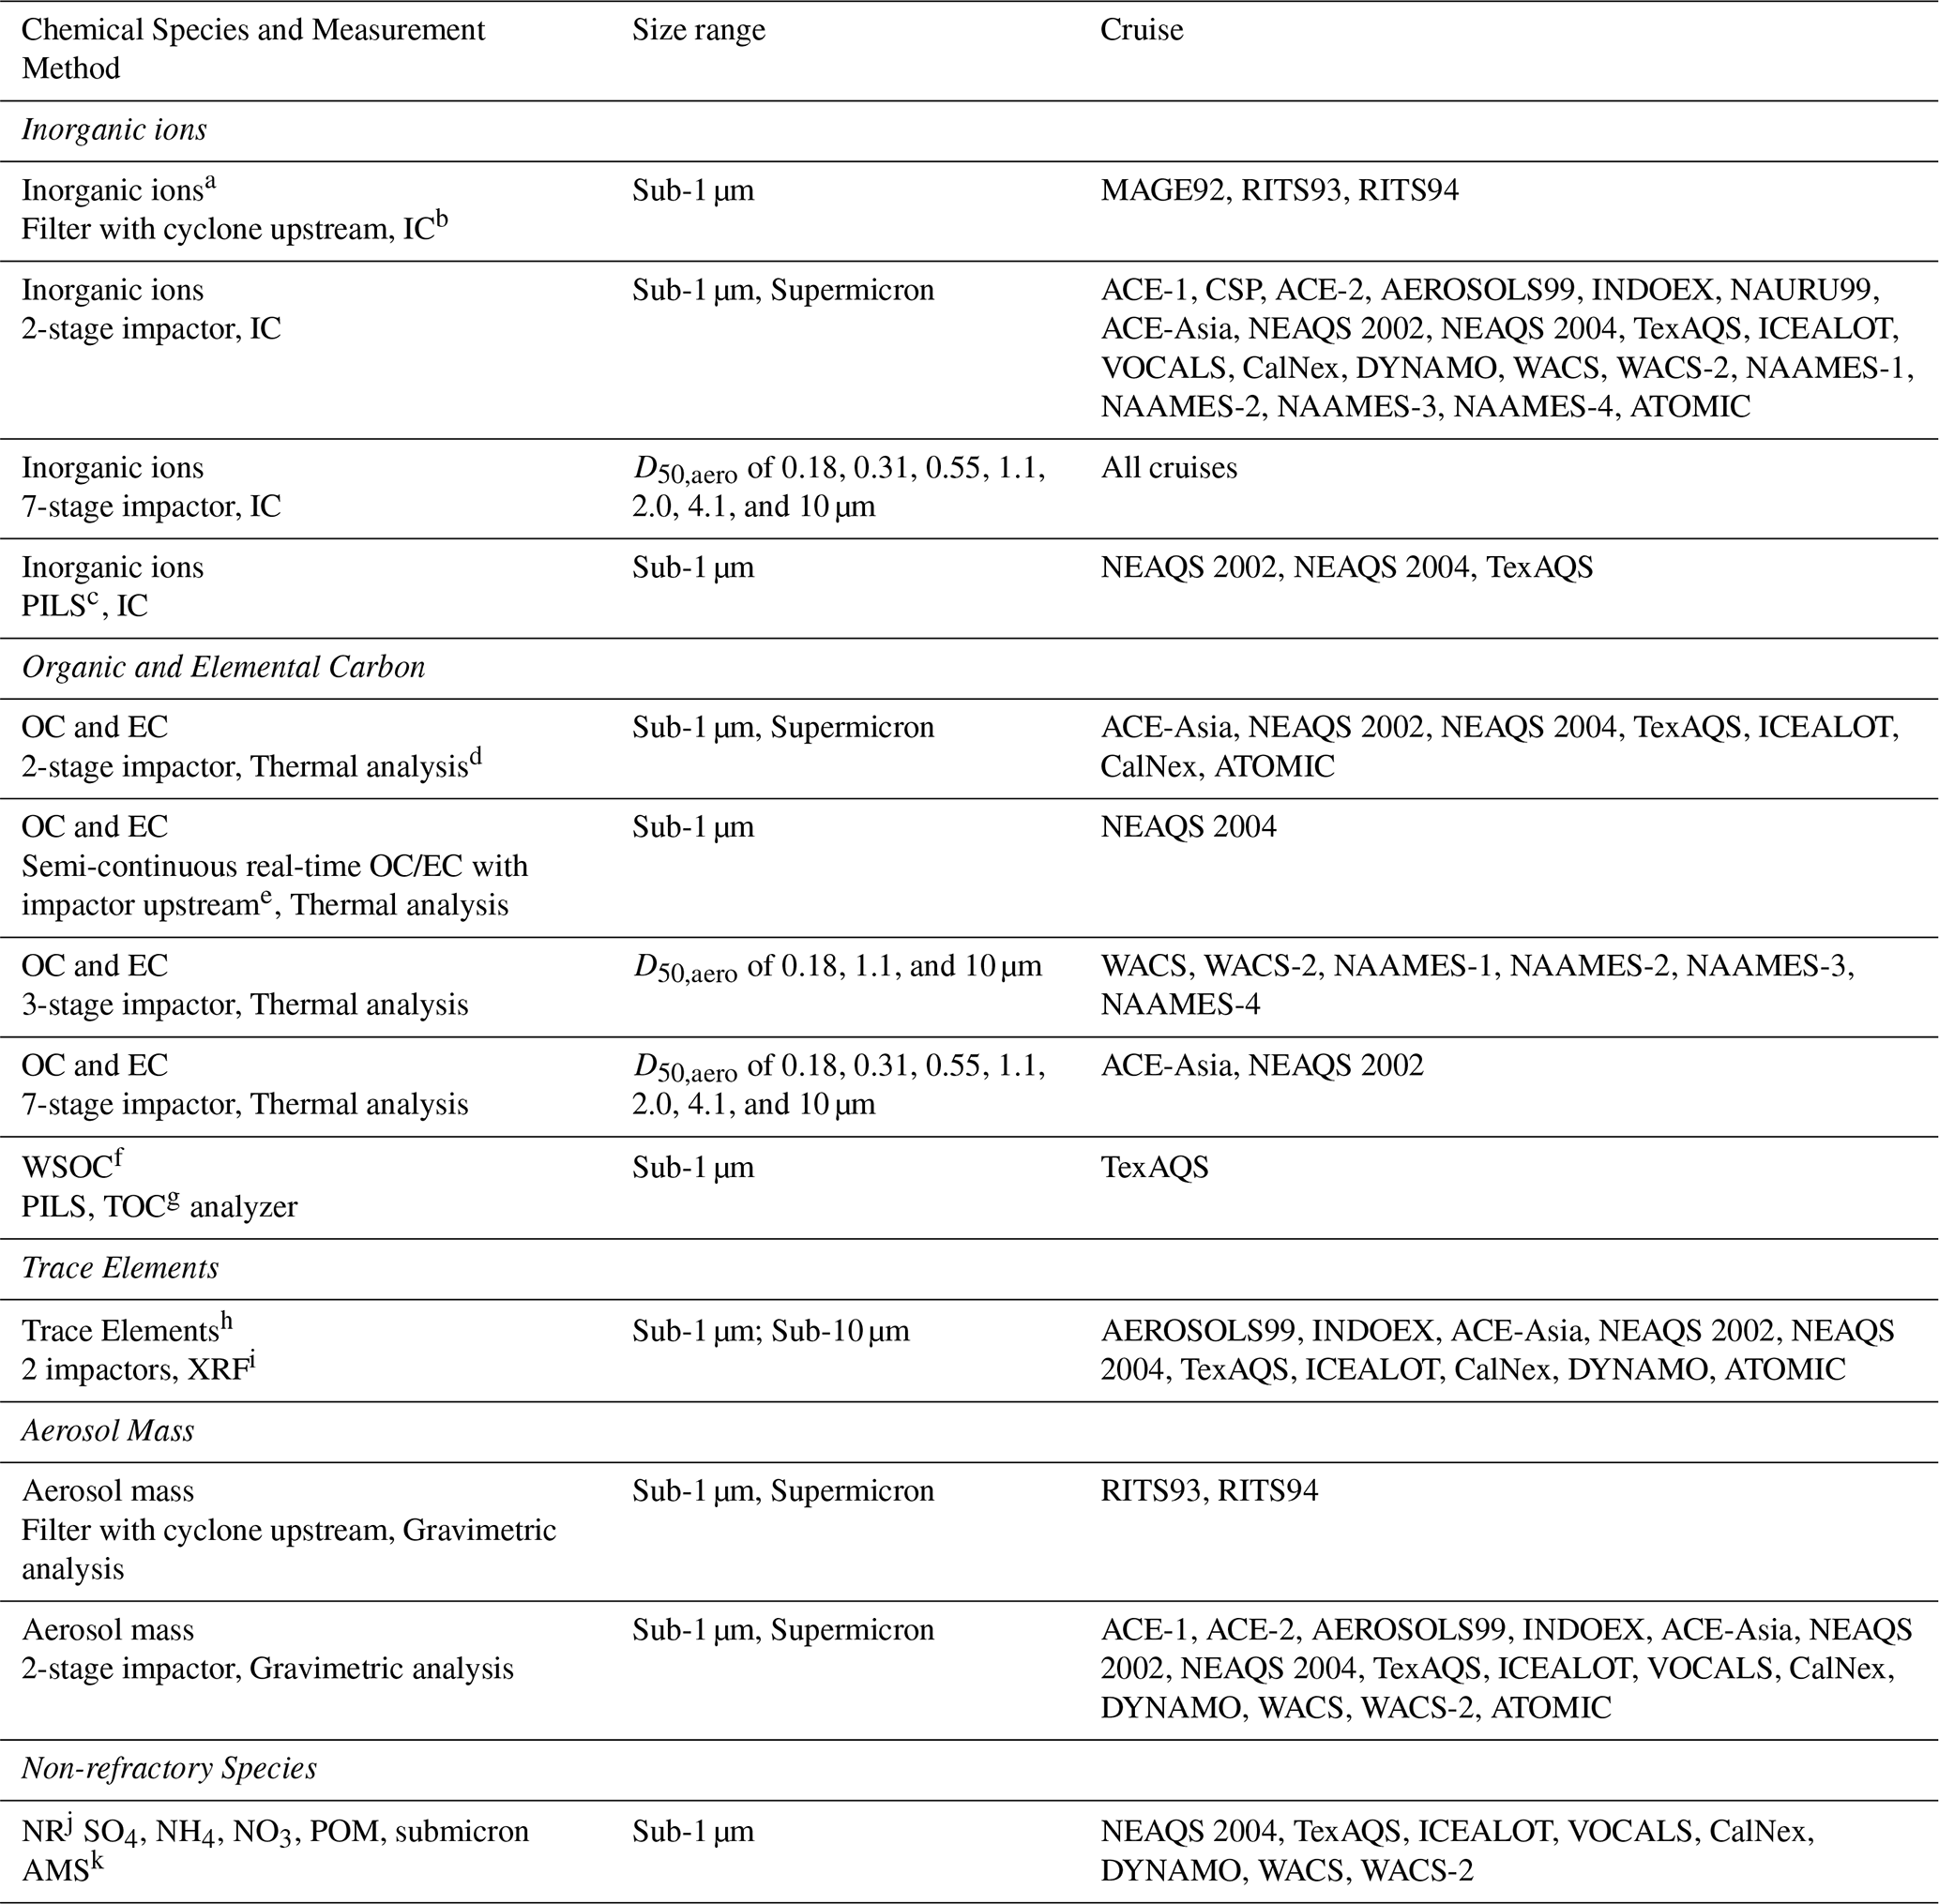
a Na+, , K+, Ca2+, Mg2+, Cl−, , , MSA−, b Ion Chromatography, c Particle-Into-Liquid-Sampler, d Sunset Labs thermal/optical analyzer, e Sunset Labs real-time, semi-continuous thermal/optical analyzer, f Water Soluble Organic Carbon, g Total Organic Carbon Sievers Model 800 Turbo analyzer, h Al, Si, nss Ca, Ti, Fe, i Energy dispersive X-ray fluorescence, j Non-refractory, k Aerodyne Mass Spectrometer.
Table 4Measurements of aerosol optical properties on each cruise and the instrumentation used.
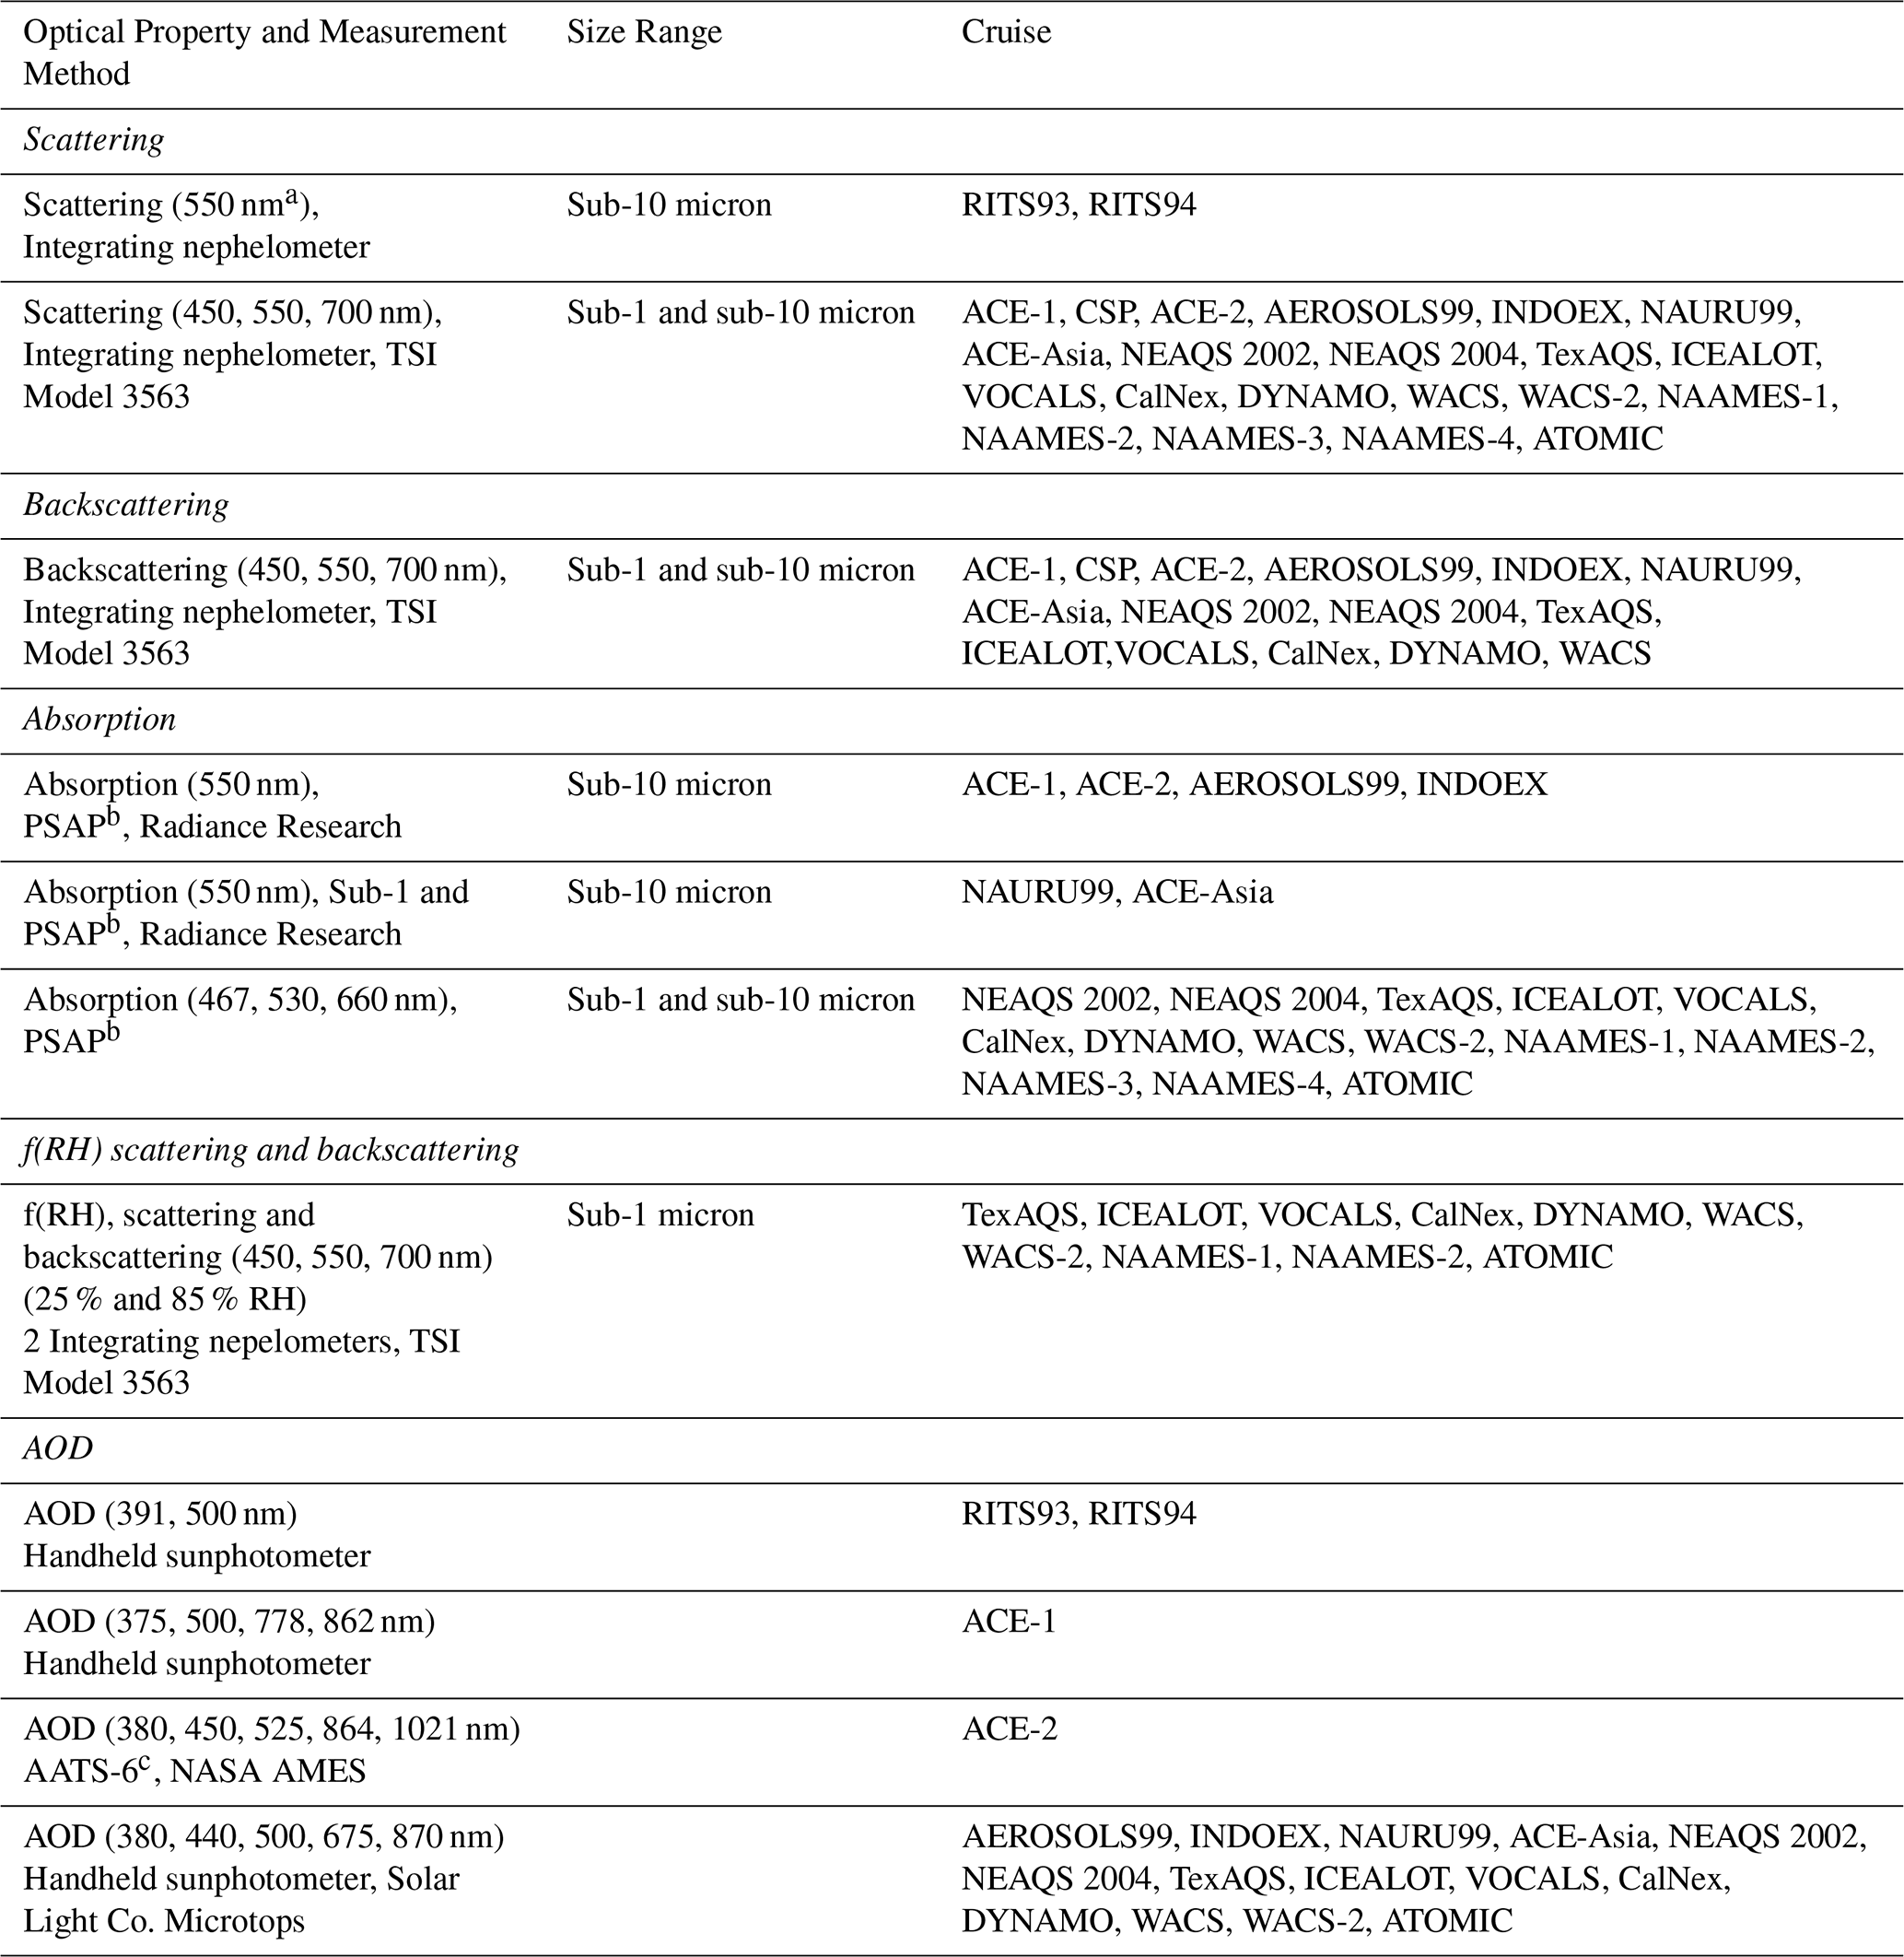
a nm, wavelength, b Particle Soot Absorption Photometer, c Ames Airborne Tracking Sunphotometer.
Table 5Measurements of gas phase species on each cruise and the instrumentation used.
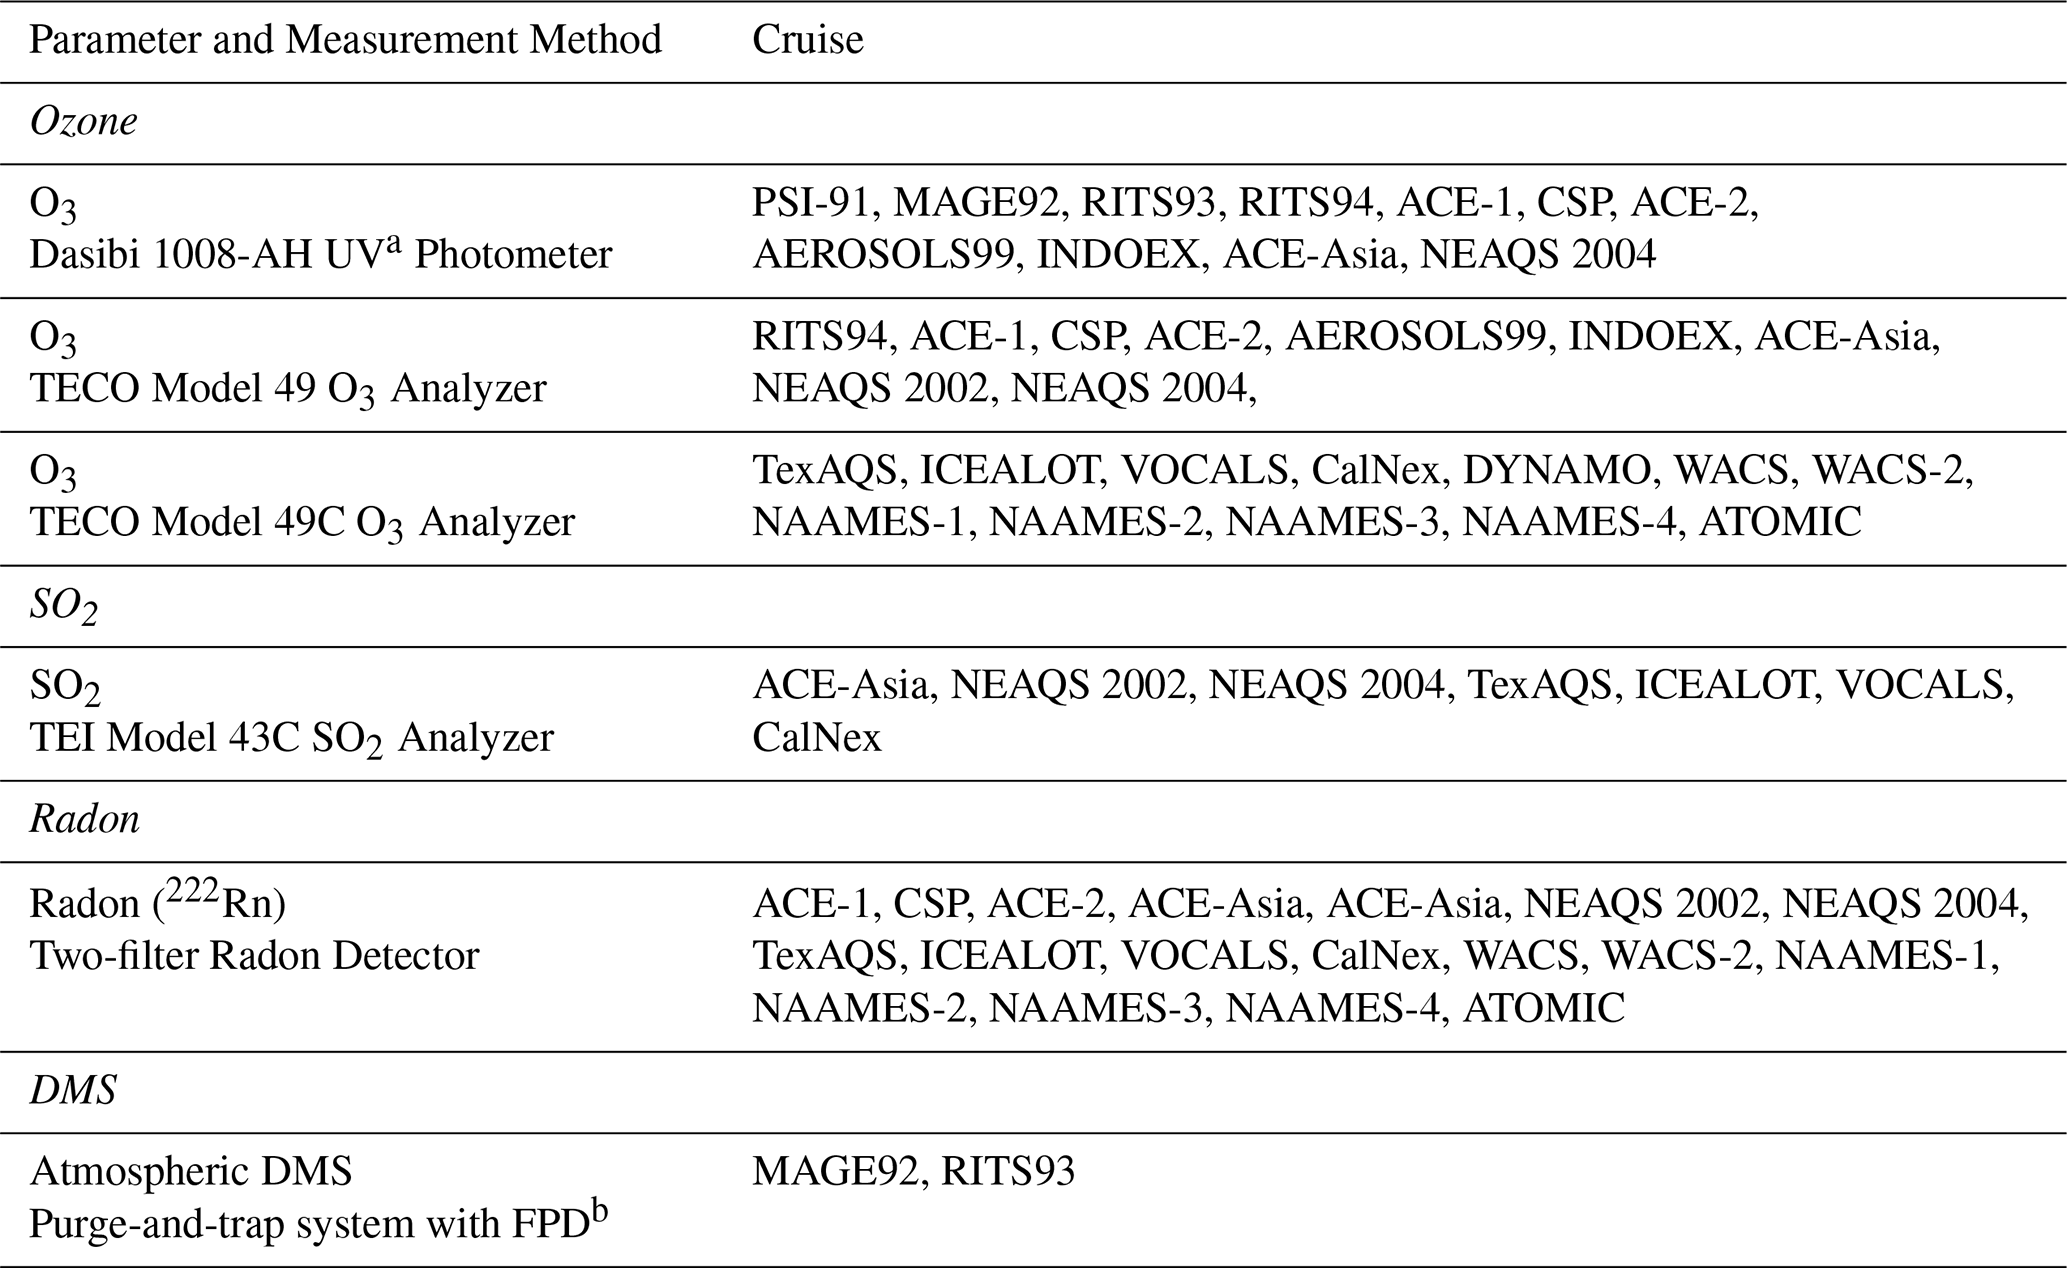
a Ultra-Violet, b Flame Photometric Detector, c Sulfur Chemiluminesence Detector.
For all cruises, instrumentation was housed in one or more 8 ft (2.44 m) tall shipping container(s) outfitted with power, air conditioning, and, in some cases, water. Unistrut was installed on inside walls for the securing of instrument racks, drawers, shelves, etc. A railing surrounding the sampling inlet was installed on the roof of the container for mounting of meteorological and other sensors.
3.1 Aerosol sampling inlet
For all cruises, an aerosol sampling mast was mounted on top of an 8 ft (2.44 m) tall shipping container converted to a laboratory as described above. Diagrams of the sampling inlet and connections to instrumentation are shown in Fig. 2. Schematics for all parts of the sampling inlet can be found at https://www.pmel.noaa.gov/acg/gallery/aerosol-sampling-inlet-schematics (last access: 10 May 2026). The container was mounted as far forward of the ship's stack as possible to minimize contamination. To maintain nominally isokinetic flow and minimize the loss of supermicron particles, the inlet at the top of the mast was rotated into the relative wind first manually (PSI-91 to NAURU-99) and then automatically under computer control (ACE Asia through ATOMIC). The mast angle was recorded for post-cruise data analysis. Air entered the inlet through a 5 cm diameter hole, passed through an expansion cone, and then into the 20 cm diameter sampling mast. The flow through the mast was 1 m3 min−1. Individual 1.9 cm diameter stainless steel tubes extended into the base of the mast. These were connected to the various aerosol instruments in the laboratory container directly below the mast with carbon-embedded conductive tubing to prevent the loss of particles through static charging. Sampling of organics was added to the PMEL payload for ACE-Asia. Stainless steel tubing was added for the connections between the aerosol inlet and the instruments and impactors sampling for organic components.
During the initial cruise reported here, PSI-91, sample air from the mast was not conditioned, i.e., heated to control RH. Instead, aerosol was sampled at ambient RH (75 % ± 9 %) although all CPCs (Condensation Particle Counters) had diffusion dryers upstream to reduce the RH of the sample air to less than 30 %. Aerosol microphysical properties were measured continuously with periods of contamination, calibration, and downtime removed from the final data set. To avoid contamination by the ship's stack, samples for chemical analysis were collected only when the particle number concentration measured at the top of the mast was less than 1000 cm−3, the relative wind speed was greater than 3 m s−1, and the relative wind direction was forward of the ship's beam (±90°). This approach was employed during all cruises although the particle number concentration and relative wind speed and direction limits were varied depending on conditions.
After PSI-91, the last 1.5 m of the inlet were heated to establish a low reference relative humidity. Heating allows for constant instrumental size segregation in spite of variations in ambient RH and results in measurements of aerosol chemical, microphysical, and optical properties that are directly comparable. During MAGE 92, RITS 93, RITS 94, and ACE-1, sample air was heated above ambient temperatures to reach an RH of <25 %. The target RH for the sample air was increased to 55 % to 60 % for ACE-2 and following cruises because it is above the efflorescence humidity of most aerosol components and component mixtures (Carrico et al., 2003), which reduces particle bounce in impactors and simplifies thermodynamic equilibrium calculations of particle density and refractive index. There are a few exceptions to the target RH of 55 % to 60 %. The cold Arctic air temperatures during ICEALOT and the higher latitude portions of the NAAMES cruises made it difficult to obtain that RH. Instead, the aerosol was sampled at less than 25 % RH during those conditions.
After RITS94 and before ACE-1, a temperature-controlled box was installed at the base of the sampling mast (Fig. 2b and c). The box was heated above ambient temperatures to reduce cooling and condensation in sampling lines in the air-conditioned laboratory container and to maintain a uniform RH of the sampled air. Instrumental RH for the particle sizing systems is listed in Table 2.
The transmission efficiency of particles through the mast as a function of size was characterized after INDOEX in the Kirsten Wind Tunnel at the University of Washington (Bates et al., 2002). The Kirsten Wind Tunnel is a subsonic, closed circuit, double return wind tunnel. The mast was mounted under the wind tunnel with the rotatable cone on top extending into the test section of the tunnel. Two sets of propellers moved air through the test section at speeds of 7 to 20 m s−1. Aerosol particles were generated from a 10 % polyethylene glycol solution (PEG-400 molecular weight mixed in distilled water) using a pressurized tank and spray nozzle downwind of the mast. Aerosol size distributions were measured from 0.56 to 14 µm using Aerodynamic Particle Sizers (APS 3320, TSI, St. Paul, MN). Larger particle sizes were the focus of these tests as comparisons of total particle number concentration during ACE-1 found agreement within ∼20 % of the NCAR C-130 airplane and ground stations. The aerosol generator was operated for 1 min every 5 min to maintain a steady concentration of ∼500 particles per cm3. Tests were conducted at different angles (0 to 90°) between the wind vector and the mast inlet cone axis, different wind speeds (7 to 20 m s−1), and different air flows down the mast (30 to 1200 L min−1). The only parameter that was found to affect the transmission efficiency was the angle between the wind and the mast inlet cone. The transmission efficiency for particles with diameters less than 6.5 µm was determined to be greater than 95 % when the inlet was kept to within 15° of the wind direction (Fig. 3). At a 90° angle, the inlet transmitted about 60 % of the particles in the 6 µm size bin. Data collected in bins greater than 6.5 µm were within the instrument noise level due to Poisson counting statistics.
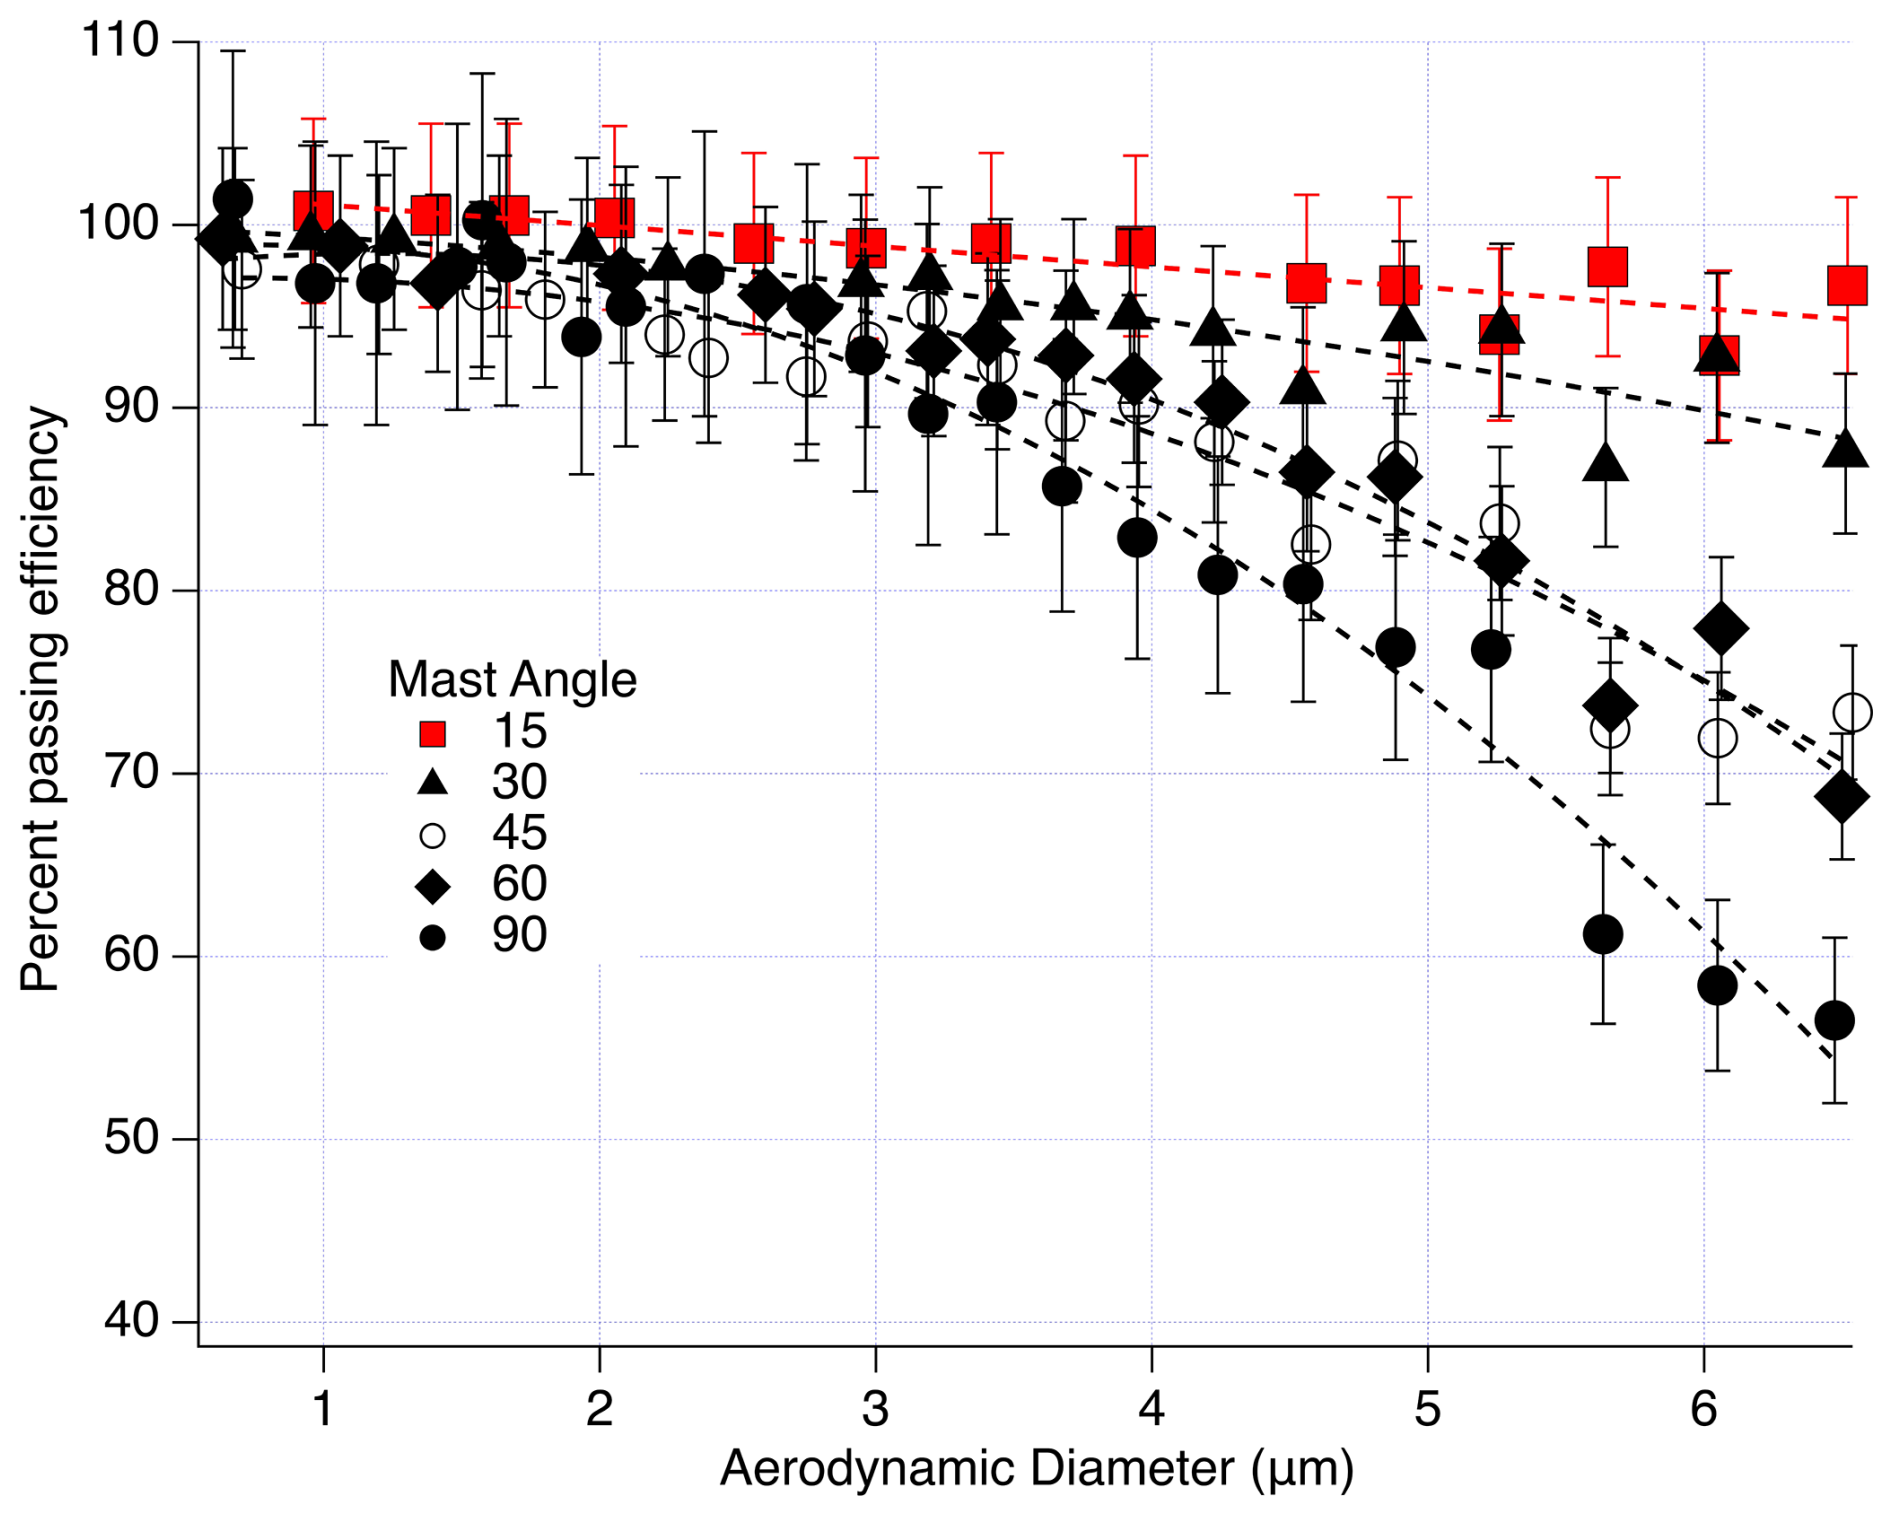
Figure 3Percent transmission efficiency of the mast at different angles between the inlet nozzle and the wind direction. The vertical bars indicate one standard deviation of the mean efficiency in each size bin. The curves are a second-order polynomial fit through the data at each angle. From Bates et al. (2002).
3.2 Aerosol microphysical properties
Total particle number concentration was measured on all cruises. After the first cruise, PSI-91, number size distributions were measured on all cruises. Measurements of cloud condensation nuclei (CCN) concentrations were first added in 2006 for TexAQS. Details of the measurements are outlined below. Table 2 indicates the measurement methods used on each cruise and, in the case of number size distributions, the instrumental RH.
3.2.1 Particle number concentrations
As indicated in Table 2, during the first several cruises (PSI-91, MAGE92, RITS93, RITS94), total particle number concentrations for Dp greater than 3 and 12 nm were measured with TSI 3025 and 3760 CPCs, respectively. The ultrafine particle number concentration was then defined as the difference between the number concentration measured with the 3025 and 3760 CPCs. For these initial cruises and all subsequent ones, diffusion driers (Permapure Inc.) were placed upstream of the CPCs to minimize particle diameter changes due to hygroscopic growth to less than 5 % (Swietlicki et al., 2008). The use of a diffusion drier also helped prevent the uptake of water in the CPC condenser that results when sampling in the humid marine atmosphere. Beginning with ACE-2 in 1997 and continuing through ATOMIC in 2020, particle number concentrations for Dp>12 nm were measured with a TSI 3010 CPC. Starting in 2008 for VOCALS, a water-based TSI 3785 CPC was added to also measure the concentrations of particles with diameters greater than 3 nm.
3.2.2 Particle number size distributions
For MAGE92, RITS93, and RITS94, particle number size distributions from 0.02 to 0.6 µm were measured with a TSI 3071 Differential Mobility Analyzer (DMA) (Quinn et al., 1998) with the number concentration in each bin measured with a TSI 3760 CPC. The resulting number mobility distributions were inverted to a number size distribution by using the manufacturer-provided algorithm (Keady et al., 1983) and assuming that a Fuchs-Boltzman equilibrium charge distribution resulted from a 85Kr charge neutralizer (TSI model 3077) on the inlet of the DMA. The number concentration was corrected for the counting efficiency of the CPC (Zhang and Liu, 1991) and diffusion losses in the DMA (Reineking and Porstendorfer, 1986). The sample air passed through a diffusion drier to reduce the RH to less than 25 %.
A Vienna short column Ultrafine DMPS (UDMPS) coupled to a TSI 3025 CPC was added for ACE-1 and all subsequent cruises to extend the size distribution measurements to the 0.005 to 0.02 µm size range. For both ACE-1 and CSP, the UDMPS and the TSI 3071 DMA were located outside of the temperature-controlled box. Sheath air for both resulted in a measurement RH of less than 25 % RH. As for the earlier cruises, the mobility distributions were inverted to number size distributions by assuming that a Fuchs-Boltzman charge distribution resulted from the 85Kr charge neutralizers on the inlet of the DMAs. The data were corrected for diffusional losses (Covert et al., 1997) and size dependent counting efficiencies (Wiedensohler et al., 1997) based on pre-ACE-1 intercalibration exercises. In addition, an APS (TSI 3300) was added for ACE-1 and all subsequent cruises to measure the number size distribution between 0.6 and 9.6 µm. APS diameters measured at ∼40 % RH were converted to geometric diameters by dividing by the square root of the particle density for sea salt (1.9 g cm−3) and dried to 10 % RH assuming a sea salt growth factor of 1.5 between 10 % and 40 % RH (Berg et al., 1998).
For ACE-2 and all subsequent cruises, the UDMPS and TSI DMA were put into the temperature-controlled box to maintain an instrumental RH of greater than 45 % (see Table 2). The APS was also transferred to the temperature-controlled box where it measured at an RH of approximately 40 %.
For AEROSOLS99 and all subsequent cruises, a Vienna medium column DMPS was used to measure particles in the 0.02–0.9 µm size range instead of the TSI 3071 DMA. In addition, the APS model 3300 was replaced with an APS model 3320. Duplicate Vienna medium column DMPSs were deployed for AEROSOLS99 and INDOEX. One measured at 10 % RH outside of the temperature-controlled box and the other measured at 55 % RH inside the box.
Although the APS was located in the temperature-controlled box and its inlet was maintained at 55 % RH, internal heating of the sample flow by its sheath flow and waste heat likely reduced the measurement RH (Bates et al., 2004). For ACE-Asia and all subsequent cruises, the APS sheath flow was routed outside of the instrument to equilibrate with the air temperature in the temperature-controlled box and then reintroduced to the sheath and acceleration nozzle to lower the temperature and increase the measurement RH. Also starting with ACE-Asia, densities and the associated water masses at the instrumental RH were calculated with a thermodynamic equilibrium model (AeRho) using the measured inorganic ion composition (Quinn et al., 1998). These calculated densities were used to convert the APS data from aerodynamic to geometric diameters for merging with the DMPS data. Due to the atmospheric dust that was sampled during ACE Asia, the APS data were corrected for ultra-Stokesian conditions in the instrument jet and nonspherical shape (Wang and John, 1987).
3.2.3 Cloud condensation nuclei concentrations
A CCN counter (DMT CCN-100) was added for TexAQS and several later cruises (CalNex, NAAMES-1, NAAMES-2, NAAMES-3, NAAMES-4, and ATOMIC) (see Table 2). A CCN counter was onboard during WACS and WACS2 but it sampled nascent SSA with Sea Sweep for the majority of the time. CCN concentrations were measured at supersaturations between 0.2 % and 1.0 %. Details of the CCN counter can be found in Roberts and Nenes (2005). A multijet cascade impactor (Berner et al., 1979) with a 50 % aerodynamic cut-off diameter of 1.1 µm was upstream of the CCN counter. More details about the CCN measurements can be found in Quinn et al. (2008).
3.3 Aerosol chemical composition
The chemical species quantified along with sample collection and analysis methods are listed for each cruise in Table 3 and described below. Starting with PSI-91, size segregated aerosol was collected with a varying combination of two-, three-, and seven-stage multijet cascade impactors (Berner et al., 1979). All impactors, except those used for the analysis of organic carbon, had a grease cup at the inlet of the impactor that was coated with silicone grease to prevent the bounce of large particles onto the downstream stages. Two stage impactors had 50 % aerodynamic cut-off diameters, Daero,50, of 1.1 and 10 µm; three stage impactors had Daero,50, of 0.18, 1.1, and 10 µm; and seven stage impactors had Daero,50, of 0.18, 0.31, 0.55, 1.1, 2.0, 4.1, and 10 µm. To attain these size cuts, air flow through all impactors was maintained at 30 L min−1. Flow through the impactors was computer-controlled so that aerosol was only collected when the relative wind speed and direction along with measured particle number concentration indicated there was no contamination from the ship's stack. Chemical analysis of the substrates included ion chromatography (inorganic ions), thermal/optical analysis (OC and EC), energy dispersive X-ray fluorescence (trace elements), and gravimetric mass (total aerosol mass). The substrates used in the impactors depended on the chemical species analyzed and are described below. Blank levels were determined by placing a substrate in the impactor with no air pulled through it. Blank concentrations were subtracted from sample concentrations.
Additional chemical analyses were performed with a particle-into-liquid-sampler (PILS) followed by ion chromatography and water soluble organic carbon (WSOC) analysis and an aerosol mass spectrometer (AMS) for non-refractory (NR) analytes. Details are provided below.
3.3.1 Inorganic ions
A seven stage multi-jet cascade impactor was used on all cruises to collect size segregated samples for ion chromatography analysis. The ions quantified were Na+, , K+, Ca2+, Mg2+, Cl−, , , and methane sulfonate or MSA−. A Millipore Fluoropore filter (1.0 µm pore size) was used for the final, smallest size range stage. The Millipore filter has a collection efficiency of 99 % or greater for particles with diameters larger than 0.035 µm (Liu and Lee, 1976). Tedlar films were used for the six largest stages. The films were cleaned in an ultrasonic bath in 10 % H2O2 for 30 min, rinsed 6 times in distilled, deionized water, and then dried in an NH3- and SO2-free glove box. Material collected on the filters and films was extracted by wetting with 1 mL of methanol and then adding 5 mL of distilled deionized water and sonicating for 30 min. Samples were handled in a glove box that was purged with air that had passed through a scrubber containing potassium carbonate, citric acid, and activated charcoal to remove SO2, NH3, and volatile organics, respectively. Sampling times varied between ∼12 and 36 h and were based on the amount of aerosol present.
For the first few cruises (MAGE92, RITS93, RITS94), higher time resolution (<12 h) submicron aerosol samples were collected using a filter holder downstream of a cyclone with a Daero,50 of 1 µm. Starting with ACE-1, a 2-stage impactor was used for higher time resolution sampling of sub- and supermicron aerosol for ion chromatography analysis. Substrates, sample handling, and blank determinations were the same as discussed above.
A Particle-Into-Liquid-Sampler (PILS) coupled to an ion chromatograph was used to sample submicron inorganic ions during NEAQS 2002, NEAQS 2004, and TexAQS at a higher time resolution (15 min) than any of the impactors (Bates et al., 2008). The common aerosol inlet was used to deliver aerosol to a PILS at 55 % RH. An impactor with a Daero,50 of 1.1 um was upstream of the PILS. Flow through the impactor was 30 slpm with 15 slpm through the PILS and 15 slpm through a bypass line. Two annular, glass denuders (URG) were in series downstream of the impactor and upstream of the PILS. One was coated with sodium carbonate for the removal of gas phase acids and the other was coated with citric acid to remove gas phase bases. Two Kloehn syringe pumps were used to deliver a solution of LiF to the top of the PILS impactor to correct for dilution of the sample within the PILS. Two additional pumps delivered sample from the PILS simultaneously to a cation and an anion IC. More information about the PILS can be found in (Weber et al., 2001). Between every 45 min to 2 h, sample air was passed through a HEPA filter for 15 min to remove particles and determine the measurement blank. This blank was subtracted from the sample concentrations.
For both the impactor and the PILS data, non-sea salt (nss) concentrations were calculated from Na+ concentrations and the ratio of sulfate to sodium in seawater. Sea salt concentrations were calculated from
where 1.47 is the seawater ratio of (Holland, 1978). This approach prevents the inclusion of non-sea salt K+, Mg2+, Ca2+, , and in the sea salt mass and allows for the loss of Cl− mass through Cl− depletion processes. It also assumes that all measured Na+ and Cl− is derived from seawater. Results of Savoie and Prospero (1980) indicate that soil dust has a minimal contribution to measured soluble sodium concentrations.
3.3.2 Organic and elemental carbon
Starting with ACE-Asia in 2001, sub-1 and sub-10 µm samples were collected for OC/EC analysis using 2 and 1 stage impactors, respectively (Bates et al., 2004). Each impactor had 2 quartz backup filters. OC concentrations from both impactors were corrected for blanks and artifacts using the last quartz filter in line. Aluminum foil was used as a substrate on the 1.1 µm jet plate. All substrates, aluminum foil and quartz, were prebaked at 500° prior to sampling. One sub-10 µm and one sub-1 µm impactor were operated without a denuder upstream to avoid losses of large particles in the denuder. OC from the sub-1 µm impactor was subtracted from the OC from the sub-10 µm impactor to determine supermicron OC concentrations. A second sub-1 µm impactor was operated with a denuder upstream that contained strips of carbon-impregnated glass fiber filters to remove gas phase organics. Sub-1 µm OC and EC were quantified on the impactor samples downstream of the denuder.
During ACE-Asia and NEAQS 2002, a 7-stage impactor was used for the sampling of OC/EC providing greater size resolution. Aluminum foil substrates were used on all stages of the impactor along with 2 quartz backup filters. A 3-stage impactor (D50,aero of 0.18, 1.1, and 10 µm) was used during WACS, WACS-2, and NAAMES-1 through NAAMES-4. These cruises focused on the composition and properties of sea spray aerosol. The 3 size cuts allowed for the separation of the sub-0.18 µm aerosol from larger size ranges in recognition that smaller particle sizes are known to be enriched in organics through the sea spray aerosol production process (Keene et al., 2007).
OC and EC concentrations on the impactor substrates were measured with a Sunset Labs thermal/optical analyzer (Birch and Cary, 1996). Four temperature steps were used to achieve a final temperature of 870 °C in He to drive off OC. After cooling the sample down to 550 °C, a mixture was introduced and the sample was heated in four temperature steps to 910 °C to drive off EC. The transmission of light through the filter was measured to separate EC from any OC that charred during the initial stages of heating. No correction was made for carbonate carbon so OC included both organic and inorganic carbon. The mass of particulate organic matter (POM) was determined by multiplying the measured organic carbon concentration in µg m−3 by a factor of 2.1 in marine regions and 1.6 elsewhere (Turpin and Lim, 2001).
A semi-continuous real-time Sunset Labs thermal/optical analyzer was used during NEAQS 2004 for higher time resolution measurements of OC concentrations. The OC/EC analyzer was downstream of a sub-1 µm impactor and a denuder. The analyzer collected air on a filter for 45 or 105 min depending on OC concentrations. At the end of the sampling time the instrument analyzed the filter using the same temperature program described above. The sampling times were not long enough to measure EC above the detection limit of 0.35 µg m−3.
3.3.3 Water soluble organic carbon
A PILS coupled to a Total Organic Carbon (TOC) analyzer (Sievers Model 800 Turbo) was used during TexAQS to measure water soluble organic carbon (WSOC) (Bates et al., 2008). As for the PILS-IC, the PILS-WSOC was connected to the common aerosol inlet but with a stainless steel line. An impactor with a D50,aero of 1.1 µm was upstream of the PILS to sample submicron aerosols. A denuder identical to the one used in the thermal/optical analysis was downstream of the impactor and upstream of the PILS to remove gas phase organics. Two syringe pumps (Kloehn) delivered low-TOC water to the top of the PILS impactor. Two additional pumps were used to pull sample out of the PILS and into the TOC analyzer. The sample was passed through a 0.5 µm in-line filter before entering the TOC analyzer to measure WSOC. Between every 45 min to 2 h, sample air was passed through a HEPA filter for 15 min to remove particles and determine the measurement background. The measurement background was subtracted from the sample air to obtain ambient WSOC ambient atmospheric concentrations.
3.3.4 Trace elements
Starting with AEROSOLS99, sub-1 and sub-10 µm samples were collected for trace element analysis using impactors with a D50,aero of 1.1 and 10 µm, respectively (Quinn et al., 2001). Energy Dispersive X-RAY Fluorescence (ED-XRF) was used for quantification (Buck et al., 2021). Both impactors collected aerosol on 2.0 µm pore size PALL Teflo Membrane Disc Filters. Supermicron concentrations were determined by subtracting the sub-1.1 µm values from the sub-10 µm values. No corrections were made for particle size or loading. Samples for XRF analysis were collected during all subsequent cruises except for VOCALS, WACS, WACS-2, and NAAMES-1 to 4.
Concentrations of Al, Si, Ca, Fe, and Ti are included in the NCEI archive as these were used to calculate dust. Other trace elements were measured but were often below detection limit so they were not reported. Dust concentrations were calculated based on measured values of Al, Si, Ca, Fe, and Ti assuming that each element was present in the aerosol in its most common oxide form (Al2O3, SiO2, CaO, K2O, FeO, Fe2O3, TiO2) (Seinfeld, 1986). The measured elemental mass concentration was multiplied by the appropriate molar correction factor as shown below (Malm et al., 1994)
This equation includes a 16 % correction factor to account for the presence of oxides of other elements such as K, Na, Mn, Mg, and V that are not included in the linear combination. In addition, the equation omits K from biomass burning by using Fe as a surrogate for soil K and an average ratio of 0.6 in soil (Braaten and Cahill, 1986). Non-crustal K was calculated using the ratio (0.31) of Asian loess (Jahn et al., 2001) which is similar to the ratio in Saharan dust (0.24) and average crustal rock (0.32) (Formenti et al., 2003). Sea salt Ca was accounted for based on the ratio of Ca to Na in seawater.
3.3.5 Non-refractory species
Concentrations of submicron non-refractory (NR) , , , and particulate organic matter (POM) were measured on NEAQS 2004, TexAQS, ICEALOT, VOCALS, CalNex, DYNAMO, WACS and WACS-2 with a Quadrupole Aerosol Mass Spectrometer (Q-AMS, Aerodyne Research Inc., Billerica, MA, USA) (Jayne et al., 2000). The NR species measured by the AMS are defined here as all the chemical components that vaporize at 550 °C. The AMS was downstream of an impactor with a D50,aero of 1.1 µm. The ionization efficiency of the AMS was calibrated every few days with dry monodisperse ammonium nitrate particles. Particle losses due to transmission through the aerodynamic lens were corrected by using the DMPS and APS-measured size distributions. Particle losses due to bounce off of the impactor-vaporizer were corrected using simultaneously sampled and non-sea salt concentrations from either the PILS-IC or the impactors (Quinn et al., 2008, 2006).
3.3.6 Aerosol mass
A filter holder with a Millipore Fluoropore filter (1.0 µm pore size) collected aerosol downstream of a cyclone with a D50,aero of 1 µm during RITS93 and RITS94. Filters were taken back to PMEL for gravimetric analysis to determine total submicron aerosol mass. The filters were weighed before and after sample collection with a Mettler UMT2 microbalance. The microbalance was housed in a glove box maintained at a constant RH to allow each sampled filter to come into equilibrium with the same vapor pressure of water, thus reducing experimental uncertainty due to a variable lab RH. For RITS93 and RITS94 the RH was maintained at less than 30 % by circulating air through a flat baffle box containing a saturated solution of MgCl2 ⋅ 6 H2O and then through the glove box (Young, 1967). The circulated air was cleaned by passing it through a scrubber containing activated charcoal, potassium carbonate, and citric acid. Filters were equilibrated overnight in the glove box prior to weighing. Static charging, which can result in balance instabilities, was minimized by coating the walls of the glove box with a static dissipative polymer (Tech Spray, Inc.), placing an antistatic mat on the glove box floor, and exposing the filters to a 210Po source to dissipate any built-up charge.
For ACE-1 and the other cruises listed in Table 3, a 2-stage impactor was used to collect submicron and supermicron aerosol for gravimetric analysis. Millipore Fluoropore filter (1.0 µm pore size) and Tedlar films were used for the collection of submicron and supermicron aerosol, respectively. The Tedlar films were cleaned as described in Sect. 3.3.1 prior to sample collection. Both the Millipore filters and the Tedlar films were weighed before and after sampling. Millipore filters were weighed on the Mettler UMT2 microbalance and Tedlar films were weighed on a Cahn Model 29 microbalance. Both balances were housed in the RH-controlled glove box described above. For cruises with higher sampling RHs of 55 % to 60 % (see Sect. 3.1), a saturated solution of KBr was used in the baffle box.
In addition to the 2-stage impactor used during ACE-Asia, a 7-stage impactor was used for higher size resolution total aerosol mass concentrations.
All reported mass concentrations include the water mass that is associated with the aerosol on the filter at the glove box RH.
3.4 Aerosol optical properties
The optical properties measured on each cruise and the instrumentation used are listed in Table 4. Aerosol light scattering coefficients were measure on each cruise with the exception of the first one, PSI-91. Variations included measurement at a single wavelength (550 nm) or three wavelengths (450, 550, and 700 nm) and measurement of sub-10 micron aerosol or sub-1 and sub-10 micron aerosol. The relative humidity dependence of light scattering, f(RH), was measured on some of the cruises as were backscattering coefficients at 450, 550, and 700 nm.
Aerosol absorption coefficients were measured on every cruise starting with ACE-1. Initially, measurements were made at 550 nm for sub-10 micron aerosol. These measurements were expanded to sub-1 and sub-10 micron aerosol starting with NAURU99 and 3 wavelengths (467, 530, and 660 nm) starting with NEAQS 2002.
Aerosol optical depth (AOD) was measured on all cruises except for the first one, PSI-91, with handheld sunphotometers. In addition, the NASA AMES Airborne Tracking sunphotometer (AATS-6) (Livingston et al., 2000) was used during ACE-2.
Details of the measurements are provided in the following sections.
3.4.1 Aerosol light scattering
During RITS93 and RITS94, sub-10 micron aerosol light scattering was measured with a newly developed, highly sensitive multiwavelength integrating nephelometer (Bodhaine et al., 1991). This nephelometer, with its high sensitivity, was combined with the closed geometry of the Ahlquist and Charlson (1967) nephelometer to develop the TSI, Inc. model 3563 (Anderson et al., 1996) that was used during the rest of the cruises reported on here. The enclosed geometry allows for the calibration of the nephelometer with gases with known scattering coefficients.
The TSI Inc. model 3563 integrating nephelometer was used for all remaining cruises to measure sub-1 and sub-10 micron scattering at three wavelengths (450, 550, and 700 nm). Sub-1 and sub-10 micron backscattering were measured on cruises between ACE-1 and WACS. Two single-stage impactors, one having a D50,aero of 1.1 µm and the other of 10 µm were placed upstream of the nephelometer. A valve automatically switched between the two impactors every 15 min so that sampling alternated between sub-1 micron and sub-10 micron aerosol. Scattering and backscattering by the supermicron aerosol was determined by difference.
During all cruises, the nephelometer was calibrated with CO2 and zeroed with particle-free air every 3 to 4 d (Quinn et al., 1996). The resulting zero offset and span factors were applied to the data. In addition, data were corrected for angular nonidealities of the nephelometer, including truncation errors and non-Lambertian illumination using the method of Anderson and Ogren (1998) or one similar to it.
The RH of the air sampled by the nephelometer was nominally that of the common inlet as described in Sect. 3.1. Heating within the nephelometer likely led to slightly lower RH's than for the sizing instruments detailed in Table 2. For ACE-Asia and all subsequent cruises the nephelometer flow path was modified so that the sheath flow was conditioned outside of the instrument case to equilibrate with the temperature-controlled box. It was then reintroduced into the sheath and acceleration nozzle to minimize heating of the sample air and lowering of the measurement RH. In addition, an RH sensor was placed in the nephelometer sensing volume.
3.4.2 Relative humidity dependence of light scattering, f(RH)
As indicated in Table 4, the relative humidity dependence of scattering, f(RH), was measured on TexAQS, ICEALOT, VOCALS, CalNex, DYNAMO, WACS, WACS-2, NAAMES-1, NAAMES-2, and ATOMIC. A humidity-controlled system measured light scattering at two different relative humidities, ∼20 % and ∼85 %, with two nephelometers operated in series downstream of an impactor (D50,aero=1.1 µm). The first nephelometer in line measured sample air dried with a PermaPure, multiple-tube nafion dryer (model PR-94). Downstream of this nephelometer a humidifier was used to add water vapor to the sample flow using 6 microporous Teflon tubes surrounded by a heated water-jacket. Humidity was measured using a chilled mirror dew point hygrometer downstream of the second nephelometer in line. The same calibration procedure described in Sect. 3.4.2 was used (Quinn et al., 2022).
3.4.3 Aerosol light absorption
Between ACE-1 and INDOEX, the aerosol light absorption coefficient of sub-10 µm was measured with a Particle Soot Absorption Photometer (PSAP, Radiance Research) at a wavelength of 550 nm and ∼55 % RH. Measured values were corrected for a scattering artifact, the deposit spot size, flow rate, and the manufacturer's calibration (Bond et al., 1999). Beginning with NAURU99, the absorption coefficient was measured for sub-1 and sub-10 µm aerosol with the PSAP located downstream of the same impactors as the nephelometer. For NEAQS 2002 and all subsequent cruises, a modified PSAP was used to measure light absorption at three wavelengths (467, 530, and 700 nm) close to that of the TSI nephelometer for calculation of single scattering albedo (Virkkula et al., 2005). Beginning with TexAQS and all following cruises, a PermaPure nafion dryer was placed upstream of the PSAP so that the sample air was at ∼25 % RH. Measurement of dry air was found to reduce instrument noise.
3.4.4 Aerosol optical depth
Handheld sunphotometers were used to measure AOD for ACE-1 and all subsequent cruises. A single wavelength (550 nm) sunphotometer was used for ACE-1. A microtops unit (Solar Light Co.) was used for all other cruises measuring at 380, 440, 500, 675, and 870 nm. Units were calibrated before each cruise by either Solar Light Co. or NASA Goddard Space Flight Center (GSFC) using a Langley plot approach (Shaw, 1983). Initially, a NASA Sensor Intercomparison and Merger for Biological and Interdisciplinary Oceanic Studies (SIMBIOS) MATLAB routine was used to convert raw signal voltages to AOD. Included in the conversion is a correction for Rayleigh scattering (Penndorf, 1957) and air mass to account for the curvature of the Earth (Kasten and Young, 1989). Beginning with ICEALOT in 2008, data were reduced as part of NASA's Maritime Aerosol Network (Smirnov et al., 2009).
3.5 Gas phase species
Gas phase species that were measured include O3, SO2, Radon, and DMS. The cruises each gas was measured on and the measurement methods used are listed in Table 5. O3 and SO2 were measured primarily as tracers of pollution. Radon (as 222Rn) was measured as an indicator of contact of the sampled air with land (Whittlestone et al., 1998b). DMS was measured due to its link to nss and MSA via oxidation in the atmosphere (e.g. Andreae et al. (1985)).
3.5.1 Ozone
O3 was measured on all cruises with the exception of NAURU99 and WACS. Three different ozone UV analyzers were used over the years including a Dasibi 1008-AH UV photometer, a TECO Model 49 O3 Analyzer, and a TECO Model 49C O3 Analyzer (Table 5). For all cruises, a 0.635 cm ID Teflon sample line was used to draw air from the top of the aerosol common sampling mast to the O3 instrument located in the lab container at the base of the mast. The loss of O3 in a Teflon sampling line is approximately 5 % per 30 m indicating that losses were negligible (<3 %). At intervals of 1 to 4 d, a charcoal filter was placed in the sampling line for 1 h to determine a zero which was subtracted from the O3 signal. More details can be found in Johnson et al. (1990).
3.5.2 Sulfur dioxide
SO2 was measured during ACE-Asia, NEAQS 2002, NEAQS 2004, TexAQS, ICEALOT, VOCALS, and CalNex with a Thermo Environmental Instruments Model 43C trace level pulsed fluorescence analyzer. Air was drawn through the 18 m aerosol common sampling mast at 1 m3 min−1. At the base of the mast, a 5.0 L min−1 flow was pulled in series through a 1 m long Teflon tube, a Millipore Fluoropore Teflon filter (1.0 µm pore size), a Perma Pure Inc. Nafion dryer (MD-070), a 2 m long Teflon tube, and then into the SO2 analyzer. The initial 1 m of tubing, filter, and drier were located in the humidity-controlled box at the base of the mast. Dry air was pulled through a charcoal trap and then through the outside of the Nafion dryer at 2 L min−1. The analyzer was run with two channels (0–20 ppb full scale and 0–100 ppb full scale) and a 20 s averaging time.
Zero air (scrubbed with a charcoal trap) was introduced into the sample line upstream of the Fluoropore filter for 10 min every hour to establish a zero baseline. An SO2 standard was generated with a permeation tube held at 50 °C. The flow over the permeation tube, diluted to 17.7 ppb, was introduced into the sample line upstream of the Fluoropore filter for 10 min every 6 h (Bates et al., 2004).
3.5.3 Radon
The rate of emission of radon from the ocean is ∼100 times less than over land. As a result, 222Rn is a qualitative tracer of an air mass that has been recently influenced by continental emissions (Carlson and Prospero, 1972).
Radon was measured on all cruises starting with ACE-1 except AEROSOL99, INDOEX, NAURU99, and DYNAMO. Radon (222Rn – half-life of 3.82 d) was measured using the two-filter detector method of Whittlestone and Zahorowski (1998). Air is drawn through a HEPA filter which removes all radon and thoron decay products (i.e., daughters), then through a delay chamber in which some daughters are produced. Finally, the air passes through a second filter which retains the daughters. These daughters have been produced in controlled conditions so their number is proportional to the radon concentration. A photomultiplier then counts the radon daughters produced in a 750 L decay tank for a 30 min period. The detector was standardized using radon emitted from a dry radon source (RN-25, PylonElectronics Corp). Background counts were measured under conditions of zero air flow (Quinn et al., 2022).
3.5.4 DMS
Air and seawater samples for DMS were analyzed using an automated purge and trap system. Air samples were collected through a Teflon line which ran approximately 60 m from the top of the aerosol sampling mast to the instrument. One hundred mL min−1 of the 4 L min−1 flow were pulled through a KI solution at the instrument to eliminate oxidant interferences (Cooper and Saltzman, 1993). The air sample volume ranged from 0.5 to 1.5 L depending on the DMS concentration. Water vapor was removed by passing the flow through a −25 °C Teflon tube filled with silanized glass wool. DMS was then trapped in another −25 °C Teflon tube filled with Tenax. During the sample trapping period, methylethyl sulfide (MES) was added to the sample stream as an internal standard. At the end of the sampling/purge period, the coolant was pushed away from the trap and the trap was electrically heated. DMS was desorbed onto a DB-1 mega-bore fused silica column where the sulfur compounds were separated isothermally at 50 °C quantified with either a Flame Photo Detector (FPD) or a Sulfur Chemiluminescence Detector (SCD). The instrument was calibrated gravimetrically with calibrated permeation tubes. More details of the analysis can be found in Bates et al. (1998b).
3.6 Seawater species
The cruises each seawater species was measured on and the measurement methods used are listed in Table 6.
Table 6Measurements of seawater species on each cruise and the instrumentation used.
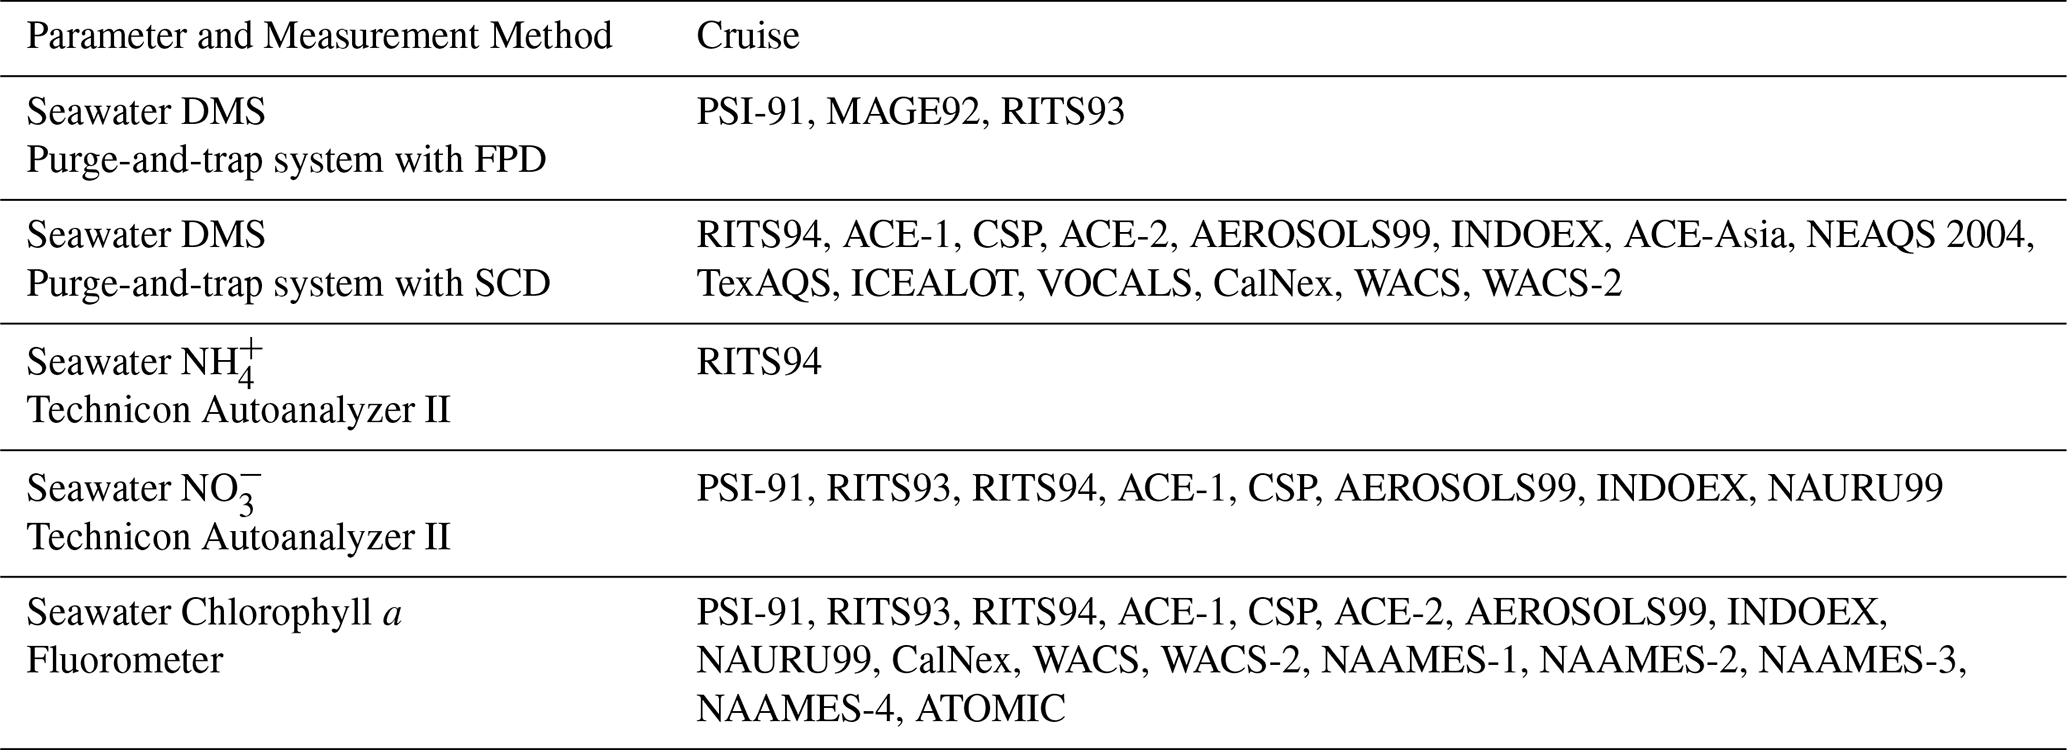
3.6.1 DMS
Seawater samples for DMS analysis were collected from the ship's seawater pumping system at a depth of approximately 5 m below the ship's waterline. Periodically, a 5 mL water sample was valved from the ship's water line into a Teflon gas stripper. The sample was purged with hydrogen for 5 min. DMS and other sulfur gases in the hydrogen purge gas were collected on the Tenax trap held at −25 °C as for the air samples. Seawater and air sample analysis was identical.
3.6.2 and
Seawater samples for the analysis of and were taken from a depth of ∼5 m using the ship's seawater pumping system. Samples were analyzed for using the phenolhypochlorite colorimetric method of Solarzano (1969) and for using the method of Parsons et al. (1984). Both of the analyses were undertaken with a Technicon Autoanalyzer II (Technicon Corp., Tarrytown, New York).
3.6.3 Chlorophyll a
Discrete seawater samples for chlorophyll a analysis were taken from the ship's seawater pumping system 2 to 6 times per day. Samples were immediately filtered, put into 10 mL of 90 % acetone, and frozen. Samples were analyzed with a fluorometer within 3 to 4 d onboard the ship. Depending on the cruise, the fluorometer was calibrated several times during, before, or after the experiment usually with algal chlorophyll a (Sigma Chemical Corp.). The discrete samples were used to calibrate continuous fluorescence measurements of seawater also from the ship's underway seawater pumping system.
3.7 Ancillary parameters
Ancillary meteorological and seawater parameters were routinely measured on all cruises. These parameters include latitude, longitude, ship's speed and course, true wind speed and direction, relative wind speed and direction, ambient temperature and relative humidity, barometric pressure, and rain rate. Radiosonde data are available for all cruises except PSI-91, MAGE92, RITS93, RITS94, DYNAMO, and WACS. Seawater parameters include sea surface temperature and salinity.
Listed below are many of the high-level major findings reported by PMEL based on its global ocean data set of marine aerosol properties. Although they may seem fundamental now, they are a result of early foundational measurements built upon over time with additional cruises in different parts of the world's oceans. These findings were not developed solely by PMEL but along with other pioneering shipboard and aircraft measurements made by many other researchers.
-
Measurements of key sulfur species in surface seawater show that most seawater DMS is microbially consumed in the water column, while the ocean-to-atmosphere flux of DMS is a minor sink in the seawater sulfur cycle (Bates et al., 1994) (Data from PSI-91).
-
The mean surface seawater DMS concentration in the equatorial Pacific (15° S to 15° N) is relatively constant seasonally and interannually. Large interannual variations associated with El Nino – Southern Oscillation (ENSO) events appear to have little effect on the concentration of DMS in tropical surface ocean waters (Bates et al., 1994). (Data from MAGE92, RITS93, RITS94, ACE-1, CSP and previous cruises not described here).
-
New particle production in the marine boundary layer is rare due to the high surface area of sea salt aerosol resulting in the condensation of gas phase precursors onto existing aerosol (Quinn et al., 1993; Covert et al., 1996; Bates et al., 1998b). (Data from PSI-91, MAGE92, RITS93, RITS94, ACE-1).
-
The marine aerosol number size distribution has modal characteristics that depend on large scale meteorological features and marine boundary layer residence times. Strong subsidence and entrainment from the FT produce an aerosol dominated by particles in the ultra – fine and Aitken modes (∼2 to 80 nm). Residence time in the MBL of a few days or more results in a bimodal aerosol with Aitken and accumulation modes (80 to 300 nm in diameter) (Covert et al., 1996; Quinn et al., 1996; Bates et al., 1998b; Bates et al., 2000; Bates et al., 2001; Bates et al., 2002; Quinn et al., 2017). (Data from MAGE92, RITS93, RITS94, ACE-1, ACE-2, AEROSOL99, ICEALOT, WACS-2, NAAMES-1).
-
Regional and mesoscale meteorological transport patterns impact aerosol number and volume distributions, chemical composition, and optical and cloud-nucleating properties (Bates et al., 2001; Bates et al., 2002; Bates et al., 2004; Bates et al., 2008; Quinn et al., 2022). (Data from ACE-1, ACE-2, AEROSOLS99, ACE-Asia, NEAQS 2002, NEAQS 2004, TexAQS, ATOMIC).
-
Sea salt can comprise a significant mass fraction of not only supermicron but also submicron aerosol in the marine atmosphere. Its relatively large mass concentration, high scattering efficiency, and lifetime comparable to other submicron chemical components often results in submicron sea salt being the dominant contributor to submicron scattering in the marine boundary layer (Quinn et al., 1996, 1998; Murphy et al., 1998; Quinn et al., 1999; Quinn et al., 2000; Quinn and Bates, 2005). (Data from PSI-91, MAGE92, RITS93, RITS94, ACE-1, ACE-2, AEROSOLS99, INDOEX, ACE-Asia, CSP, NEAQS 2002).
-
Instantaneous wind speed often only accounts for a small fraction of the variance in the coarse mode number concentration (∼30 %) and sea salt submicron and supermicron mass concentrations (∼20 % to 78 %) due to variability in upwind conditions and advection to the measurement location (Bates et al., 1998b; Quinn et al., 1999). (Data from PSI-91, MAGE92, RITS93, RITS94, ACE-1).
-
A variable and often large fraction of submicron aerosol mass in the marine boundary layer, both remote and continentally influenced, is composed of species other than non-sea salt sulfate (Mcinnes et al., 1996; Quinn et al., 2000; Quinn et al., 2005a). (Data from PSI-91, MAGE92, RITS93, RITS94, ACE-1, ACE-2, AEROSOLS99, INDOEX, ACE-Asia, CSP, NEAQS 2002).
-
Sea salt makes up a small fraction of marine boundary layer cloud condensation nuclei (Quinn et al., 2017; Quinn et al., 2019). Instead, the CCN population between 70° S and 80° N is composed primarily of nss SO due to large-scale meteorological features that result in entrainment of particles from the FT into the MBL and regionally varying MBL aerosol residence times. (Data from RITS93, RITS94, ACE-1, ICEALOT, WACS-2, NAAMES-1, NAAMES-2, NAAMES-3, NAAMES-4).
-
Particulate organic matter and its degree of oxidation impacts the relative humidity dependence of light scattering and aerosol cloud nucleation (Quinn et al., 2005, 2008). (Results from INDOEX, ACE-Asia, NEAQS 2002, TexAQS).
Examples of previous uses of the data based on PMEL co-authorship are listed below. Future use of the data is likely to be similar but could be expanded, for example, to halogen chemistry relating to sea spray aerosol.
-
Constraints on models and parameterizations (e.g., Global distribution of sea salt aerosols: new constraints from in situ and remote observations, Jaegle et al., 2011; A review of sea-spray aerosol source functions using a large global set of sea salt aerosol concentration measurements, Gyrthe et al., 2014; Atmospheric sulfur cycle simulated in the global model GOCART' Comparison with field observations and regional budgets, Chin et al., 2000; Modelled radiative forcing of the direct aerosol effect with multi-observation evaluation, Myhre et al., 2009; Numerical study of Asian dust transport during the springtime of 2001 simulated with the Chemical Weather Forecasting System (CFORS) model, Uno et al., 2004; CCN predictions using simplified assumptions of organic aerosol composition and mixing state: a synthesis from six different locations, Ervens et al., 2010; A model for the radiative forcing during ACE-Asia derived from CIRPAS Twin Otter and R/V Ronald H. Brown data and comparison with observations, Conant et al., 2003; Global sea-salt modeling: Results and validation against multicampaign shipboard measurements, Witek et al., 2007; The Global Aerosol Synthesis and Science Project (GASSP), Reddington et al., 2017).
-
Intercomparison of instruments and methods (e.g., ACE-Asia intercomparison of a thermal-optical method for the determination of particle-phase organic and elemental carbon, Schauer et al., 2003; Bias in filter based aerosol absorption measurements due to organic aerosol loading: Evidence from ambient measurements, Lack et al., 2008; Comparison of aerosol single scattering albedos derived by diverse techniques in two North Atlantic experiments, Russell et al., 2002).
-
Comparison to and validation of remote retrievals (e.g., Measurements of aerosol vertical profiles and optical properties during INDOEX 1999 using micropulse lidars, Welton et al., 2002; Geostationary satellite retrievals of aerosol optical thickness during ACE-Asia, Wang et al., 2003; Clear-sky infrared aerosol radiative forcing at the surface and the top of the atmosphere, Markovic et al., 2003; Spectral absorption of solar radiation by aerosols during ACE-Asia, Bergstrom et al., 2004; Lidar measurements during Aerosols99, Voss et al., 2001; Multi-grid-cell validation of satellite aerosol property retrievals in INTEX/ITCT/ICARTT 2004, Russell et al., 2007; Shipboard sunphtometer measurements of aerosol optical depth spectra and columnar water vapor during ACE 2 and comparison with selected land, ship, aircraft, and satellite measurements).
-
Addition to larger data sets (e.g., Maritime aerosol network as a component of aerosol robotic network, Smirnov et al., 2009; Total observed organic carbon (TOOC) in the atmosphere: a synthesis of North American observations, Heald et al., 2008; A global database of sea surface DMS measurements and a simple model to predict sea surface DMS as a function of latitude, longitude and month, Kettle et al., 1999).
Table 7Summary of cruise data links (DOIs), and references. See Table 1 for dates, ports, and ocean region for each cruise. The data are permanently and publicly available at NOAA's NCEI.
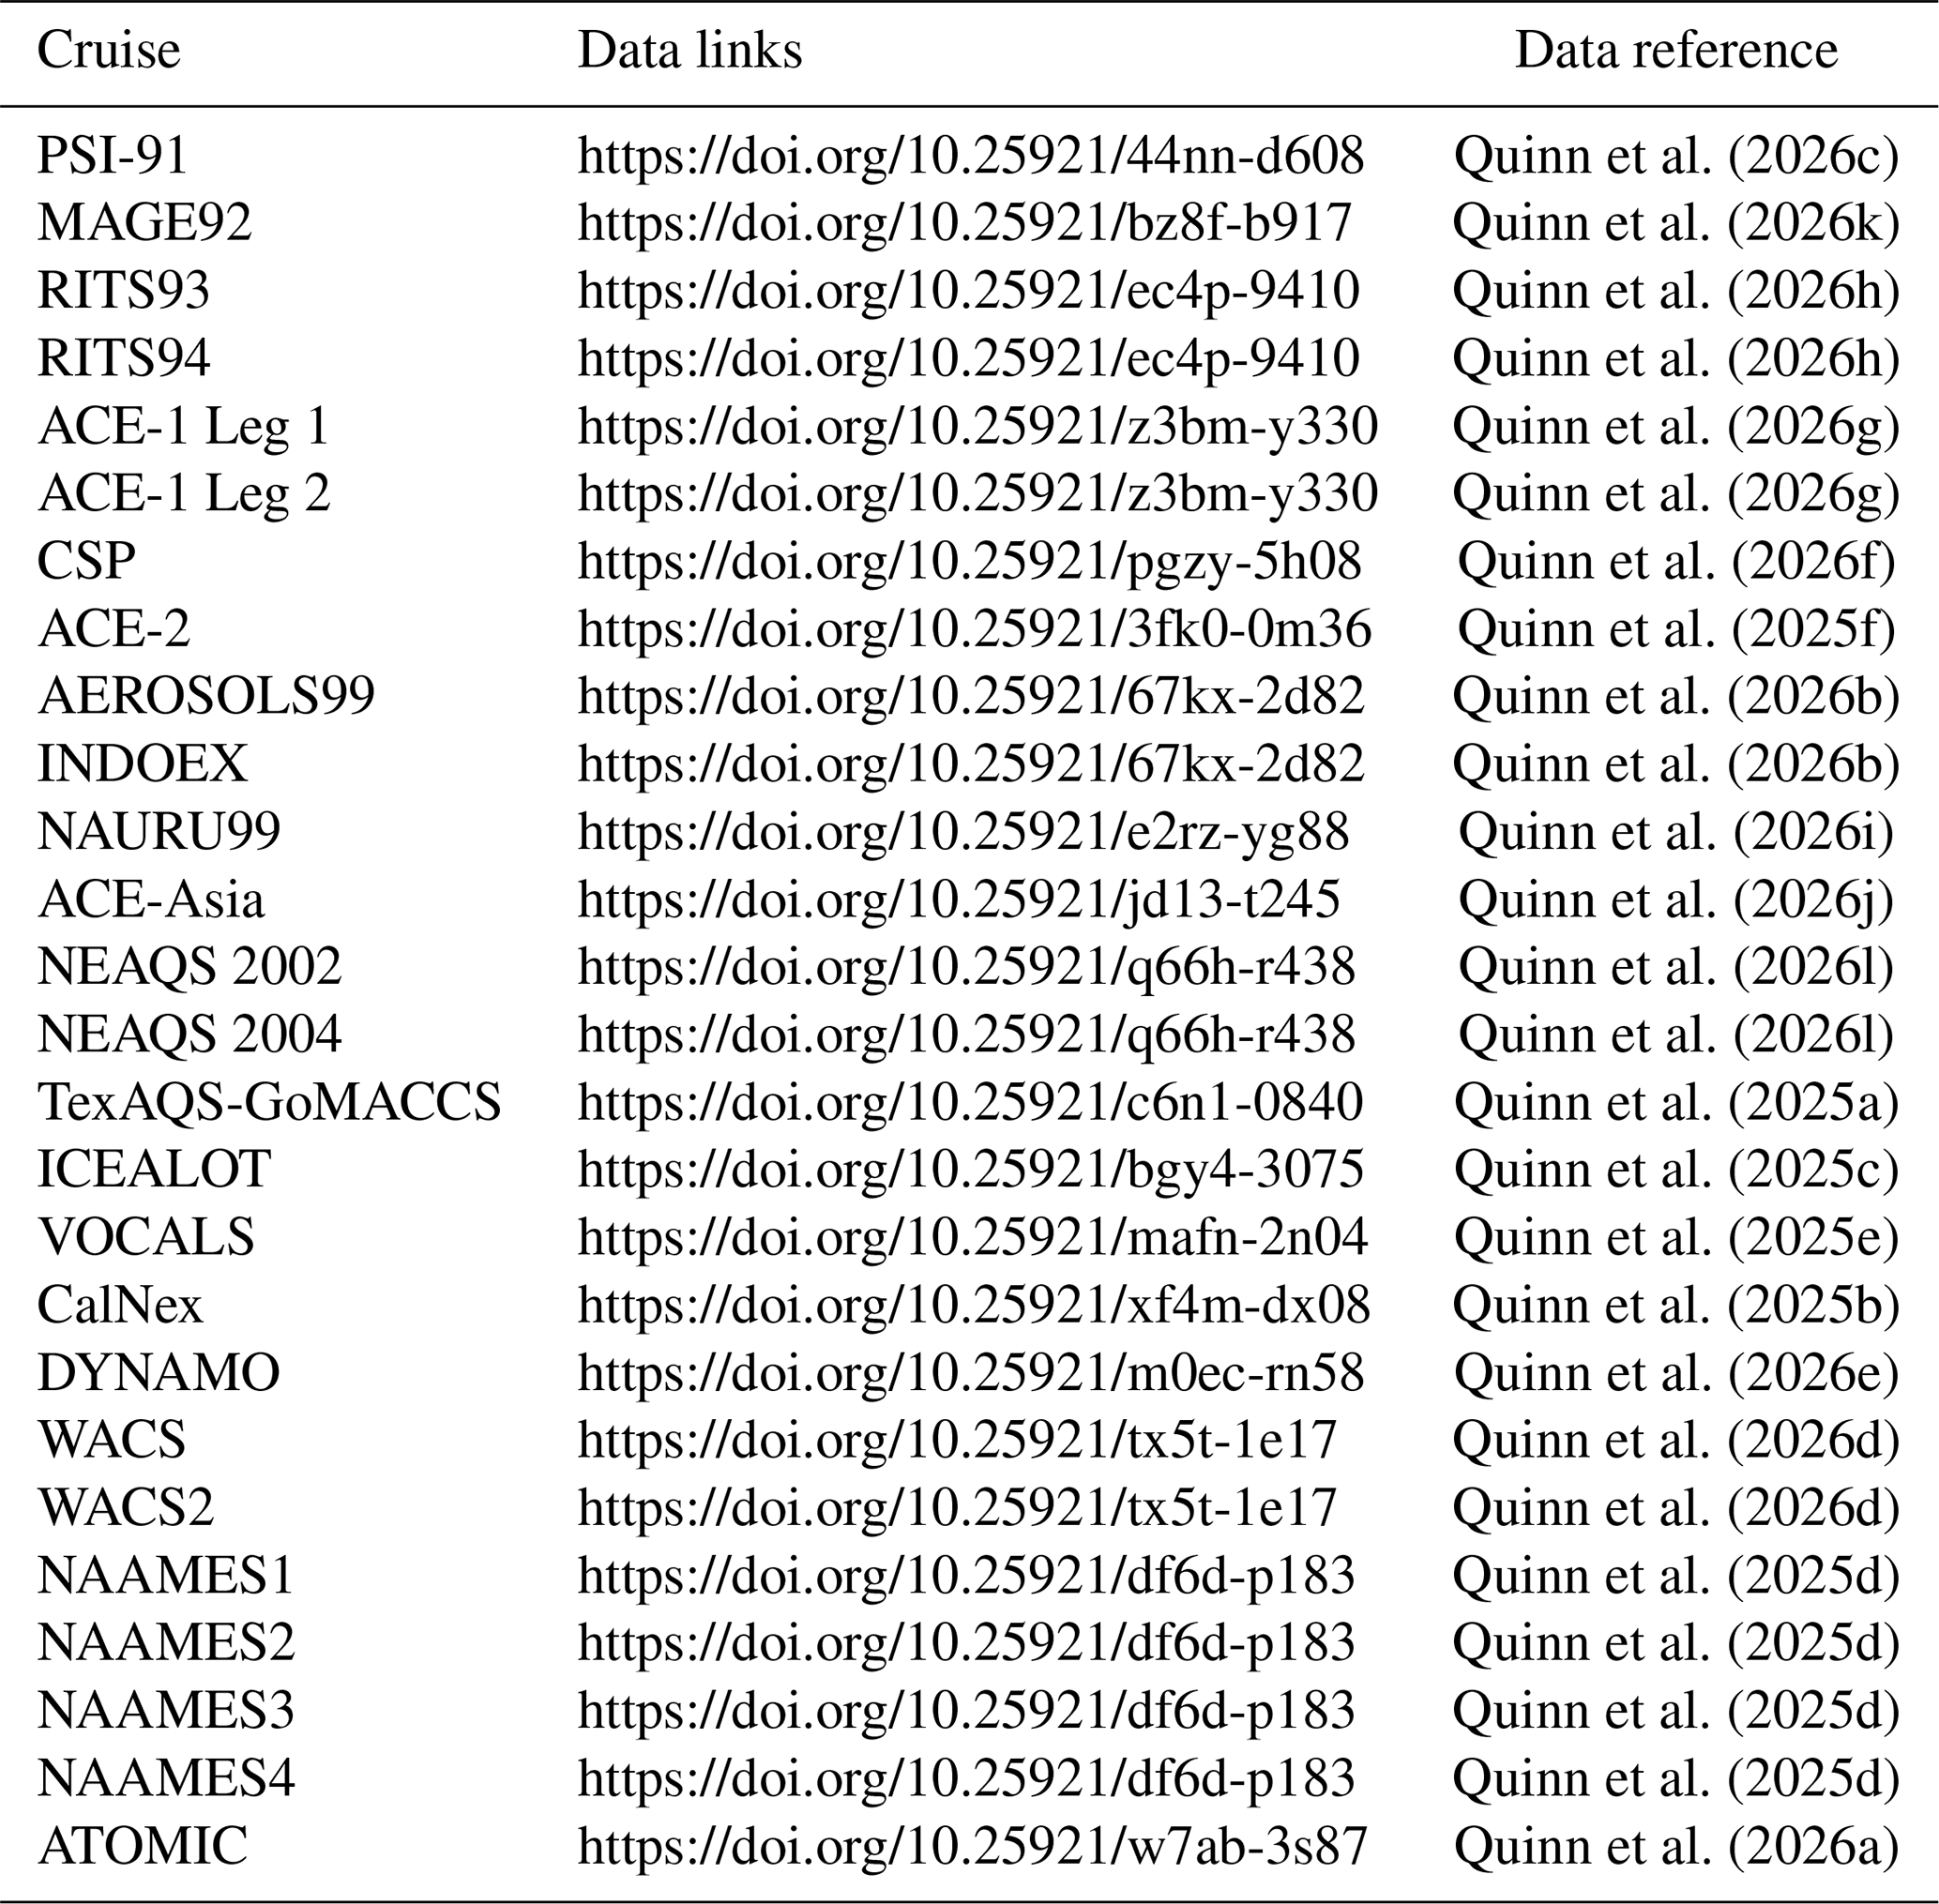
All cruise data sets are publicly available at NOAA's National Centers for Environmental Information (https://www.ncei.noaa.gov, NOAA, 2025) (see also the list of all data sets in Table 7). Cruise identification, data links (DOIs), and data references are provided in Table 7. The data are permanently and publicly available at NCEI.
PMEL conducted 25 cruises between 1991 and 2020 measuring aerosol chemical, microphysical, optical, and cloud nucleating properties. These cruises provide coverage in all of the world's oceans resulting in the largest global ocean data set of marine aerosol properties. The data set also includes gas phase and seawater species. PMEL's major findings and data usage by others are summarized. A description of each cruise is provided including location, timing, and objectives. References are cited to provide a deeper context for each cruise. The intention of the paper is to advance widespread use of the data by the broader research community.
TSB and PKQ conceptualized research goals. PKQ, TSB, DJC, JEJ, and LMU participated in collecting and analyzing data. PKQ prepared the paper. DJC and HB prepared data sets for archival at NCEI.
The contact author has declared that none of the authors has any competing interests.
Publisher's note: Copernicus Publications remains neutral with regard to jurisdictional claims made in the text, published maps, institutional affiliations, or any other geographical representation in this paper. The authors bear the ultimate responsibility for providing appropriate place names. Views expressed in the text are those of the authors and do not necessarily reflect the views of the publisher.
We thank the crews of the NOAA R/Vs Discoverer, Surveyor, and Ronald H. Brown; USC R/V Vickers; the IBSS R/V Professor Vodyanitiskiy; and UNOLS R/Vs Atlantis, Roger Revelle, and Knorr who made this work possible. This is PMEL contribution no. 5806.
Funding was provided over the years by NOAA's Climate and Global Change Program, New England Air Quality Study, Health of the Atmosphere Program, Climate Program Office, and Oceanic and Atmospheric Research Office; NASA's Interdisciplinary Studies Program, Mission to Planet Earth Science Division, Global Aerosol Climatology Project, and Earth System Science Program; the NSF Atmospheric Chemistry Program; and the Office of Naval Research.
This paper was edited by Graciela Raga and reviewed by two anonymous referees.
Ahlquist, N. C. and Charlson, R. J.: A new instrument for evaluating the visual quality of air, JAPCA J. Air Waste Ma., 17, 467–469, 1967.
Aller, J., Radway, J. C., Kilthau, W. P., Bothe, D. W., Wilson, T. W., Vaillancourt, R. D., Quinn, P. K., Coffman, D. J., Murray, B. J., and Knopf, D. A.: Size-resolved characterization of the polysaccharided and proteinaceous components of seawater, Atmos. Environ., 154, 331–347, 2017.
Anderson, T. L. and Ogren, J.: Determining aerosol radiative properties using the TSI 3563 integrating nephelometer, Aerosol Sci. Tech., 29, 57–69, 1998.
Anderson, T. L., Covert, D. S., Marshall, S. F., Laucks, M. L., Charlson, R. J., Waggoner, A. P., Ogren, J., Caldow, R., Holm, R. L., Quant, F. R., Sem, G. J., Wiedensohler, A., Ahlquist, N. C., and Bates, T. S.: Performance characteristics of a high-sensitivity, three-wavelength total scatter/backscatter nephelometer, J. Atmos. Ocean. Tech., 13, 967–986, 1996.
Andreae, M. O., Ferek, R. J., Bermond, F., Byrd, K. P., Engstrom, T., Hardin, S., Houmere, P. D., LeMarrec, F., Raemdonch, H., and Chatfield, R. B.: Dimethyl sulfide in the marine atmosphere, J. Geophys. Res.-Atmos., 90, 12891–12900, 1985.
Bates, T. S., Kiene, R. P., Wolfe, G. V., Matrai, P. A., Chavez, F. P., Buck, K. R., Blomquist, B. W., and Cuhel, R. L.: The cycling of sulfur in surface seawater of the northeast Pacfic, J. Geophys. Res.-Atmos., 99, 7835–7843, 1994.
Bates, T. S., Huebert, B. J., Gras, J., Griffiths, F. B., and Durkee, P. A.: International Global Atmospheric Chemistry (IGAC) Projects' First Aerosol Characterization Experiment (ACE 1): Overview, J. Geophys. Res.-Atmos., 103, 16297–16318, 1998a.
Bates, T. S., Kapustin, V. N., Quinn, P. K., Covert, D. S., Coffman, D. J., Mari, C., Durkee, P. A., De Bruyn, W., and Saltzman, E. S.: Processes controlling the distribution of aerosol particles in the lower marine boundary layer during the First Aerosol Characterization Experiment (ACE 1), J. Geophys. Res.-Atmos., 103, 16369–16383, 1998b.
Bates, T. S., Quinn, P. K., Covert, D. S., Coffman, D. J., Johnson, J. E., and Wiedensohler, A.: Aerosol physical properties and processes in the lower marine boundary layer: A comparison of shipboard sub-micron data from ACE-1 and ACE-2, Tellus B, 52, 258–272, 2000.
Bates, T. S., Quinn, P. K., Coffman, D. J., Johnson, J. E., Miller, T. L., and Covert, D. S.: Regional physical and chemical properties of the marine boundary layer aerosol across the Atlantic during Aerosols99: An overview, J. Geophys. Res.-Atmos., 106, 20767–20782, 2001.
Bates, T. S., Coffman, D. J., Covert, D. S., and Quinn, P. K.: Regional marine boundary layer aerosol size distributions in the Indian, Atlantic and Pacific Oceans: A comparison of INDOEX measurements with ACE-1 and ACE-2, and Aerosols99, J. Geophys. Res.-Atmos., 107, 8026, 2002.
Bates, T. S., Quinn, P. K., Coffman, D. J., Covert, D. S., Miller, T. L., Johnson, J. E., Carmichael, G. R., Guazotti, S. A., Sodeman, D. A., Prather, K. A., Rivera, M., Russell, L. M., and Merrill, J. T.: Marine boundary layer dust and pollution transport associated with the passage of a frontal system over eastern Asia, J. Geophys. Res.-Atmos., 109, https://doi.org/10.1029/2003JD004094, 2004.
Bates, T. S., Quinn, P. K., Coffman, D. J., and Johnson, J. E.: The Dominance of Organic Aerosols in the Marine Boundary Layer over the Gulf of Maine during NEAQS 2002 and their Role in Aerosol Light Scattering, J. Geophys. Res.-Atmos., 110, https://doi.org/10.1029/2005JD005797, 2005.
Bates, T. S., Quinn, P. K., Coffman, D. J., Schulz, K., Covert, D. S., and Johnson, J. E.: Boundary Layer Aerosol Chemistry during TexAQS/GoMACCS 2006: Insights into Aerosol Sources and Transformation Processes, J. Geophys. Res.-Atmos., 113, https://doi.org/10.1029/2008JD010023, 2008.
Bates, T. S., Quinn, P. K., Frossard, A. A., Russell, L. M., Hakala, J., Petaja, T., Kulmala, M., Covert, D. S., Cappa, C. D., Li, S. M., Hayden, K. L., Nuaaman, I., McLaren, R., Massoli, P., Canagaratna, M. R., Onasch, T. B., Sueper, D., Worsnop, D. R., and Keene, W. C.: Measurements of ocean derived aerosol off the coast of California, J. Geophys. Res.-Atmos., 117, D00v15, https://doi.org/10.1029/2012jd017588, 2012.
Behrenfeld, M. J., Moore, R. H., Hostetler, C. A., Graff, J., Gaube, P., Russell, L. M., Chen, G., Doney, S. C., Giovannoni, S., Liu, H., Proctor, C., Bolanos, L. M., Davie-Martin, C., Westberry, T. K., Bates, T. S., Bell, T., Bidle, K. D., Boss, E. S., Brooks, S. D., Cairns, B., Carlson, C., Halsey, K., Harvey, E. L., Hu, C., Karp-Boss, L., Kleb, M., Menden-Deuer, S., Morison, F., Quinn, P. K., Scarino, A. J., Anderson, B., Chowdhary, J., Crosbie, E., Ferrare, R., Hair, J. W., Hu, Y., Janz, S., Redemann, J., Saltzman, E., Shook, M., Siegel, D. A., Wisthaler, A., and Martin, M. Y.: The North Atlantic aerosol and marine ecosystem study (NAAMES): Science motive and mission overview, Frontiers of Marine Science, 22, https://doi.org/10.3389/fmars.2019.00122, 2019.
Berg, O. H., Swietlicki, E., and Krejci, R.: Hygroscopic growth of the aerosol particles in the marine boundary layer over the Pacfic and Southern Oceans during the First Aerosol Characterization Experiment (ACE 1), J. Geophys. Res.-Atmos., 103, 16535–16546, 1998.
Bergstrom, R. W., Pilewskie, P., Schmid, B., Redemann, J., Russell, P. B., Hiragashi, A., Nakajima, T., and Quinn, P. K.: Spectral absorption of solar radiation by aerosols during ACE-Asia, J. Geophys. Res.-Atmos., 109, https://doi.org/10.1029/2003JD004467, 2004.
Berner, A., Lurzer, C., Pohl, F., Preining, O., and Wagner, P.: The size distribution of the urban aerosol in Vienna, Sci. Total Environ., 13, 245–261, 1979.
Birch, M. E. and Cary, R. A.: Elemental carbon-based method for monitoring occupational exposures to particulate diesel exhaust, Aerosol Sci. Tech., 25, 221–241, 1996.
Bodhaine, B. A., Alhquist, N. C., and Schnell, R. C.: Three-wavelength nephelometer suitable for aircraft measurements os background aerosol scattering extinction coefficient, Atmos. Environ., 25A, 2267–2276, 1991.
Bond, T. C., Anderson, T. L., and Campbell, D.: Calibration and intercomparison of filter-based measurements of visible light absorption by aerosols, Aerosol Sci. Tech., 30, 582–600, 1999.
Braaten, D. A. and Cahill, T. A.: Size and composition of Asian dust transported to Hawaii, Atmos. Environ., 20, 1105–1109, 1986.
Buck, N. J., Barrett, P. M., Morton, P. L., Landing, W. M., and Resing, J. A.: Energy dispersive X-ray fluorescence methodology and analysis of suspended particulate matter in seawater for trace element compositions and an intercomparison with high-resolution inductively coupled plasma-mass spectrometry, Limnol. Oceanogr.-Meth., 19, 401–415, 2021.
Carlson, T. N. and Prospero, J. M.: The large-scale movement of Saharan air outbreaks over the northern equatorial Atlantic, J. Appl. Meteorol., 11, 283–297, 1972.
Carrico, C. M., Kus, P., Rood, M. J., Quinn, P. K., and Bates, T. S.: Mixtures of pollution, dust, sea salt, and volcanic aerosol during ACE-Asia: Aerosol radiative properties as a function of relative humidity, J. Geophys. Res.-Atmos., 108, https://doi.org/10.1029/2003JD003405, 2003.
Charlson, R. J., Pueschel, R. F., and Horvath, H.: The direct measurement of atmospheric light scattering coefficient for studies of visibility and air pollution, Atmos. Environ., 1, 469–478, 1967.
Chin, M., Savoie, D. L., Huebert, B. J., Bandy, A. R., Thornton, D. C., Bates, T. S., Quinn, P. K., Saltzman, E. S., and De Bruyn, W.: Atmospheric sulfur cycle simulated in the global model GOCART: Comparison with field observations and regional budgets, J. Geophys. Res.-Atmos., 105, 24689–24712, 2000.
Clarke, A. D., Freitag, S., Simpson, R. M. C., Hudson, J. G., Howell, S. G., Brekhovskikh, V. L., Campos, T., Kapustin, V. N., and Zhou, J.: Free troposphere as a major source of CCN for the equatorial pacific boundary layer: long-range transport and teleconnections, Atmos. Chem. Phys., 13, 7511–7529, https://doi.org/10.5194/acp-13-7511-2013, 2013.
Conant, W. C., Seinfeld, J. H., Wang, J., Carmichael, G. R., Tang, Y., Uno, I., Flatau, P. J., Markowicz, K. M., and Quinn, P. K.: A model for the radiative forcing during ACE-Asia derived from CIRPAS Twin Otter and R/V Ronald H. Brown data and comparison with observations, J. Geophys. Res.-Atmos., 108, https://doi.org/10.1029/2002JD003260, 2003.
Cooper, D. J. and Saltzman, E. S.: Measurements of atmospheric dimethylsulfide, hydrogen sulfide, and carbon disulfide during GTE/CITE 3, J. Geophys. Res.-Atmos., 98, 23397–23410, 1993.
Corbett, J. J., Winebrake, J. J., Green, E. H., Kasibhatla, P., Eyring, V., and Lauer, A.: Mortality from ship emissions: A global assessment, Environ. Sci. Technol., 41, 8512–8518, https://doi.org/10.1021/Es071686z, 2007.
Covert, D. S., Kapustin, V. N., Quinn, P. K., and Bates, T. S.: New particle formation in the marine boundary layer, J. Geophys. Res.-Atmos., 97, 20581–20590, 1992.
Covert, D. S., Kapustin, V. N., Bates, T. S., and Quinn, P. K.: Physical properties of marine boundary layer aerosol particles of the mid-Pacific in relation to sources and meteorological transport, J. Geophys. Res.-Atmos., 101, 6919–6930, 1996.
Covert, D. S., Wiedensohler, A., and Russell, L. M.: Particle charging and transmission efficiencies of aerosol charge neutralizers, Aerosol Sci. Tech., 27, 206–214, 1997.
de Leeuw, G., Andreas, E. L., Anguelova, M. D., Fairall, C. W., Lewis, E. R., O'Dowd, C., Schulz, M., and Schwartz, S. E.: Production Flux of Sea Spray Aerosol, Rev. Geophys., 49, Rg2001, https://doi.org/10.1029/2010rg000349, 2011.
DeWitt, H. L., Coffman, D. J., Schulz, K. J., Brewer, A., Bates, T. S., and Quinn, P. K.: Atmospheric aerosol properties over the equatorial Indian Ocean and the impact of the Madden-Julia Oscillation, J. Geophys. Res.-Atmos., 118, https://doi.org/10.1002/jgrd.50419, 2013.
Ervens, B., Cubison, M. J., Andrews, E., Feingold, G., Ogren, J. A., Jimenez, J. L., Quinn, P. K., Bates, T. S., Wang, J., Zhang, Q., Coe, H., Flynn, M., and Allan, J. D.: CCN predictions using simplified assumptions of organic aerosol composition and mixing state: a synthesis from six different locations, Atmos. Chem. Phys., 10, 4795–4807, https://doi.org/10.5194/acp-10-4795-2010, 2010.
Fehsenfeld, F. C., Ancellet, G., Bates, T. S., Goldstein, A. J., Hardesty, R. M., Honrath, R., Law, K. S., Lewis, A. C., Leaitch, R., McKeen, S., Meagher, J., Parrish, D. D., Pszenny, A. A. P., Russell, P., Schlager, H., Seinfeld, J., Talbot, R., and Zbinden, R.: International Consortium for Atmospheric Research on Transport and Transformation (ICARTT): North America to Europe – Overview of the 2004 summer field study, J. Geophys. Res.-Atmos., 111, https://doi.org/10.1029/2006JD007829, 2006.
Formenti, P., Elbert, W., Maenhaut, W., Haywood, J., and Andreae, M. O.: Chemical composition of mineral dust aerosol during the Saharan Dust Experiment (SHADE) airborne campaign in the Cape Verde region, September 2000, J. Geophys. Res.-Atmos., 108, https://doi.org/10.1029/2002JD002648, 2003.
Grythe, H., Ström, J., Krejci, R., Quinn, P., and Stohl, A.: A review of sea-spray aerosol source functions using a large global set of sea salt aerosol concentration measurements, Atmos. Chem. Phys., 14, 1277–1297, https://doi.org/10.5194/acp-14-1277-2014, 2014.
Hawkins, L. N. and Russell, L. M.: Polysaccharides, Proteins, and Phytoplankton Fragments: Four Chemically Distinct Types of Marine Primary Organic Aerosol Classified by Single Particle Spectromicroscopy, Adv. Meteorol., 612132, https://doi.org/10.1155/2010/612132, 2010.
Heald, C. L., Goldstein, A. H., Allan, J. D., Aiken, A. C., Apel, E., Atlas, E. L., Baker, A. K., Bates, T. S., Beyersdorf, A. J., Blake, D. R., Campos, T., Coe, H., Crounse, J. D., DeCarlo, P. F., de Gouw, J. A., Dunlea, E. J., Flocke, F. M., Fried, A., Goldan, P., Griffin, R. J., Herndon, S. C., Holloway, J. S., Holzinger, R., Jimenez, J. L., Junkermann, W., Kuster, W. C., Lewis, A. C., Meinardi, S., Millet, D. B., Onasch, T., Polidori, A., Quinn, P. K., Riemer, D. D., Roberts, J. M., Salcedo, D., Sive, B., Swanson, A. L., Talbot, R., Warneke, C., Weber, R. J., Weibring, P., Wennberg, P. O., Worsnop, D. R., Wittig, A. E., Zhang, R., Zheng, J., and Zheng, W.: Total observed organic carbon (TOOC) in the atmosphere: a synthesis of North American observations, Atmos. Chem. Phys., 8, 2007–2025, https://doi.org/10.5194/acp-8-2007-2008, 2008.
Holland, H. D.: The Chemistry of the Atmosphere and Oceans, John Wiley, New York, ISBN 0471035092, 1978.
Huebert, B. J., Bates, T. S., Russell, P. B., Shi, G., Kim, Y. J., Kawamura, K., Carmichael, G., and Nakajima, T.: An overview of ACE-Asia: Strategies for quantifying the relationships between Asian aerosols and their climatic impacts, J. Geophys. Res.-Atmos., 108, https://doi.org/10.1029/2003JD003550, 2003.
Jaeglé, L., Quinn, P. K., Bates, T. S., Alexander, B., and Lin, J.-T.: Global distribution of sea salt aerosols: new constraints from in situ and remote sensing observations, Atmos. Chem. Phys., 11, 3137–3157, https://doi.org/10.5194/acp-11-3137-2011, 2011.
Jahn, B.-M., Gallet, S., and Han, J.: Geochemistry of the Xining, Xifeng and Jixian section, Loess Plateau of China: Eolian dust provenanceand paleosol evolution during the last 140 k, Chem. Geol., 178, 71–94, 2001.
Jayne, J. T., Leard, D. C., Zhang, X., Davidovits, P., Smith, K. A., Kolb, C. E., and Worsnop, D. R.: Development of an aerosol mass spectrometer for size and composition analysis of submicron particles, Aerosol Sci. Tech., 33, 49–70, 2000.
Johnson, J. E., Gammon, R. H., Larsen, J., Bates, T. S., Oltmans, S. L., and Farmer, J. C.: Ozone in the marine boundary layer over the Pacific and Indian Oceans: Latitudinal Gradients and Diurnal Cycles, J. Geophys. Res.-Atmos., 95, 11847–11856, 1990.
Kasten, F. and Young, A. T.: Revised optical air mass tables and approximation formula, Appl. Optics, 28, 4735–4738, 1989.
Kaufman, Y. J., Koren, I., Remer, L., Tanre, D., Ginoux, P., and Fan, S.: Dust transport and deposition observed from the Terra-Moderate Resolution Imaging Spectroradiometer (MODIS) spacecraft over the Atlantic Ocean, J. Geophys. Res.-Atmos., 110, https://doi.org/10.1029/2003JD004436, 2005.
Kawamura, K., Hoque, M., Bates, T. S., and Quinn, P. K.: Molecular distributions and isotopic compositions of organic aerosols over the western North Atlantic: Dicarboxylic acids, related compounds, sugars and secondary organic aerosol tracers, Org. Geochem., 113, 229–238, 2017.
Keady, P. B., Quant, F. R., and Sem, G. S.: Differential mobility particle sizer: A new instrument for high resolution aerosol size distribution measurements below 1 micron, TSI Q., 9, 3–11, 1983.
Keene, W. C., Maring, H., Maben, J. R., Kieber, D. J., Pszenny, A. A. P., Dahl, E. E., Izaguirre, M. A., Davis, A. J., Long, M. S., Zhou, X. L., Smoydzin, L., and Sander, R.: Chemical and physical characteristics of nascent aerosols produced by bursting bubbles at a model air-sea interface, J. Geophys. Res.-Atmos., 112, D21202, https://doi.org/10.1029/2007jd008464, 2007.
Keene, W. C., Long, M. S., Reid, J. S., Frossard, A. A., Kieber, D. J., Maben, J., Russell, L. M., Kinsey, J. D., Quinn, P. K., and Bates, T. S.: Factors that modulate properties of primary marine aerosol generated from ambient seawater on ships at sea, J. Geophys. Res.-Atmos., 122, 11961–11990, 2017.
Kettle, A. J., Andreae, M. O., Amouroux, D., Andreae, T. W., and Bates, T. S.: A global database of sea surface dimethylsulfide (DMS) measurements and a simple model to predict sea surface DMS as a function of latitude, longitude and month, Global Biogeochem. Cy., 13, 399–444, 1999.
Lack, D. A., Cappa, C. D., Covert, D. S., Baynard, T., Passoli, P., Sierau, G., Bates, T. S., Quinn, P. K., Lovejoy, E. R., and Ravishankara, A. R.: Bias in filter based aerosol absorption measurements due to organic aerosol loading: Evidence from ambient measurements, Journal of Aerosol Science and Technology, 42, https://doi.org/10.1080/02786820802389277, 2008.
Li, J., Carlson, B. E., Yung, Y. L., Lv, D., Hansen, J., Penner, J., Liao, H., Ramaswamy, V., Kahn, R., Zhang, P., Dubovik, O., Ding, A., Lacis, A. A., Zhang, L., and Dong, Y.: Scattering and absorbing aerosols in the climate system, Nature Reviews Earth and Environment, 3, 363–379, 2022.
Liu, B. Y. H. and Lee, K. W.: Efficiency of membrane and Nuclepore filters for submicrometer aerosols, Environ. Sci. Technol., 10, 345–350, 1976.
Livingston, J. M., Kapustin, V. N., Schmid, B., Russell, P. B., Quinn, P. K., Bates, T. S., Durkee, P. A., Smith, P. J., Freudenthaler, V., Wiegner, M., Covert, D. S., Gasso, S., Hegg, D. A., Collins, D. R., Flagan, R. C., Seinfeld, J. H., Vitale, V., and Tomasi, C.: Shipboard sunphotometer measurements of aerosol optical depth spectra and columnar water vapor during ACE-2 and comparison with selected land, ship, aircraft, and satellite measurements, Tellus B, 52, 594–619, 2000.
Logan, T., Xi, B., Dong, X., Obrecht, R., Li, Z., and Cribb, M.: A study of Asian dust plumes using satellite, surface, and aircraft measurements during the INTEX-B field experiment, J. Geophys. Res.-Atmos., 115, https://doi.org/10.1029/2010JD014134, 2010.
Malm, W. C., Sisler, J. F., Huffman, D., Eldred, R. A., and Cahill, T. A.: Spatial and seasonal trends in particle concentration and optical extinction in the United States, J. Geophys. Res.-Atmos., 99, 1347–1370, 1994.
Markovic, M. Z., Flatau, P. J., Vogelmann, A. M., Quinn, P. K., and Welton, E. J.: Clear-sky infrared aerosol radiative forcing at the surface and the top of the atmosphere, Q. J. Roy. Meteor. Soc., 129, 2927–2948, 2003.
McInnes, L. M., Quinn, P. K., Covert, D. S., and Anderson, T. L.: Gravimetric analysis, ionic composition, and associated water mass of the marine aerosol, Atmos. Environ., 30, 869–884, 1996.
Murphy, D. M., Anderson, J. R., Quinn, P. K., McInnes, L. M., Brechtel, F. J., Kreidenweis, S. M., Middlebrook, A. M., Posfai, M., Thomson, D. S., and Buseck, P. R.: Influence of sea-salt on aerosol radiative properties in the Southern Ocean marine boundary layer, Nature, 392, 62–65, 1998.
Myhre, G., Berglen, T. F., Johnsrud, M., Hoyle, C. R., Berntsen, T. K., Christopher, S. A., Fahey, D. W., Isaksen, I. S. A., Jones, T. A., Kahn, R. A., Loeb, N., Quinn, P., Remer, L., Schwarz, J. P., and Yttri, K. E.: Modelled radiative forcing of the direct aerosol effect with multi-observation evaluation, Atmos. Chem. Phys., 9, 1365–1392, https://doi.org/10.5194/acp-9-1365-2009, 2009.
NOAA: https://www.ncei.noaa.gov/ (last access: 15 September 2025), 2025.
Parrish, D. D., Allen, D. T., Bates, T. S., Estes, M., Fehsenfeld, F. C., Feingold, F., Ferrare, R., Hardesty, R. M., Meagher, J., Nielsen-Gammon, J., Pierce, R. B., Ryerson, T. B., Seinfeld, J., Trainer, M., and Williams, E.: Overview of the second Texas air quality study (TexAQS II) and the Gulf of Mexico atmospheric composition and climate study (GoMACCS), J. Geophys. Res.-Atmos., 114, https://doi.org/10.1029/2009JD011842, 2009.
Parsons, T. R., Maita, Y., and Lalli, C. M.: A Manual of Chemical and Biological Methods for Seawater Analysis, Pergamon, New York, ISBN 0-08-030288-2, 1984.
Penndorf, R.: Tables of refractive index for standard air and the Rayleigh scattering coefficient for the spectral region between 0.2 and 20 um and their application to atmospheric optics, J. Opt. Soc. Am., 47, 176–182, 1957.
Post, M. J. and Fairall, C. W.: Early results from the Nauru99 campaign on NOAA ship Ronald H. Brown, IGARS 2000, https://doi.org/10.1109/IGARSS.2000.858052, 2000.
Post, M. J., Fairall, C. W., Snider, J. B., Han, Y., White, A. B., Ecklund, W. L., Weickmann, K. M., Quinn, P. K., Cooper, D., Sekelsky, S. M., McIntosh, R. E., Minnett, P., and Knuteson, R. O.: The combined sensor program: an air-sea science mission in the central and western Pacific Ocean, B. Am. Meteorol. Soc., 78, 2797–2815, 1997.
Quinn, P. K. and Bates, T. S.: Regional aerosol properties: Comparisons of boundary layer measurements from ACE 1, ACE 2, Aerosols99, INDOEX, ACE Asia, TARFOX, and NEAQS, J. Geophys. Res.-Atmos., 110, https://doi.org/10.1029/2004JD004755, 2005.
Quinn, P. K. and Coffman, D. J.: Comment on “Contribution of different aerosol species to the global aerosol extinction optical thickness: Estimates from model results” by Tegen et al., J. Geophys. Res.-Atmos., 104, 4241–4248, https://doi.org/10.1029/1998jd200066, 1999.
Quinn, P. K., Covert, D. S., Bates, T. S., Kapustin, V. N., Ramsey-Bell, D. C., and McInnes, L. M.: Dimethylsulfide/cloud condensation nuclei/climate system: Relevant size-resolved measurements of the chemical and physical properties of atmospheric aerosol particles, J. Geophys. Res.-Atmos., 98, 10411–10422, 1993.
Quinn, P. K., Marshall, S., Bates, T. S., Covert, D. S., and Kapustin, V. N.: Comparison of measured and calculated aerosol properties relevant to the direct radiative forcing of tropospheric sulfate aerosol particles, J. Geophys. Res.-Atmos., 100, 8977–8992, 1995.
Quinn, P. K., Kapustin, V. N., Bates, T. S., and Covert, D. S.: Chemical and optical properties of marine boundary layer aerosol particles of the mid-Pacific in relation to sources and meteorological transport, J. Geophys. Res.-Atmos., 101, 6931–6951, 1996.
Quinn, P. K., Coffman, D. J., Kapustin, V. N., Bates, T. S., and Covert, D. S.: Aerosol optical properties in the MBL during ACE-1 and the underlying chemical and physical aerosol properties, J. Geophys. Res.-Atmos., 103, 16547–16564, 1998.
Quinn, P. K., Bates, T. S., Miller, T. L., Coffman, D. J., Johnson, J. E., Harris, J. M., Ogren, J., Forbes, G., Anderson, T. L., Covert, D. S., and Rood, M. J.: Surface submicron aerosol chemical composition: What fraction is not sulfate?, J. Geophys. Res.-Atmos., 105, 6785–6805, 2000.
Quinn, P. K., Coffman, D. J., Bates, T. S., Miller, T. L., Johnson, J. E., Voss, K. J., Welton, E. J., and Neusüß, C.: Dominant aerosol chemical components and their contribution to extinction during the Aerosols99 cruise across the Atlantic, J. Geophys. Res.-Atmos., 106, 20783–20809, 2001.
Quinn, P. K., Bates, T. S., Baynard, T., Clarke, A., Onasch, T. B., Wang, W., Rood, M. J., Andrews, E., Allan, J., Carrico, C. M., Coffman, D. J., and Worsnop, D. R.: Impact of particulate organic matter on the relative humidity dependence of light scattering: A simplified parameterization, Geophys. Res. Lett., 32, https://doi.org/10.1029/2005GL024322, 2005.
Quinn, P. K., Bates, T. S., Coffman, D. J., Onasch, T. B., Worsnop, D. R., Baynard, T., de Gouw, J. A., Goldan, P. D., Kuster, W. C., Williams, E., Roberts, J. M., Lerner, B., Stohl, A., Pettersson, A., and Lovejoy, E. R.: Impacts of sources and aging on submicrometer aerosol properties in the marine boundary layer across the Gulf of Maine, J. Geophys. Res.-Atmos., 111, https://doi.org/10.1029/2006JD007582, 2006.
Quinn, P. K., Bates, T. S., Coffman, D. J., and Covert, D. S.: Influence of particle size and chemistry on the cloud nucleating properties of aerosols, Atmos. Chem. Phys., 8, 1029–1042, https://doi.org/10.5194/acp-8-1029-2008, 2008.
Quinn, P. K., Bates, T. S., Schultz, K. S., Coffman, D. J., Frossard, A. A., Russell, L. M., Keene, W. C., and Kieber, D. J.: Contribution of sea surface carbon pool to organic matter enrichment in sea spray aerosol, Nat. Geosci., 7, 228–232, https://doi.org/10.1038/ngeo2092, 2014.
Quinn, P. K., Collins, D. B., Grassian, V. H., Prather, K. A., and Bates, T. S.: Chemistry and related properties of freshly emitted sea spray aerosol, Chem. Rev., https://doi.org/10.1021/cr500713g, 2015.
Quinn, P. K., Coffman, D. J., Johnson, J. E., Upchurch, L. M., and Bates, T. S.: Small fraction of marine cloud condensation nuclei made up of sea spray aerosol, Nat. Geosci., 10, 674–679, 2017.
Quinn, P. K., Bates, T. S., Coffman, D. J., Upchurch, L. M., Moore, R., Ziemba, L., Bell, T., Saltzman, E. S., Graff, J., and Behrenfeld, M. J.: Seasonal variations in western North Atlantic remote marine aerosol properties, J. Geophys. Res.-Atmos., 124, 14240–14261, 2019.
Quinn, P. K., Thompson, E. J., Coffman, D. J., Baidar, S., Bariteau, L., Bates, T. S., Bigorre, S., Brewer, A., de Boer, G., de Szoeke, S. P., Drushka, K., Foltz, G. R., Intrieri, J., Iyer, S., Fairall, C. W., Gaston, C. J., Jansen, F., Johnson, J. E., Krüger, O. O., Marchbanks, R. D., Moran, K. P., Noone, D., Pezoa, S., Pincus, R., Plueddemann, A. J., Pöhlker, M. L., Pöschl, U., Quinones Melendez, E., Royer, H. M., Szczodrak, M., Thomson, J., Upchurch, L. M., Zhang, C., Zhang, D., and Zuidema, P.: Measurements from the RV Ronald H. Brown and related platforms as part of the Atlantic Tradewind Ocean-Atmosphere Mesoscale Interaction Campaign (ATOMIC), Earth Syst. Sci. Data, 13, 1759–1790, https://doi.org/10.5194/essd-13-1759-2021, 2021.
Quinn, P. K., Bates, T. S., Coffman, D. J., Upchurch, L. M., and Johnson, J. E.: Wintertime observations of tropical northwest Atlantic aerosol properties during ATOMIC: Varying mixtures of dust and biomass burning, J. Geophys. Res.-Atmos., 127, https://doi.org/10.1029/2021JD036253, 2022.
Quinn, P. K., Bates, T. S., and Coffman, D. J.: Texas Air Quality – Gulf of Mexico Atmospheric Composition and Climate Study (TexAQS/GoMACCS): Physical, optical, and chemical properties of atmospheric marine aerosols aboard NOAA R/V Ronald H. Brown in the Gulf of America, 2006-07-27 to 2006-09-12 (NCEI Accession 0310784), NOAA National Centers for Environmental Information [data set], https://doi.org/10.25921/c6n1-0840, 2025a.
Quinn, P. K., Bates, T. S., and Coffman, D. J.: California Research at the Nexus of Air Quality and Climate Change (CalNex) Field Campaign: Physical, optical, and chemical properties of atmospheric marine aerosols aboard WHOI R/V Atlantis along the California coast, 2010-05-14 to 2010-06-09 (NCEI Accession 0310783), NOAA National Centers for Environmental Information [data set], https://doi.org/10.25921/xf4m-dx08, 2025b.
Quinn, P. K., Bates, T. S., and Coffman, D. J.: International Chemistry Experiment in the Arctic Lower Troposphere (ICEALOT): Physical, optical, and chemical properties of atmospheric marine aerosols aboard WHOI R/V Knorr in Arctic ice-free regions of the Greenland, Norwegian, and Barents seas, 2008-03-19 to 2009-04-24 (NCEI Accession 0310737), NOAA National Centers for Environmental Information [data set], https://doi.org/10.25921/bgy4-3075, 2025c.
Quinn, P. K., Bates, T. S., and Coffman, D. J.: North Atlantic Aerosols and Marine Ecosystems Study (NAAMES): Physical, optical, and chemical properties of atmospheric marine aerosols aboard WHOI R/V Atlantis in the western subarctic North Atlantic, 2015 to 2018 (NCEI Accession 0310822), NOAA National Centers for Environmental Information [data set], https://doi.org/10.25921/df6d-p183, 2025d.
Quinn, P. K., Bates, T. S., and Coffman, D. J.: VAMOS Ocean-Cloud-Atmosphere-Land Study – Regional Experiment (VOCALS-REx): Physical, optical, and chemical properties of atmospheric marine aerosols aboard NOAA R/V Ronald H. Brown in the tropical eastern Pacific, 2008-10-20 to 2008-12-01 (NCEI Accession 0310622), NOAA National Centers for Environmental Information [data set], https://doi.org/10.25921/mafn-2n04, 2025e.
Quinn, P. K., Bates, T. S., and Coffman, D. J.: The second Aerosol Characterization Experiment (ACE-2): Physical, optical, and chemical properties of atmospheric marine aerosols aboard IBSS R/V Vodyanitskiy in the subtropical northeast Atlantic, 1997-06-19 to 1997-07-23 (NCEI Accession 0311148), NOAA National Centers for Environmental Information [data set], https://doi.org/10.25921/3fk0-0m36, 2025f.
Quinn, P. K., Bates, T. S., and Coffman, D. J.: Atlantic Tradewind Ocean-Atmosphere Mesoscale Interaction Campaign (ATOMIC): Physical, optical, and chemical properties of atmospheric marine aerosols aboard NOAA R/V Ronald H. Brown in the tropical North Atlantic, 2020-01-07 to 2020-02-11 (NCEI Accession 0311369), NOAA National Centers for Environmental Information [data set], https://doi.org/10.25921/w7ab-3s87, 2026a.
Quinn, P. K., Bates, T. S., and Coffman, D. J.: Indian Ocean Experiment (INDOEX): Physical, optical, and chemical properties of atmospheric marine aerosols aboard NOAA R/V Ronald H. Brown in the Atlantic and Indian Oceans, 1999-01-14 to 1999-03-31 (NCEI Accession 0312108), NOAA National Centers for Environmental Information [data set], https://doi.org/10.25921/67kx-2d82, 2026b.
Quinn, P. K., Bates, T. S., and Coffman, D. J.: Pacific Sulfur-Stratus Investigation (PSI): Physical and chemical properties of atmospheric marine aerosols aboard NOAA R/V Discoverer off the coast of Washington state, 1991-04-16 to 1991-05-01 (NCEI Accession 0311260), NOAA National Centers for Environmental Information [data set], https://doi.org/10.25921/44nn-d608, 2026c.
Quinn, P. K., Bates, T. S., and Coffman, D. J.: Western Atlantic Climate Study (WACS): Physical, optical, and chemical properties of atmospheric marine aerosols in Georges Bank and the Sargasso Sea aboard NOAA R/V Ronald H. Brown (2012-08-19 to 2012-08-28) and WHOI R/V Knorr (2014-05-20 to 2014-06-06) (NCEI Accession 0310824), NOAA National Centers for Environmental Information [data set], https://doi.org/10.25921/tx5t-1e17, 2026d.
Quinn, P. K., Bates, T. S., and Coffman, D. J.: Dynamics of the Madden-Julian Oscillation (DYNAMO) Field Campaign: Physical, optical, and chemical properties of atmospheric marine aerosols aboard SIO R/V Roger Revelle in the equatorial Indian ocean, 2011-10-01 to 2011-12-07 (NCEI Accession 0310825), NOAA National Centers for Environmental Information [data set], https://doi.org/10.25921/m0ec-rn58, 2026e.
Quinn, P. K., Bates, T. S., and Coffman, D. J.: Combined Sensor Program (CSP): Physical, optical, and chemical properties of atmospheric marine aerosols aboard NOAA R/V Discoverer in the central and tropical western Pacific, 1996-03-15 to 1996-04-12 (NCEI Accession 0311408), NOAA National Centers for Environmental Information [data set], https://doi.org/10.25921/pgzy-5h08, 2026f.
Quinn, P. K., Bates, T. S., and Coffman, D. J.: Aerosol Characterization Experiment (ACE-1): Physical, optical, and chemical properties of atmospheric marine aerosols aboard NOAA R/V Discoverer in the southern hemisphere, 1995-10-13 to 1995-12-13 (NCEI Accession 0311430), NOAA National Centers for Environmental Information [data set], https://doi.org/10.25921/z3bm-y330, 2026g.
Quinn, P. K., Bates, T. S., and Coffman, D. J.: Radiatively Important Trace Species (RITS) Field Campaign: Physical, optical, and chemical properties of atmospheric marine aerosols aboard NOAA R/V Surveyor in the central Pacific, 1993-03-20 to 1993-05-08 and 1993-11-21 to 1994-01-08 (NCEI Accession 0310738), NOAA National Centers for Environmental Information [data set], https://doi.org/10.25921/ec4p-9410, 2026h.
Quinn, P. K., Bates, T. S., and Coffman, D. J.: NAURU-99 Field Campaign: Physical, optical, and chemical properties of atmospheric marine aerosols aboard NOAA R/V Ronald H. Brown in the southwestern Pacific, 1999-06-14 to 1999-07-16 (NCEI Accession 0311261), NOAA National Centers for Environmental Information [data set], https://doi.org/10.25921/e2rz-yg88, 2026i.
Quinn, P. K., Bates, T. S., and Coffman, D. J.: Asian Pacific Regional Aerosol Characterization Experiment (ACE-Asia): Physical, optical, and chemical properties of atmospheric marine aerosols aboard NOAA R/V Ronald H. Brown in the western Pacific, 2001-03-15 to 2001-04-20 (NCEI Accession 0311457), NOAA National Centers for Environmental Information [data set], https://doi.org/10.25921/jd13-t245, 2026j.
Quinn, P. K., Bates, T. S., and Coffman, D. J.: Marine Aerosol and Gas Exchange (MAGE-92) Field Campaign: Physical and chemical properties of atmospheric marine aerosols aboard NOAA R/V John Vickers in the tropical Pacific, 1992-02-21 to 1992-03-23 (NCEI Accession 0310736), NOAA National Centers for Environmental Information [data set], https://doi.org/10.25921/bz8f-b917, 2026k.
Quinn, P. K., Bates, T. S., and Coffman, D. J.: New England Air Quality Study (NEAQS): Physical, optical, and chemical properties of atmospheric marine aerosols aboard NOAA R/V Ronald H. Brown in the Gulf of Maine and the northwest Atlantic, 2002-07-12 to 2002-08-10 and 2004-07-05 to 2004-08-13 (NCEI Accession 0311433), NOAA National Centers for Environmental Information [data set], https://doi.org/10.25921/q66h-r438, 2026l.
Raes, F., Bates, T. S., McGovern, F., and Vanliedekerke, M.: The Second Aerosol Characterization Experiment, Tellus B, 52, 111–125, 2000.
Ramanathan, V., Crutzen, P. J., Lelieveld, J., Mitra, A. P., Althausen, D., Anderson, J., Andreae, M. O., Cantrell, W., Cass, G. R., Chung, C. E., Clarke, A. D., Coakley, J. A., Collins, W. D., Conant, W. C., Dulac, F., Heintzenberg, J., Heymsfield, A. J., Holben, B., Howell, S., Hudson, J., Jayaraman, A., Kiehl, J. T., Krishnamurti, T. N., Lubin, D., McFarquhar, G., Novakov, T., Ogren, J. A., Podgorny, I. A., Prather, K., Priestley, K., Prospero, J. M., Quinn, P. K., Rajeev, K., Rasch, P., Rupert, S., Sadourny, R., Satheesh, S. K., Shaw, G. E., Sheridan, P., and Valero, F. P. J.: Indian Ocean Experiment: An integrated analysis of the climate forcing effects of the great Indo-Asian haze, J. Geophys. Res.-Atmos., 106, 28371–28398, 2001.
Reddington, C. L., Carslaw, K. S., Stier, P., Schutgens, N., Coe, H., Liu, D., Allan, J., Browse, J., Pringle, K. J., Lee, L. A., Yoshioka, M., Johnson, J. S., Regayre, L. A., Spracklen, D. V., Mann, G. W., Clarke, A., Hermann, M., Henning, S., Wex, H., Kristensen, T. B., Leaitch, W. R., Poschl, U., Rose, D., Andreae, M. O., Schmale, J., Kondo, Y., Oshima, N., Schwarz, J., Nenes, A., Anderson, B., Roberts, G. C., Snider, J. R., Leck, C., Quinn, P. K., Chi, X., Ding, A., Jimenez, J., and Zhang, Q.: The Global Aerosol Synthesis and Science Project (GASSP), B. Am. Meteorol. Soc., 98, 1857–1877, 2017.
Reineking, A. and Porstendorfer, J.: Measurements of particle loss functions in a differential mobility analyzer for different flow rates, Aerosol Sci. Tech., 5, 483–487, 1986.
Roberts, G. C. and Nenes, A.: A continuous-flow streamwise thermal-gradient CCN chamber for atmospheric measurements, Aerosol Sci. Tech., 39, 206–221, 2005.
Russell, L. M., Hawkins, L. N., Frossard, A. A., Quinn, P. K., and Bates, T. S.: Carbohydrate-like composition of submicron atmospheric particles and their production from ocean bubble bursting, P. Natl. Acad. Sci. USA, 107, 6652–6657, 2010.
Russell, P. B., Redemann, J., Schmid, B., Bergstrom, R. W., Livingston, J. M., McIntosh, D. M., Ramirez, S. A., Hartley, S. A., Hobbs, P. V., Quinn, P. K., Carrico, C. M., Rood, M. J., Ostrom, E., Noone, K. J., von Hoyningen-Huene, W., and Remer, L.: Comparison of aerosol single scattering albedos derived by diverse techniques in two North Atlantic experiments, J. Atmos. Sci., 59, 609–619, 2002.
Russell, P. B., Livingston, J. M., Redemann, J., Schmid, B., Ramirez, S. A., Eilers, J., Kahn, R., Chu, D. A., Remer, L., Quinn, P. K., Rood, M. J., and Wang, W.: Multi-grid-cell validation of satellite aerosol property retrievals in INTEX/ITCT/ICARTT 2004, J. Geophys. Res.-Atmos., 112, https://doi.org/10.1029/2006JD007606, 2007.
Ryerson, T. B., Andrews, A. E., Angevine, W. M., Bates, T. S., Brock, C. A., Cairns, B., Cohen, R. C., Cooper, O. R., de Guow, J. A., Fehsenfeld, F. C., Ferrare, R., Fischer, M. L., Flagan, R. C., Goldstein, A. J., Hair, J. W., Hardesty, R. M., Hostetler, C. A., Jimenez, J. L., Langford, A. O., McCauley, E., McKeen, S., Molina, L. T., Nenes, A., Oltmans, S. J., Parrish, D. D., Pederson, J. R., Pierce, R. B., Prather, K., Quinn, P. K., Seinfeld, J., Senff, C. J., Sorooshian, A., Stutz, J., Surratt, J. D., Trainer, M., Volkamer, R., Williams, E., and Wofsy, S. C.: The 2010 California Research at the Nexus of Air Quality and Climate Change (CalNex) field study, J. Geophys. Res.-Atmos., 118, https://doi.org/10.1002/jgrd.50331, 2013.
Savoie, D. L. and Prospero, J. M.: Water-soluble potassium, calcium, and magnesium in the aerosols over the tropical North Atlantic, J. Geophys. Res.-Atmos., 85, 385–392, 1980.
Schauer, J. J., Mader, B. T., DeMinter, J. T., Heidemann, G., Bae, M. S., Seinfeld, J. H., Flagan, R. C., Cary, R. A., Smith, D., Huebert, B. J., Bertram, T. H., Howell, S., Kline, J. T., Quinn, P. K., Bates, T. S., Turpin, B. J., Lim, H., Yu, J. Z., Yang, H., and Keywood, M. D.: ACE-Asia intercomparison of a thermal-optical method for the determination of particle-phase organic and elemental carbon, Environ. Sci. Technol., 37, https://doi.org/10.1021/es020622f, 2003.
Seinfeld, J. H.: Atmospheric chemistry and physics of air pollution, John Wiley, ISBN 10:0-471-72017-8, 1986.
Shaw, G. E.: Sun Photometery, B. Am. Meteorol. Soc., 64, 4–9, 1983.
Smirnov, A., Holben, B. N., Slutsker, I., Giles, D. M., McClain, C. R., Eck, T. F., Sakerin, S. M., Macke, A., Croot, P., Zibordi, G., Quinn, P. K., Sciare, J., Kinne, S., Harvey, M., Smyth, T. J., Piketh, S., Zielinski, T., Proshutinsky, A., Goes, J. I., Nelson, N. B., Larouche, P., Radionov, V. F., Goloub, P., Krishna Moorthy, K., Matarrese, R., Robertson, E. J., and Jourdin, F.: Maritime aerosol network as a component Aerosol Robotic Network, J. Geophys. Res.-Atmos., 114, https://doi.org/10.1029/2008JD011257, 2009.
Solarzano, L.: Determination of ammonia in natural waters by the phenolhypochorite method, Limnol. Oceanogr., 14, 799–801, 1969.
Stevens, B., Bony, S., Farrell, D., Ament, F., Blyth, A., Fairall, C., Karstensen, J., Quinn, P. K., Speich, S., Acquistapace, C., Aemisegger, F., Albright, A. L., Bellenger, H., Bodenschatz, E., Caesar, K.-A., Chewitt-Lucas, R., de Boer, G., Delanoë, J., Denby, L., Ewald, F., Fildier, B., Forde, M., George, G., Gross, S., Hagen, M., Hausold, A., Heywood, K. J., Hirsch, L., Jacob, M., Jansen, F., Kinne, S., Klocke, D., Kölling, T., Konow, H., Lothon, M., Mohr, W., Naumann, A. K., Nuijens, L., Olivier, L., Pincus, R., Pöhlker, M., Reverdin, G., Roberts, G., Schnitt, S., Schulz, H., Siebesma, A. P., Stephan, C. C., Sullivan, P., Touzé-Peiffer, L., Vial, J., Vogel, R., Zuidema, P., Alexander, N., Alves, L., Arixi, S., Asmath, H., Bagheri, G., Baier, K., Bailey, A., Baranowski, D., Baron, A., Barrau, S., Barrett, P. A., Batier, F., Behrendt, A., Bendinger, A., Beucher, F., Bigorre, S., Blades, E., Blossey, P., Bock, O., Böing, S., Bosser, P., Bourras, D., Bouruet-Aubertot, P., Bower, K., Branellec, P., Branger, H., Brennek, M., Brewer, A., Brilouet, P.-E., Brügmann, B., Buehler, S. A., Burke, E., Burton, R., Calmer, R., Canonici, J.-C., Carton, X., Cato Jr., G., Charles, J. A., Chazette, P., Chen, Y., Chilinski, M. T., Choularton, T., Chuang, P., Clarke, S., Coe, H., Cornet, C., Coutris, P., Couvreux, F., Crewell, S., Cronin, T., Cui, Z., Cuypers, Y., Daley, A., Damerell, G. M., Dauhut, T., Deneke, H., Desbios, J.-P., Dörner, S., Donner, S., Douet, V., Drushka, K., Dütsch, M., Ehrlich, A., Emanuel, K., Emmanouilidis, A., Etienne, J.-C., Etienne-Leblanc, S., Faure, G., Feingold, G., Ferrero, L., Fix, A., Flamant, C., Flatau, P. J., Foltz, G. R., Forster, L., Furtuna, I., Gadian, A., Galewsky, J., Gallagher, M., Gallimore, P., Gaston, C., Gentemann, C., Geyskens, N., Giez, A., Gollop, J., Gouirand, I., Gourbeyre, C., de Graaf, D., de Groot, G. E., Grosz, R., Güttler, J., Gutleben, M., Hall, K., Harris, G., Helfer, K. C., Henze, D., Herbert, C., Holanda, B., Ibanez-Landeta, A., Intrieri, J., Iyer, S., Julien, F., Kalesse, H., Kazil, J., Kellman, A., Kidane, A. T., Kirchner, U., Klingebiel, M., Körner, M., Kremper, L. A., Kretzschmar, J., Krüger, O., Kumala, W., Kurz, A., L'Hégaret, P., Labaste, M., Lachlan-Cope, T., Laing, A., Landschützer, P., Lang, T., Lange, D., Lange, I., Laplace, C., Lavik, G., Laxenaire, R., Le Bihan, C., Leandro, M., Lefevre, N., Lena, M., Lenschow, D., Li, Q., Lloyd, G., Los, S., Losi, N., Lovell, O., Luneau, C., Makuch, P., Malinowski, S., Manta, G., Marinou, E., Marsden, N., Masson, S., Maury, N., Mayer, B., Mayers-Als, M., Mazel, C., McGeary, W., McWilliams, J. C., Mech, M., Mehlmann, M., Meroni, A. N., Mieslinger, T., Minikin, A., Minnett, P., Möller, G., Morfa Avalos, Y., Muller, C., Musat, I., Napoli, A., Neuberger, A., Noisel, C., Noone, D., Nordsiek, F., Nowak, J. L., Oswald, L., Parker, D. J., Peck, C., Person, R., Philippi, M., Plueddemann, A., Pöhlker, C., Pörtge, V., Pöschl, U., Pologne, L., Posyniak, M., Prange, M., Quiñones Meléndez, E., Radtke, J., Ramage, K., Reimann, J., Renault, L., Reus, K., Reyes, A., Ribbe, J., Ringel, M., Ritschel, M., Rocha, C. B., Rochetin, N., Röttenbacher, J., Rollo, C., Royer, H., Sadoulet, P., Saffin, L., Sandiford, S., Sandu, I., Schäfer, M., Schemann, V., Schirmacher, I., Schlenczek, O., Schmidt, J., Schröder, M., Schwarzenboeck, A., Sealy, A., Senff, C. J., Serikov, I., Shohan, S., Siddle, E., Smirnov, A., Späth, F., Spooner, B., Stolla, M. K., Szkółka, W., de Szoeke, S. P., Tarot, S., Tetoni, E., Thompson, E., Thomson, J., Tomassini, L., Totems, J., Ubele, A. A., Villiger, L., von Arx, J., Wagner, T., Walther, A., Webber, B., Wendisch, M., Whitehall, S., Wiltshire, A., Wing, A. A., Wirth, M., Wiskandt, J., Wolf, K., Worbes, L., Wright, E., Wulfmeyer, V., Young, S., Zhang, C., Zhang, D., Ziemen, F., Zinner, T., and Zöger, M.: EUREC4A, Earth Syst. Sci. Data, 13, 4067–4119, https://doi.org/10.5194/essd-13-4067-2021, 2021.
Swietlicki, E., Hannsson, H.-C., Hameri, K., Svenningsson, B., Massling, A., Mcfiggans, G., McMurry, P. H., Petaja, T., Tunver, P., Gysel, M., Topping, D., Weingartner, E., Baltensperger, U., Rissler, J., Wiedensohler, A., and Kumala, M.: Hygroscopic properties of submicrometer atmospheric aerosol particles measured with H-TDMA instruments in various environments – A review, Tellus B, 60, 432–469, 2008.
Turpin, B. J. and Lim, H.: Species contribution to PM2.5 concentrations: Revisiting common assumptions for estimating organic mass, Aerosol Sci. Tech., 35, 602–610, 2001.
Uno, I., Satake, S., Carmichael, G. R., Tang, Y., Wang, Z., Takemura, T., Sugimoto, N., Shimizu, A., Murayama, T., Cahill, T. A., Cliff, S., Uematsu, M., Ohta, S., Quinn, P. K., and Bates, T. S.: Numerical study of Asian dust transport during the springtime of 2001 simulated with the CFORS model, J. Geophys. Res.-Atmos., 109, https://doi.org/10.1029/2003JD004222, 2004.
Virkkula, A., Ahlquist, N. C., Covert, D. S., Arnott, W. P., Sheridan, P. J., Quinn, P. K., and Coffman, D. J.: Modification, Calibration and a Field Test of an Instrument for Measuring Light Absorption by Particles, Aerosol Sci. Tech., 39, 68–83, 2005.
Voss, K. J., Welton, E. J., Quinn, P. K., Johnson, J. E., Thompson, A. M., and Gordon, H. R.: Lidar measurements during Aerosols99, J. Geophys. Res.-Atmos., 106, https://doi.org/10.1029/2001JD900217, 2001.
Wang, H. C. and John, W.: Particle density correction for the aerodynamic particle sizer, Aerosol Sci. Tech., 6, 191–198, 1987.
Wang, J., Flagan, R. C., Seinfeld, J. H., Jonsson, H. H., Collins, D. R., Russell, P. B., Schmid, B., Redemann, J., Livingston, J. M., Gao, S., Hegg, D. A., Welton, E. J., and Bates, D.: Clear-column radiative closure during ACE-Asia: Comparison of multiwavelength extinction derived from particle size and composition with results from Sun photometry, J. Geophys. Res.-Atmos., 107, https://doi.org/10.1029/2002JD002465, 2002.
Wang, J., Christopher, S. A., Brechtel, F. J., Kim, J., Schmid, B., Redemann, J., Russell, P. B., Quinn, P. K., and Holben, B. N.: Geostationary satellite retrievals of aerosol optical thickness during ACE-Asia, J. Geophys. Res.-Atmos., 108, https://doi.org/10.1029/2003JD003580, 2003.
Weber, R. J., Orsini, D., Daun, Y., Lee, Y.-N., Klotz, P. J., and Brechtel, F. J.: A particle-into-liquid collector for rapid measurement of aerosol bulk chemical composition, Aerosol Sci. Tech., 35, 718–727, 2001.
Welton, E. J., Voss, K. J., Quinn, P. K., Flatau, P. J., Markovic, M. Z., Campbell, J. R., Spinhirne, J. D., Gordon, H. R., and Johnson, J. E.: Measurements of aerosol vertical profiles and optical properties during INDOEX 1999 using micropulse lidars, J. Geophys. Res.-Atmos., 107, https://doi.org/10.1029/2000JD000038, 2002.
Whittlestone, S. and Zahorowski, W.: Baseline radon detectors for shipboard use: Development and deployment in the First Aerosol Characterization Experiment (ACE 1), J. Geophys. Res.-Atmos., 103, 16743–16751, 1998.
Whittlestone, S., Gras, J., and Siems, S. T.: Surface air mass origins during the First Aerosol Characterization Experiment (ACE-1), J. Geophys. Res.-Atmos., 103, 16341–16350, 1998b.
Wiedensohler, A., Orsini, D., Covert, D. S., Coffman, D. J., Cantrell, W., Havlicek, M., Brechtel, F. J., Russell, L. M., Weber, R. J., Gras, J., Hudson, J. G., and Litchy, M.: Intercomparison study of size dependent counting efficiency of 26 condensation particle counters, Aerosol Sci. Tech., 27, 224–242, 1997.
Witek, M., Flatau, P. J., Quinn, P. K., and Westphal, D. L.: Global sea-salt modeling: Results and validation against multicampaign shipboard measurements, J. Geophys. Res.-Atmos., 112, https://doi.org/10.1029/2006JD007779, 2007.
Wood, R., Mechoso, C. R., Bretherton, C. S., Weller, R. A., Huebert, B., Straneo, F., Albrecht, B. A., Coe, H., Allen, G., Vaughan, G., Daum, P., Fairall, C., Chand, D., Gallardo Klenner, L., Garreaud, R., Grados, C., Covert, D. S., Bates, T. S., Krejci, R., Russell, L. M., de Szoeke, S., Brewer, A., Yuter, S. E., Springston, S. R., Chaigneau, A., Toniazzo, T., Minnis, P., Palikonda, R., Abel, S. J., Brown, W. O. J., Williams, S., Fochesatto, J., Brioude, J., and Bower, K. N.: The VAMOS Ocean-Cloud-Atmosphere-Land Study Regional Experiment (VOCALS-REx): goals, platforms, and field operations, Atmos. Chem. Phys., 11, 627–654, https://doi.org/10.5194/acp-11-627-2011, 2011.
Yoneyama, K., Zhang, C., and Long, C. N.: Tracking pulses of the Madden-Julian Oscillation, B. Am. Meteorol. Soc., 94, 1871–1891, 2013.
Young, J. F.: Humidity control in the laboratory using salt solutions, J. Appl. Chem., 17, 241–245, 1967.
Zang, Z. and Liu, B. Y. H.: Performance of the TSI 3760 condensation nuclei counter at reduced pressures and flow rates, Aerosol Sci. Tech., 15, 228–238, 1991.