the Creative Commons Attribution 4.0 License.
the Creative Commons Attribution 4.0 License.
 | 17 Jun 2026
A high-resolution gridded dataset of water footprints for China's major food crops from 2001 to 2020
En Hua
Ling Huang
Liangliang Zhang
Quanbo Zhao
Yingxuan Wang
Bowei Wu
Sien Li
Yaokui Cui
Yubao Wang
Xuhui Wang
Increasingly unsustainable water use in food systems and rising regional water scarcity jointly pose a critical challenge to food security. Advancing sustainable agricultural water management requires accurate quantification of crop water use, including the contributions of blue and green water and their spatiotemporal dynamics throughout growing seasons, the absence of which impedes reliable estimation of agricultural water requirements and the improvement of water management practices. Here, we integrated multi-source remote sensing datasets with high-resolution crop distribution and phenology data within a detailed water footprint accounting framework. This approach resulted in ChinaCropWF (Hua and Wang, 2025; https://doi.org/10.5281/zenodo.19532526), a 1 km, nationwide, daily-resolution dataset spanning 2001–2020, which quantifies blue and green water footprints for China's five major crops. Our dataset shows the total crop water footprints ranked as rice (145.55±20.04 Gm3) > maize (120.39±29.02 Gm3) > wheat (55.06±7.68 Gm3) > soybean (35.00±4.09 Gm3) > potato (7.23±0.72 Gm3). The blue and green water composition was primarily determined by crop-specific traits and regional precipitation regimes. In contrast to the global increase in blue water footprints, China's blue water footprints for major food crops have declined, despite pronounced spatial heterogeneity. By contrast, green water footprints have increased widely across all major cropping regions. By capturing spatial heterogeneity in water volume and use efficiency, ChinaCropWF provides data support for adaptive irrigation, regional water management, and food-water nexus assessments.
- Article
(7195 KB) - Full-text XML
-
Supplement
(2342 KB) - BibTeX
- EndNote


Global food production systems face emerging water scarcity challenges, representing a major constraint to sustainable agricultural development (Dalin et al., 2015; Perez et al., 2024; Rosa et al., 2020). Climate change further undermines agricultural water security by altering precipitation patterns and intensifying hydrological extremes, thereby exacerbating the imbalance between irrigation water supply and demand (Giordano et al., 2023; Piao et al., 2010; Wang et al., 2021; Zheng et al., 2023). Combined pressures from water scarcity and climate change exacerbate challenges to water security and pose significant risks to the stability of food supply (Vörösmarty et al., 2010). This issue is of particular concern for China, which is among the world's largest producers of rice, maize, wheat, soybean, and potato. With approximately half of its cropland under irrigation, China's agricultural system is highly vulnerable to risks associated with water shortages.
Water footprint refers to the volume of water resources required for producing goods and services consumed by a country, region, or individual over a given period. It represents the “footprints” of water use across production and consumption processes. It is a key metric for quantifying water consumption in crop production and is widely used in water resource management and agricultural sustainability research (Hoekstra et al., 2011). Moreover, it serves as a key variable in food-water nexus research and management frameworks that address critical constraints on agricultural sustainability (Wu, 2024). By definition, it comprises blue water (consumed surface and groundwater) and green water (consumed precipitation-derived soil moisture).
Earlier global water footprint assessments (Mekonnen and Hoekstra, 2011) have highlighted marked spatial heterogeneity in agricultural water use and emphasized the interactions among agricultural systems, climate, and land management. Recent methodological advances enable multiscale evaluations, from field to global scales, and expand analytical capabilities to include water consumption assessment, efficiency analysis, pollution accounting, and developing sustainable water management strategies (Graham et al., 2020; Mialyk et al., 2024; Sun et al., 2016; Wang et al., 2024; Zhuo and Hoekstra, 2017). Currently, the assessment of crop water footprints still relies primarily on model simulations, with most models constructed based on simplified assumptions about evapotranspiration and seasonal water shortages, limiting the reliability of the results. For example, current crop water footprint assessments may overestimate crop evapotranspiration because they rely on crop coefficients derived under idealized environmental conditions. Moreover, aggregating precipitation and evaporation over monthly or growing-season periods can bias estimates of seasonal water shortages, influencing both the quantification of crop water footprints and the separation of blue and green water (He and Rosa, 2023). Hence, limitations in existing data and models hinder accurate daily-scale monitoring of crop water use at a high spatiotemporal resolution, particularly in capturing the dynamics of key water-stress periods, which remains a major challenge (Xu et al., 2019).
Compared with global datasets, regional crop water footprint assessments in China can provide higher spatiotemporal resolution and extended temporal coverage because they incorporate locally-specific data on crop phenology and management practices. At the spatial scale, research has expanded from representative farmlands to provincial and national scales, supported by high-resolution accounting frameworks that integrate multi-source satellite remote sensing data with ground-based meteorological observations. For example, Wang et al. (2023a) developed a remote sensing-based quantitative method to assess the dynamic changes in crop water footprints at a 250 m resolution within the Baojixia Irrigation District. Li et al. (2021) quantified the rice water footprint in Jilin Province at a spatial resolution of 1 km. At the temporal scale, Wang et al. (2023b) estimated national water footprints for 21 crops from 2000 to 2018 using the AquaCrop model, generating 5 arcmin gridded outputs. Furthermore, Wang and Shi (2024) mapped annual blue and green water footprints for 15 major crops from 1991 to 2019 at 1 km resolution by coupling a dynamic water balance model with a random forest algorithm and incorporating meteorological and phenological dynamics. However, these studies generally have strong assumptions about crop phenology and planting patterns. In terms of temporal resolution, they also predominantly rely on monthly or ten-day growth period divisions, while in terms of spatial resolution, they often assume that planting patterns are static across multiple years. These limitations have restricted analyses of water footprint dynamics. Consequently, two major limitations remain: limited partitioning of blue and green water use throughout crop growth stages, and insufficient temporal resolution to capture daily, high-resolution water footprint dynamics.
In this study, we developed ChinaCropWF, a high-resolution (1 km) gridded dataset that quantifies the water footprints of China's five major crops – wheat, maize, rice, soybean, and potato – from 2001 to 2020. The dataset encompasses three core components: the total water footprint (blue and green water), the production water footprint, and evapotranspiration partitioning (i.e., the evaporation-to-transpiration ratio). ChinaCropWF presents key innovations in high-resolution crop water footprint assessment: (1) It integrates multi-source remote sensing datasets, enabling daily, 1 km gridded quantification of crop water consumption, markedly enhancing spatiotemporal resolution; (2) It further resolves fine-scale dynamics and explicitly accounts for the water footprint required to alleviate seasonal soil moisture shortages, providing a more comprehensive assessment of actual water demand. Furthermore, we identified the key drivers underlying interannual variations in these crop water footprints. This analysis provides critical data to guide targeted interventions in water-saving irrigation, cropping structure optimization, and agricultural water management.
This study focuses on five major crops in China: wheat, maize, rice, soybean, and potato. As of 2024, the national sown area for food crops was 119.3 Mha, with maize, rice, wheat, soybean, and tubers accounting for 44.7, 29.0, 23.6, 10.3, and 7.0 Mha, respectively, collectively representing 96.1 % of the total sown area. Given their dominant share of the sown area and importance for national food production, accurately quantifying their water footprints is crucial for sustainable water management and food security assessments. ChinaCropWF, a high-resolution (1 km) gridded dataset, was developed through three main steps to quantify the water footprints of these crops from 2001 to 2020 (Fig. 1):
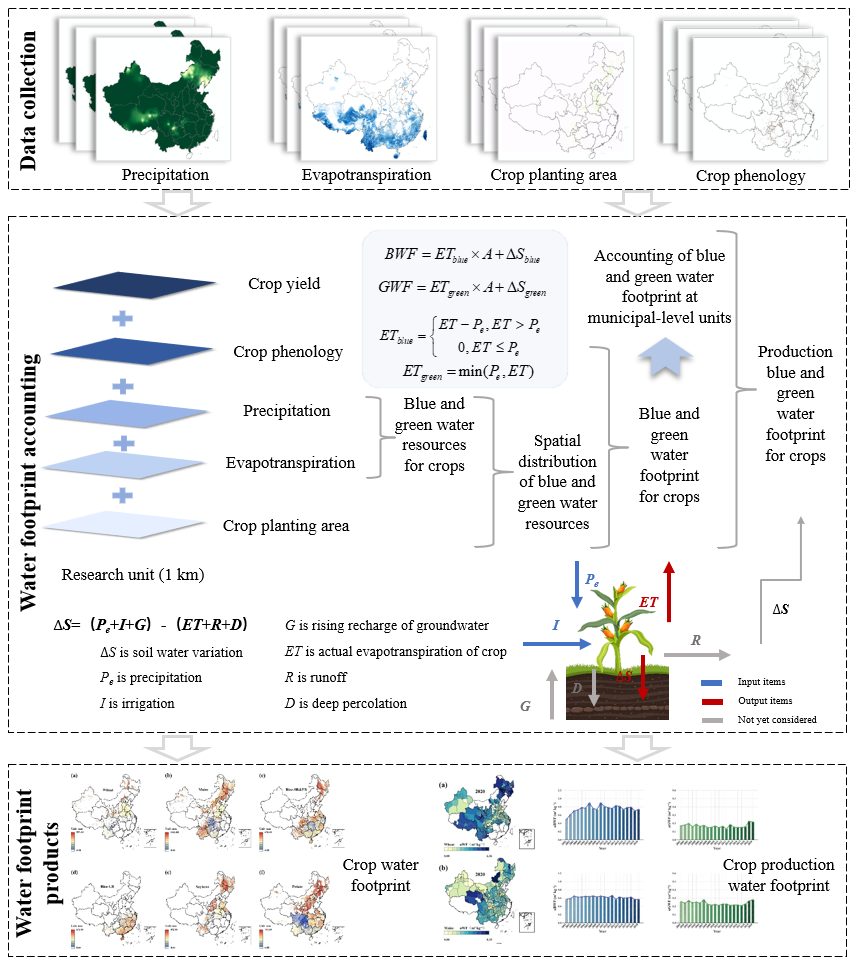
Figure 1Research steps.
- Step 1:
-
Data collection. This step focused on acquiring high-resolution (1 km) remote sensing datasets essential for quantifying the water footprints of China's major food crops. The key datasets included precipitation, evapotranspiration, crop planting area, and crop phenology.
- Step 2:
-
Water footprint accounting. In this step, the blue and green water components consumed by major food crops were quantified through integration of evapotranspiration and precipitation datasets. By incorporating crop planting area and phenology data, daily blue and green water footprints were further quantified across different growth stages.
- Step 3:
-
Water footprint products. During the dataset development process, the high-resolution ChinaCropWF dataset (2001–2020) was developed, including blue and green water footprints, production water footprints, and evaporation-to-transpiration ratios. The dataset was validated using observed water footprint data to ensure its accuracy and reliability. Additionally, another crop water footprint dataset was generated using a synthesized evapotranspiration dataset for comparative assessment.
2.1 Data sources
2.1.1 Precipitation
In this study, the China Daily Precipitation dataset (CHM_PRE) was used as the primary data source. This 0.1°-resolution gridded dataset was generated by integrating data from 2839 meteorological stations in China and adjacent regions (Han et al., 2023). Cross-validation against widely used precipitation datasets, including CGDPA, CN05.1, and CMA V2.0, showed strong agreement in interannual variability and spatial patterns of extreme precipitation, confirming its suitability for regional climate and hydrological analyses.
2.1.2 Evapotranspiration
Actual evapotranspiration data were obtained from the Penman–Monteith–Leuning Evapotranspiration Version 2 (PML-V2) dataset (He et al., 2022), which provides 500 m spatial resolution and spans 2000–2020. The primary advancement of the PML-V2 model is the development of a coupled stomatal response mechanism that accounts for CO2 concentration, photosynthesis, and water transport, resulting in a substantial increase in the accuracy of evapotranspiration simulations. PML-V2 derives evapotranspiration (ET) by separately estimating its three components, including plant transpiration (Ec), evaporation from the soil (Es), and canopy evaporation from precipitation interception (Ei), as follows:
To validate ChinaCropWF, we recalculated crop water footprint datasets based on a synthesized evapotranspiration dataset. This dataset was generated by evaluating twelve global evapotranspiration products over various periods, land surface types, and environmental conditions; the best-performing products were selected through site-to-pixel comparisons (Elnashar et al., 2021). The resulting synthesized evapotranspiration dataset offers a comprehensive depiction of the spatiotemporal patterns and variability of actual evapotranspiration (see Supplement). Furthermore, to accurately distinguish between evaporation and transpiration during crop growing seasons, this study separates the evaporation components (Es and Ei) and the transpiration component (Ec) in the PML-V2 dataset.
2.1.3 Crop planting area
Crop planting areas for wheat, maize, and rice were obtained from the ChinaCropArea1kmV2 dataset, which was derived from GLASS leaf area index (LAI) time-series data. Key phenological features of the LAI curves were extracted using inflection point detection and thresholding to facilitate remote sensing-based estimation of crop planting areas (Luo et al., 2020b; Mei et al., 2022). Here, rice is divided into single cropping rice and early rice (Rice-SR&ER) and late rice (Rice-LR). Soybean planting areas for 2017–2020 were derived from the ChinaSoyArea10 m dataset, produced using a regionally adapted spectra-phenology integration approach based on Sentinel-2 imagery and Google Earth Engine (Mei et al., 2024). Potato planting areas were sourced from the SPAM dataset (available at https://mapspam.info/, last access: 23 May 2026), which is updated every five or 10 years.
2.1.4 Crop phenology
Crop phenology data for maize, wheat, and rice were obtained from the ChinaCropPhen1km dataset (Luo et al., 2020a), which provides high-resolution spatiotemporal information on key phenological stages across China, spanning 2000–2019. This dataset was generated through the integration of GLASS-derived LAI and long-term meteorological observations from agrometeorological stations. Phenology data for soybean and potato were obtained from station-based observations.
2.2 Methods
2.2.1 Crop water footprint
The crop water footprint accounting framework consists of four modules. (1) The spatiotemporal integration of multi-source datasets involved precipitation (CHM_PRE), actual evapotranspiration (PML-V2), crop planting areas (ChinaCropArea1kmV2 and ChinaSoyArea10m), and crop phenology (ChinaCropPhen1km) datasets, which were uniformly resampled to a 1 km spatial resolution, resulting in a spatiotemporally aligned raster database. (2) Blue and green water were quantified using the field crop water requirement method: blue water (irrigation) was computed as the difference between actual evapotranspiration and precipitation, while green water was defined as precipitation; when precipitation exceeded actual evapotranspiration, green water was set equal to actual evapotranspiration. (3) The delineation of crop planting areas was performed by identifying the presence of each crop within every 1 km grid cell using crop planting area datasets, thereby defining the spatial extent of each crop's water footprint. (4) Based on phenology data, daily crop growth stages were determined, and blue and green water were allocated to each stage. This enabled the calculation of the crop water footprint for each 1 km grid cell spanning the period 2001–2020.
To account for soil water shortages resulting from seasonal precipitation, the soil water balance method was employed to calculate soil water variations (ΔS), thereby enabling a more accurate quantification of crop water footprints (Fig. 1). The total crop water footprint (WF) consists of the blue water footprint (BWF) and the green water footprint (GWF), which are calculated as follows:
where ETblue is the blue water portion of evapotranspiration, mm; ETgreen is the green water portion of evapotranspiration, mm; A is the crop planting area, km2; Pe is the precipitation, mm; ΔSblue and ΔSgreen are the blue (irrigation) and green (precipitation) water footprints caused by seasonal water shortages, respectively.
To supplement the water footprint caused by seasonal water shortages, first estimated the soil saturation moisture content, and then calculated the initial soil moisture content using the soil water balance method. Regarding the initial soil water content, it was accounted for based on the soil data of Shi et al. (2025) and Wei et al. (2013).
where St is the soil moisture content on day t; St−1 is the soil moisture content on day t−1; and I is irrigation water. During the calculation process, due to data limitations, deep percolation, capillary rise, and surface runoff are not considered. Meanwhile, we assume that water replenished each year to address seasonal water shortages serves only that year's crop production and cannot be reused across years.
Finally, the upper limit of suitable soil moisture during the crop growing period was set as the threshold, based on which the required supplementary ΔSblue and ΔSgreen at the initial stage of the growing period to reach this threshold were calculated.
2.2.2 Crop production water footprint
Within a multi-scale coupled water-food nexus framework, municipal-level crop yield statistics were spatially aligned with 1 km resolution water footprint datasets. Using the production water footprint indicator (m3 kg−1), the relationship between water use and crop yield was quantified for five major crops: wheat, maize, rice, soybean, and potato. The total water footprint was further partitioned into blue water (irrigation) and green water (precipitation) components to assess the relative contributions of different water sources.
where uWF, uBWF, and uGWF represent the crop production water footprint, crop production blue water footprint, and crop production green water footprint, m3 kg−1, respectively; Y is the crop yield, kg.
3.1 Spatiotemporal evolution patterns of crop water footprint
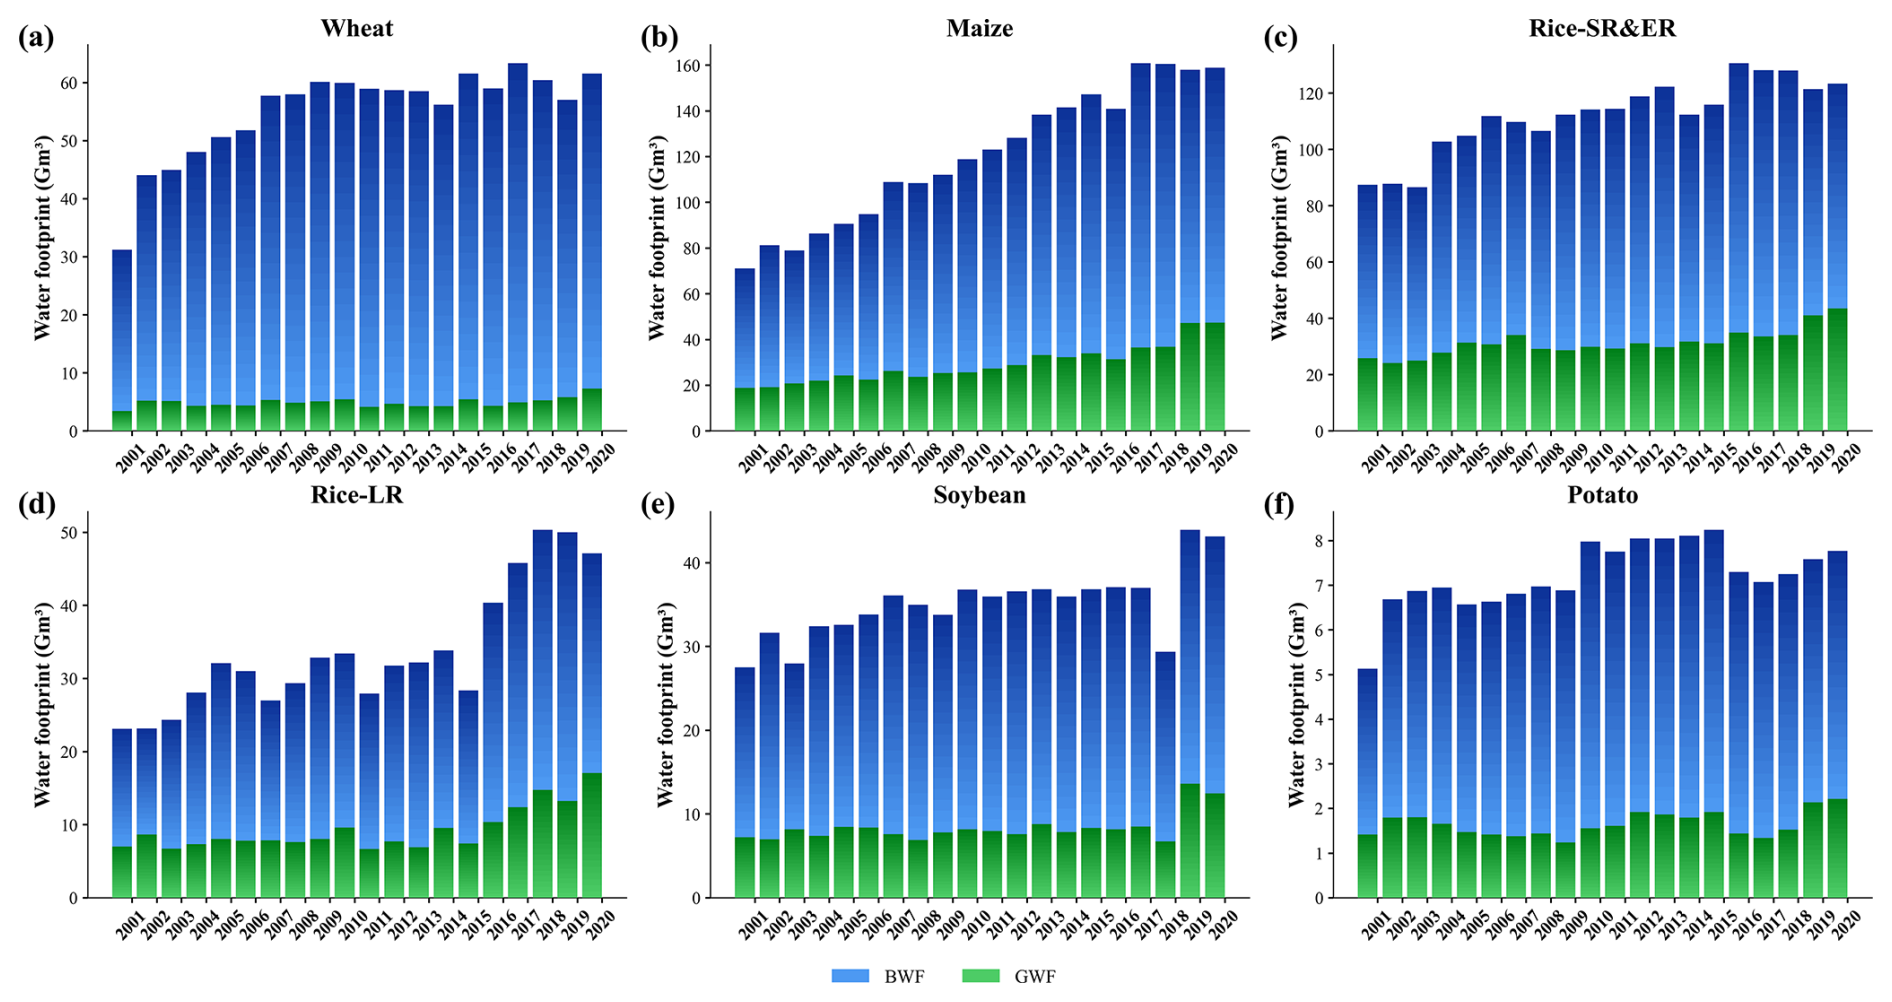
Over the period 2001–2020, the total water footprint of China's major food crops increased by 80.0 %, from 245.40 to 441.73 Gm3 (Fig. 2). This increase was mainly driven by the green water footprint, which expanded by 104.1 %, whereas the blue water footprint grew by only 71.6 %. All crops exhibited upward trends, with the blue water footprint maintaining a relatively high contribution for most crops. The total water footprint peaked in 2017 before declining slightly. Among all crops, maize and rice-LR exhibited the most pronounced increases (123.5 % and 104.0 %), whereas potato and rice-SR&ER showed comparatively moderate growth (51.5 % and 41.1 %, respectively). Green water footprints increased by more than 56.0 % across all crops, with maize showing an especially large rise of 152.4 %. In contrast, changes in blue water footprints were comparatively moderate, with potato and rice-SR&ER increasing by only 49.5 % and 29.6 %, respectively.
In 2020, the water footprints of China's major food crops exhibited pronounced spatial clustering patterns and substantial regional heterogeneity. High values (>20 Gm3) were concentrated in major grain-producing provinces, whereas markedly low values were observed in the Qinghai-Tibet Plateau ecological barrier – such as Qinghai (0.69 Gm3) – as well as in megacities such as Beijing (0.13 Gm3). This spatial pattern was largely governed by the distribution of cultivated land resources and the intensity of agricultural production. The blue water footprint closely mirrored the total water footprint, underscoring the dominant role of irrigated agriculture in core grain-producing regions. In Heilongjiang, Henan, and Shandong, blue water contributed 71.1 %, 79.7 %, and 80.3 % of the total, respectively. In contrast, green water footprints were strongly influenced by precipitation gradients, forming a distinct spatial corridor along the 400 mm isoline, with green water contributions in Chongqing, Guizhou, and Sichuan accounting for 50.3 %, 50.3 %, and 43.9 % of their respective totals.
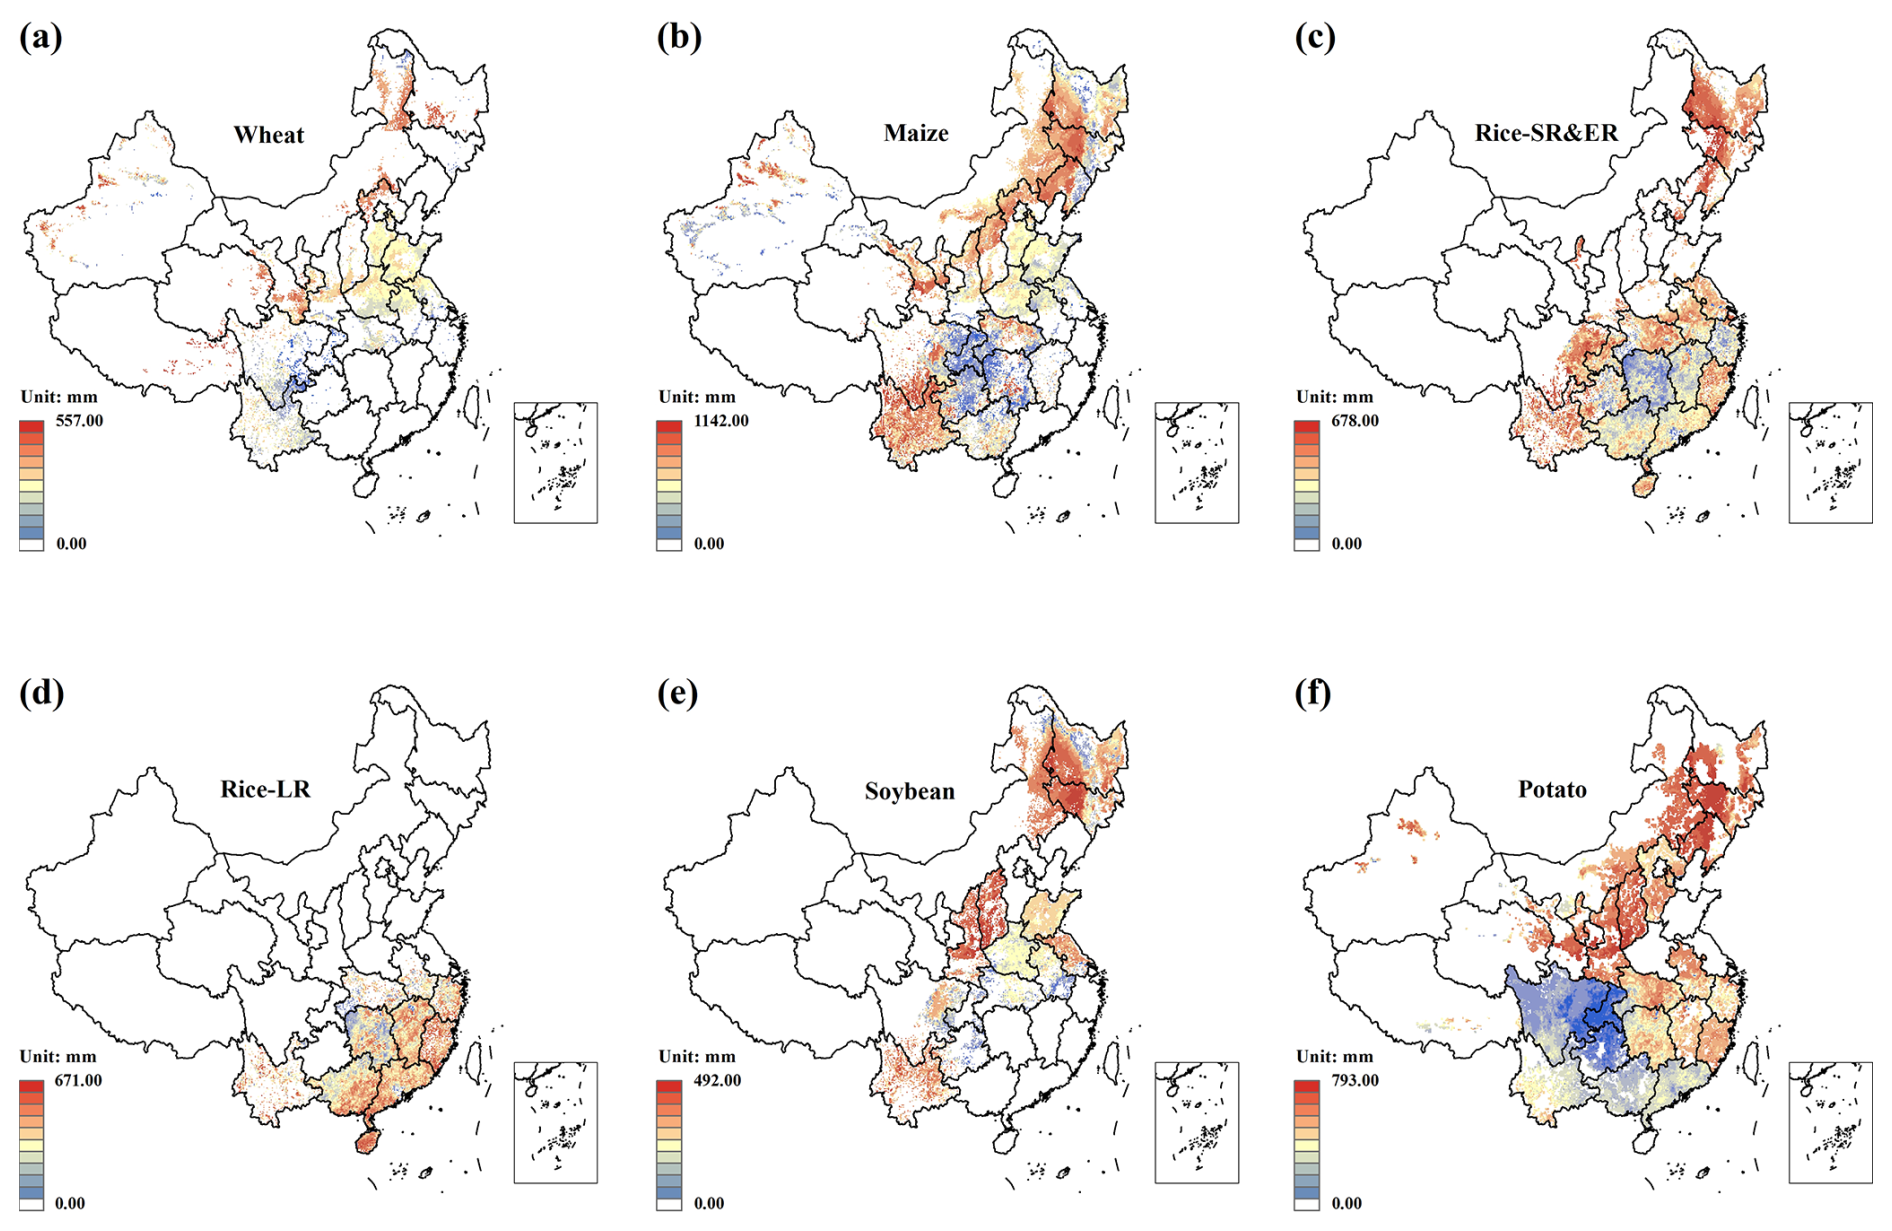
Figure 3Spatial distribution pattern of crop water footprint (blue and green water footprints) in 2020 at 10 km resolution.
For individual crops (Fig. 3), high wheat water footprints were concentrated in the Huang–Huai–Hai Plain. In Henan, Shandong, and Anhui, blue water accounted for 90.0 %, 89.7 %, and 88.0 % of the total, respectively. Henan exhibited the largest blue water footprint (14.29 Gm3), which is closely related to the phenological characteristics and cultivation patterns of wheat. In Northeast China, maize water footprints were concentrated in Heilongjiang, Jilin, and Inner Mongolia, contributing 35.9 % of the national total. High rice-SR&ER water footprints were concentrated in Heilongjiang (17.75 Gm3), Guangxi (12.36 Gm3), and Hunan (11.02 Gm3), where green water contributed 29.9 %–36.7 % of the total. For rice-LR, high water footprints were observed in Guangxi (12.11 Gm3), Hunan (11.14 Gm3), and Jiangxi (10.50 Gm3), with a larger total green water footprint. Soybean water footprints were mainly concentrated in Heilongjiang, Inner Mongolia, and Jilin, which together accounted for 62.8 % of the national total. For potato, high water footprints occurred in Inner Mongolia, Gansu, and Shaanxi, with relatively high blue water contributions even in humid southern regions.
3.2 Regionalized assessment of crop production water footprint
From 2001 to 2020, the uWF of China's major food crops exhibited distinct crop-specific patterns and substantial spatial heterogeneity (Fig. 4). The uWF of maize remained relatively stable, whereas that of wheat, rice, soybean, and potato increased over time. Wheat uWF showed a first increasing and then decreasing trend, with high values concentrated in Northeast China and Inner Mongolia. For example, Xilin Gol in Inner Mongolia (7.22 m3 kg−1) and Songyuan in Jilin (5.56 m3 kg−1) showed notably elevated levels, which are likely associated with climatic constraints that increase irrigation demand. Maize uWF remained largely stable but with significant fluctuations, with high values observed in Jingmen, Hubei (8.85 m3 kg−1) and Yichun, Heilongjiang (6.81 m3 kg−1), while exceptionally low values occurred in Shihezi and Hami, Xinjiang (). Rice-SR&ER uWF increased markedly from 0.83 to 1.25 m3 kg−1, accompanied by a northward shift in high-value areas. Non-advantageous rice-growing regions, such as Anshan in Liaoning, Zibo in Shandong, Jinzhong in Shanxi, and Ganzi in Sichuan, exhibited comparatively high uWF, indicating lower water-use efficiency. Rice-LR uWF increased by 68.3 %, with high values occurring in Yangjiang, Chaozhou, and Yunfu, Guangdong (). Soybean uWF rose from 0.33 to 0.82 m3 kg−1, with higher values in Shanxi and Henan and a notable increasing trend in humid regions such as Yunnan. Potato uWF increased by 19.6 %, with high-value areas concentrated in Shaanxi, Gansu, and Inner Mongolia.
Temporal trends in blue and green water footprints were broadly consistent with those of uWF, with pronounced differences among crop types. For uBWF, wheat uBWF fluctuated in an upward trend, increasing by 46.6 % from 0.50 to 0.74 m3 kg−1. In contrast, maize uBWF exhibited fluctuations but remained at 0.57 m3 kg−1 for several years. Rice-SR&ER showed relatively high uBWF, whereas rice-LR exhibited greater interannual variability. The uBWF for soybean and potato increased from 0.24 and 0.49 m3 kg−1 in 2001 to 0.58 and 0.56 m3 kg−1 in 2020, respectively, highlighting the relative underutilization of water-saving practices for legume and tuber crops. The evolution of uGWF exhibited clear climate-driven patterns, with all crops showing increasing trends, particularly rice, soybean, and potato. In contrast, dryland crops experienced more moderate increases: wheat and maize rose by 27.3 % and 9.5 %, respectively, likely reflecting improved precipitation utilization supported by the adoption of drought-resistant varieties. Overall, the spatiotemporal evolution of crop production blue and green water footprints revealed pronounced regional differentiation, characterized by greater fluctuations uBWF and a broadly consistent increase in uGWF.
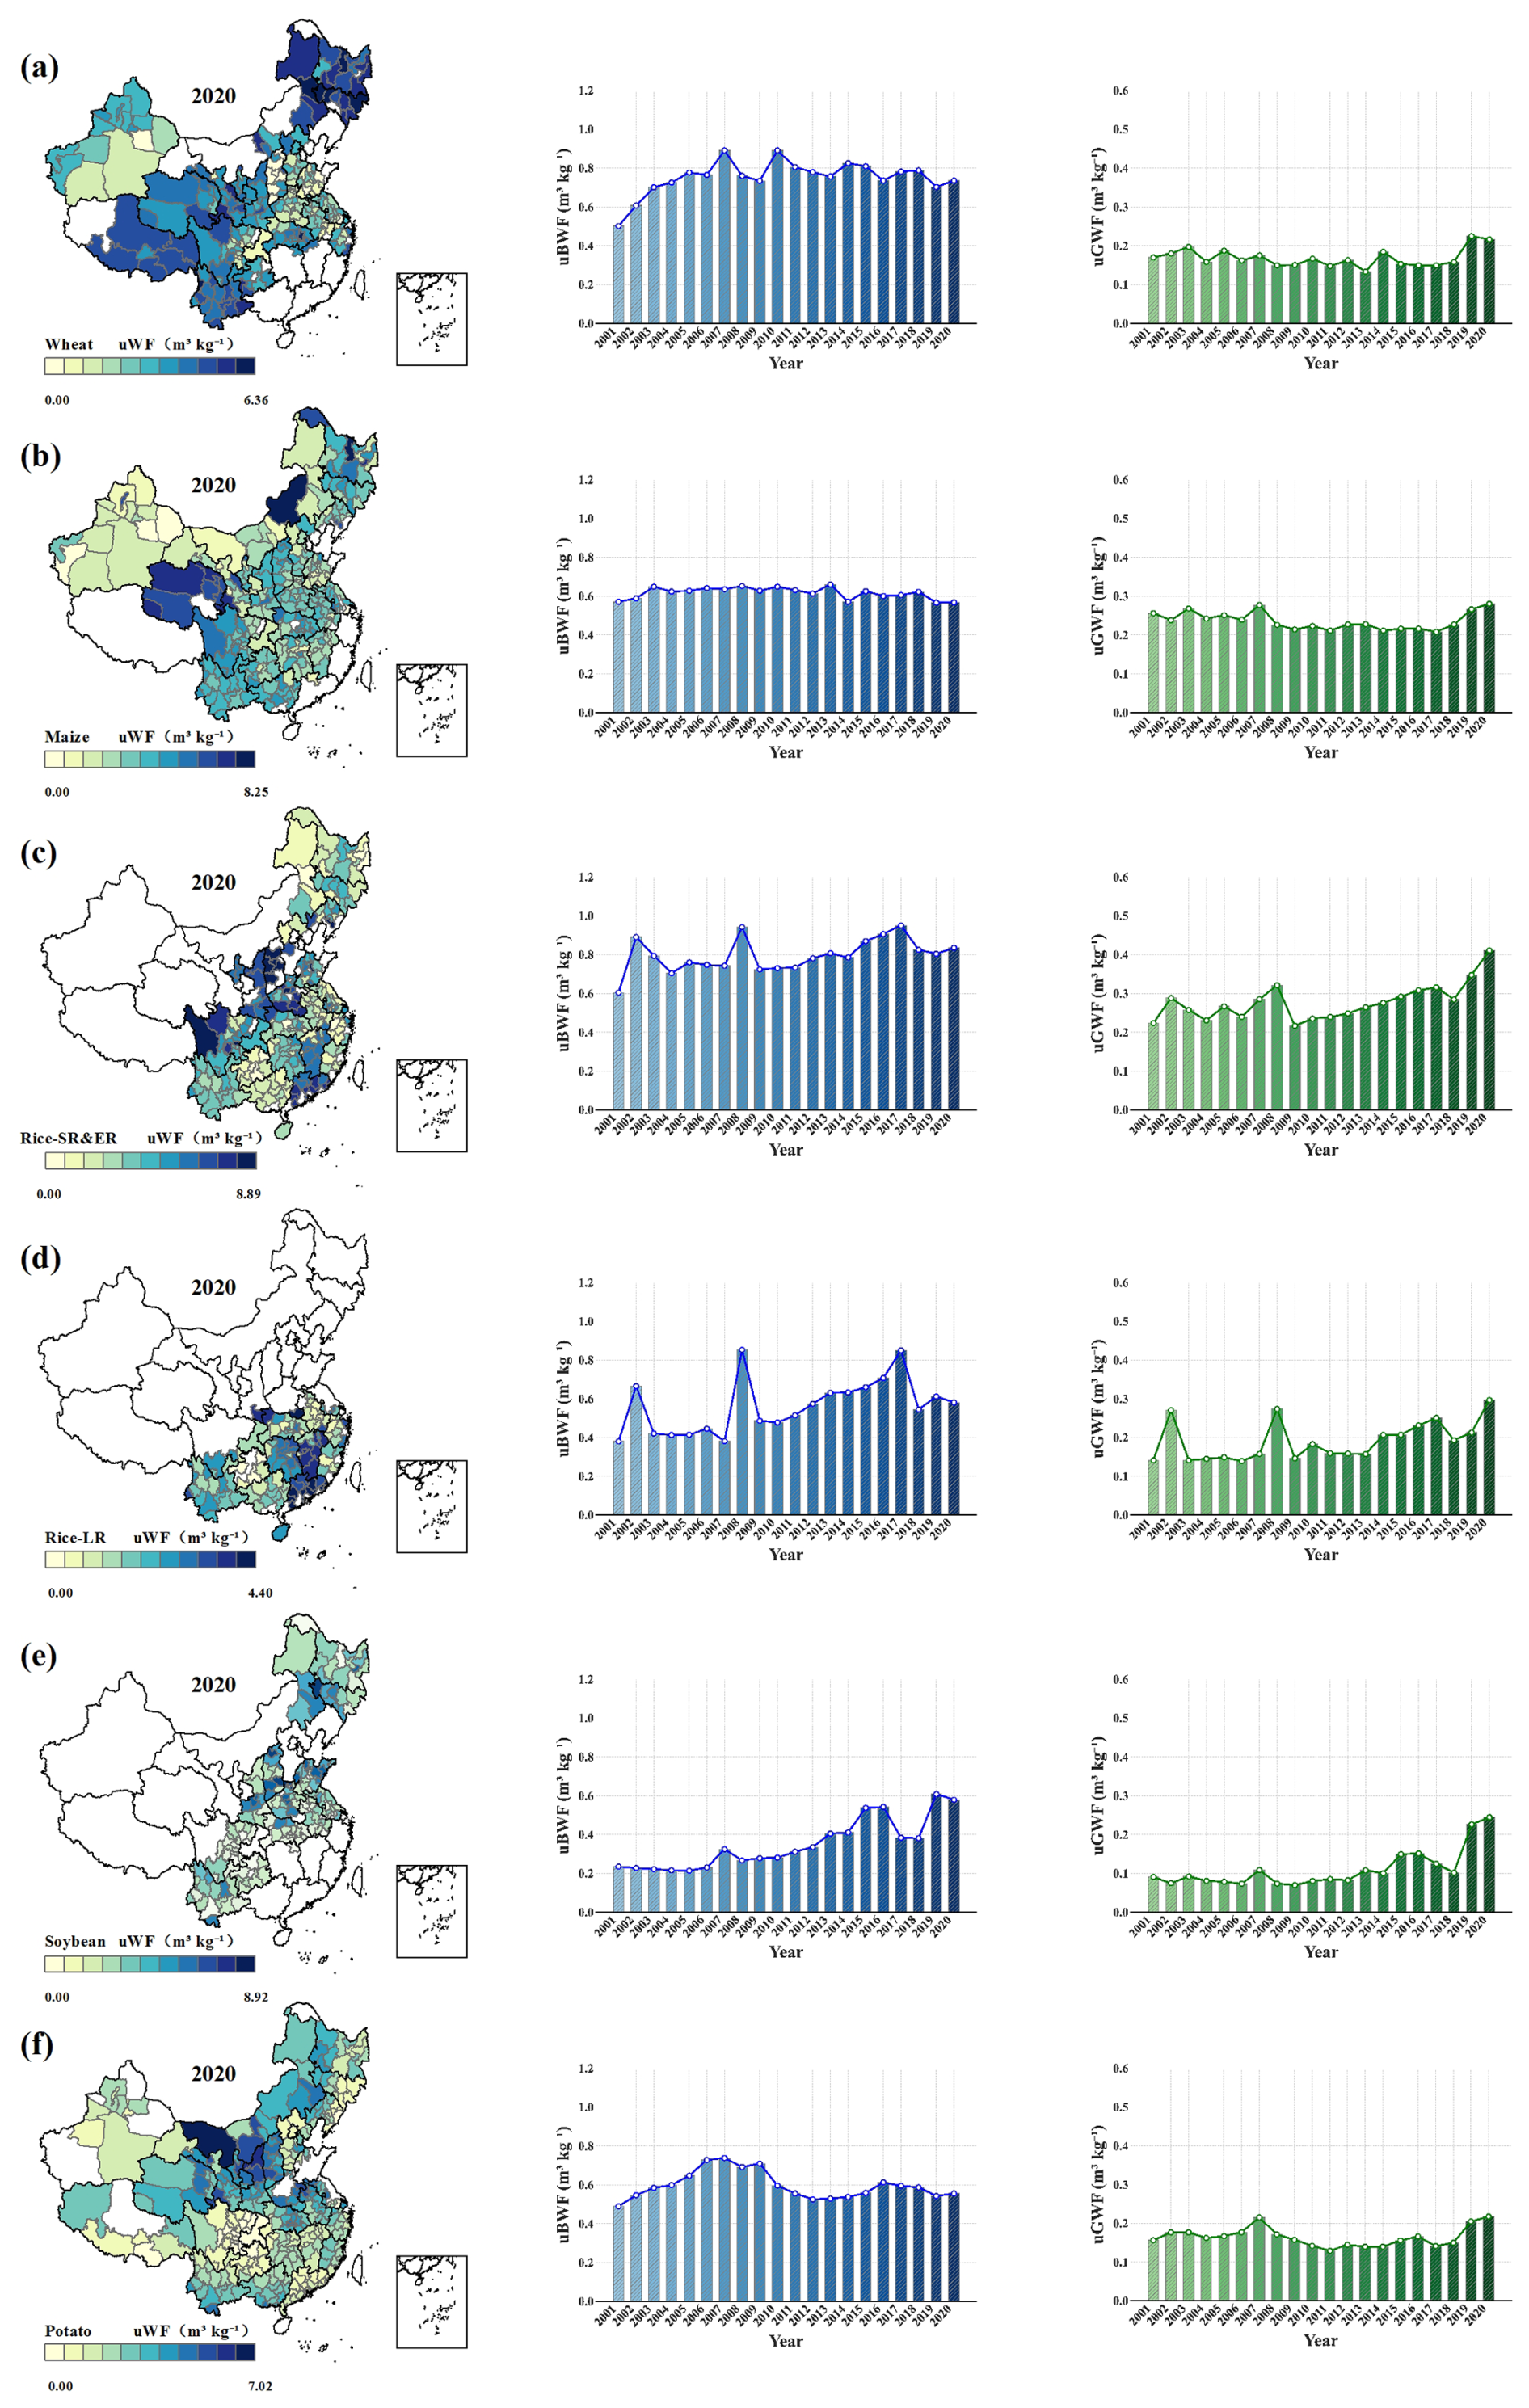
Figure 4Spatiotemporal evolution pattern of crop production water footprint. (a–f) denote wheat, maize, rice-SR&ER, rice-LR, soybean, and potato, respectively. The maps depict the spatial distribution patterns of the production water footprint for each crop in 2020, while the blue and green bar charts illustrate the evolutionary trends in the national average production blue water footprint and production green water footprint over the period 2001–2020, respectively.
3.3 Evaporation and transpiration in crop water use
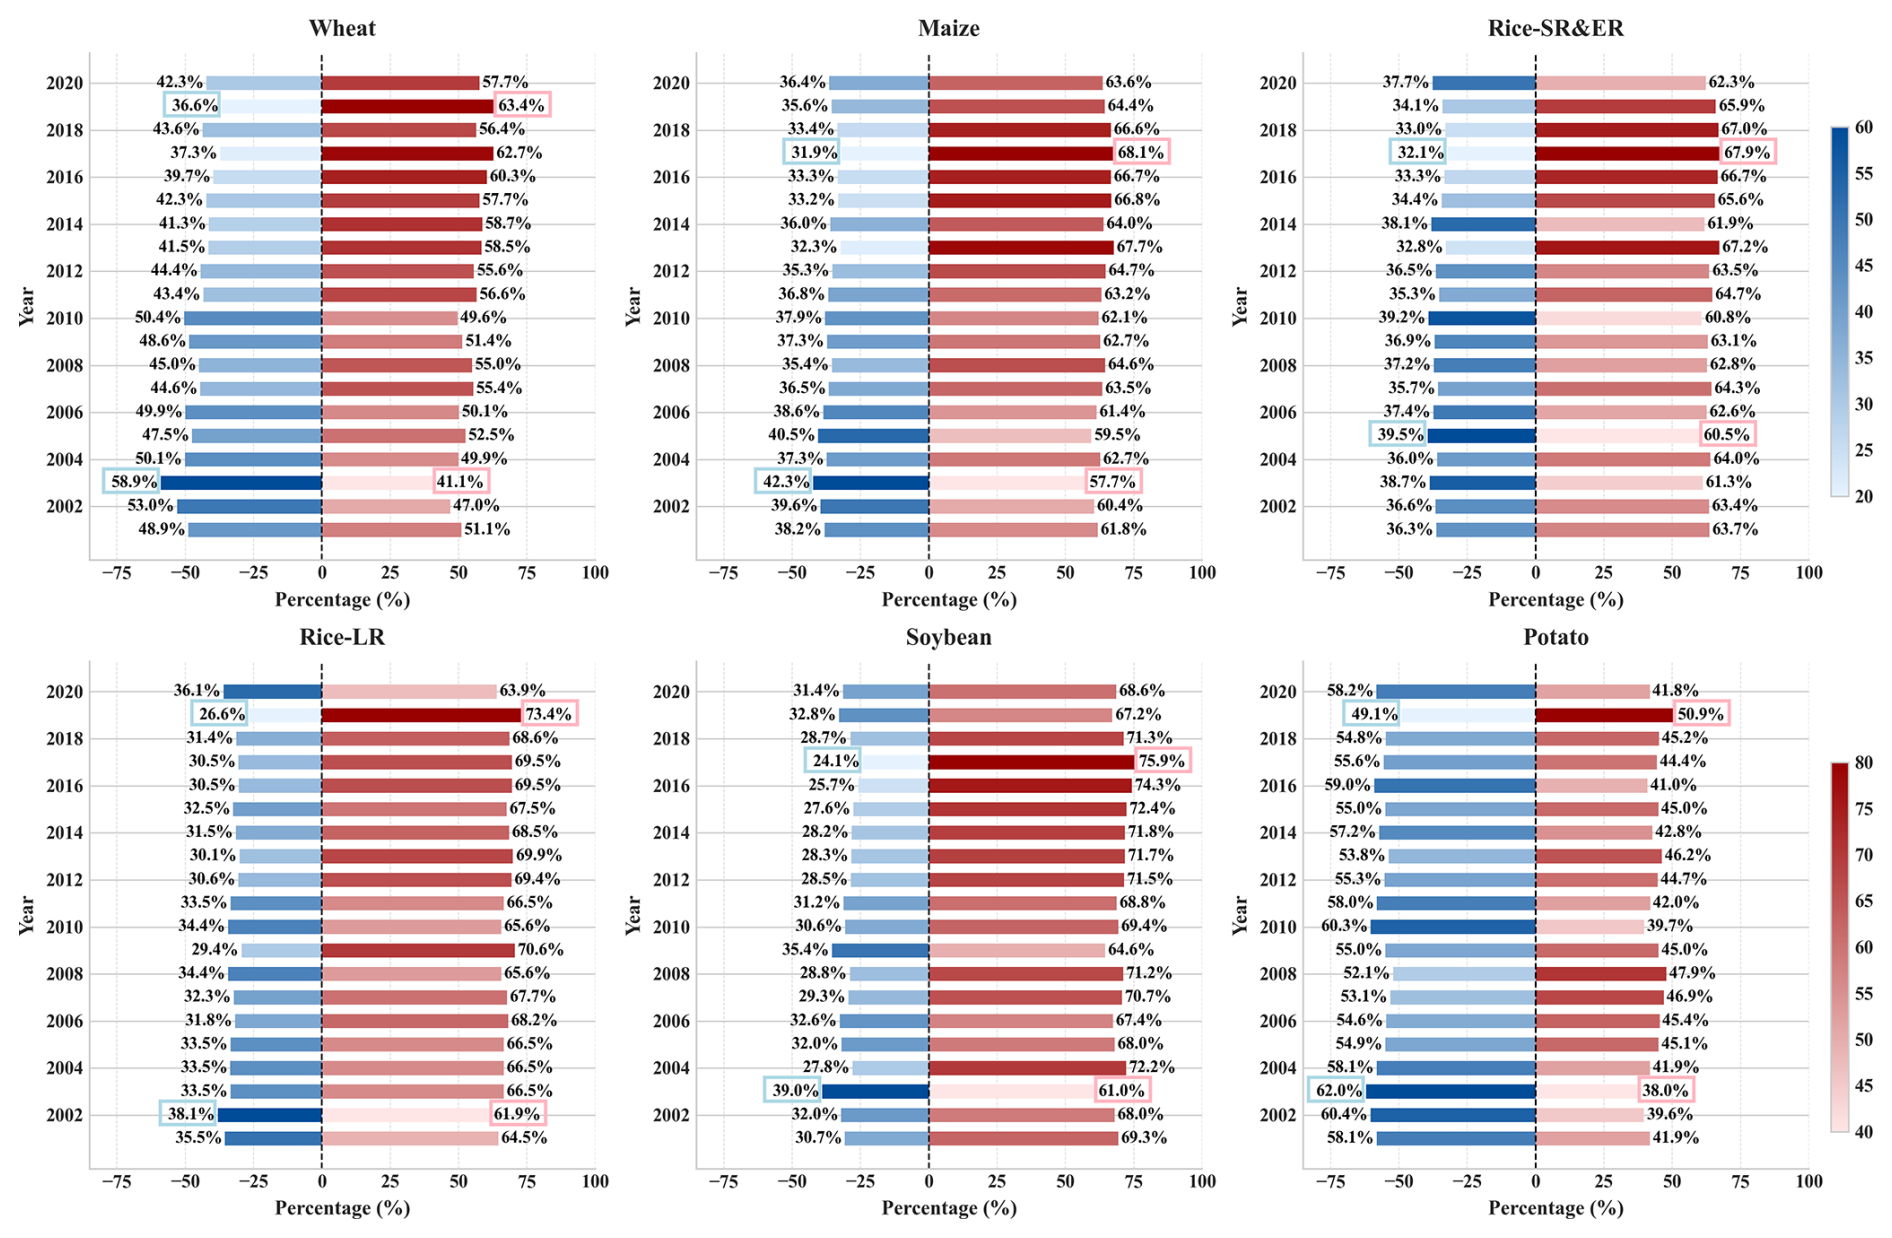
Between 2001 and 2020, crop transpiration and evaporation increased by 36.3 % and 31.2 %, respectively. A pronounced shift was observed in wheat, with evaporation declining from 58.9 % in 2003 % to 36.6 % in 2019 (Fig. 5), while transpiration increased from 41.1 % to 63.4 %, changes likely associated with the adoption of drought-resistant cultivars and the implementation of precision irrigation. In maize, evaporation peaked at 42.3 % in 2003 before decreasing to 31.9 % in 2017, whereas transpiration ranged from 57.7 % to 68.1 %, suggesting an overall tendency toward higher transpiration fractions. Rice showed marked interannual fluctuations in evaporation and transpiration, with transpiration consistently exceeding 60 %. Soybean exhibited the lowest evaporation rate among all crops, accounting for only 39.0 % in 2003. Conversely, potato displayed evaporation closer to transpiration levels, with evaporation exceeding transpiration in most years – a pattern linked to the winter planting pattern in southern regions.
A comparative analysis of crop evaporation and transpiration identified three major patterns in their spatiotemporal dynamics. First, transpiration was higher than evaporation, a pattern consistent with physiological differences in water-use strategies between C3 and C4 crops. Second, a peak in evaporation occurred during 2002–2005, followed by a peak in transpiration during 2017–2019. This sequential pattern is indicative of a fundamental shift in the primary drivers of water loss, from atmospheric factors to vegetation processes. Third, interannual variability remained within 0 %–11.2 % across crops, indicating a relatively stable response of agroecosystems to climate variability.
3.4 Key drivers of crop water footprint
Using the LMDI decomposition method, we evaluated the temporal evolution of blue and green water footprints of wheat, maize, rice, soybean, and potato during 2002–2020, along with their underlying driving factors (Fig. 6). For wheat, increases in the blue water footprint were primarily driven by transpiration, whereas evaporation, planting area, and phenology acted as negative drivers. Evaporation and transpiration contributed positively to the green water footprint, with transpiration again emerging as the dominant factor. For maize and rice-LR, evaporation, transpiration, planting area, and phenology all contributed positively to both blue and green water footprints. Meanwhile, evaporation, transpiration, and planting area were all the dominant driving factors. In contrast, for rice-SR&ER, phenology acted as a negative driver for the blue water footprint, with phenology showing a weaker inhibitory effect. For soybean and potato, evaporation, transpiration, and planting area all had positive effects on both blue and green water footprints; however, the influence of planting area on the green water footprint of potato was relatively small.
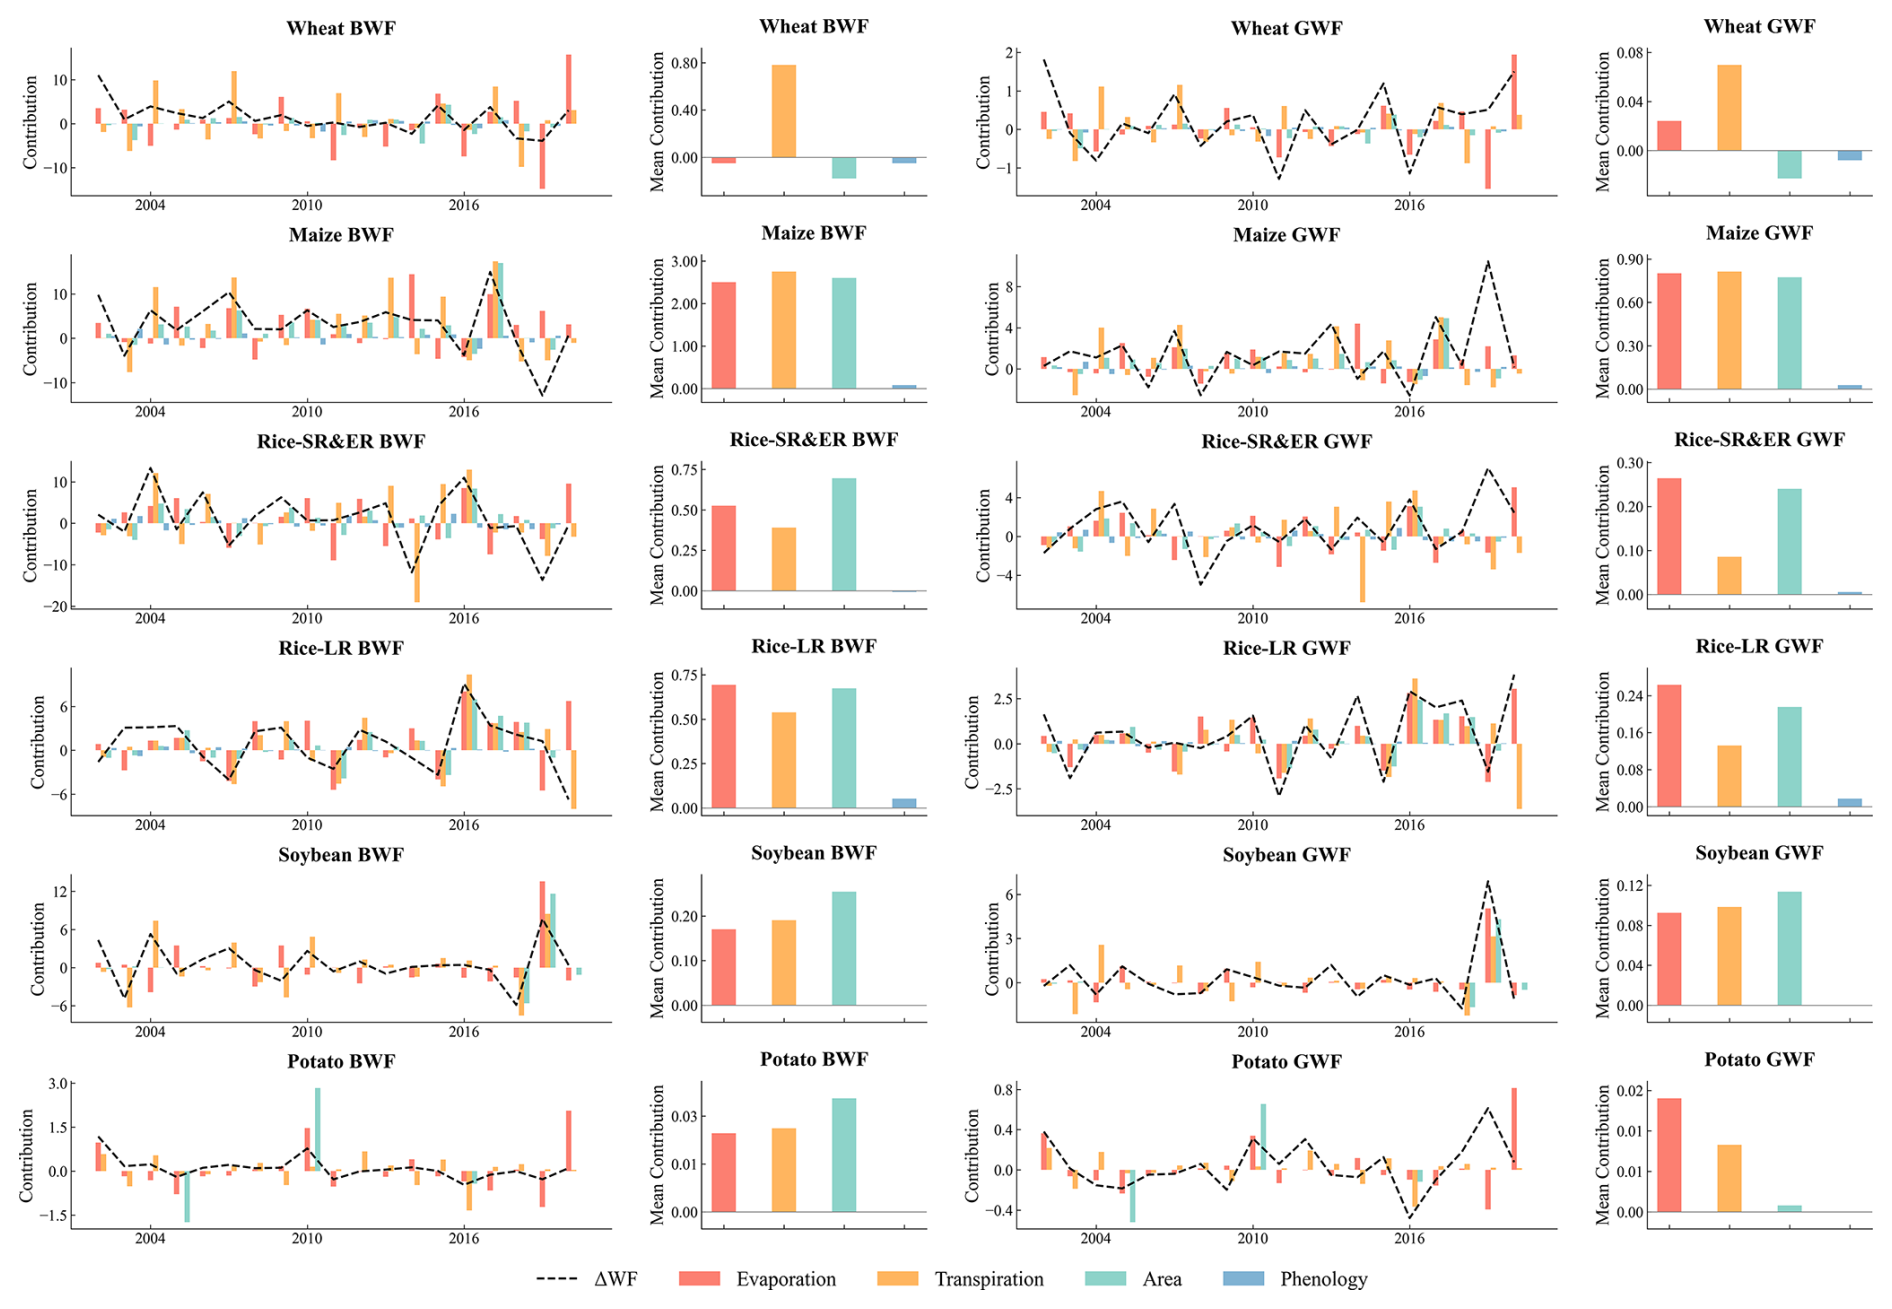
Figure 6Evaluation of key driving factors of water footprint based on LMDI. The line charts illustrate the evolutionary trends driven by various factors over the period 2001–2020, while the bar charts present the multi-year average values attributed to each driving factor.
Overall, the relative influence of the driving factors indicates that evaporation and transpiration generally exhibit positive contributions across different crops, suggesting the significant role of meteorological conditions (e.g., temperature and humidity) in influencing crop water use. Compared with phenology, planting area makes a larger contribution. Comparison of blue and green water footprints reveals that blue water footprints exhibit substantially higher interannual variability, indicating the dominant influence of irrigation management on pressure on agricultural water resources. Green water footprints contribute more in years with abundant precipitation but decline sharply during drought years, highlighting the potential risks of climate change for sustainable agricultural water availability.
4.1 Evaluation of ChinaCropWF
4.1.1 Comparison with field measurements
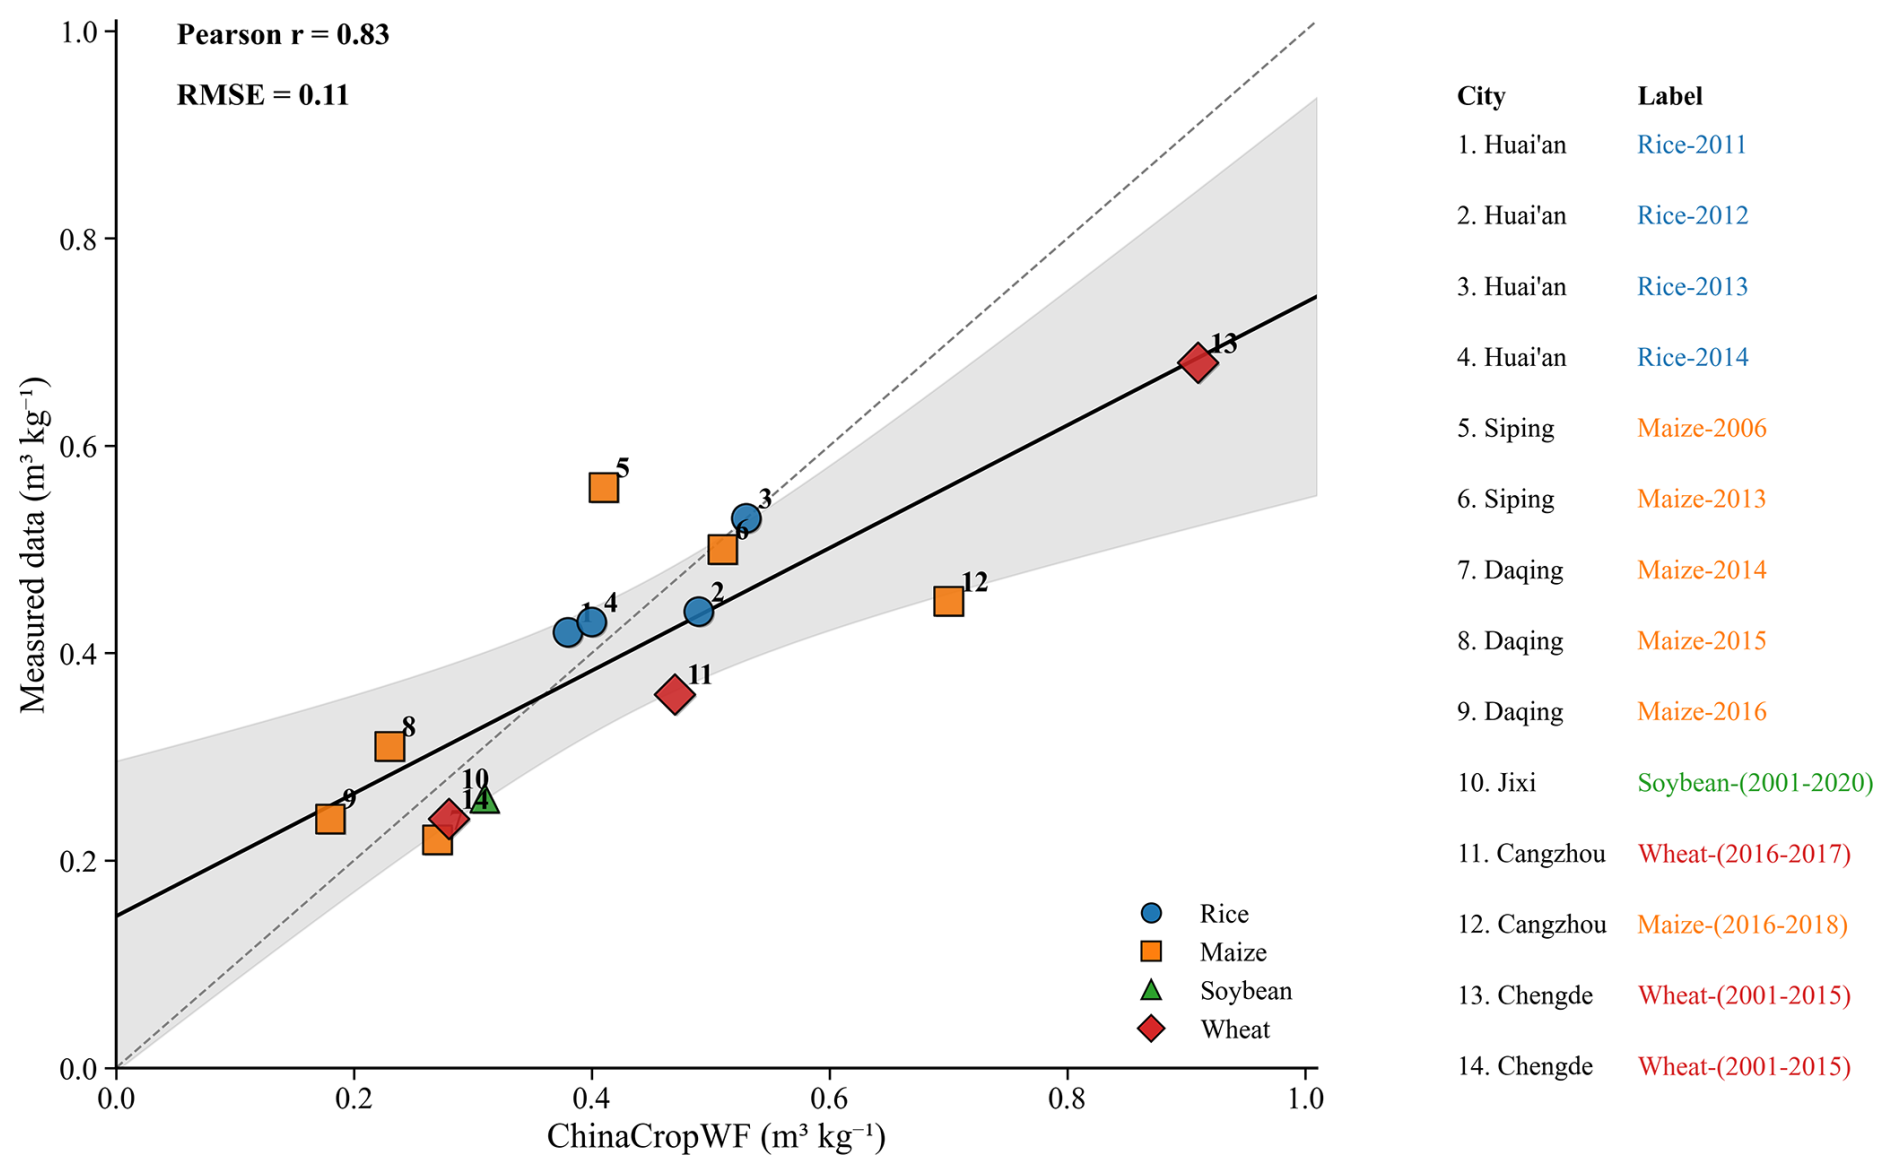
To evaluate ChinaCropWF, field-measured water footprint data were used as an independent reference, because they directly quantify crop water consumption and distinguish between blue and green components. Datasets for multiple crops were compiled to assess potential discrepancies arising from the integration of multi-source remote sensing datasets (Fig. 7). Multi-crop comparisons indicate that ChinaCropWF slightly overestimates water footprints (mean , ), partly due to the limited representation of localized soil water shortages at large spatial scales and uncertainties in irrigation practices, particularly in irrigated regimes. Nevertheless, calculated and observed values show strong agreement (Pearson r=0.83, p<0.001), demonstrating that ChinaCropWF reliably captures crop-specific water footprints at the national scale. Temporal evaluation further indicates that interannual variability is well reproduced. Rice, wheat, and soybean exhibit the closest agreement with field measurements, whereas minor discrepancies for maize likely reflect region-specific irrigation management and soil conditions. Remaining differences primarily arise from uncertainties in remote sensing-derived crop area, evapotranspiration estimates, and the integration of multi-source datasets.
4.1.2 Comparison with other datasets
ChinaCropWF was compared with two existing China-wide crop water footprint datasets: the WFCP dataset (Wang et al., 2023b) and CropGBWater (Chukalla et al., 2025). CropGBWater is a global crop water footprint dataset; here, we focus exclusively on its estimates within China. Results show that CropGBWater reports a higher total water footprint (approximately 500 Gm3) than ChinaCropWF, characterized by a larger green water footprint (approximately 300 Gm3) and a smaller blue water footprint (approximately 200 Gm3). Similarly, the WFCP dataset estimates an even higher total water footprint, comprising approximately 365 Gm3 of green water and 180 Gm3 of blue water. The relatively large green water footprints in both datasets are primarily attributable to the use of monthly or ten-day scale phenological periods, which extend the effective growing seasons and increase accumulated green water consumption. The difference in growing seasons coincides with months of higher precipitation (Fig. 8). When phenological periods in ChinaCropWF are expanded accordingly, its green water footprint estimates become more consistent with those from WFCP and CropGBWater, highlighting the role of phenological assumptions in shaping inter-dataset differences. In addition, notable discrepancies in crop planting areas are observed between the WFCP dataset and this study, particularly in high-precipitation regions of southern China (see Supplement). Such differences in input planting area datasets can substantially influence regional crop water footprint estimates, particularly in rainfed agricultural systems where green water dominates. The larger blue water footprint in this study, compared to other datasets, can be attributed to our accounting for seasonal soil water shortages that necessitate substantial irrigation.
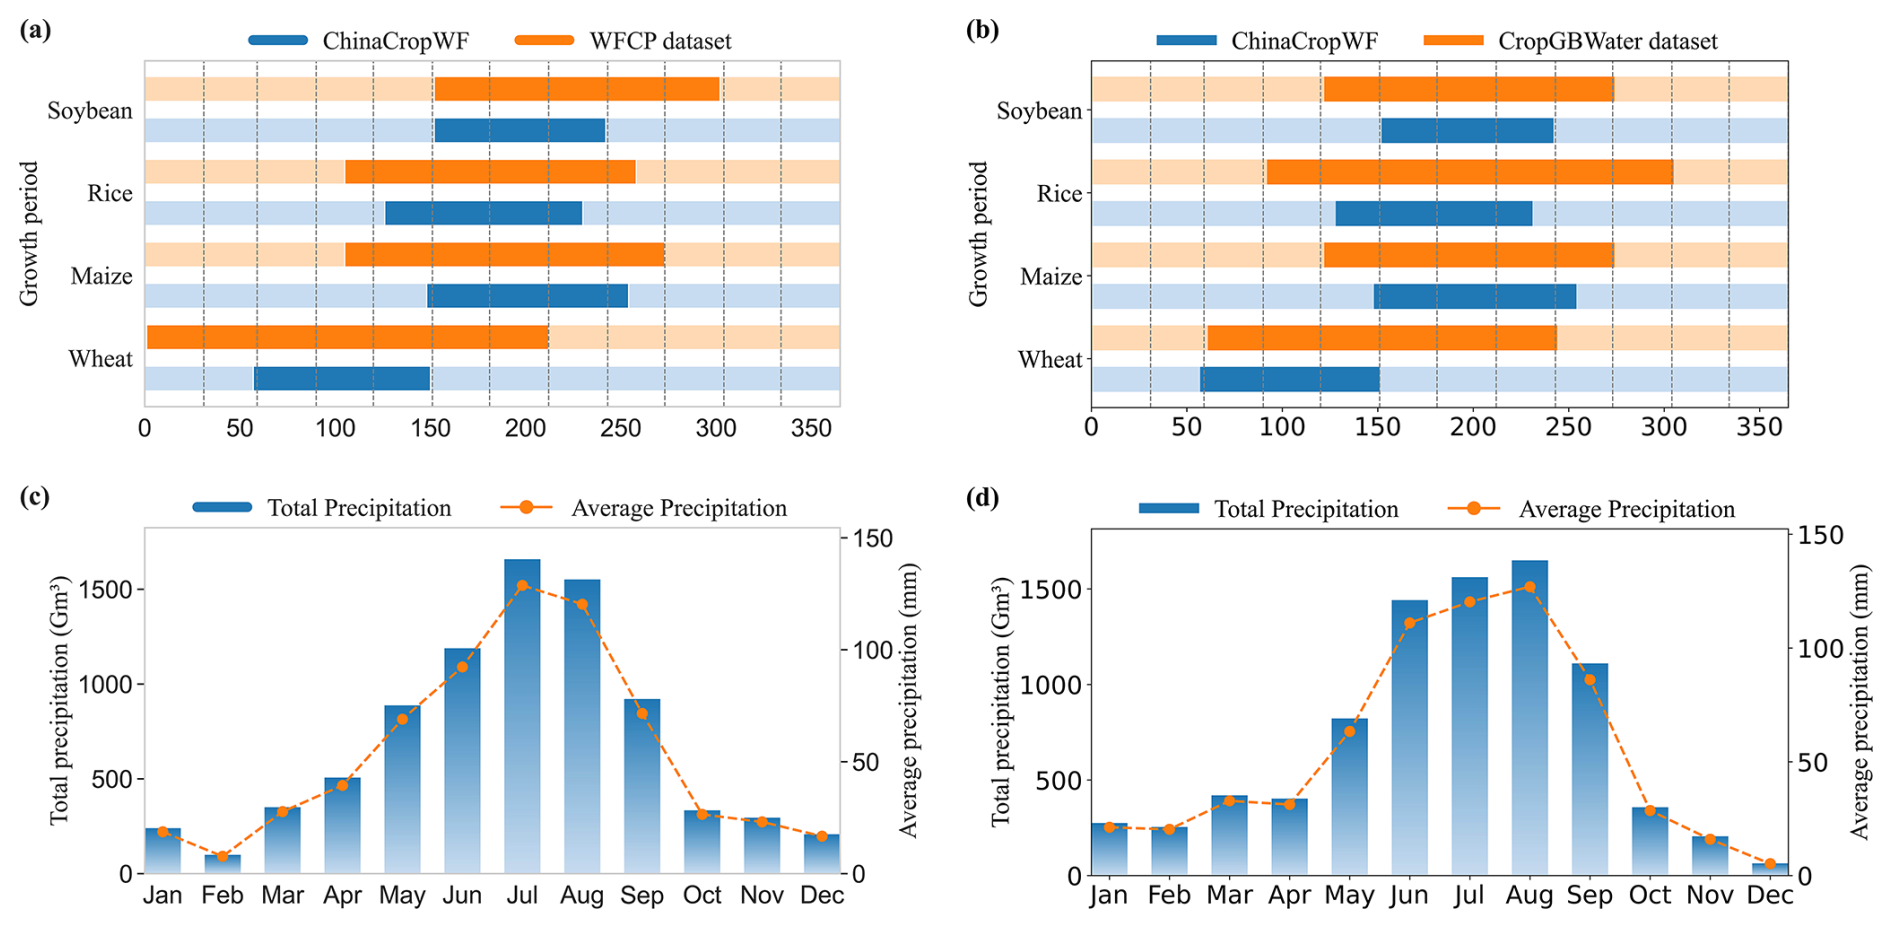
Figure 8Comparison of phenological period of different water footprint datasets. (a, b) compare the growing period derived from the WFCP dataset and the CropGBWater dataset, respectively, with those used in this study. (c, d) depict the evolutionary trends in monthly precipitation for the years 2018 and 2020, respectively.
4.2 Characteristics of ChinaCropWF
ChinaCropWF offers two key advantages: (1) it integrates multi-source remote sensing datasets to enable daily, 1 km gridded quantification of crop water consumption; (2) it captures fine-scale spatiotemporal dynamics and innovatively incorporates the water footprint of alleviating seasonal soil moisture shortages, providing a comprehensive representation of actual water demand.
4.2.1 Phenology impacts on water footprint
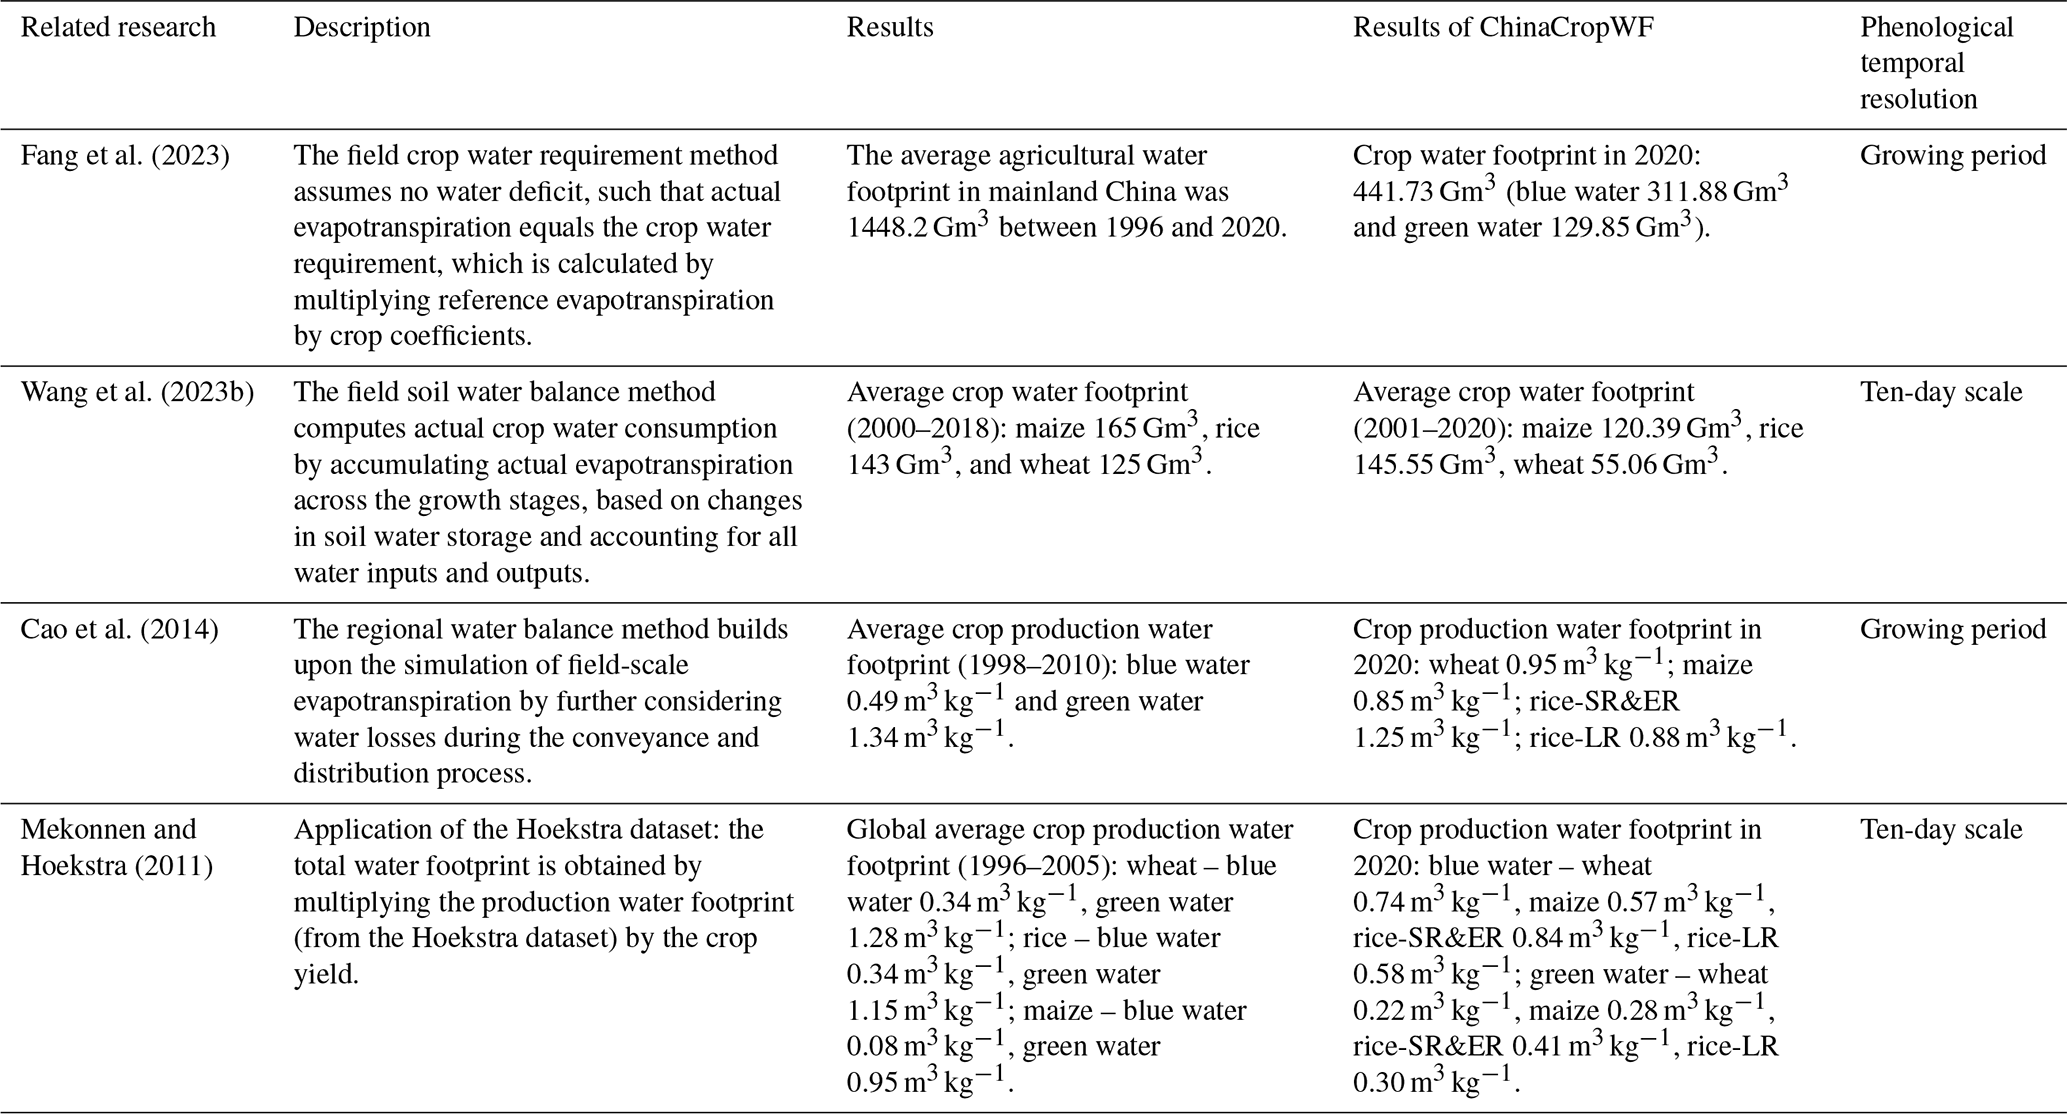
The choice of temporal scale (monthly, ten-day, or daily) in crop water footprint accounting critically influences the reliability and accuracy of estimates, as it determines how well temporal variations in water availability and crop water demand are captured. Approaches using monthly or ten-day scales, typically focusing on the growing seasons (Cao et al., 2014; Mekonnen and Hoekstra, 2020), offer higher temporal resolution than seasonal or annual methods and are relatively straightforward to implement using commonly available meteorological and crop data. However, they remain insufficient for accurately capturing short-term water stress, extreme weather events, or transient physiological responses, all of which can substantially affect crop growth, transpiration, and overall water-use efficiency. Daily-scale methods, usually based on soil water balance models, theoretically provide the highest process-level accuracy by simulating day-to-day fluctuations in water supply, evapotranspiration, and soil moisture dynamics (Hoekstra, 2019). These methods can better account for irrigation timing, rainfall variability, and crop phenology, which are essential for precise estimation of blue and green water footprints. Nevertheless, daily-scale approaches require high-resolution input data – including meteorological variables, soil properties, and crop-specific parameters – and involve considerable computational complexity, which has historically limited their use in multi-scale, long-term analyses or large-area assessments. Table 1 presents a comparison of major crop water footprint methods, along with their phenological temporal resolution and resulting estimates. Compared to the ChinaCropWF dataset, the results from these methods are higher.
Table 1Phenological temporal resolution under different water footprint accounting methods.
To overcome the aforementioned limitations and enhance the accuracy of water footprint accounting, this study proposes a refined framework for daily-scale crop water footprint assessment. This framework integrates high spatiotemporal resolution remote sensing data, the soil water balance method, and the field crop water requirement method. It not only facilitates the precise calculation of daily-scale crop water footprints but also quantifies the supplemental water footprint resulting from seasonal soil water shortages. Consequently, it provides data support with higher temporal resolution for subsequent model simulations and analyses.
4.2.2 Seasonal water shortages effects
Conventional crop water footprint assessments typically quantify blue and green water based solely on evapotranspiration, implicitly assuming sufficient soil moisture and negligible changes in soil water storage, deep percolation, and runoff (Cao et al., 2021; Chukalla et al., 2025). Field observations, however, show that evapotranspiration is regulated by soil infiltration, storage, redistribution, and release processes (Sun et al., 2025). Temporal mismatches between precipitation and crop water demand, limited infiltration during high-intensity rainfall, and rapid soil moisture depletion under dry conditions can substantially reduce effective water availability (Fu et al., 2024; Zhou et al., 2026; Zhu et al., 2022). To maintain soil moisture near field capacity, additional blue and/or green water inputs via irrigation and management practices are required. Incorporating these supplementary inputs alongside evapotranspiration-based footprints provides a more complete representation of agricultural water appropriation. This integrated approach corrects the systematic underestimation inherent in conventional methods, enhances sensitivity to regional water scarcity and hydro-climatic variability, and aligns more closely with soil-plant-atmosphere continuum processes and fundamental hydrological principles.
Therefore, the ChinaCropWF dataset overcomes the simplifications of soil water balance in traditional water footprint assessments by precisely quantifying the blue and green water footprints required as supplemental inputs during seasonal soil water shortages. This enables a more accurate characterization of dynamic crop water consumption under actual climatic and soil conditions. Concurrently, the dataset uses the PML-V2 evapotranspiration product as its core input. This product fully couples vegetation stomatal physiological responses to atmospheric CO2 concentration, photosynthesis, and water transport, thereby providing a robust physiological foundation for this research and ensuring the accuracy of crop water footprint accounting at the source.
4.3 Limitations and future work
This study has several limitations and opportunities for improvement. First, in estimating water footprints associated with seasonal water shortages, a fixed relative soil moisture of 60 % was assumed for non-rice crops, which may not fully capture variability across different water stress conditions. Future research should examine how varying stress levels influence crop water footprints. Results from the sensitivity analysis for different soil moisture scenarios are provided in the Supplement. Second, the grey water footprint refers to the water volume required to dilute pollutants to regulatory standards. Nonpoint source pollution from intensive agriculture has already exceeded environmental carrying capacity, accelerating the degradation of both water quantity and quality (Deng et al., 2025; Ma et al., 2020). Future research should focus on investigating the spatiotemporal dynamics of the grey water footprint to improve the quantification and management of pollution-related components of water resource assessments. Third, despite more realistic crop evapotranspiration provided by remote sensing data, there are known limitations in these satellite datasets due to coarse spatial and temporal resolution, cloud contamination, and uncertainties in flux estimation (Anderson et al., 2024; Huete et al., 2002). Furthermore, the use of multi-source datasets for crop planting area introduces inherent uncertainties due to discrepancies in statistical definitions, spatial resolutions, and temporal update frequencies. The inability of remote sensing products to cover the complete phenological period from sowing to maturity results in incomplete phenological data, which leads to a systematic underestimation of the water footprint. Such constraints may hinder a comprehensive representation of complex agricultural processes, indicating substantial room for improvement in the refined characterization and dynamic monitoring of crop water use patterns. Finally, various remote sensing data products and statistical data exhibit inconsistencies in spatial and temporal resolutions, along with limitations in data accuracy, and the methods and processes of resampling introduce data uncertainties highlighting the need for further integration and refinement to support more detailed research. Future updates of ChinaCropWF should address these issues to enhance accuracy and applicability for sustainable water resource assessment.
ChinaCropWF is available for download via https://doi.org/10.5281/zenodo.19532526 (Hua and Wang, 2025).
ChinaCropWF provides a crop water footprint dataset with a spatial resolution of 1 km and a daily temporal resolution, covering major crops including wheat, maize, rice, soybean, and potato over the period 2001–2020. This dataset enables high-resolution dynamic assessment of blue and green water use. Comparative analyses with multiple datasets and observational data indicate that the daily-scale approach offers irreplaceable advantages in improving water footprint accounting accuracy, distinguishing between blue and green water footprints, and accurately capturing seasonal water shortages. Results show that, although overall crop water footprints have increased, production water footprints have decreased, reflecting sustained pressure on water resources from food production, while highlighting the critical role of efficient water use in maintaining the sustainability of the water-food nexus. As an open-access dataset, ChinaCropWF provides a robust foundation for analyzing the spatial variability of agricultural water use, evaluating transboundary virtual water flows, and informing water-saving and irrigation optimization policies.
The supplement related to this article is available online at https://doi.org/10.5194/essd-18-4097-2026-supplement.
XW designed the research; EH performed the analysis and plotted the figures with supervision by XW; LH, LZ, QZ, and YiW contributed to data processing; EH and XW wrote the original draft; All authors contribute to interpretation of the results and revision of the manuscript.
The contact author has declared that none of the authors has any competing interests.
Publisher's note: Copernicus Publications remains neutral with regard to jurisdictional claims made in the text, published maps, institutional affiliations, or any other geographical representation in this paper. The authors bear the ultimate responsibility for providing appropriate place names. Views expressed in the text are those of the authors and do not necessarily reflect the views of the publisher.
We thank the editor and anonymous reviewers for their constructive suggestions help improving the manuscript from its earlier version. We also thank the support of the High-performance Computing Platform of Peking University.
This research was financially supported by Scientific Research Innovation Capability Support Project for Young Faculty by Ministry of Education (grant no. ZYGXQNJSKYCXNLZCXM-S2), National Natural Science Foundation of China (grant nos. 42361144876 and 42501355) and National Key R&D Program of China (grant no. 2024YFF0809103).
This paper was edited by Peng Zhu and reviewed by two anonymous referees.
Anderson, M. C., Kustas, W. P., Norman, J. M., Diak, G. T., Hain, C. R., Gao, F., Yang, Y., Knipper, K. R., Xue, J., Yang, Y., Crow, W. T., Holmes, T. R. H., Nieto, H., Guzinski, R., Otkin, J. A., Mecikalski, J. R., Cammalleri, C., Torres-Rua, A. T., Zhan, X., Fang, L., Colaizzi, P. D., and Agam, N.: A brief history of the thermal IR-based two-source energy balance (TSEB) model – diagnosing evapotranspiration from plant to global scales, Agr. Forest. Meteorol., 350, 109951, https://doi.org/10.1016/j.agrformet.2024.109951, 2024.
Cao, X., Wu, P., Wang, Y., and Zhao, X.: Water footprint of grain product in irrigated farmland of China, Water Resour. Manag., 28, 2213–2227, https://doi.org/10.1007/s11269-014-0607-1, 2014.
Cao, X., Zeng, W., Wu, M., Li, T., Chen, S., and Wang, W.: Water resources efficiency assessment in crop production from the perspective of water footprint, J. Clean. Prod., 309, 127371, https://doi.org/10.1016/j.jclepro.2021.127371, 2021.
Chukalla, A. D., Mekonnen, M. M., Gunathilake, D., Wolkeba, F. T., Gunasekara, B., and Vanham, D.: Global spatially explicit crop water consumption shows an overall increase of 9 % for 46 agricultural crops from 2010 to 2020, Nat. Food, 6, 983–994, https://doi.org/10.1038/s43016-025-01231-x, 2025.
Dalin, C., Qiu, H., Hanasaki, N., Mauzerall, D. L., and Rodriguez-Iturbe, I.: Balancing water resource conservation and food security in China, P. Natl. Acad. Sci. USA, 112, 4588–4593, https://doi.org/10.1073/pnas.1504345112, 2015.
Deng, Q., Sharretts, T., Ali, T., Ao, Y. Z., Chiarelli, D. D., Demeke, B., Marston, L., Mehta, P., Mekonnen, M., Rulli, M. C., Tuninetti, M., Xie, W., and Davis, K. F.: Deepening water scarcity in breadbasket nations, Nat. Commun., 16, 1110, https://doi.org/10.1038/s41467-025-56022-6, 2025.
Elnashar, A., Wang, L., Wu, B., Zhu, W., and Zeng, H.: Synthesis of global actual evapotranspiration from 1982 to 2019, Earth Syst. Sci. Data, 13, 447–480, https://doi.org/10.5194/essd-13-447-2021, 2021.
Fang, H., Wu, N., Adamowski, J., Wu, M., and Cao, X.: Crop water footprints and their driving mechanisms show regional differences, Sci. Total Environ., 904, 167549, https://doi.org/10.1016/j.scitotenv.2023.167549, 2023.
Fu, Z., Ciais, P., Wigneron, J.-P., Gentine, P., Feldman, A. F., Makowski, D., Viovy, N., Kemanian, A. R., Goll, D. S., Stoy, P. C., Prentice, I. C., Yakir, D., Liu, L., Ma, H., Li, X., Huang, Y., Yu, K., Zhu, P., Li, X., Zhu, Z., Lian, J., and Smith, W. K.: Global critical soil moisture thresholds of plant water stress, Nat. Commun., 15, 4826, https://doi.org/10.1038/s41467-024-49244-7, 2024.
Giordano, V., Tuninetti, M., and Laio, F.: Efficient agricultural practices in africa reduce crop water footprint despite climate change, but rely on blue water resources, Commun. Earth Environ., 4, 1–12, https://doi.org/10.1038/s43247-023-01125-5, 2023.
Graham, N. T., Hejazi, M. I., Kim, S. H., Davies, E. G. R., Edmonds, J. A., and Miralles-Wilhelm, F.: Future changes in the trading of virtual water, Nat. Commun., 11, 3632, https://doi.org/10.1038/s41467-020-17400-4, 2020.
Han, J., Miao, C., Gou, J., Zheng, H., Zhang, Q., and Guo, X.: A new daily gridded precipitation dataset for the Chinese mainland based on gauge observations, Earth Syst. Sci. Data, 15, 3147–3161, https://doi.org/10.5194/essd-15-3147-2023, 2023.
He, L. and Rosa, L.: Solutions to agricultural green water scarcity under climate change, PNAS Nexus, 2, pgad117, https://doi.org/10.1093/pnasnexus/pgad117, 2023.
He, S., Zhang, Y., Ma, N., Tian, J., Kong, D., and Liu, C.: A daily and 500 m coupled evapotranspiration and gross primary production product across China during 2000–2020, Earth Syst. Sci. Data, 14, 5463–5488, https://doi.org/10.5194/essd-14-5463-2022, 2022.
Hoekstra, A. Y.: Green-blue water accounting in a soil water balance, Adv. Water Resour., 129, 112–117, https://doi.org/10.1016/j.advwatres.2019.05.012, 2019.
Hoekstra, A. Y., Chapagain, A. K., Aldaya, M. M., and Mekonnen, M. M. (Eds.): The water footprint assessment manual: Setting the global standard, Earthscan, ISBN 978-1-84971-279-8, 2011.
Hua, E. and Wang, X.: A high-resolution gridded dataset of water footprints for China's major food crops from 2001 to 2020, Zenodo [data set], https://doi.org/10.5281/zenodo.19532526, 2025.
Huete, A., Didan, K., Miura, T., Rodriguez, E. P., Gao, X., and Ferreira, L. G.: Overview of the radiometric and biophysical performance of the MODIS vegetation indices, Remote Sens. Environ., 83, 195–213, https://doi.org/10.1016/S0034-4257(02)00096-2, 2002.
Li, B., Qin, L., Wang, J., Dang, Y., and He, H.: Multi-source data-based spatial variations of blue and green water footprints for rice production in jilin province, China, Environ. Sci. Pollut. R., 28, 38106–38116, https://doi.org/10.1007/s11356-021-13365-z, 2021.
Luo, Y., Zhang, Z., Chen, Y., Li, Z., and Tao, F.: ChinaCropPhen1km: a high-resolution crop phenological dataset for three staple crops in China during 2000–2015 based on leaf area index (LAI) products, Earth Syst. Sci. Data, 12, 197–214, https://doi.org/10.5194/essd-12-197-2020, 2020a.
Luo, Y., Zhang, Z., Li, Z., Chen, Y., Zhang, L., Cao, J., and Tao, F.: Identifying the spatiotemporal changes of annual harvesting areas for three staple crops in China by integrating multi-data sources, Environ. Res. Lett., 15, 074003, https://doi.org/10.1088/1748-9326/ab80f0, 2020b.
Ma, T., Sun, S., Fu, G., Hall, J. W., Ni, Y., He, L., Yi, J., Zhao, N., Du, Y., Pei, T., Cheng, W., Song, C., Fang, C., and Zhou, C.: Pollution exacerbates China's water scarcity and its regional inequality, Nat. Commun., 11, 650, https://doi.org/10.1038/s41467-020-14532-5, 2020.
Mei, Q., Zhang, Z., Luo, Y., Wu, H., and Tao, F.: A 1 km resolution dataset of planting area of three staple crops in China during 2009–2015 V2 (ChinaCropArea1kmV2), Science Data Bank, https://www.scidb.cn/en/detail?dataSetId=e379a388063c4616a6e9271a0b411c9b#p1 (last access: 23 May 2026), 2022.
Mei, Q., Zhang, Z., Han, J., Song, J., Dong, J., Wu, H., Xu, J., and Tao, F.: ChinaSoyArea10m: a dataset of soybean-planting areas with a spatial resolution of 10 m across China from 2017 to 2021, Earth Syst. Sci. Data, 16, 3213–3231, https://doi.org/10.5194/essd-16-3213-2024, 2024.
Mekonnen, M. M. and Hoekstra, A. Y.: The green, blue and grey water footprint of crops and derived crop products, Hydrol. Earth Syst. Sci., 15, 1577–1600, https://doi.org/10.5194/hess-15-1577-2011, 2011.
Mekonnen, M. M. and Hoekstra, A. Y.: Blue water footprint linked to national consumption and international trade is unsustainable, Nat. Food, 1, 792–800, https://doi.org/10.1038/s43016-020-00198-1, 2020.
Mialyk, O., Schyns, J. F., Booij, M. J., Su, H., Hogeboom, R. J., and Berger, M.: Water footprints and crop water use of 175 individual crops for 1990–2019 simulated with a global crop model, Sci. Data, https://doi.org/10.1038/s41597-024-03051-3, 2024.
Perez, N., Singh, V., Ringler, C., Xie, H., Zhu, T., Sutanudjaja, E. H., and Villholth, K. G.: Ending groundwater overdraft without affecting food security, Nat. Sustain., 7, 1007–1017, https://doi.org/10.1038/s41893-024-01376-w, 2024.
Piao, S., Ciais, P., Huang, Y., Shen, Z., Peng, S., Li, J., Zhou, L., Liu, H., Ma, Y., Ding, Y., Friedlingstein, P., Liu, C., Tan, K., Yu, Y., Zhang, T., and Fang, J.: The impacts of climate change on water resources and agriculture in China, Nature, 467, 43–51, https://doi.org/10.1038/nature09364, 2010.
Rosa, L., Chiarelli, D. D., Rulli, M. C., Dell'Angelo, J., and D'Odorico, P.: Global agricultural economic water scarcity, Sci. Adv., 6, eaaz6031, https://doi.org/10.1126/sciadv.aaz6031, 2020.
Shi, G., Sun, W., Shangguan, W., Wei, Z., Yuan, H., Li, L., Sun, X., Zhang, Y., Liang, H., Li, D., Huang, F., Li, Q., and Dai, Y.: A China dataset of soil properties for land surface modelling (version 2, CSDLv2), Earth Syst. Sci. Data, 17, 517–543, https://doi.org/10.5194/essd-17-517-2025, 2025.
Sun, S., Liu, J., Wu, P., Wang, Y., Zhao, X., and Zhang, X.: Comprehensive evaluation of water use in agricultural production: a case study in hetao irrigation district, China, J. Clean. Prod., 112, 4569–4575, https://doi.org/10.1016/j.jclepro.2015.06.123, 2016.
Sun, W., Zhou, S., Yu, B., Zhang, Y., Keenan, T., and Fu, B.: Soil moisture-atmosphere interactions drive terrestrial carbon-water trade-offs, Commun. Earth Environ., 6, 169, https://doi.org/10.1038/s43247-025-02145-z, 2025.
Vörösmarty, C. J., McIntyre, P. B., Gessner, M. O., Dudgeon, D., Prusevich, A., Green, P., Glidden, S., Bunn, S. E., Sullivan, C. A., Liermann, C. R., and Davies, P. M.: Global threats to human water security and river biodiversity, Nature, 467, 555–561, https://doi.org/10.1038/nature09440, 2010.
Wang, J., Gao, X., Huang, K., Yuan, Y., Wang, A., Dong, L., and Zhao, X.: A remote sensing-based method for high-resolution crop water footprint quantification in an irrigation district with complex planting structure, J. Hydrol., 617, 129030, https://doi.org/10.1016/j.jhydrol.2022.129030, 2023a.
Wang, M. and Shi, W.: The annual dynamic dataset of high-resolution crop water use in China from 1991 to 2019, Sci. Data, 11, 1373, https://doi.org/10.1038/s41597-024-04185-0, 2024.
Wang, W., Zhuo, L., Ji, X., Yue, Z., Li, Z., Li, M., Zhang, H., Gao, R., Yan, C., Zhang, P., and Wu, P.: A gridded dataset of consumptive water footprints, evaporation, transpiration, and associated benchmarks related to crop production in China during 2000–2018, Earth Syst. Sci. Data, 15, 4803–4827, https://doi.org/10.5194/essd-15-4803-2023, 2023b.
Wang, X., Müller, C., Elliot, J., Mueller, N. D., Ciais, P., Jägermeyr, J., Gerber, J., Dumas, P., Wang, C., Yang, H., Li, L., Deryng, D., Folberth, C., Liu, W., Makowski, D., Olin, S., Pugh, T. A. M., Reddy, A., Schmid, E., Jeong, S., Zhou, F., and Piao, S.: Global irrigation contribution to wheat and maize yield, Nat. Commun., 12, 1235, https://doi.org/10.1038/s41467-021-21498-5, 2021.
Wang, Z., Li, T., Liang, W., Fu, B., Li, J., and Yan, J.: Uncovering the structure and evolution of global virtual water and agricultural land network, Sustainable Production and Consumption, 51, 599–611, https://doi.org/10.1016/j.spc.2024.08.017, 2024.
Wei, S., Dai, Y., Liu, B., Zhu, A., Duan, Q., Wu, L., Ji, D., Ye, A., Yuan, H., Zhang, Q., Chen, D., Chen, M., Chu, J., Dou, Y., Guo, J., Li, H., Li, J., Liang, L., Liang, X., Liu, H., Liu, S., Miao, C., and Zhang, Y.: A China data set of soil properties for land surface modeling, JAMES, 5, 212–224, https://doi.org/10.1002/jame.20026, 2013.
Wu, P.: Strategic study on water use management in agriculture with “four coordinations” as the core, China Water Resources, 17, 13–20, https://doi.org/10.3969/j.issn.1000-1123.2024.17.012, 2024.
Xu, Z., Chen, X., Wu, S. R., Gong, M., Du, Y., Wang, J., Li, Y., and Liu, J.: Spatial–temporal assessment of water footprint, water scarcity and crop water productivity in a major crop production region, J. Clean. Prod., 224, 375–383, https://doi.org/10.1016/j.jclepro.2019.03.108, 2019.
Zheng, J., Zhou, Z., Liu, J., Yan, Z., Xu, C.-Y., Jiang, Y., Jia, Y., and Wang, H.: A novel framework for investigating the mechanisms of climate change and anthropogenic activities on the evolution of hydrological drought, Sci. Total Environ., 900, 165685, https://doi.org/10.1016/j.scitotenv.2023.165685, 2023.
Zhou, F., Tang, G., Wang, C., Qin, Y., Fu, B., and Fu, J.: Pre-rainfall vapor pressure deficit stress and sunshine reduction govern sub-seasonal rainfall effects on China's rice yield, Eur. J. Agron., 174, 127954, https://doi.org/10.1016/j.eja.2025.127954, 2026.
Zhu, P., Burney, J., Chang, J., Jin, Z., Mueller, N. D., Xin, Q., Xu, J., Yu, L., Makowski, D., and Ciais, P.: Warming reduces global agricultural production by decreasing cropping frequency and yields, Nat. Clim. Change, 12, 1016–1023, https://doi.org/10.1038/s41558-022-01492-5, 2022.
Zhuo, L. and Hoekstra, A. Y.: The effect of different agricultural management practices on irrigation efficiency, water use efficiency and green and blue water footprint, Front. Agric. Sci. Eng., 4, 185–194, https://doi.org/10.15302/J-FASE-2017149, 2017.