the Creative Commons Attribution 4.0 License.
the Creative Commons Attribution 4.0 License.
 | 11 Jun 2026
CY-Bench: a comprehensive benchmark dataset for sub-national crop yield forecasting
Michiel Kallenberg
Dilli Paudel
Stella Ofori-Ampofo
Hilmy Baja
Ron van Bree
Aike Potze
Pratishtha Poudel
Abdelrahman Saleh
Weston Anderson
Malte von Bloh
Andres Castellano
Oumnia Ennaji
Raed Hamed
Rahel Laudien
Donghoon Lee
Inti Luna
Dainius Masiliūnas
Michele Meroni
Janet Mumo Mutuku
Siyabusa Mkuhlani
Jonathan Richetti
Alex C. Ruane
Ritvik Sahajpal
Guanyuan Shuai
Vasileios Sitokonstantinou
Rogério de S. Nóia-Júnior
Amit Kumar Srivastava
Robert Strong
Lily-belle Sweet
Petar Vojnović
Allard de Wit
Maximilian Zachow
Ioannis N. Athanasiadis
In-season, pre-harvest crop yield forecasts are essential for enhancing transparency in commodity markets and improving food security. They play a key role in increasing resilience to climate change and extreme events and thus contribute to the United Nations’ Sustainable Development Goal 2 of zero hunger. Pre-harvest crop yield forecasting is a complex task, as several interacting factors contribute to yield formation, including in-season weather variability, extreme events, long-term climate change, soil, pests, diseases and farm management decisions. Several modeling approaches have been employed to capture complex interactions among such predictors and crop yields. Prior research for in-season, pre-harvest crop yield forecasting has primarily been case-study based, which makes it difficult to compare modeling approaches and measure progress systematically. To address this gap, we introduce CY-Bench (Crop Yield Benchmark), a comprehensive dataset and benchmark to forecast maize and wheat yields at a global scale. CY-Bench was conceptualized and developed within the Machine Learning team of the Agricultural Model Intercomparison and Improvement Project (AgML) in collaboration with agronomists, climate scientists, and machine learning researchers. It features publicly available sub-national yield statistics and relevant predictors, such as weather data, soil characteristics, and remote sensing indicators, that have been pre-processed, standardized, and harmonized across spatio-temporal scales. With CY-Bench, we aim to: (i) establish a standardized framework for developing and evaluating data-driven models across diverse farming systems in more than 25 countries across six continents; (ii) enable robust and reproducible model comparisons that address real-world operational challenges; (iii) provide an openly accessible dataset to the earth system science and machine learning communities, facilitating research on time series forecasting, domain adaptation, and online learning. The dataset (https://doi.org/10.5281/zenodo.11502142, Kallenberg et al., 2025) and accompanying code (https://doi.org/10.5281/zenodo.20456375, Kallenberg et al., 2026) are openly available to support the continuous development of advanced data driven models for crop yield forecasting to enhance decision-making on food security.
- Article
(3779 KB) - Full-text XML
- BibTeX
- EndNote


The global food system faces significant challenges, including unequal access to resources and volatile markets, despite advancements in agricultural production (Ambikapathi et al., 2022; Zhang et al., 2022; Chen and Villoria, 2022; Zelingher and Makowski, 2023; Schneider et al., 2023a) To enhance food security policies, experts have emphasized the need for improved data, maps, and predictions (Mehrabi et al., 2022; Ennaji et al., 2023; Fanzo, 2024). Pre-harvest yield forecasts, in particular, play a critical role in enhancing global market transparency and enabling decision-makers to plan and respond effectively to potential food shortages, especially in the face of a changing climate (Becker-Reshef et al., 2020; Tanaka et al., 2023; Stuart et al., 2024).
Crop yield forecasts are produced by both private entities and government institutes using field surveys, process-based crop models (Gavasso-Rita et al., 2023), and data-driven methods. The latter include statistical regression (e.g., linear models with predefined assumptions) and machine learning (e.g., random forests, neural networks) (Basso and Liu, 2019; Schauberger et al., 2020; Paudel et al., 2021). Commonly used predictors are weather, soil moisture, crop productivity, and remotely-sensed vegetation health indicators. Data availability determines the yield forecasting modeling setup and the selected spatial scale, which can range from national to sub-national and field levels. For example, the European Commission's Joint Research Centre (EC-JRC) regularly produces national crop yield forecasts for the EU and surrounding countries using crop models, agro-meteorological analyses and the expertise of analysts (van der Velde and Nisini, 2019). In India, the Ministry of Agriculture generates multi-season crop production forecasts for major crops from remote sensing and agro-meteorological data using statistical and crop models (Singh et al., 2022). In the United States, the USDA's National Agricultural Statistics Service (NASS) publishes monthly crop forecasts on a multi-stage administrative scale, primarily based on in-field surveys (Good and Irwin, 2003). Data for sub-national crop yield forecasting, which focuses on higher resolution administrative units (e.g., regions, provinces) and captures spatial yield variability within a country (Meroni et al., 2021; Paudel et al., 2022), is crucial for targeted food security planning. Such data is usually publicly available, but compiling them for many countries is challenging due to differences in collection and reporting protocols, including language and data format.
Traditionally, crop yield prediction has been based on biophysical process based crop models, grounded in decades of agricultural knowledge. Their challenges in parametrization (He et al., 2017; Wallach et al., 2021; Seidel et al., 2018) however limits scalability and their reliance on first principles hinders significant improvements in forecasting accuracy (van der Velde and Nisini, 2019). Machine learning methods offer promising alternatives, capturing processes not fully covered by biophysical models. However, they typically require high-quality datasets covering large areas and multiple years. Several review articles (Chlingaryan et al., 2018; Kamilaris and Prenafeta-Boldú, 2018; Liakos et al., 2018; Van Klompenburg et al., 2020; Benos et al., 2021; Oikonomidis et al., 2022) have highlighted promising performance of machine learning methods, including deep learning, for pre-harvest yield forecasting (Schlenker and Roberts, 2009; You et al., 2017; Khaki et al., 2020; Mateo-Sanchis et al., 2021; Paudel et al., 2022; Fan et al., 2022; Liu et al., 2022; Lesk et al., 2022; Paudel et al., 2023b; Vijverberg et al., 2023; Ma et al., 2023; Priyatikanto et al., 2023; Ennaji et al., 2024). However, the data and code used in such studies are not always available, and the diversity in evaluation procedures, metrics, and datasets makes intercomparison and synthesis of results difficult. As a result, the research community is unable to reproduce results and compare the strengths and weaknesses of different methods across crops and regions.
To better understand the specific strengths and weaknesses of data-driven methods for pre-harvest yield forecasting, and to drive future research progress, well-documented benchmark datasets compiled by domain experts are vital (Tsaftaris and Scharr, 2019; Dueben et al., 2022; Rolnick et al., 2024; Sweet et al., 2025). While benchmark datasets can focus on specific regions or tasks, geographic diversity is a particularly valuable property for agricultural machine learning. Crop yield is influenced by highly variable and region-specific factors such as climate, farming practices, soil properties, and socioeconomic conditions. Datasets that span multiple countries and agro-ecological contexts help ensure that models are robust, transferable, and better equipped to generalize beyond well-studied regions (Richards et al., 2023; Tzachor et al., 2022). Including underrepresented or data-scarce regions also promotes research equity and allows the community to address the full spectrum of challenges in global food production (Nakalembe and Kerner, 2023). In addition to producing accurate forecasts, models must be reliable in real-world settings for adoption by stakeholders (van der Velde and Nisini, 2019). The evaluation metrics should closely represent the needs of stakeholders and allow a more granular breakdown of model performance (Thomas and Uminsky, 2022; Burnell et al., 2023) – for example, the model's ability to capture yield variability in years with climate extremes (Watson, 2022). To avoid overestimation of model skill, the evaluation procedure must take into account the specific challenges arising from the use of spatio-temporal data that does not satisfy independent and identically distributed assumptions (Meyer and Pebesma, 2022; Sweet et al., 2023; Kapoor and Narayanan, 2023; Richetti et al., 2023).
A few research works have compiled benchmark-like datasets that include components related to crop yield prediction. SustainBench (Yeh et al., 2021) includes a benchmark dataset for crop yield prediction, and targets end-of-season prediction for only one crop (soybean) in three countries (United States, Brazil and Argentina). Another public dataset is CropNet (Lin et al., 2024), which only covers the United States. Similarly, there are ongoing efforts to produce a multi-task benchmark dataset which includes yield prediction in the USA as a sub-task (Höhl et al., 2023). Apart from these, other available data contributions include yield statistics only (Lee et al., 2025; Potter, 2019; Ronchetti et al., 2024; Duden et al., 2024; Argentina, 2016; Australia, 2024; Brazil, 2022; China, 2024; India, 2024; Mexico, 2019) or sample data published with articles (Khaki et al., 2020; Fernandez-Beltran et al., 2021; Paudel et al., 2021, 2023b) without releasing the full datasets.
We present CY-Bench, a comprehensive dataset and benchmark for sub-national crop yield forecasting, covering thirty-eight countries for maize and twenty-nine countries for wheat across six continents. Here, sub-national refers to the administrative levels for which official crop statistics are published. Crop yield refers to the end-of-season yield reported in the statistics; and forecasting refers to the production of end-of-season yield estimates with a certain lead time before harvest (e.g., mid-season or 30 d before harvest). Thus, the dataset combines sub-national yield statistics with relevant predictors, such as growing-season weather, remote sensing indicators, and soil properties. The novelty of our contribution lies in the integration, harmonization, and standardization of multiple disparate sources into a single, analysis-ready benchmark. To our knowledge, this is the first publicly available dataset that enables consistent model comparison for sub-national yield forecasting across such a broad set of regions and production systems. Key novel aspects include: (i) facilitating benchmarking across countries rather than single-country datasets, filling a gap recently emphasized in the literature (Davis et al., 2025; Sweet et al., 2025); (ii) harmonization of yield statistics, weather, soil, and remote sensing predictors with consistent spatial and temporal alignment; (iii) broad geographical coverage, explicitly including low- and middle-income countries that are often underrepresented in benchmarks; and (iv) development in collaboration with agricultural experts, climate scientists, and machine learning researchers from the AgML community (https://www.agml.org/, last access: 30 May 2026) who guided the selection and alignment of key variables and data sources and contributed to designing the dataset with benchmarking needs in mind. CY-Bench thus lowers the barrier to entry for machine learning researchers in this crucial application area, facilitates model intercomparison across diverse agricultural systems, and promotes reproducibility and transparency in agricultural forecasting. By providing an integrated, expert-curated benchmark, our work complements existing datasets that are either crop- or country-specific and enables the community to develop and evaluate forecasting tools that can support decision-makers in food security planning worldwide.
CY-Bench is a benchmark dataset to train and evaluate crop yield forecasting models that produce in-season forecasts with a certain lead time ahead of harvest. The benchmark includes a comprehensive set of predictors that are known to be important drivers of crop yield. Crop yield is determined by the complex interaction of genetics (G), environmental conditions (E), and management decisions (M), commonly referred to as . Genetics (G) includes factors such as genotype, phenotype, and cultivar; environmental conditions (E) encompass both abiotic factors (e.g., climate, soil) and biotic factors (e.g., pests, pollinators); and management decisions (M) involve farm practices like tillage, sowing dates, irrigation, and fertilization (Liliane and Charles, 2020). Technological advancements, including genetic improvements, better farm inputs, machinery, and enhanced management practices, have all contributed to increased yields over time (Liliane and Charles, 2020). These advancements are often reflected in the yield trend (Lecerf et al., 2019). At the sub-national spatial scale, data on genetic differences (e.g., cultivars) and farm management practices, with the exception of planting and harvest dates, are often not available. Therefore, previous studies of crop yield forecasting also commonly rely on environmental factors, crop calendar information (planting and harvest dates), and yield trend (You et al., 2017; Khaki et al., 2020; Paudel et al., 2021). Factors not explicitly captured in CY-Bench but known to influence end-of-season yields are biotic stressors (e.g., pests and diseases), farm management choices (e.g., irrigation, fertilization, cultivar selection), and socioeconomic factors (e.g., market prices, labor availability, and policy changes).
2.1 Data sources selection
In the absence of benchmark datasets like CY-Bench, modeling crop yield involves numerous uncertainties regarding data sources and quality. The data collection and pre-processing protocols of many predictor datasets, cropland or crop type maps, crop calendars and official statistics are important to select suitable data sources. Each data source has strengths and limitations related to spatial and temporal resolutions and coverage, sampling methods and gap-filling strategies. After data source selection, predictor data from diverse spatial resolutions needs to be aggregated (to the level of yield statistics), which can lead to information loss. In constructing CY-Bench, we engaged a diverse community of researchers to weigh the benefits and limitations of data sources for each type of data necessary to produce crop yield forecasts. The outcome is a curated set of sources, including alternative and our justifications for picking one data source over another. The selection process was guided by several principles: (i) global coverage, (ii) public accessibility, (iii) regular updates (except for inherently static datasets), (iv) near real-time availability, and (v) demonstrated relevance for crop growth and development. A summary of these decisions is provided in the dedicated data sections of this paper, while a more comprehensive overview, including specific benefits and limitations of each dataset considered, is available in our online documentation (https://doi.org/10.5281/zenodo.20456375, Kallenberg et al., 2026). Each selected dataset is further described in accompanying data cards, which provide links to sources, reports, and related publications.
2.1.1 Weather and soil moisture data
Weather is a key driver of crop yield variability (Frieler et al., 2017), as it influences plant growth, development, and physiological processes through factors such as temperature, precipitation, and radiation. Derived weather variables such as vapour pressure deficit and evapotranspiration provide additional information on crop water demand and stress, which can improve yield prediction (López et al., 2021; Tadesse et al., 2015). Precipitation affects soil moisture availability, and evapotranspiration which is strongly influenced by vapour pressure deficit, governs water loss and stress risk. Although actual evapotranspiration would be preferred over reference evapotranspiration, the former is crop-dependent and not readily available at a global scale.
Temperature (temp), precipitation (prec), radiation (rad), reference evapotranspiration (ETo), and vapor pressure deficit (VPD) were selected from AgERA5 (Boogaard et al., 2022), which provides daily data at a 0.1° (∼ 11 km) spatial resolution. AgERA5 offers agrometeorological indicators from 1979 to the present, derived from ERA5 reanalysis and is tailored for agricultural studies. Its key benefits include high-quality data with near real-time updates (i.e. lag of ∼ 2 weeks), comprehensive documentation, and free access via the Copernicus Climate Data Store (CDS, https://cds.climate.copernicus.eu/#!/home, last access: 30 May 2026). Other datasets, such as PRISM, GridMET, TerraClimate, MSWEP, and CPC, have limitations including restricted geographic coverage, coarser temporal or spatial resolution, and fewer variables. A detailed comparison of candidate datasets and trade-offs is available on our Zenodo repository (https://doi.org/10.5281/zenodo.20456375; Kallenberg et al., 2026).
For soil moisture, we selected surface soil moisture (SSM) and root-zone soil moisture (RSM) from the Global Land Data Assimilation System (GLDAS) dataset (Rodell et al., 2004). This dataset represents gridded and global soil moisture data developed by integrating satellite- and ground-based observational data products, using advanced land surface modeling and data assimilation techniques. The dataset is available from 2003 to present, and can be freely downloaded from Goddard Earth Sciences Data and Information Services Center (GES DISC; https://disc.gsfc.nasa.gov/datasets?keywords=GLDAS, last access: 30 May 2026). It has a temporal resolution of one day, and a spatial resolution of 0.25° (∼ 28 km). An alternative dataset is the Global Land Evaporation Amsterdam Model (GLEAM) (Miralles et al., 2025), but it is typically updated only once a year and is currently available only until December 2023.
2.1.2 Remote sensing data
Remote sensing indicators of crop biomass and health include vegetation indices, such as the normalized difference vegetation index (NDVI) and enhanced vegetation index (EVI), as well as biophysical metrics like the fraction of absorbed photosynthetically active radiation (fPAR) and leaf area index (LAI). Sub-national yield forecasting requires long-term time series of these indicators, coupled with frequent satellite revisits to ensure cloud-free imagery. These requirements practically limit options to the coarse-resolution missions MODIS and its successor, VIIRS. While MODIS data can be directly downloaded from NASA Land Processes Distributed Active Archive Center (LPDACC), the raw vegetation indices and biophysical variables are often of low quality due to issues like cloud cover. These limitations require further screening, gap-filling, and corrections. Furthermore, additional processing, which includes the use of quality flags and the application of temporal smoothing procedures, is time-consuming and complex. These challenges become even more pronounced when processing near-real-time data, which is essential for operational yield forecasting.
In view of an operational deployment of sub-national yield forecasting, we selected two analysis-ready operational products representing crop biomass and health: fPAR and NDVI. fPAR is provided as dekadal (10 d) data with a spatial resolution of 0.0045° (500 m), utilizing gap-filled and smoothed MODIS and VIIRS datasets. This data is sourced from EC-JRC (https://agricultural-production-hotspots.ec.europa.eu/data/indicators_fpar/, last access: 30 May 2026), and its quality is being evaluated in Seguini et al. (2026). NDVI, a key indicator of vegetation greenness, is derived from MOD09CMG (Vermote, 2015), available from NASA LPDACC. The data is prepared as an eight-day composite, selecting the pixel with the highest quality for each composite period. This interval offers a practical compromise: shorter composites tend to be noisier due to clouds, while longer intervals risk missing short-term vegetation dynamics and phenological changes. The data is provided at a spatial resolution of 0.05° (∼ 5 km). The quality of this NDVI product has been evaluated in Meroni et al. (2019).
While NDVI can saturate under dense canopies, alternatives such as EVI and GCVI overcomes this limitation. We chose to focus on fPAR and NDVI because of their extensive use in crop yield studies, their direct link to canopy structure and light interception, and their availability as analysis-ready products. Moreover, EVI relies on empirical constants for canopy background adjustment, which can introduce calibration challenges across regions (Huete et al., 2002).
2.1.3 Soil data
We selected data from the World Inventory of Soil Emission Potentials (WISE) project (Batjes, 2016) for static soil properties. WISE data is constructed using the soil map unit delineations of the broad-scale Harmonized World Soil Database, overlaid by a climate zones map (Köppen-Geiger) as co-variate, and soil property estimates derived from analyses of the ISRIC-WISE soil profile database for the respective mapped “soil/climate” combinations. The dataset has a spatial resolution of 30 arcsec (0.00833° (∼ 0.9 km)).
While SoilGrids (Hengl et al., 2017; Poggio et al., 2021) is an alternative, WISE was selected due to its suitability for agricultural applications. Specifically, WISE data is considered to be more readily interpretable and provides essential parameters like soil rooting depth and water holding capacity, which are absent in SoilGrids.
2.1.4 Crop mask and crop calendar data
Crop masks are selected from the European Space Agency WorldCereal (ESA WorldCereal) project (Van Tricht et al., 2023), which provides an up-to-date and actively maintained source for cropland and crop type maps at a spatial resolution of 0.0045° (500 m). Alternative sources of crop masks include Anomaly Hotspots of Agricultural Production (ASAP) from EC-JRC and IIASA (JRC-IIASA) and Global Best Available Crop Specific Masks (GEOGLAM-BACS) from the Group on Earth Observations Global Agriculture Monitoring (GEOGLAM). We considered ESA WorldCereal to be a better choice than the generic cropland layer from JRC-IIASA because of the availability of crop type maps for maize and wheat (spring and winter cereals). Although GEOGLAM-BACS (Becker-Reshef et al., 2023) provides crop type maps for maize and wheat (spring and winter cereals), their spatial resolution (0.05°) is lower compared to ESA WorldCereal (0.00464°).
Crop calendars also come from the ESA WorldCereal project (Franch et al., 2022). ESA WorldCereal crop calendars combine information from existing global crop calendar products, such as GEOGLAM Crop Monitor, the United States Department of Agriculture Foreign Agricultural Service (USDA-FAS), FAO, and EC-JRC's ASAP, into a baseline map and sample them to train a Random Forest algorithm based on climatic and geographic data. They have global coverage and a spatial resolution of 0.5° (∼ 50 km). We considered alternative sources, including Food and Agriculture Organization (FAO, 2025), GGCMI (Waha et al., 2012; Minoli et al., 2019), MIRCA (Portmann et al., 2010), and SAGE (Sacks et al., 2010). However, we selected ESA WorldCereal primarily due to its global coverage and alignment with our crop statistics data. A detailed comparison, based on crop types, country coverage, spatial resolution, and data sources, can be found in our Zenodo repository (https://doi.org/10.5281/zenodo.20456375; Kallenberg et al., 2026).
2.1.5 Crop statistics data
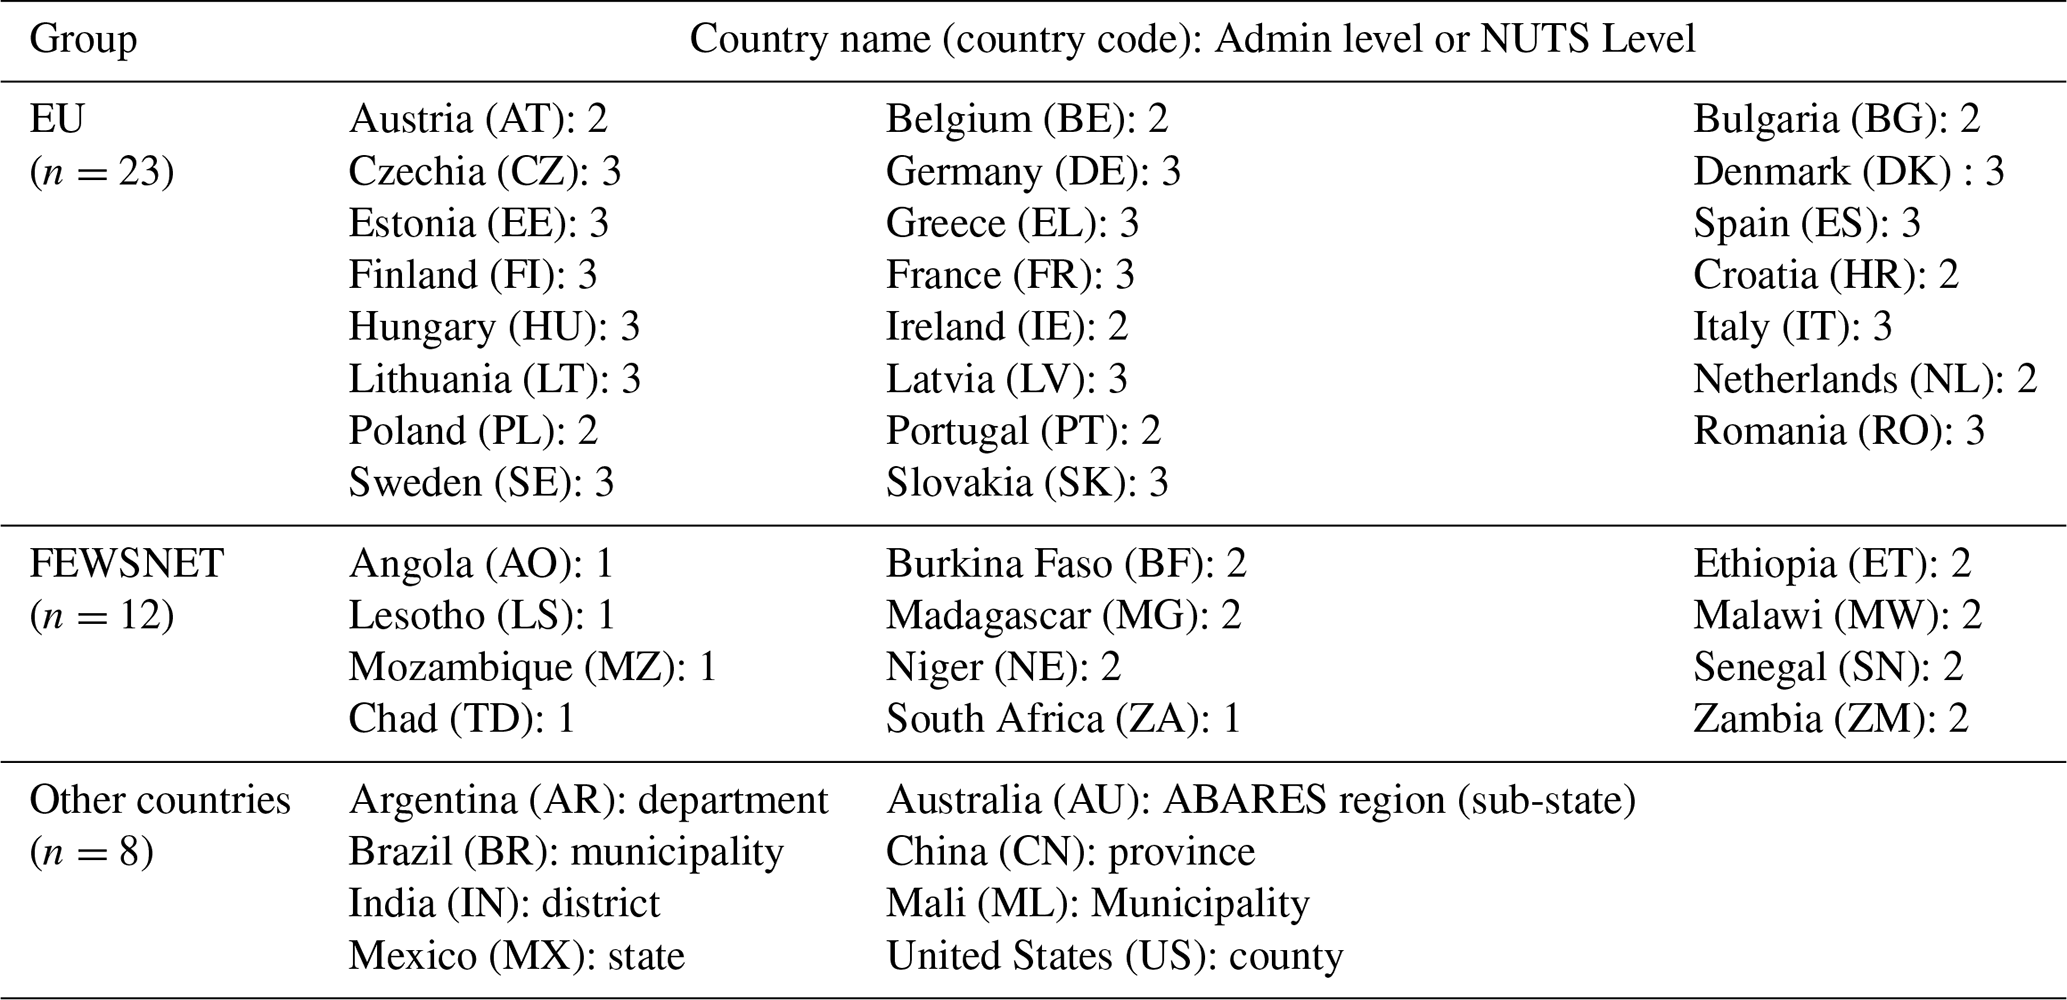
Crop yield statistics for sub-national administrative levels are obtained from national statistics offices or regional agencies, depending on their quality and timely availability. In most cases, they come from the national statistics offices. For example, in the United States, they are published by the National Agricultural Statistics Service (NASS) of the United States Department of Agriculture (USDA). For the European Union, member countries report statistics to Eurostat. However, we considered Ronchetti et al. (2024) a more reliable source than Eurostat, as they follow a harmonization procedure developed by EC-JRC, standardizing crop definitions, administrative boundaries, and reporting practices to produce comparable annual yield time series. For Germany, we selected data from Duden et al. (2024) instead of Ronchetti et al. (2024) because of better temporal coverage (1979–2021 vs. 1999–2020), higher spatial resolution for maize (NUTS level 3 vs. level 1) and better quality based on consistency checks (e.g., ). For Africa, except for Mali, data comes from the USAID's Famine Early Warning Systems Network (FEWS NET) Data Warehouse via the HarvestStat Africa dataset. The data was compiled by FEWS NET and NASA Harvest and harmonized by Lee et al. (2025) to account for changing administrative boundaries and reporting inconsistencies over time. For Mali, we selected Compagnie Malienne pour le Developpement des Textiles (CMDT) dataset (ICRISAT Mali, 2018) that provides higher spatial resolution data at arrondissement-level (administrative level 3). Depending on the country, the term “sub-national” can refer to administrative division 1 (province, state, region), division 2 (district), or division 3 (county, municipality, commune) (Table 2). When statistics for multiple administrative levels are available, we select the highest resolution.
2.2 Data preparation
2.2.1 Crop yield data (targets)
CY-Bench dataset includes crop statistics from thirty-eight countries for maize and twenty-nine countries for wheat (Fig. 3). Coverage maps show that CY-Bench has extensive coverage when layered on top of crop type maps from ESA WorldCereal, with notable omissions including Canada, Ukraine and Russia for wheat and Ukraine, Uganda and Tanzania for maize. Data preparation for yield data involved filtering out values that do not meet certain consistency checks, e.g., , or zero values. The data sources or publications from which CY-Bench draws the data do additional consistency checks. We refer interested readers to respective data cards (Pushkarna et al., 2022) in our Zenodo repository (https://doi.org/10.5281/zenodo.20456375; Kallenberg et al., 2026) which contains further links to data sources, related reports and publications.
2.2.2 Predictor data
CY-Bench predictor data includes static soil properties and time series of weather variables, soil moisture indicators and vegetation indicators (Table 1). Predictor data and yield statistics often differ in spatial and temporal resolution, requiring further processing to align them effectively. While such aggregation can mask fine-scale variability or temporal dynamics, it can also smooth out noise and improve the stability of predictors (Hoffmann et al., 2016; Paudel et al., 2023). Weather, ETo and soil moisture data come in daily time steps. fPAR comes in dekadal time step, with three values per month (days 1–10, 11–20, 21–31). NDVI data is available every eight days, with gaps due to cloud cover.
Table 1Overview of the predictor data, crop mask and crop calendar.
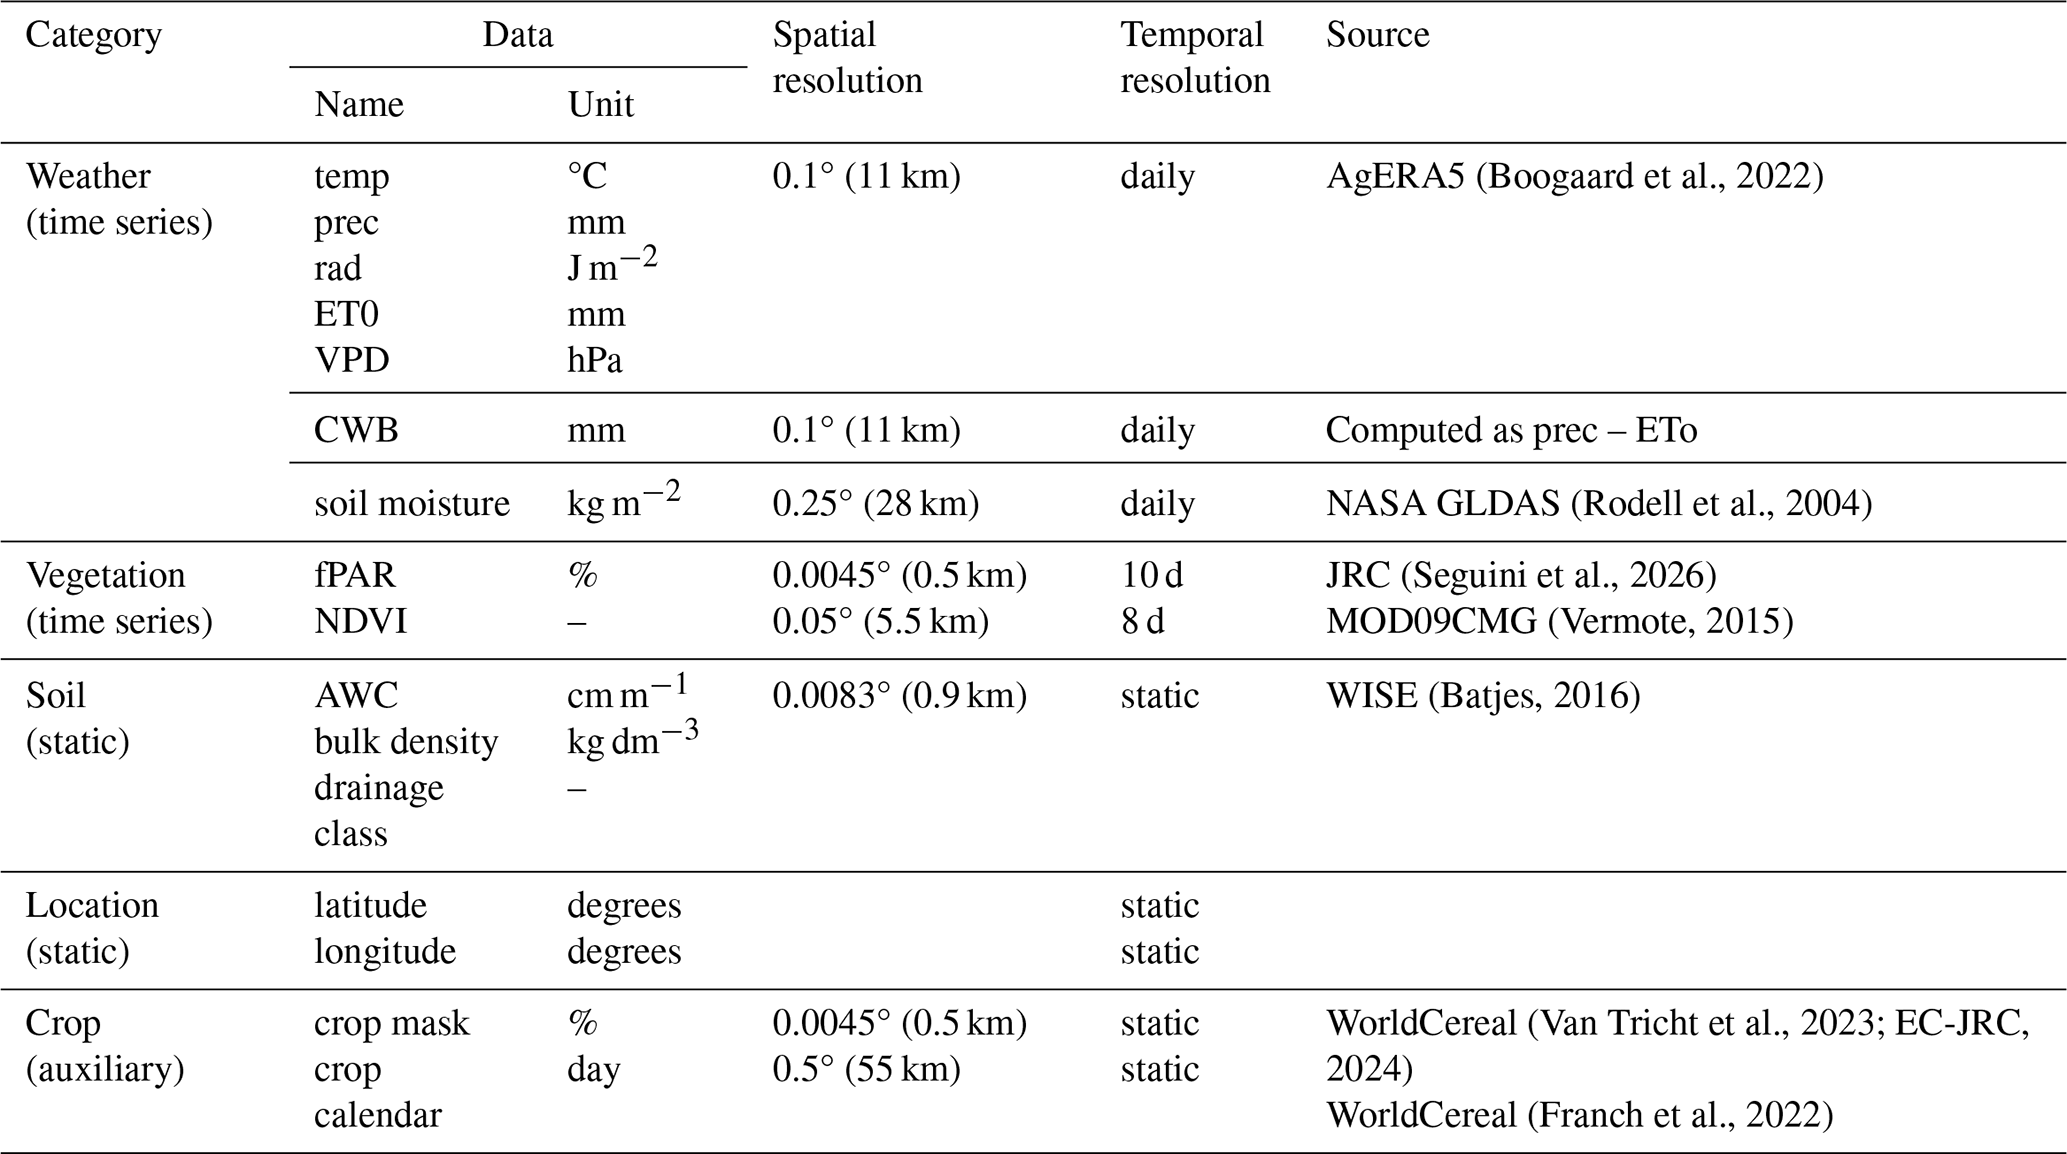
Abbreviations: Temperature (temp), Precipitation flux (prec), Solar radiation flux (rad), Reference evapotranspiration (ETo), Vapor pressure deficit (VPD), Climatic water balance (CWB), Fraction of absorbed photosynthetically active radiation (fPAR), Normalized difference vegetation index (NDVI), and available water capacity (AWC).
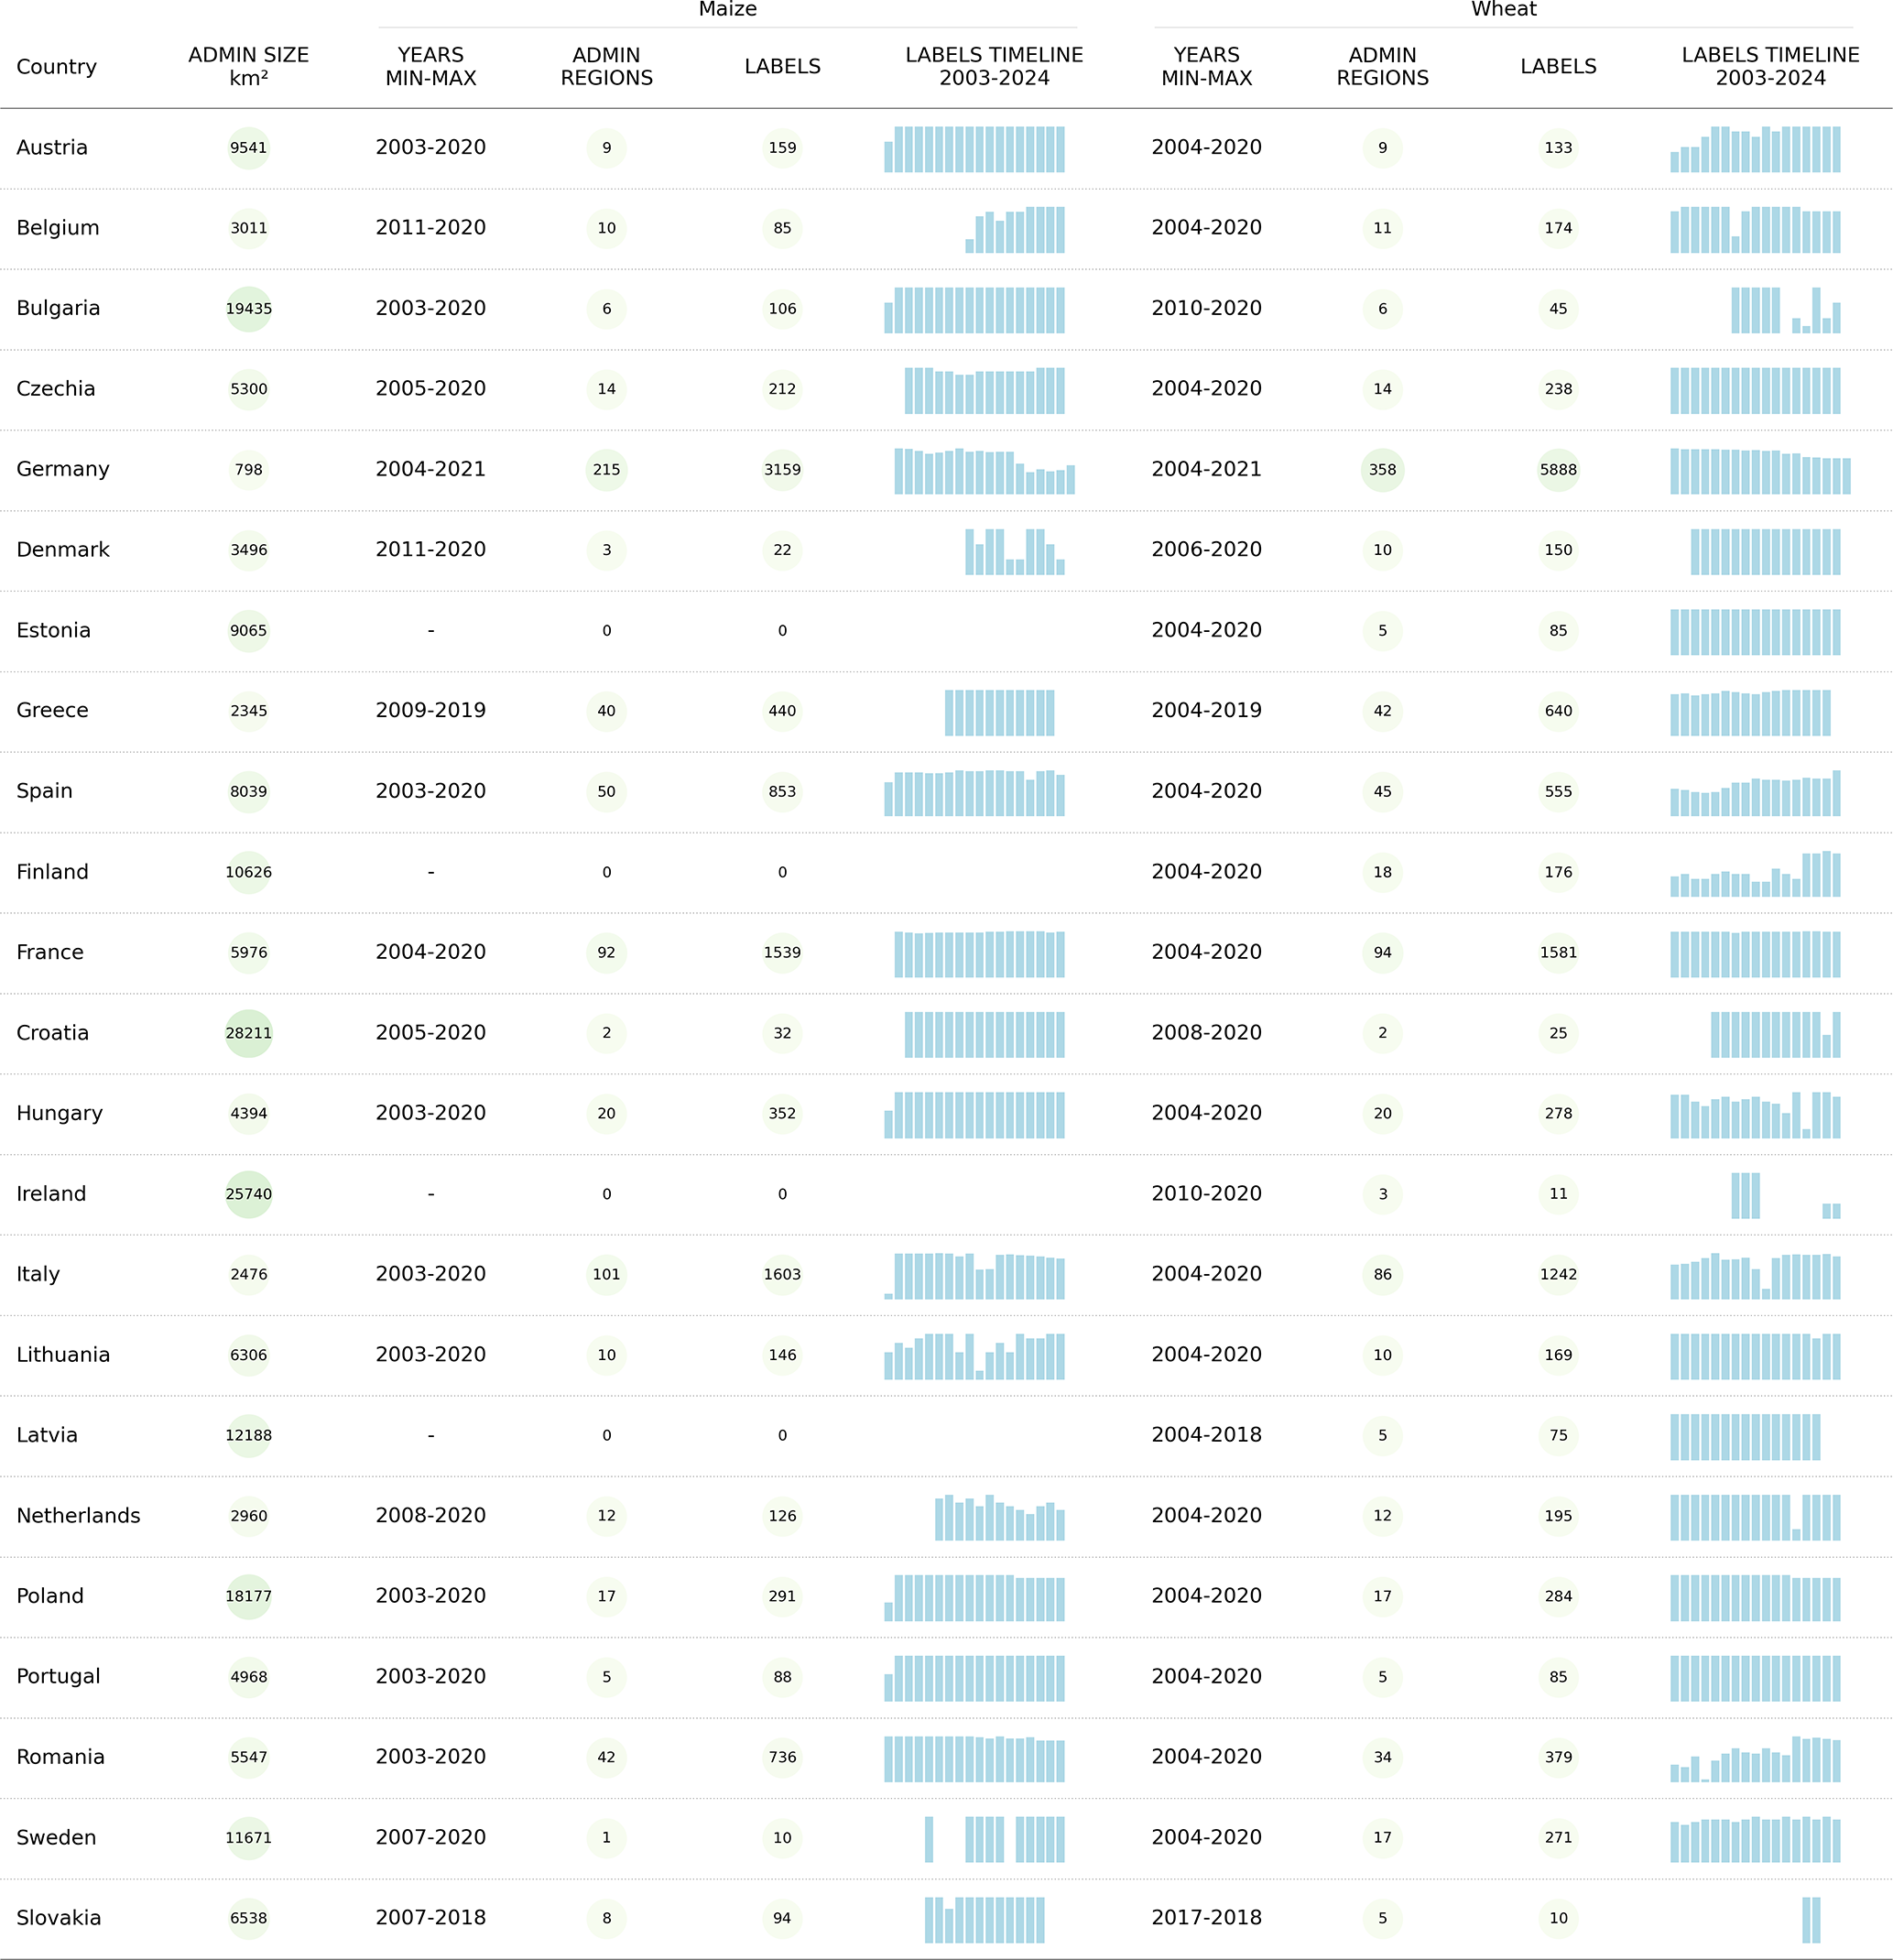
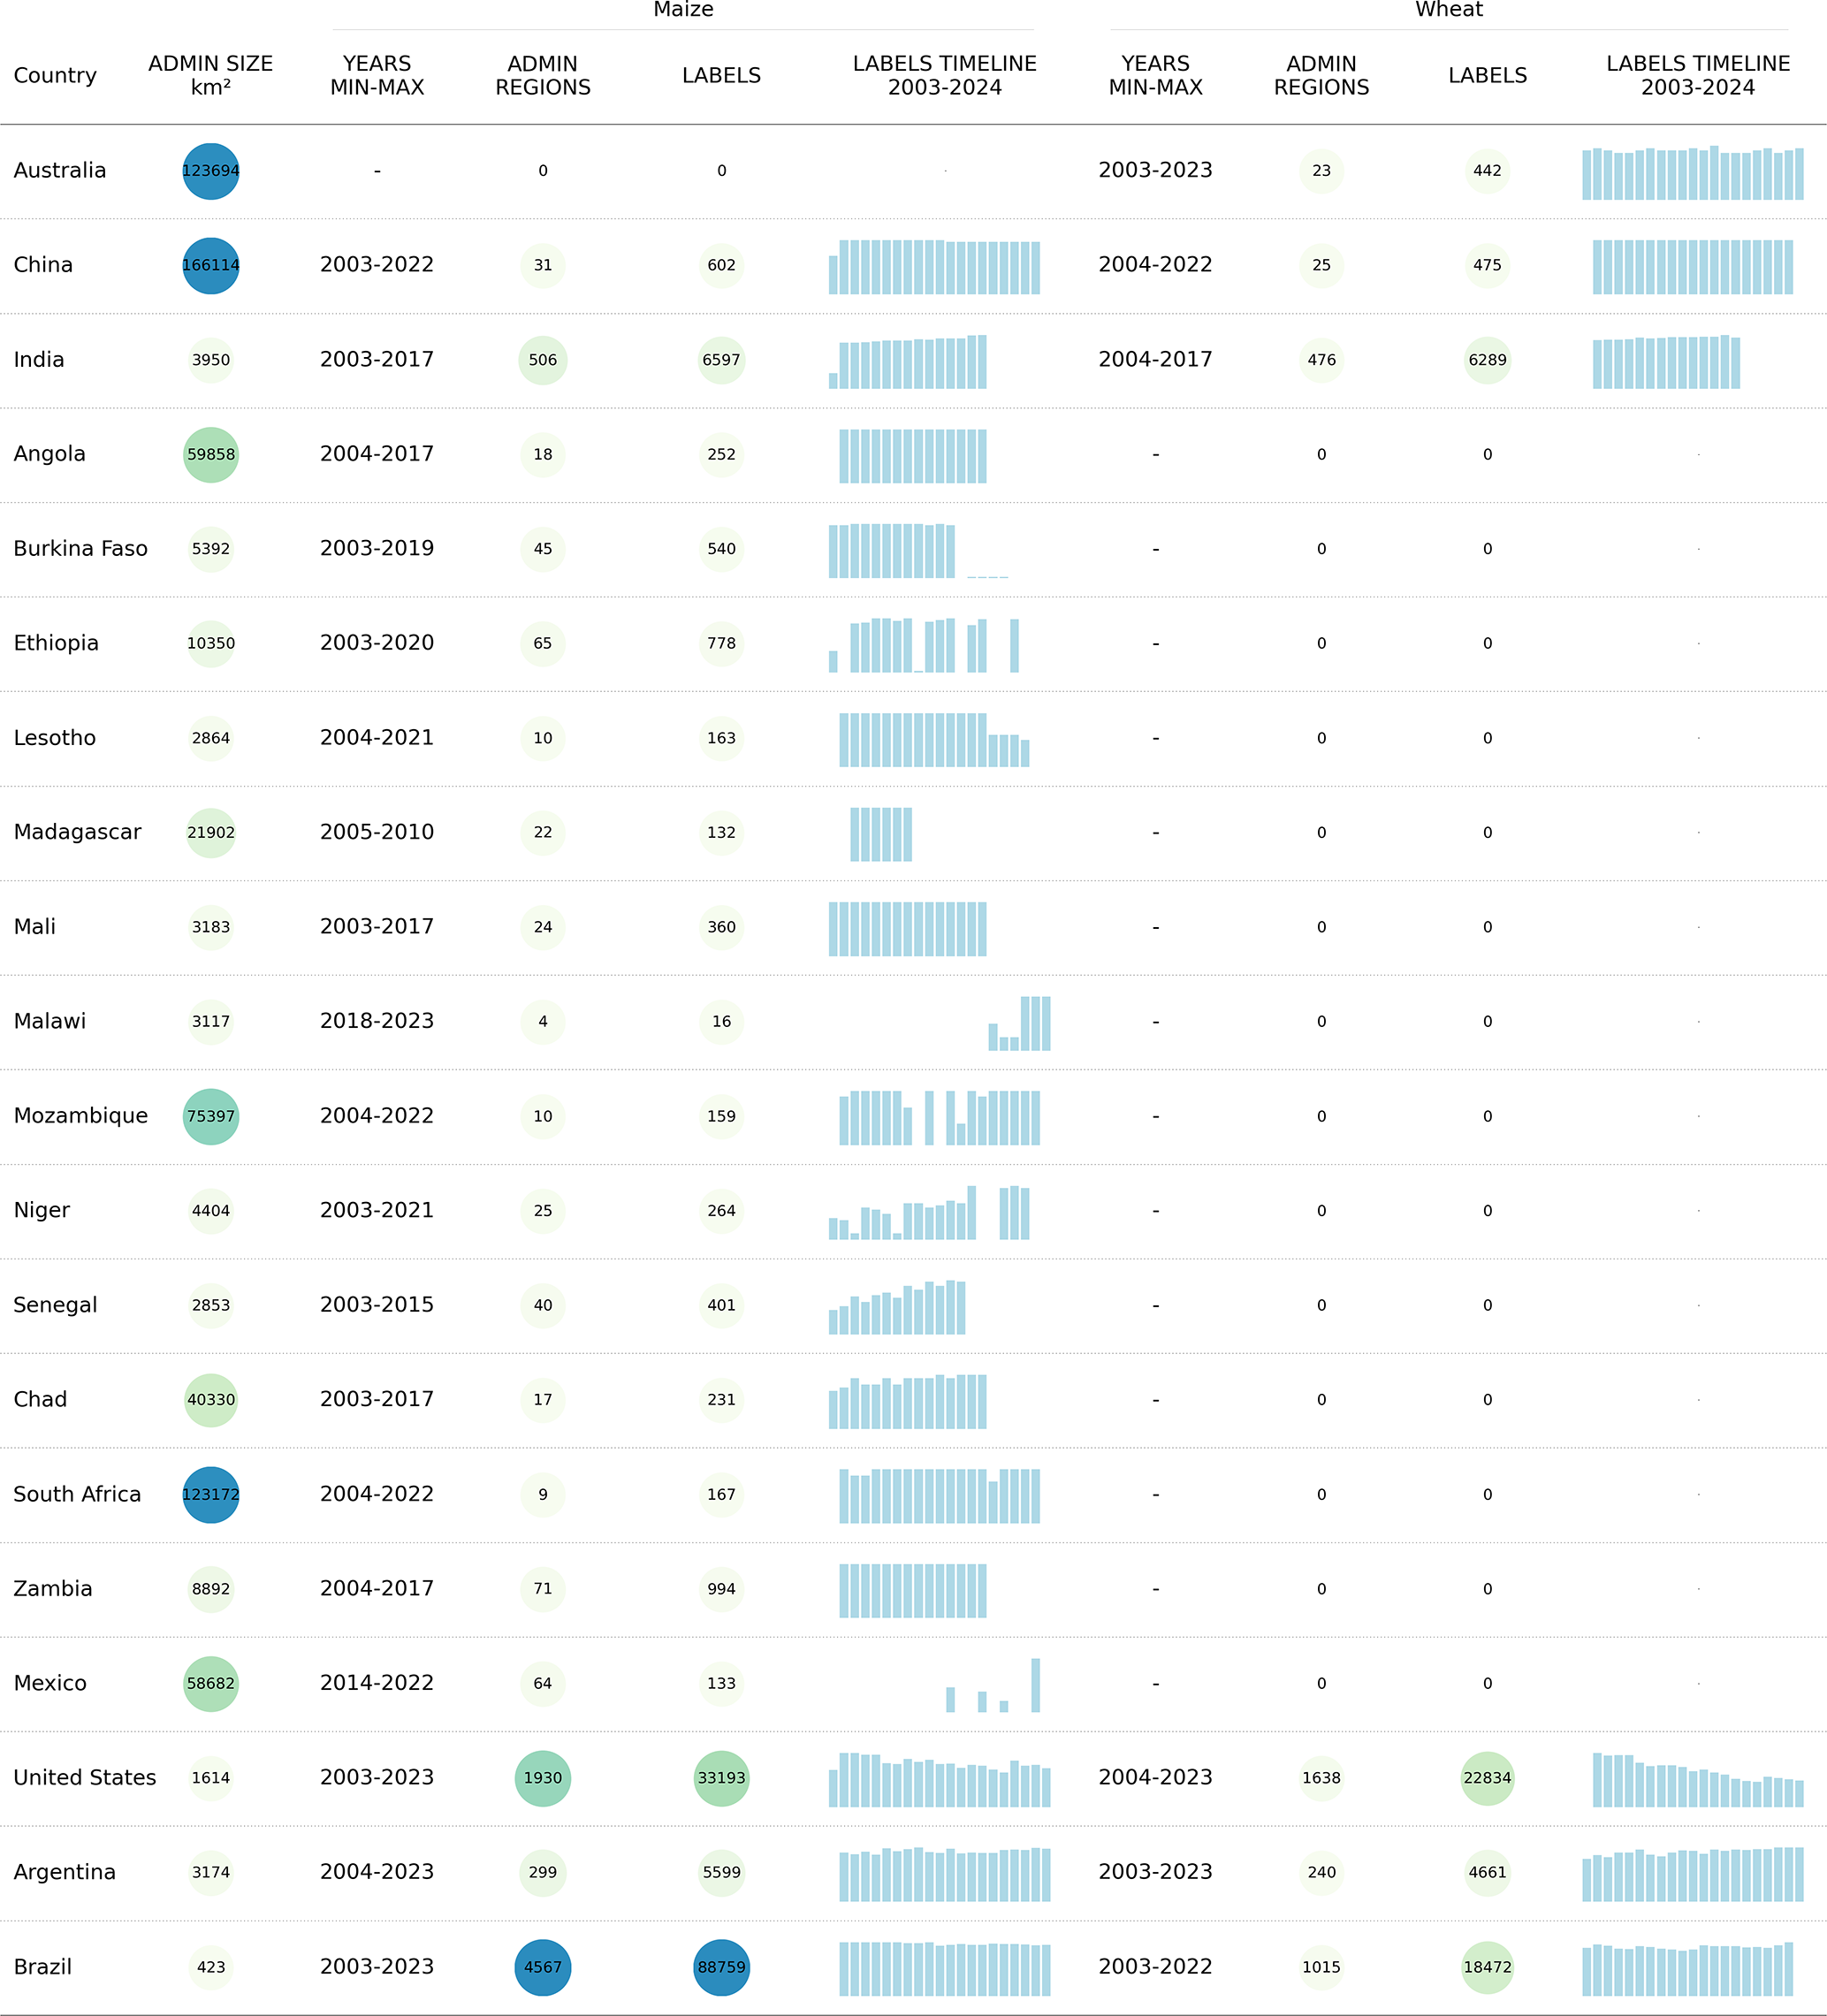
Table 2Countries and the administrative levels for which CY-Bench data is provided.
Predictor data is filtered using crop type maps (or crop masks) from EC-JRC (2024) which are derived from the ESA WorldCereal project (Van Tricht et al., 2023). This step restricts predictor data to pixels in harvested crop areas only. After masking, predictor data is aggregated to match the boundaries and spatial level of the yield data according to the administrative level (Fig. 1). The data preparation workflow is implemented in a Python script in our GitHub repository (https://github.com/WUR-AI/AgML-CY-Bench/tree/main/data_preparation/predictor_data_prep.py, last access: 30 May 2026; Kallenberg et al., 2026). We note that all predictor data retain their temporal resolution from the original data source, creating a multi-modal dataset.
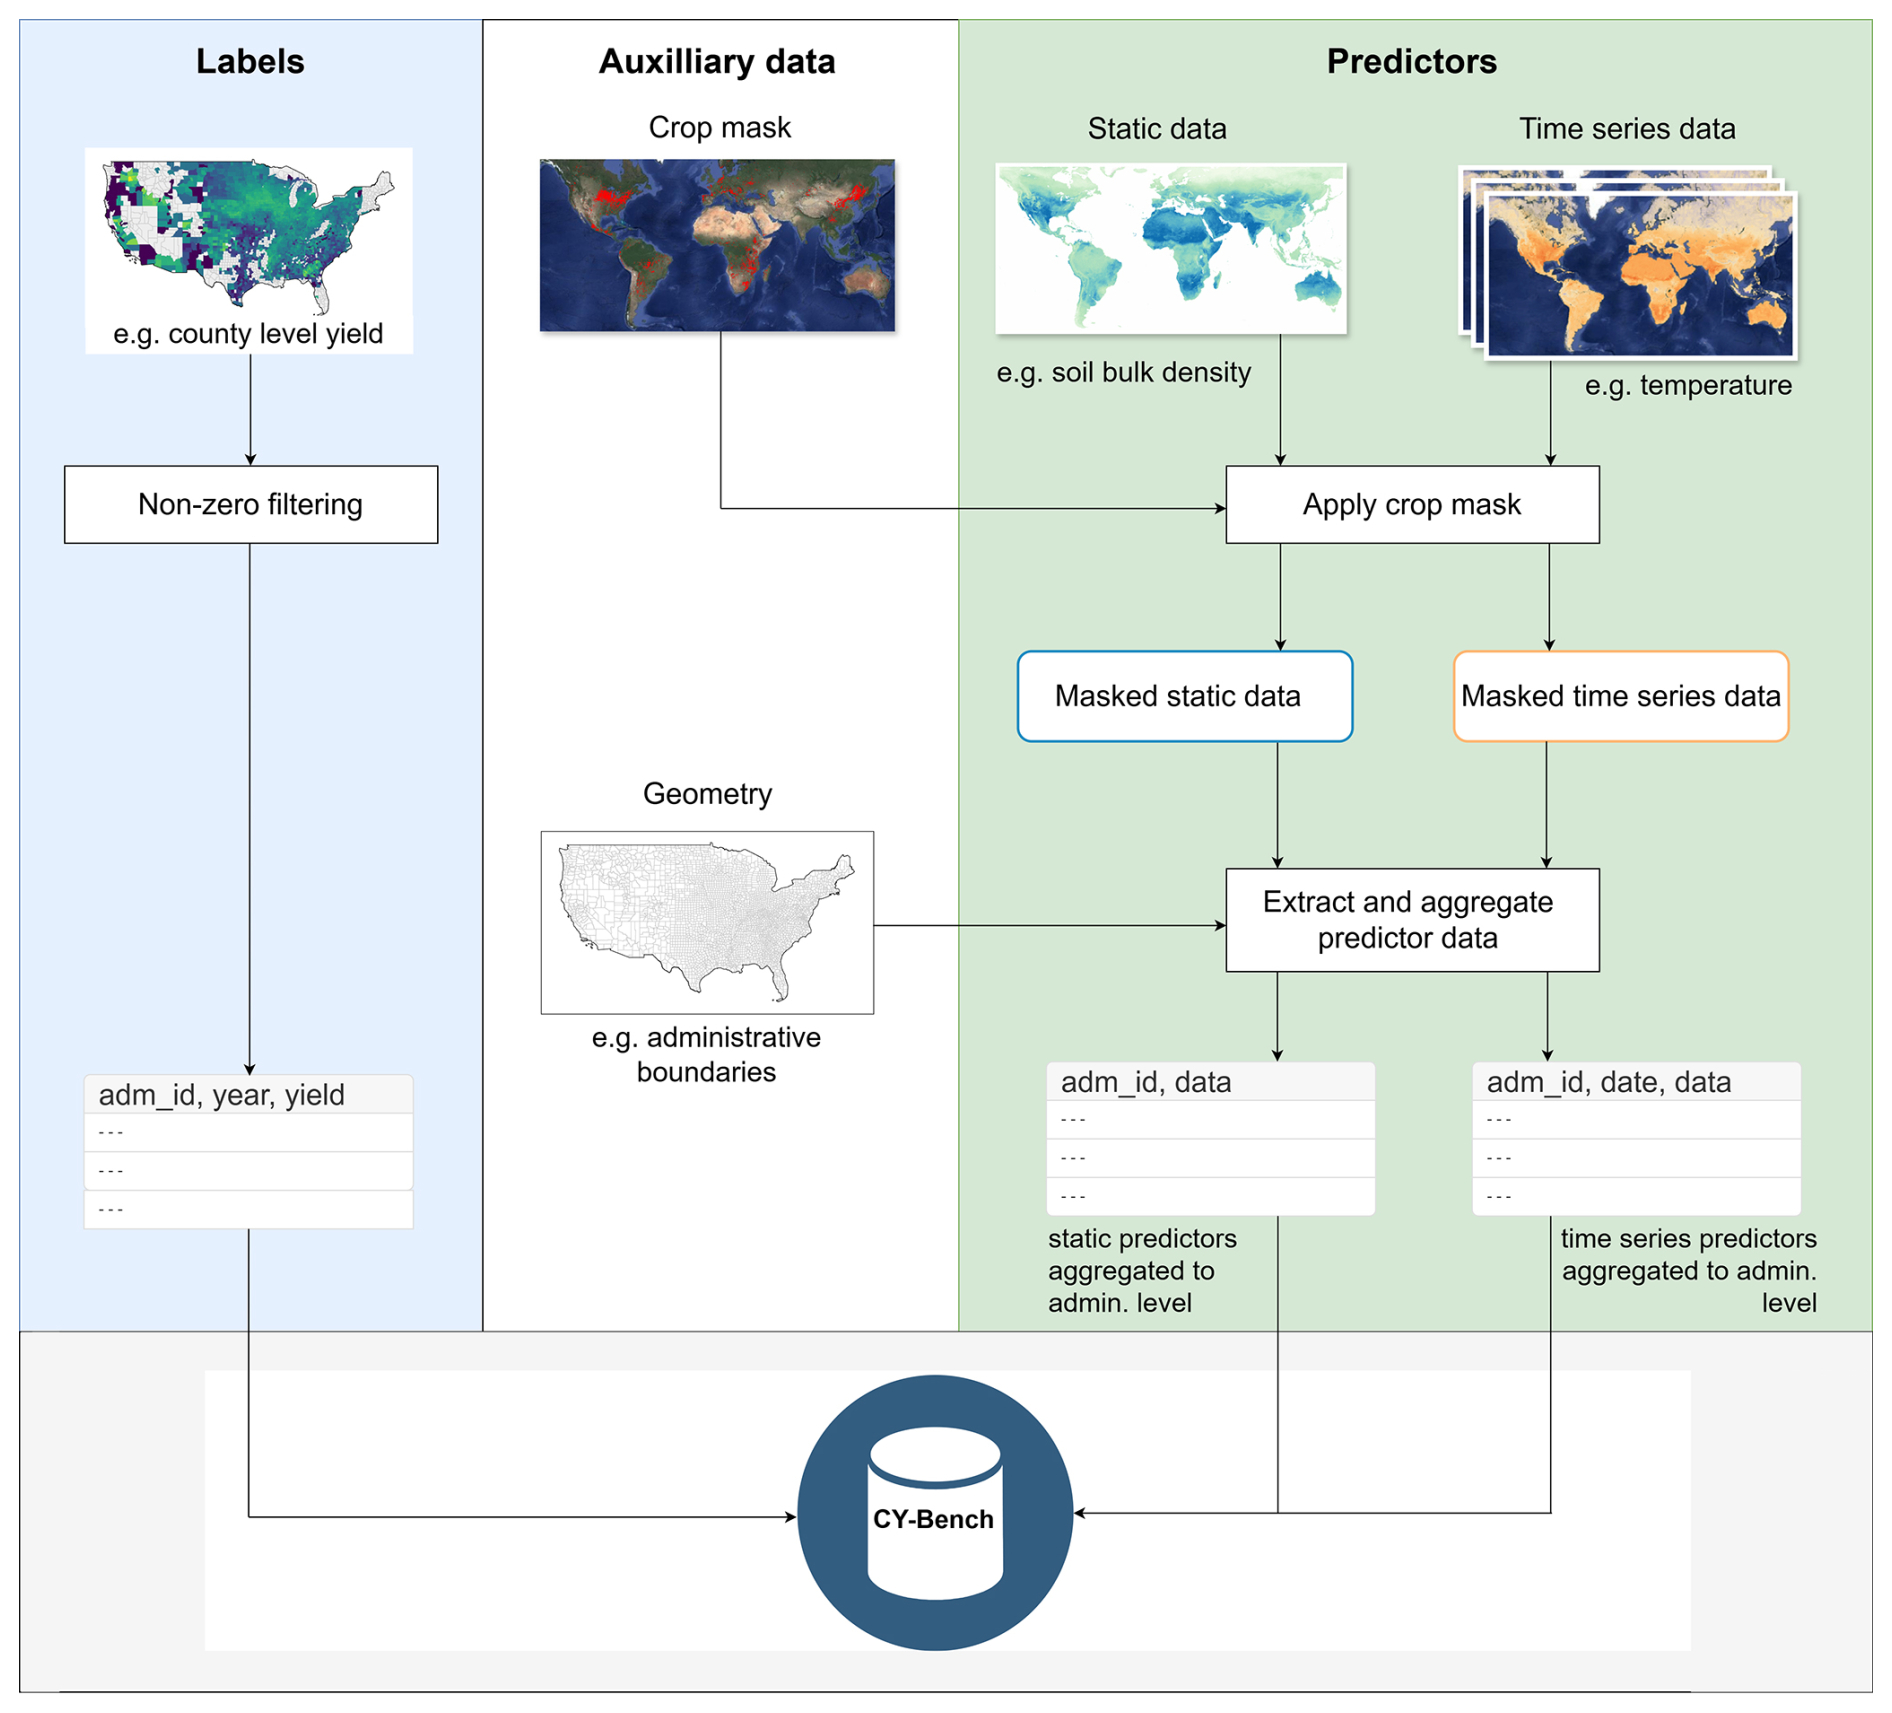
Figure 1Overview of the CY-Bench data preparation process.
2.2.3 Additional pre-processing for yield forecasting models
Here we describe some additional pre-processing implemented in our cybench library that are relevant for building crop yield forecasting models. Predictor data from different sources come with different temporal coverage. Similarly, they include observations for the calendar year, which may not capture the crop season. First, we align time series inputs (weather variables, remote sensing indicators and soil moisture indicators) to the crop season (see Fig. 2). We define the boundaries of the crop season as 90 d before the start of season (the spin-up time) to the end of season in a particular calendar year and filter out data outside the boundaries. Therefore, data from the previous year can be included in the current calendar year's crop season and data after the end-of-season date get pushed to the crop season for the next calendar year. Furthermore, data towards the end-of-season are filtered out based on the lead time relative to harvest or end-of-season. Second, we align the input data sources and label data to produce a set of data samples that are complete, i.e. each data sample includes all the relevant predictors for each time step (or static) and a label.
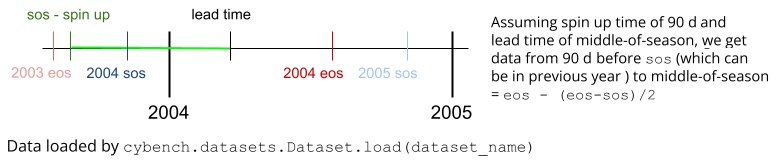
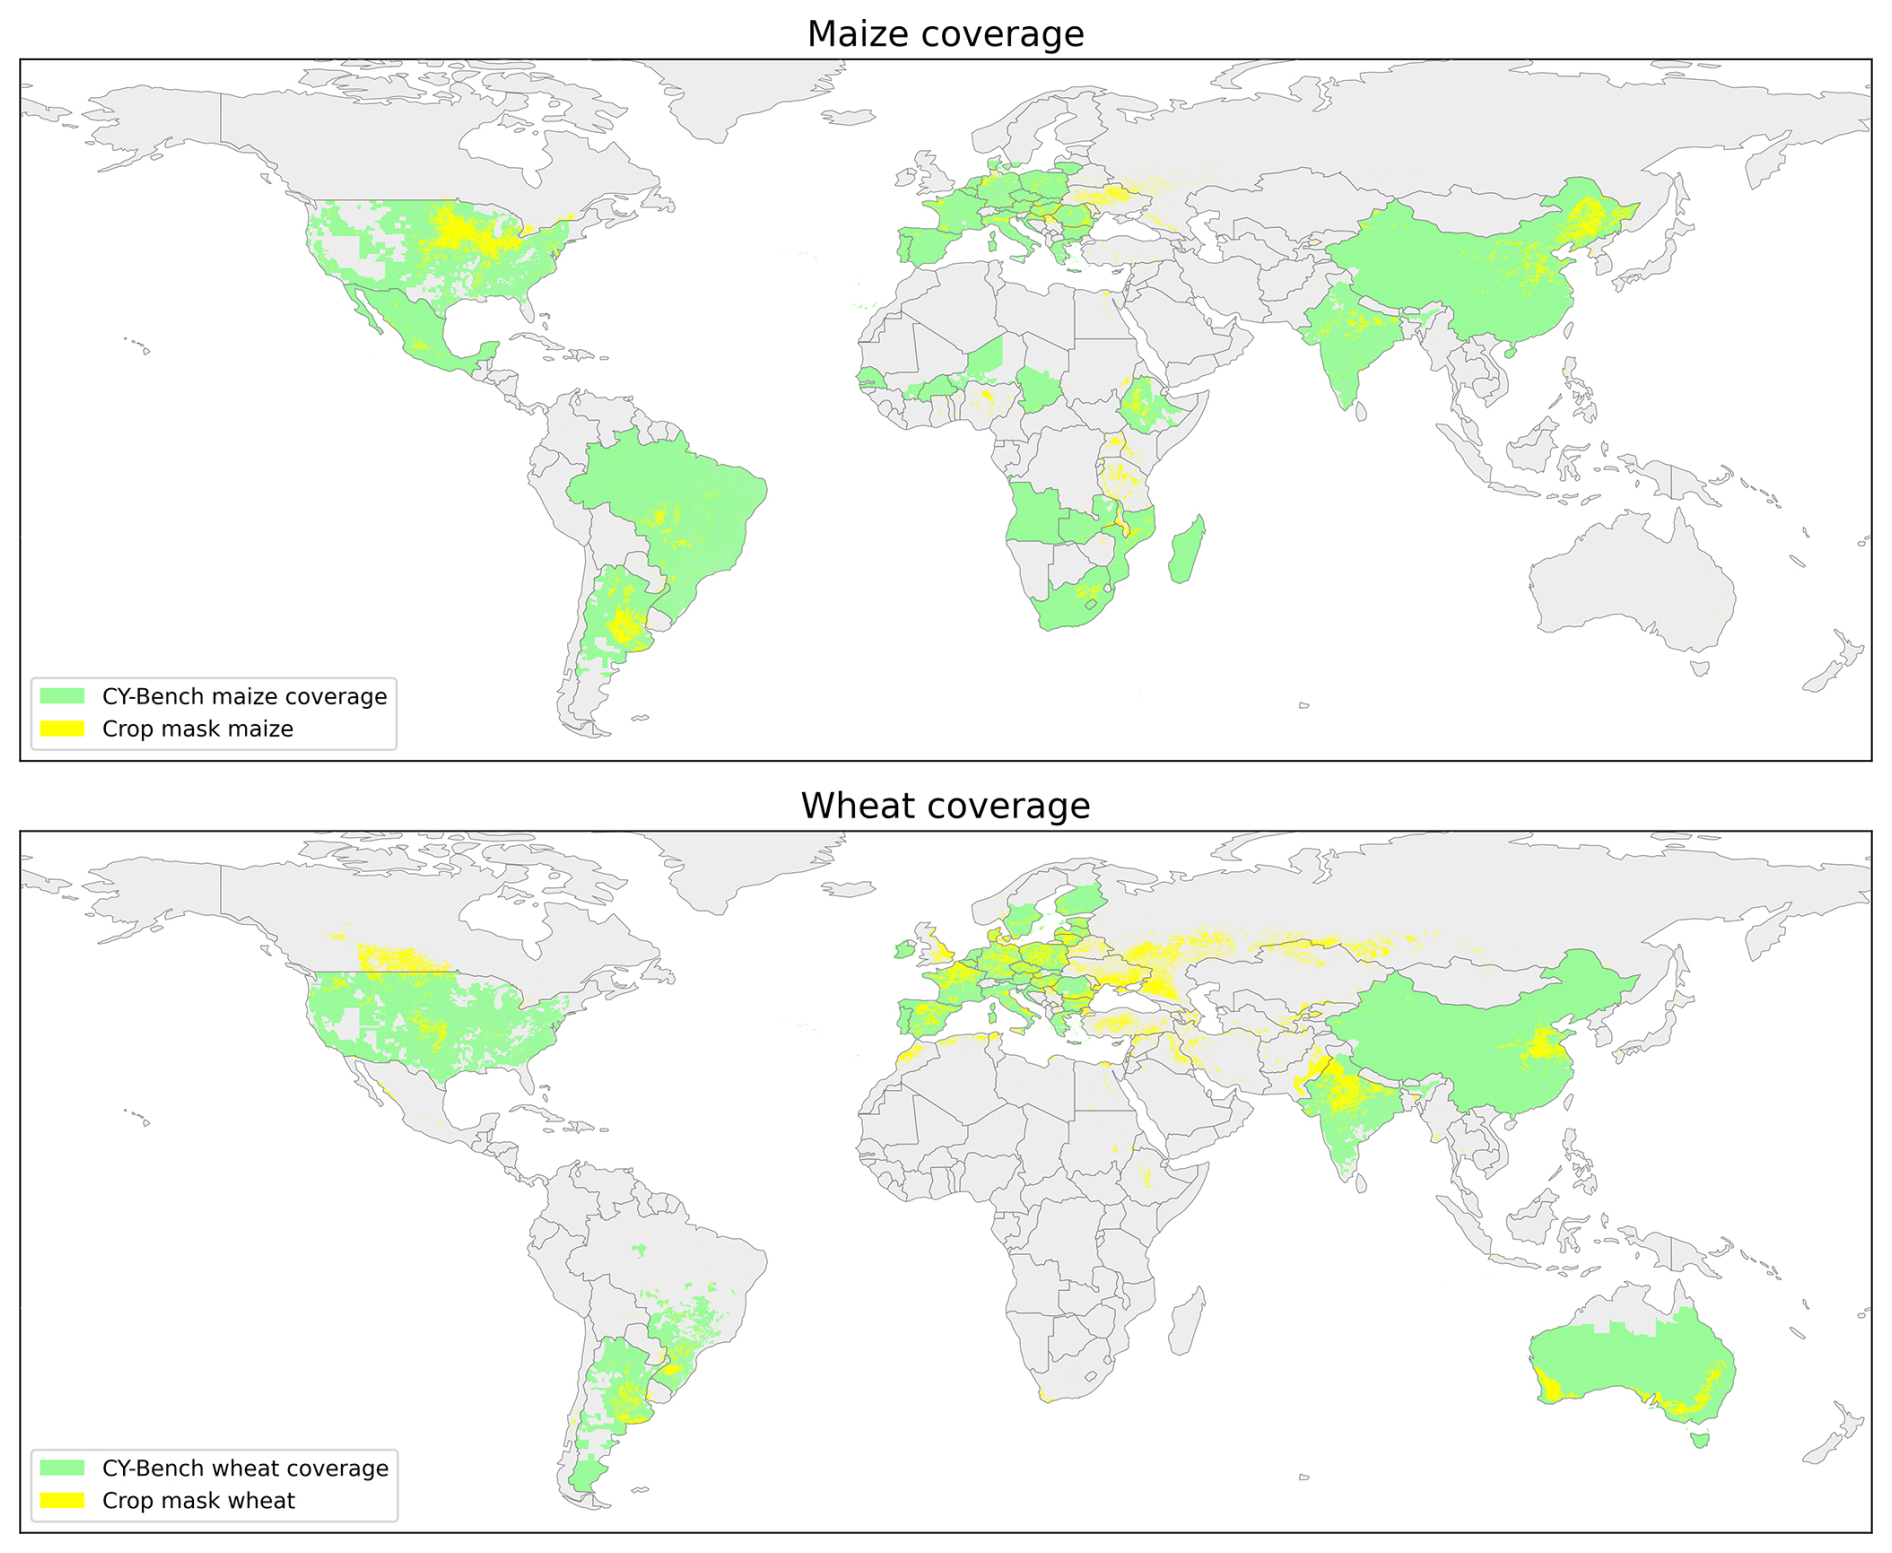
Figure 3Coverage of CY-Bench for maize (38 countries) and wheat (29 countries) overlaid on crop type maps from ESA WorldCereal. Coverage is extensive, with notable omissions including Ukraine, Uganda, and Tanzania for maize, and Canada, Ukraine, and Russia for wheat. Some administrative units are covered despite no visible crop mask; an apparent mismatch caused by thresholding of low-percentage crop mask pixels (e.g., Tasmania contains only a few hectares of wheat).
The time series predictors need further pre-processing during modeling. Certain models require time series data to have the same number of time steps. Therefore, time series inputs are aggregated to dekadal time steps (days 1–10, 11–20, 21–30, and so on), taking the mean of most variables, minimum of minimum temperature, maximum of maximum temperature and the sum of precipitation flux, climatic water balance and solar radiation flux. Where the variable is categorical (such as soil drainage), we take the mode.
To further prepare features as tabular data, time series data are aggregated in the temporal dimension to create domain-relevant features. Following expert recommendations we create monthly averages of minimum daily temperature (tmin), maximum daily temperature (tmax), average daily temperature, daily precipitation (prec), cumulative climatic water balance (prec − ETo) and surface soil moisture. Similarly, monthly maximum values are calculated for cumulative growing degree days (GGD), cumulative precipitation, cumulative fPAR and cumulative NDVI. Furthermore, we calculate the number of days in which tmin is less than 0 °C (“cold days”), days in which tmax is greater than 35 °C (“hot days”) and days where prec is less than 1 mm (“dry days”).
2.2.4 Future expansion and data integration
CY-Bench currently includes predictor data from 2003 through 2023. Availability of crop statistics varies by country (see Tables 3, 4). We share yield and predictor data preparation scripts and notebooks in our Zenodo repository (https://doi.org/10.5281/zenodo.20456375; Kallenberg et al., 2026). to make the inclusion of new data possible as it becomes available. For example, when crop statistics for new data years become available for specific countries, the data preparation pipeline for agricultural yield data can be run for the crop statistics, and predictor data preparation scripts can be run for predictor inputs. Expanding the database in the future primarily depends on onboarding crop statistics, as the global availability of input predictors ensures that integrating additional crop statistics is the only prerequisite for extending CY-Bench's coverage.
3.1 Dataset overview
CY-Bench covers two main crops, namely maize and wheat. Depending on the country, the crop names can refer to different varieties or seasons of maize and wheat as detailed in our Zenodo repository (https://doi.org/10.5281/zenodo.20456375; Kallenberg et al., 2026).
3.2 Task
CY-Bench is designed to train and evaluate models for in-season crop yield forecasting of wheat and maize at the sub-national level, covering major and underrepresented crop-growing countries worldwide. Forecasts can be made at multiple time points from start of season (sos) to end of season (eos), based on a lead time relative to eos, e.g., middle-of-season (), quarter-of-season () and n-days before harvest. The exact inference time depends on the crop calendar for the selected crop and region. The quarter-of-season mark often coincides with crops reaching physiological maturity, while the middle-of-season typically represents the transition from vegetative to reproductive growth stages (Lee et al., 2022; Basso and Liu, 2019). The reproductive period, which includes flowering and grain filling, is generally the most climate-sensitive phase of the growing season (Hatfield and Prueger, 2015). By contrast, the vegetative phase before mid-season and the senescence phase after grain filling tend to be less sensitive to climate anomalies, although rainfall during the harvest period can significantly impact yield. While quarter-of-season forecasts may achieve higher accuracy, middle-of-season forecasts balance accuracy with actionable insights, allowing for management adjustments during the remainder of the growing season – something late forecasts cannot provide.
Formal definition
The input data consists of time series inputs (weather, soil moisture, and vegetation indices) and static inputs (soil properties). Let xt represent the vector of time series inputs at time t, where t spans from sos up to the inference point T. Time series data up to the inference point is represented as and static inputs as z. Each training or testing sample i corresponds to a specific region-season pair (r,s). For each training sample , the input consists of and z(i). The target is the end-of-season yield Y(i) for the corresponding region r and season s. The objective is to learn a mapping function f such that , where θ represents the model parameters, and ϵ(i) is the error term.
During testing, the model gets from the start of the season (sos) up to the inference point T and static inputs z(j) for a new sample . The model then forecasts the end-of-season yield , where are the model parameters learned during training. Model performance is evaluated by comparing yield forecasts with reported yields Y(j).
Some details that are ignored in the above formulation:
-
t can actually start earlier than
sos, based on spin-up time (e.g., 60 or 90 d beforesos). -
The temporal resolution can be different for time series inputs, i.e. the +1 in 𝚜𝚘𝚜+1 represents different time units.
3.3 Training, validation and test splits
We closely mimic real-world operational settings in the predictor data used, data pre-processing steps and evaluation setup. Specifically, we adopt Leave-One-Year-Out validation (LOYO), which is more appropriate for this type of agricultural problem compared to the random sampling methods commonly used in prior studies (Richetti et al., 2023), including SustainBench (Yeh et al., 2021). Yields from neighboring regions in the same year are typically correlated, so random sampling can cause data leakage: information from the same year appears in both training and testing sets. This violates the independent and identically distributed (IID) assumption and produces overly optimistic performance estimates. LOYO avoids this by holding out an entire year, ensuring that correlations within that year are only encountered during evaluation. It also guarantees that extreme yield years are fully represented, rather than being diluted across random splits.
Our library computes the following evaluation metrics: normalized root mean squared error (NRMSE; i.e., the root mean squared error normalized by the average yield of the test set), mean absolute percentage error (MAPE), and R-squared (R2). These metrics are computed by averaging over all cross-validation test folds (which covers the complete dataset for LOYO) and all admin regions with a country.
4.1 Impact
In addition to the relevance for climate change, food security and the United Nations' sustainable development goals, CY-Bench dataset is relevant to the earth systems science and machine learning research communities due to its comprehensive geographic coverage, capturing diverse agricultural practices and conditions. The inclusion of (indicators derived from) satellite imagery, weather data, and soil properties provides a rich, heterogeneous dataset that presents numerous opportunities for the development of innovative machine learning methods. An inherent challenge of agricultural data, and crop-yield forecasting specifically, is the high level of domain knowledge required in collecting and processing the various data types and defining the task. This analysis-ready dataset is accessible to modelers who do not necessarily have expertise in yield forecasting, lowering the barrier to entry for advanced yield forecasting research and fostering broader participation and innovation in the field.
To illustrate the potential of CY-Bench for crop yield prediction, we provide initial benchmarking results using several machine learning models in the accompanying code repository. These results offer a preliminary sense of model performance across regions and model choices and show that the predictive value of features in CY-Bench varies. This highlights the complexity of yield prediction across diverse landscapes and underscores the importance of CY-Bench as a standardized benchmark to study these differences systematically for data-rich and -sparse regions. While these results are only illustrative, a full comparison of methods, including systematic benchmarking and analysis of findings relative to existing datasets will be addressed in a dedicated follow-up study. We emphasize that the purpose of CY-Bench is to support comparative evaluation of modeling approaches under realistic and widely available data constraints, rather than to define an upper bound on achievable yield prediction accuracy.
Beyond academic research, this dataset can significantly impact policy-making, agricultural planning, and disaster response by enabling the robust evaluation and development of operational models. Researchers, policymakers, farmers, and agribusinesses can benefit from the insights derived from this dataset, leading to better-informed decisions and improved agricultural outcomes.
4.2 Limitations
We also would like to point out several limitations of CY-Bench that can also be areas for improvement in future iterations.
- 1.
Some limitations stem from the data sources available in the public domain.
- –
The predictors do not capture certain factors that influence end-of-season yields, such as pests, diseases, and farm management choices. Similarly, CY-Bench excludes socioeconomic factors such as market prices, labor availability, and policy changes. Some of these omitted factors, like crop varieties and management practices, might exhibit spatial or temporal correlations. Consequently, these factors could be partially captured by incorporating spatial or temporal embeddings within a model. Other factors, such as pests, are less likely to be adequately captured in this way. Including these variables could provide a more holistic understanding of yield fluctuations and help develop more robust models. Nevertheless, the availability of such data on a global scale is typically difficult or often not feasible.
- –
The crop masks and crop calendars included in CY-Bench are static, i.e. they do not reflect yearly changes. While dynamic, up-to-date masks could improve data quality, the availability of consistent, high-quality, global-scale dynamic masks remains limited – a challenge shared by many yield prediction and benchmarking efforts (Kebede et al., 2025; Yeh et al., 2021). Regional, high-resolution products exist (e.g., the USDA Cropland Data Layer; Boryan et al., 2011), but their inclusion would break the harmonization across countries central to CY-Bench. We considered incorporating dynamic global products, such as the recently released MIRCA-OS dataset (Kebede et al., 2025). However, we prioritized spatial precision over temporal dynamics: MIRCA-OS has a significantly coarser resolution (0.0833°, ∼ 10 km) compared to our current mask (0.0045°, ∼ 0.5 km), which introduces systematic mixed-pixel bias at sub-national scales. To validate this design choice, we conducted a sensitivity analysis comparing signal variability driven by mask changes versus natural interannual vegetation dynamics (see Appendix A). We found that the variability introduced by mask changes is minor (median relative variability ≈ 2 %) compared to the interannual signal variability. For the purpose of regional yield forecasting, the stochastic noise from a static mask was deemed preferable to the systematic bias of coarser dynamic masks. Future iterations of CY-Bench will evaluate high-resolution dynamic masks as they become globally available.
- –
The crop calendar information included in CY-Bench is limited to start-of-season and end-of-season dates. More detailed phenological stages, such as emergence and flowering date, are not currently represented. Incorporating these intermediate stages could improve expertise-based feature design and generate more predictive inputs for yield forecasting models.
- –
Government-reported yield statistics can vary in quality across countries due to differences in data collection, aggregation, and reporting accuracy. For a large fraction of the data, we rely on reprocessed and curated statistics from the relevant national agencies. For quality control of these data, we refer to the relevant studies and papers that detail the validation methods applied. Where available, the data card for each country provides a link to these references. In addition, we apply basic quality checks, such as filtering out zero or missing yields and verifying internal consistency (). Nevertheless, there is currently no universally accepted protocol for quality control or uncertainty assessment of yield data (Davis et al., 2025). As such, CY-Bench does not include formal uncertainty estimates for each observation, though future iterations could incorporate quality indicators based on the source, cropping area, or other metadata.
- –
Crop yield forecasting models could benefit from incorporating weather forecasts (Cunha et al., 2018). In our task definition, models cannot access data after the lead time and, therefore, cannot capture conditions that might affect the end-of-season yields after that point. In the real-life setting, forecasters would have access to weather forecasts that may provide useful information. We did not include weather forecasts in CY-Bench because the evidence supporting their usefulness is variable (Darbyshire et al., 2020) and there are multiple considerations that need to be discussed before including weather forecasts: (a) Observed weather data and forecast data may originate from difference sources. (b) Some variables, e.g.,
fPARandNDVI, have no forecasts. Strategies for addressing these gaps are necessary. (c) Weather forecasts from General Circulation Models (GCMs) typically have coarse spatial resolutions (50–400 km grid sizes) and often contain systematic errors or biases that must be adjusted. Bias correction and downscaling techniques must be applied using observed historical records of weather variables, such as precipitation and temperature, to adjust the climate data and better represent local conditions. (d) Using weather forecasts for yield prediction would also cause error/uncertainty propagation from the weather forecast models leading to an increase in overall uncertainty.
- –
- 2.
CY-Bench does not differentiate between irrigated and non-irrigated systems. These systems can exhibit different responses to predictors due to varying water availability, leading to potential inaccuracies in yield forecasts. Our choice was driven by the fact that crop statistics in most countries are rarely reported separately for irrigated and non-irrigated areas.
- 3.
CY-Bench does not provide process-based crop model outputs, which could serve as valuable input features for machine learning models. Additionally, the current feature aggregation uses fixed time steps rather than adapting to crop growth stages. Access to crop model outputs, which contain information on key phenological state changes, could enable the development of more effective, stage-specific features.
- 4.
CY-Bench does not provide raw surface reflectance but includes vegetation indices (i.e.
NDVI– the most frequently-used index for crop yield forecasting; Schauberger et al., 2020, andfPAR), that are strongly correlated with yields (Johnson, 2016). The utility of high-resolution (10–60 m) satellite images (considering spatial information without aggregating to administrative units as performed in CY-Bench) for crop yield forecasting at the sub-national level will result in a massive data size. In addition, the temporal availability of such data is not very long (e.g., Sentinel available since 2014/2015). Meanwhile, moderate-resolution satellite images have been used to forecast crop yields in the United States (e.g., You et al., 2017), demonstrating an advantage over time series data. Future work could investigate the value of satellite images for sub-national crop yield forecasting at a global level. - 5.
Finally, the LOYO method of evaluation is used due to small data sizes in many countries. This approach assumes that all years are independent, which may be too strong of an assumption if consecutive years have correlated environmental and climatic conditions. Also, management strategies might affect multiple seasons; for example, there is evidence of the impact of crop rotation from a previous season on yields (Lawes et al., 2022). While LOYO is a practical compromise for smaller datasets (allowing maximum use of available training data while ensuring each year is evaluated), regions with larger datasets could benefit from forward sliding (rolling-window) validation, which better mimics operational forecasting.
4.3 Advancing earth system modeling
We noted a distinct lack of benchmark datasets for agricultural yield forecasting. Still, many recent developments in the related field of crop type mapping using satellite data (Rußwurm et al., 2019; Tseng et al., 2021b; Yeh et al., 2021; Kondmann et al., 2021) are leading to exciting progress in the development of methods for extracting meaningful patterns from time series of earth observation data (Rußwurm and Körner, 2018; Rußwurm et al., 2019; Pelletier et al., 2019; Sainte Fare Garnot et al., 2020). Similarly, some studies have shown improved model performance for land cover classification, crop mapping and agricultural yield forecasting using meta-learning and multitask learning (Tseng et al., 2022, 2021a; Kerner et al., 2020). CY-Bench includes time series of crop productivity or vegetation health indicators from earth observation as predictors, and can therefore be combined with existing crop mapping benchmark datasets to explore such approaches.
Apart from the downstream task of pre-harvest yield forecasting, CY-Bench enables explorations in transfer learning, domain adaptation, and representation learning to assess whether models can generalize well across diverse geographic and climatic conditions. We envision at least four directions for future research. First, transfer learning methods can be explored to improve model generalization ability when training on data-rich regions and deploying to data-sparse regions (Koukos et al., 2024; Coulibaly et al., 2019; Nowakowski et al., 2021). Second, self-supervised learning could be used to harness the vast amounts of unlabeled agricultural data available (Wang et al., 2022; Xu et al., 2024). By training models to recognize patterns and structures within this data, we can build robust representations that capture essential features of agricultural systems. These representations can then be fine-tuned using the labeled datasets in CY-Bench specific to each country or crop. For instance, a self-supervised model trained on satellite images and environmental data can later be fine-tuned to predict specific crop yields in various regions, making it a powerful tool for global agricultural analysis. Third, another important area is to explore the stability of model predictions against natural and human interventions. This involves understanding how factors like extreme weather events, policy changes, or management practices impact yield forecasts. Causal invariance learning focuses on identifying and utilizing stable variables across different environments to ensure robustness and generalization (Mitrovic et al., 2020; Neophytides et al., 2024). For example, soil quality and basic climatic factors like temperature and precipitation may have stable relationships with crop yields. By recognizing variables that consistently impact crop yields regardless of geographic or climatic differences, it may be possible to build models that are resilient to distributional shifts and perform reliably across diverse conditions.
The complete code base encompassing data pre-processing, tools for model construction, training, evaluation, and data/metric visualization routines is available through our publicly accessible Zenodo repository: https://doi.org/10.5281/zenodo.20456375 (Kallenberg et al., 2026). A summarizing overview can be found on https://cybench.agml.org/ (last access: 30 May 2026). We additionally provide a Python package cybench that can be installed via the repository to load the dataset and run CY-Bench. The dataset is available in Zenodo at https://doi.org/10.5281/zenodo.11502142 (Kallenberg et al., 2025) and is comprehensively documented using the framework of Data Cards. Each individual dataset subset is accompanied by a dedicated Data Card located within the data_preparation (https://doi.org/10.5281/zenodo.20456375) directory of our repository (Kallenberg et al., 2026). The CY-Bench dataset and the python library are licensed under EUPL-1.2 (https://joinup.ec.europa.eu/collection/eupl/eupl-text-eupl-12, last access: 30 May 2026), which is compatible with all of the licenses for the datasets included.
Innovative, data-driven approaches are crucial for enhancing the resilience of food systems to climate change and extreme events, which is essential for achieving the United Nations' Sustainable Development Goal 2 of Zero Hunger (Schneider et al., 2023b). By providing a well-curated dataset designed for the consistent development and evaluation of large-scale crop yield predictions, CY-Bench is a step forward in improving the accuracy of yield forecasting. Curated by an interdisciplinary group of experts in agronomy, food security, climate science and agriculture, this dataset can facilitate increased collaboration between fields and ultimately help to produce reliable crop yield forecasts to support the decisions of farmers, policymakers and commodity traders worldwide. In summary, with CY-Bench we aim to contribute to advancing earth system sciences by providing a critical resource for modeling the effects of climate change, extreme events, and environmental variability on crop yields, while also supporting machine learning research in time series forecasting, transfer learning, and domain adaptation techniques.
A primary challenge in global-scale benchmarking is the trade-off between spatial resolution and temporal consistency in crop masks. CY-Bench utilizes a static, high-resolution (∼ 0.5 km) crop mask. To assess the potential error introduced by neglecting year-to-year changes in cropped area (e.g., due to rotation or fallowing), we performed a sensitivity analysis using the dynamic, but coarser (∼ 10 km), MIRCA-OS dataset (Kebede et al., 2025).
We isolated the “mask effect” by calculating the regional aggregate of a vegetation indicator (fPAR) in two ways for over 12 000 administrative regions:
-
Signal Variance: The crop mask is held constant, while the vegetation signal varies according to its observed interannual dynamics.
-
Mask Variance: The vegetation signal is held constant at its climatological mean, isolating the variability driven solely by annual changes in the crop mask (using MIRCA-OS 2000–2015).
The analysis revealed that the variability driven by mask changes is significantly lower than the natural interannual variability of the crop signal. Specifically, the median relative variability (defined as the ratio of mask-induced standard deviation to signal-induced standard deviation) was approximately 2 % across all regions.
These results confirm that at the sub-national aggregation level used in CY-Bench, the error introduced by using a static mask is negligible relative to the signal of interest. Furthermore, the use of a static mask avoids the mixed-pixel bias inherent in coarser dynamic products.
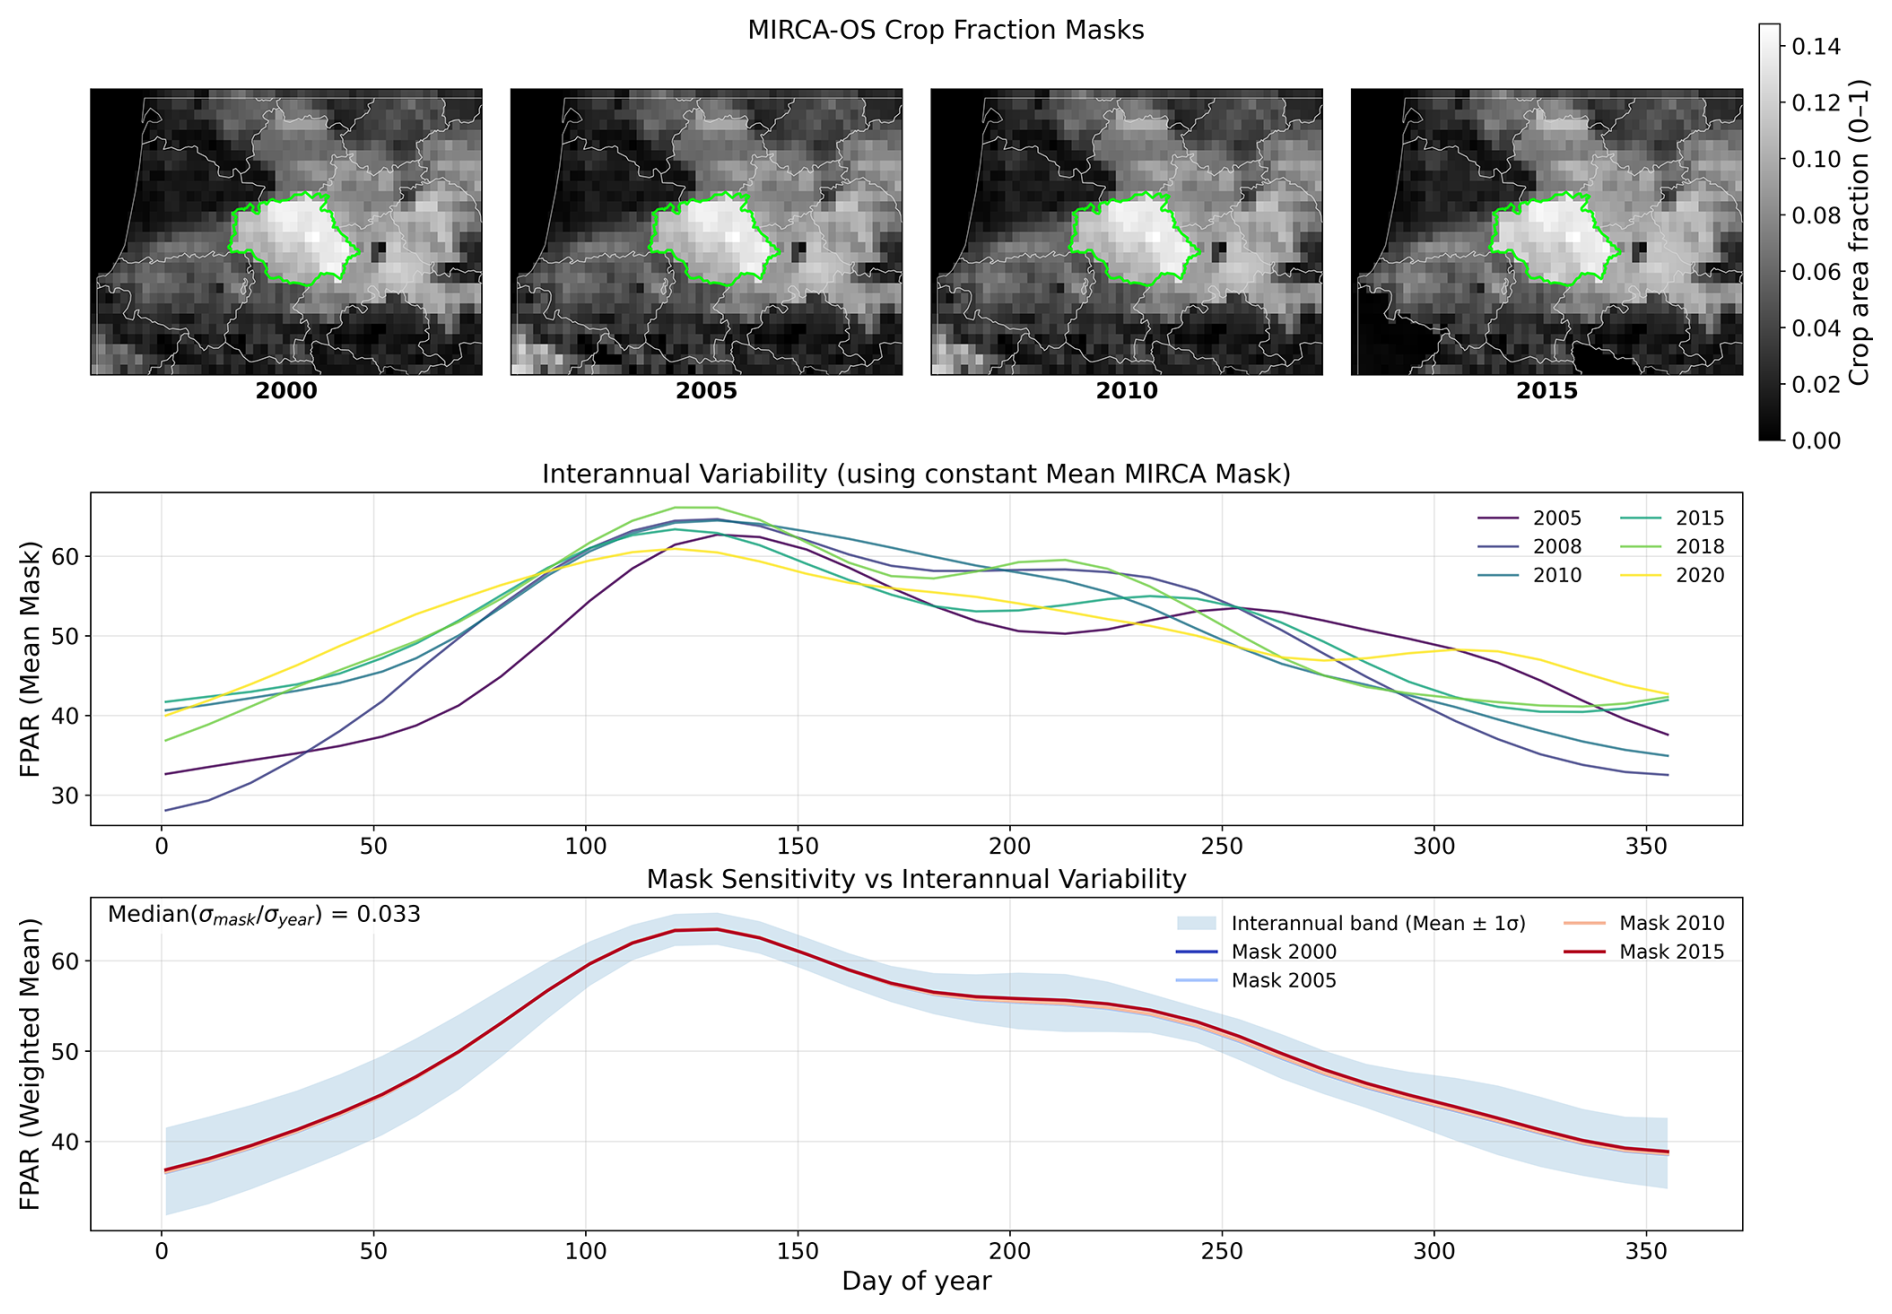
Figure A1Comparison of variability driven by natural interannual signal fluctuations versus crop mask evolution. The colored lines represent the indicator trajectories if only the crop mask changed (using MIRCA-OS dynamic masks), while the blue envelope represents the interannual variability of the signal with a static mask. The vertical spread of the mask effect is minor compared to the natural interannual variation of the signal, showing that the error introduced by using a static mask is negligible relative to the signal of interest.
MK: Project administration, Software, Validation, Writing – original draft preparation, Writing – review & editing.
DP: Conceptualization, Methodology, Project administration, Investigation, Software, Writing – original draft preparation, Writing – review & editing.
SOA: Data curation, Software, Validation, Writing – original draft preparation, Writing – review & editing.
HB: Investigation, Software, Visualization, Writing – review & editing.
RVB: Software, Validation, Writing – review & editing.
AP: Software, Validation, Writing – review & editing.
PP: Data curation, Validation, Writing – original draft preparation, Writing – review & editing.
AS: Data curation, Validation, Writing – review & editing.
WA: Data curation, Validation, Writing – original draft preparation, Writing – review & editing.
MVB: Validation, Writing – original draft preparation, Writing – review & editing.
AC: Validation, Writing – review & editing.
OE: Data curation, Validation, Writing – original draft preparation, Writing – review & editing.
RH: Data curation, Project administration, Validation, Writing – review & editing.
RL: Data curation, Validation, Writing – review & editing.
DL: Data curation, Validation, Writing – review & editing.
IL: Data curation.
DM: Software, Validation.
MM: Data curation, Validation, Writing – original draft preparation, Writing – review & editing.
JMM: Data curation, Writing – review & editing.
SM: Data curation, Validation, Writing – original draft preparation, Writing – review & editing.
JR: Data curation, Writing – original draft preparation, Writing – review & editing.
ACR: Validation, Writing – original draft preparation, Writing – review & editing.
RS: Data curation, Validation, Writing – original draft preparation, Writing – review & editing.
GS: Data curation, Validation, Writing – review & editing.
VS: Validation, Writing – original draft preparation, Writing – review & editing.
RDSNJ: Data curation, Validation, Writing – review & editing.
AKS: Data curation, Validation, Writing – original draft preparation, Writing – review & editing.
RS: Writing – original draft preparation, Manuscript writing and review.
LS: Validation, Writing – original draft preparation, Writing – review & editing.
PV: Data curation, Validation, Writing – review & editing.
ADW: Data curation, Validation, Writing – review & editing.
MZ: Data curation, Validation, Writing – review & editing.
INA: Funding acquisition, Supervision, Validation, Writing – review & editing.
The contact author has declared that none of the authors has any competing interests.
Publisher's note: Copernicus Publications remains neutral with regard to jurisdictional claims made in the text, published maps, institutional affiliations, or any other geographical representation in this paper. The authors bear the ultimate responsibility for providing appropriate place names. Views expressed in the text are those of the authors and do not necessarily reflect the views of the publisher.
CY-Bench benefited from many helpful discussions with the participants of AgML (https://www.agml.org, last access: 30 May 2026), the Machine Learning team of the Agricultural Model Intercomparison and Improvement Project (AgMIP, http://www.agmip.org, last access: 30 May 2026).
We would also like to acknowledge the contributions of Marc Russwurm, Afef Marzougui, Hendrik Boogaard, Marijn van der Velde, Steven Hoek, Filip Szabo, Francesco Collivignarelli, Xiaomao Lin, Toshi Iizumi, Peng Fu, Prakriti Bista, Paresh Shirsath, Soora Naresh Kumar, Sibiri Traore and Javier Garcia Navarro in the design and implementation of the benchmark and preparation of the manuscript.
This work was partially supported by the WUR Research Investment Theme on Data-Driven Discoveries in a Changing Climate, and the Digital Europe Programme under Grant agreement AgrifoodTEF – Test and Experiment Facilities for the Agri-Food Domain (ID 101100622).
This paper was edited by Yun Yang and reviewed by two anonymous referees.
Ambikapathi, R., Schneider, K. R., Davis, B., Herrero, M., Winters, P., and Fanzo, J. C.: Global food systems transitions have enabled affordable diets but had less favourable outcomes for nutrition, environmental health, inclusion and equity, Nature Food, 3, 764–779, https://doi.org/10.1038/s43016-022-00588-7, 2022. a
Argentina: Ministerio de Agrícultura, Ganaderia y Pesca. “Estimaciones Agrícolas”, https://datosestimaciones.magyp.gob.ar/reportes.php?reporte=Estimaciones (last access: 29 April 2016), 2016. a
Australia: ABARES. Australian Bureau of Agricultural and Resource Economics and Sciences Farm Data Portal, https://www.agriculture.gov.au/abares/data/farm-data-portal#data-download (last access: 5 March 2024), 2024. a
Basso, B. and Liu, L.: Seasonal crop yield forecast: Methods, applications, and accuracies, Adv. Agron., 154, 201–255, https://doi.org/10.1016/bs.agron.2018.11.002, 2019. a, b
Batjes, N. H.: Harmonized soil property values for broad-scale modelling (WISE30sec) with estimates of global soil carbon stocks, Geoderma, 269, 61–68, https://doi.org/10.1016/j.geoderma.2016.01.034, 2016. a, b
Becker-Reshef, I., Justice, C., Barker, B., Humber, M., Rembold, F., Bonifacio, R., Zappacosta, M., Budde, M., Magadzire, T., Shitote, C., Pound, J., Constantino, A., Nakalembe, C., Mwangi, K., Sobue, S., Newby, T., Whitcraft, A., Jarvis, I., and Verdin, J.: Strengthening agricultural decisions in countries at risk of food insecurity: The GEOGLAM Crop Monitor for Early Warning, Remote Sens. Environ., 237, 111553, https://doi.org/10.1016/j.rse.2019.111553, 2020. a
Becker-Reshef, I., Barker, B., Whitcraft, A., Oliva, P., Mobley, K., Justice, C., and Sahajpal, R.: Crop type maps for operational global agricultural monitoring, Sci. Data, 10, 172, https://doi.org/10.1038/s41597-023-02047-9, 2023. a
Benos, L., Tagarakis, A. C., Dolias, G., Berruto, R., Kateris, D., and Bochtis, D.: Machine learning in agriculture: A comprehensive updated review, Sensors, 21, 3758, https://doi.org/10.3390/s21113758, 2021. a
Boogaard, H., Schubert, J., De Wit, A., Lazebnik, J., Hutjes, R., and Van der Grijn, G.: Agrometeorological indicators from 1979 to present derived from reanalysis, Climate Data Store – Copernicus Climate Change Service, https://doi.org/10.24381/cds.6c68c9bb, 2022. a, b
Boryan, C., Yang, Z., Mueller, R., and Craig, M.: Monitoring US agriculture: the US department of agriculture, national agricultural statistics service, cropland data layer program, Geocarto Int., 26, 341–358, 2011. a
Brazil: IBGE SIDRA. “Tabela 1612: Área plantada, área colhida, quantidade produzida, rendimento médio e valor da produção das lavouras temporárias”, https://sidra.ibge.gov.br/tabela/1612 (last access: 6 February 2024), 2022. a
Burnell, R., Schellaert, W., Burden, J., Ullman, T. D., Martinez-Plumed, F., Tenenbaum, J. B., Rutar, D., Cheke, L. G., Sohl-Dickstein, J., Mitchell, M., Kiela, D., Shanahan, M., Voorhees, E. M., Cohn, A. G., Leibo, J. Z., and Hernandez-Orallo, J.: Rethink reporting of evaluation results in AI, Science, 380, 136–138, https://doi.org/10.1126/science.adf6369, 2023. a
Chen, B. and Villoria, N. B.: Foreign yield shocks and domestic price variability: the case of maize in developing countries, Environ. Res. Lett., 17, 124044, https://doi.org/10.1088/1748-9326/aca7d5, 2022. a
China: National Bureau of Statistics of China, National Data Portal, https://data.stats.gov.cn (last access: 18 February 2024), 2024. a
Chlingaryan, A., Sukkarieh, S., and Whelan, B.: Machine learning approaches for crop yield prediction and nitrogen status estimation in precision agriculture: A review, Comput. Electron. Agr., 151, 61–69, https://doi.org/10.1016/j.compag.2018.05.012, 2018. a
Coulibaly, S., Kamsu-Foguem, B., Kamissoko, D., and Traore, D.: Deep neural networks with transfer learning in millet crop images, Comput. Ind., 108, 115–120, 2019. a
Cunha, R. L., Silva, B., and Netto, M. A.: A scalable machine learning system for pre-season agriculture yield forecast, in: 2018 IEEE 14th international conference on e-science (e-Science), IEEE, 423–430, https://doi.org/10.1109/eScience.2018.00131, 2018. a
Darbyshire, R., Crean, J., Cashen, M., Anwar, M. R., Broadfoot, K. M., Simpson, M., Cobon, D. H., Pudmenzky, C., Kouadio, L., and Kodur, S.: Insights into the value of seasonal climate forecasts to agriculture, Aust. J. Agr. Resour. Ec., 64, 1034–1058, https://doi.org/10.1111/1467-8489.12389, 2020. a
Davis, K. F., Anderson, W., Ehrmann, S., Flach, R., Meyer, C., Proctor, J., Ray, D. K., You, L., Foley, M., Kerdiles, H., Hultgren, A., Huybers, P., Kebede, E., Meroni, M., Park, C., and Lee, D.: HarvestStat: A global effort towards open and standardized sub-national agricultural data, Environ. Res. Lett., 20, 052001, https://doi.org/10.1088/1748-9326/adcb54, 2025. a, b
Duden, C., Nacke, C., and Offermann, F.: German yield and area data for 11 crops from 1979 to 2021 at a harmonized spatial resolution of 397 districts, Sci. Data, 11, https://doi.org/10.1038/s41597-024-02951-8, 2024. a, b
Dueben, P. D., Schultz, M. G., Chantry, M., Gagne, D. J., Hall, D. M., and McGovern, A.: Challenges and Benchmark Datasets for Machine Learning in the Atmospheric Sciences: Definition, Status, and Outlook, Artificial Intelligence for the Earth Systems, 1, https://doi.org/10.1175/AIES-D-21-0002.1, 2022. a
EC-JRC: Elaboration of Van Tricht et al, 2023, 2024. a, b
Ennaji, O., Vergutz, L., and El Allali, A.: Machine learning in nutrient management: A review, Artificial Intelligence in Agriculture, 9, 1–11, https://doi.org/10.1016/j.aiia.2023.06.001, 2023. a
Ennaji, O., Baha, S., Vergutz, L., and El Allali, A.: Gradient boosting for yield prediction of elite maize hybrid ZhengDan 958, PloS One, 19, e0315493, https://doi.org/10.1371/journal.pone.0315493, 2024. a
Fan, J., Bai, J., Li, Z., Ortiz-Bobea, A., and Gomes, C.: A GNN-RNN Approach for Harnessing Geospatial and Temporal Information: Application to Crop Yield Prediction, Proceedings of the AAAI Conference on Artificial Intelligence, 36, 11873–11881, https://doi.org/10.1609/aaai.v36i11.21444, 2022. a
Fanzo, J.: Kicking around in the wreck, PLOS Climate, 3, e0000401, https://doi.org/10.1371/journal.pclm.0000401, 2024. a
FAO: Crop Calendar Food and Agriculture Organization of the United Nations, https://cropcalendar.apps.fao.org (last access: 11 February 2025), 2025. a
Fernandez-Beltran, R., Baidar, T., Kang, J., and Pla, F.: Rice-Yield Prediction with Multi-Temporal Sentinel-2 Data and 3D CNN: A Case Study in Nepal, Remote Sensing, 13, 1391, https://doi.org/10.3390/rs13071391, 2021. a
Franch, B., Cintas, J., Becker-Reshef, I., Sanchez-Torres, M. J., Roger, J., Skakun, S., Sobrino, J. A., Van Tricht, K., Degerickx, J., Gilliams, S., Koetz, B., Szantoi, Z., and Whitcraft, A.: Global crop calendars of maize and wheat in the framework of the WorldCereal project, GISci. Remote Sens., 59, 885–913, https://doi.org/10.1080/15481603.2022.2079273, 2022. a, b
Frieler, K., Schauberger, B., Arneth, A., Balkovič, J., Chryssanthacopoulos, J., Deryng, D., Elliott, J., Folberth, C., Khabarov, N., Müller, C., Olin, S., Pugh, T.A.M., Schaphoff, S., Schewe, J., Schmid, E., Warszawski, L., andLevermann, A.: Understanding the weather signal in national crop-yield variability, Earth's Future, 5, 605–616, https://doi.org/10.1002/2016EF000525, 2017. a
Gavasso-Rita, Y. L., Papalexiou, S. M., Li, Y., Elshorbagy, A., Li, Z., and Schuster-Wallace, C.: Crop models and their use in assessing crop production and food security: A review, Food and Energy Security, 13, e503, https://doi.org/10.1002/fes3.503, 2023. a
Good, D. L. and Irwin, S. H.: Understanding USDA corn and soybean production forecasts: An overview of methods, performance and market impacts, https://doi.org/10.22004/ag.econ.37496, 2003. a
Hatfield, J. L. and Prueger, J. H.: Temperature extremes: Effect on plant growth and development, Weather and Climate Extremes, 10, 4–10, 2015. a
He, D., Wang, E., Wang, J., and Robertson, M.: Data requirement for effective calibration of process-based crop models, Agr. Forest Meteorol., 234–235, 136–148, https://doi.org/10.1016/j.agrformet.2016.12.015, 2017. a
Hengl, T., Mendes de Jesus, J., Heuvelink, G. B., Ruiperez Gonzalez, M., Kilibarda, M., Blagotić, A., Shangguan, W., Wright, M. N., Geng, X., Bauer-Marschallinger, B., Guevara, M. A., Vargas, R., MacMillan, R. A., Batjes, N. H., Leenaars, J. G. B., Ribeiro, E., Wheeler, I., Mantel, S., and Kempen, B.: SoilGrids250m: Global gridded soil information based on machine learning, PLoS One, 12, e0169748, https://doi.org/10.1371/journal.pone.0169748, 2017. a
Hoffmann, H., Zhao, G., Asseng, S., Bindi, M., Biernath, C., Constantin, J., Coucheney, E., Dechow, R., Doro, L., Eckersten, H., Gaiser, T., Grosz, B., Heinlein, F., Kassie, B. T., Kersebaum, K.-C., Klein, C., Kuhnert, M., Lewan, E., Moriondo, M., Nendel, C., Priesack, E., Raynal, H., Roggero, P. P., Rötter, R. P., Siebert, S., Specka, X., Tao, F., Teixeira, E., Trombi, G., Wallach, D., Weihermüller, L., Yeluripati, J., and Ewert, F.: Impact of spatial soil and climate input data aggregation on regional yield simulations, PloS One, 11, e0151782, https://doi.org/10.1371/journal.pone.0151782, 2016. a
Höhl, A., Ofori-Ampofo, S., Obadic, I., Fernández-Torres, M.-Á., Salih Kuzu, R., and Zhu, X.: USCC: A Benchmark Dataset for Crop Yield Prediction under Climate Extremes, EGU General Assembly 2023, Vienna, Austria, 23–28 Apr 2023, EGU23-15540, https://doi.org/10.5194/egusphere-egu23-15540, 2023. a
Huete, A., Didan, K., Miura, T., Rodriguez, E. P., Gao, X., and Ferreira, L. G.: Overview of the radiometric and biophysical performance of the MODIS vegetation indices, Remote Sens. Environ., 83, 195–213, 2002. a
ICRISAT Mali: Compagnie Malienne pour le Developpement des Textiles (CMDT) Monitoring Operational Maize Yield Statistics, http://data.icrisat.org/dataverse/ (last access: 30 May 2026), 2018. a
India: ICRISAT. District Level Database, http://data.icrisat.org/dld/src/crops.html (last access: 9 February 2024), 2024. a
Johnson, D. M.: A comprehensive assessment of the correlations between field crop yields and commonly used MODIS products, Int. J. Appl. Earth Obs., 52, 65–81, https://doi.org/10.1016/j.jag.2016.05.010, 2016. a
Kallenberg, M., Paudel, D., Ofori-Ampofo, S., Baja, H., van Bree, R., Potze, A., Poudel, P., Saleh, A., Anderson, W., von Bloh, M., Castellano, A., Ennaji, O., Hamed, R., Laudien, R., Lee, D., Luna, I., Masiliūnas, D., Meroni, M., Mutuku, J. M., Mkuhlani, S., Richetti, J., Ruane, A. C., Sahajpal, R., Shuai, G., Sitokonstantinou, V., de Souza Noia Junior, R., Srivastava, A. K., Strong, R., Sweet, L.-b., Vojnović, P., de Wit, A., Zachow, M., and Athanasiadis, I. N.: CY-Bench: A comprehensive benchmark dataset for subnational crop yield forecasting, Zenodo [data set], https://doi.org/10.5281/zenodo.11502142, 2025. a, b
Kallenberg, M., Paudel, D., Ofori-Ampofo, S., Baja, H., van Bree, R., Potze, A., Poudel, P., Saleh, A., Anderson, W., von Bloh, M., Castellano, A., Ennaji, O., Hamed, R., Laudien, R., Lee, D., Luna, I., Masiliunas, D., Meroni, M., Mutuku, J. M., Mkuhlani, S., Richetti, J., Ruane, A. C., Sahajpal, R., Shuai, G., Sitokonstantinou, V., de Souza Noia Junior, R., Srivastava, A. K., Strong, R., Sweet, L.-b., Vojnovic, P., de Wit, A., Zachow, M., and Athanasiadis, I. N. : WUR-AI/AgMLCY-Bench: CY-Bench v1.0.0: ESSD paper, Zenodo [code], https://doi.org/10.5281/zenodo.20456375, 2026 a, b, c, d, e, f, g, h, i, j
Kamilaris, A. and Prenafeta-Boldú, F. X.: Deep learning in agriculture: A survey, Comput. Electron. Agr., 147, 70–90, https://doi.org/10.1016/j.compag.2018.02.016, 2018. a
Kapoor, S. and Narayanan, A.: Leakage and the reproducibility crisis in machine-learning-based science, Patterns, 4, 100804, https://doi.org/10.1016/j.patter.2023.100804, 2023. a
Kebede, E. A., Oluoch, K. O., Siebert, S., Mehta, P., Hartman, S., Jägermeyr, J., Ray, D., Ali, T., Brauman, K. A., Deng, Q., Xie, W., and Davis, K. F.: A global open-source dataset of monthly irrigated and rainfed cropped areas (MIRCA-OS) for the 21st century, Sci. Data, 12, 208, https://doi.org/10.1038/s41597-024-04313-w, 2025. a, b, c
Kerner, H., Tseng, G., Becker-Reshef, I., Nakalembe, C., Barker, B., Munshell, B., Paliyam, M., and Hosseini, M.: Rapid Response Crop Maps in Data Sparse Regions, in: ACM SIGKDD Conference on Data Mining and Knowledge Discovery Workshops, arXiv, https://doi.org/10.48550/arXiv.2006.16866, 2020. a
Khaki, S., Wang, L., and Archontoulis, S. V.: A CNN-RNN framework for crop yield prediction, Front. Plant Sci., 10, 1750, https://doi.org/10.3389/fpls.2019.01750, 2020. a, b, c
Kondmann, L., Toker, A., Ruß wurm, M., Camero, A., Peressuti, D., Milcinski, G., Mathieu, P.-P., Longepe, N., Davis, T., Marchisio, G., Leal-Taixé, L., and Zhu, X.: DENETHOR: The DynamicEarthNET dataset for Harmonized, inter-Operable, analysis-Ready, daily crop monitoring from space, in: Proceedings of the Neural Information Processing Systems Track on Datasets and Benchmarks, edited by: Vanschoren, J. and Yeung, S., Vol. 1, Curran, https://openreview.net/pdf?id=uUa4jNMLjrL (last access: 30 May 2026), 2021. a
Koukos, A., Jo, H.-W., Sitokonstantinou, V., Tsoumas, I., Kontoes, C., and Lee, W.-K.: Towards Global Crop Maps with Transfer Learning, in: IGARSS 2024–2024 IEEE International Geoscience and Remote Sensing Symposium, 1540–1545, IEEE, https://doi.org/10.1109/IGARSS53475.2024.10641793, 2024. a
Lawes, R., Mata, G., Richetti, J., Fletcher, A., and Herrmann, C.: Using remote sensing, process-based crop models, and machine learning to evaluate crop rotations across 20 million hectares in Western Australia, Agron. Sustain. Dev., 42, 120, https://doi.org/10.1007/s13593-022-00851-y, 2022. a
Lecerf, R., Ceglar, A., López-Lozano, R., Van Der Velde, M., and Baruth, B.: Assessing the information in crop model and meteorological indicators to forecast crop yield over Europe, Agr. Syst., 168, 191–202, https://doi.org/10.1016/j.agsy.2018.03.002, 2019. a
Lee, D., Davenport, F., Shukla, S., Husak, G., Funk, C., Harrison, L., McNally, A., Rowland, J., Budde, M., and Verdin, J.: Maize yield forecasts for Sub-Saharan Africa using Earth Observation data and machine learning, Glob. Food Secur., 33, 100643, https://doi.org/10.1016/j.gfs.2022.100643, 2022. a
Lee, D., Anderson, W., Chen, X., Davenport, F., Shukla, S., Sahajpal, R., Budde, M., Rowland, J., Verdin, J., You, L., Ahouangbenon, M., Davis, K. F., Kebede, E., Ehrmann, S., Justice, C., and Meyer, C.: HarvestStat Africa–harmonized subnational crop statistics for sub-Saharan Africa, Sci. Data, 12, 690, https://doi.org/10.1038/s41597-025-05001-z, 2025. a, b
Lesk, C., Anderson, W., Rigden, A., Coast, O., Jägermeyr, J., McDermid, S., Davis, K. F., and Konar, M.: Compound heat and moisture extreme impacts on global crop yields under climate change, Nat. Rev. Earth Environ., 3, 872–889, https://doi.org/10.1038/s43017-022-00368-8, 2022. a
Liakos, K., Busato, P., Moshou, D., Pearson, S., and Bochtis, D.: Machine learning in agriculture: A review, Sensors, 18, 2674, https://doi.org/10.3390/s18082674, 2018. a
Liliane, T. N. and Charles, M. S.: Factors Affecting Yield of Crops, in: Agronomy, edited by: Amanullah, Chap. 2, IntechOpen, Rijeka, https://doi.org/10.5772/intechopen.90672, 2020. a, b
Lin, F., Guillot, K., Crawford, S., Zhang, Y., Yuan, X., and Tzeng, N.-F.: An Open and Large-Scale Dataset for Multi-Modal Climate Change-aware Crop Yield Predictions, in: Proceedings of the 30th ACM SIGKDD Conference on Knowledge Discovery and Data Mining, 5375–5386, ACM, https://doi.org/10.1145/3637528.3671536, 2024. a
Liu, Q., Yang, M., Mohammadi, K., Song, D., Bi, J., and Wang, G.: Machine Learning Crop Yield Models Based on Meteorological Features and Comparison with a Process-Based Model, Artificial Intelligence for the Earth Systems, 1, https://doi.org/10.1175/AIES-D-22-0002.1, 2022. a
López, J., Way, D. A., and Sadok, W.: Systemic effects of rising atmospheric vapor pressure deficit on plant physiology and productivity, Glob. Change Biol., 27, 1704–1720, 2021. a
Ma, Y., Yang, Z., Huang, Q., and Zhang, Z.: Improving the Transferability of Deep Learning Models for Crop Yield Prediction: A Partial Domain Adaptation Approach, Remote Sens., 15, https://doi.org/10.3390/rs15184562, 2023. a
Mateo-Sanchis, A., Piles, M., Amorós-López, J., Muñoz-Marí, J., Adsuara, J. E., Moreno-Martínez, Á., and Camps-Valls, G.: Learning main drivers of crop progress and failure in Europe with interpretable machine learning, Int. J. Appl. Earth Obs., 104, 102574, https://doi.org/10.1016/j.jag.2021.102574, 2021. a
Mehrabi, Z., Delzeit, R., Ignaciuk, A., Levers, C., Braich, G., Bajaj, K., Amo-Aidoo, A., Anderson, W., Balgah, R. A., Benton, T. G., Chari, M. M., Ellis, E. C., Gahi, N. Z., Gaupp, F., Garibaldi, L. A., Gerber, J. S., Godde, C. M., Grass, I., Heimann, T., Hirons, M., Hoogenboom, G., Jain, M., James, D., Makowski, D., Masamha, B., Meng, S., Monprapussorn, S., Müller, D., Nelson, A., Newlands, N. K., Noack, F., Oronje, M., Raymond, C., Reichstein, M., Rieseberg, L. H., Rodriguez-Llanes, J. M., Rosenstock, T., Rowhani, P., Sarhadi, A., Seppelt, R., Sidhu, B. S., Snapp, S., Soma, T., Sparks, A. H., Teh, L., Tigchelaar, M., Vogel, M. M., West, P. C., Wittman, H., and You, L.: Research priorities for global food security under extreme events, One Earth, 5, 756–766, https://doi.org/10.1016/j.oneear.2022.06.008, 2022. a
Meroni, M., Fasbender, D., Rembold, F., Atzberger, C., and Klisch, A.: Near real-time vegetation anomaly detection with MODIS NDVI: Timeliness vs. accuracy and effect of anomaly computation options, Remote Sens. Environ., 221, 508–521, https://doi.org/10.1016/j.rse.2018.11.041, 2019. a
Meroni, M., Waldner, F., Seguini, L., Kerdiles, H., and Rembold, F.: Yield forecasting with machine learning and small data: What gains for grains?, Agr. Forest Meteorol., 308, 108555, https://doi.org/10.1016/j.agrformet.2021.108555, 2021. a
Mexico: INEGI. Agricultural Census and Survey Data, https://www.inegi.org.mx (last access: 10 April 2024), 2019. a
Meyer, H. and Pebesma, E.: Machine learning-based global maps of ecological variables and the challenge of assessing them, Nat. Commun., 13, 2208, https://doi.org/10.1038/s41467-022-29838-9, 2022. a
Minoli, S., Egli, D. B., Rolinski, S., and Müller, C.: Modelling cropping periods of grain crops at the global scale, Global Planet. Change, 174, 35–46, https://doi.org/10.1016/j.gloplacha.2018.12.013, 2019. a
Miralles, D. G., Bonte, O., Koppa, A., Baez-Villanueva, O. M., Tronquo, E., Zhong, F., Beck, H. E., Hulsman, P., Dorigo, W., Verhoest, N. E., and Haghdoost, S.: GLEAM4: global land evaporation and soil moisture dataset at 0.1 resolution from 1980 to near present, Sci. Data, 12, 416, https://doi.org/10.1038/s41597-025-04610-y, 2025. a
Mitrovic, J., McWilliams, B., Walker, J., Buesing, L., and Blundell, C.: Representation learning via invariant causal mechanisms, arXiv [preprint], https://doi.org/10.48550/arXiv.2010.07922, 2020. a
Nakalembe, C. and Kerner, H.: Considerations for AI-EO for agriculture in Sub-Saharan Africa, Environ. Res. Lett., 18, 041002, https://doi.org/10.1088/1748-9326/acc476, 2023. a
Neophytides, S. P., Tsoumas, I., Tsalakou, A., Christoforou, M., Mavrovouniotis, M., Eliades, M., Papoutsa, C., Kontoes, C., and Hadjimitsis, D. G.: Invariant learning as a pathway to robust potato yield prediction, in: Remote Sensing for Agriculture, Ecosystems, and Hydrology XXVI, SPIE, 13191, 33–42, https://doi.org/10.1117/12.3031554, 2024. a
Nowakowski, A., Mrziglod, J., Spiller, D., Bonifacio, R., Ferrari, I., Mathieu, P. P., Garcia-Herranz, M., and Kim, D.-H.: Crop type mapping by using transfer learning, Int. J. Appl. Earth Obs., 98, 102313, https://doi.org/10.1016/j.jag.2021.102313, 2021. a
Oikonomidis, A., Catal, C., and Kassahun, A.: Deep learning for crop yield prediction: a systematic literature review, New Zeal. J. Crop Hort., 1–26, https://doi.org/10.1080/01140671.2022.2032213, 2022. a
Paudel, D., Boogaard, H., de Wit, A., Janssen, S., Osinga, S., Pylianidis, C., and Athanasiadis, I. N.: Machine learning for large-scale crop yield forecasting, Agr. Syst., 187, 103016, https://doi.org/10.1016/j.agsy.2020.103016, 2021. a, b, c
Paudel, D., Boogaard, H., de Wit, A., van der Velde, M., Claverie, M., Nisini, L., Janssen, S., Osinga, S., and Athanasiadis, I. N.: Machine learning for regional crop yield forecasting in Europe, Field Crop. Res., 276, 108377, https://doi.org/10.1016/j.fcr.2021.108377, 2022. a, b
Paudel, D., Marcos, D., de Wit, A., Boogaard, H., and Athanasiadis, I. N.: A weakly supervised framework for high-resolution crop yield forecasts, Environ. Res. Lett., 18, 094062, https://doi.org/10.1088/1748-9326/acf50e, 2023. a
Paudel, D. R., Marcos, D., de Wit, A., Boogaard, H., and Athanasiadis, I. N.: A weakly supervised framework for high resolution crop yield forecasts, Environ. Res. Lett., 18, 094062, https://doi.org/10.1088/1748-9326/acf50e, 2023b. a, b
Pelletier, C., Webb, G. I., and Petitjean, F.: Temporal Convolutional Neural Network for the Classification of Satellite Image Time Series, Remote Sensing, 11, https://doi.org/10.3390/rs11050523, 2019. a
Poggio, L., de Sousa, L. M., Batjes, N. H., Heuvelink, G. B. M., Kempen, B., Ribeiro, E., and Rossiter, D.: SoilGrids 2.0: producing soil information for the globe with quantified spatial uncertainty, SOIL, 7, 217–240, https://doi.org/10.5194/soil-7-217-2021, 2021. a
Portmann, F. T., Siebert, S., and Döll, P.: MIRCA2000 – Global monthly irrigated and rainfed crop areas around the year 2000: A new high-resolution data set for agricultural and hydrological modeling, Global Biogeochem. Cy., 24, https://doi.org/10.1029/2008GB003435, 2010. a
Potter, N. A.: rnassqs: An “R” package to access agricultural data via the USDA National Agricultural Statistics Service (USDA-NASS) “Quick Stats” API, Journal of Open Source Software, 4, 1880https://doi.org/10.21105/joss.01880, 2019. a
Priyatikanto, R., Lu, Y., Dash, J., and Sheffield, J.: Improving generalisability and transferability of machine-learning-based maize yield prediction model through domain adaptation, Agr. Forest Meteorol., 341, 109652, https://doi.org/10.1016/j.agrformet.2023.109652, 2023. a
Pushkarna, M., Zaldivar, A., and Kjartansson, O.: Data Cards: Purposeful and transparent dataset documentation for responsible AI, in: Proceedings of the 2022 ACM Conference on Fairness, Accountability, and Transparency, 1776–1826, https://doi.org/10.1145/3531146.3533231, 2022. a
Richards, M., Kirichenko, P., Bouchacourt, D., and Ibrahim, M.: Does Progress On Object Recognition Benchmarks Improve Real-World Generalization?, arXiv, https://doi.org/10.48550/arXiv.2307.13136, 2023. a
Richetti, J., Diakogianis, F. I., Bender, A., Colaço, A. F., and Lawes, R. A.: A methods guideline for deep learning for tabular data in agriculture with a case study to forecast cereal yield, Comput. Electron. Agr., 205, 107642, https://doi.org/10.1016/j.compag.2023.107642, 2023. a, b
Rodell, M., Houser, P., Jambor, U., Gottschalck, J., Mitchell, K., Meng, C.-J., Arsenault, K., Cosgrove, B., Radakovich, J., Bosilovich, M., Entin, J. K., Walker, J. P., Lohmann, D., and Toll, D.: The global land data assimilation system, B. Am. Meteorol. Soc., 85, 381–394, https://doi.org/10.1175/BAMS-85-3-381, 2004. a, b
Rolnick, D., Aspuru-Guzik, A., Beery, S., Dilkina, B., Donti, P. L., Ghassemi, M., Kerner, H., Monteleoni, C., Rolf, E., Tambe, M., and White, A.: Application-Driven Innovation in Machine Learning, arXiv, https://doi.org/10.48550/arXiv.2403.17381, 2024. a
Ronchetti, G., Nisini Scacchiafichi, L., Seguini, L., Cerrani, I., and van der Velde, M.: Harmonized European Union subnational crop statistics can reveal climate impacts and crop cultivation shifts, Earth Syst. Sci. Data, 16, 1623–1649, https://doi.org/10.5194/essd-16-1623-2024, 2024. a, b, c
Rußwurm, M., Lefèvre, S., and Körner, M.: BreizhCrops: A Satellite Time Series Dataset for Crop Type Identification, arXiv, https://doi.org/10.48550/arXiv.1905.11893, 2019. a, b
Rußwurm, M. and Körner, M.: Multi-Temporal Land Cover Classification with Sequential Recurrent Encoders, ISPRS Int. J. Geo-Inf., 7, https://doi.org/10.3390/ijgi7040129, 2018. a
Sacks, W. J., Deryng, D., Foley, J. A., and Ramankutty, N.: Crop planting dates: an analysis of global patterns, Global Ecol. Biogeogr., 19, 607–620, 2010. a
Sainte Fare Garnot, V., Landrieu, L., Giordano, S., and Chehata, N.: Satellite Image Time Series Classification with Pixel-Set Encoders and Temporal Self-Attention, CVPR, https://doi.org/10.1109/CVPR42600.2020.01234, 2020. a
Schauberger, B., Jägermeyr, J., and Gornott, C.: A systematic review of local to regional yield forecasting approaches and frequently used data resources, Eur. J. Agron., 120, 126153, https://doi.org/10.1016/j.eja.2020.126153, 2020. a, b
Schlenker, W. and Roberts, M. J.: Nonlinear temperature effects indicate severe damages to U.S. crop yields under climate change, P. Natl. Acad. Sci., 106, 15594–15598, https://doi.org/10.1073/pnas.0906865106, 2009. a
Schneider, K. R., Fanzo, J., Haddad, L., Herrero, M., Moncayo, J. R., Herforth, A., Remans, R., Guarin, A., Resnick, D., Covic, N., Béné, C., Cattaneo, A., Aburto, N., Ambikapathi, R., Aytekin, D., Barquera, S., Battersby, J., Beal, T., Molina, P. B., Cafiero, C., Campeau, C., Caron, P., Conforti, P., Damerau, K., Di Girolamo, M., DeClerck, F., Dewi, D., Elouafi, I., Fabi, C., Foley, P., Frazier, T. J., Gephart, J., Golden, C., Fischer, C. G., Hendriks, S., Honorati, M., Huang, J., Kennedy, G., Laar, A., Lal, R., Lidder, P., Loken, B., Marshall, Q., Masuda, Y. J., McLaren, R., Miachon, L., Muñoz, H., Nordhagen, S., Qayyum, N., Saisana, M., Suhardiman, D., Sumaila, U. R., Cullen, M. T., Tubiello, F. N., Vivero-Pol, J.-L., Webb, P., and Wiebe, K.: The state of food systems worldwide in the countdown to 2030, Nature Food, 4, 1090–1110, https://doi.org/10.1038/s43016-023-00885-9, 2023a. a
Schneider, M., Schelte, T., Schmitz, F., and Körner, M.: EuroCrops: The Largest Harmonized Open Crop Dataset Across the European Union, Sci. Data, 10, 612, https://doi.org/10.1038/s41597-023-02517-0, 2023b. a
Seguini, L., Klisch, A., Meroni, M., Vrieling, A., Manfron, G., Atzberger, C., and Rembold, F.: Global near real-time 500 m 10 d FPAR dataset from MODIS and VIIRS for operational agricultural monitoring and crop yield forecasting, Earth Syst. Sci. Data, 18, 309–331, https://doi.org/10.5194/essd-18-309-2026, 2026. a, b
Seidel, S., Palosuo, T., Thorburn, P., and Wallach, D.: Towards improved calibration of crop models – Where are we now and where should we go?, Eur. J. Agron., 94, 25–35, https://doi.org/10.1016/j.eja.2018.01.006, 2018. a
Singh, K., Singh, D., Goroshi, S., Yashu, S., Kumar, Y., Solanki, S., and Sagar, S.: Crop Yield forecasting under FASAL (Forecasting Agricultural output using Space Agrometeorology and Land based observations), Tech. rep., India Meteorological Department (IMD), Ministry of Earth Sciences (MoES), Government of India, https://doi.org/10.13140/RG.2.2.11593.42083, 2022. a
Stuart, L., Hobbins, M., Niebuhr, E., Ruane, A. C., Pulwarty, R., Hoell, A., Thiaw, W., Rosenzweig, C., Muñoz-Arriola, F., Jahn, M., and Farrar, M.: Enhancing Global Food Security: Opportunities for the American Meteorological Society, B. Am. Meteorol. Soc., 104, E760–E777, https://doi.org/10.1175/BAMS-D-22-0106.1, 2024. a
Sweet, L.-b., Müller, C., Anand, M., and Zscheischler, J.: Cross-Validation Strategy Impacts the Performance and Interpretation of Machine Learning Models, Artificial Intelligence for the Earth Systems, 2, https://doi.org/10.1175/AIES-D-23-0026.1, 2023. a
Sweet, L. B., Athanasiadis, I. N., van Bree, R., Castellano, A., Martre, P., Paudel, D., Ruane, A. C., and Zscheischler, J.: Transdisciplinary coordination is essential for advancing agricultural modeling with machine learning, One Earth, https://doi.org/10.1016/j.oneear.2025.101233, 2025. a, b
Tadesse, T., Senay, G. B., Berhan, G., Regassa, T., and Beyene, S.: Evaluating a satellite-based seasonal evapotranspiration product and identifying its relationship with other satellite-derived products and crop yield: A case study for Ethiopia, Int. J. Applied Earth Obs., 40, 39–54, 2015. a
Tanaka, T., Sun, L., Becker-Reshef, I., Song, X.-P., and Puricelli, E.: Satellite forecasting of crop harvest can trigger a cross-hemispheric production response and improve global food security, Commun. Earth Environ., 4, 1–9, https://doi.org/10.1038/s43247-023-00992-2, 2023. a
Thomas, R. L. and Uminsky, D.: Reliance on metrics is a fundamental challenge for AI, Patterns, 3, 100476, https://doi.org/10.1016/j.patter.2022.100476, 2022. a
Tsaftaris, S. A. and Scharr, H.: Sharing the Right Data Right: A Symbiosis with Machine Learning, Trends Plant Sci., 24, 99–102, https://doi.org/10.1016/j.tplants.2018.10.016, 2019. a
Tseng, G., Kerner, H., Nakalembe, C., and Becker-Reshef, I.: Learning to predict crop type from heterogeneous sparse labels using meta-learning, in: 2021 IEEE/CVF Conference on Computer Vision and Pattern Recognition Workshops (CVPRW), 1111–1120, https://doi.org/10.1109/CVPRW53098.2021.00122, 2021a. a
Tseng, G., Zvonkov, I., Nakalembe, C., and Kerner, H.: CropHarvest: A global dataset for crop-type classification, in: Proceedings of the Neural Information Processing Systems Track on Datasets and Benchmarks, edited by: Vanschoren, J. and Yeung, S., Vol. 1, Curran, https://openreview.net/pdf?id=JtjzUXPEaCu (last access: 30 May 2026), 2021b. a
Tseng, G., Kerner, H., and Rolnick, D.: TIML: Task-Informed Meta-Learning for Agriculture, arXiv, https://doi.org/10.48550/arXiv.2202.02124, 2022. a
Tzachor, A., Devare, M., King, B., Avin, S., and Ó hÉigeartaigh, S.: Responsible artificial intelligence in agriculture requires systemic understanding of risks and externalities, Nature Machine Intelligence, 4, 104–109, https://doi.org/10.1038/s42256-022-00440-4, 2022. a
van der Velde, M. and Nisini, L.: Performance of the MARS-crop yield forecasting system for the European Union: Assessing accuracy, in-season, and year-to-year improvements from 1993 to 2015, Agr. Syst., 168, 203–212, https://doi.org/10.1016/j.agsy.2018.06.009, 2019. a, b, c
Van Klompenburg, T., Kassahun, A., and Catal, C.: Crop yield prediction using machine learning: A systematic literature review, Comput. Electron. Agr., 177, 105709, https://doi.org/10.1016/j.compag.2020.105709, 2020. a
Van Tricht, K., Degerickx, J., Gilliams, S., Zanaga, D., Battude, M., Grosu, A., Brombacher, J., Lesiv, M., Bayas, J. C. L., Karanam, S., Fritz, S., Becker-Reshef, I., Franch, B., Mollà-Bononad, B., Boogaard, H., Pratihast, A. K., Koetz, B., and Szantoi, Z.: WorldCereal: a dynamic open-source system for global-scale, seasonal, and reproducible crop and irrigation mapping, Earth Syst. Sci. Data, 15, 5491–5515, https://doi.org/10.5194/essd-15-5491-2023, 2023. a, b, c
Vermote, E.: MOD09CMG MODIS/Terra Surface Reflectance Daily L3 Global 0.05Deg CMG V006, NASA Land Processes Distributed Active Archive Center [data set], https://doi.org/10.5067/MODIS/MOD09CMG.006, 2015. a, b
Vijverberg, S., Hamed, R., and Coumou, D.: Skillful U.S. Soy Yield Forecasts at Presowing Lead Times, Artificial Intelligence for the Earth Systems, 2, https://doi.org/10.1175/AIES-D-21-0009.1, 2023. a
Waha, K., Van Bussel, L., Müller, C., and Bondeau, A.: Climate-driven simulation of global crop sowing dates, Global Ecol. Biogeogr., 21, 247–259, https://doi.org/10.1111/j.1466-8238.2011.00678.x, 2012. a
Wallach, D., Palosuo, T., Thorburn, P., Hochman, Z., Gourdain, E., Andrianasolo, F., Asseng, S., Basso, B., Buis, S., Crout, N., Dibari, C., Dumont, B., Ferrise, R., Gaiser, T., Garcia, C., Gayler, S., Ghahramani, A., Hiremath, S., Hoek, S., Horan, H., Hoogenboom, G., Huang, M., Jabloun, M., Jansson, P.-E., Jing, Q., Justes, E., Kersebaum, K. C., Klosterhalfen, A., Launay, M., Lewan, E., Luo, Q., Maestrini, B., Mielenz, H., Moriondo, M., Nariman Zadeh, H., Padovan, G., Olesen, J. E., Poyda, A., Priesack, E., Pullens, J. W. M., Qian, B., Schütze, N., Shelia, V., Souissi, A., Specka, X., Srivastava, A. K., Stella, T., Streck, T., Trombi, G., Wallor, E., Wang, J., Weber, T. K., Weihermüller, L., de Wit, A., Wöhling, T., Xiao, L., Zhao, C., Zhu, Y., and Seidel, S. J.: The chaos in calibrating crop models: Lessons learned from a multi-model calibration exercise, Environ. Model. Softw., 145, 105206, https://doi.org/10.1016/j.envsoft.2021.105206, 2021. a
Wang, Y., Albrecht, C. M., Braham, N. A. A., Mou, L., and Zhu, X. X.: Self-supervised learning in remote sensing: A review, IEEE Geosci. Remote S., 10, 213–247, 2022. a
Watson, P. A. G.: Machine learning applications for weather and climate need greater focus on extremes, Environ. Res. Lett., 17, 111004, https://doi.org/10.1088/1748-9326/ac9d4e, 2022. a
Xu, Y., Ma, Y., and Zhang, Z.: Self-supervised pre-training for large-scale crop mapping using Sentinel-2 time series, ISPRS J. Photogramm., 207, 312–325, 2024. a
Yeh, C., Meng, C., Wang, S., Driscoll, A., Rozi, E., Liu, P., Lee, J., Burke, M., Lobell, D., and Ermon, S.: SustainBench: Benchmarks for Monitoring the Sustainable Development Goals with Machine Learning, in: Thirty-fifth Conference on Neural Information Processing Systems, Datasets and Benchmarks Track (Round 2), Curran Associates, Inc., https://openreview.net/forum?id=5HR3vCylqD (last access: 30 May 2026), 2021. a, b, c, d
You, J., Li, X., Low, M., Lobell, D., and Ermon, S.: Deep Gaussian Process for Crop Yield Prediction Based on Remote Sensing Data, in: Proceedings of the AAAI Conference on Artificial Intelligence, Association for the Advancement of Artificial Intelligence (AAAI), Vol. 31, https://doi.org/10.1609/aaai.v31i1.11172, 2017. a, b, c
Zelingher, R. and Makowski, D.: Investigating and forecasting the impact of crop production shocks on global commodity prices, Environ. Res. Lett., 19, 014026, https://doi.org/10.1088/1748-9326/ad0dda, 2023. a
Zhang, T., van der Wiel, K., Wei, T., Screen, J., Yue, X., Zheng, B., Selten, F., Bintanja, R., Anderson, W., Blackport, R., Glomsrød, S., Liu, Y., Cui, X., and Yang, X.: Increased wheat price spikes and larger economic inequality with 2 °C global warming, One Earth, 5, 907–916, https://doi.org/10.1016/j.oneear.2022.07.004, 2022. a