the Creative Commons Attribution 4.0 License.
the Creative Commons Attribution 4.0 License.
 | 02 Jun 2026
Microbial necromass contribution to topsoil organic carbon storage of natural and agricultural ecosystems
Jing-Li Lu
Thomas W. Crowther
Manuel Delgado-Baquerizo
Wenjie Liu
Yamin Jiang
Hongyang Sun
Microbial necromass is an important component of soil organic carbon (C). Yet, the relative contribution of microbial necromass in shaping the global C stocks in agricultural and natural ecosystems worldwide remains virtually unknown. Here, we compiled data on fungal and bacterial necromass along with soil organic carbon (SOC) from the 0–20 cm soil layer across 486 study sites (145 agricultural and 341 natural ecosystems) to evaluate the relative contribution of fungal necromass C (FNC) and bacterial necromass C (BNC) to SOC. Our results indicated that, on average, FNC is two times more important than BNC in explaining SOC in both agricultural and natural ecosystems. The contributions of FNC and BNC to SOC were markedly higher in agricultural ecosystems compared with natural ecosystems, with a contrasting trend in the ratio. Soil physicochemical properties (soil ratio and clay content) were the most important predictors of the contributions of FNC and BNC to SOC in both ecosystems, while geographical factor (elevation) was the most important predictor of the ratio. Our study enhances the current level of understanding regarding microbially mediated biogeochemical cycling and SOC dynamics, underscoring the critical role of microbial necromass in the global C cycle. The data and R code for this manuscript are available at https://doi.org/10.6084/m9.figshare.28827383 (Lu, 2025).
- Article
(6097 KB) - Full-text XML
-
Supplement
(1779 KB) - BibTeX
- EndNote


Soils are the most important reservoir of organic carbon (SOC), playing a pivotal role in shaping the global C cycle and climate system (Bellamy et al., 2005; Crowther et al., 2015). Such carbon stocks are the result of key processes such as organic matter decomposition. Plant inputs provide the primary carbon source to soils, and microbial processing transforms these inputs into microbial necromass that can persist over long turnover times (Cotrufo et al., 2013; Angst et al., 2021). Although the living soil microbial biomass typically constitutes only about 2 % of SOC (a ratio referred to as the microbial quotient; Anderson and Domsch, 1989; Liu et al., 2023), microbial necromass has been shown to contribute more than half and up to approximately 80 % of SOC, depending on soil type and analytical methods (Liang and Balser, 2011; Kallenbach et al., 2016; Liang et al., 2019). As such, microbial necromass C (MNC) is likely to constitute a substantial and critical component of stable SOC (Ma et al., 2018), and its dynamics are increasingly recognized for their role in regulating the terrestrial carbon cycle and climate feedbacks (Zhao et al., 2023). To gain a comprehensive understanding of the critical role of MNC in the global C cycle, recent research has highlighted the distinct roles of fungal and bacterial necromass, revealing their contrasting responses to environmental and anthropogenic drivers (Liang et al., 2017; Ni et al., 2020; Luo et al., 2022; Zhou et al., 2023). For instance, studies have shown that the accumulation and contribution of MNC are sensitive to factors such as aridity, primary productivity, agricultural management practices like tillage and fertilization, as well as key soil properties including pH and clay content (Zhang et al., 2021; Zhou et al., 2023; Xu et al., 2024). Despite these advances, it remains unclear whether these organism-specific mechanisms translate into systematic differences in necromass contributions between ecosystems under varying degrees of human interference, such as agricultural versus natural systems.
With the distinct roles of fungi and bacteria in decomposing organic matter and stabilizing organic carbon in soil, the relative contribution to SOC of fungal and bacterial necromass C could be used to track the dynamics of SOC storage (Malik et al., 2016). The cell walls of fungi primarily consist of chitin (a nitrogen-containing polysaccharide) and β-glucans, whereas bacterial cell walls are mainly composed of peptidoglycan – a complex of sugars and amino acids (Lenardon et al., 2007). As bacterial amino sugars are readily degradable, while fungal chitin and -glucans are more recalcitrant, fungal necromass generally exhibits a longer turnover time in soil compared to bacterial necromass (Xu et al., 2022). Wang et al. (2021a) reported that the contribution of fungal necromass carbon (FNC) to SOC exceeded 65 %, considerably higher than that of bacterial necromass carbon (BNC, 32 %–36 %). This pattern is likely attributed to the slower decomposition rate and stronger mineral-associative capacity of the more recalcitrant fungal necromass. Furthermore, greater fungal biomass and higher turnover rates may enhance the input flux of fungal necromass (Klink et al., 2022). The contributions of FNC and BNC to SOC varied across ecosystem types (Wang et al., 2021a; Cao et al., 2023; Xu et al., 2024). However, until now, few studies have explored how fungal and bacterial necromass carbon contribution to SOC vary across both natural and human managed landscapes (Zhou et al., 2023).
To explore the global patterns and drivers of FNC, BNC and the ratio in agricultural and natural ecosystems, we compiled data from 486 study sites worldwide. The aims of this study were: (1) to quantify the contributions of FNC and BNC to SOC and the ratio in agricultural and natural ecosystems; and (2) to investigate the primary driving factors influencing the contributions of FNC and BNC to SOC and the ratio. Agricultural and natural ecosystems are known to differ in the amount and characteristics of carbon stored in their soils (Hobbs et al., 2011; Keith et al., 2022). Agricultural ecosystems often stock less carbon typically resulting in bacterial-dominated soil communities (van Der Heijden et al., 2008). In contrast, natural ecosystems display greater carbon stocks of greater diversity coming from plant litter and root deposits (Wu et al., 2019). In such ecosystems, fungal mycelial networks and stable soil aggregates are enhanced, leading to higher FNC contributions to SOC (Sanaullah et al., 2020; Sae-Tun et al., 2022). While bacteria are undoubtedly vital decomposers, fungi play a distinct and often dominant role in the initial breakdown of complex plant polymers such as cellulose and lignin in natural environments. In contrast, agricultural monocultures tend to reduce fungal diversity unless mitigated by management practices (Chen et al., 2020). Reflecting this context dependence, cellulose-rich inputs can enrich saprotrophic fungi in arable soils (Clocchiatti et al., 2021), whereas bacteria may contribute substantially in mineral soils or under specific microhabitat and land management conditions (Štursová et al., 2012; Choi et al., 2018). Elucidating the global distribution and drivers of FNC, BNC, and their ratio across agricultural and natural ecosystems is essential for predicting management-induced shifts in SOC under varying climatic and soil conditions (Zhang et al., 2021; Zhou et al., 2023; Xu et al., 2024).
2.1 Data collection
We compiled a comprehensive dataset following the stepwise workflow. (1) We collected peer-reviewed papers published from 1996 to 31 December 2022 from Web of Science (http://apps.webofknowledge.com, last access: 31 December 2022), Google Scholar (http://scholar.google.com, last access: 31 December 2022), and the China National Knowledge Infrastructure (http://cnki.net, last access: 31 December 2022), using the keywords: “amino sugars”, “microbial necromass”, “microbial residue”, “fungal residue”, and “bacterial residue”. Records from different databases were merged and deduplicated to form an initial compilation. (2) We then filtered the compiled studies to include only those focusing on topsoil, defined as the 0–20 cm layer. Studies reporting deeper or unspecified sampling depths (e.g., 0–30 cm) were excluded to ensure spatial comparability. (3) Full texts were assessed to confirm the presence of paired fungal and bacterial residue data from the same sample – specifically, glucosamine (GluN) and muramic acid (MurA), or directly reported FNC and BNC values – to enable consistent cross-study calculation of the ratio. Studies lacking either biomarker were excluded from ratio analyses, though those directly reporting the ratio were retained. (4) Eligible observations were classified into agricultural ecosystems (including dry land, irrigated cropland, and submerged paddy) or natural ecosystems (forest and grassland) based on study metadata. (5) For natural ecosystems, data from fertilized, polluted, experimentally treated, or otherwise anthropogenically disturbed sites were excluded. In total, the final dataset consisted of 2094 observations from 486 sites worldwide (145 agricultural and 341 natural sites; Fig. 1) reported in 164 peer-reviewed papers. Of these observations, 1001 were from agricultural ecosystems, and 1093 from natural ecosystems. Among the 341 natural sites, 195 were forests and 146 were grasslands. For agricultural sites, we used Google Earth Engine with the LGRIP30 V1 dataset to classify agricultural ecosystem into dry land and irrigated cropland, and we overlaid the JRC surface-water seasonality layer to extract submerged paddy from the irrigated class (LGRIP30 irrigated value = 2 and JRC seasonality ≥ 1). We ultimately classified 145 samples of agricultural ecosystems into 32 dry land, 72 irrigated, and 41 submerged paddy sites.
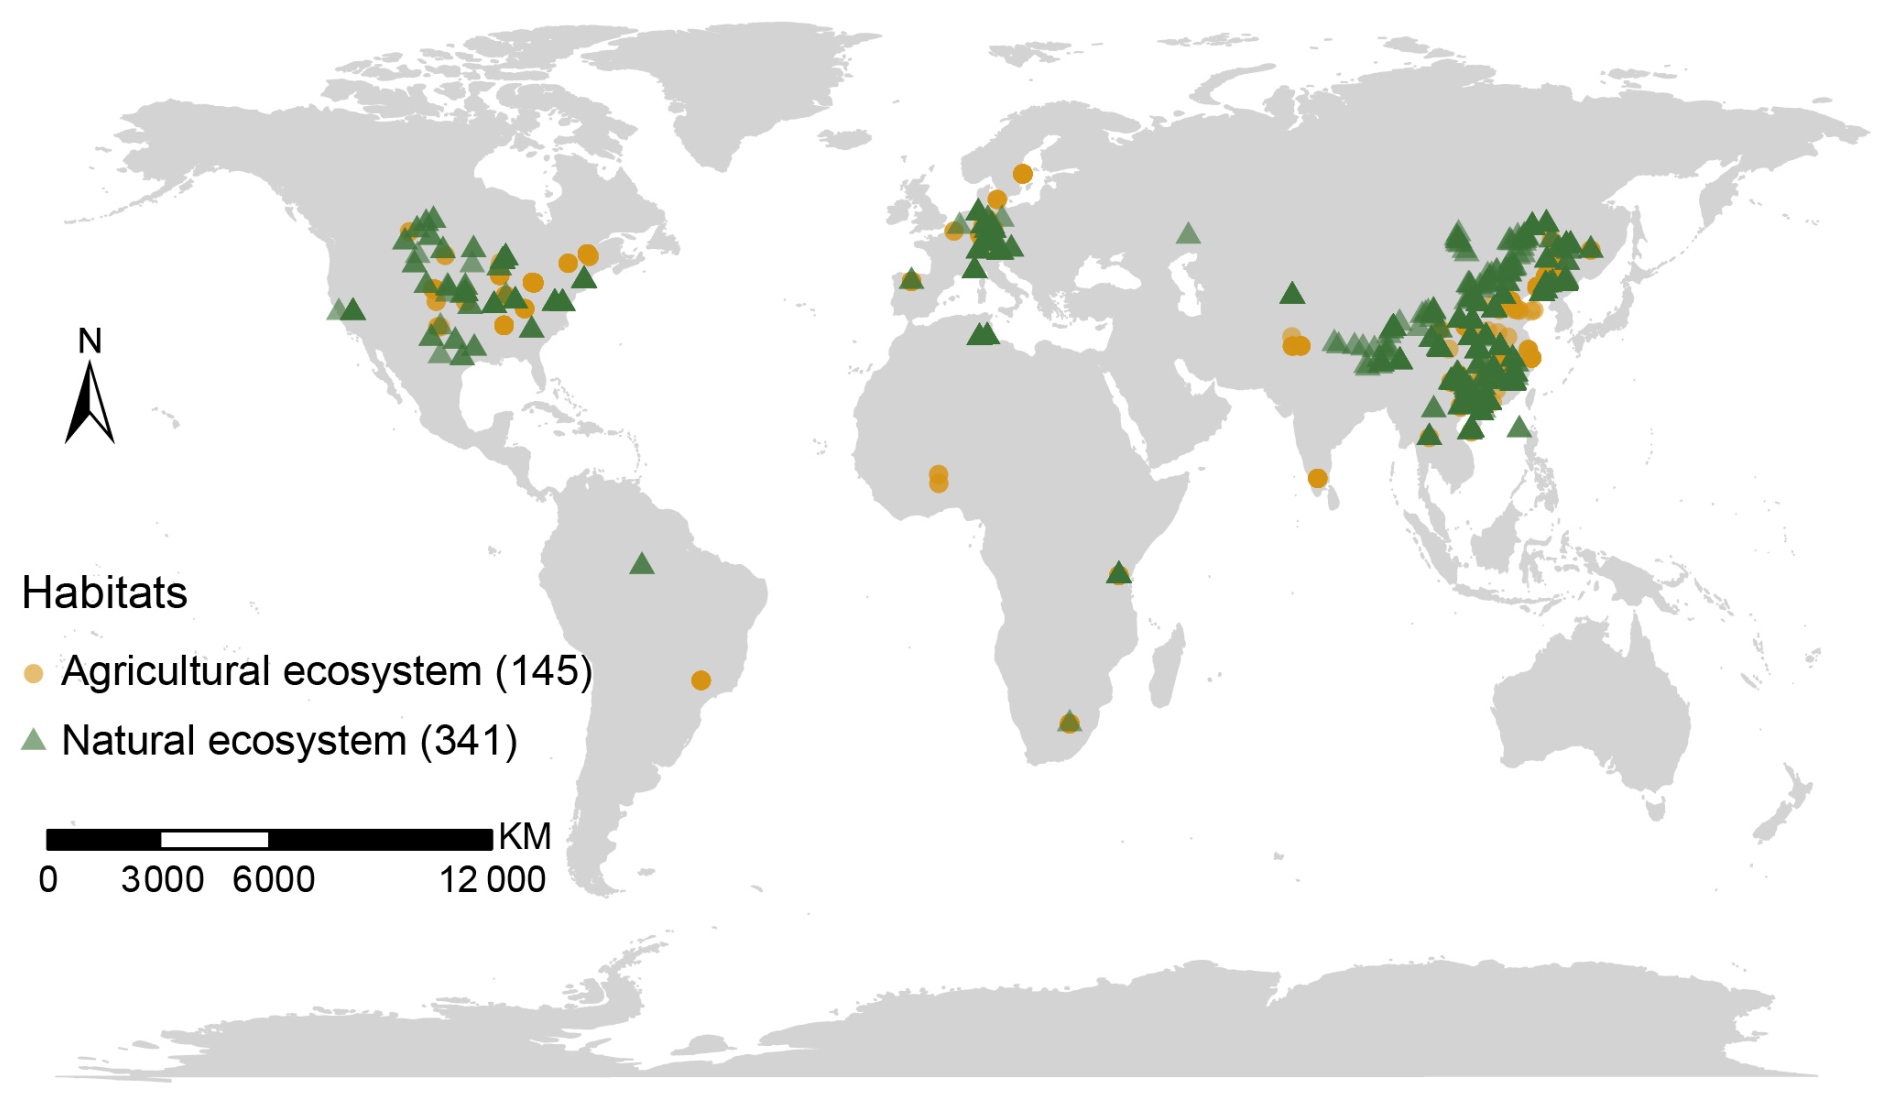
Figure 1Global distribution of the sites used in this study. Ecosystem types are distinguished by distinct shapes and colors, with the numbers in parentheses indicating the number of study sites for each ecosystem type.
We calculated the FNC and BNC based on amino sugar concentrations following widely used conversion factors, correcting total GluN for its bacterial share using MurA:
where 9 (unitless) is the conversion factor from GluN to FNC. To estimate fungal-derived GluN, we subtracted the bacterial share of GluN assuming an empirical GluN:MurA molar ratio of 2:1 for bacterial residues. 179.17 and 251.23 are the molecular weights of GluN and MurA, respectively. And their units are all g mol−1. The unit of FNC is mg kg−1.
where 45 (unitless) is the conversion factor from MurA to BNC. The unit of BNC is mg kg−1.
Additional information including site geographic location (latitude and longitude), topographical condition (elevation), climatic factors (mean annual temperature [MAT] and mean annual precipitation [MAP]), soil physicochemical properties (pH, SOC, total nitrogen [TN], clay content, and soil temperature), and biotic (microbial and plant) factors were recorded. Specifically, biotic factors included microbial biomass carbon (MBC), microbial biomass nitrogen (MBN), , net primary production (NPP), and belowground biomass C density (BGBC). The data of topographical condition (elevation) was classified as geographical factor in this study. When MAT and MAP were unavailable in the original articles, we extracted them from the global climate layers of WorldClim (http://www.worldclim.org/, last access: 31 December 2022) with a grid precision of 30 × 30 arcsec according to geographic location. Missing elevation data were extracted using the elevatr package v.0.4.2 (Hollister, 2021) in the R environment. We acquired the data on annual mean soil temperature from the study of Lembrechts et al. (2022), while other absent soil physicochemical data were extracted from the Harmonized World Soil Database (https://www.fao.org/soils-portal/data-hub/soil-maps-and-databases/harmonized-world-soil-database-v12/en/, last access: 31 December 2022) and SoilGrids 2.0 (Poggio et al., 2021; https://www.soilgrids.org/, last access: 31 December 2022) using ArcGIS 10.3. We supplemented missing climatic and soil variables using high-resolution, globally interpolated datasets to ensure consistent spatial coverage across all sites. After retrieving missing value from gridded data, we typically calibrate them against field-reported values via a field-anchored bias correction (i.e., a site- or region-specific “delta” adjustment) to minimize errors introduced by gridded data. While the use of such data introduces inherent uncertainties, these databases are widely adopted in global-scale ecological analyses and provide the most feasible approach for a unified assessment. In addition, the data on NPP and BGBC were acquired from the studies of Zhao and Running (2010) and Spawn et al. (2020), respectively. Missing MBC and MBN data were acquired using a global database with a high resolution of 30 × 30 arcsec (Wang et al., 2022).
2.2 Statistical analysis
All statistical analyses were performed using R v4.1.3 (R Core Team, 2021). Initially, the Shapiro–Wilk test was employed to assess the normality of our data, followed by the application of Levene's test to evaluate the homogeneity of variances across different groups. To detect the significant differences in the contributions of FNC and BNC to SOC, and the ratio between agricultural and natural ecosystems, as well as between forest and grassland ecosystems, the Wilcoxon rank sum test was conducted. Kruskal–Wallis and Dunn's post hoc tests were used to assess the significant differences of the contributions of FNC and BNC to SOC, and the ratio among dry land, irrigated cropland, and submerged paddy. We used Spearman's rank correlation coefficient to explore the connections between the 16 variables considered in this study, including geographical and climatic factors, soil physicochemical properties, and biotic factors. Since there was a strong positive correlation between MAT and soil temperature (Fig. S1 in the Supplement), soil temperature was excluded from our subsequent analyses. Linear regressions between different factors and the contributions of FNC and BNC to SOC and the ratio were performed. Dots and smoothing curves were drawn using the geom_point and geom_smooth functions, respectively, in the ggplot2 package v.3.4.0 (Wickham, 2016).
Variation partitioning analysis was conducted using the vegan package v.2.5.7 (Oksanen et al., 2020) to evaluate the effects of four types of factors on the contributions of FNC and BNC to SOC and the ratio in agricultural and natural ecosystems at global scale. We used a variance inflation factor threshold of 3.3 to eliminate those variables that were strongly correlated and avoid multicollinearity (Fig. S2; Kock, 2015; Fanin et al., 2020). Following factor selection, boosted regression trees (BRTs) were used to partition independent influences of geographical (elevation) and climatic (MAT and MAP) factors, soil physicochemical properties (pH, clay, , and SOC), and biotic factors (NPP, BGBC, MBC, and ) on the contributions of FNC and BNC to SOC and the ratio with the gbm package v.2.1.8.1 (Greenwell et al., 2022).
Utilizing the selected factors, we performed structural equation models (SEMs) to quantify the effects (direct, indirect and both) of four types of factors on the contributions of FNC and BNC to SOC and the ratio using lavaan package v.0.6.19 (Rosseel, 2012). According to the previously reported potential causal relationships between explanatory and response variables (Wang et al., 2021a, b; Li et al., 2024), we established the priori structural equation models for agricultural and natural ecosystems, respectively (Fig. S3). The SEMs were fitted via maximum likelihood estimation, with non-significant paths iteratively pruned through stepwise exclusion, followed by model evaluation using modification indices and goodness-of-fit criteria. The fit indices included degrees of freedom (df), chi-square (χ2, 0 ≤ 2), comparative fit index (CFI > 0.9), and root mean square error of approximation (RMSEA < 0.08), which were used to assess the adequacy of the SEM.
Map, box, bar, bubble, and lollipop charts were plotted with the ggplot2 package v.3.4.0 (Wickham, 2016). To enhance map visualization, the ggnewscale package v.0.4.8 (Campitelli, 2022) was necessary alongside the ggplot2 package v.3.4.0 (Wickham, 2016). Similarly, the ggpubr package v.0.5.0 (Kassambara, 2022) was an additional necessity when creating lollipop charts.
3.1 Fungal and bacterial necromass contribution to SOC in agricultural and natural ecosystems
Our results show that in agricultural ecosystems, ranged from 0.09 % to 97.53 % (mean ± SE: 34.39 ± 0.67 %), and ranged from 0.81 % to 65 % (15.65 ± 0.33 %). In natural ecosystems, ranged from 0.92 % to 96.29 % (29.24 ± 0.51 %), and ranged from 0.25 % to 89.45 % (14.02 ± 0.36 %) (Table 1). The ratio ranged from 0.02 to 12.74 (2.61 ± 0.06) in agricultural ecosystems and from 0.12 to 44.24 (3.22 ± 0.11) in natural ecosystems (Table 1).
Table 1Summary of the contributions of fungal necromass carbon (FNC) and bacterial necromass carbon (BNC) to SOC and the ratio in agricultural and natural ecosystems at the global scale investigated in this study.
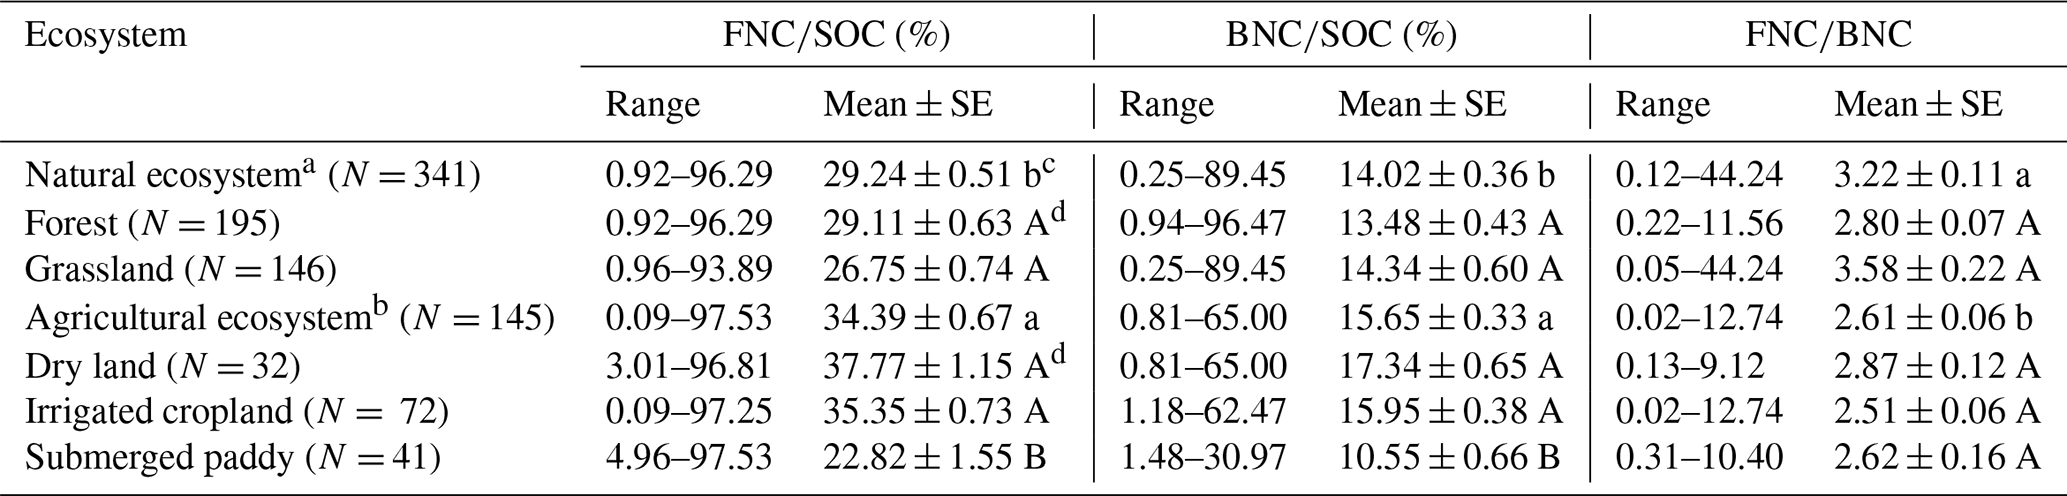
Note: N refers to the number of study sites; a Natural ecosystem includes forest and grassland; b Agricultural ecosystem includes dry land, irrigated cropland, and submerged paddy; c Within the same column, values with different lowercase letters indicate a significant difference in the same variable between agricultural and natural ecosystems (Wilcoxon rank sum test; P < 0.05); d Within the same column, values with different capital letters indicate a significant difference in the same variable between forests and grasslands (Wilcoxon rank sum test), as well as between dry land, irrigated cropland, and submerged paddy (Kruskal–Wallis and Dunn's post hoc tests; P < 0.05).
Our analysis revealed statistically significant disparities in the contributions of FNC and BNC to explain SOC in agricultural and natural ecosystems at the global scale (P < 0.05; Fig. 2a, b). Notably, the average contributions of FNC and BNC to SOC were substantially higher in agricultural ecosystems than in natural ecosystems (P < 0.001; Fig. 2a, b). For FNC, the average contribution explaining the variation of SOC was 34.39 % in agricultural ecosystems, versus 29.24 % in natural ecosystems. BNC contributed an average of 15.65 % to explaining the variation in SOC in agricultural ecosystems, compared to 14.02 % in natural ecosystems (Table 1). Our results also indicated that the contributions of FNC to SOC were approximately twice those of BNC in agricultural and natural ecosystems (Table 1).
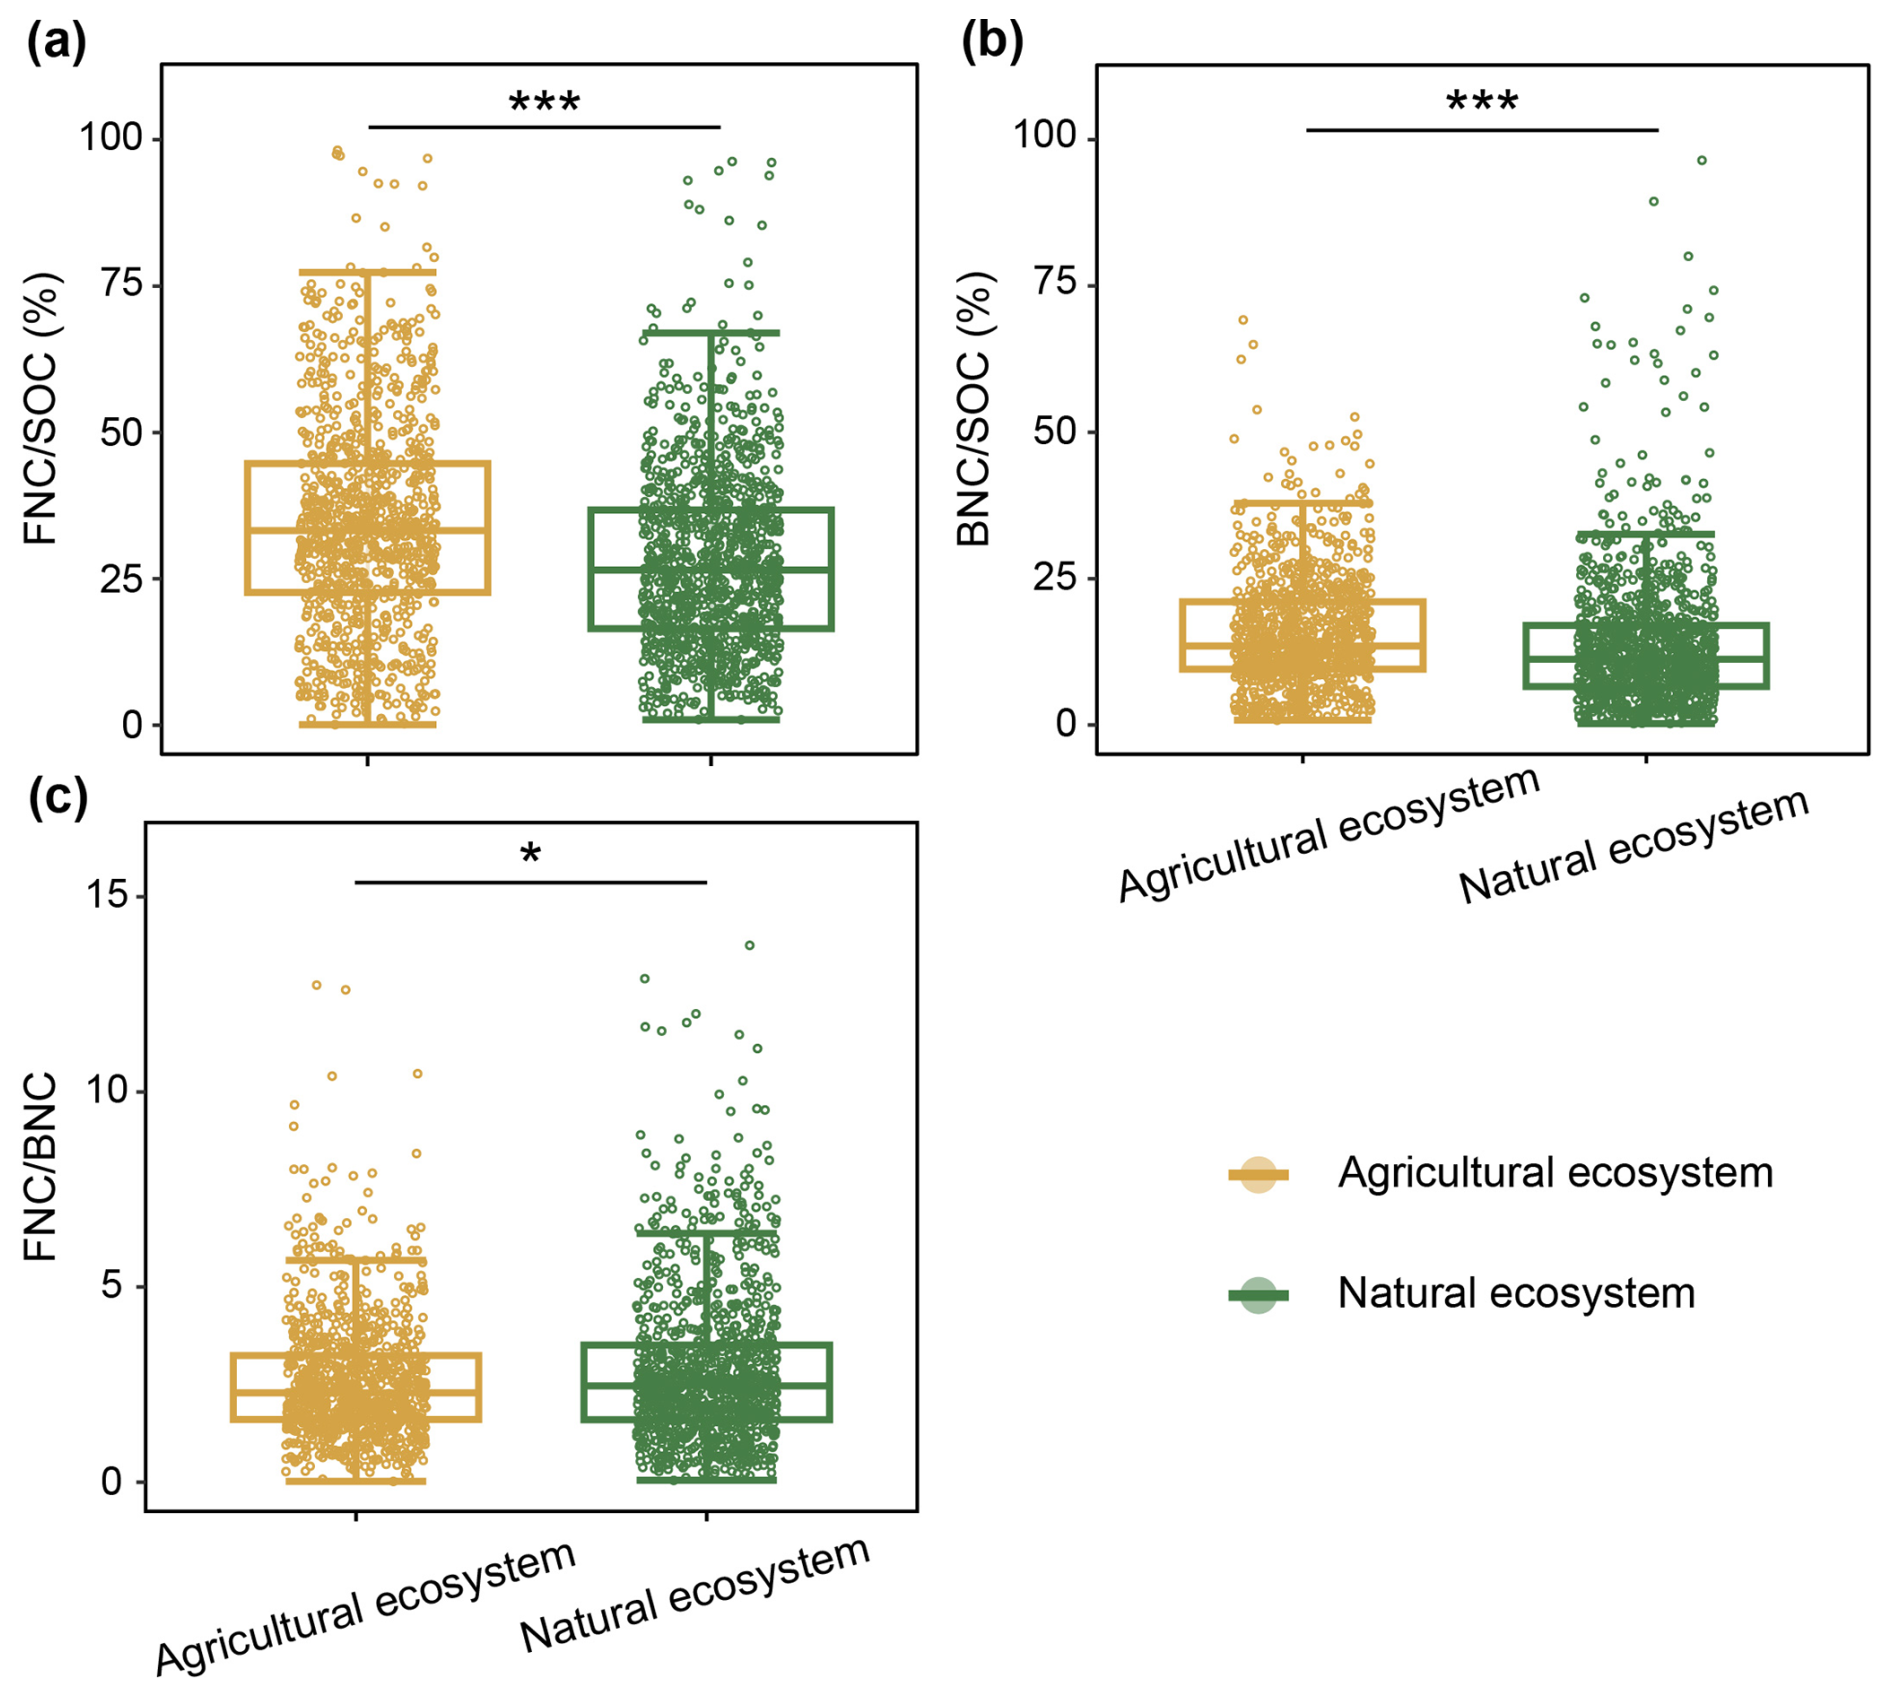
Figure 2Comparison of the contributions of MNC to SOC and their ratio in agricultural and natural ecosystems. Colors indicate different ecosystems types. Significance levels: P < 0.001 and * P < 0.05.
The contributions of FNC and BNC to explaining the variation of SOC indicated no significant difference between dry land and irrigated cropland (P > 0.05), whereas both differed significantly from submerged paddy (P < 0.05; Fig. S4a, b). In detail, across dry land, irrigated cropland, and submerged paddy, the mean contributions of FNC to SOC were 37.77 %, 35.35 %, and 22.82 %, respectively, whereas those of BNC were 17.34 %, 15.95 %, and 10.55 % (Table 1). Moreover, there were no significant differences in the contributions of FNC and BNC to SOC between forest and grassland ecosystems (P > 0.05; Fig. S5). Specifically, FNC contributed, on average, 29.11 % to SOC in forests and 26.75 % in grasslands, while BNC contributed 13.48 % in forests and 14.34 % in grasslands (Table 1).
3.2 Ratios of fungal and bacterial necromass in agricultural and natural ecosystems
Our results indicated that, at the global scale, the soil ratio differs significantly between agricultural and natural ecosystems (P<0.05; Fig. 2c), with a higher ratio in natural ecosystems (3.22) than in agricultural ecosystems (2.61; Table 1).The ratio did not differ significantly among dry land, irrigated cropland, and submerged paddy (P > 0.05; Fig. S4c), with average ratios of 2.87, 2.51, and 2.62, respectively (Table 1). Similarly, there was no significant difference in the ratio between forest and grassland ecosystems (P> 0.05; Fig. S5), and the average ratios for forests and grasslands were 2.80 and 3.58 (Table 1), respectively.
3.3 Associations of abiotic and biotic factors with microbial necromass parameters
Soil physicochemical factors were the most important influence on the contributions of FNC and BNC to SOC across both ecosystem types (Figs. 3a–d, 4a–d). Specifically, they explained 16 % and 17 % of the variance in the contributions of FNC and BNC to SOC in agricultural ecosystems, respectively (Fig. 3a, c), and 20 % and 24 % in natural ecosystems (Fig. 3b, d). BRTs corroborated this pattern, with soil physicochemical factors showing the highest relative influence (51% for FNC, and 44 % for BNC) in agricultural systems and 44 % in natural systems (Fig. 4a–d). All BRT models were significant (P < 0.001), with explained variance 36 %–66 %. While soil factors dominated overall, responses to individual variables differed between ecosystems. In detail, in agricultural systems, the ratio ranked third for FNC after clay and SOC (Fig. 4a), whereas was the top predictor for FNC in natural systems and for BNC in both ecosystems (Fig. 4b–d). Consistently, linear models showed declines in the contributions of FNC and BNC with increasing in both ecosystems (Figs. S6g, S7g). SEMs yielded convergent results, indicating both direct and indirect pathways (Figs. 5a–d, 6a–d). Notably, the direct and total effects of soil physicochemical factors on FNC were negative in agricultural but positive in natural ecosystems (Figs. 5a, b, 6a, b), whereas the effects on BNC were negative in both ecosystem types (Figs. 5c, d, 6c, d).
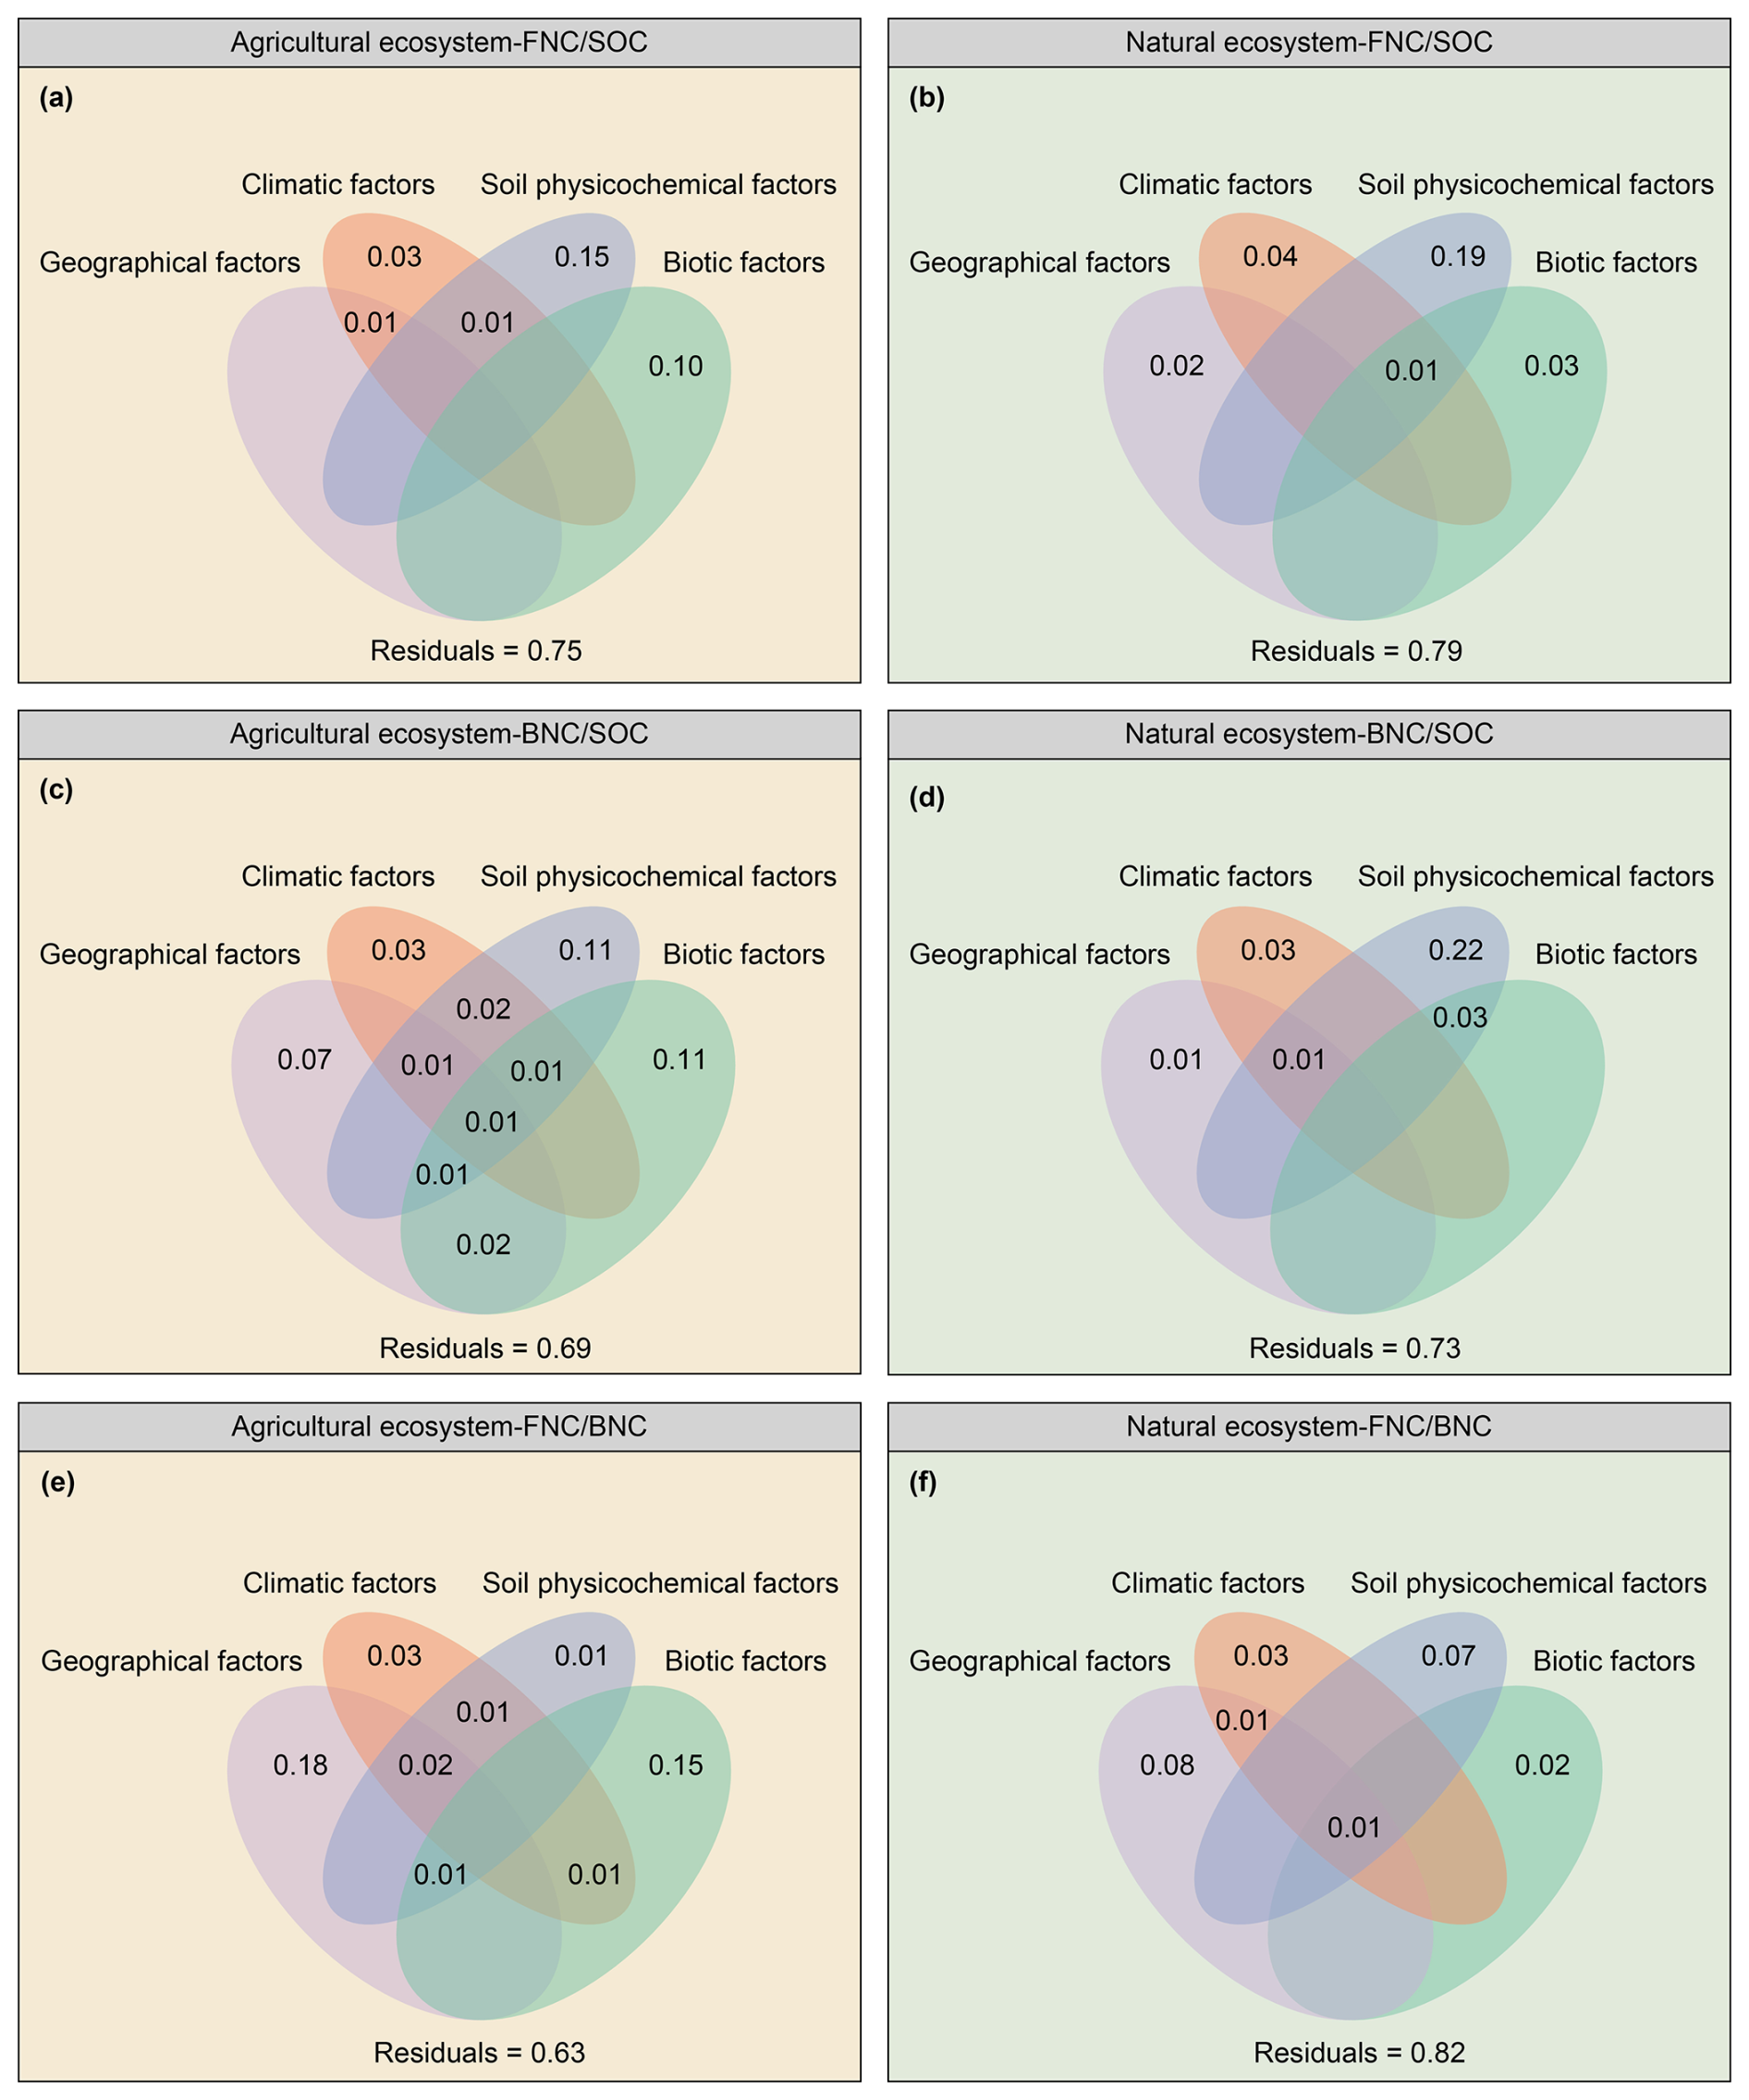
Figure 3Variations in the contributions of MNC to SOC and their ratio explained by four types of factors in agricultural and natural ecosystems. Colors indicate different types of factors.
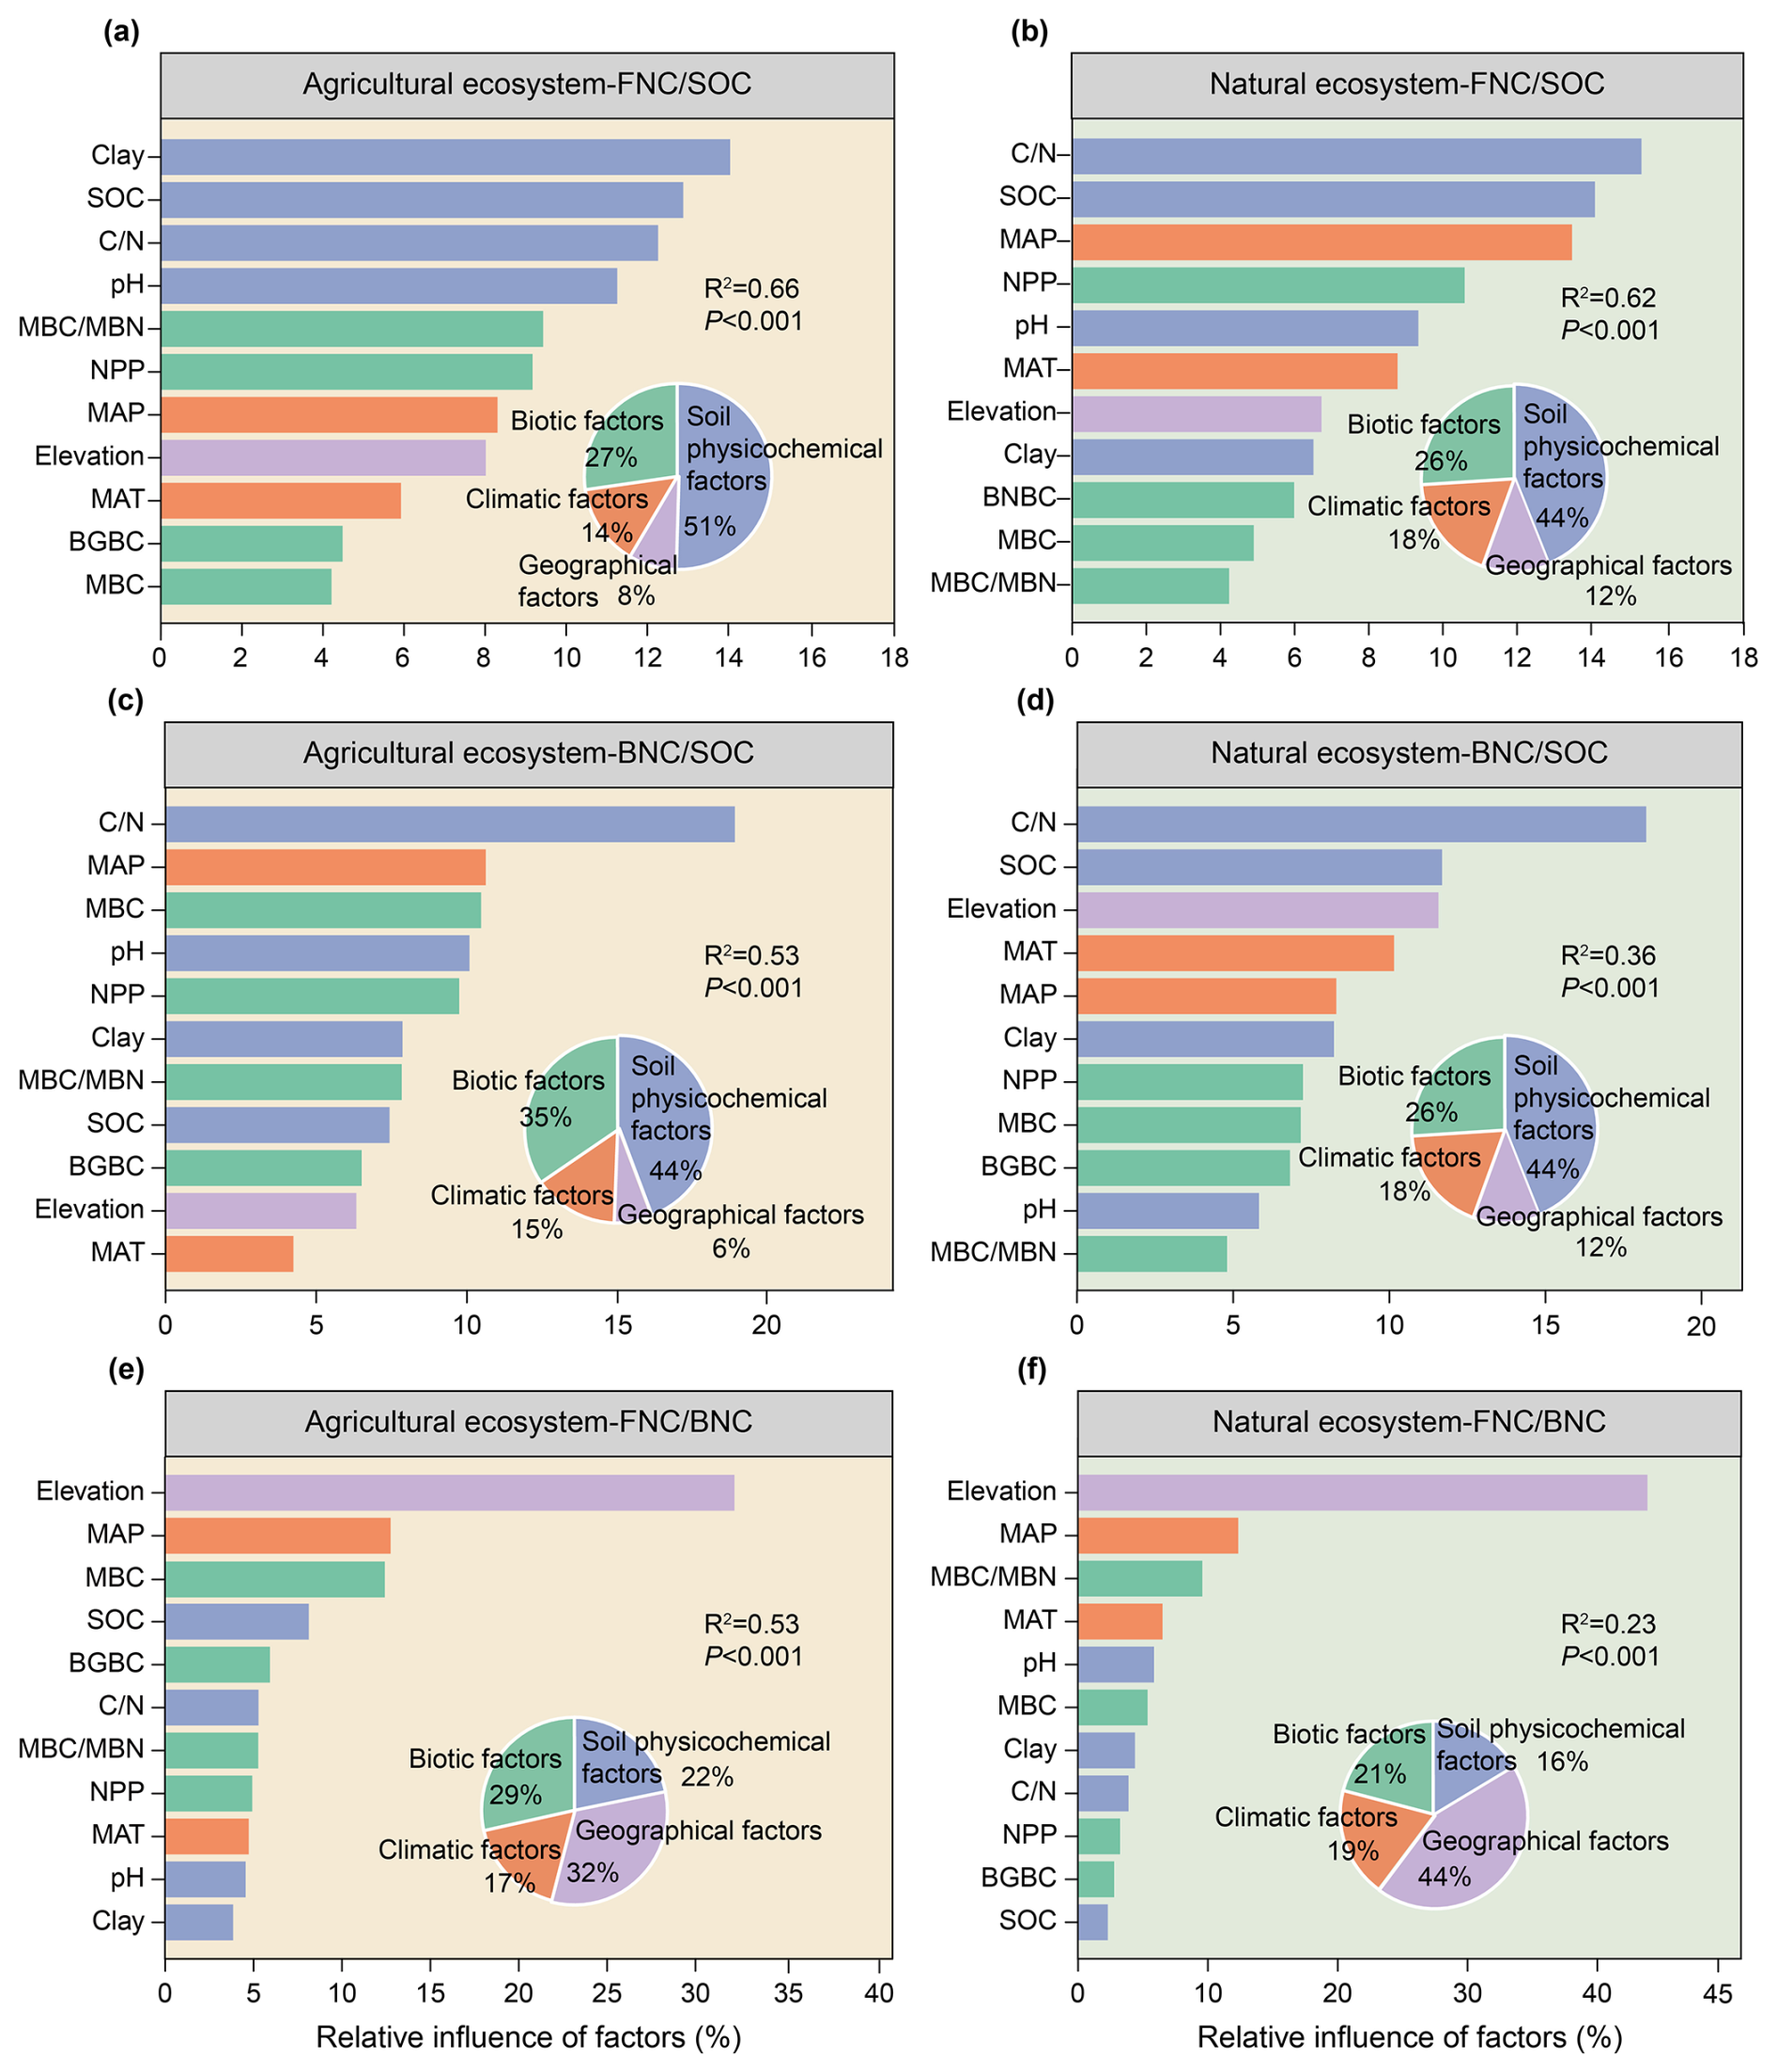
Figure 4Relative influence of different factors on the contributions of MNC to SOC and their ratio in agricultural and natural ecosystems. MAT, mean annual temperature; MAP, mean annual precipitation; MBC, microbial biomass carbon; SOC, soil organic carbon; , the ratio of SOC to total nitrogen (TN); , the ratio of MBC to microbial biomass nitrogen (MBN); NPP, net primary production; BGBC, belowground biomass carbon density. Colors indicate different types of factors.
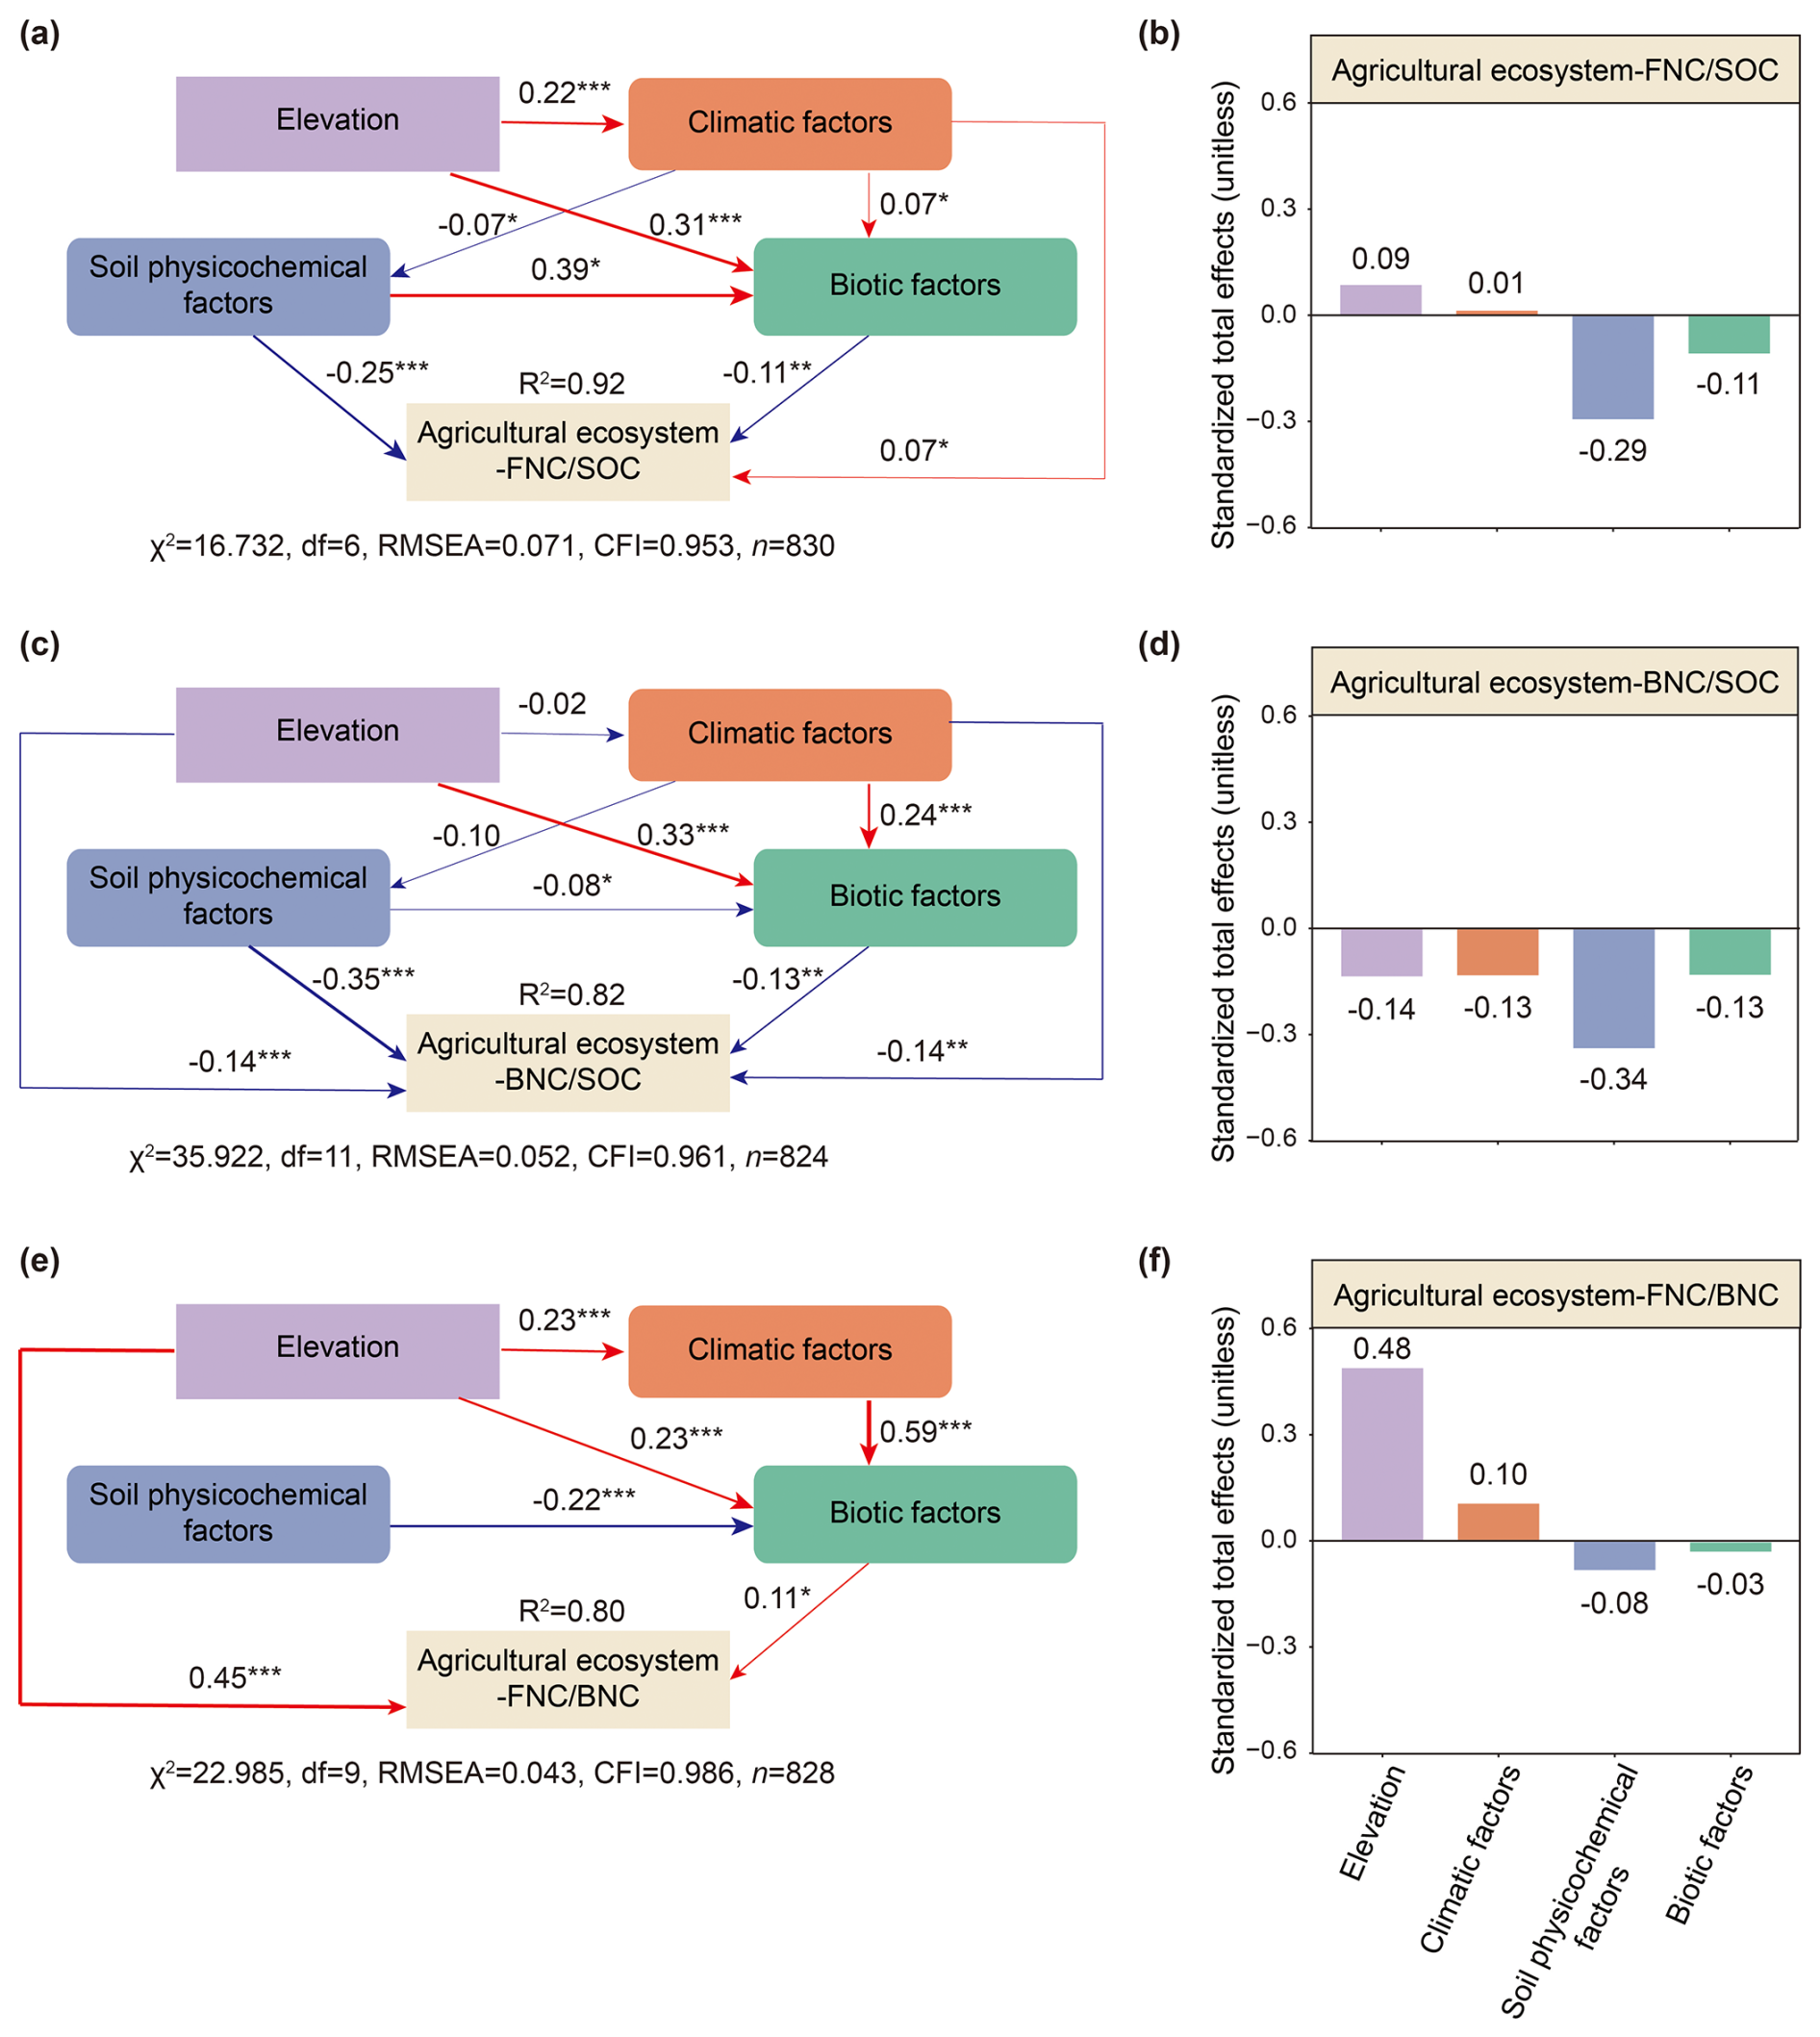
Figure 5The influence pathways of four types of factors on the contributions of MNC to SOC and their ratio in agricultural ecosystems. Direct and indirect effects (a, c, e) and the standardized total effects (b, d, f) of different factors on the contributions of MNC to SOC and their ratio of agricultural ecosystems are shown. Standardized path coefficients representing the effect sizes of potential causal factors are indicated by numbers adjacent to arrows. The width of arrows is proportional to the potential causal effect between variables. The red arrows indicate positive effects, and the blue arrows indicate negative effects. The numbers adjacent to boxes of response variables denote the explained variance (R2). Right-angled rectangles denote single variables, whereas rounded rectangles represent composite variables. Colors indicate different types of factors. Significance levels: P < 0.001, P < 0.01 and * P < 0.05. The priori models are shown in Fig. S3.
Our results indicated that geographical factors were the most important contributors to explain the ratio in both agricultural and natural ecosystems, accounting for 21 % and 10 % of the explained variance in the ratio, respectively (Fig. 3e, f). The results of the BRTs suggested that geographical factors played a similar role in explaining the ratio (Fig. 4e, f). In the BRT models, geographical factors emerged as the primary influencers of the ratio in agricultural and natural ecosystems, accounting for 32 % and 44 % of the variance in each case, respectively (Fig. 4e, f). To be more specific, elevation was the most significant geographical factors influencing the ratio in both ecosystems (Fig. 4e, f). Moreover, the ratio in agricultural and natural ecosystems show significantly increased with an increase elevation (Fig. S8a). The results of SEMs also indicated that geographical factors were the most influential factors for the ratio in agricultural and natural ecosystems, exerting both direct and indirect effects on this ratio (Figs. 5e, 6e), with the standardized total effect being positive (Figs. 5f, 6f).
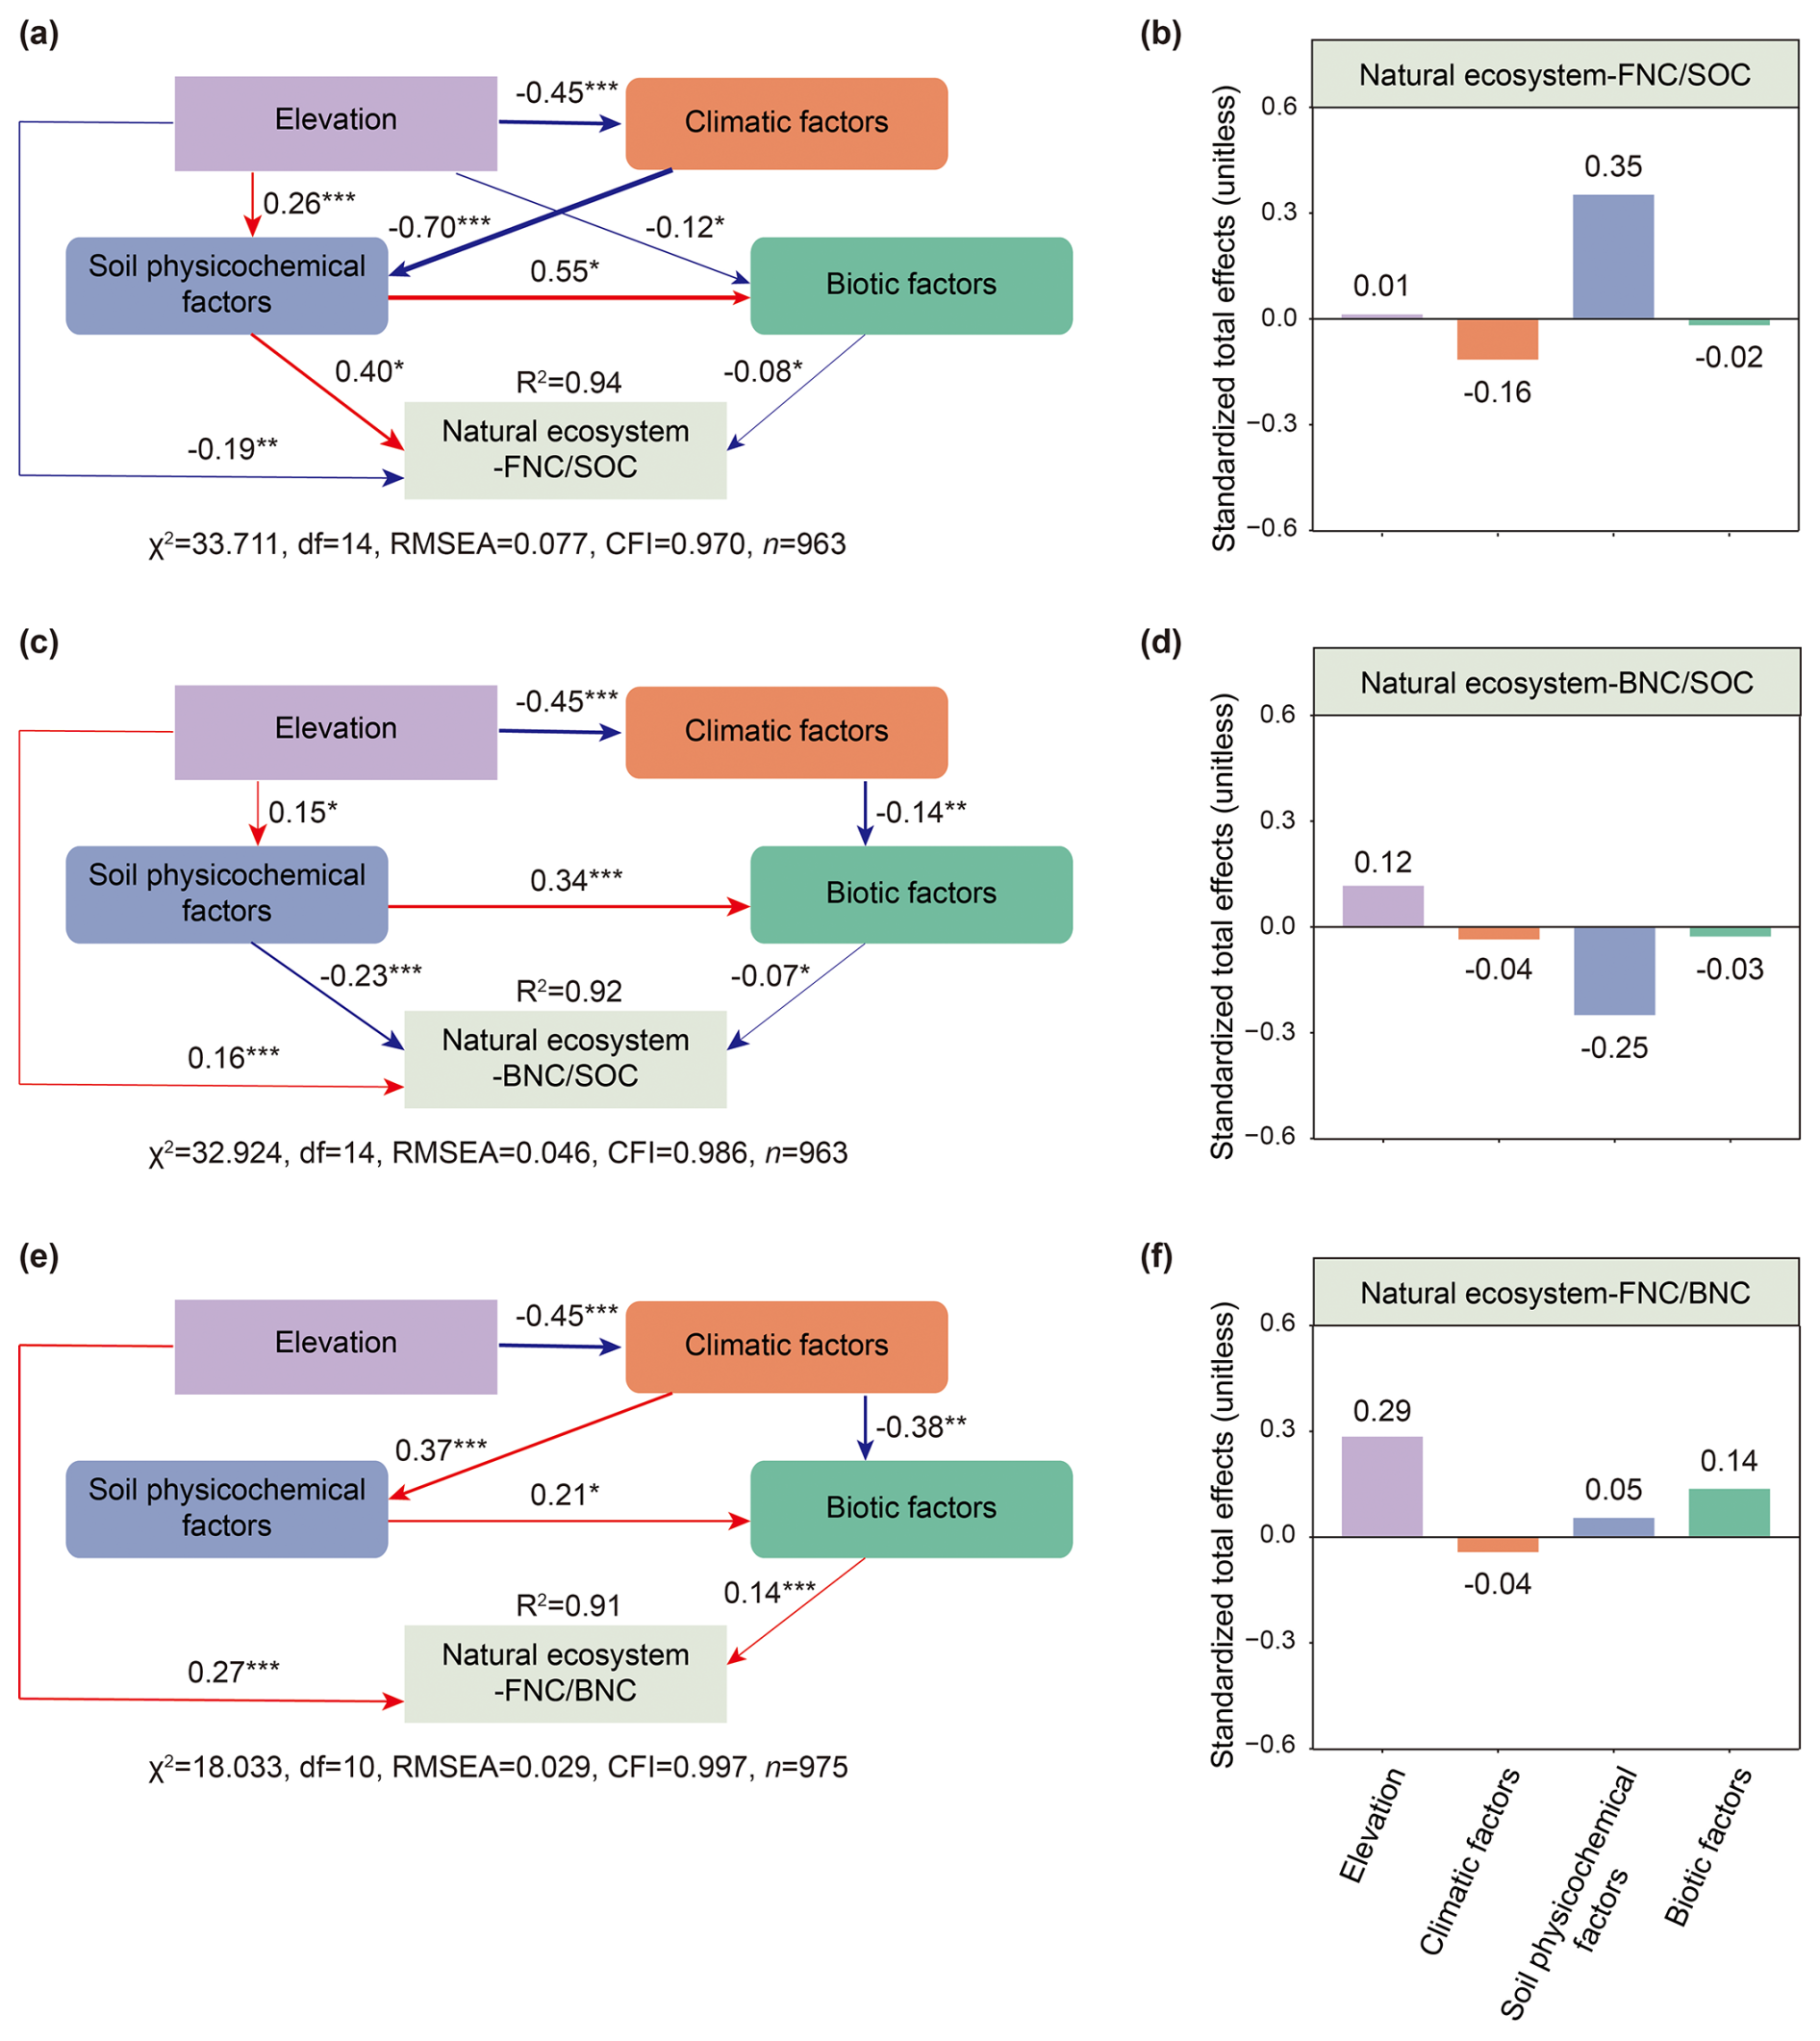
Figure 6The influence pathways of four types of factors on the contributions of MNC to SOC and their ratio in natural ecosystems. Direct and indirect effects (a, c, e) and the standardized total effects (b, d, f) of different factors on the contributions of MNC to SOC and their ratio of natural ecosystems are shown. Standardized path coefficients representing the effect sizes of potential causal factors are indicated by numbers adjacent to arrows. The width of arrows is proportional to the potential causal effect between variables. The red arrows indicate positive effects, and the blue arrows indicate negative effects. The numbers adjacent to boxes of response variables denote the explained variance (R2). Right-angled rectangles denote single variables, whereas rounded rectangles represent composite variables. Colors indicate different types of factors. Significance levels: P < 0.001, P < 0.01 and * P < 0.05. The priori models are shown in Fig. S3.
4.1 Comparing fungal versus bacterial necromass
Our results, from a global synthesis, suggest that fungal necromass can explain up two times more variation in SOC compared with bacterial necromass both in natural and agricultural ecosystems. This is, despite, the long-term described dominance of bacterial communities in disturbed soils environments. Moreover, the mean ratio was significantly higher in natural ecosystems than in agricultural ecosystems (P < 0.05; Fig. 2). Although this general pattern has been reported in previous studies (Liang et al., 2019; Wang et al., 2021a; Zhang et al., 2023; Ding et al., 2024), the systematic differences in the magnitude of these contributions between agricultural and natural ecosystems – and their underlying drivers – have remained poorly understood. Our study not only confirms the broad-scale trend, but also elucidates these ecosystem-level disparities and their environmental determinants. Consistent with our finding that the contribution of fungal necromass carbon (FNC) to SOC exceeded that of bacterial necromass carbon (BNC) in both ecosystem types (Table 1), the predominance of fungal necromass may be attributed to its more recalcitrant cell wall composition (e.g., chitin) and slower decomposition rate (Wang et al., 2021a). Our BRT and SEM analyses further identified soil clay content and ratio as key drivers of FNC accumulation (Figs. 4a, 5a), reinforcing the importance of organo-mineral associations in the stabilization of fungal-derived carbon.
Our study further reveals that the contributions of both fungal and bacterial necromass carbon (FNC and BNC) to explaining variation in SOC is higher in agricultural ecosystems. On the contrary, ratio seems to be a better predictor in natural ecosystems. The higher contributions of FNC and BNC to SOC in agricultural ecosystems. This is probably associated with natural environments supporting greater inputs from more diverse carbon sources such as plant-derived carbon, in addition to microbial necromass, compared with agricultural systems. Moreover, agricultural nitrogen-rich environment, characterized by low ratios, can enhance microbial mineralization, thereby promoting the production and accumulation of microbial necromass (Liang et al., 2017). Supporting this mechanism, we found that the contributions of both FNC and BNC to SOC decreased significantly with increasing soil ratio in both agricultural ecosystems (: R= −0.27, P < 0.001; : R= −0.29, P<0.001) and natural ecosystems (: R= −0.17, P < 0.001; : R= −0.35, P < 0.001; Figs. S6g, S7g). These results further underscore that a lower soil ratio – often indicative of higher nitrogen availability – is a key driver of microbial necromass accumulation. It should be noted that, although in situ plant residues in agricultural systems (e.g., cereal straw) may have high ratios, the overall soil ratio is reduced by management practices such as mineral fertilization and the incorporation of low organic amendments. Deng and Liang (2022) suggested that the potential contribution of microbial necromass to the SOC pool was governed by the ratio. This finding was confirmed by our results (Fig. 4b–d). As elaborated in Sect. 4.1, high N availability (i.e., low soil ratio) promotes the production and accumulation of microbial necromass (Wu et al., 2025). Consequently, the contributions of both FNC and BNC to SOC decreased with increasing soil ratio (Figs. S6g, S7g). In agricultural ecosystems, high soil N levels primarily result from fertilization (Chen et al., 2020). In contrast, natural ecosystems experience minimal anthropogenic disturbance, N often acts as the key limiting factor for microbial activity (Elser et al., 2007). Under N-limited conditions, microbes (both fungi and bacteria) allocate more energy and C resources to the synthesis of N-acquiring enzymes (e.g., proteases and chitinases). This shift in metabolic strategy reduces the C allocated to biomass synthesis, thereby diminishing the amount of C ultimately converted into microbial necromass (Mooshammer et al., 2014; Liu et al., 2024). Thus, although microbial community composition differs between natural and agricultural ecosystems, the regulatory role of soil ratio in shaping their structure and function remains consistent (Han et al., 2024). These potential mechanisms will need to be further addressed by future experimental work.
Notably, as major components of agricultural ecosystems, both dryland and irrigated croplands exhibited significantly greater contributions of FNC and BNC to SOC than submerged paddy soils, although the ratio did not differ significantly among these three systems (Fig. S4). This pattern may reflect similar aeration regimes in dryland and irrigated systems (predominantly oxygenated), leading to comparable decomposition–transformation–mineral association pathways and, thus, similar net contributions of fungal and bacterial residues to SOC (Ghezzehei et al., 2019). By contrast, persistent or periodic flooding in paddy soils induces anoxia, suppresses aerobic decomposition, and shifts metabolic pathways (e.g., denitrification and methanogenesis), potentially suppressing fungal activity or dominance and altering the relative accumulation and turnover of fungal and bacterial necromass (Qiu et al., 2017), resulting in contributions that differ significantly from – and are lower than – those in the other two systems. Flooding can suppress fungi yet also enhance the joint retention of both fungal and bacterial necromass via slower decomposition and mineral protection, yielding unchanged ratios but altered totals or compositional pathways (Chen et al., 2021; Gao et al., 2024).
4.2 Factors driving fungal and bacterial necromass contribution
In addition to ratio explained above, soil clay content was identified as the predominant factor governing the contribution of FNC to SOC in agricultural ecosystems (Fig. 4a), with this contribution being increasing significant with clay content (Fig. S6d). This suggests that soils with higher clay and silt contents generally accumulate greater amounts of microbial residues, particularly those derived from fungi, which can be attributed to the promotion of stable organo-mineral complex formation by abundant fine soil particles (Six et al., 2006; Liang et al., 2017). Furthermore, although agricultural management practices often disturb soil structure, they simultaneously enhance clay enrichment and aggregate formation, thereby providing effective physical protection for the long-term stabilization of fungal-derived C (Chen et al., 2020; Mou et al., 2021; Zhou et al., 2023). In contrast, topographic factors such as elevation were identified as the most influential predictor of the ratio in both agricultural and natural ecosystems (Figs. 4e, f, 5f, 6f), with the ratio increasing significantly with elevation (Fig. S8a). Increasing elevation typically leads to decreased temperature, and increased precipitation (Körner, 2007), conditions favoring fungi over bacteria due to higher enzymatic capabilities and resource-use efficiency of fungi under the environments (Chen et al., 2020; Yu et al., 2022; Zhang et al., 2025). High elevation also results in slower soil development, which can reduce the availability of soil nutrients (Guerrero-Ramírez et al., 2020). This in turn increases environmental stress and restricts bacterial activity, thereby favoring the accumulation and conversion of fungal residues into necromass (Li et al., 2024). Our study further demonstrated that although elevation had a direct effect on the ratio, it also indirectly influenced the ratio by modulating climatic factors, soil physicochemical properties, and biological factors (Figs. 5e, 6e). This may explain why elevation is always integrate other environmental factor effects in the studies of MNC (Cui et al., 2023; Zhang et al., 2025).
4.3 Limitations and uncertainties
Although the present study provides important insights on global patterns and drivers of soil microbial necromass in agricultural and natural ecosystems, we must clarify three limitations. First, the limited data available on microbial characteristics, such as microbial community composition, enzymatic activities, and the content of soil aggregates and minerals hinder exploration of the drivers of soil microbial necromass. Second, it is undeniable that our dataset is unevenly distributed, primarily concentrating on the Northern Hemisphere, with sparse or nearly no data from other regions such as Africa, South America, and Australia (Fig. 1). Additionally, the natural ecosystems in this study were limited to forests and grasslands, excluding other natural habitats such as wetlands and deserts. The uneven distribution of data may reduce the universality of MNC as a key driver of soil carbon pools in global terrestrial ecosystems. Furthermore, the compiled studies employed varied methodologies regarding sampling time, depth, and laboratory protocols. While such heterogeneity is an inherent challenge in global meta-analyses, it likely introduces additional variability and may constrain the direct comparability of certain data points. Therefore, more standardized data from these important areas and biomes are clearly required, and further investigation is warranted to fill the data gaps regarding the contribution of MNC to SOC in terrestrial ecosystems.
The data and R code for this manuscript are available at https://doi.org/10.6084/m9.figshare.28827383 (Lu, 2025).
Our results indicate that, on average, fungal necromass carbon (FNC) contributes approximately twice as much to soil organic carbon (SOC) as bacterial necromass carbon (BNC) across both agricultural and natural ecosystems. The relative contributions of FNC and BNC to SOC were found to be higher in agricultural ecosystems – an effect that is likely to be mediated by differences in soil physicochemical factors. The ratio was significantly higher in natural ecosystems than in agricultural ecosystems, albeit with a modest effect size, and was primarily driven by geographical factors – particularly elevation. Our findings demonstrate that, despite considerable variability among individual sampling sites, statistically significant differences exist between agricultural and natural ecosystems in the contributions of fungal and bacterial necromass carbon (FNC and BNC) to soil organic carbon (SOC), as well as in the ratio, at a global scale. These results are likely to underscore a fundamental divergence in the pathways and mechanisms of carbon turnover and stabilization between these two broad ecosystem types. These insights provide novel evidence that ecosystem management type (agricultural versus natural) is a key determinant of the pathways through which microbial necromass contributes to the global soil organic carbon (SOC) pool. Future studies that integrate microbial community composition with necromass dynamics across a broader range of biomes will be essential to predict ecosystem-specific responses of this critical carbon pool to global change.
The supplement related to this article is available online at https://doi.org/10.5194/essd-18-3697-2026-supplement.
JL performed the data analysis and prepared the original draft. MDB contributed to data interpretation, data conceptualization and provided specific insights during the drafting. WL and HS contributed to data collection. YJ contributed to data analysis. ZW supervised the project and contributed to the original draft. TWC and MDB contributed to manuscript review and editing.
The contact author has declared that none of the authors has any competing interests.
Publisher's note: Copernicus Publications remains neutral with regard to jurisdictional claims made in the text, published maps, institutional affiliations, or any other geographical representation in this paper. The authors bear the ultimate responsibility for providing appropriate place names. Views expressed in the text are those of the authors and do not necessarily reflect the views of the publisher.
We are grateful for the data contributors and the scientific community which made the data accessible and useful for our study.
This work was supported financially by the National Natural Science Foundation of China (grant no. 32160291), the National Key Research and Development Program of China (grant no. 2021YFD2200403-04), the Natural Science Foundation of Hainan province (grant no. 423QN212), the Hainan University Research start-up Fund (grant no. KYQD(ZR)22187), and the Southwest Minzu University National Huang Danian-style Teacher Team Funding Project (2025).
This paper was edited by Peng Zhu and reviewed by Zhenhong Hu and two anonymous referees.
Anderson, T. H. and Domsch, K. H.: Ratios of microbial biomass carbon to total organic carbon in arable soils, Soil Biol. Biochem., 21, 471–479, https://doi.org/10.1016/0038-0717(89)90117-X, 1989.
Angst, G., Mueller, K. E., Nierop, K. G., and Simpson, M. J.: Plant-or microbial-derived? A review on the molecular composition of stabilized soil organic matter, Soil Biol. Biochem., 156, 108189, https://doi.org/10.1016/j.soilbio.2021.108189, 2021.
Bellamy, P. H., Loveland, P. J., Bradley, R. I., Lark, R. M., and Kirk, G. J.: Carbon losses from all soils across England and Wales 1978–2003, Nature, 437, 245–248, https://doi.org/10.1038/nature04038, 2005.
Campitelli, E.: ggnewscale: Multiple Fill and Colour Scales in “ggplot2”, R package version 0.4.8, https://CRAN.R-project.org/package=ggnewscale (last access: 31 May 2023), 2022.
Cao, Y., Ding, J., Li, J., Xin, Z., Ren, S., and Wang, T.: Necromass-derived soil organic carbon and its drivers at the global scale, Soil Biol. Biochem., 181, 109025, https://doi.org/10.1016/j.soilbio.2023.109025, 2023.
Chen, G., Ma, S., Tian, D., Xiao, W., Jiang, L., Xing, A., Zou, A., Zhou, L., Shen, H., Zheng, C., Ji, C., He, H., Zhu, B., Liu, L., and Fang, J.: Patterns and determinants of soil microbial residues from tropical to boreal forests, Soil Biol. Biochem., 151, 108059, https://doi.org/10.1016/j.soilbio.2020.108059, 2020.
Chen, X., Hu, Y., Xia, Y., Zheng, S., Ma, C., Rui, Y., He, H., Huang, D., Zhang, Z., Ge, T., Wu, J., Guggenberger, G., Kuzyakov, Y., and Su, Y.: Contrasting pathways of carbon sequestration in paddy and upland soils, Glob. Change Biol., 27, 2478–2490, https://doi.org/10.1111/gcb.15595, 2021.
Choi, J., Bach, E., Lee, J., Flater, J., Dooley, S., Howe, A., and Hofmockel, K. S.: Spatial structuring of cellulase gene abundance and activity in soil, Front. Environ. Sci., 6, 107, https://doi.org/10.3389/fenvs.2018.00107, 2018.
Clocchiatti, A., Hannula, S. E., Hundscheid, M. P., Klein Gunnewiek, P. J., and de Boer, W.: Stimulated saprotrophic fungi in arable soil extend their activity to the rhizosphere and root microbiomes of crop seedlings, Environ. Microbiol., 23, 6056–6073, https://doi.org/10.1111/1462-2920.15563, 2021.
Cotrufo, M. F., Wallenstein, M. D., Boot, C. M., Denef, K., and Paul, E.: The Microbial Efficiency-Matrix Stabilization (MEMS) framework integrates plant litter decomposition with soil organic matter stabilization: do labile plant inputs form stable soil organic matter?, Glob. Change Biol., 19, 988–995, https://doi.org/10.1111/gcb.12113, 2013.
Crowther, T. W., Sokol, N. W., Oldfield, E. E., Maynard, D. S., Thomas, S. M., and Bradford, M. A.: Environmental stress response limits microbial necromass contributions to soil organic carbon, Soil Biol. Biochem., 85, 153–161, https://doi.org/10.1016/j.soilbio.2015.03.002, 2015.
Cui, W., Li, R., Fan, Z., Wu, L., Zhao, X., Wei, G., and Shu, D.: Weak environmental adaptation of rare phylotypes sustaining soil multi-element cycles in response to decades-long fertilization, Sci. Total Environ., 871, 162063, https://doi.org/10.1016/j.scitotenv.2023.162063, 2023.
Deng, F. and Liang, C.: Revisiting the quantitative contribution of microbial necromass to soil carbon pool: stoichiometric control by microbes and soil, Soil Biol. Biochem., 165, 108486, https://doi.org/10.1016/j.soilbio.2021.108486, 2022.
Ding, Z., Mou, Z., Li, Y., Liang, C., Xie, Z., Wang, J., Hui, D., Lambers, H., Sardans, J., Peñuelas, J., Xu, H., and Liu, Z.: Spatial variation and controls of soil microbial necromass carbon in a tropical montane rainforest, Sci. Total Environ., 921, 170986, https://doi.org/10.1016/j.scitotenv.2024.170986, 2024.
Elser, J. J., Bracken, M. E., Cleland, E. E., Gruner, D. S., Harpole, W. S., Hillebrand, H., Ngai, J. T., Seabloom, E. W., Shurin, J. B., and Smith, J. E.: Global analysis of nitrogen and phosphorus limitation of primary producers in freshwater, marine and terrestrial ecosystems, Ecol. Lett., 10, 1135–1142, https://doi.org/10.1111/j.1461-0248.2007.01113.x, 2007.
Fanin, N., Bezaud, S., Sarneel, J. M., Cecchini, S., Nicolas, M., and Augusto, L.: Relative importance of climate, soil and plant functional traits during the early decomposition stage of standardized litter, Ecosystems, 23, 1004–1018, https://doi.org/10.1007/s10021-019-00452-z, 2020.
Gao, W., Duan, X., Chen, X., Wei, L., Wang, S., Wu, J., and Zhu, Z.: Iron-carbon complex types and bonding forms jointly control organic carbon mineralization in paddy soils, Sci. Total Environ., 953, 176117, https://doi.org/10.1016/j.scitotenv.2024.176117, 2024.
Ghezzehei, T. A., Sulman, B., Arnold, C. L., Bogie, N. A., and Berhe, A. A.: On the role of soil water retention characteristic on aerobic microbial respiration, Biogeosciences, 16, 1187–1209, https://doi.org/10.5194/bg-16-1187-2019, 2019.
Greenwell, B., Boehmke, B., and Cunningham, J.: gbm: Generalized Boosted Regression Models, R package version 2.1.8.1, https://CRAN.R-project.org/package=gbm (last access: 31 May 2023), 2022.
Guerrero-Ramírez, N. R., Pizarro, V., and Turner, B. L.: Soil and microbial nutrient status are heterogeneous within an elevational belt on a neotropical mountain, Pedobiologia, 83, 150689, https://doi.org/10.1016/j.pedobi.2020.150689, 2020.
Han, B., Yao, Y., Wang, Y., Su, X., Ma, L., Chen, X., and Li, Z.: Microbial traits dictate soil necromass accumulation coefficient: A global synthesis, Global Ecol. Biogeogr., 33, 151–161, https://doi.org/10.1111/geb.13776, 2024.
Hobbs, R. J., Hallett, L. M., Ehrlich, P. R., and Mooney, H. A.: Intervention ecology: applying ecological science in the twenty-first century, BioScience, 61, 442–450, https://doi.org/10.1525/bio.2011.61.6.6, 2011.
Hollister, J. W.: elevatr: Access Elevation Data from Various APIs, R package version 0.4.2, https://CRAN.R-project.org/package=elevatr/ (last access: 31 May 2023), 2021.
Kallenbach, C. M., Frey, S. D., and Grandy, A. S.: Direct evidence for microbial-derived soil organic matter formation and its ecophysiological controls, Nat. Commun., 7, 13630, https://doi.org/10.1038/ncomms13630, 2016.
Kassambara, A.: ggpubr: “ggplot2” Based Publication Ready Plots, R package version 0.5.0, https://CRAN.R-project.org/package=ggpubr (last access: 31 May 2023), 2022.
Keith, D. A., Ferrer-Paris, J. R., Nicholson, E., Bishop, M. J., Polidoro, B. A., Ramirez-Llodra, E., Tozer, M. G., Nel, J. L., Nally, R. M., Gregr, E. J., Watermeyer, K. E., Essl, F., Faber-Langendoen, D., Franklin, J., Lehmann, C. E. R., Etter, A., Roux, D. J., Stark, J. S., Rowland, J. A., Brummitt, N. A., Fernandez-Arcaya, U. C., Suthers, I. M., Wiser, S. K., Donohue, I., Jackson, L. J., Pennington, R. T., Iliffe, T. M., Gerovasileiou, V., Giller, P., Robson, B. J., Pettorelli, N., Andrade, A., Lindgaard, A., Tahvanainen, T., Terauds, A., Chadwick, M. A., Murray, N. J., Moat, J., Pliscoff, P., Zager, I., and Kingsford, R. T.: A function-based typology for Earth's ecosystems, Nature, 610, 513–518, https://doi.org/10.1038/s41586-022-05318-4, 2022.
Klink, S., Keller, A. B., Wild, A. J., Baumert, V. L., Gube, M., Lehndorff, E., Meyer, N., Mueller, C. W., Phillips, R. P., and Pausch, J.: Stable isotopes reveal that fungal residues contribute more to mineral-associated organic matter pools than plant residues, Soil Biol. Biochem., 168, 108634, https://doi.org/10.1016/j.soilbio.2022.108634, 2022.
Kock, N.: Common method bias in PLS-SEM: A full collinearity assessment approach, International Journal of e-Collaboration, 11, 1–10, https://doi.org/10.4018/ijec.2015100101, 2015.
Körner, C.: The use of “altitude” in ecological research, Trends Ecol. Evol., 22, 569–574, https://doi.org/10.1016/j.tree.2007.09.006, 2007.
Lembrechts, J. J., van den Hoogen, J., Aalto, J., Ashcroft, M. B., De Frenne, P., Kemppinen, J., Kopecký, M., Luoto, Maclean, M. I. M. D, Crowther, T. W., Bailey, J. J., Haesen, S., Klinges, D. H., Niittynen, P., Scheffers, B. R., Van Meerbeek, K., Aartsma, P., Abdalaze, O., Abedi, M., Aerts, R., Ahmadian, N., Ahrends, A., Alatalo, J. M., Alexander, J. M., Allonsius, C. N., Altman, J., Ammann, C., Andres, C., Andrews, C., Ardö, J., Arriga, N., Arzac, A., Aschero, V., Assis, R. L., Assmann, J. J., Bader, M. Y., Bahalkeh, K., Barančok, P., Barrio, I. C., Barros, A., Barthe, M., Basham, E. W., Bauters, M., Bazzichetto, M., Marchesini, L. B., Bell, M. C., Benavides, J. C., Alonso, J. L. B., Berauer, B. J., Bjerke, J. W., Björk, R. G., Björkman, M. P., Björnsdóttir, K., Blonder, B., Boeckx, P., Boike, J., Bokhorst, S., Brum, B. N. S., Brůna, J., Buchmann, N., Buysse, P., Camargo, J. L., Campoe, O. C., Candan, O., Canessa, R., Cannone, N., and Hik, D. S.: Global maps of soil temperature, Glob. Change Biol., 28, 3110–3144, https://doi.org/10.1111/gcb.16060, 2022.
Lenardon, M. D., Whitton, R. K., Munro, C. A., Marshall, D., and Gow, N. A. R.: Individual chitin synthase enzymes synthesize microfibrils of differing structure at specific locations in the Candida albicans cell wall, Mol. Microbiol., 66, 1164–1173, https://doi.org/10.1111/j.1365-2958.2007.05990.x, 2007.
Liang, C. and Balser, T. C.: Microbial production of recalcitrant organic matter in global soils: implications for productivity and climate policy, Nat. Rev. Microbiol., 9, 75–75, https://doi.org/10.1038/nrmicro2386-c1, 2011.
Liang, C., Schimel, J. P., and Jastrow, J. D.: The importance of anabolism in microbial control over soil carbon storage, Nat. Microbiol., 2, 17105, https://doi.org/10.1038/nmicrobiol.2017.105, 2017.
Liang, C., Amelung, W., Lehmann, J., and Kästner, M.: Quantitative assessment of microbial necromass contribution to soil organic matter, Glob. Change Biol., 25, 3578–3590, https://doi.org/10.1111/gcb.14781, 2019.
Liu, C., Tian, J., Cheng, K., Xu, X., Wang, Y., Liu, X., Liu, Z., Bian, R., Zhang, X., Xia, S., Zheng, J., Li, L., and Pan, G.: Topsoil microbial biomass carbon pool and the microbial quotient under distinct land-use types across China: A data synthesis, Soil Science and Environment, 2, 5, https://doi.org/10.48130/SSE-2023-0005, 2023.
Liu, X., Tian, Y., Heinzle, J., Salas, E., Kwatcho-Kengdo, S., Borken, W., Schindlbacher, A., and Wanek, W.: Long-term soil warming decreases soil microbial necromass carbon by adversely affecting its production and decomposition, Glob. Change Biol., 30, e17379, https://doi.org/10.1111/gcb.17379, 2024.
Li, Y., Wang, S., Yang, Y., Ren, L., Wang, Z., Liao, Y., and Yong, T.: Global synthesis on the response of soil microbial necromass carbon to climate-smart agriculture, Glob. Change Biol., 30, e17302, https://doi.org/10.1111/gcb.17302, 2024.
Lu, J.: Microbial necromass contribution to topsoil organic carbon storage of natural and agricultural ecosystems, figshare [code, data set], https://doi.org/10.6084/m9.figshare.28827383, 2025.
Luo, R., Kuzyakov, Y., Zhu, B., Qiang, W., Zhang, Y., and Pang, X.: Phosphorus addition decreases plant lignin but increases microbial necromass contribution to soil organic carbon in a subalpine forest, Glob. Change Biol., 28, 4194–4210, https://doi.org/10.1111/gcb.16205, 2022.
Ma, T., Zhu, S., Wang, Z., Chen, D., Dai, G., Feng, B., Su, X., Hu, H., Li, K., Han, W., Liang, C., Bai, Y., and Feng, X.: Divergent accumulation of microbial necromass and plant lignin components in grassland soils, Nat. Commun., 9, 3480, https://doi.org/10.1038/s41467-018-05891-1, 2018.
Malik, A. A., Chowdhury, S., Schlager, V., Oliver, A., Puissant, J., Vazquez, P. G., Jehmlich, N., von Bergen, M., Griffiths, R., and Gleixner, G.: Soil fungal: bacterial ratios are linked to altered carbon cycling, Front. Microbiol., 7, 1247, https://doi.org/10.3389/fmicb.2016.01247, 2016.
Mooshammer, M., Wanek, W., Zechmeister-Boltenstern, S., and Richter, A.: Stoichiometric imbalances between terrestrial decomposer communities and their resources: mechanisms and implications of microbial adaptations to their resources, Front. Microbiol., 5, 22, https://doi.org/10.3389/fmicb.2014.00022, 2014.
Mou, Z., Kuang, L., He, L., Zhang, J., Zhang, X., Hui, D., Li, Y., Wu, W., Mei, Q., He, X., Kuang, Y., Wang, J., Wang, Y., Lambers, H., Sardans, J., Peñuelas, J., and Liu, Z.: Climatic and edaphic controls over the elevational pattern of microbial necromass in subtropical forests, Catena, 207, 105707, https://doi.org/10.1016/j.catena.2021.105707, 2021.
Ni, X., Liao, S., Tan, S., Peng, Y., Wang, D., Yue, K., Wu, F., and Yang, Y.: The vertical distribution and control of microbial necromass carbon in forest soils, Global Ecol. Biogeogr., 29, 1829–1839, https://doi.org/10.1111/geb.13159, 2020.
Oksanen, J., Blanchet, F. G., Friendly, M., Kindt, R., Legendre, P., McGlinn, D., and Wagner, H.: vegan: Community Ecology Package, R package version 2.5.7, https://CRAN.R-project.org/package=vegan (last access: 31 May 2023), 2020.
Poggio, L., de Sousa, L. M., Batjes, N. H., Heuvelink, G. B. M., Kempen, B., Ribeiro, E., and Rossiter, D.: SoilGrids 2.0: producing soil information for the globe with quantified spatial uncertainty, SOIL, 7, 217–240, https://doi.org/10.5194/soil-7-217-2021, 2021.
Qiu, H., Zheng, X., Ge, T., Dorodnikov, M., Chen, X., Hu, Y., Kuzyakov, Y., Wu, J., Su, Y., and Zhang, Z.: Weaker priming and mineralisation of low molecular weight organic substances in paddy than in upland soil, Eur. J. Soil Biol., 83, 9–17, https://doi.org/10.1016/j.ejsobi.2017.09.008, 2017.
R Core Team: R: A language and environment for statistical computing, R Foundation for Statistical Computing, Vienna, Austria, https://www.R-project.org (last access: 31 May 2023), 2021.
Rosseel, Y: lavaan: An R package for structural equation modeling, J. Stat. Softw., 48, 1–36, https://doi.org/10.18637/jss.v048.i02, 2012.
Sae-Tun, O., Bodner, G., Rosinger, C., Zechmeister-Boltenstern, S., Mentler, A., and Keiblinger, K.: Fungal biomass and microbial necromass facilitate soil carbon sequestration and aggregate stability under different soil tillage intensities, Appl. Soil Ecol., 179, 104599, https://doi.org/10.1016/j.apsoil.2022.104599, 2022.
Sanaullah, M., Usman, M., Wakeel, A., Cheema, S. A., Ashraf, I., and Farooq, M.: Terrestrial ecosystem functioning affected by agricultural management systems: A review, Soil Till. Res., 196, 104464, https://doi.org/10.1016/j.still.2019.104464, 2020.
Six, J., Frey, S. D., Thiet, R. K., and Batten, K. M.: Bacterial and fungal contributions to carbon sequestration in agroecosystems, Soil Sci. Soc. Am. J., 70, 555–569, https://doi.org/10.2136/sssaj2004.0347, 2006.
Spawn, S. A., Sullivan, C. C., Lark, T. J., and Gibbs, H. K.: Harmonized global maps of above and belowground biomass carbon density in the year 2010, Sci. Data, 7, 112, https://doi.org/10.1038/s41597-020-0444-4, 2020.
Štursová, M., Žifčáková, L., Leigh, M. B., Burgess, R., and Baldrian, P.: Cellulose utilization in forest litter and soil: identification of bacterial and fungal decomposers, FEMS Microbiol. Ecol., 80, 735–746, https://doi.org/10.1111/j.1574-6941.2012.01343.x, 2012.
van Der Heijden, M. G., Bardgett, R. D., and van Straalen, N. M.: The unseen majority: soil microbes as drivers of plant diversity and productivity in terrestrial ecosystems, Ecol. Lett., 11, 296–310, https://doi.org/10.1111/j.1461-0248.2007.01139.x, 2008.
Wang, B., An, S., Liang, C., Liu, Y., and Kuzyakov, Y.: Microbial necromass as the source of soil organic carbon in global ecosystems, Soil Biol. Biochem., 162, 108422, https://doi.org/10.1016/j.soilbio.2021.108422, 2021a.
Wang, B., Liang, C., Yao, H., Yang, E., and An, S.: The accumulation of microbial necromass carbon from litter to mineral soil and its contribution to soil organic carbon sequestration, Catena, 207, 105622, https://doi.org/10.1016/j.catena.2021.105622, 2021b.
Wang, Z., Zhao, M., Yan, Z., Yang, Y., Niklas, K. J., Huang, H., Mipam, T. D., He, X., Hu, H., and Wright, S. J.: Global patterns and predictors of soil microbial biomass carbon, nitrogen, and phosphorus in terrestrial ecosystems, Catena, 211, 106037, https://doi.org/10.1016/j.catena.2022.106037, 2022.
Wickham, H.: ggplot2: elegant graphics for data analysis, Springer-Verlag New York, https://ggplot2.tidyverse.org (last access: 31 May 2023), 2016.
Wu, H., Xiang, W., Ouyang, S., Forrester, D. I., Zhou, B., Chen, L., Ge, T., Lei, P., Chen, L., Zeng, Y., Song, X., Peñuelas, J., and Peng, C.: Linkage between tree species richness and soil microbial diversity improves phosphorus bioavailability, Funct. Ecol., 33, 1549–1560, https://doi.org/10.1111/1365-2435.13355, 2019.
Wu, W., Feng, J., Wang, X., Xiao, J., Qin, W., and Zhu, B.: The response of soil microbial necromass carbon to global change: A global meta-analysis, Catena, 249, 108693, https://doi.org/10.1016/j.catena.2024.108693, 2025.
Xu, S., Song, X., Zeng, H., and Wang, J.: Soil microbial necromass carbon in forests: A global synthesis of patterns and controlling factors, Soil Ecol. Lett., 6, 240237, https://doi.org/10.1007/s42832-024-0237-3, 2024.
Xu, Y., Sun, L., Gao, X., and Wang, J.: Contrasting response of fungal versus bacterial residue accumulation within soil aggregates to long-term fertilization, Sci. Rep., 12, 17834, https://doi.org/10.1038/s41598-022-22064-9, 2022.
Yu, K., van den Hoogen, J., Wang, Z., Averill, C., Routh, D., Smith, G. R., Drenovsky, R. E., Scow, K. M., Mo, F., Waldrop, M. P., Yang, Y., Tang, W., De Vries, F. T., Bardgett, R. D., Manning, P., Bastida, F., Baer, S. G., Bach, E. M., García, C., Wang, Q., Ma, L., Chen, B., He, X., Teurlincx, S., Heijboer, A., Bradley, J. A., and Crowther, T. W.: The biogeography of relative abundance of soil fungi versus bacteria in surface topsoil, Earth Syst. Sci. Data, 14, 4339–4350, https://doi.org/10.5194/essd-14-4339-2022, 2022.
Zhang, B., Zhu, S., Guo, L., Chen, G., Zhang, G., and Li, J.: Elevation-dependent distribution of soil microbial necromass carbon in Pinus densata Mast. Forests, Appl. Soil Ecol., 209, 106049, https://doi.org/10.1016/j.apsoil.2025.106049, 2025.
Zhang, Q., Li, X., Liu, J., Liu, J., Han, L., Wang, X., Liu, H., Xu, M., Yang, G., Ren, C., and Han, X.: The contribution of microbial necromass carbon to soil organic carbon in soil aggregates, Appl. Soil Ecol., 190, 104985, https://doi.org/10.1016/j.apsoil.2023.104985, 2023.
Zhang, X., Jia, J., Chen, L., Chu, H., He, J. S., Zhang, Y., and Feng, X.: Aridity and NPP constrain contribution of microbial necromass to soil organic carbon in the Qinghai-Tibet alpine grasslands, Soil Biol. Biochem., 156, 108213, https://doi.org/10.1016/j.soilbio.2021.108213, 2021.
Zhao, M. and Running, S. W.: Drought-induced reduction in global terrestrial net primary production from 2000 through 2009, Science, 329, 940–943, https://doi.org/10.1126/science.1192666, 2010.
Zhao, X., Tian, P., Liu, S., Yin, P., Sun, Z., and Wang, Q.: Mean annual temperature and carbon availability respectively controlled the contributions of bacterial and fungal necromasss to organic carbon accumulation in topsoil across China's forests, Global Ecol. Biogeogr., 32, 120–131, https://doi.org/10.1111/geb.13605, 2023.
Zhou, R., Liu, Y., Dungait, J. A., Kumar, A., Wang, J., Tiemann, L. K., Zhang, F., Kuzyakov, Y., and Tian, J.: Microbial necromass in cropland soils: A global meta-analysis of management effects, Glob. Change Biol., 29, 1998–2014, https://doi.org/10.1111/gcb.16613, 2023.