the Creative Commons Attribution 4.0 License.
the Creative Commons Attribution 4.0 License.
 | 26 May 2026
A dataset of vertical profiles of O3 and HONO from the hyperspectral vertical remote sensing network in China (2021–2024)
Tiliang Zou
Xiangguang Ji
Shaocong Wei
Wei Tan
Haoran Liu
Photolysis of HONO and O3 in the troposphere is one of the primary sources of OH radical and a fundamental control on atmospheric oxidative capacity. Their vertical distributions and diurnal evolution are therefore essential for elucidating photochemical processes in the planetary boundary layer and the lower free troposphere. Yet long-term, continuous observations of the vertical profiles of HONO, O3, their photolysis frequencies, and the resulting OH production rates remain extremely limited, particularly at multi-regional and interannual scales. Here we present vertical profile measurements of HONO and O3 acquired by the Chinese Hyperspectral Vertical Remote Sensing Network during 2021–2024. The dataset comprises 22 representative sites spanning urban, suburban, plateau, and basin environments, covering diverse surface and climatic regimes. Profiles extend from the surface to 4 km with ∼100 m vertical resolution and ∼15 min temporal resolution. Using the TUV model with co-retrieved aerosol and trace-gas profiles, we derive photolysis frequencies of HONO and O3 and the corresponding OH production rates, P(OH)HONO and P(OH). The observations reveal robust regional patterns in the diurnal and vertical structure of tropospheric photochemical activity. Photolysis frequencies peak near local noon and generally increase with altitude from the surface layer to the upper mixed layer and the lower free troposphere, whereas OH production rates reach their maxima within the boundary layer and decrease with height. Processed using a unified retrieval framework and rigorous quality control, this dataset provides quantitative constraints on the contribution of HONO and O3 photolysis to tropospheric OH, supports improved radical parameterizations in chemical transport models, and enables synergistic multi-platform remote sensing analyses. By delivering the first systematic, long-term vertical profiles of HONO, O3, and their OH production in China, this public dataset fills a critical observational gap and offers a robust basis for investigating the spatiotemporal evolution of tropospheric oxidative capacity across regions and altitude ranges, with substantial scientific significance and long-term applicability. The dataset is available for free at Zenodo (https://doi.org/10.5281/zenodo.18489836, Zou et al., 2026)
- Article
(3628 KB) - Full-text XML
-
Supplement
(5895 KB) - BibTeX
- EndNote


Over the past decade, “the implementation of China's Air Pollution Prevention and Control Action Plan” (2013) and “the Three-Year Action Plan for Defending the Blue Sky” (2018) has led to a marked reduction in fine particulate matter (PM2.5) nationwide (Liu et al., 2023b; Wang et al., 2020). In contrast, ozone (O3) – a secondary pollutant and a major atmospheric oxidant – has continued to increase on average in economically developed regions such as the Beijing–Tianjin–Hebei area, the Yangtze River Delta, and the Pearl River Delta, where it has emerged as the most intractable air-quality problem after PM2.5 (Guo et al., 2023; He et al., 2023a; Li et al., 2020; Lyu et al., 2025; Zou et al., 2025). To address the observational gaps in these and other key regions, we developed a comprehensive dataset. The dataset comprises measurements from 22 ground-based sites across five major regions of China – North, East, Southwest, South, and Central China. Photochemical air pollution is a dominant driver of urban and regional air-quality degradation, characterized by the rapid sunlight-driven accumulation of secondary species, most notably O3 (Dewan and Lakhani, 2022; Donzelli and Suarez-Varela, 2024; Sharma et al., 2025; Wang et al., 2025b). Beyond being a typical secondary pollutant, O3 is a powerful oxidant that exerts substantial impacts on regional climate, ecosystems, and human health (Monks et al., 2015; Sharma et al., 2025; Wang et al., 2025b; Xing et al., 2017). Nitrous acid (HONO), a short-lived reactive nitrogen species, occurs at relatively low concentrations but represents a major primary source of the OH radical, the key “detergent” of the troposphere (Andersen et al., 2023; He et al., 2023c; Song et al., 2023a; Zhang et al., 2023a). In polluted environments, photolysis of HONO can account for 20 %–80 % of total OH production, and its relative importance is particularly pronounced during early morning and late afternoon, when solar elevation is low and alternative OH sources are less efficient (Elshorbany et al., 2010; He et al., 2023c; Zhang et al., 2023a). A quantitative understanding of the formation and transport of both HONO and O3 is therefore essential for elucidating the mechanisms of tropospheric photochemical pollution and for designing effective mitigation strategies.
Despite extensive research on HONO and O3, major gaps persist in observations of their vertical structure and in the parameterization of key photochemical processes, limiting a mechanistic understanding of photochemical air pollution (Liu et al., 2023a; Wang et al., 2018, 2025c; Zhang et al., 2024; Zhu et al., 2025b). Vertical measurements remain particularly sparse, and concurrent profiles of HONO and O3 are largely unavailable (Garcia-Nieto et al., 2018; Song et al., 2023a; Wang et al., 2018, 2025c; Zhu et al., 2025b). China National Environmental Monitoring Center (CNEMC), with more than 2000 surface stations, provides routine measurements of PM2.5, NO2, and SO2, but lacks observations of key photochemical precursors such as HONO and volatile organic compounds (VOCs) (Liu et al., 2023a; Qu et al., 2020; Zhang et al., 2024; Zhu et al., 2025b). More fundamentally, surface observations alone cannot resolve pollutant distributions within the planetary boundary layer or capture variations in vertical atmospheric structure (Wang et al., 2018, 2019, 2025c; Xuan et al., 2025; Zhu et al., 2025b), and exclusive reliance on near-surface data may therefore bias assessments of regional transport and accumulation (Liu et al., 2023a; Wang et al., 2019, 2025c). Spaceborne sensors, including MODIS, CALIPSO, TROPOMI, and OMI, provide global fields of aerosol optical depth (AOD) and vertical column densities (VCDs) for selected trace gases. However, their limited temporal sampling and spatial resolution preclude resolving the fine-scale diurnal variability and fine vertical structure of O3 and HONO (Itahashi et al., 2020; Johnson et al., 2024; Torres et al., 2020; Wang et al., 2025a). Chemical transport models (CTMs) and regional climate models (RCMs) can reproduce the spatiotemporal evolution of pollutants, but their performance depends critically on initial and boundary conditions, and uncertainties in vertical parameterizations – such as turbulent mixing and chemical mechanisms – often lead to substantial biases in simulated profiles (Chambers et al., 2019; Kim et al., 2024; Li et al., 2021; Sekiya et al., 2025; Thürkow et al., 2024). Current in situ and remote-sensing techniques also have intrinsic limitations. Lidar systems provide high-resolution aerosol profiles but are restricted in detectable gaseous species and spatial coverage (Anon, 2023; Johnson et al., 2024; Torres et al., 2020b). Aircraft and balloon soundings yield detailed upper-air observations but are expensive and unsuitable for sustained, long-term monitoring (Johnson et al., 2024; Sekiya et al., 2025; Wang et al., 2025a; Yu et al., 2025). Tower measurements, while valuable near the surface, are height-limited and cannot capture the full vertical variability across the boundary layer (Chambers et al., 2019; Kim et al., 2024; Thürkow et al., 2024).
To address the observational limitations and scientific questions outlined above, we developed a comprehensive dataset of vertical profiles of HONO, O3, and their photolysis frequencies using the Chinese Hyperspectral Vertical Remote Sensing Network. The primary objective is to resolve the vertical structure of HONO and O3 and to quantify the altitude-resolved production of OH radicals from their photolysis. This dataset fills a critical gap in vertical observations of key photochemical species over China and provides a unique basis for assessing the contribution of HONO photolysis to boundary-layer OH budget, the vertical characteristics of O3 formation, and the role of aerosols in modulating photolysis rates. The dataset comprises measurements from 22 ground-based sites across five major regions of China – North, East, Southwest, South, and Central China – collected during 2021–2024. Its core products are high-temporal-resolution vertical profiles of HONO and O3 spanning 0–4 km. Public release of this dataset will enable systematic investigations of the unresolved sources of HONO in the boundary layer and the vertical variability in O3 production sensitivity. When combined with numerical models, the high-resolution vertical information can be used to evaluate and refine photochemical mechanisms, quantify the contribution of HONO photolysis to the tropospheric OH budget, and reduce uncertainties in vertical parameterizations. These advances will, in turn, support robust source attribution of O3 pollution and inform the development of coordinated regional control strategies for PM2.5 and O3. The following sections describe the site distribution, observational and retrieval methods, and the seasonal and diurnal features of the HONO and O3 vertical structures revealed by this dataset.
2.1 Description of the monitoring site
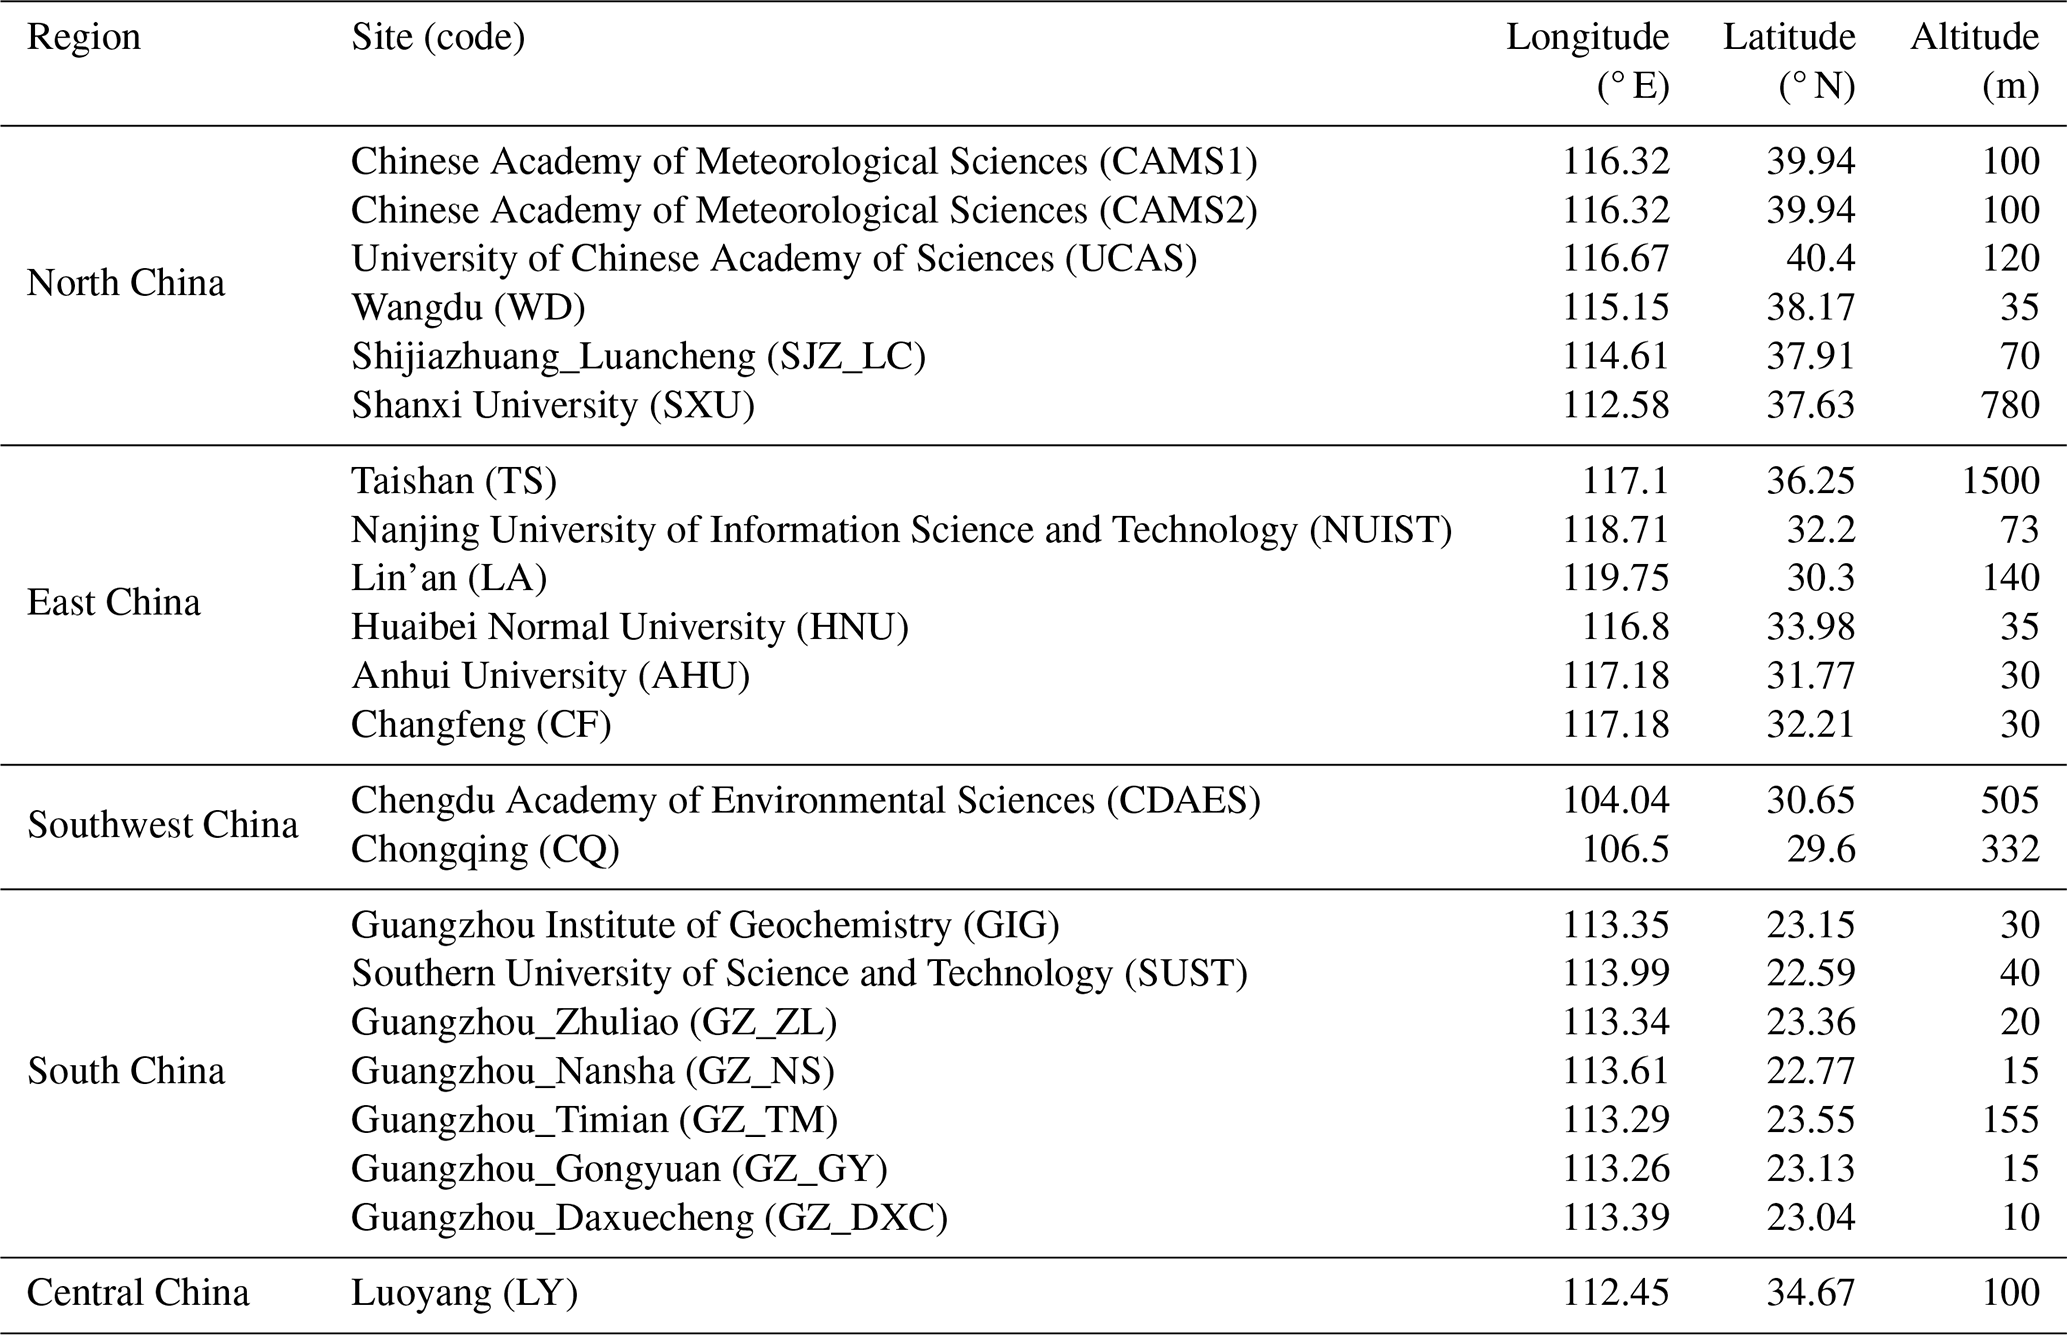
The dataset is derived from 22 hyperspectral ground-based vertical remote sensing stations distributed across five major regions of China – North, East, Southwest, South, and Central China – forming an integrated network that samples a wide range of representative atmospheric environments (Table 1). The sites span urban cores, urban–suburban transition zones, regional background areas, coastal and land–sea interaction regions, as well as plateau, mountain, and basin settings, thereby providing a three-dimensional observational framework for key photochemical species. In North China, stations at the Chinese Academy of Meteorological Sciences (CAMS1, CAMS2) and the University of Chinese Academy of Sciences (UCAS), located within Beijing (∼100–120 m a.s.l.), characterize the heavily urbanized and industrialized core of the Beijing–Tianjin–Hebei megacity cluster. The Wangdu (WD) site in suburban Baoding represents regional background conditions, whereas the Shijiazhuang Luancheng (SJZ_LC) site was included to better resolve pollution features specific to industrial cities. The Shanxi University (SXU) site in the Taihang Mountains (780 m a.s.l.) provides critical constraints on pollutant formation and transport between mountainous terrain and adjacent plains. In East China, stations are distributed across the Yangtze River Delta and its hinterland, covering topography from coastal lowlands to inland mountains. The summit of Mount Tai (TS; 1500 m a.s.l.) offers vertical profiles under relatively clean, high-altitude background conditions. The Nanjing University of Information Science and Technology (NUIST) site represents a densely populated and economically developed urban environment, while sites at Huaibei Normal University (HNU), Anhui University (AHU), and Changfeng (CF) in Anhui Province (30–35 m a.s.l.) capture urban–suburban transition regimes. Southwest China is represented by the Chengdu Academy of Environmental Sciences (CDAES; 505 m a.s.l.) on the Chengdu Plain and the Chongqing (CQ; 332 m a.s.l.) site within the Sichuan Basin. These stations are strategically located to investigate pollutant accumulation and transport under high-humidity conditions and strong topographic confinement, and to probe photochemical processes in complex terrain. In South China, a dense network was established over the Pearl River Delta megacity region. In addition to sites at the Guangzhou Institute of Geochemistry (GIG) and the Southern University of Science and Technology (SUST) in Shenzhen, multiple stations in Guangzhou (Zhuliao, Nansha, Timian, Gongyuan, and Daxuecheng; 15–155 m a.s.l.) form an intra-urban array. This configuration allows detailed examination of the combined influences of land–sea breezes, anthropogenic emissions, and local meteorology on the vertical distributions of HONO and O3. Central China is represented by the Luoyang (LY) site, located in the middle reaches of the Yellow River within a mixed industrial–agricultural region, providing key constraints on regional transport and accumulation over the central plains. Together, the broad geographic coverage and pronounced contrasts in elevation and surface type make this network well suited to resolve the vertical distributions of aerosols, HONO, and O3 across urban, suburban, coastal, mountainous, and basin environments. It thus offers a robust observational basis for investigating the dynamics of photochemical air pollution over major regions of China.
Table 1Geographic information of the stations in the Chinese Hyperspectral Ground-Based Vertical Remote Sensing Network.
2.2 Instrument setup
Between 2021 and 2024, the 22 stations were operated during different periods using a standardized instrument configuration comprising a telescope, a spectrometer, and a control computer. The telescope consisted of a right-angle prism and a plano-convex lens with a full field of view < 0.3°, and was mounted on motorized stages that independently controlled elevation and azimuth angles, enabling multi-directional measurements of atmospheric constituents. The spectrometer covered the ultraviolet (296–408 nm) and visible (420–565 nm) wavelength ranges, while the computer handled instrument control and spectral data acquisition. All sites employed an identical elevation scanning sequence of 1, 2, 3, 4, 5, 6, 8, 10, 15, 30, and 90° (Liu et al., 2022a; Xing et al., 2021a, 2023). The integration time at each elevation angle was 1 min, yielding a full scan cycle of approximately 12 min, which is the total time to complete all elevation measurements and be ready to initiate the next scanning cycle. Routine measurements were conducted during daytime (08:00–18:00 LT – local time). For instrument calibration purposes only, the instruments operated at night to record dark current and electronic offsets. To minimize stratospheric contamination, daytime spectra acquired at solar zenith angles greater than 75° were excluded from further analysis.
2.3 Spectral retrieval
Ultraviolet–visible spectra measured by the ground-based instruments were analysed with the QDOAS software (version 3.2) developed by BIRA-IASB. Differential optical absorption spectroscopy (DOAS) was applied to retrieve the differential slant column densities (DSCDs) of the oxygen dimer (O4), O3, and HONO. For each elevation scan, the zenith spectrum (90° elevation) acquired within the same scanning sequence was used as the reference and subtracted from spectra at lower elevation angles, thereby isolating the narrow-band absorption features of trace gases from broadband structures and enabling robust retrieval of target species. The fitting settings follow Xing et al. (2021a, b, 2024a, b) and are summarized in Table 2. To account for the Ring effect arising from rotational Raman scattering and Fraunhofer line filling-in, a Ring spectrum calculated with DOASIS was included in the fit. Broadband spectral structures were represented and removed using a fifth-order polynomial. This allowing accurate separation of narrow-band molecular absorption. Strict quality control was applied: only retrievals with a root-mean-square (RMS) fitting residual below were retained, ensuring the robustness and stability of the dataset. Representative spectral fits and residuals for O4, O3, and HONO are shown in Fig. 1.
Table 2Detailed retrieval settings for O4, O3, and HONO.
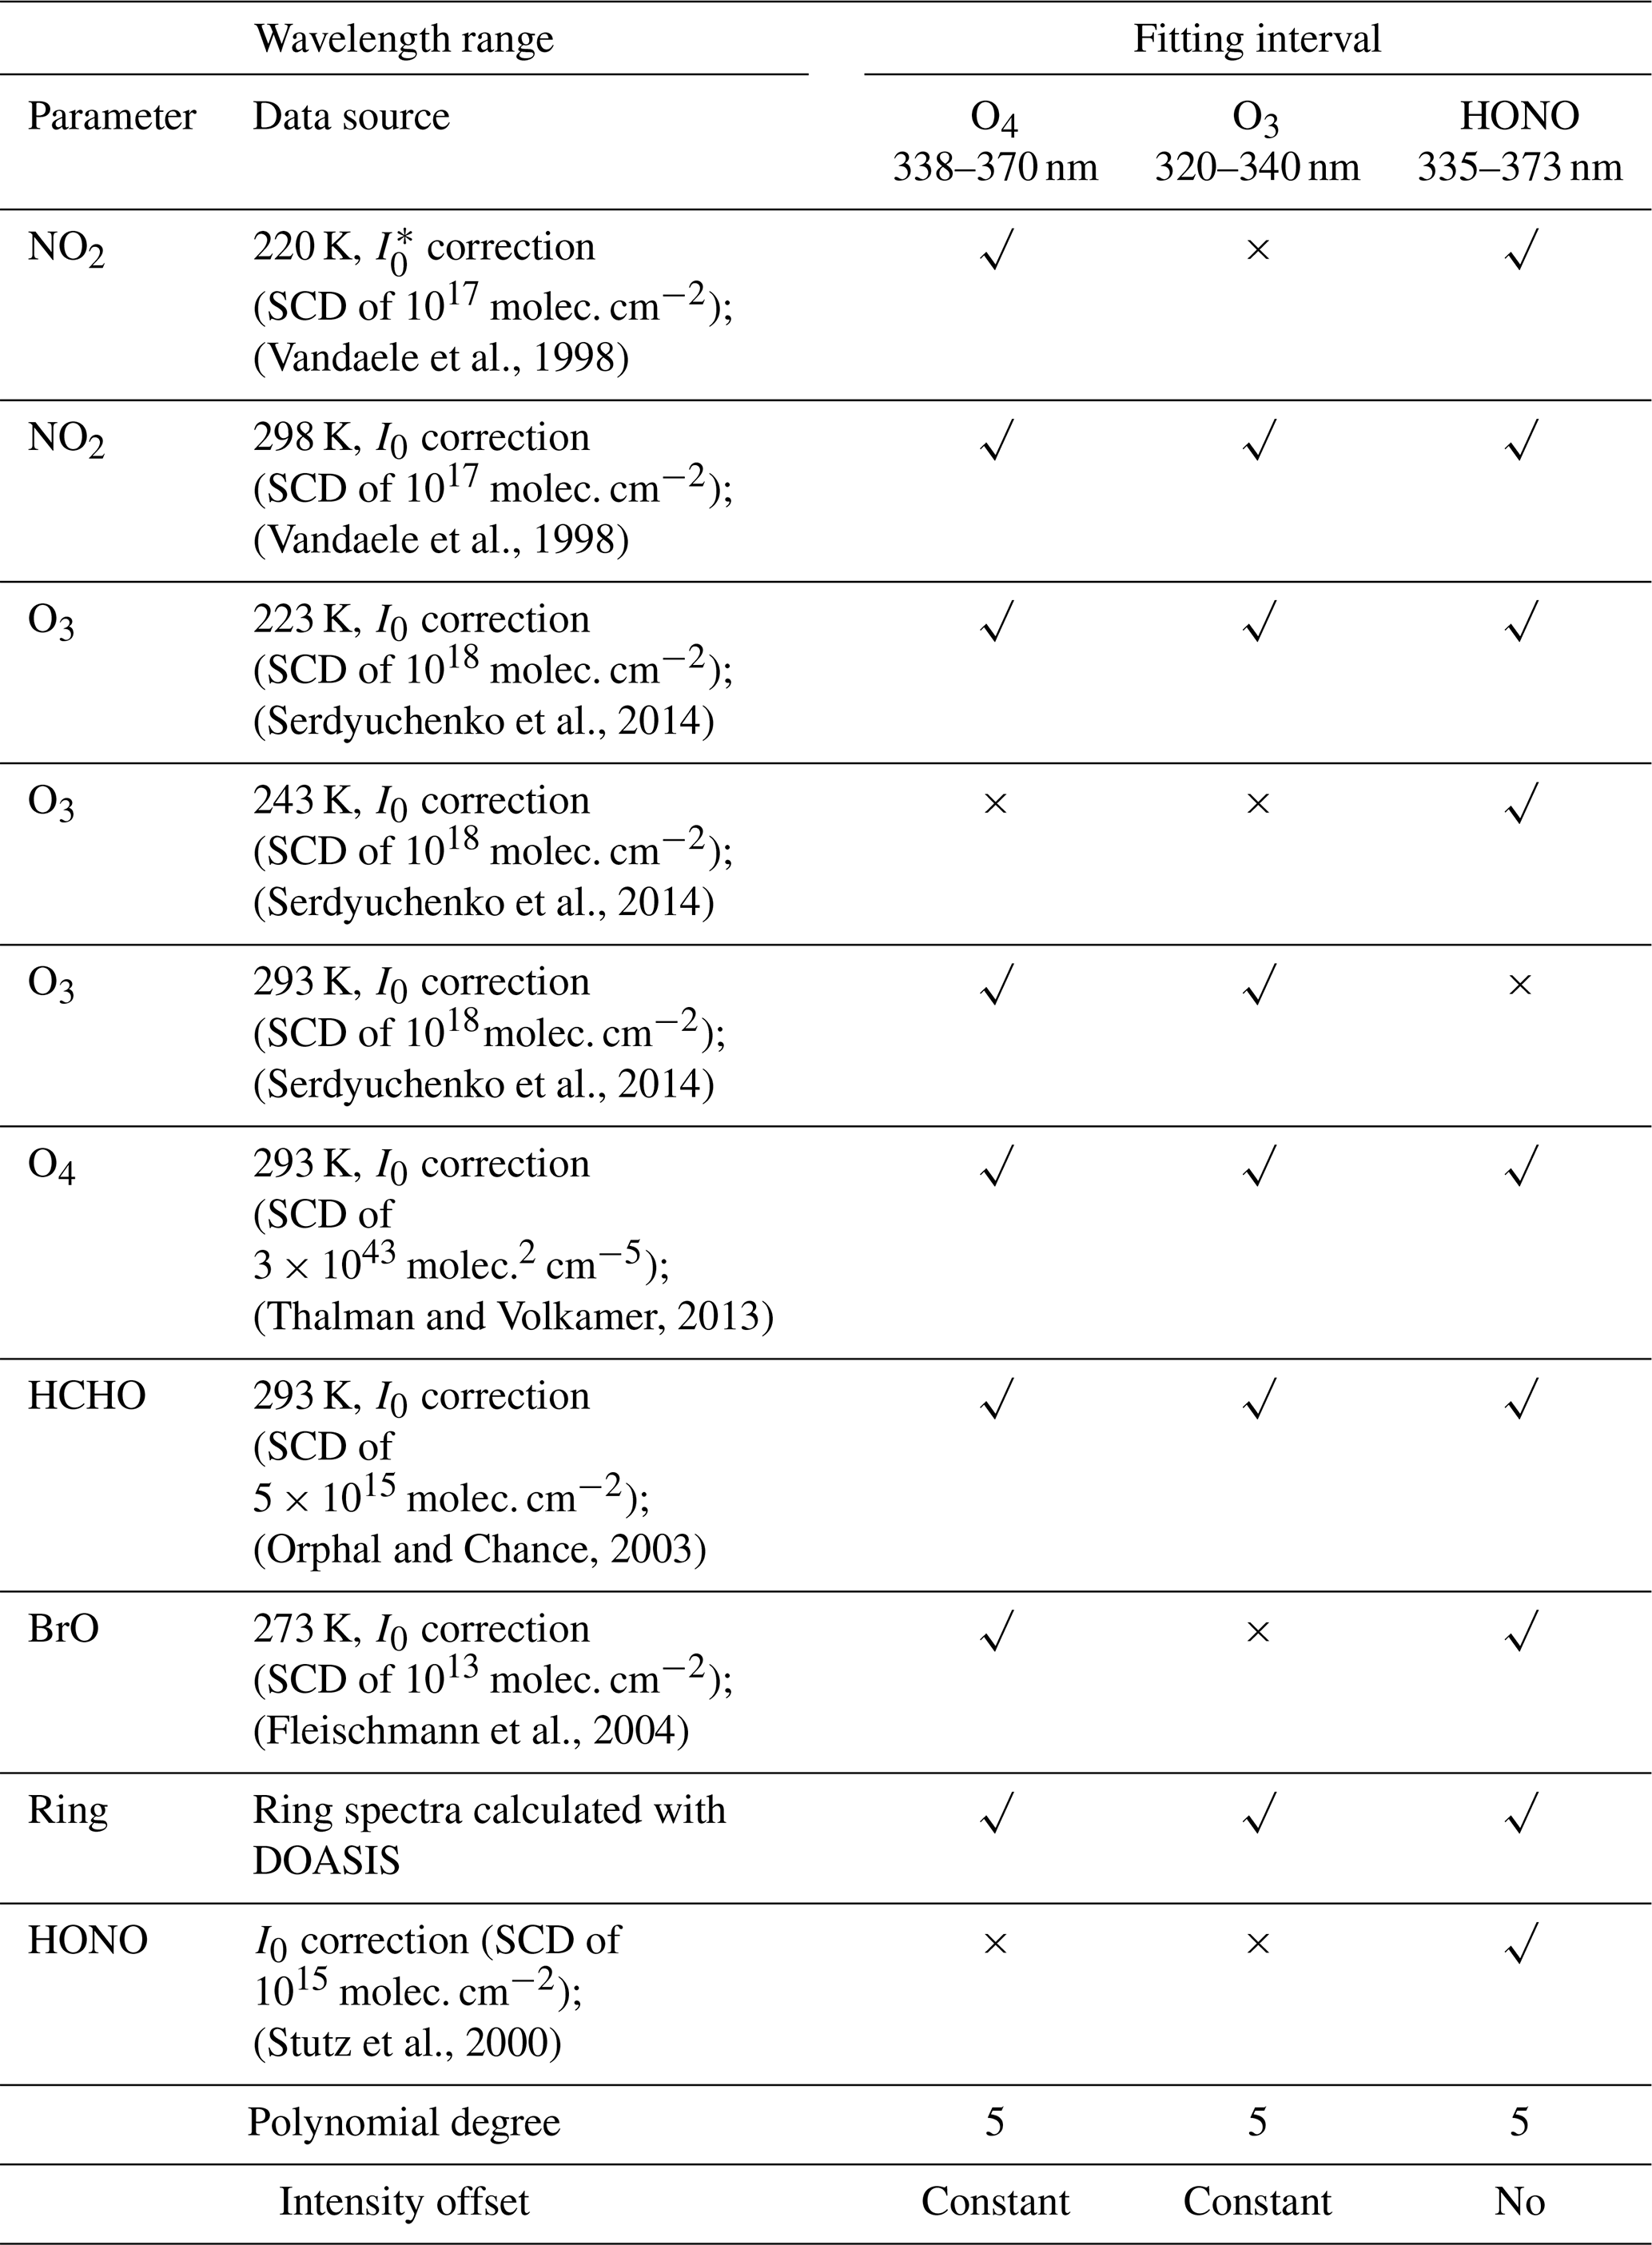
* Solar I0 correction, Aliwell et al. (2002).
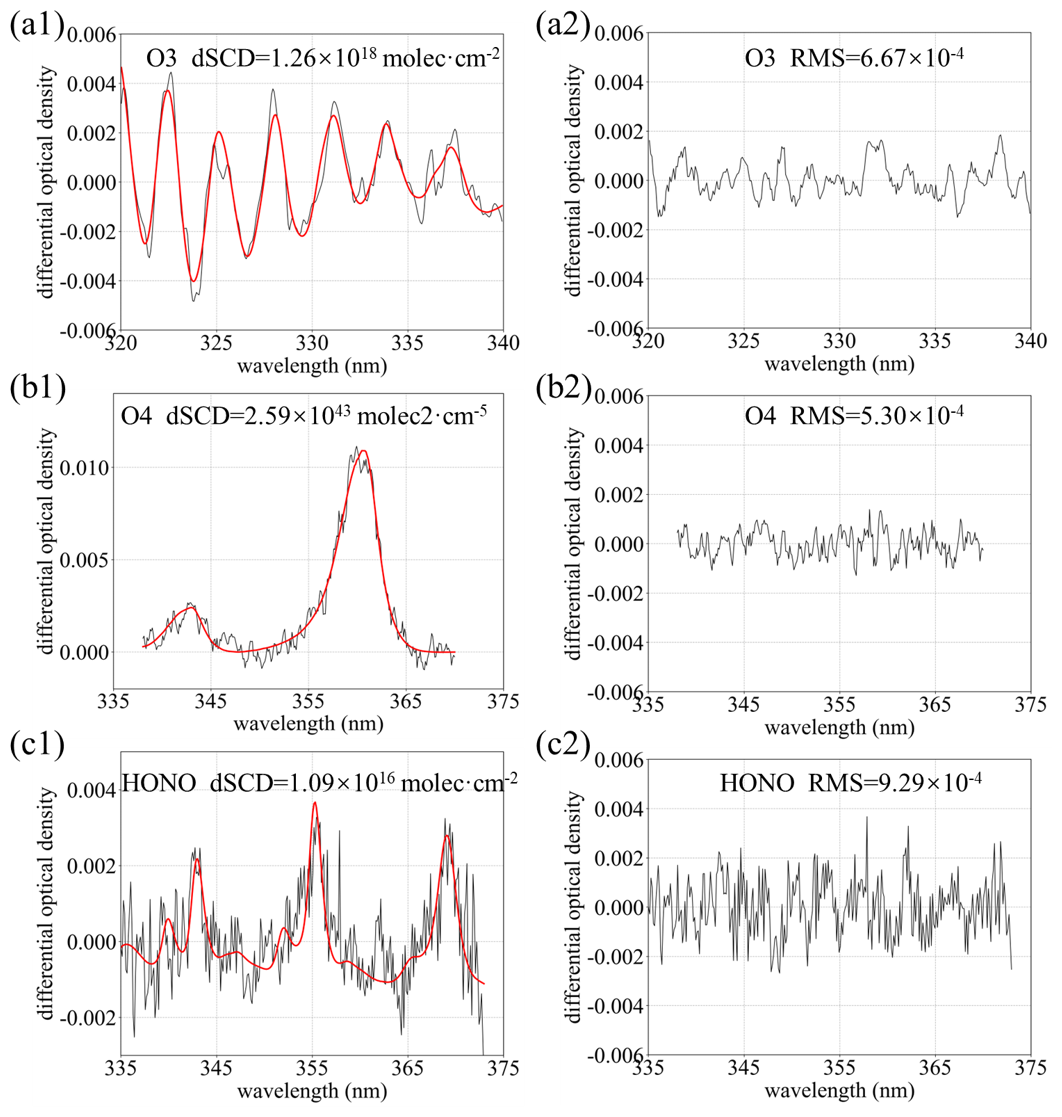
Figure 1(a1) O3, (b1) O4, and (c1) HONO DOAS fitting examples; (a2) O3, (b2) O4, and (c2) HONO fitting residuals.
2.4 Vertical profile retrieval algorithm
Vertical profiles of aerosols and trace gases (HONO and O3) were retrieved using an inversion framework based on the optimal estimation method (OEM). The forward radiative transfer calculations were performed with the linearized pseudo-spherical vector discrete ordinate model VLIDORT (Spurr, 2006). The posterior state vector x was obtained by minimizing the cost function χ2:
where y denotes the measured DSCDs, F(x,b) is the forward model, b represents ancillary meteorological parameters (e.g., temperature, pressure, single-scattering albedo, and asymmetry factor), xa is the a priori state vector, Sε is the measurement error covariance matrix, and Sa is the a priori covariance matrix. For both aerosols and trace gases, the a priori vertical profiles were assumed to decrease exponentially with altitude, reflecting the characteristic rapid decay of pollutant concentrations within the planetary boundary layer. Because the absorption of the O4 is strongly linked to aerosol optical properties, aerosol vertical profiles were first retrieved from multi-elevation O4 DSCDs and subsequently used as inputs to the forward model for the retrieval of O3 and HONO profiles. The atmosphere from the surface to 4 km was discretized into 20 layers with a vertical resolution of 200 m (Xing et al., 2024b). Retrievals were subjected to strict quality control: profiles with degrees of freedom (DOF) below 1.0, χ2 values exceeding 200, or relative uncertainties greater than 50 % were excluded from further analysis.
2.5 TUV model
Photolysis rates of HONO and O3 were computed with the Tropospheric Ultraviolet and Visible (TUV) radiative transfer model developed by NCAR, which is based on rigorous radiative transfer theory and implemented in FORTRAN (https://www2.acom.ucar.edu/modeling/tropospheric, last access: 26 January 2026). The TUV model simulates the propagation of solar radiation in the troposphere under prescribed optical and chemical conditions and provides spectrally resolved photolysis frequencies for key atmospheric reactions. These rates were used to quantify the contributions of HONO and O3 photolysis to OH production. Model inputs included AOD at ∼361 nm derived from MAX-DOAS–retrieved aerosol extinction profiles, total ozone column from daily TROPOMI observations (typically 260–280 DU), and single-scattering albedo (SSA) constrained by regression analyses of O4 absorptions at 361 and 477 nm (Xing et al., 2019).
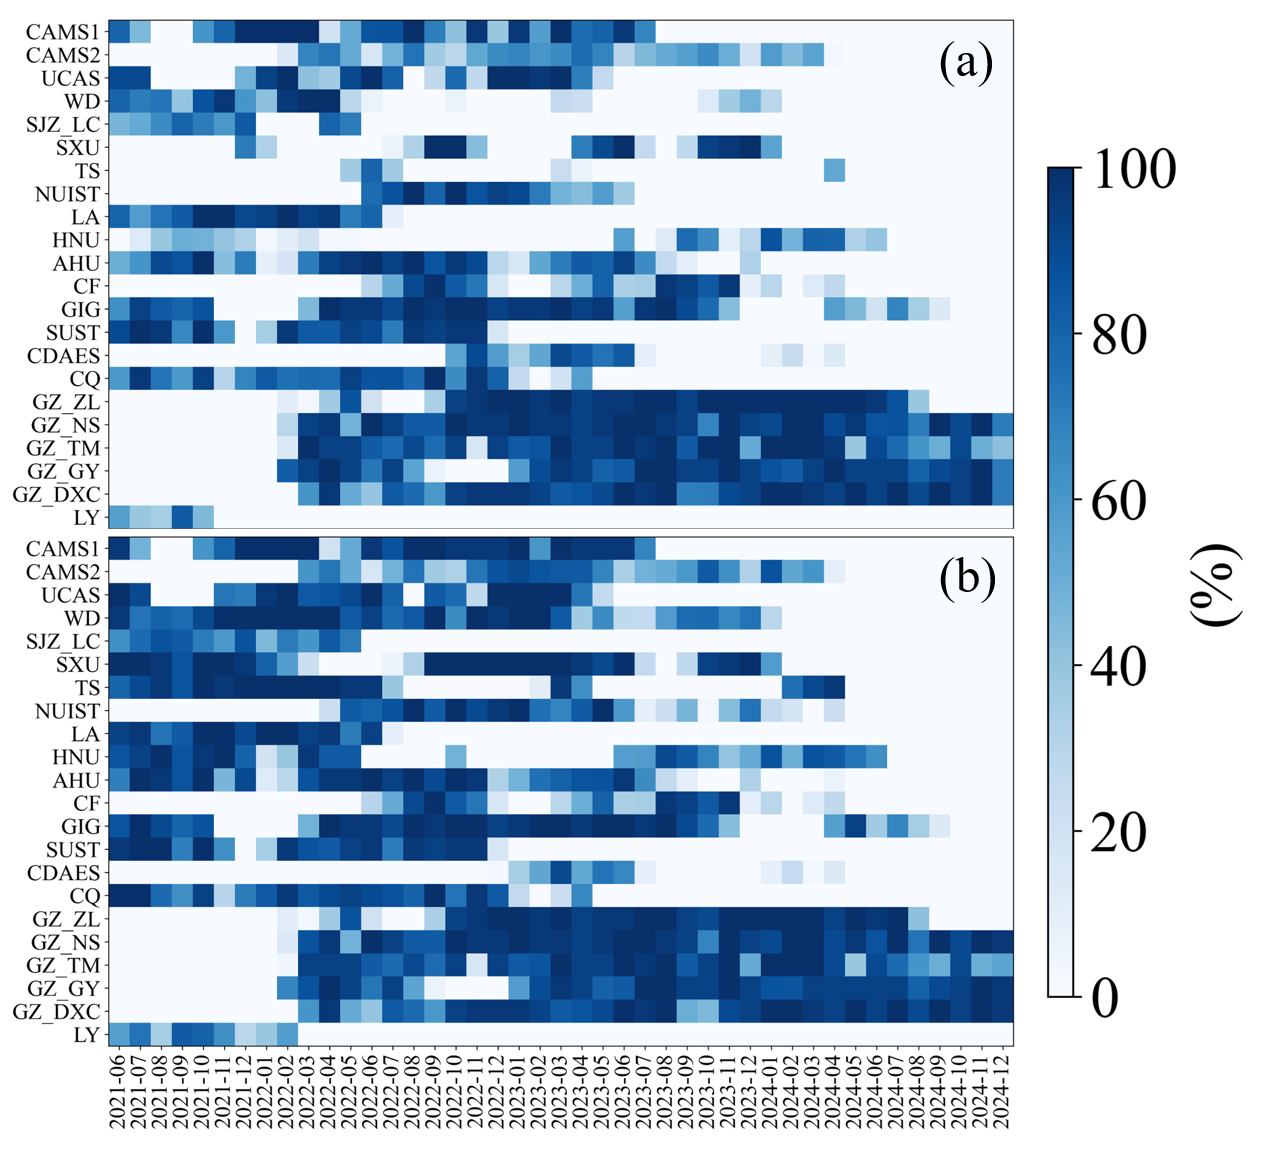
Figure 2 summarizes the monthly completeness of O3 and HONO vertical profile measurements at 22 sites from 2021 to 2024. Shading denotes the fraction of valid observations, with 100 % indicating uninterrupted daytime measurements and successful profile retrievals throughout the month. Because stations were commissioned at different times and operated under varying maintenance and field conditions, the available observation periods differ among sites. Most stations provide long, continuous time series of both HONO and O3. More than 85 % of the sites had operational histories spanning over one year, and 60 % for more than two years, although these periods may include intermittent data gaps due to maintenance, weather, or technical issues, with only quality-controlled valid profiles retained in the dataset, demonstrating the temporal stability of the network. This coverage enables robust characterization of seasonal and diurnal variability under diverse climatic regimes and emission backgrounds. Although a few sites had shorter operational periods owing to instrument commissioning and field constraints, they still delivered several months of continuous high-quality data, which are valuable for regional intercomparison and support analyses of long-term trends and photochemical processes. Isolated months with missing or incomplete data occur at some sites, primarily because of unavoidable factors such as instrument maintenance, power interruptions, persistent cloud or precipitation, and quality-control filtering (e.g., excessive fitting residuals or low DOF in the retrievals).
3.1 HONO
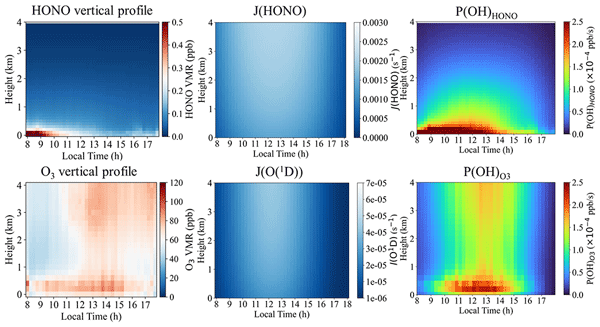
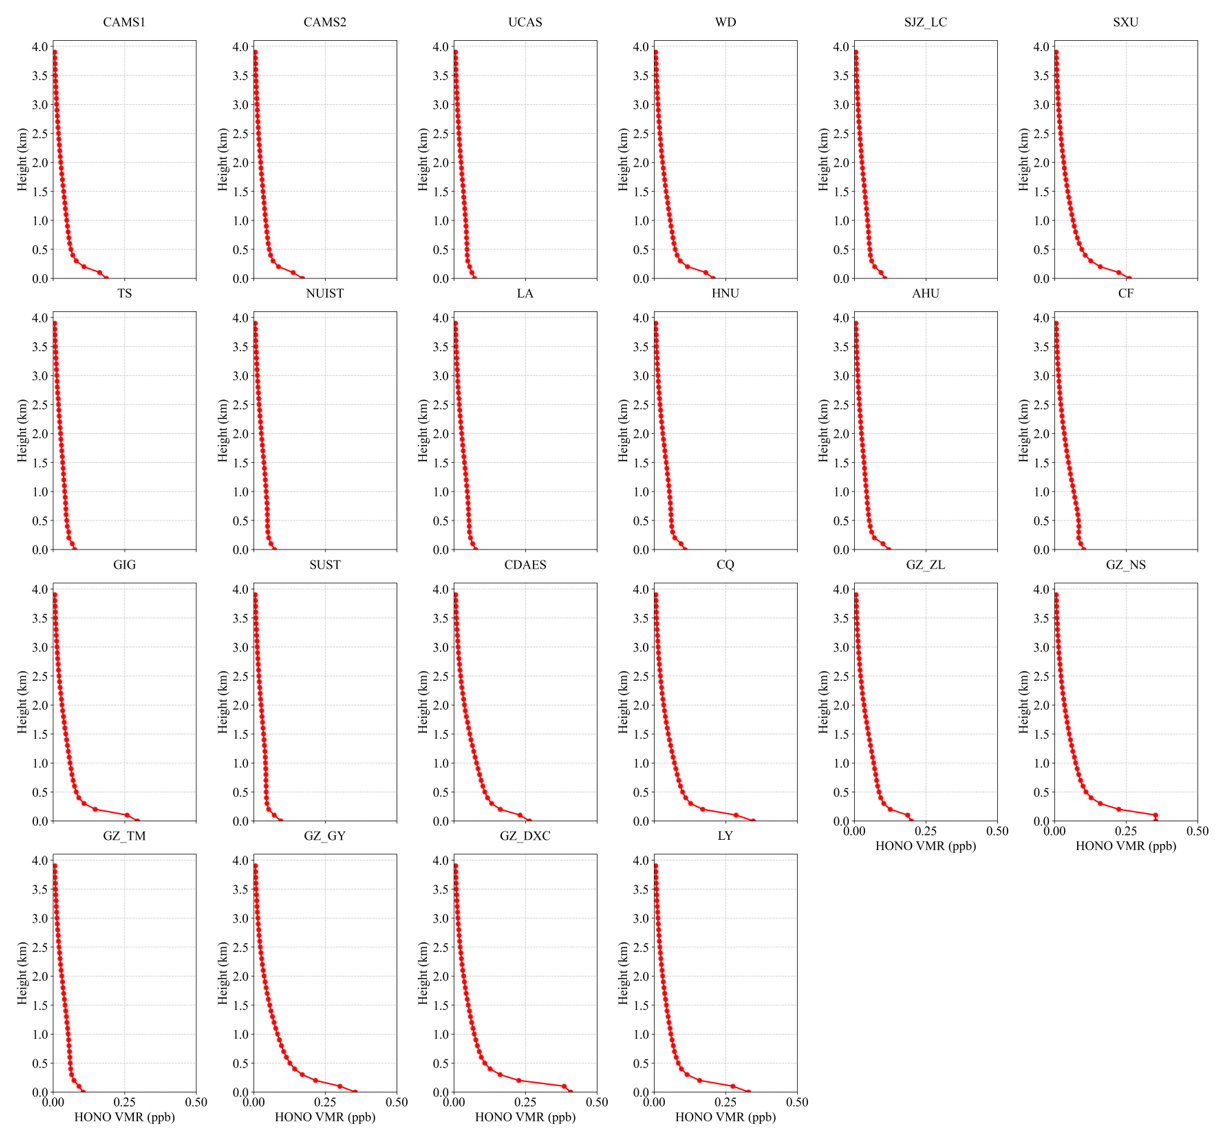
Figure 3 presents the 2021–2024 mean vertical profiles of HONO across all sites. At every location, HONO is strongly enriched near the surface and decreases rapidly with height, following an approximately exponential decay. This structure is characteristic of a boundary-layer-dominated species controlled by ground-based sources (Li et al., 2025b; Meng et al., 2020; Xing et al., 2024b; Xu et al., 2021). Peak mixing ratios occur within the lowest 0–0.5 km, decline sharply between 0.5 and 1.5 km, and generally fall to regional background or near the detection limit above 2 km (<0.05–0.1 ppb), becoming negligible by 4 km. Such steep gradients reflect dominant near-surface emissions and nocturnal heterogeneous formation of HONO from NO2 on ground and aerosol surfaces, combined with its short photochemical lifetime and rapid daytime photolysis, which preclude sustained accumulation in the free troposphere (Li et al., 2025b; Meng et al., 2020; Xing et al., 2024a). Pronounced regional contrasts are evident. Urban sites in North and East China (e.g., CAMS1, CAMS2, WD, SXU, AHU) exhibit the highest near-surface HONO (0.3–0.5 ppb below 0.3 km), followed by a rapid decrease to <0.1 ppb above 1 km. The sharp vertical gradients and absence of secondary maxima aloft indicate strong control by surface sources and nocturnal heterogeneous production, with efficient removal by turbulent mixing and photolysis within the planetary boundary layer (Xu et al., 2021). In contrast, background or relatively clean sites (e.g., TS, LA) show much lower concentrations, with near-surface values typically <0.2 ppb and a monotonic decrease with altitude, consistent with weak local emissions and dominance of regional background (Garcia-Nieto et al., 2018b; Li et al., 2025b). Sites in South and Southwest China (e.g., GZ_ZL, GZ_NS, GZ_DXC, CQ, CDAES) display a similar monotonic decay: elevated HONO confined to the lowest 0–0.5 km and rapid attenuation to background levels above 1–2 km, without a distinct mid-level enhancement. Although near-surface mixing ratios at some locations (e.g., GZ_DXC, CQ) approach or slightly exceed 0.3 ppb, their vertical decay rates are comparable to those at northern and eastern urban sites. This indicates that, even under high humidity or complex topography, HONO remains largely restricted to the lower boundary layer, governed by its short lifetime, fast photolysis, and dilution by convective mixing, while large-scale vertical transport contributes little to its maintenance aloft (Li et al., 2025b; Xing et al., 2021b; Xu et al., 2021). Seasonal mean profiles are shown in Figs. S1–S4 in the Supplement. Taken together, the regionally averaged profiles consistently demonstrate strong near-surface accumulation and rapid vertical attenuation of HONO. This confirms that HONO is a short-lived, boundary-layer-derived reactive nitrogen species, tightly coupled to surface emissions and heterogeneous chemistry. It therefore plays a key role in initiating early-morning OH production and regulating boundary-layer oxidizing capacity, whereas its direct impact in the free troposphere is comparatively minor.
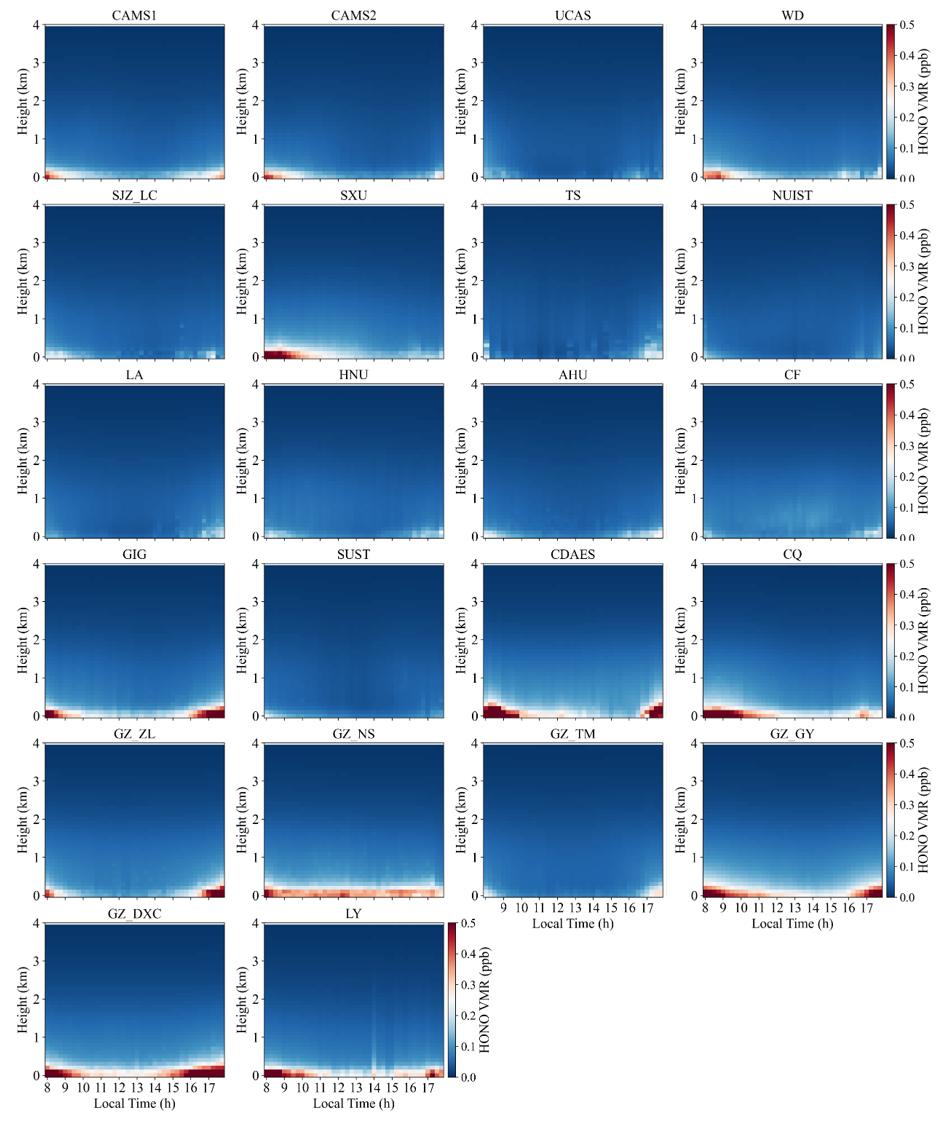
Figure 4 illustrates the mean diurnal evolution of HONO. As a key reactive nitrogen species, HONO exhibits vertical and temporal patterns that integrate the effects of surface emissions, heterogeneous and photochemical processes, and boundary-layer dynamics. Based on HONO data obtained from the hyperspectral vertical remote-sensing network, pronounced regional and site-specific patterns are observed. Across North China (CAMS1, CAMS2, UCAS, WD, SJZ_LC and SXU), HONO exhibits a clear near-surface morning maximum followed by an afternoon minimum. At CAMS1 and CAMS2, the 0–1 km volume mixing ratio (VMR) peaks at 08:00–10:00 LT (0.3–0.4 ppb) and decreases to 0.1–0.2 ppb by 14:00–16:00 LT. This pattern reflects nocturnal accumulation driven by heterogeneous conversion of NO2 on aerosol and ground surfaces (Liu et al., 2022a; Xing et al., 2023; Xuan et al., 2025b); after sunrise, enhanced solar radiation leads to the release and photochemical processing of HONO; meanwhile, morning rush-hour emissions of NO2 and VOCs further promote HONO formation (Garcia-Nieto et al., 2018; Zhang et al., 2025a). At the mountain site SXU, topography-induced temperature inversions enhance nighttime accumulation, yielding a more pronounced morning peak. In contrast, UCAS and WD, characterized by weaker anthropogenic emissions, show lower near-surface HONO levels and smaller diurnal amplitudes. In East China (TS, NUIST, LA, HNU, AHU and CF), urban sites display modest morning enhancements (0.2–0.3 ppb at 08:00–10:00 LT) followed by afternoon decreases driven by boundary-layer growth and photolysis. At the high-altitude TS site (1500 m), HONO remains below 0.1 ppb with weak diurnal variability, reflecting clean background conditions and efficient vertical mixing. Sites with dense vegetation or agricultural land use (LA and CF) may receive contributions from biogenic VOC-related chemistry, but the overall pattern still features a subdued morning maximum (Liang et al., 2017; Ryan et al., 2018a; Xue et al., 2021; Ye et al., 2023a). At South China and Southwest China sites (GIG, SUST, CDAES, CQ and the Guangzhou cluster: GZ_ZL, GZ_NS, GZ_TM, GZ_GY and GZ_DXC), warm and humid conditions together with basin or coastal circulations further modulate the diurnal cycle. Urban stations typically reach 0.3–0.5 ppb near the surface in the morning and decline to 0.1–0.2 ppb in the afternoon. In the Sichuan Basin (CQ), strong nocturnal inversions favour HONO accumulation, producing slightly higher morning peaks (0.4–0.5 ppb). At coastal sites, land–sea breeze circulation leads to a transient morning enhancement followed by dilution by cleaner marine air masses. At the Central China site LY, the diurnal pattern resembles that in North and South China, with a clear morning maximum and lower concentrations in the afternoon associated with boundary-layer development. Seasonal mean diurnal vertical profiles are shown in Figs. S5–S8. Overall, the diurnal cycle of HONO is governed by three coupled processes: (i) nocturnal heterogeneous production from NO2 on aerosol and surface substrates, which drives early-morning maxima (Li et al., 2025b; Meng et al., 2020; Xuan et al., 2024); (ii) enhancement by morning anthropogenic emissions of NOx and VOCs from traffic and industrial activities (Hao et al., 2020; Zhang et al., 2025a, 2023b); and (iii) rapid photolysis and boundary-layer dilution in the afternoon (Xing et al., 2021b, 2024a; Zhang et al., 2023b). Regional contrasts arise from the combined effects of emission intensity, topography (basin, mountain and coastal settings), and meteorological conditions, particularly temperature inversions and ventilation efficiency Li et al., 2025b; Xuan et al., 2024; Zhang et al., 2025a).
3.2 O3
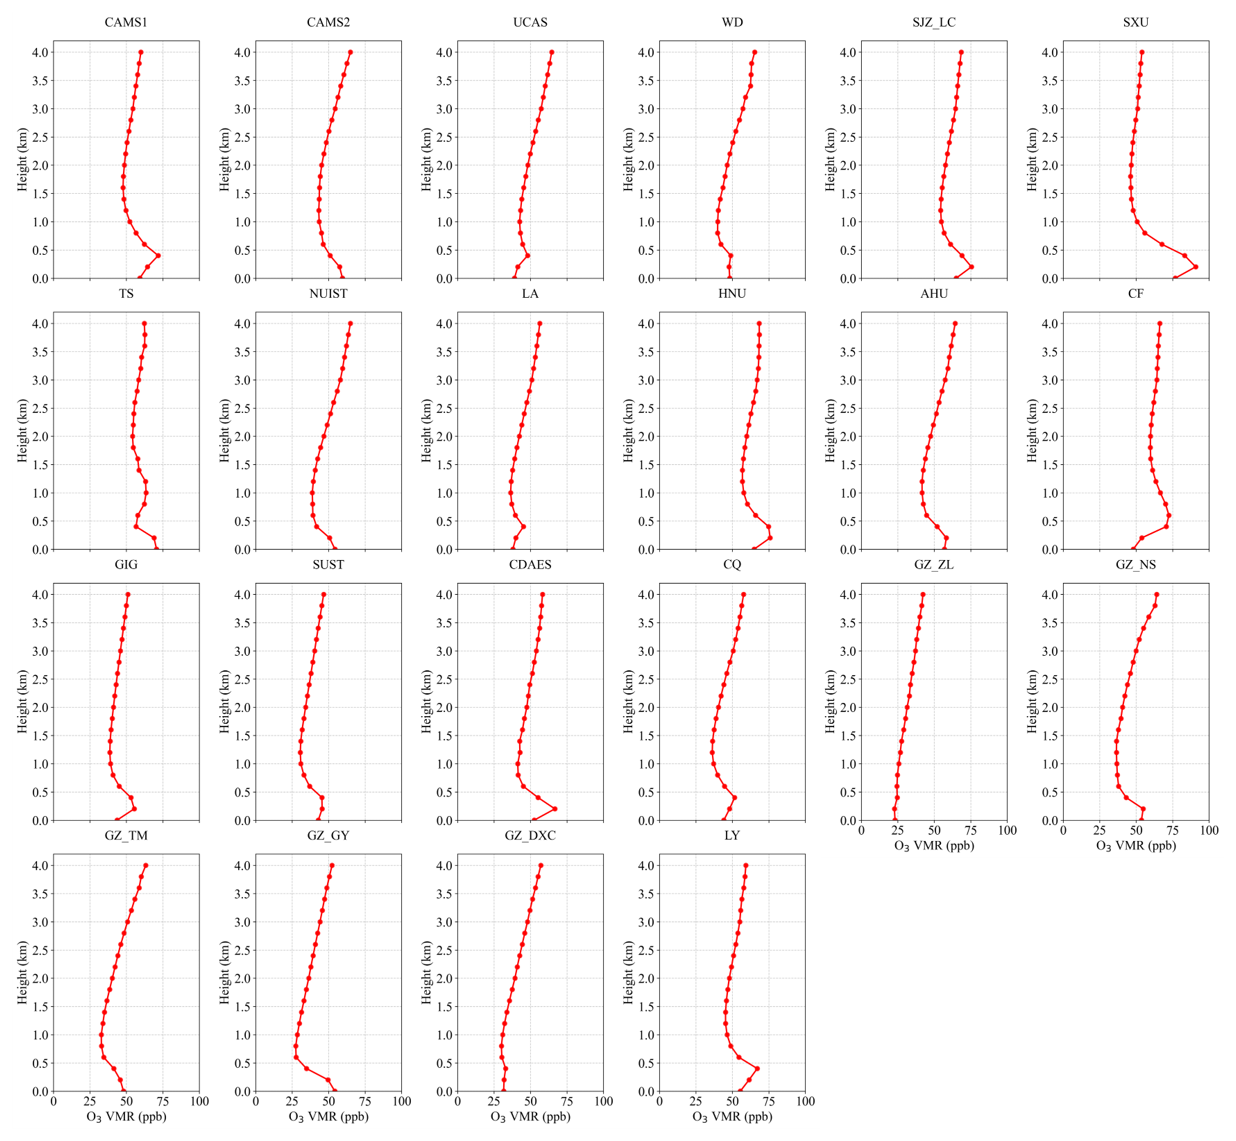
Figure 5 presents the mean vertical profiles of O3 averaged over 2021–2024 for all sites. A consistent “low near the surface–high aloft” structure is observed, characterized by a monotonic increase or a weak S-shaped pattern. O3 VMR are lowest in the lowest 0–0.5 km (20–60 ppb), rise rapidly between 1 and 2 km, and reach daytime maxima at 3–4 km (60–100 ppb). This vertical gradient agrees well with MAX-DOAS and ozone-sonde observations over eastern China and other regions worldwide (Couillard et al., 2021; Ji et al., 2023; Liao et al., 2024; Su et al., 2017; Wang et al., 2018; Zeng et al., 2023), and reflects the combined effects of strong near-surface NO2 titration, dry deposition, and boundary-layer mixing that suppress O3, together with photochemical production and regional transport that enhance O3 aloft (Couillard et al., 2021; Donzelli and Suarez-Varela, 2024; Liao et al., 2024; Zeng et al., 2023; Zhu et al., 2025b). Within the boundary layer (0–1 km), O3 generally increases sharply with height, and a weak local maximum or inflection is often found at 0.2–0.5 km. This contrasts with the vertical distributions of NO2 and HCHO at the same sites, which show high near-surface concentrations dominated by emissions (Couillard et al., 2021; Hu et al., 2024; Hong et al., 2022; Jiao et al., 2025; Liu et al., 2023b). In contrast, O3 is efficiently removed near the ground by nocturnal NO2 titration and daytime surface deposition (Liao et al., 2024; Xing et al., 2022). At urban and suburban stations (e.g., UCAS and CF), O3 in the lowest 0–0.3 km can decrease to 20–40 ppb, indicating strong titration by traffic and industry related NO2 (Hu et al., 2024). Between 1 and 3 km, O3 increases nearly monotonically at most sites, with the largest vertical gradient typically occurring around 2–3 km. This layer often corresponds to the daytime boundary-layer top or the nocturnal residual layer and represents a key altitude for regional photochemical accumulation and downward transport (He et al., 2023b; Liao et al., 2024; Zhu et al., 2025a). Numerous studies have shown that O3-rich air in the upper boundary layer and residual layer can be mixed downward during boundary-layer growth, and that O3 stored aloft at night is re-entrained to the surface the following morning, making an important contribution to surface O3 levels (Ancellet et al., 2024; Donzelli and Suarez-Varela, 2024; Liu et al., 2022b; Shi et al., 2022; Song et al., 2024; Wang et al., 2024b). At 3–4 km, O3 VMR further increase and tend to level off, with some sites exhibiting distinct maxima. At these altitudes, the influence of surface NO2 titration becomes negligible, whereas long-range transport and possible stratosphere–troposphere exchange start to play a role. Previous studies have shown that enhanced O3 at 3–5 km over East Asia in spring and summer can partly arise from stratospheric intrusions and westerly long-range transport (Li et al., 2025a; Liao et al., 2024, 2025; Park et al., 2020). The pronounced O3 enhancements observed at 3–4 km at sites such as CQ, GZ_TM and SUST are therefore likely linked to free-tropospheric background O3 and regional-scale transport processes. Seasonal mean O3 vertical profiles are shown in Figs. S9–S12.
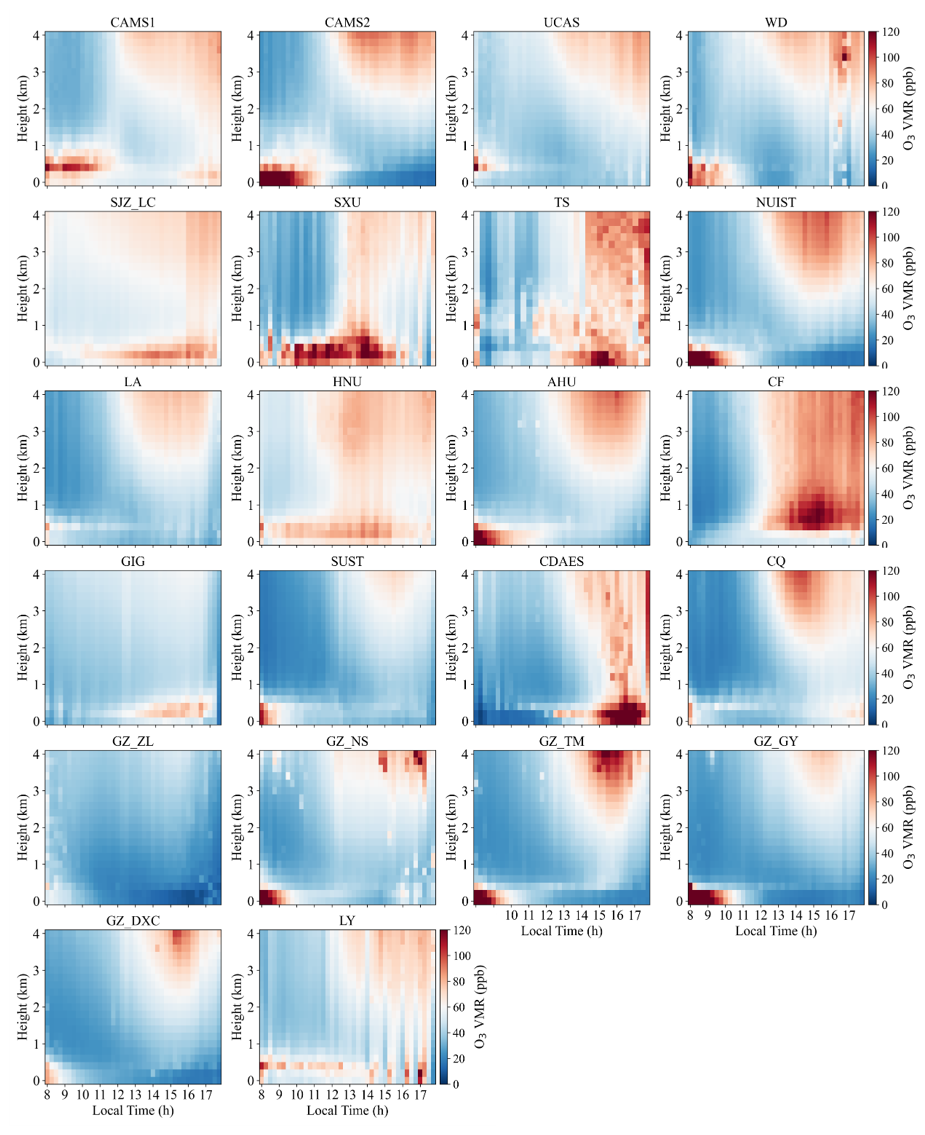
Figure 6 presents the mean diurnal evolution of O3. All sites exhibit pronounced daily cycles with clear regional contrasts. O3 typically peaks in the morning (08:00–10:00 LT) or in the early afternoon (12:00–15:00 LT), in phase with the diurnal variation of solar irradiance and photochemical reaction rates (Xia et al., 2021; Yang et al., 2020). This behaviour is most evident in North and East China, whereas the cycle is weaker in South China, likely owing to persistently high temperature and humidity that modulate boundary-layer development and photochemistry (Zhou et al., 2022). At several sites (e.g., TS, CDAES and CQ), enhanced O3 at 1–2 km during 12:00–15:00 LT points to the influence of local meteorology and emission distributions (Chen et al., 2023; Li et al., 2025a). In contrast, morning maxima at CAMS1, CAMS2, UCAS, NUIST and AHU reflect the rapid re-entrainment and photochemical processing of O3 accumulated overnight after sunrise (David and Nair, 2011; Liao et al., 2023). The vertical structure of the diurnal cycle also differs markedly among regions. North China sites show strong near-surface variability, whereas peak O3 in South China is generally lower, consistent with regional differences in pollution levels and meteorological conditions. Relatively high near-surface O3 at GZ_ZL and GZ_NS is likely linked to local emissions combined with weak dispersion (Yang et al., 2020; Zhou et al., 2022). North China stations (CAMS1, CAMS2, UCAS, WD, SJZ_LC and SXU) display a typical urban O3 diurnal pattern. At CAMS1 and CAMS2, O3 in the 0–1 km layer reaches 80–120 ppb in the morning (08:00–10:00 LT) and decreases markedly in the early afternoon, reflecting rapid boundary-layer growth and photochemical loss after sunrise (David and Nair, 2011; Liao et al., 2023). UCAS and WD show similar morning maxima, whereas SJZ_LC is characterized by lower and more stable O3, indicative of relatively clean background conditions. At SXU, high morning O3 (80–100 ppb) is followed by even higher afternoon levels (>100 ppb), pointing to strong in situ secondary production under intense photochemical activity (Wang et al., 2017; Xia et al., 2021). East China sites (TS, NUIST, LA, HNU, AHU and CF) exhibit more complex diurnal behaviour. At TS, O3 peaks at 1–2 km during 12:00–15:00 LT (80–100 ppb), suggesting an important role of vertical transport and local emissions. NUIST and AHU show morning maxima similar to those in North China, whereas LA maintains low and weakly varying O3, consistent with relatively clean conditions (Chen et al., 2024). At HNU, near-surface O3 increases in the early afternoon (60–80 ppb), reflecting active photochemistry (Wang et al., 2025c). CF shows a pronounced afternoon peak (13:00–17:00 LT, 80–120 ppb), indicating a strong influence of local sources (Xia et al., 2021; Yang et al., 2020). South China sites (GIG, SUST, GZ_ZL, GZ_NS, GZ_TM, GZ_GY and GZ_DXC) differ substantially from those in the north and east. GIG exhibits low and weakly varying O3, representative of background conditions (Chen et al., 2024; Lin et al., 2022). The other sites show morning near-surface maxima (80–100 ppb at 08:00–10:00 LT), followed by decreases associated with rapid boundary-layer development after sunrise (David and Nair, 2011; Liao et al., 2023), and enhanced O3 at 3–4 km in the afternoon (13:00–17:00 LT), highlighting the pronounced vertical structure of O3 pollution in this region. Southwestern sites (CDAES and CQ) display distinct afternoon enhancements at 1–2 km. At CDAES, O3 reaches 80–120 ppb during 15:00–18:00 LT, likely favored by high temperature and humidity that accelerate photochemical production (Yang et al., 2020; Zhang et al., 2022), while CQ shows a similar but weaker enhancement (60–80 ppb). The central China site LY exhibits morning near-surface maxima (60–80 ppb) and elevated O3 at 2–4 km in the afternoon, characteristic of a typical urban diurnal cycle. Seasonal mean diurnal vertical profiles are shown in Figs. S13–S16. These regional contrasts underline the differing controls on O3 across China, with strong local photochemistry in North China, combined regional transport and sustained photochemical production in South China, and mixed influences of emissions and meteorology in East China.
3.3 OH production
Photolysis of HONO and O3 constitutes a primary source of OH radicals and therefore controls the atmospheric oxidation capacity (AOC). To quantify the AOC at each site, we evaluated altitude-resolved OH production from HONO and O3 using retrieved profiles combined with photolysis frequencies calculated by the TUV model. OH production from HONO and O3 was computed from the following expressions.
Here, J(HONO) and J(O(1D)) are the photolysis rate coefficients of HONO and O3, respectively, obtained from the TUV model. O(1D) denotes electronically excited atomic oxygen produced by O3 photodissociation, and f represents the branching fraction of the reaction O(1D) + H2O → 2OH. [HONO] and [O3] are the concentrations of HONO and O3 at each altitude level.
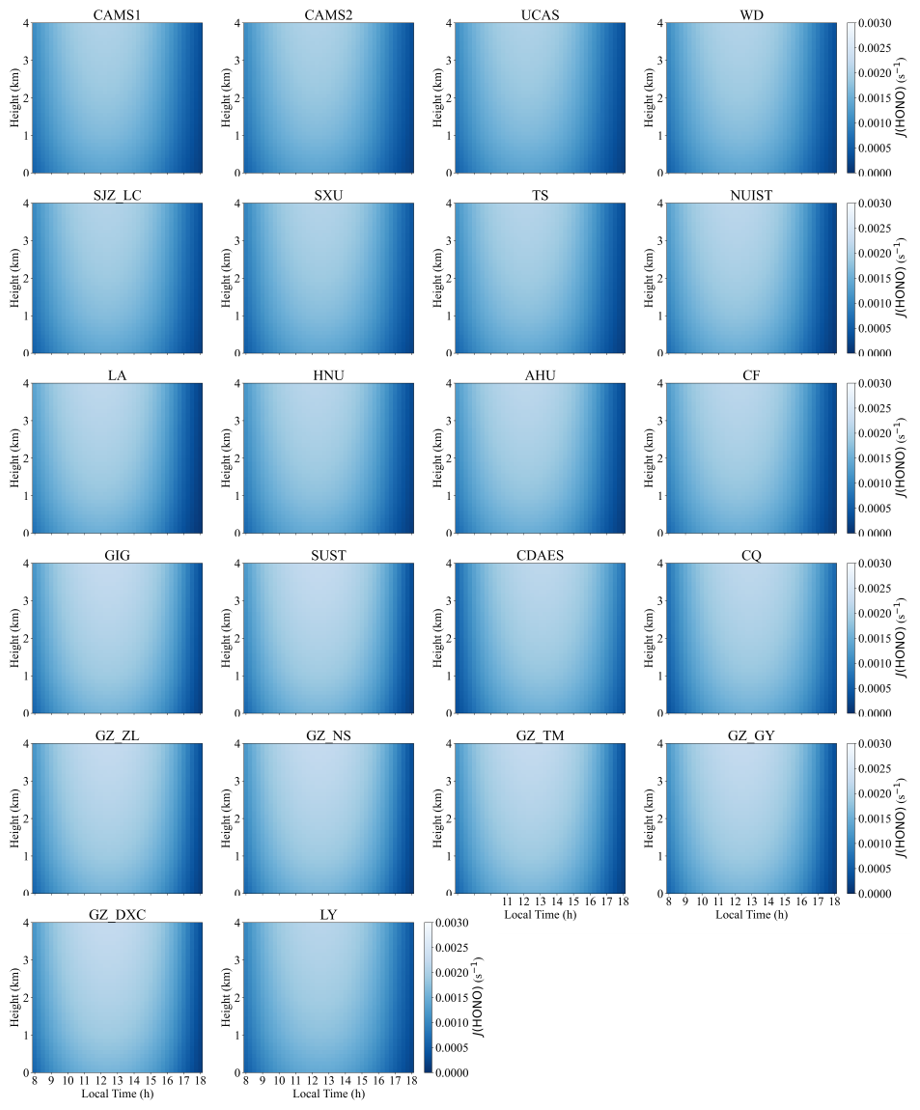
Figure 7 presents the mean diurnal vertical profiles of the HONO photolysis frequency, J(HONO), at 22 sites during 2021–2024; the corresponding seasonal mean diurnal variations are presented in Figs. S17–S20. All sites exhibit a canonical photochemical pattern: J(HONO) increases rapidly after sunrise, reaches a maximum around local noon, and then gradually decreases with increasing solar zenith angle. Elevated values persist between 10:00 and 14:00 LT, with peak J(HONO) typically occurring near 12:00–13:00 LT, indicating that HONO photolysis is primarily controlled by solar irradiance, in agreement with observations in Beijing and Guangzhou (He et al., 2023c; Ryan et al., 2018). Vertically, J(HONO) increases systematically with altitude. Photolysis rates are relatively low in the near-surface layer (0–0.5 km), increase markedly in the upper mixed layer and lower free troposphere (approximately 1–3 km), and reach maxima between 2 and 4 km, with peak values around s−1. This “weaker near the surface and stronger aloft” structure is highly consistent with the J(HONO) profiles reported by Xing et al. (2024a) and reflects the combined effects of aerosol attenuation of ultraviolet radiation in the lower atmosphere and enhanced shortwave actinic flux at higher altitudes (He et al., 2023c; Ryan et al., 2018; Spataro and Ianniello, 2014). At the North China sites (CAMS1, CAMS2, UCAS, WD, SJZ_LC, SXU), J(HONO) exhibits a pronounced diurnal cycle, increasing after sunrise with rising solar radiation, peaking at midday (12:00–14:0,LT) at 0.0020–0.0025 s−1, and decreasing in the afternoon (14:00–18:00 LT). The urban Beijing sites CAMS1 and CAMS2 show peak values of ∼0.0025 s−1, comparable to those at other North China Plain stations (e.g., UCAS and WD), reflecting strong photolysis under high HONO loading and favourable radiation conditions. At SJZ_LC, located at the foothills of the Taihang Mountains, morning J(HONO) is slightly enhanced, likely owing to temperature inversions that modulate the vertical distribution of aerosols and actinic flux. The elevated site SXU (780 m a.s.l.) exhibits systematically higher J(HONO) than lowland stations, with a peak of ∼0.0022 s−1, consistent with reduced aerosol extinction and stronger solar radiation at higher altitude. East China sites (TS, NUIST, LA, HNU, AHU, CF) display similar peak timing to North China but slightly lower magnitudes (0.0015–0.0025 s−1). For example, J(HONO) at NUIST peaks at ∼0.0020 s−1, whereas the high-altitude background site TS (1500 m a.s.l.) reaches ∼0.0021 s−1, consistent with enhanced actinic flux under cleaner atmospheric conditions. In South China (GIG, SUST, GZ_ZL, GZ_NS, GZ_TM, GZ_GY, GZ_DXC), the maximum J(HONO) occurs slightly later in the day (13:00–15:00 LT) and attains higher values (0.0020–0.0030 s−1). The highest peak is observed at GZ_DXC (∼0.0030 s−1), likely reflecting elevated HONO concentrations promoted by warm and humid conditions that favor heterogeneous formation. The southwestern basin site CQ shows a comparable peak (∼0.0025 s−1), while the Central China site LY reaches ∼0.0020 s−1, similar to values in North and East China. Overall, urban sites exhibit larger diurnal amplitudes and 20 %–40 % higher J(HONO) maxima than mountain or clean-background sites, owing to higher HONO abundances and aerosol loading that modulate the effective actinic flux. This behaviour is fully consistent with previous findings from Beijing, Shanghai and other megacities, which reported pronounced daytime enhancement of J(HONO) under high-NO2 and high-HONO conditions (He et al., 2023c; Spataro and Ianniello, 2014; Ye et al., 2023b).
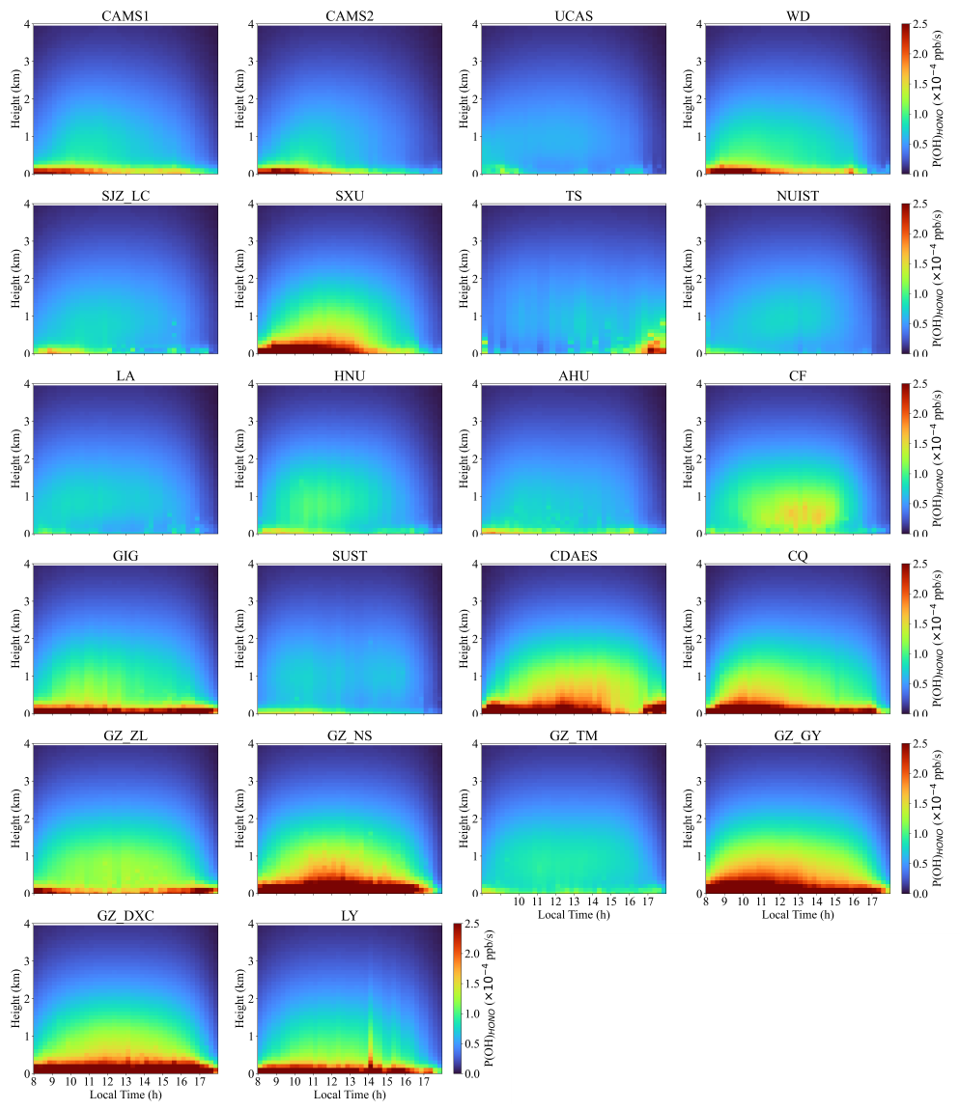
Figure 8 presents the mean diurnal vertical profiles of OH production from HONO photolysis, P(OH)HONO, at 22 sites; the corresponding seasonal mean profiles are shown in Figs. S21–S24. At all sites, P(OH)HONO displays a pronounced unimodal diurnal cycle, increasing rapidly after sunrise, peaking between 10:00 and 14:00 LT, and declining thereafter. The peak timing closely follows the maximum of the J(HONO), whereas the peak altitude remains confined to the near-surface layer, reflecting the strong surface enhancement of HONO. In the lower boundary layer (0–0.5 km), P(OH)HONO attains its column maximum, with most sites peaking between 11:00 and 13:00 LT and reaching – ppb s−1. For all stations, P(OH)HONO is largest within 0–1 km and decreases monotonically with height, consistent with the preferential accumulation of HONO near the surface and the resulting localization of photochemically produced OH (He et al., 2023c; Li et al., 2025b; Xing et al., 2021b; Zhang et al., 2025a). Several sites, including SXU, CDAES, CQ, GZ_NS, GZ_GY, and GZ_DXC, exhibit particularly strong OH production, with peak P(OH)HONO commonly exceeding ppb s−1. This reflects the combined effects of elevated HONO levels and intense solar radiation. At these locations, the high-P(OH)HONO layer can extend to 1–2 km, indicating a deeper photochemically active region. This feature is consistent with earlier reports highlighting the substantial contribution of HONO to OH in the lower free troposphere (Aumont et al., 2003; Crilley et al., 2016; Xue et al., 2025; Zhang et al., 2025a). Vertically, P(OH)HONO decreases rapidly with altitude at all sites and is reduced to 20 %–40 % of its surface value above 2 km, demonstrating that the impact of HONO photolysis on OH is largely confined to the boundary layer. In agreement with previous observations in Beijing and Guangzhou (Gu et al., 2022; Meng et al., 2020; Yu et al., 2022), HONO photolysis represents one of the dominant OH sources during the morning and around local noon, accounting for 30 %–60 % of the daytime OH production near the surface (Song et al., 2023a; Tang et al., 2015). In the present study, several plateau sites show even larger relative contributions at midday, indicating that under conditions of low NO2 and strong solar irradiance, HONO photolysis becomes an especially efficient radical source, consistent with findings at Nam Co (Xing et al., 2024b). Regionally, North China sites (CAMS1, CAMS2, UCAS, WD, SJZ_LC, and SXU) exhibit near-surface (0–1 km) P(OH)HONO maxima between 12:00 and 14:00 LT, with values of – ppb s−1. At CAMS1, the peak reaches ppb s−1, whereas at SJZ_LC, although nocturnal temperature inversions near the Taihang Mountains may favour HONO accumulation, the peak remains modest ( ppb s−1) owing to weaker local emissions, comparable to UCAS and WD (– ppb s−1). At these sites, P(OH)HONO declines sharply with height and is substantially reduced above 1 km, underscoring the near-surface confinement of both HONO and OH production from its photolysis. East China stations (TS, NUIST, LA, HNU, AHU, and CF) show similar peak times (12:00–14:00 LT) but slightly lower magnitudes (– ppb s−1). In South China (GIG, SUST, GZ_ZL, GZ_NS, GZ_TM, GZ_GY, and GZ_DXC), peaks occur later (13:00–15:00 LT) and are substantially higher (– ppb s−1), consistent with enhanced heterogeneous HONO formation under warm and humid conditions. Southwest China sites (CDAES and CQ) reach peak values of ppb s−1, comparable to those in South China, likely owing to basin-induced HONO accumulation and vigorous photochemistry. In Central China (LY), the peak ( ppb s−1 ) is similar to that in North and East China, indicating broadly comparable HONO sources and photolysis efficiencies across these regions.
Figure 9 presents the O3 photolysis frequency, J(O(1D)), at all 22 sites follows a pronounced diurnal cycle, with maxima consistently occurring between 12:00 and 14:00 LT. Seasonal mean diurnal variations are presented in Figs. S25–S28. In North China (CAMS1, CAMS2, UCAS, WD, SJZ_LC, and SXU), near-surface peak J(O(1D)) ranges from to s−1. The urban sites CAMS1, CAMS2, UCAS, and WD reach the highest values (– s−1) at midday. At SJZ_LC, located at the foothills of the Taihang Mountains, nocturnal temperature inversions can favor O3 accumulation (Guo et al., 2024b; He et al., 2021), but the peak remains slightly lower (– s−1), likely constrained by local emissions. At the higher-altitude SXU site (780 m a.s.l.), near-surface J(O(1D)) is reduced (– s−1). Overall, urban stations exhibit larger J(O(1D)) than suburban and rural sites, reflecting higher O3 levels driven by anthropogenic precursors and consistent with reported regional contrasts (Fardilah et al., 2023; Guo et al., 2024a; Qiu et al., 2025).In East China (TS, NUIST, LA, HNU, AHU, and CF), near-surface J(O(1D)) peaks at – s−1, with urban sites such as NUIST and AHU reaching – s−1 at noon. In contrast, the high-altitude TS site (1500 m a.s.l.) shows lower values (– s−1), consistent with its lower O3 burden and cleaner background conditions. South China stations (GIG, SUST, GZ_ZL, GZ_NS, GZ_TM, GZ_GY, and GZ_DXC) display slightly higher peak J(O(1D)) (– s−1), in line with enhanced O3 production under warm and humid subtropical conditions (Lu et al., 2025; Song et al., 2026; Zhang et al., 2025b). In Southwest China (CDAES and CQ), peak values (– s−1) are comparable to those in South China, likely driven by basin topography that favors O3 accumulation and vigorous photochemistry (Qiao et al., 2019; Shu et al., 2023; Wang et al., 2024a). The Central China site LY exhibits slightly lower peaks (– s−1), similar to North and East China, indicating broadly comparable O3 sources and photolysis efficiencies across these regions.
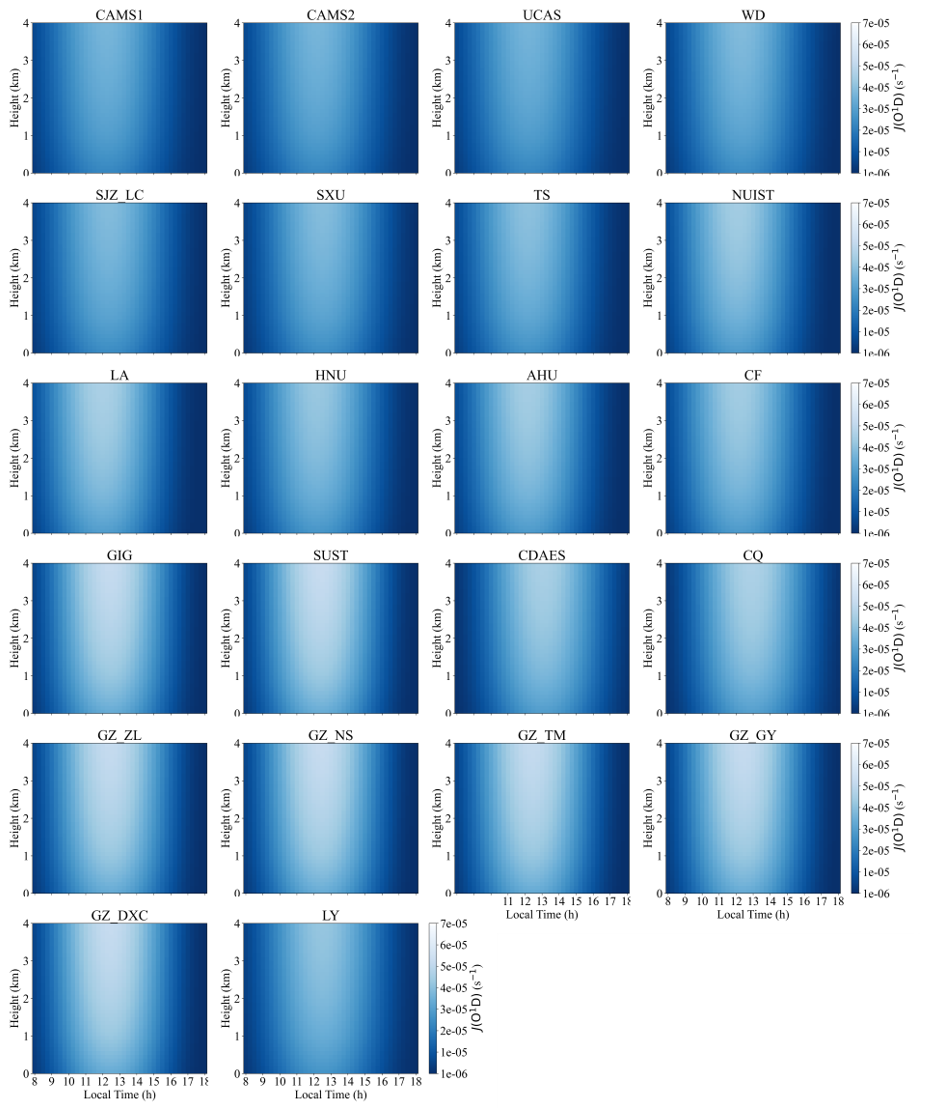
Figure 10 presents the mean diurnal vertical profiles of the OH production rate from ozone photolysis, P(OH), at the 22 sites, and seasonal mean diurnal variations are presented in Figs. S29–S32. All sites exhibit a pronounced unimodal diurnal cycle, with P(OH) increasing rapidly after sunrise, peaking between 12:00 and 14:00 LT, and declining thereafter. The vertical location of the maxima varies markedly among sites: at some, enhanced production is confined to the near-surface layer (0–0.5 km), whereas at others distinct maxima occur at 3–4 km, indicating substantial regional differences in photochemical regimes. Peak P(OH) spans – ppb s−1 across the network. In North China (CAMS1, CAMS2, UCAS, WD, SJZ_LC, and SXU), near-surface P(OH) during 12:00–14:00 LT reaches – ppb s−1. The urban sites CAMS1, CAMS2, UCAS, and WD show the highest values (– ppb s−1), whereas SJZ_LC, likely influenced by local emissions and complex topography, exhibits slightly lower peaks (– ppb s−1). SXU reaches ppb s−1. At all these sites, P(OH) decreases with altitude and generally falls below ppb s−1 above 1 km. East China stations (TS, NUIST, LA, HNU, AHU, and CF) display similar peak timing (12:00–14:00 LT), with near-surface maxima of – ppb s−1. TS, NUIST, HNU, AHU, and CF reach – ppb s−1, while LA peaks at ppb s−1. In South China (GIG, SUST, GZ_ZL, GZ_NS, GZ_TM, GZ_GY, and GZ_DXC), the maxima occur slightly later (13:00–15:00 LT) and are generally higher (– ppb s−1), with GZ_GY reaching ppb s−1 and GZ_NS, GZ_TM, and GZ_DXC ppb s−1. Southwest China (CDAES and CQ) shows peaks of – ppb s−1, including ppb s−1 at CQ and ppb s−1 at CDAES. The Central China site LY exhibits a peak of ppb s−1, comparable to those in North and East China, indicating broadly similar ozone photochemical efficiencies across these regions.
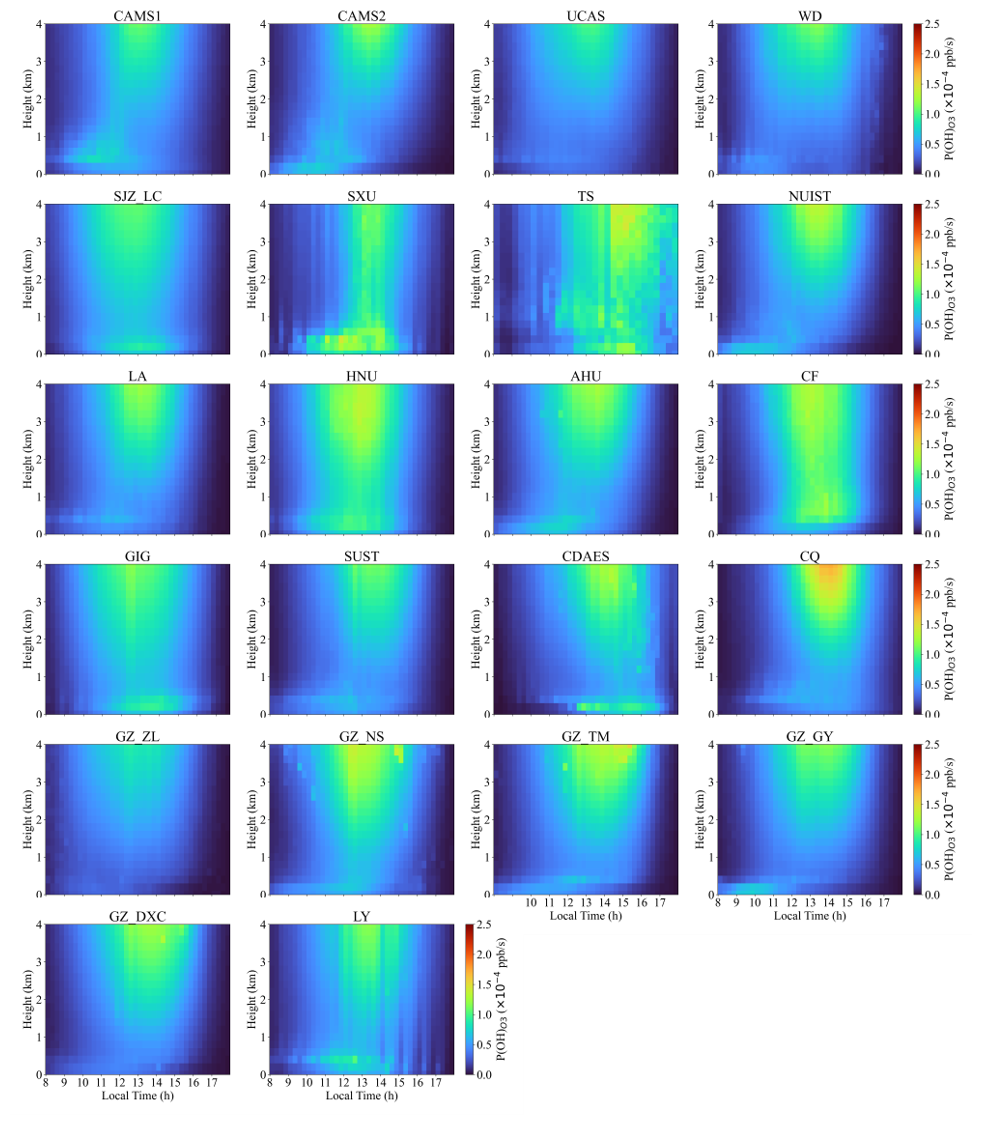
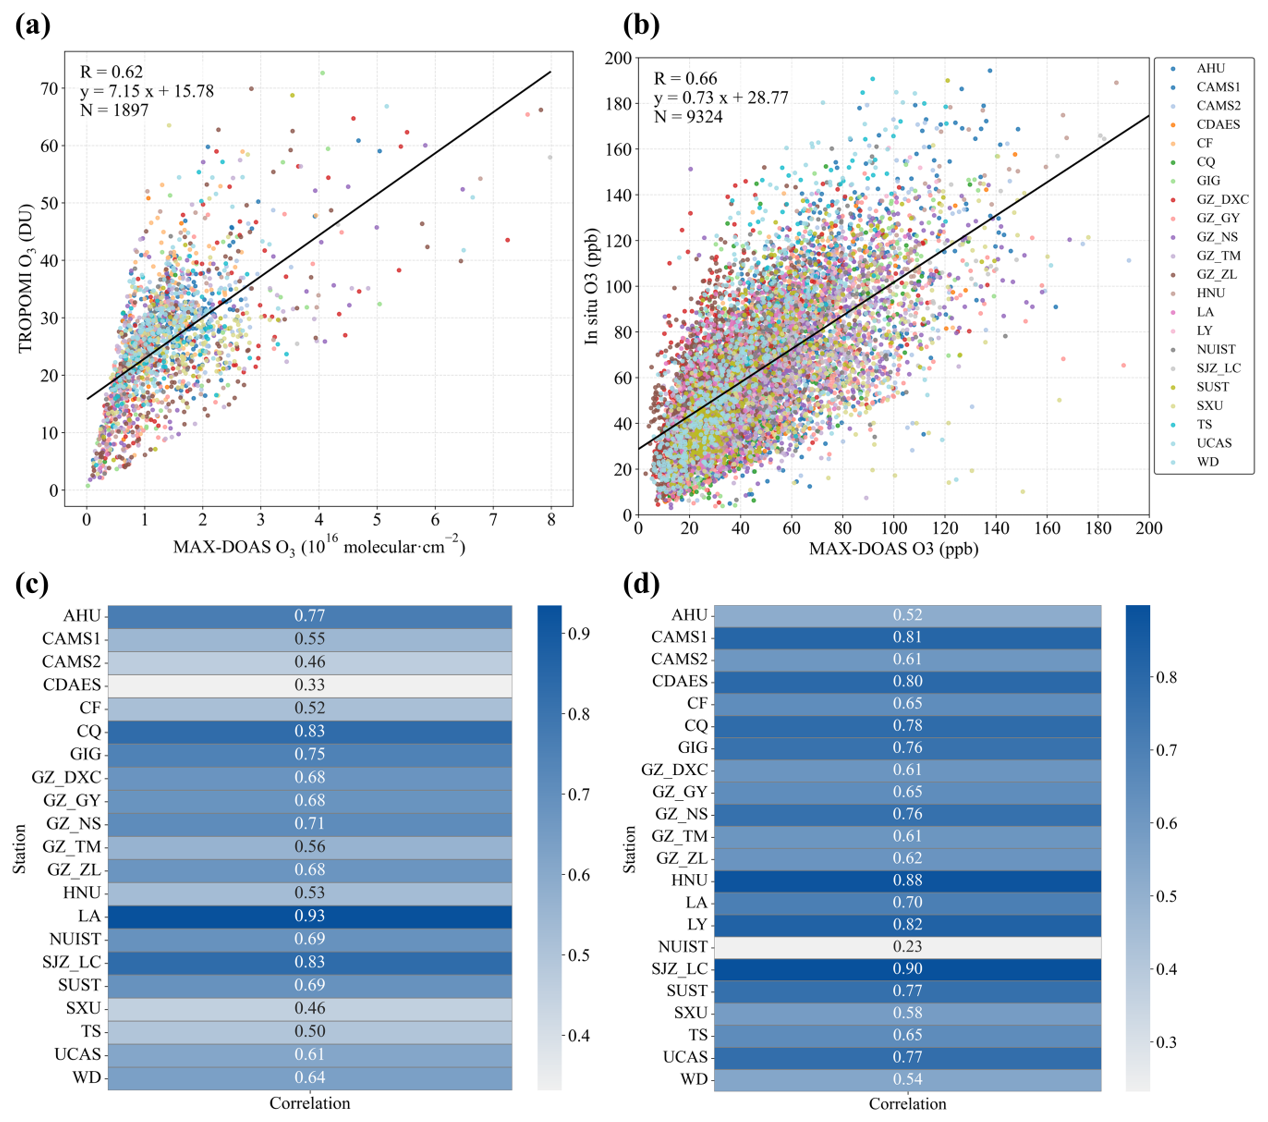
Figure 11(a) Correlation between O3 column densities retrieved from hyperspectral ground-based stations and TROPOMI satellite observations; (b) correlation between hyperspectral O3 column densities and in situ O3 measurements from the nearest CNEMC; (c) site-specific correlations between hyperspectral and TROPOMI O3 column densities; (d) site-specific correlations between hyperspectral O3 column densities and in situ O3 at the nearest CNEMC.
3.4 Validations with independent data
The dataset was validated using two independent approaches. First, O3 VCD retrieved from the MAX-DOAS network for 2021–2024 were evaluated against coincident TROPOMI satellite observations. MAX-DOAS measurements were averaged within ±30 min of the TROPOMI overpass (13:30–14:00 BJT – Beijing Time), and TROPOMI pixels were spatially averaged over a 7 km × 5.5 km area center on each site, consistent with the native spatial resolution of TROPOMI. As shown in Fig. 11a, the two datasets exhibit a strong linear relationship, with a Pearson correlation coefficient of R=0.62 (N=1897); site-resolved correlations are given in Fig. 11c. Second, near-surface O3 concentrations retrieved at the 22 hyperspectral sites were compared with in situ measurements from the nearest CNEMC over the same period. Site pairs were selected following the spatial representativeness criteria of Song et al. (2023b), Specifically, we prioritized the nearest CNEMC station within a maximum distance of ∼10–15 km (detailed in Table S1 in the Supplement) and verified environmental consistency between the paired sites using land-use and satellite-derived products, ensuring that both sites sampled comparable urban or suburban atmospheric conditions. The comparison (Fig. 11b) shows a significant positive correlation (R=0.66, N=9324), demonstrating good consistency between MAX-DOAS-derived surface O3 and ground-based observations. The correlations for each hyperspectral site and its nearest CNEMC are summarized in Fig. 11d. Together, these two independent validations demonstrate reasonable consistency and provide confidence in the dataset used in this study.
The vertical profiles of HONO and O3, and the vertical profiles of OH radicals over the major regions of China presented in this study, are freely available in .xlsx format at Zenodo (https://doi.org/10.5281/zenodo.18489836; Zou et al., 2026).
We developed and released a comprehensive dataset of vertical profiles of HONO and O3, and the associated OH radical production rates, P(OH)HONO and P(OH), derived from the Chinese hyperspectral vertical remote-sensing network for 2021–2024. The dataset spans 22 representative sites across North, East, Central, South, and Southwest China, covering a wide range of climatic regimes and surface types, and represents one of the most extensive publicly available collections in China in terms of spatial coverage and vertical resolution of photochemical parameters relevant to OH precursors. Independent validation against TROPOMI satellite retrievals and in situ measurements from the CNEMC demonstrates robust consistency. Mean diurnal profiles within 0–4 km reveal pronounced regional and vertical contrasts in HONO and O3 driven photochemistry. Both J(HONO) and J(O(1D)) exhibit radiation controlled, single-peaked diurnal cycles, with maxima around local noon (11:00–14:00 LT), and remain elevated in the upper mixed layer and the lower free troposphere, reflecting the combined effects of radiative transfer and aerosol extinction on the vertical distribution of photolysis rates. Accordingly, P(OH)HONO and P(OH) peak near the surface and decrease with height, indicating that the boundary layer is the primary daytime source region of OH. At several plateau and mountainous sites, however, the lower free troposphere also shows a substantial radical production potential. Urban and highly industrialized sites exhibit higher photolysis rates and OH production, reflecting the combined effects of high precursor concentrations and strong radiation, while high-altitude clean-background sites, despite lower near-surface concentrations, maintain relatively large photolysis rates and significant OH production at middle and upper levels due to weaker aerosol extinction and stronger shortwave radiation, showing a vertical photochemical structure distinct from that over plains.
With continuous temporal coverage ranging from five months to 3.5 years and multi-site vertical profiling, this dataset provides a valuable foundation for: (1) quantifying the relative contributions of HONO and O3 photolysis to the OH budget in the boundary layer and the lower free troposphere; (2) constraining radical initial conditions and radiative parameterizations in regional and global chemical transport models; (3) enabling cross-validation and synergistic inversion among ground-based, UAV, and satellite observations; (4) advancing studies of photochemical pollution formation, secondary aerosol production, and atmospheric oxidation capacity; and (5) supporting air-quality management and policy development as a complementary national monitoring resource. (6) serving as a critical benchmark for assessing and reducing uncertainties in vertical parameterization schemes (e.g., turbulent mixing, photolysis rates, heterogeneous reactions) within atmospheric chemical transport models. However, it is important to note the limitations of the current dataset. The time span (2021–2024) limits the capacity for robust analysis of long-term interannual trends driven by climate change or policy shifts. The observed photochemical regimes may not fully represent conditions during extreme climatic years outside this period, and the climatological representativeness of sites with shorter operational histories requires continued data accumulation.
The supplement related to this article is available online at https://doi.org/10.5194/essd-18-3559-2026-supplement.
All authors contributed to the generation of the dataset described in this paper. TZ, CX, and CL wrote the manuscript, while all other authors participated in its revision.
The contact author has declared that none of the authors has any competing interests.
Publisher's note: Copernicus Publications remains neutral with regard to jurisdictional claims made in the text, published maps, institutional affiliations, or any other geographical representation in this paper. The authors bear the ultimate responsibility for providing appropriate place names. Views expressed in the text are those of the authors and do not necessarily reflect the views of the publisher.
We would like to thank every individual involved in the site maintenance process.
This work was supported by the National Natural Science Foundation of China (grant nos. 42588301 and 42225504), the President's Foundation of Hefei Institutes of Physical Science, Chinese Academy of Sciences (grant nos. YZJJQY202401 and BJPY2024B09).
This paper was edited by Yuqiang Zhang and reviewed by three anonymous referees.
Aliwell, S. R., Van Roozendael, M., Johnston, P. V., Richter, A., Wagner, T., Arlander, D. W., Burrows, J. P., Fish, D. J., Jones, R. L., Tørnkvist, K. K., Lambert, J.-C., Pfeilsticker, K., and Pundt, I.: Analysis for BrO in zenith-sky spectra: An intercomparison exercise for analysis improvement, J. Geophys. Res.-Atmos., 107, ACH 10-1–ACH 10-20, https://doi.org/10.1029/2001JD000329, 2002.
Ancellet, G., Viatte, C., Boynard, A., Ravetta, F., Pelon, J., Cailteau-Fischbach, C., Genau, P., Capo, J., Roy, A., and Nédélec, P.: Analysis of the day-to-day variability of ozone vertical profiles in the lower troposphere during the 2022 Paris ACROSS campaign, Atmos. Chem. Phys., 24, 12963–12983, https://doi.org/10.5194/acp-24-12963-2024, 2024.
Andersen, S. T., Carpenter, L. J., Reed, C., Lee, J. D., Chance, R., Sherwen, T., Vaughan, A. R., Stewart, J., Edwards, P. M., Bloss, W. J., Sommariva, R., Crilley, L. R., Nott, G. J., Neves, L., Read, K., Heard, D. E., Seakins, P. W., Whalley, L. K., Boustead, G. A., Fleming, L. T., Stone, D., and Fomba, K. W.: Extensive field evidence for the release of HONO from the photolysis of nitrate aerosols, Sci. Adv., 9, eadd6266, https://doi.org/10.1126/sciadv.add6266, 2023.
Anon: Systematic Evaluation of Four Satellite AOD Datasets for Estimating PM2.5 Using a Random Forest Approach, Remote Sens., 15, 2064–2064, https://doi.org/10.3390/rs15082064, 2023.
Aumont, B., Chervier, F., and Laval, S.: Contribution of HONO sources to the NOx/HOx/O3 chemistry in the polluted boundary layer, Atmos. Environ., 37, 487–498, https://doi.org/10.1016/S1352-2310(02)00920-2, 2003.
Chambers, S. D., Guérette, E.-A., Monk, K., Griffiths, A. D., Zhang, Y., Duc, H., Cope, M., Emmerson, K. M., Chang, L. T., Silver, J. D., Utembe, S., Crawford, J., Williams, A. G., and Keywood, M.: Skill-Testing Chemical Transport Models across Contrasting Atmospheric Mixing States Using Radon-222, Atmosphere, 10, 25, https://doi.org/10.3390/atmos10010025, 2019.
Chen, Z., Xie, Y., Liu, J., Shen, L., Cheng, X., Han, H., Yang, M., Shen, Y., Zhao, T., and Hu, J.: Distinct seasonality in vertical variations of tropospheric ozone over coastal regions of southern China, Sci. Total Environ., 874, 162423, https://doi.org/10.1016/j.scitotenv.2023.162423, 2023.
Chen, Z., Liu, R., Wu, S., Xu, J., Wu, Y., and Qi, S.: Diurnal variation characteristics and meteorological causes of autumn ozone in the Pearl River Delta, China, Sci. Total Environ., 908, 168469, https://doi.org/10.1016/j.scitotenv.2023.168469, 2024.
Couillard, M. H., Schwab, M. J., Schwab, J. J., Lu, C.-H. (S.), Joseph, E., Stutsrim, B., Shrestha, B., Zhang, J., Knepp, T. N., and Gronoff, G. P.: Vertical Profiles of Ozone Concentrations in the Lower Troposphere Downwind of New York City During LISTOS 2018–2019, J. Geophys. Res.-Atmos., 126, e2021JD035108, https://doi.org/10.1029/2021JD035108, 2021.
Crilley, L. R., Kramer, L., Pope, F. D., Whalley, L. K., Cryer, D. R., Heard, D. E., Lee, J. D., Reed, C., and Bloss, W. J.: On the interpretation of in situ HONO observations via photochemical steady state, Faraday Discuss., 189, 191–212, https://doi.org/10.1039/C5FD00224A, 2016.
David, L. M. and Nair, P. R.: Diurnal and seasonal variability of surface ozone and NOx at a tropical coastal site: Association with mesoscale and synoptic meteorological conditions, J. Geophys. Res.-Atmos., 116, https://doi.org/10.1029/2010JD015076, 2011.
Dewan, S. and Lakhani, A.: Tropospheric ozone and its natural precursors impacted by climatic changes in emission and dynamics, Front. Environ. Sci., 10, https://doi.org/10.3389/fenvs.2022.1007942, 2022.
Donzelli, G. and Suarez-Varela, M. M.: Tropospheric Ozone: A Critical Review of the Literature on Emissions, Exposure, and Health Effects, Atmosphere, 15, 779, https://doi.org/10.3390/atmos15070779, 2024.
Elshorbany, Y., Barnes, I., Becker, K., Kleffmann, J., and Wiesen, P.: Sources and cycling of tropospheric hydroxyl radicals – An overview, USF St. Petersburg Campus Faculty Publications, https://doi.org/10.1524/zpch.2010.6136, 2010.
Fardilah, R. D., Turyanti, A., Pangestu, L. A., Dominica, M. V., and Perdinan: Systematic Literature Review on Ozone Dispersion Correlated with Diurnal Concentration Pattern in Urban and Rural Areas, Agromet, 37, 77–90, https://doi.org/10.29244/j.agromet.37.2.77-90, 2023.
Fleischmann, O. C., Hartmann, M., Burrows, J. P., and Orphal, J.: New ultraviolet absorption cross-sections of BrO at atmospheric temperatures measured by time-windowing Fourier transform spectroscopy, J. Photochem. Photobiol. A, 168, 117–132, https://doi.org/10.1016/j.jphotochem.2004.03.026, 2004.
Garcia-Nieto, D., Benavent, N., and Saiz-Lopez, A.: Measurements of atmospheric HONO vertical distribution and temporal evolution in Madrid (Spain) using the MAX-DOAS technique, Sci. Total Environ., 643, 957–966, https://doi.org/10.1016/j.scitotenv.2018.06.180, 2018b.
Gu, R., Shen, H., Xue, L., Wang, T., Gao, J., Li, H., Liang, Y., Xia, M., Yu, C., Liu, Y., and Wang, W.: Investigating the sources of atmospheric nitrous acid (HONO) in the megacity of Beijing, China, Sci. Total Environ., 812, 152270, https://doi.org/10.1016/j.scitotenv.2021.152270, 2022.
Guo, J., Zhang, X., Gao, Y., Wang, Z., Zhang, M., Xue, W., Herrmann, H., Brasseur, G. P., Wang, T., and Wang, Z.: Evolution of Ozone Pollution in China: What Track Will It Follow?, Environ. Sci. Technol., 57, 109–117, https://doi.org/10.1021/acs.est.2c08205, 2023.
Guo, P., Su, Y., Sun, X., Liu, C., Cui, B., Xu, X., Ouyang, Z., and Wang, X.: Urban–Rural Comparisons of Biogenic Volatile Organic Compounds and Ground-Level Ozone in Beijing, Forests, 15, 508, https://doi.org/10.3390/f15030508, 2024a.
Guo, W., Yang, Y., Zhang, J., Han, K., Yang, Y., Chen, Q., Li, S., and Zhu, Y.: Effects of valley topography on ozone pollution in the Lanzhou valley: A numerical case study, Environ. Pollut., 363, 125225, https://doi.org/10.1016/j.envpol.2024.125225, 2024b.
Hao, Q., Jiang, N., Zhang, R., Yang, L., and Li, S.: Characteristics, sources, and reactions of nitrous acid during winter at an urban site in the Central Plains Economic Region in China, Atmos. Chem. Phys., 20, 7087–7102, https://doi.org/10.5194/acp-20-7087-2020, 2020.
He, C., Wu, Q., Li, B., Liu, J., Gong, X., and Zhang, L.: Surface ozone pollution in China: Trends, exposure risks, and drivers, Front. Publ. Health, 11, https://doi.org/10.3389/fpubh.2023.1131753, 2023a.
He, G., He, C., Wang, H., Lu, X., Pei, C., Qiu, X., Liu, C., Wang, Y., Liu, N., Zhang, J., Lei, L., Liu, Y., Wang, H., Deng, T., Fan, Q., and Fan, S.: Nighttime ozone in the lower boundary layer: insights from 3-year tower-based measurements in South China and regional air quality modeling, Atmos. Chem. Phys., 23, 13107–13124, https://doi.org/10.5194/acp-23-13107-2023, 2023b.
He, S., Wang, S., Zhang, S., Zhu, J., Sun, Z., Xue, R., and Zhou, B.: Vertical distributions of atmospheric HONO and the corresponding OH radical production by photolysis at the suburb area of Shanghai, China, Sci. Total Environ., 858, 159703, https://doi.org/10.1016/j.scitotenv.2022.159703, 2023c.
He, Y., Wang, H., Wang, H., Xu, X., Li, Y., and Fan, S.: Meteorology and topographic influences on nocturnal ozone increase during the summertime over Shaoguan, China, Atmos. Environ., 256, 118459, https://doi.org/10.1016/j.atmosenv.2021.118459, 2021.
Hong, Q., Zhu, L., Xing, C., Hu, Q., Lin, H., Zhang, C., Zhao, C., Liu, T., Su, W., and Liu, C.: Inferring vertical variability and diurnal evolution of O3 formation sensitivity based on the vertical distribution of summertime HCHO and NO2 in Guangzhou, China, Sci. Total Environ., 827, 154045, https://doi.org/10.1016/j.scitotenv.2022.154045, 2022.
Hu, Q., Ji, X., Hong, Q., Li, J., Li, Q., Ou, J., Liu, H., Xing, C., Tan, W., Chen, J., Chang, B., and Liu, C.: Vertical Evolution of Ozone Formation Sensitivity Based on Synchronous Vertical Observations of Ozone and Proxies for Its Precursors: Implications for Ozone Pollution Prevention Strategies, Environ. Sci. Technol., 58, 4291–4301, https://doi.org/10.1021/acs.est.4c00637, 2024.
Itahashi, S., Mathur, R., Hogrefe, C., and Zhang, Y.: Modeling stratospheric intrusion and trans-Pacific transport on tropospheric ozone using hemispheric CMAQ during April 2010 – Part 1: Model evaluation and air mass characterization for stratosphere–troposphere transport, Atmos. Chem. Phys., 20, 3373–3396, https://doi.org/10.5194/acp-20-3373-2020, 2020.
Ji, X., Liu, C., Wang, Y., Hu, Q., Lin, H., Zhao, F., Xing, C., Tang, G., Zhang, J., and Wagner, T.: Ozone profiles without blind area retrieved from MAX-DOAS measurements and comprehensive validation with multi-platform observations, Remote Sens. Environ., 284, 113339, https://doi.org/10.1016/j.rse.2022.113339, 2023.
Jiao, P., Xing, C., Li, Y., Ji, X., Tan, W., Li, Q., Liu, H., and Liu, C.: A dataset of ground-based vertical profile observations of aerosol, NO2, and HCHO from the hyperspectral vertical remote sensing network in China (2019–2023), Earth Syst. Sci. Data, 17, 3167–3187, https://doi.org/10.5194/essd-17-3167-2025, 2025.
Johnson, M. S., Rozanov, A., Weber, M., Mettig, N., Sullivan, J., Newchurch, M. J., Kuang, S., Leblanc, T., Chouza, F., Berkoff, T. A., Gronoff, G., Strawbridge, K. B., Alvarez, R. J., Langford, A. O., Senff, C. J., Kirgis, G., McCarty, B., and Twigg, L.: TOLNet validation of satellite ozone profiles in the troposphere: impact of retrieval wavelengths, Atmos. Meas. Tech., 17, 2559–2582, https://doi.org/10.5194/amt-17-2559-2024, 2024.
Kim, H., Park, R. J., Hong, S.-Y., Park, D.-H., Kim, S.-W., Oak, Y. J., Feng, X., Lin, H., and Fu, T.-M.: A mixed layer height parameterization in a 3-D chemical transport model: Implications for gas and aerosol simulations, Sci. Total Environ., 955, 176838, https://doi.org/10.1016/j.scitotenv.2024.176838, 2024.
Li, K., Jacob, D. J., Shen, L., Lu, X., De Smedt, I., and Liao, H.: Increases in surface ozone pollution in China from 2013 to 2019: anthropogenic and meteorological influences, Atmos. Chem. Phys., 20, 11423–11433, https://doi.org/10.5194/acp-20-11423-2020, 2020.
Li, K., Tan, R., Qiao, W., Lee, T., Wang, Y., Zhang, D., Tang, M., Zhao, W., Gu, Y., Fan, S., Zhang, J., Lyu, X., Xue, L., Xu, J., Ma, Z., Latif, M. T., Amnuaylojaroen, T., Gil, J., Lee, M.-H., Bak, J., Kim, J., Liao, H., Kanaya, Y., Lu, X., Nagashima, T., and Koo, J.-H.: Surface and tropospheric ozone over East Asia and Southeast Asia from observations: distributions, trends, and variability, Atmos. Chem. Phys., 25, 11575–11596, https://doi.org/10.5194/acp-25-11575-2025, 2025a.
Li, M., McDonald, B. C., McKeen, S. A., Eskes, H., Levelt, P., Francoeur, C., Harkins, C., He, J., Barth, M., Henze, D. K., Bela, M. M., Trainer, M., de Gouw, J. A., and Frost, G. J.: Assessment of Updated Fuel-Based Emissions Inventories Over the Contiguous United States Using TROPOMI NO2 Retrievals, J. Geophys. Res.-Atmos., 126, e2021JD035484, https://doi.org/10.1029/2021JD035484, 2021.
Li, Y., Xing, C., Peng, H., Jiao, P., Zhang, Q., Liu, C., Sun, Z., Tan, W., and Liu, C.: Vertical Differences in NO2-to-HONO Heterogeneous Conversion and HONO-Driven OH Production over Inland, Coastal, and Island Regions, Environ. Sci. Technol., 59, 26020–26030, https://doi.org/10.1021/acs.est.5c10318, 2025b.
Liang, Y., Zha, Q., Wang, W., Cui, L., Lui, K. H., Ho, K. F., Wang, Z., Lee, S., and Wang, T.: Revisiting nitrous acid (HONO) emission from on-road vehicles: A tunnel study with a mixed fleet, J. Air Waste Manage. Assoc., 67, 797–805, https://doi.org/10.1080/10962247.2017.1293573, 2017.
Liao, Z., Pan, Y., Ma, P., Jia, X., Cheng, Z., Wang, Q., Dou, Y., Zhao, X., Zhang, J., and Quan, J.: Meteorological and chemical controls on surface ozone diurnal variability in Beijing: A clustering-based perspective, Atmos. Environ., 295, 119566, https://doi.org/10.1016/j.atmosenv.2022.119566, 2023.
Liao, Z., Gao, M., Zhang, J., Sun, J., Quan, J., Jia, X., Pan, Y., and Fan, S.: Mixing-layer-height-referenced ozone vertical distribution in the lower troposphere of Chinese megacities: stratification, classification, and meteorological and photochemical mechanisms, Atmos. Chem. Phys., 24, 3541–3557, https://doi.org/10.5194/acp-24-3541-2024, 2024.
Liao, Z., Zhang, J., Gao, M., and Ma, Z.: Widespread stratospheric intrusion influence on summer ozone pollution over China revealed by multi-site ozonesonde and validated EAC4 reanalysis, Atmos. Chem. Phys., 25, 14865–14877, https://doi.org/10.5194/acp-25-14865-2025, 2025.
Lin, H., Xing, C., Hong, Q., Liu, C., Ji, X., Liu, T., Lin, J., Lu, C., Tan, W., Li, Q., and Liu, H.: Diagnosis of Ozone Formation Sensitivities in Different Height Layers via MAX-DOAS Observations in Guangzhou, J. Geophys. Res.-Atmos., 127, e2022JD036803, https://doi.org/10.1029/2022JD036803, 2022.
Liu, C., Xing, C., Hu, Q., Li, Q., Liu, H., Hong, Q., Tan, W., Ji, X., Lin, H., Lu, C., Lin, J., Liu, H., Wei, S., Chen, J., Yang, K., Wang, S., Liu, T., and Chen, Y.: Ground-Based Hyperspectral Stereoscopic Remote Sensing Network: A Promising Strategy to Learn Coordinated Control of O3 and PM2.5 over China, Engineering, 19, 71–83, https://doi.org/10.1016/j.eng.2021.02.019, 2022a.
Liu, H., Han, X., Tang, G., Zhang, J., Xia, X., Zhang, M., and Meng, L.: Model analysis of vertical exchange of boundary layer ozone and its impact on surface air quality over the North China Plain, Sci. Total Environ., 821, 153436, https://doi.org/10.1016/j.scitotenv.2022.153436, 2022b.
Liu, P., Xue, C., Ye, C., Liu, C., Zhang, C., Wang, J., Zhang, Y., Liu, J., and Mu, Y.: The Lack of HONO Measurement May Affect the Accurate Diagnosis of Ozone Production Sensitivity, ACS Environ. Au, 3, 18–23, https://doi.org/10.1021/acsenvironau.2c00048, 2023a.
Liu, X., Yi, G., Zhou, X., Zhang, T., Bie, X., Li, J., and Tan, H.: Spatio-temporal variations of PM2.5 and O3 in China during 2013–2021: Impact factor analysis, Environ. Pollut., 334, 122189, https://doi.org/10.1016/j.envpol.2023.122189, 2023b.
Lu, Y., Kong, L., Shen, J., Liu, B., An, Y., Wang, Y., Tan, J., and Wang, L.: Characteristics and influencing factors of ambient ozone pollution in Hangzhou in the relative humidity range with high ozone levels, Atmos. Pollut. Res., 16, 102648, https://doi.org/10.1016/j.apr.2025.102648, 2025.
Lyu, Y., Xu, H., Wu, H., Han, F., Lv, F., Kang, A., and Pang, X.: Spatiotemporal variations of PM2.5 and ozone in urban agglomerations of China and meteorological drivers for ozone using explainable machine learning, Environ. Pollut., 365, 125380, https://doi.org/10.1016/j.envpol.2024.125380, 2025.
Meng, F., Qin, M., Tang, K., Duan, J., Fang, W., Liang, S., Ye, K., Xie, P., Sun, Y., Xie, C., Ye, C., Fu, P., Liu, J., and Liu, W.: High-resolution vertical distribution and sources of HONO and NO2 in the nocturnal boundary layer in urban Beijing, China, Atmos. Chem. Phys., 20, 5071–5092, https://doi.org/10.5194/acp-20-5071-2020, 2020.
Monks, P. S., Archibald, A. T., Colette, A., Cooper, O., Coyle, M., Derwent, R., Fowler, D., Granier, C., Law, K. S., Mills, G. E., Stevenson, D. S., Tarasova, O., Thouret, V., von Schneidemesser, E., Sommariva, R., Wild, O., and Williams, M. L.: Tropospheric ozone and its precursors from the urban to the global scale from air quality to short-lived climate forcer, Atmos. Chem. Phys., 15, 8889–8973, https://doi.org/10.5194/acp-15-8889-2015, 2015.
Orphal, J. and Chance, K.: Ultraviolet and visible absorption cross-sections for HITRAN, J. Quant. Spectrosc. Ra., 82, 491–504, https://doi.org/10.1016/S0022-4073(03)00173-0, 2003.
Park, S., Son, S.-W., Jung, M.-I., Park, J., and Park, S. S.: Evaluation of tropospheric ozone reanalyses with independent ozonesonde observations in East Asia, Geosci. Lett., 7, 12, https://doi.org/10.1186/s40562-020-00161-9, 2020.
Qiao, X., Guo, H., Wang, P., Tang, Y., Ying, Q., Zhao, X., Deng, W., and Zhang, H.: Fine Particulate Matter and Ozone Pollution in the 18 Cities of the Sichuan Basin in Southwestern China: Model Performance and Characteristics, Aerosol Air Qual. Res., 19, 2308–2319, https://doi.org/10.4209/aaqr.2019.05.0235, 2019.
Qiu, Y., Li, X., Chai, W., Liu, Y., Song, M., Tian, X., Zou, Q., Lou, W., Zhang, W., Li, J., and Zhang, Y.: Insights into ozone pollution control in urban areas by decoupling meteorological factors based on machine learning, Atmos. Chem. Phys., 25, 1749–1763, https://doi.org/10.5194/acp-25-1749-2025, 2025.
Qu, H., Wang, Y., Zhang, R., and Li, J.: Extending Ozone-Precursor Relationships in China From Peak Concentration to Peak Time, J. Geophys. Res.-Atmos., 125, e2020JD033670, https://doi.org/10.1029/2020JD033670, 2020.
Ryan, R. G., Rhodes, S., Tully, M., Wilson, S., Jones, N., Frieß, U., and Schofield, R.: Daytime HONO, NO2 and aerosol distributions from MAX-DOAS observations in Melbourne, Atmos. Chem. Phys., 18, 13969–13985, https://doi.org/10.5194/acp-18-13969-2018, 2018.
Sekiya, T., Emili, E., Miyazaki, K., Inness, A., Qu, Z., Pierce, R. B., Jones, D., Worden, H., Cheng, W. Y. Y., Huijnen, V., and Koren, G.: Assessing the relative impacts of satellite ozone and its precursor observations to improve global tropospheric ozone analysis using multiple chemical reanalysis systems, Atmos. Chem. Phys., 25, 2243–2268, https://doi.org/10.5194/acp-25-2243-2025, 2025.
Serdyuchenko, A., Gorshelev, V., Weber, M., Chehade, W., and Burrows, J. P.: High spectral resolution ozone absorption cross-sections – Part 2: Temperature dependence, Atmos. Meas. Tech., 7, 625–636, https://doi.org/10.5194/amt-7-625-2014, 2014.
Sharma, B. R., Kuttippurath, J., and Gopikrishnan, G. S.: Tropospheric ozone as an atmospheric pollutant and short-lived climate forcer in the Third Pole, Chemosphere, 380, 144474, https://doi.org/10.1016/j.chemosphere.2025.144474, 2025.
Shi, Y., Zeng, Q., Liu, L., Huo, J., Zhang, Z., Ding, W., and Hu, F.: Observed Evidence That Subsidence Process Stabilizes the Boundary Layer and Increases the Ground Concentration of Secondary Pollutants, J. Geophys. Res.-Atmos., 127, e2021JD035244, https://doi.org/10.1029/2021JD035244, 2022.
Shu, Z., Zhao, T., Chen, Y., Liu, Y., Yang, F., Jiang, Y., He, G., Yang, Q., and Zhang, Y.: Terrain effect on atmospheric process in seasonal ozone variation over the Sichuan Basin, Southwest China, Environ. Pollut., 338, 122622, https://doi.org/10.1016/j.envpol.2023.122622, 2023.
Song, M., Zhao, X., Liu, P., Mu, J., He, G., Zhang, C., Tong, S., Xue, C., Zhao, X., Ge, M., and Mu, Y.: Atmospheric NOx oxidation as major sources for nitrous acid (HONO), npj Clim. Atmos. Sci., 6, 30, https://doi.org/10.1038/s41612-023-00357-8, 2023a.
Song, X., Li, X.-B., Yuan, B., He, X., Chen, Y., Wang, S., Huangfu, Y., Peng, Y., Zhang, C., Liu, A., Yang, H., Liu, C., Li, J., and Shao, M.: Elucidating key factors in regulating budgets of ozone and its precursors in atmospheric boundary layer, npj Clim. Atmos. Sci., 7, 262, https://doi.org/10.1038/s41612-024-00818-8, 2024.
Song, Y., Xing, C., Liu, C., Lin, J., Wu, H., Liu, T., Lin, H., Zhang, C., Tan, W., Ji, X., Liu, H., and Li, Q.: Evaluation of transport processes over North China Plain and Yangtze River Delta using MAX-DOAS observations, Atmos. Chem. Phys., 23, 1803–1824, https://doi.org/10.5194/acp-23-1803-2023, 2023b.
Song, Y., Wang, P., Yang, Y., Tang, J., and Liao, H.: Meteorological conditions and physicochemical processes amplifying ozone pollution during heatwaves in major city clusters of China, Atmos. Res., 330, 108580, https://doi.org/10.1016/j.atmosres.2025.108580, 2026.
Spataro, F. and Ianniello, A.: Sources of atmospheric nitrous acid: State of the science, current research needs, and future prospects, J. Air Waste Manage. Assoc., 64, 1232–1250, https://doi.org/10.1080/10962247.2014.952846, 2014.
Spurr, R. J. D.: VLIDORT: A linearized pseudo-spherical vector discrete ordinate radiative transfer code for forward model and retrieval studies in multilayer multiple scattering media, J. Quant. Spectrosc. Ra., 102, 316–342, https://doi.org/10.1016/j.jqsrt.2006.05.005, 2006.
Stutz, J., Kim, E. S., Platt, U., Bruno, P., Perrino, C., and Febo, A.: UV-visible absorption cross sections of nitrous acid, J. Geophys. Res.-Atmos., 105, 14585–14592, https://doi.org/10.1029/2000JD900003, 2000.
Su, W., Liu, C., Hu, Q., Fan, G., Xie, Z., Huang, X., Zhang, T., Chen, Z., Dong, Y., Ji, X., Liu, H., Wang, Z., and Liu, J.: Characterization of ozone in the lower troposphere during the 2016 G20 conference in Hangzhou, Sci. Rep., 7, 17368, https://doi.org/10.1038/s41598-017-17646-x, 2017.
Tang, Y., An, J., Wang, F., Li, Y., Qu, Y., Chen, Y., and Lin, J.: Impacts of an unknown daytime HONO source on the mixing ratio and budget of HONO, and hydroxyl, hydroperoxyl, and organic peroxy radicals, in the coastal regions of China, Atmos. Chem. Phys., 15, 9381–9398, https://doi.org/10.5194/acp-15-9381-2015, 2015.
Thalman, R. and Volkamer, R.: Temperature dependent absorption cross-sections of O2–O2 collision pairs between 340 and 630 nm and at atmospherically relevant pressure, Phys. Chem. Chem. Phys., 15, 15371, https://doi.org/10.1039/c3cp50968k, 2013.
Thürkow, M., Schaap, M., Kranenburg, R., Pfäfflin, F., Neunhäuserer, L., Wolke, R., Heinold, B., Stoll, J., Lupaşcu, A., Nordmann, S., Minkos, A., and Butler, T.: Dynamic evaluation of modeled ozone concentrations in Germany with four chemistry transport models, Sci. Total Environ., 906, 167665, https://doi.org/10.1016/j.scitotenv.2023.167665, 2024.
Torres, O., Jethva, H., Ahn, C., Jaross, G., and Loyola, D. G.: TROPOMI aerosol products: evaluation and observations of synoptic-scale carbonaceous aerosol plumes during 2018–2020, Atmos. Meas. Tech., 13, 6789–6806, https://doi.org/10.5194/amt-13-6789-2020, 2020.
Vandaele, A. C., Hermans, C., Simon, P. C., Carleer, M., Colin, R., Fally, S., Mérienne, M. F., Jenouvrier, A., and Coquart, B.: Measurements of the NO2 absorption cross-section from 42 000 cm−1 to 10 000 cm−1 (238–1000 nm) at 220 K and 294 K, J. Quant. Spectrosc. Ra., 59, 171–184, https://doi.org/10.1016/S0022-4073(97)00168-4, 1998.
Wang, N., Du, Y., Chen, D., Meng, H., Chen, X., Zhou, L., Shi, G., Zhan, Y., Feng, M., Li, W., Chen, M., Li, Z., and Yang, F.: Spatial disparities of ozone pollution in the Sichuan Basin spurred by extreme, hot weather, Atmos. Chem. Phys., 24, 3029–3042, https://doi.org/10.5194/acp-24-3029-2024, 2024a.
Wang, R., Shen, H., Zeng, C., Chen, J., Wang, Y., and Li, Y.: A global land daily 10-km-resolution surface ozone dataset from 2013–2022, Sci. Data, 12, 1710, https://doi.org/10.1038/s41597-025-05990-x, 2025a.
Wang, W.-N., Cheng, T.-H., Gu, X.-F., Chen, H., Guo, H., Wang, Y., Bao, F.-W., Shi, S.-Y., Xu, B.-R., Zuo, X., Meng, C., and Zhang, X.-C.: Assessing Spatial and Temporal Patterns of Observed Ground-level Ozone in China, Sci. Rep., 7, 3651, https://doi.org/10.1038/s41598-017-03929-w, 2017.
Wang, X., Zhang, H., Hong, X., Xiang, Y., Wang, S., Zhang, T., Qin, Z., and Ou, J.: Vertical profiles and regional transport of ozone in typical area of Yangtze-Huaihe River Basin during the autumn base on multiple lidars, Atmos. Pollut. Res., 15, 101983, https://doi.org/10.1016/j.apr.2023.101983, 2024b.
Wang, Y., Puīte, J., Wagner, T., Donner, S., Beirle, S., Hilboll, A., Vrekoussis, M., Richter, A., Apituley, A., Piters, A., Allaart, M., Eskes, H., Frumau, A., Van Roozendael, M., Lampel, J., Platt, U., Schmitt, S., Swart, D., and Vonk, J.: Vertical Profiles of Tropospheric Ozone From MAX-DOAS Measurements During the CINDI-2 Campaign: Part 1 – Development of a New Retrieval Algorithm, J. Geophys. Res.-Atmos., 123, 10637–10670, https://doi.org/10.1029/2018JD028647, 2018.
Wang, Y., Dörner, S., Donner, S., Böhnke, S., De Smedt, I., Dickerson, R. R., Dong, Z., He, H., Li, Z., Li, Z., Li, D., Liu, D., Ren, X., Theys, N., Wang, Y., Wang, Y., Wang, Z., Xu, H., Xu, J., and Wagner, T.: Vertical profiles of NO2, SO2, HONO, HCHO, CHOCHO and aerosols derived from MAX-DOAS measurements at a rural site in the central western North China Plain and their relation to emission sources and effects of regional transport, Atmos. Chem. Phys., 19, 5417–5449, https://doi.org/10.5194/acp-19-5417-2019, 2019.
Wang, Y., Gao, W., Wang, S., Song, T., Gong, Z., Ji, D., Wang, L., Liu, Z., Tang, G., Huo, Y., Tian, S., Li, J., Li, M., Yang, Y., Chu, B., Petäjä, T., Kerminen, V.-M., He, H., Hao, J., Kulmala, M., Wang, Y., and Zhang, Y.: Contrasting trends of PM2.5 and surface-ozone concentrations in China from 2013 to 2017, Natl. Sci. Rev., 7, 1331–1339, https://doi.org/10.1093/nsr/nwaa032, 2020.
Wang, Y., Yang, Y., Yuan, Q., Li, T., Zhou, Y., Zong, L., Wang, M., Xie, Z., Ho, H. C., Gao, M., Tong, S., Lolli, S., and Zhang, L.: Substantially underestimated global health risks of current ozone pollution, Nat. Commun., 16, 102, https://doi.org/10.1038/s41467-024-55450-0, 2025b.
Wang, Z., Zhang, H., Shi, C., Ji, X., Zhu, Y., Xia, C., Sun, X., Zhang, M., Lin, X., Yan, S., Zhou, Y., Xing, C., Chen, Y., and Liu, C.: Vertical and spatial differences in ozone formation sensitivities under different ozone pollution levels in eastern Chinese cities, npj Clim. Atmos. Sci., 8, 30, https://doi.org/10.1038/s41612-024-00855-3, 2025c.
Xia, N., Du, E., Guo, Z., and de Vries, W.: The diurnal cycle of summer tropospheric ozone concentrations across Chinese cities: Spatial patterns and main drivers, Environ. Pollut., 286, 117547, https://doi.org/10.1016/j.envpol.2021.117547, 2021.
Xing, C., Liu, C., Wang, S., Chan, K. L., Gao, Y., Huang, X., Su, W., Zhang, C., Dong, Y., Fan, G., Zhang, T., Chen, Z., Hu, Q., Su, H., Xie, Z., and Liu, J.: Observations of the vertical distributions of summertime atmospheric pollutants and the corresponding ozone production in Shanghai, China, Atmos. Chem. Phys., 17, 14275–14289, https://doi.org/10.5194/acp-17-14275-2017, 2017.
Xing, C., Liu, C., Wang, S., Hu, Q., Liu, H., Tan, W., Zhang, W., Li, B., and Liu, J.: A new method to determine the aerosol optical properties from multiple-wavelength O4 absorptions by MAX-DOAS observation, Atmos. Meas. Tech., 12, 3289–3302, https://doi.org/10.5194/amt-12-3289-2019, 2019.
Xing, C., Liu, C., Wu, H., Lin, J., Wang, F., Wang, S., and Gao, M.: Ground-based vertical profile observations of atmospheric composition on the Tibetan Plateau (2017–2019), Earth Syst. Sci. Data, 13, 4897–4912, https://doi.org/10.5194/essd-13-4897-2021, 2021a.
Xing, C., Liu, C., Hu, Q., Fu, Q., Wang, S., Lin, H., Zhu, Y., Wang, S., Wang, W., Javed, Z., Ji, X., and Liu, J.: Vertical distributions of wintertime atmospheric nitrogenous compounds and the corresponding OH radicals production in Leshan, southwest China, J. Environ. Sci., 105, 44–55, https://doi.org/10.1016/j.jes.2020.11.019, 2021b.
Xing, C., Liu, C., Hong, Q., Liu, H., Wu, H., Lin, J., Song, Y., Chen, Y., Liu, T., Hu, Q., Tan, W., and Lin, H.: Vertical distributions and potential sources of wintertime atmospheric pollutants and the corresponding ozone production on the coast of Bohai Sea, J. Environ. Manage., 319, 115721, https://doi.org/10.1016/j.jenvman.2022.115721, 2022.
Xing, C., Xu, S., Song, Y., Liu, C., Liu, Y., Lu, K., Tan, W., Zhang, C., Hu, Q., Wang, S., Wu, H., and Lin, H.: A new insight into the vertical differences in NO2 heterogeneous reaction to produce HONO over inland and marginal seas, Atmos. Chem. Phys., 23, 5815–5834, https://doi.org/10.5194/acp-23-5815-2023, 2023.
Xing, C., Liu, C., Li, Q., Wang, S., Tan, W., Zou, T., Wang, Z., and Lu, C.: Observations of HONO and its precursors between urban and its surrounding agricultural fields: The vertical transports, sources and contribution to OH, Sci. Total Environ., 915, 169159, https://doi.org/10.1016/j.scitotenv.2023.169159, 2024a.
Xing, C., Liu, C., Ye, C., Xue, J., Wu, H., Ji, X., Ou, J., and Hu, Q.: Observations of the vertical distributions of summertime atmospheric pollutants in Nam Co: OH production and source analysis, Atmos. Chem. Phys., 24, 10093–10112, https://doi.org/10.5194/acp-24-10093-2024, 2024b.
Xu, S., Wang, S., Xia, M., Lin, H., Xing, C., Ji, X., Su, W., Tan, W., Liu, C., and Hu, Q.: Observations by Ground-Based MAX-DOAS of the Vertical Characters of Winter Pollution and the Influencing Factors of HONO Generation in Shanghai, China, Remote Sens., 13, 3518, https://doi.org/10.3390/rs13173518, 2021.
Xuan, H., Liu, J., Zhao, Y., Cao, Q., Chen, T., Wang, Y., Liu, Z., Sun, X., Li, H., Zhang, P., Chu, B., Ma, Q., and He, H.: Relative humidity driven nocturnal HONO formation mechanism in autumn haze events of Beijing, npj Clim. Atmos. Sci., 7, 193, https://doi.org/10.1038/s41612-024-00745-8, 2024.
Xuan, H., Lian, C., Ma, P., Lan, L., Wang, W., Liu, C., Quan, J., Zhang, S., Liu, J., Li, H., Chen, T., Zhang, P., Wang, Y., Chu, B., Ma, Q., and He, H.: Vertical Distribution of Sources and Atmospheric Impacts of HONO in the North China Plain, Environ. Sci. Technol., 59, 17666–17676, https://doi.org/10.1021/acs.est.5c01801, 2025.
Xue, C., Ye, C., Zhang, C., Catoire, V., and Mu, Y.: Evidence for Strong HONO Emission from Fertilized Agricultural Fields and its Remarkable Impact on Regional O3 Pollution in the Summer North China Plain, ACS Earth Space Chem., 5, https://doi.org/10.1021/acsearthspacechem.0c00314, 2021.
Xue, C., Chen, H., McGillen, M. R., Su, H., Cheng, Y., Kleffmann, J., Li, G., Cazaunau, M., Colomb, A., Sciare, J., DeWitt, L., Marchand, N., Sarda-Esteve, R., Petit, J.-E., and Kukui, A.: Role of Heterogeneous Reactions in the Atmospheric Oxidizing Capacity in Island Environments, Environ. Sci. Technol., 59, 3153–3164, https://doi.org/10.1021/acs.est.4c11647, 2025.
Yang, G., Liu, Y., and Li, X.: Spatiotemporal distribution of ground-level ozone in China at a city level, Sci. Rep., 10, 7229, https://doi.org/10.1038/s41598-020-64111-3, 2020.
Ye, C., Lu, K., Ma, X., Qiu, W., Li, S., Yang, X., Xue, C., Zhai, T., Liu, Y., Li, X., Li, Y., Wang, H., Tan, Z., Chen, X., Dong, H., Zeng, L., Hu, M., and Zhang, Y.: HONO chemistry at a suburban site during the EXPLORE-YRD campaign in 2018: formation mechanisms and impacts on O3 production, Atmos. Chem. Phys., 23, 15455–15472, https://doi.org/10.5194/acp-23-15455-2023, 2023a.
Ye, C., Lu, K., Ma, X., Qiu, W., Li, S., Yang, X., Xue, C., Zhai, T., Liu, Y., Li, X., Li, Y., Wang, H., Tan, Z., Chen, X., Dong, H., Zeng, L., Hu, M., and Zhang, Y.: HONO chemistry at a suburban site during the EXPLORE-YRD campaign in 2018: formation mechanisms and impacts on O3 production, Atmos. Chem. Phys., 23, 15455–15472, https://doi.org/10.5194/acp-23-15455-2023, 2023b.
Yu, H., De Smedt, I., Theys, N., Sneep, M., Veefkind, P., and Van Roozendael, M.: Harmonized cloud datasets for the Ozone Monitoring Instrument (OMI) and TROPOspheric Monitoring Instrument (TROPOMI) using the O2–O2 477 nm absorption band, Atmos. Meas. Tech., 18, 4131–4163, https://doi.org/10.5194/amt-18-4131-2025, 2025.
Yu, Y., Cheng, P., Li, H., Yang, W., Han, B., Song, W., Hu, W., Wang, X., Yuan, B., Shao, M., Huang, Z., Li, Z., Zheng, J., Wang, H., and Yu, X.: Budget of nitrous acid (HONO) at an urban site in the fall season of Guangzhou, China, Atmos.Chem. Phys., 22, 8951–8971, https://doi.org/10.5194/acp-22-8951-2022, 2022.
Zeng, Y., Zhang, J., Li, D., Liao, Z., Bian, J., Bai, Z., Shi, H., Xuan, Y., Yao, Z., and Chen, H.: Vertical distribution of tropospheric ozone and its sources of precursors over Beijing: Results from ∼20 years of ozonesonde measurements based on clustering analysis, Atmos. Res., 284, 106610, https://doi.org/10.1016/j.atmosres.2023.106610, 2023.
Zhang, H., Ren, C., Zhou, X., Tang, K., Liu, Y., Liu, T., Wang, J., Chi, X., Li, M., Li, N., Huang, X., and Ding, A.: Improving HONO Simulations and Evaluating Its Impacts on Secondary Pollution in the Yangtze River Delta Region, China, J. Geophys. Res.-Atmos., 129, e2024JD041052, https://doi.org/10.1029/2024JD041052, 2024.
Zhang, H., Shi, C., Ying, C., Weng, S., Ni, E., Zhao, L., Yang, P., Tang, K., Zhou, X., Ren, C., Chi, X., Zhou, D., Li, M., Li, N., Liu, T., and Huang, X.: HONO formation mechanisms and impacts on ambient oxidants in coastal regions of Fujian, China, Atmos. Chem. Phys., 25, 16797–16816, https://doi.org/10.5194/acp-25-16797-2025, 2025a.
Zhang, Q., Liu, P., Wang, Y., George, C., Chen, T., Ma, S., Ren, Y., Mu, Y., Song, M., Herrmann, H., Mellouki, A., Chen, J., Yue, Y., Zhao, X., Wang, S., and Zeng, Y.: Unveiling the underestimated direct emissions of nitrous acid (HONO), P. Natl. Acad. Sci. USA, 120, e2302048120, https://doi.org/10.1073/pnas.2302048120, 2023a.
Zhang, X., Tong, S., Jia, C., Zhang, W., Wang, Z., Tang, G., Hu, B., Liu, Z., Wang, L., Zhao, P., Pan, Y., and Ge, M.: Elucidating HONO formation mechanism and its essential contribution to OH during haze events, npj Clim. Atmos. Sci., 6, 55, https://doi.org/10.1038/s41612-023-00371-w, 2023b.
Zhang, X., Yan, Y., Zhang, N., Wang, W., Suo, H., Jian, X., Wang, C., Ma, H., Gao, H., Yang, Z., Huang, T., and Ma, J.: The 21st-century wetting inhibits growing surface ozone in Northwestern China, Atmos. Chem. Phys., 25, 9669–9684, https://doi.org/10.5194/acp-25-9669-2025, 2025b.
Zhang, Y., Zhang, Y., Liu, Z., Bi, S., and Zheng, Y.: Analysis of Vertical Distribution Changes and Influencing Factors of Tropospheric Ozone in China from 2005 to 2020 Based on Multi-Source Data, Int. J. Environ. Res. Publ. Health, 19, 12653, https://doi.org/10.3390/ijerph191912653, 2022.
Zhou, M., Li, Y., and Zhang, F.: Spatiotemporal Variation in Ground Level Ozone and Its Driving Factors: A Comparative Study of Coastal and Inland Cities in Eastern China, Int. J. Environ. Res. Publ. Health, 19, 9687, https://doi.org/10.3390/ijerph19159687, 2022.
Zhu, L., Wang, J., Xu, Y., Ma, N., Song, X., Qin, J., Li, B., Tsui, W. B. C., Lv, L., and Zhang, T.: Vertical Characteristics of an Ozone Pollution Episode in Hong Kong Under the Typhoon Mawar – A Case Study, Remote Sens., 17, 3904, https://doi.org/10.3390/rs17233904, 2025a.
Zhu, X., Wang, H., Han, Y., Zhang, D., Liu, S., Zhang, Z., and Liu, Y.: Reconstructing the VOC–Ozone Research Framework Through a Systematic Review of Observation and Modeling, Sustainability, 17, 7512, https://doi.org/10.3390/su17167512, 2025b.
Zou, T., Xing, C., Xue, J., Li, Q., Tan, W., Wu, Z., and Liu, C.: Transport characteristics of urban and rural aerosols based on vertical observations and deep learning predictions, Atmos. Res., 315, 107876, https://doi.org/10.1016/j.atmosres.2024.107876, 2025.
Zou, T., Xing, C., Ji, X., Wei, S., Tan, W., Liu, H., and Liu, C.: A dataset of vertical profiles of O3, HONO and their contribution to OH radical from the hyperspectral vertical remote sensing network in China (2021–2024), Zenodo [data set], https://doi.org/10.5281/zenodo.18489836, 2026.