the Creative Commons Attribution 4.0 License.
the Creative Commons Attribution 4.0 License.
 | 21 May 2026
A temporally consistent global 500 m-resolution monthly VIIRS-like nighttime light dataset (1992–2024)
Hongquan Cheng
Mengqing Geng
Shijie Li
Chen Lin
Jie Wang
Peng Gong
Yuyu Zhou
Nighttime light (NTL) data serve as critical indicators of human activities and have been widely applied in urbanization monitoring and socioeconomic analyses. The two most widely used global NTL datasets, derived from the Defense Meteorological Satellite Program Operational Linescan System (DMSP-OLS) and the Visible Infrared Imaging Radiometer Suite (NPP-VIIRS) aboard the Suomi National Polar-orbiting Partnership satellite, differ substantially in spatial resolution and temporal coverage, which hinders their direct integration into a consistent long-term dataset. Previous studies have explored the construction of annual or aggregated NTL data, but these methods often smooth out short-term fluctuations and seasonal variations. Monthly NTL, on the other hand, can provide a more detailed representation of temporal variations. However, the challenge with monthly data lies in maintaining consistent spatial resolution while capturing high-frequency temporal variations tied to economic cycles and seasonal trends, with data gaps persisting, further complicating the generation of continuous, high-resolution monthly NTL datasets. To overcome these challenges, we propose a super-resolution network for DMSP reconstruction, with dedicated pre- and post-processing to generate long-term monthly VIIRS-like NTL products (MVNL). Leveraging multi-modal observations, monthly VIIRS-like products are reconstructed by translating calibrated DMSP data from 1992 to 2013, with 2012 and 2013 serving as the overlapping years between the DMSP and NPP-VIIRS datasets. In particular, the 2013 annual data were used for model training and cross-sensor mapping, and the 2012 monthly NPP-VIIRS data were used as an independent validation benchmark. To construct the long-term VIIRS-like time series, we additionally gap-filled missing observations in the monthly NPP-VIIRS data for 2012–2024 and performed temporal correction to the reconstructed 1992–2012 NTL using the monthly NPP-VIIRS data from 2012 to 2013. Compared with the VIIRS NTL of Earth Observation Group (EOG), the extended dataset shows substantial agreement during the overlapping months in 2012, with a mean R2 of 0.65 and RMSE of 14.27 at the pixel scale and an even higher mean R2 of 0.96 at the city scale, underscoring the reliability of the reconstructed dataset for city-level applications. The 2012 annual composite derived from MVNL shows strong agreement with the EOG product, with R2 values of 0.72 at the pixel scale and 0.98 at the city scale. Moreover, city-level evaluation against radiance-calibrated DMSP products further verifies the reconstruction accuracy, with an R2 exceeding 0.94. Compared with existing NTL datasets, MVNL achieves substantial improvements in resolution, spatial calibration accuracy, and temporal continuity, establishing a continuous and trustworthy data resource. The extended monthly VIIRS-like NTL dataset for 1992–2024 is freely available online at https://doi.org/10.25442/hku.31321315.v2 (Cheng et al., 2026a).
- Article
(32169 KB) - Full-text XML
- BibTeX
- EndNote


With artificial lighting widely deployed across residential, commercial, and infrastructural settings, nighttime light (NTL) remote sensing has emerged as a vital tool for examining human activities and their environmental impacts (Doll et al., 2000; Dong et al., 2025; Elvidge, 1997; Elvidge et al., 2001; Zhao et al., 2019; Zheng et al., 2023). NTL observations capture the spatial distribution and intensity of illuminated areas, enabling a broad spectrum of research endeavors, including urban expansion monitoring (Chen et al., 2019; Li and Cao, 2024; Wu et al., 2022), socioeconomic development assessment (Bao et al., 2024; Chen et al., 2019, 2022), population estimation (Bagan and Yamagata, 2015; Chen et al., 2021a; Sun et al., 2024b; Wu et al., 2023), and environmental issue detection (Huang et al., 2023; Liu et al., 2024).
Currently, those two most widely used NTL datasets are the long-term series from the Defense Meteorological Satellite Program Operational Linescan System (DMSP-OLS) and the more recent data from the Suomi National Polar-orbiting Partnership Visible Infrared Imaging Radiometer Suite (NPP-VIIRS). The DMSP dataset stretches back to the early 1990s, offering a lengthy historical record, and has been widely applied in economic policy analysis (Henderson et al., 2012). However, DMSP suffers from intrinsic limitations such as coarse spatial resolution (∼1 km), saturation in brightly lit urban cores, blooming effects, and a lack of on-orbit radiance calibration (Chen et al., 2021b; Yang et al., 2022; Zhao et al., 2022; Zhuo et al., 2015). In economic estimation, DMSP data performs poorly at predicting economic activity in low-density rural areas and often underestimates spatial inequality in urban regions (Gibson et al., 2021) – the data's inherent ambiguity results in flaws in its applications. To overcome the limitations of DMSP data in spatial and radiometric resolution, VIIRS NTL was introduced as a more refined source of nighttime light remote sensing data. NPP-VIIRS offers higher spatial resolution (∼500 m) and better radiometric sensitivity, spanning a longer time period from April 2012 (Oudrari et al., 2015). Refined spatial resolution of VIIRS NTL data can help alleviate uncertainties in studies of socioeconomic activities, such as economic research (Gibson et al., 2020). However, the observation period of VIIRS data is relatively short, and thus, how to integrate DMSP and VIIRS data to construct a unified long-term NTL record that leverages the historical depth of DMSP data while exploiting the enhanced accuracy of VIIRS remains an ongoing challenge (Bian et al., 2019; Li et al., 2023; Ma et al., 2020).
A variety of strategies have been explored to address the discrepancies in spatial resolution and radiometric properties between DMSP-OLS and NPP-VIIRS datasets. Early efforts primarily relied on regression-based transformations, including power-law, logarithmic, and sigmoid functions, to approximate VIIRS-like outputs from DMSP inputs (Li et al., 2023; Nechaev et al., 2021; Zheng et al., 2019a). While these methods are efficient and easy to implement, the performance is susceptible to the selection of calibration samples and prone to spatial heterogeneity, leading to regional biases and limited generalizability (Bian et al., 2019; Hu et al., 2022; Zheng et al., 2019b). To overcome these limitations, recent studies have increasingly adopted deep learning approaches, particularly autoencoders, convolutional neural networks (CNNs) (Nechaev et al., 2021; Zhang et al., 2024a), and generative adversarial networks (GANs) (Jindal et al., 2024; Yao et al., 2025; Zhang et al., 2025), which are capable of learning non-linear mappings between input and target domains from large-scale data (Chen et al., 2024; Sahoo et al., 2020; Wang et al., 2022). Deep learning methods enable flexible modeling of the complex spatiotemporal relationships between DMSP and VIIRS signals. By framing cross-sensor calibration as a super-resolution problem (Anwar et al., 2021), deep neural networks can simultaneously enhance spatial details and harmonize radiometric differences, transforming coarse-resolution DMSP into high-fidelity images. However, existing deep learning based super resolution approaches for NTL reconstruction are often built on a single vegetation index, such as EVI (Glenn et al., 2010; Kong et al., 2019) or NDVI (Huang et al., 2021b), with limited use of other correlated indicators that influence NTL intensity, which can degrade the radiometric quality of the generated outputs. In addition, single-task formulations for NTL super-resolution provide no explicit guidance for suppressing non-light regions, and the representation of light boundaries is typically weak, further limiting the fidelity of the generated results.
Although significant progress has been made in improving resolution, most existing studies are still limited to annual or aggregated data and have not systematically constructed a monthly dataset. Annual data often masks short-term fluctuations and smooths seasonal differences, making it challenging to capture the immediate dynamics of urbanization and economic activities accurately (Tan et al., 2023; Wu and Li, 2024). In contrast, monthly data can fill this gap by capturing short-term temporal variations, reflecting seasonal rhythms, and tracking subtle changes in NTL intensity with high temporal resolution (Hong et al., 2021). This allows for more precise alignment with seasonal changes and short-term urban development dynamics, providing accurate calibration for long-term trend analysis and improving the reliability of research findings. However, existing monthly data still face challenges, such as insufficient spatial consistency and radiometric accuracy in long-term DMSP monthly observations (Jindal et al., 2024), and data gaps at high latitudes in VIIRS monthly observations (Chen et al., 2021b). To leverage the potential of monthly NTL data to capture short-term dynamics, it is essential to apply rigorous data correction to address spatial and temporal inconsistencies and radiometric inaccuracies, ensuring reliability for long-term analyses.
To establish the long-term, high-resolution, monthly VIIRS-like dataset, we present a dedicated deep super-resolution reconstruction framework that addresses spatial and radiometric discrepancies between the DMSP and VIIRS NTL datasets. The framework generates monthly global NTL data at a spatial resolution of 500 m from 1992 to 2024, extending VIIRS-like observations by more than three decades and forming the longest continuous monthly NTL record currently available. The framework consists of three major components, namely DMSP preprocessing, super-resolution modeling, and monthly VIIRS-like data generation. During the preprocessing stage, the monthly DMSP data obtained from EOG are gap-filled and calibrated to improve the consistency of the input. During the modeling stage, unlike existing approaches that rely on single-indicator calibration or single-task super-resolution, we develop a deep super-resolution network that performs cross-modal feature fusion on multi-source auxiliary observations to integrate complementary information, employs multi-level deformable convolution alignment for accurate spatial registration, incorporates hierarchical contextual feature enhancement for representation learning, and proposes multi-task collaborative learning to improve reconstruction performance. During the data generation stage, the trained super-resolution model is applied to the corrected monthly DMSP observations, and the gaps in the high-latitude values in the post-2012 VIIRS data are filled to produce a long-term dataset with improved spatial fidelity and temporal continuity.
The remainder of this paper is organized as follows. Section 2 introduces the input datasets and preprocessing procedures. Section 3 describes the architecture of the proposed super-resolution framework, along with the cross-sensor and temporal calibration strategy. Sections 4 and 5 present the global VIIRS-like NTL dataset and evaluate spatial patterns, radiometric accuracy, and temporal consistency. Section 6 provides the code and data availability information. Finally, Sect. 7 concludes the study and discusses potential applications and future directions.
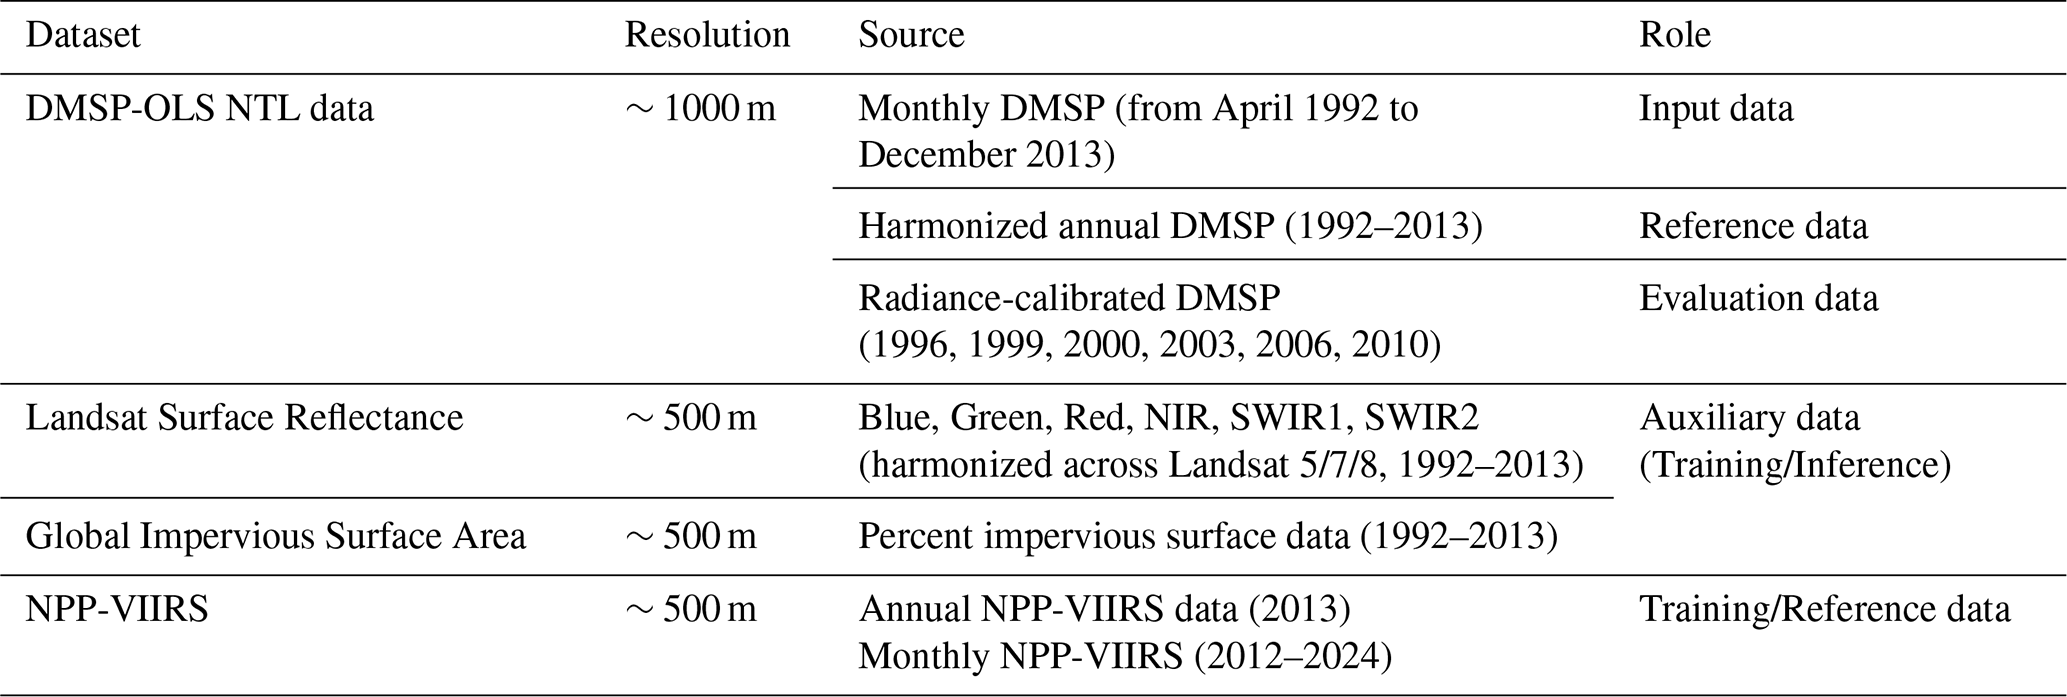
This study integrates multiple remote sensing image datasets with varying spatial and temporal resolutions to construct a global, monthly, VIIRS-like NTL product spanning from 1992 to 2024. The primary data sources include the monthly and annual DMSP-OLS NTL, Landsat surface reflectance composites, global impervious surface area data, and both annual and monthly NPP-VIIRS composites. An overview of each dataset is provided in Table 1, and the detailed descriptions are presented below.
2.1 DMSP-OLS NTL data
DMSP-OLS provides a continuous record of global NTL observations, with data available since the early 1990s. In this study, monthly DMSP-OLS NTL data from 1992 to 2013 are used as input to the reconstruction framework. These data, distributed by the Earth Observation Group (EOG) at the Colorado School of Mines (Baugh et al., 2010; Elvidge, 1997), have a nominal spatial resolution of 30 arcsec (approximately 1 km near the equator), and the digital number (DN) values range from 0, indicating no detectable illumination, to 63 representing the saturation limit. We employ the monthly DMSP composites from April 1992 to December 2013 as the input for cross-sensor reconstruction, providing essential support for extending VIIRS-like high-resolution products backward into the pre-VIIRS era. Notably, due to observational noise and data gaps in the original monthly DMSP data at high latitudes, noise filtering and gap filling are required before further processing.
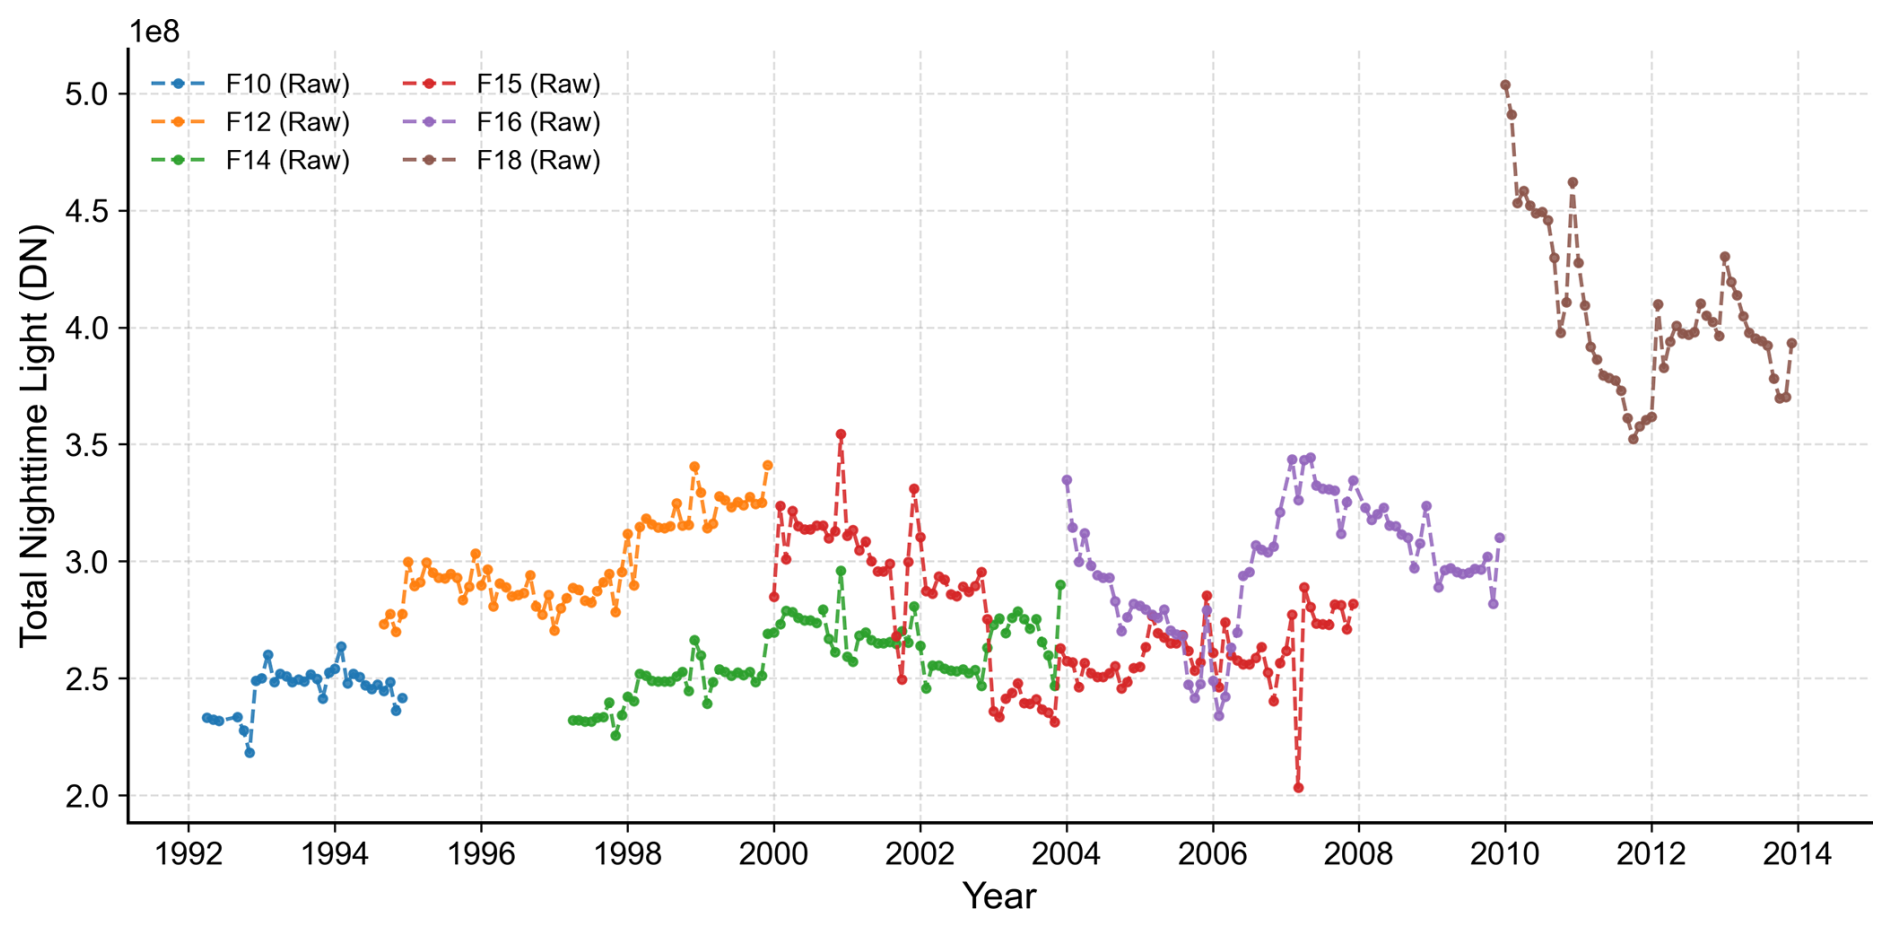
Despite being the long-term global NTL observation source, the DMSP-OLS series, as shown in Fig. 1, has several inherent limitations. These include sensor saturation in brightly illuminated urban areas, the absence of onboard radiometric calibration, which compromises inter-annual consistency, and inter-satellite inconsistencies caused by variations in sensor characteristics, orbital drift, and viewing geometry (Hsu et al., 2015; Zhang et al., 2016; Zhuo et al., 2015). Furthermore, raw DMSP OLS measurements are expressed as unitless DN values that lack direct physical interpretability and may exhibit temporal discontinuities and regional biases (Huang et al., 2022; Pandey et al., 2017). As such, preprocessing is highly required before using the raw monthly DMSP data as the model input.
2.2 Auxiliary multi-modal data
To overcome the spatial limitations of DMSP observations and improve fine-scale NTL reconstruction, this study integrates Landsat surface reflectance and impervious surface data as auxiliary inputs. Previous DMSP enhancement studies often used vegetation indices, such as EANTLI or NDVI-based corrections, to mitigate saturation and blooming by introducing land-cover heterogeneity (Chen et al., 2024, 2021b; Liu et al., 2020; Zhuo et al., 2015). However, reliance on a single vegetation proxy provides limited spatial and spectral information for fine-scale NTL characterization (Sun et al., 2024a). Therefore, multi-band Landsat reflectance is incorporated to supply richer spectral cues and stronger physical interpretability.
This study uses Landsat surface reflectance as one of the auxiliary inputs. Landsat 5, 7, and 8 observations were temporally averaged over a three-year window centered on the target year to reduce cloud contamination. These processed Landsat data were used for model training in 2013, the year with available high-resolution NPP-VIIRS observations (Badawi et al., 2019). Specifically, Landsat Collection 2 Level-2 products from Google Earth Engine (GEE) were radiometrically scaled and atmospherically corrected, with cloud, cirrus, shadow, and snow masked and saturated pixels removed (Hughes and Kennedy, 2019; Zhang et al., 2024b). Cloud-screened scenes from 2012–2014 (cloud cover below 35 %) were composited using the median, and a minimum-value composite was added to improve spatial completeness. All Landsat composites were resampled to 500 m to match the VIIRS NTL resolution. For historical processing (1992–2012), Landsat 5 TM and Landsat 7 ETM+ Collection 2 Level-2 products (Claverie et al., 2015; Li et al., 2021) were processed using the same pipeline as Landsat 8, with TM and ETM+ jointly used to reduce ETM+ scan line corrector striping and improve coverage (Asare et al., 2020; Masek et al., 2001). Finally, six harmonized bands (blue, green, red, near-infrared, shortwave infrared 1, and shortwave infrared 2) were retained to provide spectrally rich constraints for cross-sensor NTL reconstruction.
To enhance model generalization and address the limitations of NTL signals in heterogeneous or low-illumination regions, the impervious surface (IS) area was also introduced as an auxiliary input. In peri-urban zones and mixed-use landscapes, DMSP signals are often weak or ambiguous due to sparse lighting infrastructure (Li and Zhou, 2017b). As a proxy for development intensity, high-resolution impervious surface information provides complementary structural cues independent of radiance, helping guide NTL spatial reconstruction. In this study, the impervious surface data were derived from the Global Artificial Impervious Area (GAIA) dataset (Gong et al., 2020), which offers annual global maps from 1985 onward at 30 m resolution. The original classification data were aggregated to compute the proportion of impervious surface within each 500 m grid cell, generating a continuous variable aligned with the DMSP footprint. This percentage measure was temporally matched to samples and incorporated as a structural prior, particularly beneficial in urban–rural transition zones where light-based features are less reliable.
2.3 NPP-VIIRS NTL data
Cross-sensor calibration in this study relied on NPP-VIIRS NTL observations from 2013, when both NPP-VIIRS and DMSP-OLS were in operation, and complete annual observations were available from both sensors. Although 2012 was also an overlapping year, the monthly NPP-VIIRS record began only in April, making its annual composite less representative of full-year NTL variation and therefore less suitable for model calibration. This temporal overlap ensures consistent reference conditions and enables direct supervision for deep learning model training. VIIRS data offers substantially improved spatial resolution at approximately 500 m and a broader radiometric dynamic range, providing radiometrically calibrated observations that mitigate saturation effects and support detailed spatial and temporal analysis (Chen et al., 2024; Zheng et al., 2025). The 2013 annual VIIRS median composite was utilized as the reference data to construct training, validation, and test subsets, facilitating consistent benchmarking while reducing interference from short-term variability. All NPP-VIIRS NTL data used in our study, including the monthly composites from 2012 to 2024, were obtained from EOG (Elvidge et al., 2021; Jindal et al., 2024).
To improve the reliability of training labels and mitigate the impact of extreme radiometric responses, an empirical filtering approach was adopted based on the maximum radiance values observed across a set of metropolitan areas, including Beijing, Shanghai, Guangzhou, Shenzhen, Hong Kong, Tokyo, New York, London, Paris, and Sydney (Huang et al., 2021a; Liu et al., 2016). These cities were chosen based on their high levels of urbanization and economic activity, which are typically associated with intense and saturated nighttime light emissions. The maximum pixel-level radiance observed within these urban areas was regarded as an approximation of the upper bound of genuine anthropogenic illumination. The max value was adopted as a global threshold to identify and suppress outliers such as sensor noise, stray light, or other non-urban artifacts. This correction minimized the influence of saturated urban cores on model fitting and improved the sensitivity and stability of predictions in dimmer or mixed-use regions. The preprocessed dataset mitigates the impact of abnormally high-value noise and ensures spatial and radiometric consistency, providing a stable learning target for DMSP-OLS enhancement.
During this study, a four-stage framework is developed to generate and evaluate the monthly VIIRS-like NTL dataset covering both the DMSP and VIIRS observational periods, as illustrated in Fig. 2. In the data preprocessing stage (Step 1 in Fig. 2), gaps in the monthly DMSP observations from the EOG are addressed through temporal interpolation that incorporates both intra-annual and inter-annual information. Based on the gap-filled results, temporal calibration of the monthly DMSP series is further performed with the stepwise processed annual DMSP composites (Li and Zhou, 2017a) serving as the radiometric reference, enhancing spatiotemporal consistency. As for the auxiliary data, annual Landsat multispectral imagery and impervious surface area data (fractions) from 1992 to 2013 are acquired from the GEE platform and resampled to a resolution of 500 m through spatial aggregation. Moreover, for the monthly VIIRS data from 2012 to 2024, missing or anomalous observations are modeled and interpolated after acquisition from the EOG to ensure temporal completeness, where missing regions are filled using the proposed gap-filling scheme and anomalously large values are screened by a global maximum threshold.
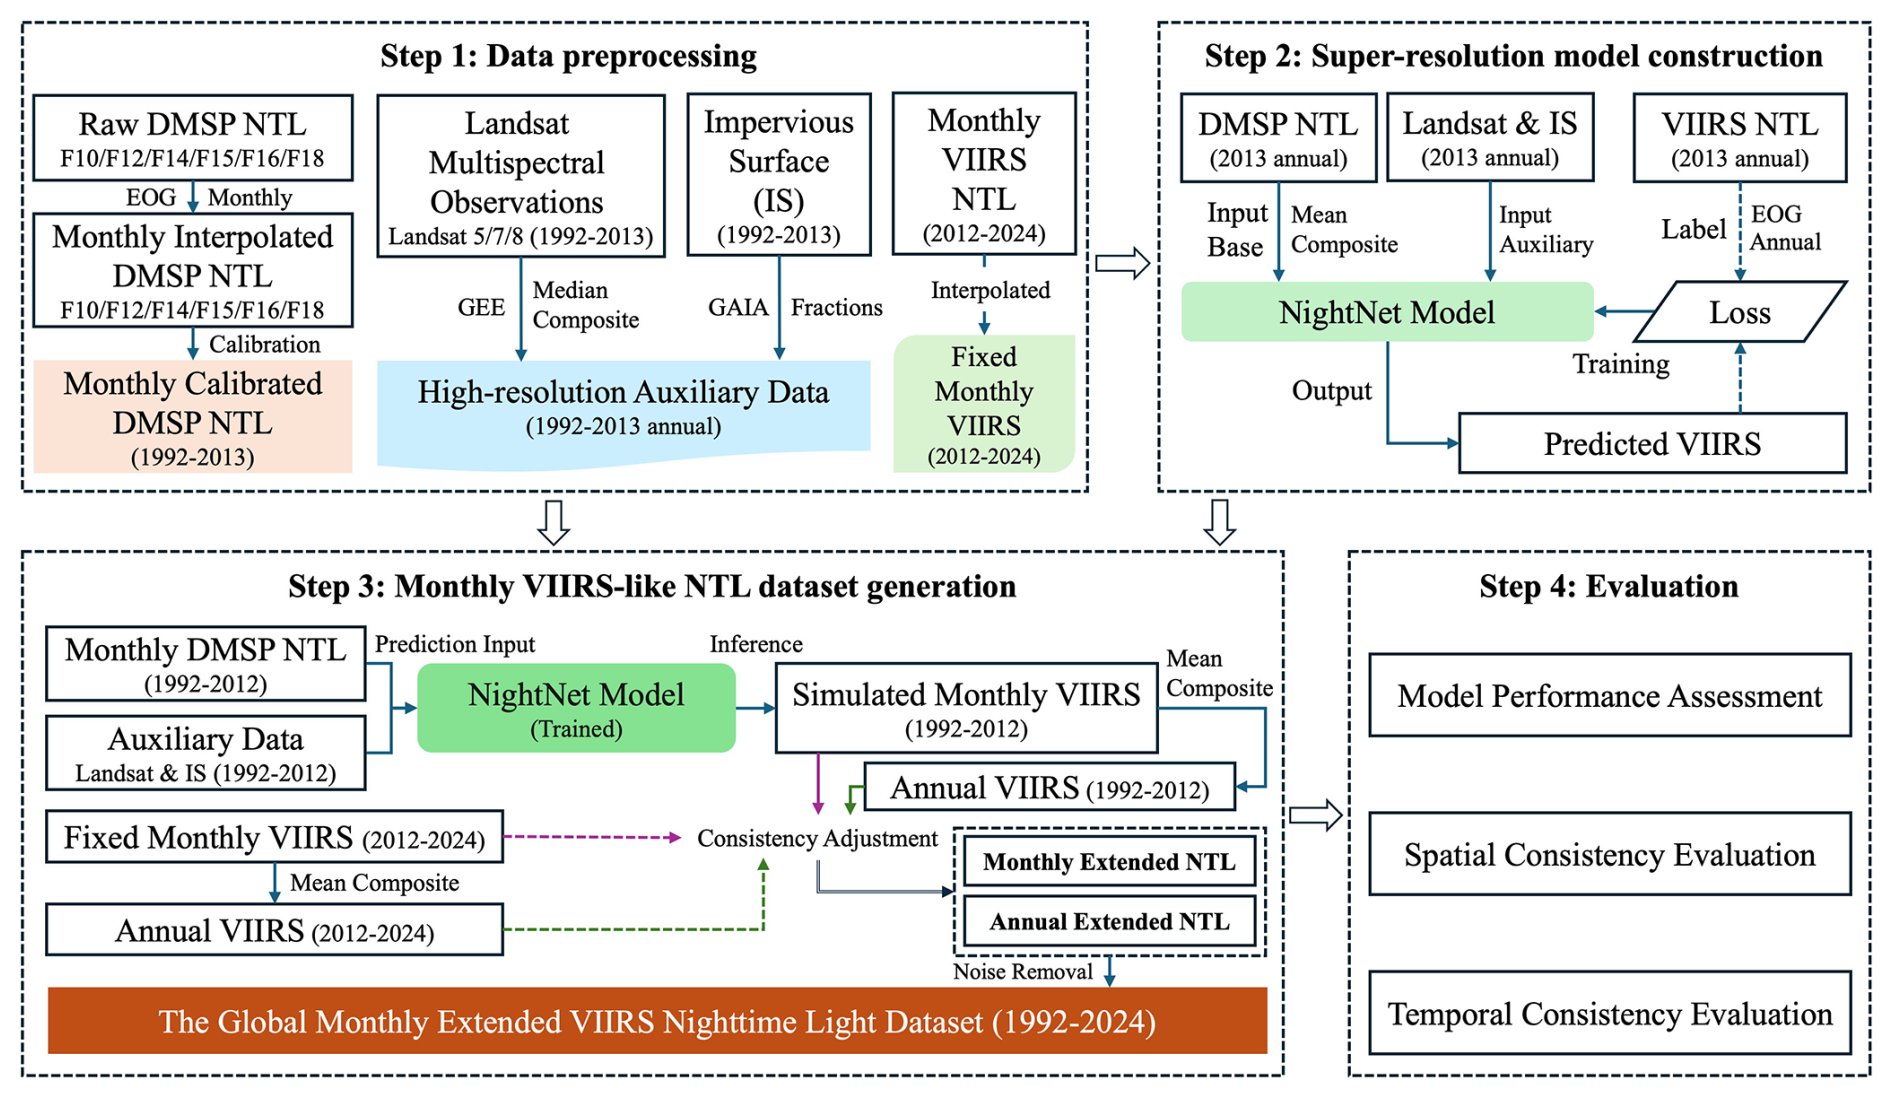
During the model construction stage (Step 2 in Fig. 2), a deep learning super-resolution model (NightNet) is designed and trained on the annual composited DMSP derived from the calibrated 2013 monthly data and the yearly VIIRS composite from the EOG. Landsat reflectance and impervious surface data for 2013 serve as auxiliary inputs to support the modeling of cross-sensor relationships. In the monthly VIIRS-like dataset generation stage (Step 3 in Fig. 2), the trained model is applied to monthly DMSP observations from 1992 to 2012 to produce simulated monthly VIIRS-like products, followed by the generation of corresponding annual mean composites. These reconstructed products are subsequently merged with the fixed monthly VIIRS and the annual composites from 2012 to 2024. Then, temporal consistency adjustment (Chen et al., 2021b) and manual spatial filtering are applied at both monthly and yearly scales to improve radiometric coherence and maintain inter-annual continuity across the full time series, yielding the MVNL dataset. Finally, comprehensive validation experiments are conducted to assess the radiometric accuracy and temporal stability of the reconstructed dataset (Step 4 in Fig. 2).
3.1 Data processing and dataset setting up
The preprocessing workflow began with the reconstruction of monthly DMSP observations from EOG, which initially contained extensive missing pixels and even entire months missing in several years. To generate a temporally continuous input for the subsequent cross-sensor enhancement, we implemented a joint intra-annual and inter-annual interpolation strategy to reconstruct a gap-filled monthly DMSP series from 1992 to 2012, as illustrated in Fig. 3. Specifically, for monthly images with partial missing areas, intra-annual interpolation was first conducted by exploiting the temporal similarity among adjacent months within the same year. The missing regions in a target month were estimated using the average information from other available months of that year, so that the seasonal pattern within the annual cycle could be preserved as much as possible. For months that were completely missing or still contained substantial gaps after the intra-annual step, inter-annual interpolation was further conducted by referring to the corresponding month or temporally adjacent months in neighboring years, thereby preserving long-term temporal continuity across years. By combining these two procedures, the method simultaneously accounts for seasonal variability within each year and temporal consistency across successive years, enabling the construction of a continuous monthly DMSP time series for subsequent modeling.
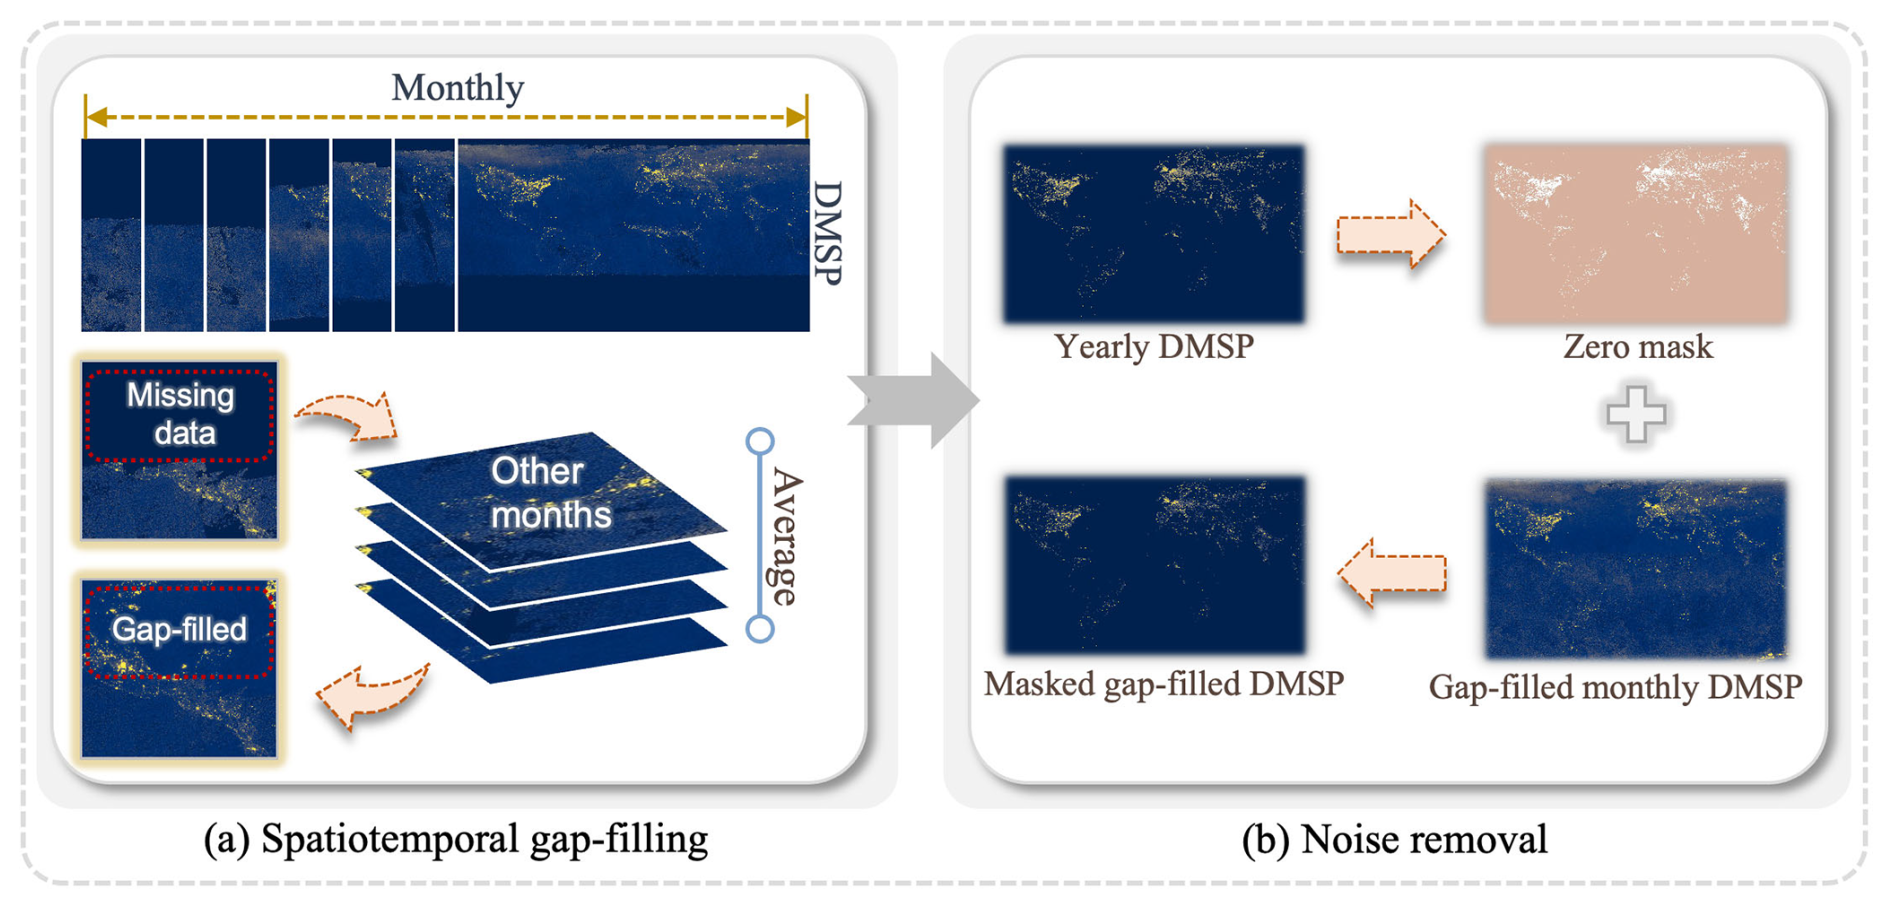
Figure 3Processing workflow of spatiotemporal gap-filling and denoising.
Although the reconstructed NTL images showed improved spatial coverage, noticeable temporal discontinuities persisted due to differences in radiometric response and viewing geometry across satellite sensors. To mitigate these inconsistencies, a local-scale monthly calibration method was developed using the harmonized annual DMSP product (Li et al., 2020a). Specifically, all monthly observations Mt(x,y) in a year were padded to match the spatial extent and resolution of the corresponding harmonized image, and an annual mean field was computed from the available months as
A sliding window-based calibration was then performed with a window size of 8 pixel ×8 pixel and a stride of 4 pixels. For each local window Ωi,j, a radiometric scaling factor was estimated as
and applied to the corresponding segment of the harmonized annual DMSP image H(x,y) to generate calibrated monthly values following . To suppress block boundary artifacts introduced during patch-wise reconstruction, two-pixel margins at each patch edge were discarded, leaving only the core region for seamless mosaicking across the full spatial extent. The final calibrated monthly products were constrained to the valid range of [0,63] and converted to the integer format to maintain consistency with the harmonized radiometric scale. This preprocessing procedure effectively preserved monthly temporal variability while significantly improving cross-sensor radiometric consistency and long-term continuity, thereby ensuring a reliable and stable DMSP input for the subsequent cross-sensor super-resolution reconstruction. Following this temporal harmonization, monthly results from different sensors within each year were averaged to generate a unified calibrated monthly time series for 1992 to 2012, as illustrated in Fig. 4.
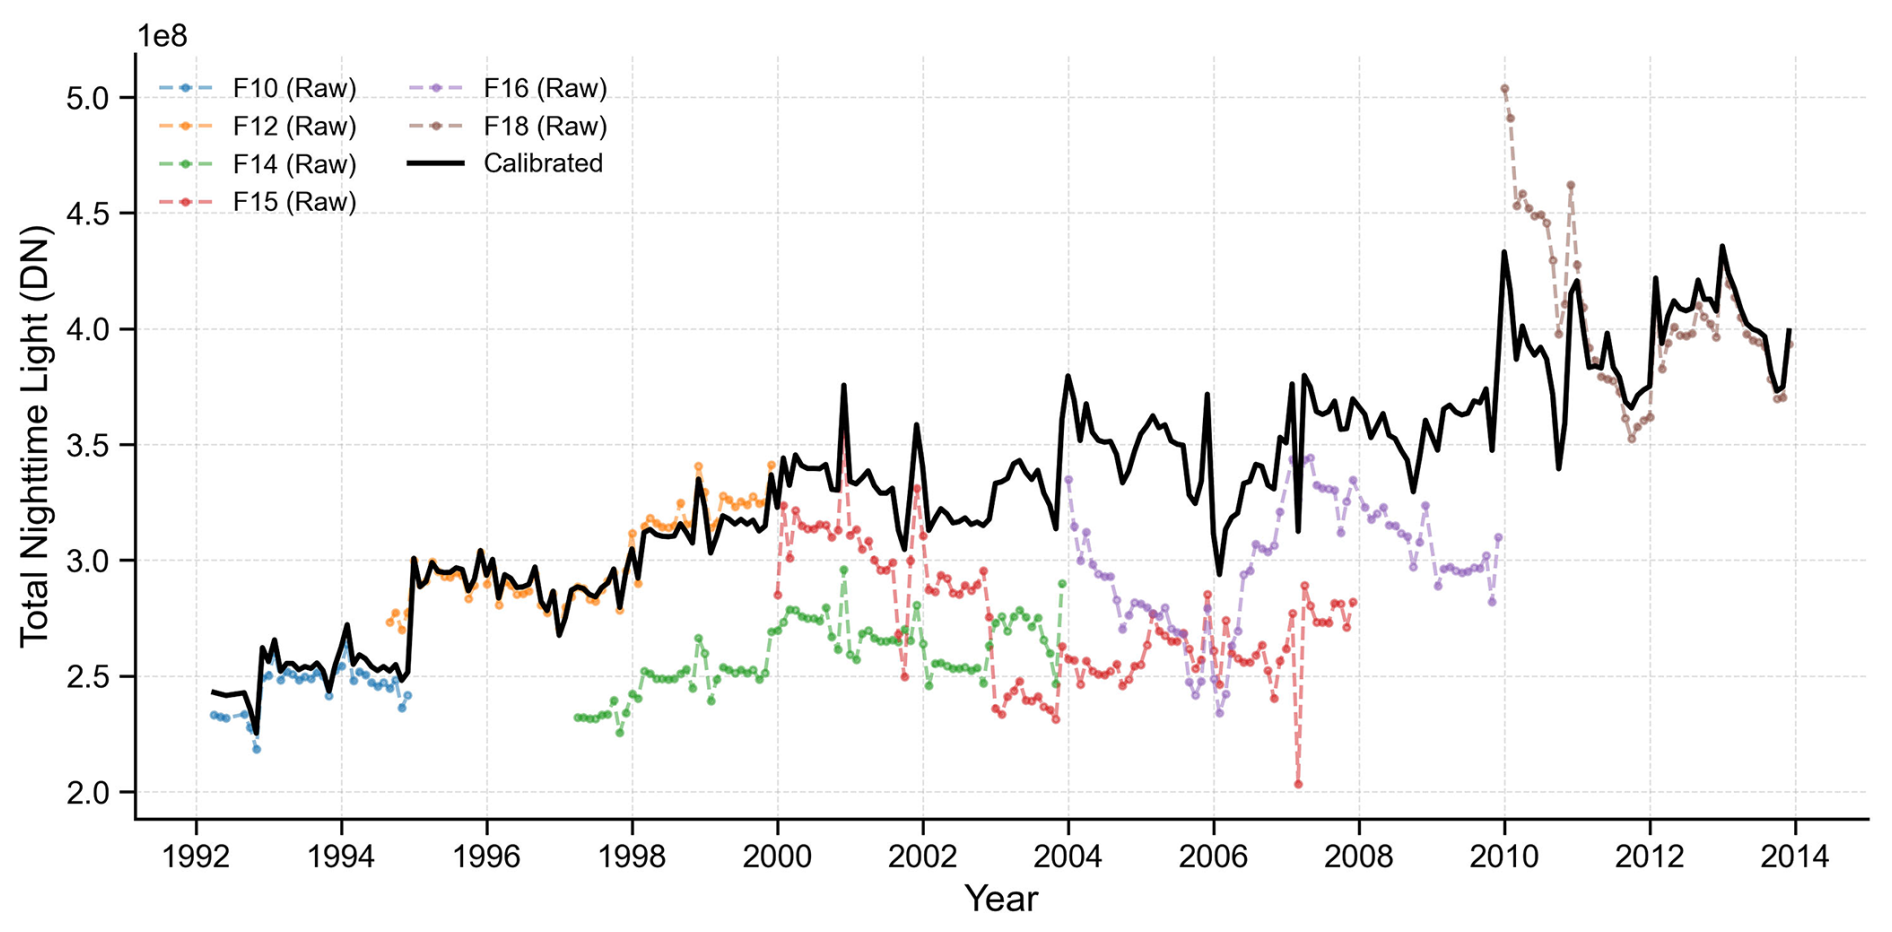
Figure 4Time series comparison of raw and calibrated total NTL values from different DMSP-OLS sensors (F10, F12, F14, F15, F16, F18) from 1992 to 2013.
To construct training data for cross-sensor super-resolution modeling, geographically valid and representative sample coordinates were generated based on global VIIRS imagery. Specifically, a sliding-window tiling strategy was applied to the 2013 annual VIIRS composite, producing 256 pixel ×256 pixel tiles with a 56 pixel overlap, ensuring seamless reconstruction of the 144 pixel ×144 pixel central region during inference. To maintain spatial alignment during tiling, longitude wrap-around was employed for cases crossing the 180° meridian, while zero padding was applied along the latitudinal boundaries. Ocean-dominated and irrelevant tiles were removed using a global land-area polygon mask, and affine metadata were recorded for all retained tiles to preserve spatial correspondence. To further enhance semantic information richness, tiles with a non-zero pixel proportion below three percent were excluded, effectively filtering out tiles dominated by ocean or extremely dim regions. After this dual filtering based on geographic coverage and information density, the remaining VIIRS tiles were paired with collocated DMSP observations, Landsat surface reflectance bands, and impervious surface fraction data, resulting in a total of 17 000 multi-source training samples. Among them, 15 300 samples were assigned for model training and 1700 for validation, providing a balanced configuration that supports stable optimization, practical hyperparameter tuning, and independent evaluation of generalization performance.
3.2 A cross-sensor super-resolution network (NightNet) for VIIRS-like NTL reconstruction
To reconstruct high-resolution VIIRS-like NTL images from low-resolution DMSP data, we developed a deep super-resolution network named NightNet. This network integrates spatial alignment, contextual feature enhancement, and auxiliary information fusion to support robust and generalized cross-sensor NTL mapping. As illustrated in Fig. 5, the network consists of three major functional modules: (1) a multi-level deformable alignment and fusion module (Fig. 5a) for dynamically aligning auxiliary inputs with DMSP features at multiple encoding stages; (2) a hierarchical contextual feature enhancement module (Fig. 5b) employing spatial pyramid pooling and attention mechanisms to enrich deep representations; and (3) a multi-task synergistic learning module (Fig. 5c) that simultaneously predicts enhanced NTL outputs along with auxiliary edge and mask maps to stabilize learning and boost generalization. These modules are integrated into an encoder-decoder backbone, where cross-scale information is hierarchically encoded and progressively decoded, enabling the network to recover fine-grained structural and radiometric details from degraded DMSP observations.
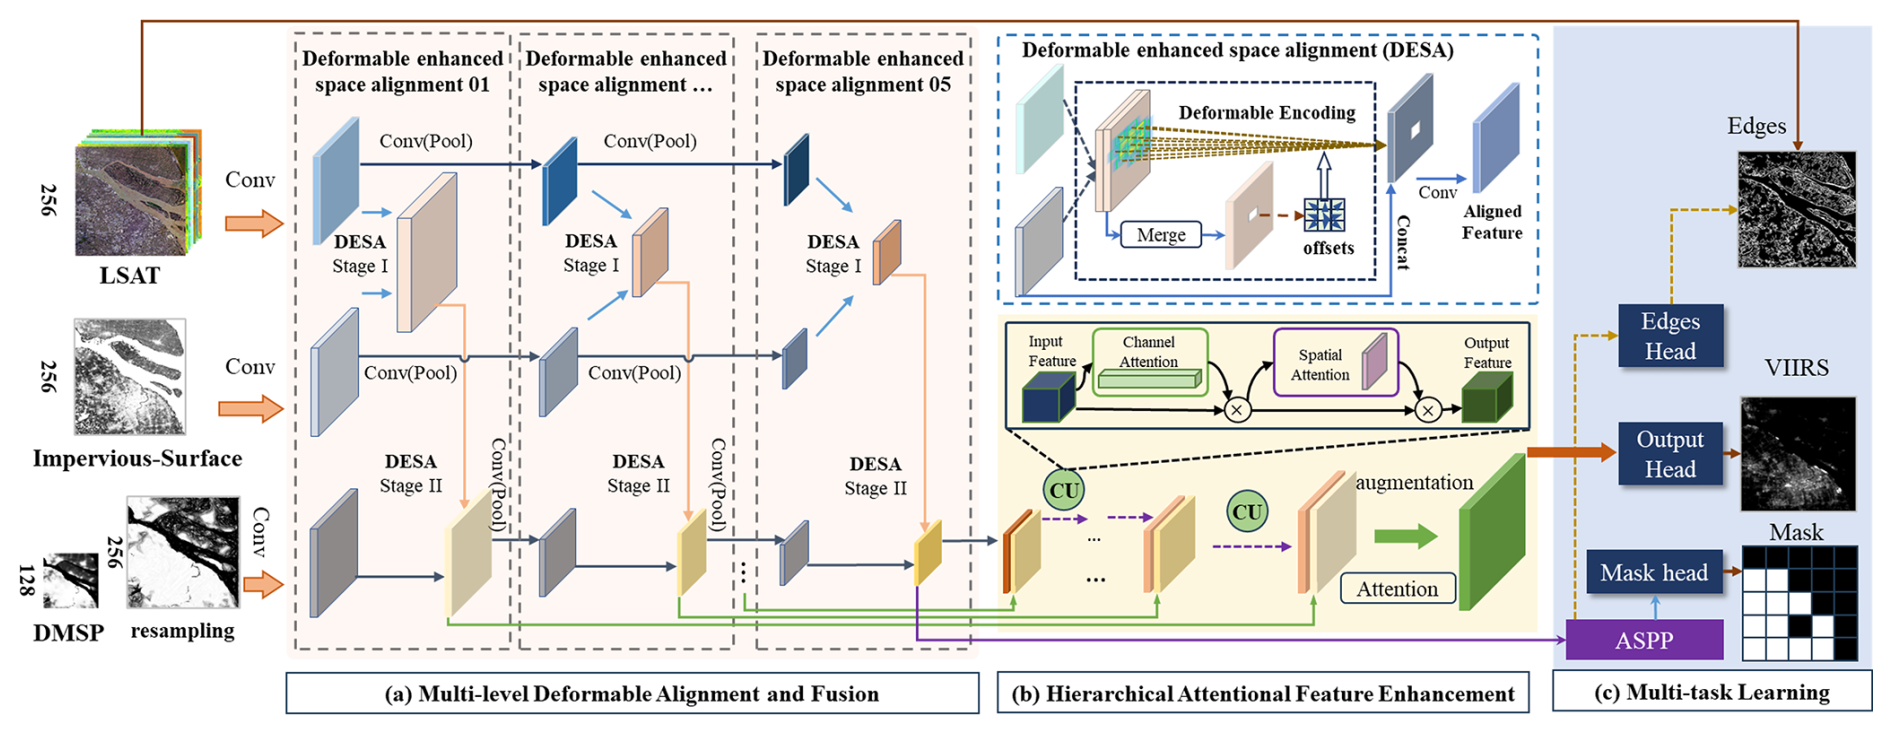
Figure 5The NightNet framework.
3.2.1 Multi-level Deformable Alignment and Fusion Module
Leveraging high-resolution auxiliary data such as Landsat surface reflectance and impervious surface maps is crucial for enhancing coarse-resolution DMSP images to generate VIIRS-like outputs. However, due to inherent differences in sensor platforms, spatial resolution, and acquisition timing, these auxiliary inputs often exhibit spatial misalignments relative to DMSP observations. Such inconsistencies can hinder effective feature integration and lead to geometric artifacts in the enhanced outputs. To mitigate this issue, we designed a multi-level deformable alignment and fusion module that enables dynamic spatial registration between DMSP and auxiliary feature maps. At each encoder level, the module adaptively estimates pixel-wise offset fields based on joint feature representations:
where represents the learned sampling offsets, and [;] denotes channel-wise concatenation. The resulting offsets are fed into a deformable convolution operation applied to the DMSP feature space:
The aligned DMSP features Fdef are then fused with the auxiliary stream using a 1×1 convolution:
This operation is applied at multiple semantic levels to progressively refine spatial alignment from shallow textures to deep contextual features. By incorporating deformable sampling, the model learns to align heterogeneous inputs in a data-driven manner, enhancing the stability and precision of the DMSP-to-VIIRS mapping.
For implementation, this fusion process is integrated into the encoder pathway at several consecutive stages. At each stage l, the primary DMSP stream is first processed via standard convolutional encoding, while the auxiliary features, derived respectively from Landsat and impervious surface inputs, are separately encoded and aligned using dedicated convolution blocks. Each aligned pair is then combined through the deformable fusion mechanism described above. The resulting outputs at each stage are denoted as . These fused multi-level features preserve hierarchical semantic structures while effectively integrating heterogeneous data sources, which are subsequently forwarded to the decoding module for hierarchical reconstruction and contextual enhancement.
3.2.2 Hierarchical Contextual Feature Enhancement Module
To improve the model's ability to reconstruct spatially heterogeneous nighttime light patterns, particularly in dense urban environments with complex textures and illumination gradients, we designed a hierarchical contextual feature enhancement module during decoding. This module progressively integrates multi-level semantic features from the encoder with upsampled decoder outputs, while applying attention-based refinement to highlight salient spatial structures.
During decoding, feature maps from deeper layers are upsampled using bilinear interpolation to match the resolution of encoder outputs at the corresponding semantic level. The upsampled decoder feature is then concatenated with the encoder feature at the same level, enabling the decoder to recover detailed spatial structures while leveraging high-level contextual cues. The combined features are refined with attention and convolved to enhance structural saliency and suppress noise. This process can be formalized as:
where is the decoder feature map at level l, is the processed feature map from the preceding decoder level, upsampled to match the resolution of level l, is the encoder output at level l, Up(⋅) denotes bilinear upsampling, and ℱdec(⋅) represents the refinement function consisting of convolution and attention-based recalibration. The hierarchical decoding strategy facilitates effective integration of spatially aligned features across levels and enhances the reconstruction of complex NTL distributions.
To enhance semantic discrimination and local detail recovery, each fused feature map dl is further processed through a dual-stage attention mechanism (Woo et al., 2018). First, a channel attention map is computed as:
where F denotes the input feature map, GAP(⋅) and GMP(⋅) are global average and max pooling operations, respectively, MLP(⋅) represents a shared multi-layer perceptron, and σ(⋅) is the sigmoid function. The channel-refined output is then given by . Next, spatial attention is applied to F′ to emphasize salient regions within the spatial domain. The spatial attention map is calculated as:
where f7×7 denotes a convolution layer with a 7×7 kernel, and both pooling operations are applied along the channel axis. The final refined feature is obtained by . This attention-augmented decoding strategy enables the model to dynamically focus on informative spectral and spatial regions, enhancing structural coherence and improving the quality of the reconstructed VIIRS-like NTL outputs.
3.2.3 Multi-task Synergistic Learning Module
Achieving spatial consistency and radiometric fidelity in NTL reconstruction remains challenging, especially in complex urban environments with heterogeneous illumination patterns. Landsat multi-band data, used as auxiliary input, not only leverages the non-linear enhancement of multi-band features but also provides morphological boundary constraints for continuous lighting. To fully utilize these additional constraints, a multi-task synergistic learning module is incorporated at the end of the decoding pipeline. This component leverages the high-level semantic abstraction from the bottleneck layer and introduces auxiliary learning signals that regularize the primary super-resolution task using illumination boundary structures and spatial priors, further stabilizing model learning and improving spatial structural understanding.
The multi-task synergistic learning module builds upon the semantic abstraction generated at the network's bottleneck, which corresponds to the output feature map obtained from the deepest encoding layer immediately before the upsampling process begins. This layer aggregates multi-scale and cross-modal information, serving as the model's semantic anchor. To enrich the contextual representation of fb, it is processed by a context-aware enhancement block ℱctx(⋅), composed of stacked dilated convolutions. This operation enlarges the receptive field while maintaining spatial granularity, yielding a shared latent embedding z=ℱctx(fb), which captures both global illumination patterns and local spatial structures. The representation z is fed into three parallel prediction heads: the primary head for VIIRS-like radiance estimation, and two auxiliary heads designed to regularize structural alignment and spatial certainty. These decoding functions – denoted ℋntl, ℋedge, ℋmask – are implemented as shallow convolutional branches:
where represent the predicted radiance map, structural edge probability map, and soft spatial confidence map, respectively.
Ground truth labels for edge prediction are automatically constructed from the auxiliary Landsat cube . Each spectral band is independently processed using a Canny edge detector (Ding and Goshtasby, 2001) and skeletonization to yield a binary edge volume 𝒞(L). The aggregated structural supervision map is then defined as:
To further restrict supervision to urbanized areas, a binary mask is derived from the impervious surface fraction map by thresholding:
This yields a masked edge supervision target , focusing the model's attention on built-up zones with significant lighting patterns. While is directly optimized for radiance reconstruction and retained during inference, the auxiliary outputs and act as implicit structural and spatial priors. Notably, is not trained with explicit labels, but instead evolves through joint optimization, guiding the model to attend more reliably to spatial regions with high structural certainty. This mechanism resembles a soft attention map, dynamically highlighting informative regions across varying urban morphologies. The proposed module can stabilize training and enhance generalization across diverse global settings by jointly encoding semantic, structural, and spatial knowledge.
3.3 Model training and inference
Achieving spatial consistency and radiometric fidelity in NTL reconstruction requires a robust optimization framework that balances pixel-wise accuracy with structural integrity. The training objective was formulated as a multi-task learning problem, wherein the model simultaneously learns to generate high-resolution radiance predictions , extract semantic edge structures , and infer a confidence-aware spatial mask . The regression loss ℒreg integrates spatial and frequency constraints to improve cross-sensor reconstruction quality. It is formulated as:
where pred denotes the reconstructed NTL values and gt represents the VIIRS reference. The MSE enforces pixel-wise radiometric fidelity. The Lfitness is computed from a symmetric coefficient of determination:
which adaptively emphasizes regions exhibiting larger residuals relative to their joint variance, improving consistency in challenging areas. The L1 component compares the magnitudes of the normalized Fourier spectra, which facilitates the preservation of localized high-intensity lighting patterns and reduces spectral distortion. Auxiliary predictions are supervised by weighted cross-entropy losses. Let E∗ and M∗ denote the ground-truth edge and impervious surface masks, respectively. The auxiliary loss is defined as:
where CE refers to the cross-entropy loss. To dynamically balance these heterogeneous objectives, the total loss is formulated using an uncertainty-guided adaptive weighting mechanism, known as automatic weighted Loss (Cipolla et al., 2018). Let ℒ1=ℒreg and ℒ2=ℒaux; the final loss becomes:
where δ1, δ2 are learnable task-dependent uncertainty parameters. This design encourages balanced training and mitigates task dominance during early-stage optimization.
The NightNet model was trained for 200 epochs using the Adam optimizer, with a cosine annealing learning rate schedule. Each training batch comprised 32 paired samples of low- and high-resolution NTL images, randomly sampled to ensure data diversity and mitigate overfitting. The model was assessed on the validation set using three perceptual quality indicators, including peak signal-to-noise ratio (PSNR), structural similarity index (SSIM), and the coefficient of determination (R2), which were computed for each sample and then averaged across the dataset. The best-performing checkpoint was selected based on the highest validation R2, ensuring optimal radiometric consistency with the reference data. All experiments were conducted on an NVIDIA RTX 4090 GPU with 24 GB of memory, enabling efficient multi-task backpropagation and high-throughput batch processing. During inference, only the radiance branch is activated. The output is rescaled using precomputed maximum values from training data and exported as a high-resolution VIIRS-like NTL image. Although the auxiliary branches are disabled at test time, they play a critical role during training by enforcing spatial consistency and enhancing structural detail through multi-task regularization.
3.4 Monthly VIIRS-like NTL data generation
To construct a temporally consistent monthly VIIRS-like dataset spanning both the DMSP and VIIRS observational eras, we applied the same tile partitioning strategy used during model training. Specifically, monthly DMSP, Landsat, and impervious-surface fraction products covering global land from 1992 to 2012 were divided into overlapping tiles, forming a test dataset aligned with the spatial configuration of the training tiles. The trained NightNet model was then used for monthly tile-level inference to produce high-resolution VIIRS-like results. During reconstruction, only the 144 pixel ×144 pixel central region of each tile was retained to mitigate edge artifacts associated with overlap. These central patches were mosaicked based on spatial indices to generate monthly VIIRS-like composites covering global land.
To fully capture the temporal sequence from 1992 to 2024, systematic corrections were applied to the original EOG monthly VIIRS observations from 2012 to 2024. The EOG monthly VIIRS data exhibit substantial, irregular spatial missingness in high-latitude regions, with the pattern varying across months and showing apparent seasonal effects. During the summer months in the Northern Hemisphere, data coverage in high-latitude regions is notably sparse, while coverage in the Southern Hemisphere remains complete. In contrast, during winter months, the Northern Hemisphere exhibits full data coverage, while the Southern Hemisphere faces data gaps. Specifically, December data from the Northern Hemisphere and June data from the Southern Hemisphere have the most complete coverage.
To address this issue, we developed hemispheric gap-filling schemes that leverage low-latitude observations to estimate missing high-latitude radiances using proportional scaling referenced to a baseline month within each year. For the Northern Hemisphere, original monthly VIIRS data were used, along with modeling points randomly selected within 33° S to 33° N. For each year between 2012 and 2024, pixel values from all available months were sampled at these points, and zero-intercept proportional fitting was performed between the target month and December to derive monthly scaling coefficients. During gap filling, only pixels north of 33° latitude with a value of 0 or nodata were treated as missing and replaced with the product of the corresponding scaling coefficient and the December radiance field, enabling high-latitude recovery while preserving the stable temporal consistency observed in low-latitude regions.
In the Southern Hemisphere, after completing the Northern Hemisphere correction, the same modeling strategy was applied to regions south of 33° S. For each year from 2012 to 2024, June VIIRS observations were used as the hemispheric baseline, and zero-intercept proportional fitting was conducted for all other months in the low-latitude zone to derive monthly scaling coefficients. Only pixels south of 33° S latitude with original values of 0 or nodata were replaced by the product of the scaling coefficient and the June radiance field. This design maintains strong temporal constraints from low-latitude observations while avoiding unnecessary modification of valid radiance measurements. Both hemispheric procedures enforced non-negative radiance and relied on unified point sampling, proportional fitting, and parallel block-based writing, ensuring global spatial coverage, continuous monthly time series, and radiometric consistency within and across years.
After completing high-latitude interpolation and threshold-based radiometric correction for the period 2012–2024, we further adopted the temporal calibration strategy proposed by Chen et al. (2021b). This method uses a stretching technique to align the temporal variations of simulated NTL data with the raw NTL data. The adjustment is based on comparing changes between adjacent time points, ensuring that the simulated data maintains consistent temporal trends and aligns with the observed data. Specifically, the monthly VIIRS-like super-resolution results from April 1992 to March 2012 were corrected month-by-month along the temporal dimension using the reconstructed EOG monthly VIIRS observations from January to April 2013 and April to December 2012, alleviating systematic discontinuities across the inter-sensor transition. Finally, the temporally corrected EOG monthly VIIRS observations and the VIIRS-like monthly series for 1992–2012 were combined to generate a global, 500-meter-resolution, long-term VIIRS-like nighttime light product covering 1992–2024.
Following the construction of monthly products, we further generated an annual VIIRS-like nighttime light dataset. Specifically, for the period 1992–2012, the annual NTL values were obtained by averaging the 12 monthly super-resolved VIIRS-like predictions within each year, and time-series calibration was applied using the annual VIIRS composite from 2013, released by EOG, as the radiometric reference. For the EOG monthly VIIRS data from 2012 to 2024, after interpolation and correction, annual NTL values were similarly derived through monthly averaging. Finally, the annual VIIRS-like results for 1992–2011 were seamlessly merged with the annual EOG-VIIRS data for 2012–2024, yielding a globally consistent nighttime light dataset at 500 m resolution spanning 1992–2024.
4.1 NightNet model assessment
A comprehensive quantitative evaluation was conducted to assess the performance of the proposed super-resolution model. Metrics computed on both training and validation sets confirm that NightNet generates high-quality super-resolved NTL estimates. As illustrated in Fig. 6a–c, the evolution of average PSNR, SSIM, and tile-based R2 on the validation set across validation epochs exhibits a consistently increasing trend that reflects progressively improved spatial detail recovery and radiometric consistency. The best checkpoint achieves an average PSNR of 52.42, an average SSIM of 99.30 %, and an average R2 of 0.8078 on the validation set, demonstrating strong quantitative accuracy and structural preservation. Panel (d) presents the convergence behavior of the evaluation loss, indicating stable training dynamics. Panels (e) to (g) further depict the decreasing trajectories of the training auxiliary loss, regression loss, and total loss, showing that the multi-objective optimization effectively reduces training oscillation and enhances model robustness. Panel (h) summarizes the mean loss trend, further confirming that the model achieves full convergence and reliable reconstruction capability across multiple evaluation criteria.
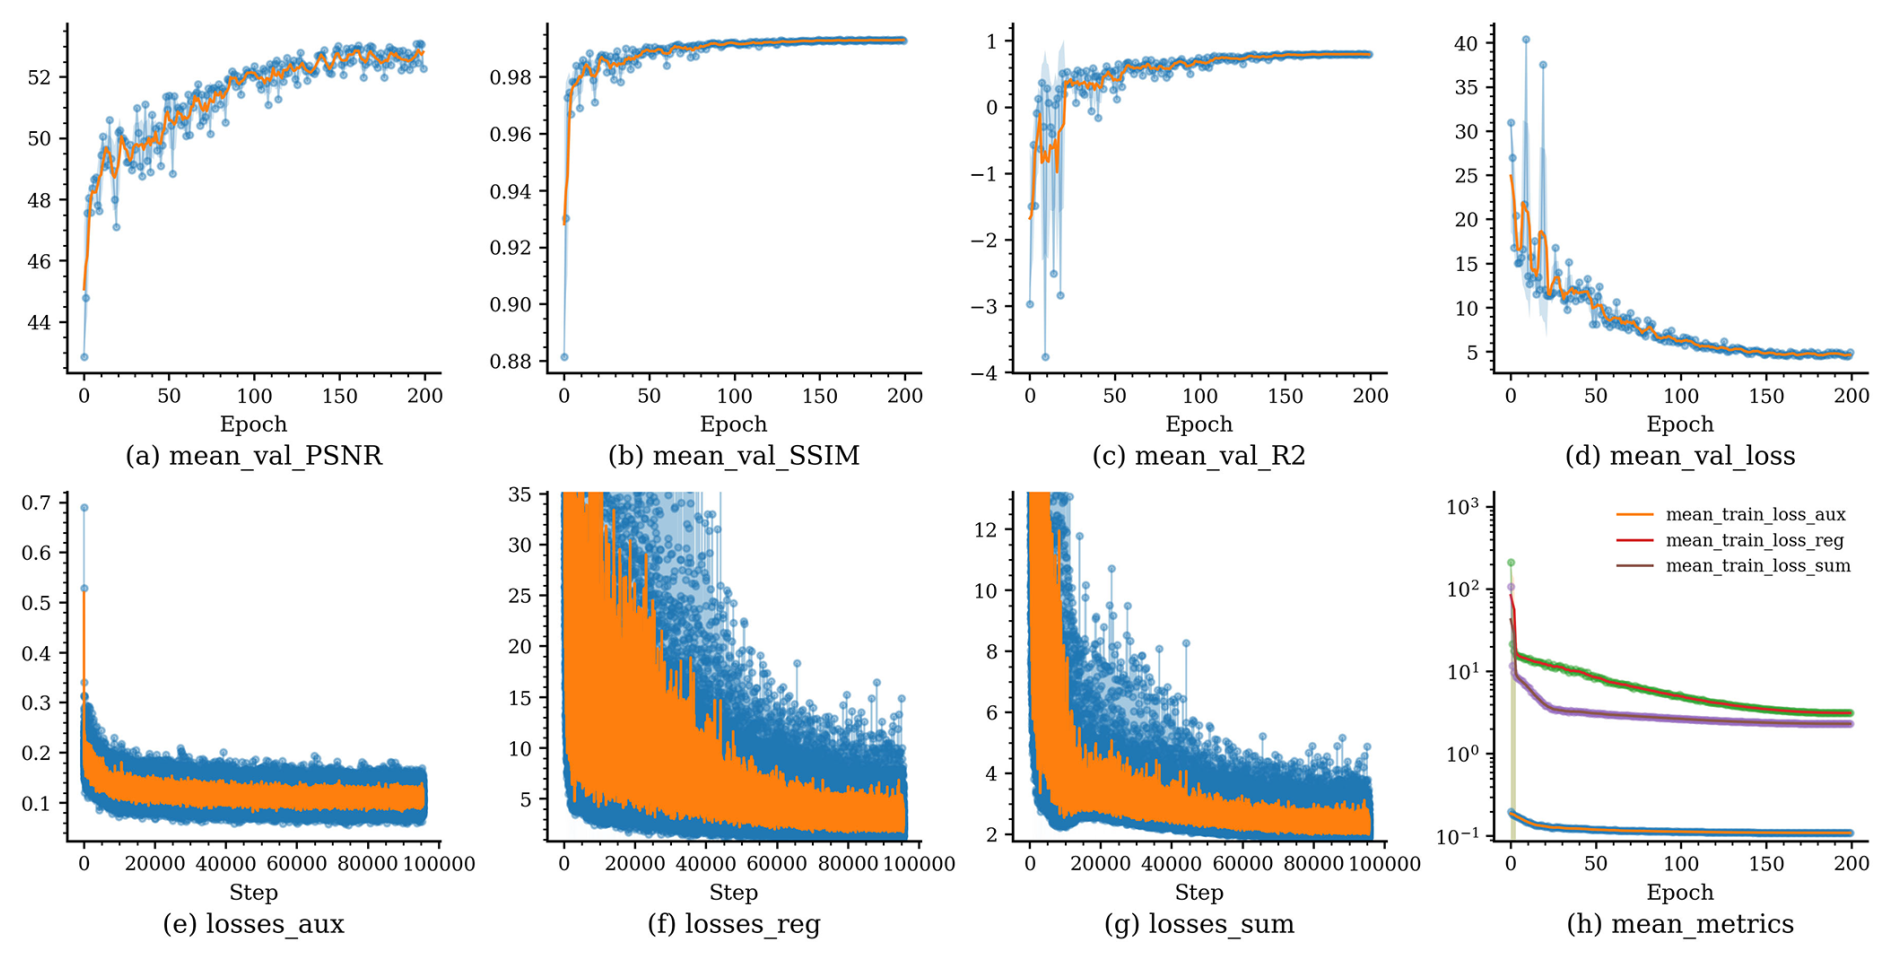
Figure 6The metrics of model training and validation. (a) Validation PSNR; (b) Validation SSIM. (c) Validation tile level R2; (d) Validation loss; (e) Auxiliary loss; (f) Regression loss; (g) Total loss; (h) Loss summary.
To visually assess the reconstruction capability of the proposed model, five representative types of urban regions, as illustrated in Fig. 7, were selected for qualitative comparison, including major metropolitan cores, medium-sized urban clusters, urban corridors, suburban small towns, and sparsely populated remote settlements. Compared with the original DMSP data, which suffers from severe blooming and blurred structural boundaries, the reconstructed results exhibit substantially improved spatial detail, boundary sharpness, and radiometric distribution that closely match the VIIRS observations. Specifically, the model successfully distinguishes multiple urban centers, restores corridor-like settlement patterns, enhances the discernibility of towns and road networks, and effectively suppresses noise and spurious illumination. Overall, the model demonstrates notable improvements in both spatial detail enhancement and radiometric consistency across different spatial scales, validating its effectiveness for cross-sensor NTL super-resolution reconstruction.
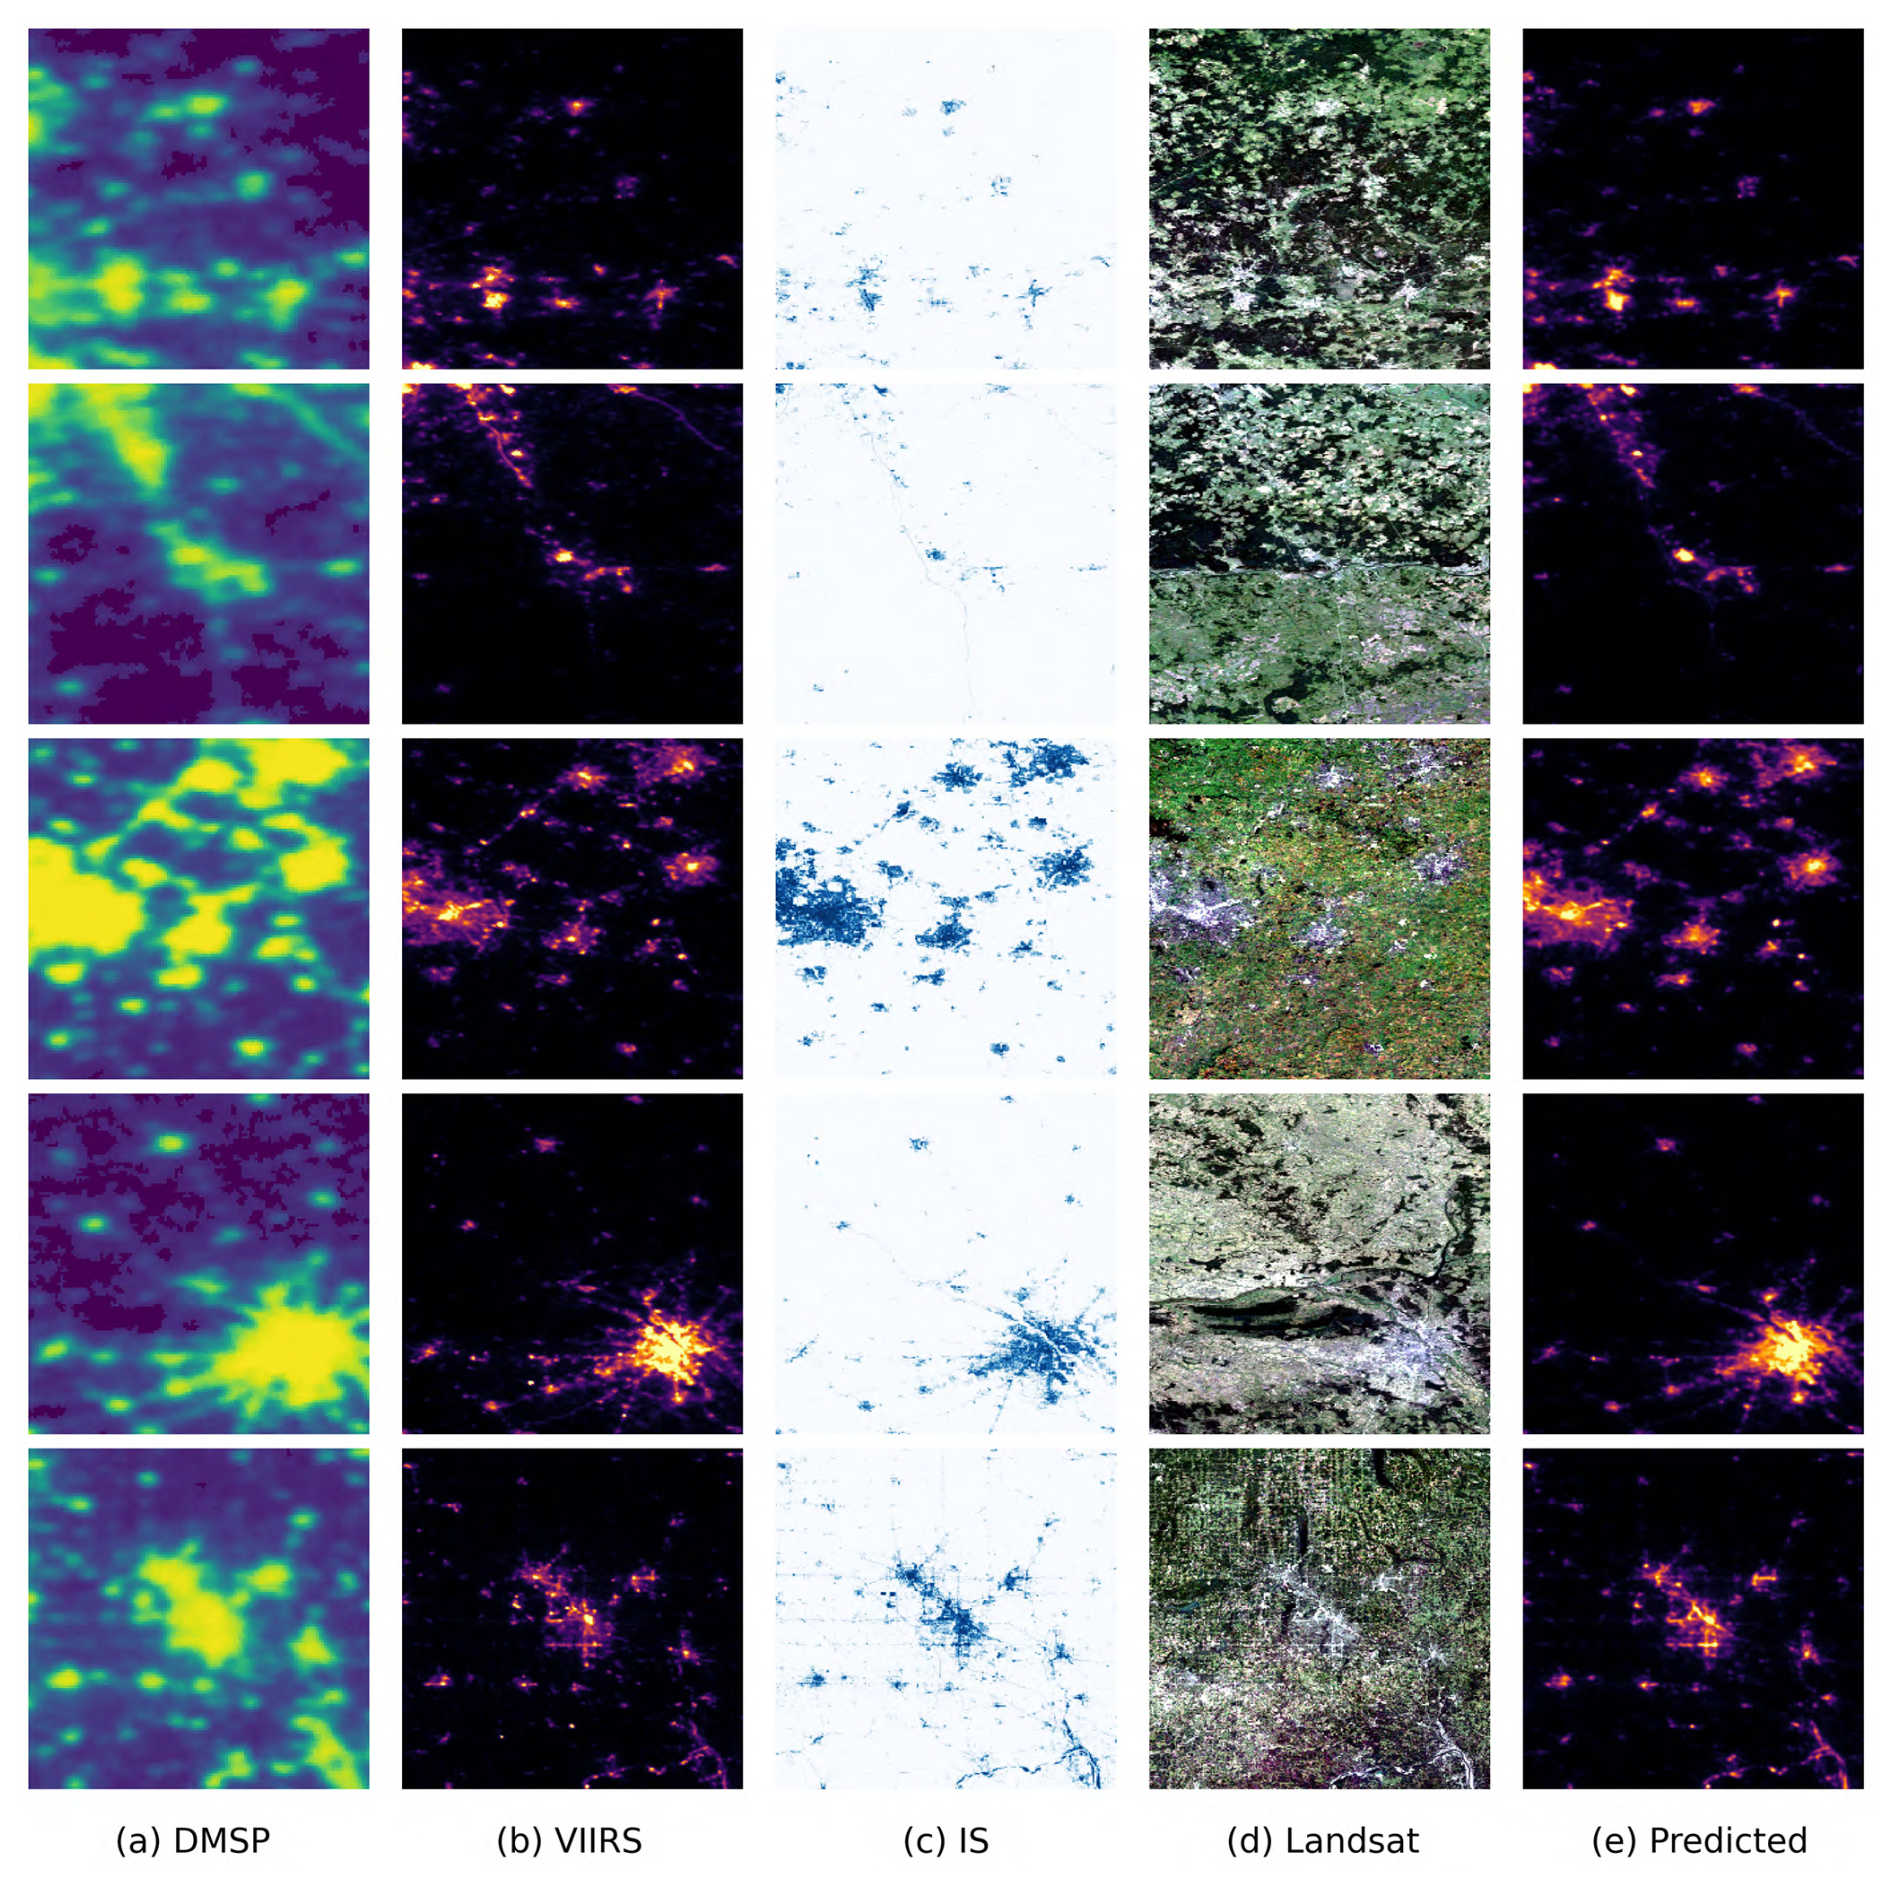
Figure 7Visual comparison of NTL across typical regions in 2013 using the test set. (a) DMSP; (b) VIIRS; (c) Impervious surface (IS); (d) Landsat; (e) Predicted VIIRS-like output.
Table 2Quantitative comparison of the proposed method with baseline networks.
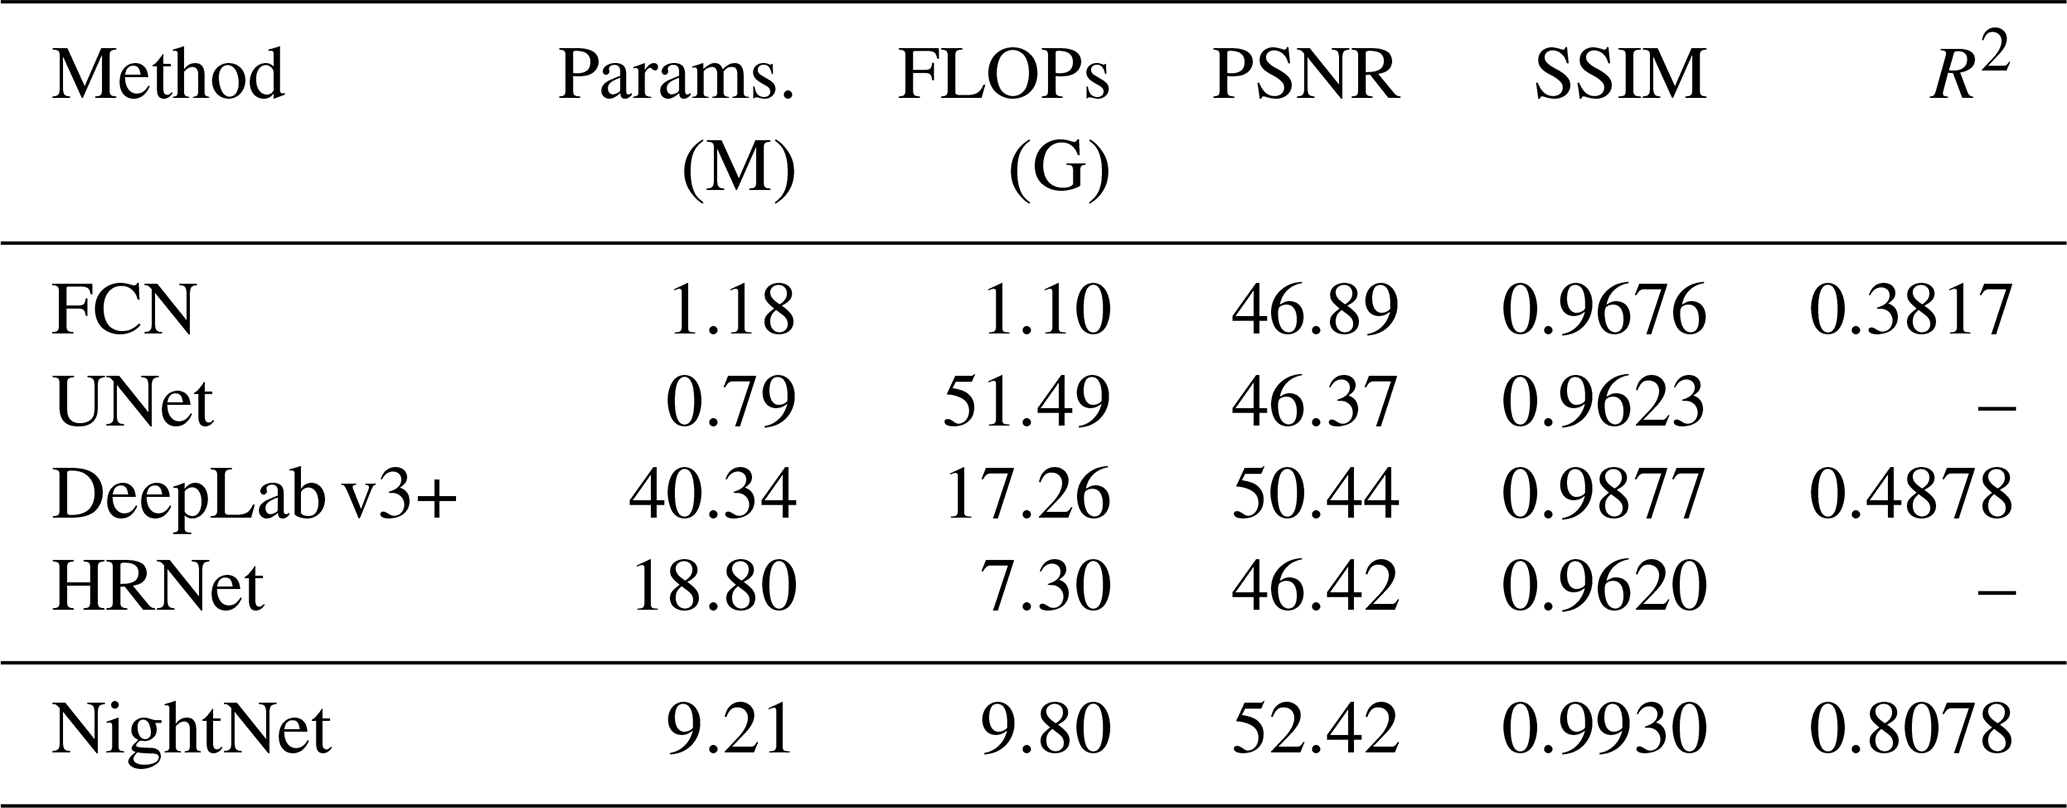
A comparison between NightNet and several widely used representative baseline networks, including FCN (Long et al., 2015), UNet (Ronneberger et al., 2015), DeepLab v3+ (Chen et al., 2018), and HRNet (Wang et al., 2021), was conducted to evaluate the effectiveness of the proposed architecture and clarify the rationale for its design. The quantitative results in terms of model complexity and reconstruction performance are presented in Table 2. As shown, our NightNet achieves the best overall performance, with the highest PSNR (52.42), SSIM (0.9930), and R2 (0.8078), indicating superior reconstruction accuracy and structural consistency. Although some baseline models, such as DeepLab v3+, also show relatively strong performance, their results remain inferior to those of NightNet. Moreover, the DeepLab v3+ model has more model parameters (40.34M parameters) than NightNet (9.21M), yet yields lower reconstruction accuracy. The result indicates that NightNet can achieve better reconstruction performance with relatively lower model complexity and computation.
4.2 Accuracy evaluation
To evaluate the spatial consistency and reconstruction accuracy of the generated dataset at the global scale, we conducted a visual assessment using the reconstructed annual mean VIIRS-like product for 2012 and a comparative analysis of the monthly reconstructions from April to December 2012. The middle panel of Fig. 8 shows the model-generated global NTL intensity in 2012, with aggregated radiance distributions along the longitudinal and latitudinal dimensions. Panel (a) shows the spatial distribution of the reconstructed NTL intensity, expressed in , revealing the global patterns of major cities and urban corridors. This distribution clearly delineates the spatial extent of human activity across all continents. Panels (b) and (c) illustrate the one-degree binned total radiance of the original VIIRS observations shown in orange and the predicted results shown in green along the longitudinal and latitudinal directions, respectively. The two curves exhibit strong agreement, particularly in densely urbanized latitudinal zones. These results indicate that the reconstructed data successfully reproduce the global-scale spatial patterns of the original VIIRS product.
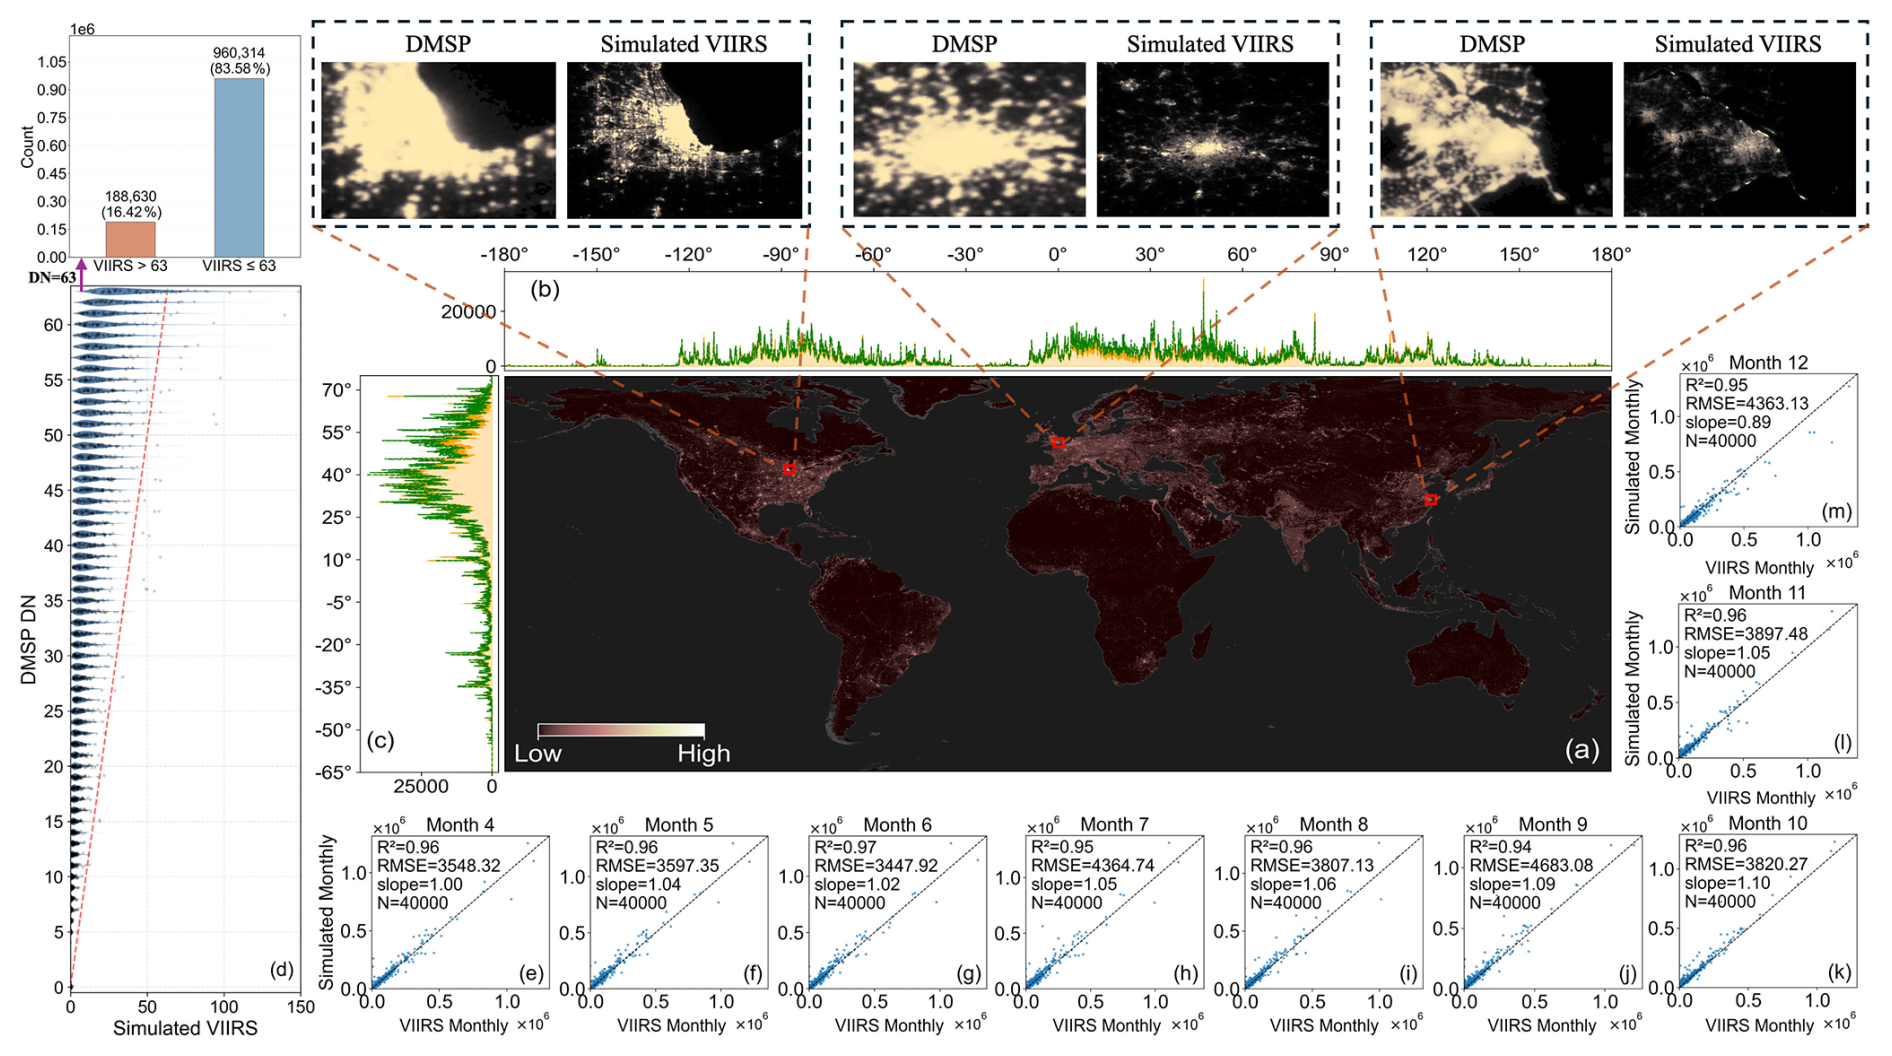
Figure 8The simulated VIIRS-like data. (a) The generated global NTL intensity in 2012. (b) The longitudinal and (c) latitudinal sum of VIIRS NTL (orange) and Predicted VIIRS (green) with 1° bin (unit: ). (d) Distribution of simulated VIIRS NTL across DMSP DN levels. (e)–(m) illustrate the city-level prediction errors of the total monthly VIIRS-like NTL from April to December 2012 at the global scale (unit: ).
Panel (d) further quantifies the radiometric relationship between the reconstructed data and the original DMSP digital number values. Unlike the pronounced saturation plateau at high DN levels in the raw DMSP data, the reconstructed VIIRS-like NTL exhibits a more continuous radiometric response, effectively mapping saturated values into a broader radiance range. This improvement is supported by the statistics in the upper-left panel, where 16.42 % of pixels with DMSP DN =63 are reassigned to simulated VIIRS-like values greater than 63, indicating that a substantial portion of saturated pixels is released from the original upper limit. For visual comparison, representative regions in North America, Europe, and Asia are selected, and all qualitative examples in the top panels are displayed within a fixed range of 0–63 to ensure consistency with the original DMSP scale. Under this unified visualization, the simulated VIIRS-like NTL shows reduced overglow, clearer light boundaries, and enhanced spatial detail, further demonstrating its effectiveness in mitigating blooming effects. As our MVNL dataset is designed to provide a monthly enhanced reference, the accuracy of the monthly reconstructions was further evaluated by comparing simulated and observed data for overlapping months at the city scale. Panels (e) to (m) in Fig. 8 show scatter plot comparisons between the simulated monthly results and the EOG monthly VIIRS observations from April to December 2012. The results demonstrate high radiance consistency at the city scale between the reconstructed and observed data. For all overlapping months, the regression slopes are close to unity, and the coefficients of determination exceed 0.94, while the city-level RMSE values range from 3447 to 4683, indicating relatively low errors.
Pixel-scale differences between the simulated results and the observed monthly VIIRS data during overlapping periods were quantitatively examined using the month-by-month scatter density comparisons shown in Fig. 9. Each panel represents one month, with the horizontal and vertical axes denoting the observed radiance and predicted values, respectively. The dashed line indicates the one-to-one reference, while the red solid line corresponds to the linear regression fit. The scatter points are closely aligned with the one-to-one line across all months, indicating well pixel-level agreement between the simulated results and the observations. The coefficient of determination R2 ranges approximately from 0.53 to 0.70, and the RMSE remains stable at about 13 to 15 , demonstrating consistent radiometric reconstruction accuracy over time. Although the dispersion of points increases slightly at higher radiance levels, reflecting greater uncertainty in intensely lit areas, the underlying linear relationship remains clear. Taken together, these results indicate that the generated VIIRS-like data effectively reproduce the radiance distribution characteristics of NPP-VIIRS NTL at the pixel scale and maintain stable reconstruction performance across multiple months.
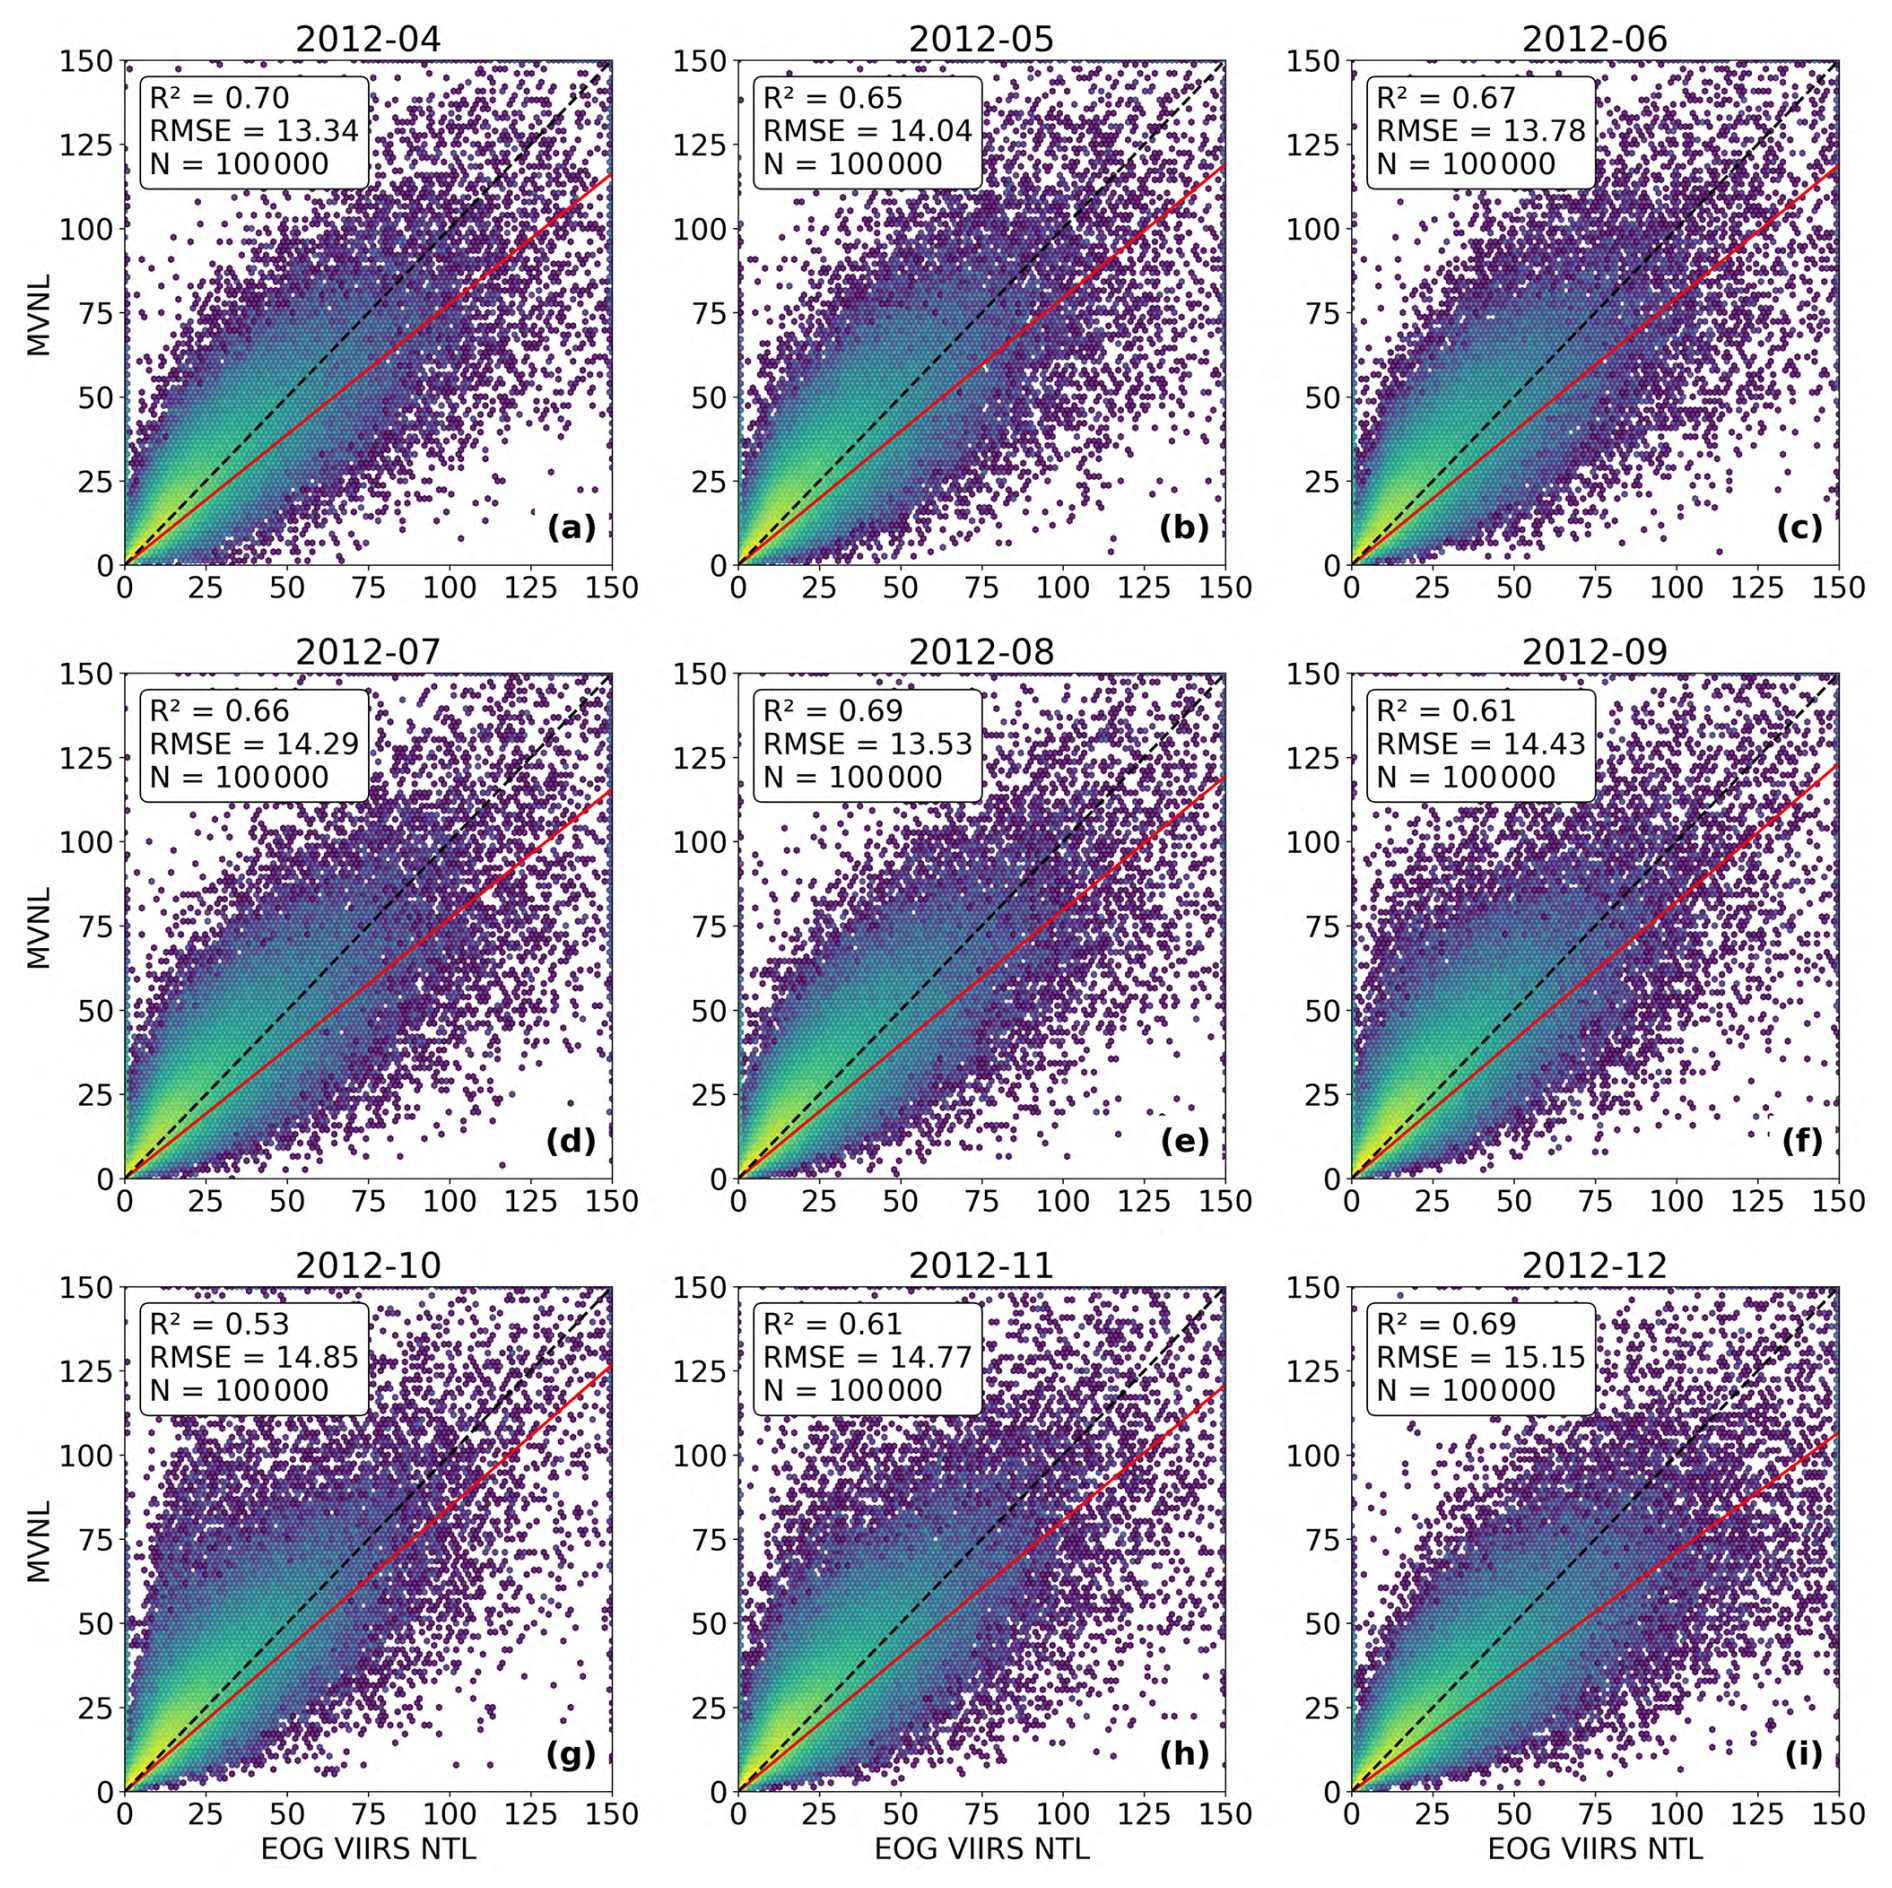
Figure 9Pixel-level scatter density plots comparing simulated VIIRS-like NTL values with NPP-VIIRS observations for randomly sampled points (100 000 points) from April to December 2012.
To quantitatively assess the pixel-level reconstruction consistency of the generated VIIRS-like data across different continental regions and temporal snapshots, Fig. 10 presents cross-continental scatter density plots based on randomly selected pixels, comparing predicted values with NPP-VIIRS NTL for April, August, and December 2012. The R2 coefficients across the six continents consistently range from 0.60 to 0.76 for all months, while the RMSE values range from 13 to 17 , indicating stable pixel-level reconstruction accuracy at the global scale. Asia, North America, and Europe exhibit relatively higher agreement, with R2 values approaching or exceeding 0.70 in multiple months and more concentrated scatter distributions, reflecting stronger reconstruction capability in regions with richer radiance variability and higher levels of urbanization. In contrast, Africa, South America, and Oceania show slightly lower yet still robust correlations, with R2 remaining above 0.60 and scatter points largely clustered in low-radiance ranges, consistent with generally weaker NTL and a limited dynamic range in these regions. Comparisons across months reveal only minor variations in both R2 and RMSE for each continent, indicating a high degree of temporal stability of the model. As illustrated in Fig. 10, the quantitative metrics and the distributional patterns demonstrate that the constructed VIIRS-like dataset effectively reproduces the pixel-level radiance characteristics of NPP-VIIRS observations across diverse continental regions and representative months.
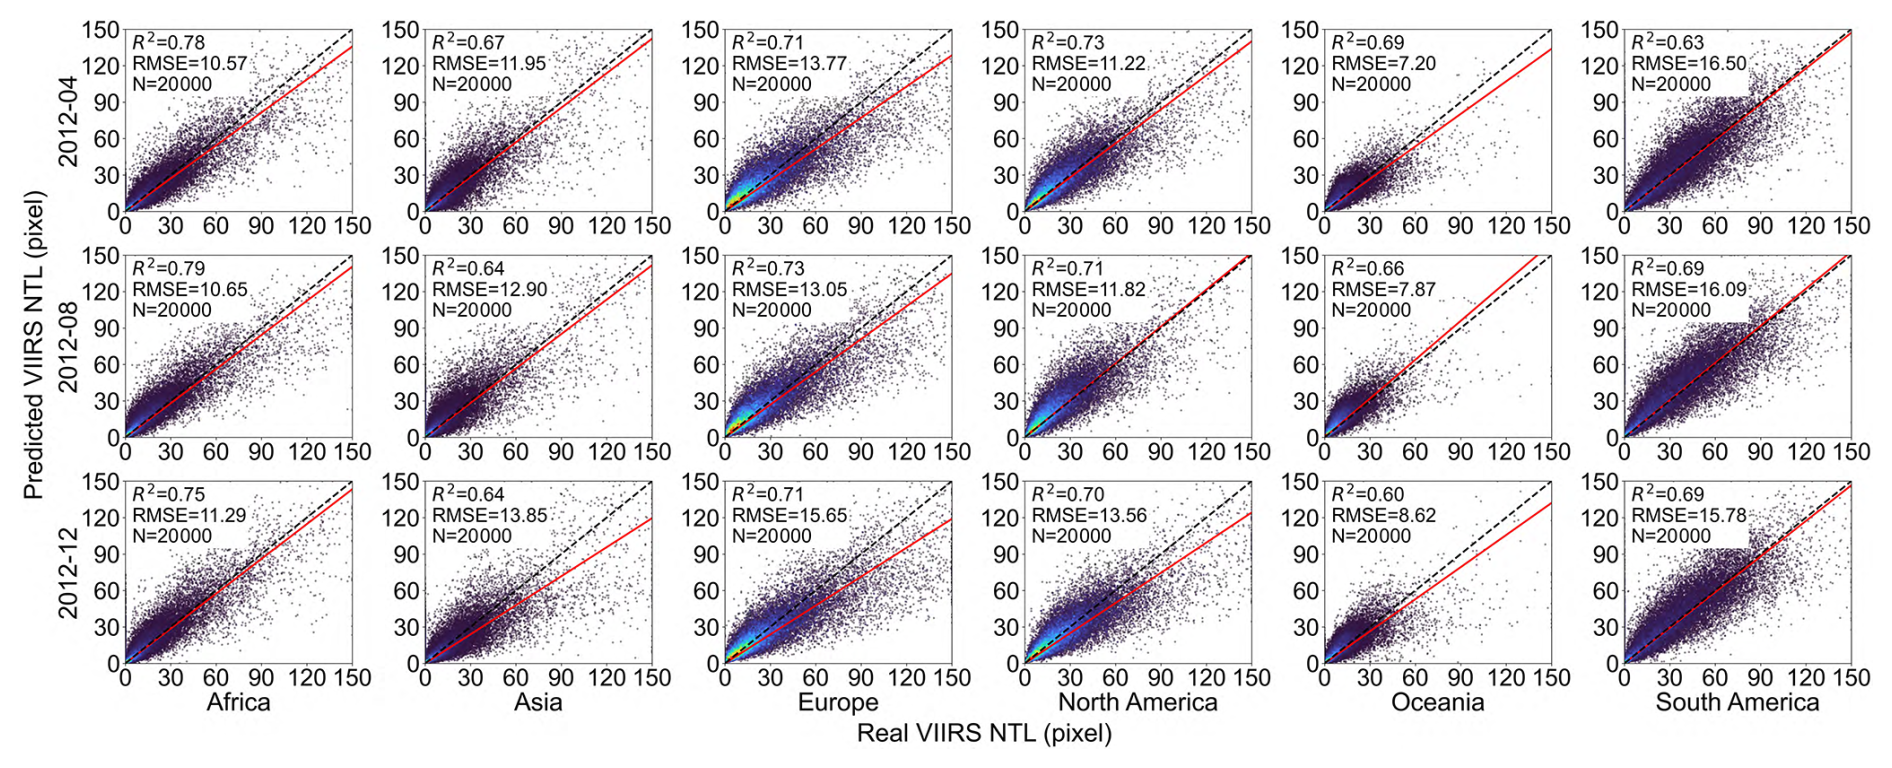
Figure 10Pixel-level scatter density plot comparing simulated VIIRS-like NTL values with NPP VIIRS data across six continents for April 2012, August 2012, and December 2012 (unit: ).
At the national scale, reconstruction accuracy shows discernible cross-country variation. Pixel-level validation was conducted using simulated results for April and December 2012 across ten representative countries: Canada, the United States, Germany, Australia, Japan, China, South Africa, Mexico, Brazil, and India. Figures 11 and 12 show scatter density plots comparing predicted VIIRS-like NTL values with corresponding NPP-VIIRS observations, with dashed lines denoting the 1:1 reference and solid lines indicating linear regression fits. For both months, reconstruction performance remains consistent, with R2 values generally ranging from approximately 0.67 to 0.84 and RMSE values concentrated between about 3.0 and 7.0 , indicating stable pixel-level accuracy. Higher agreement is observed in the United States, Germany, Japan, Australia, and Brazil, where R2 values approach or exceed 0.75 and scatter distributions are more compact, reflecting robust performance in highly urbanized settings. In contrast, China, India, Mexico, and South Africa exhibit slightly lower but stable R2 values around 0.70, with greater dispersion at higher radiance levels, consistent with more substantial spatial heterogeneity and wider brightness dynamics.
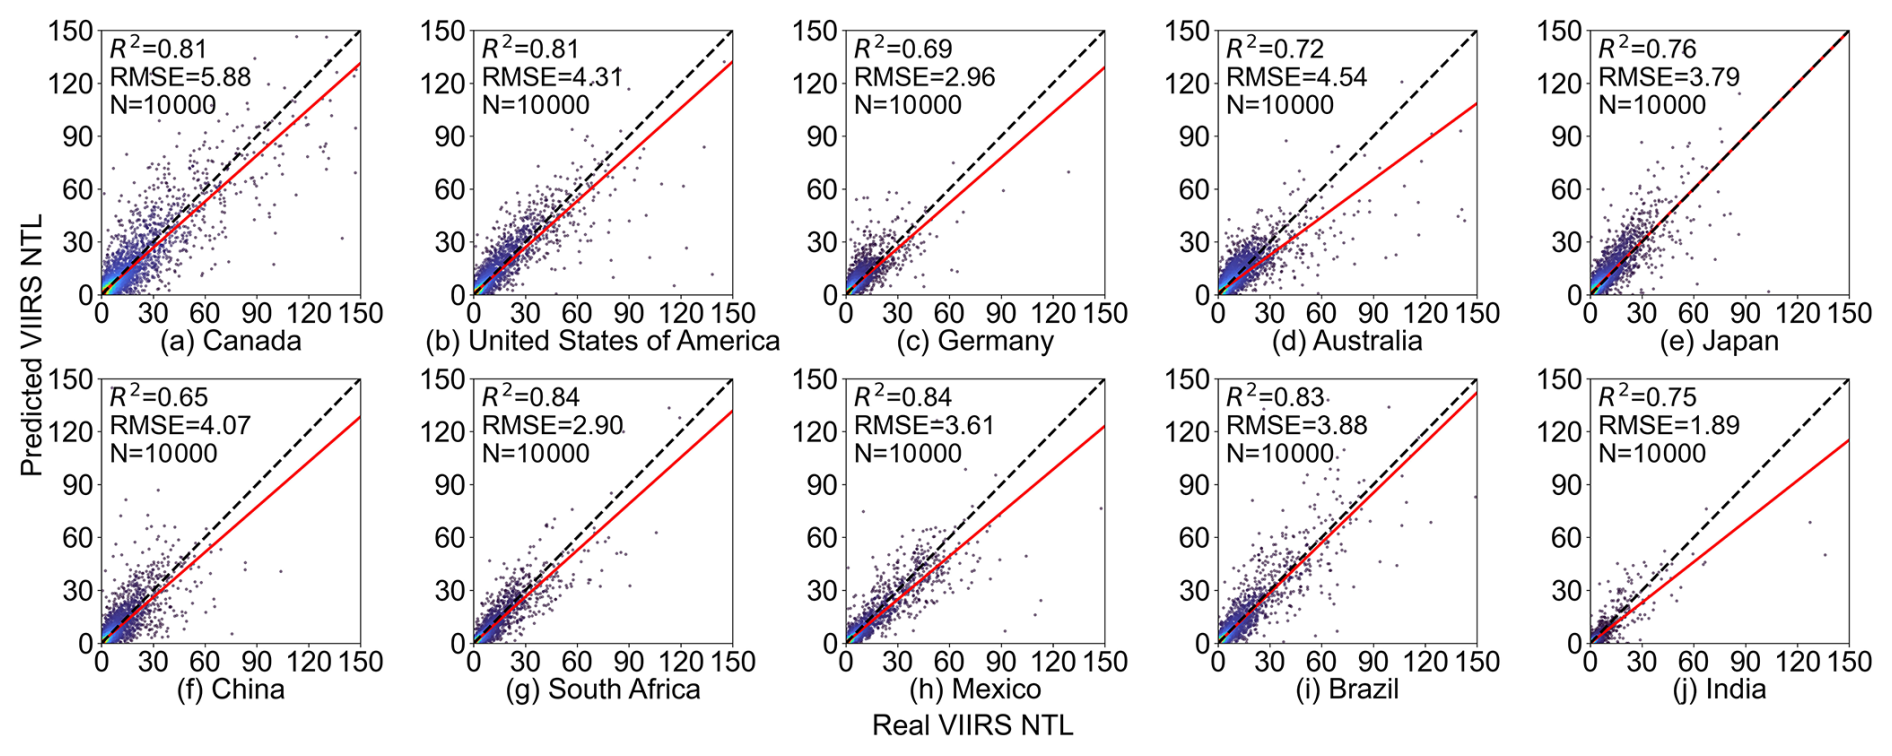
Figure 11Pixel-level scatter density plot of predicted and NPP-VIIRS NTL values for 10 selected countries in April 2012 (unit: ).
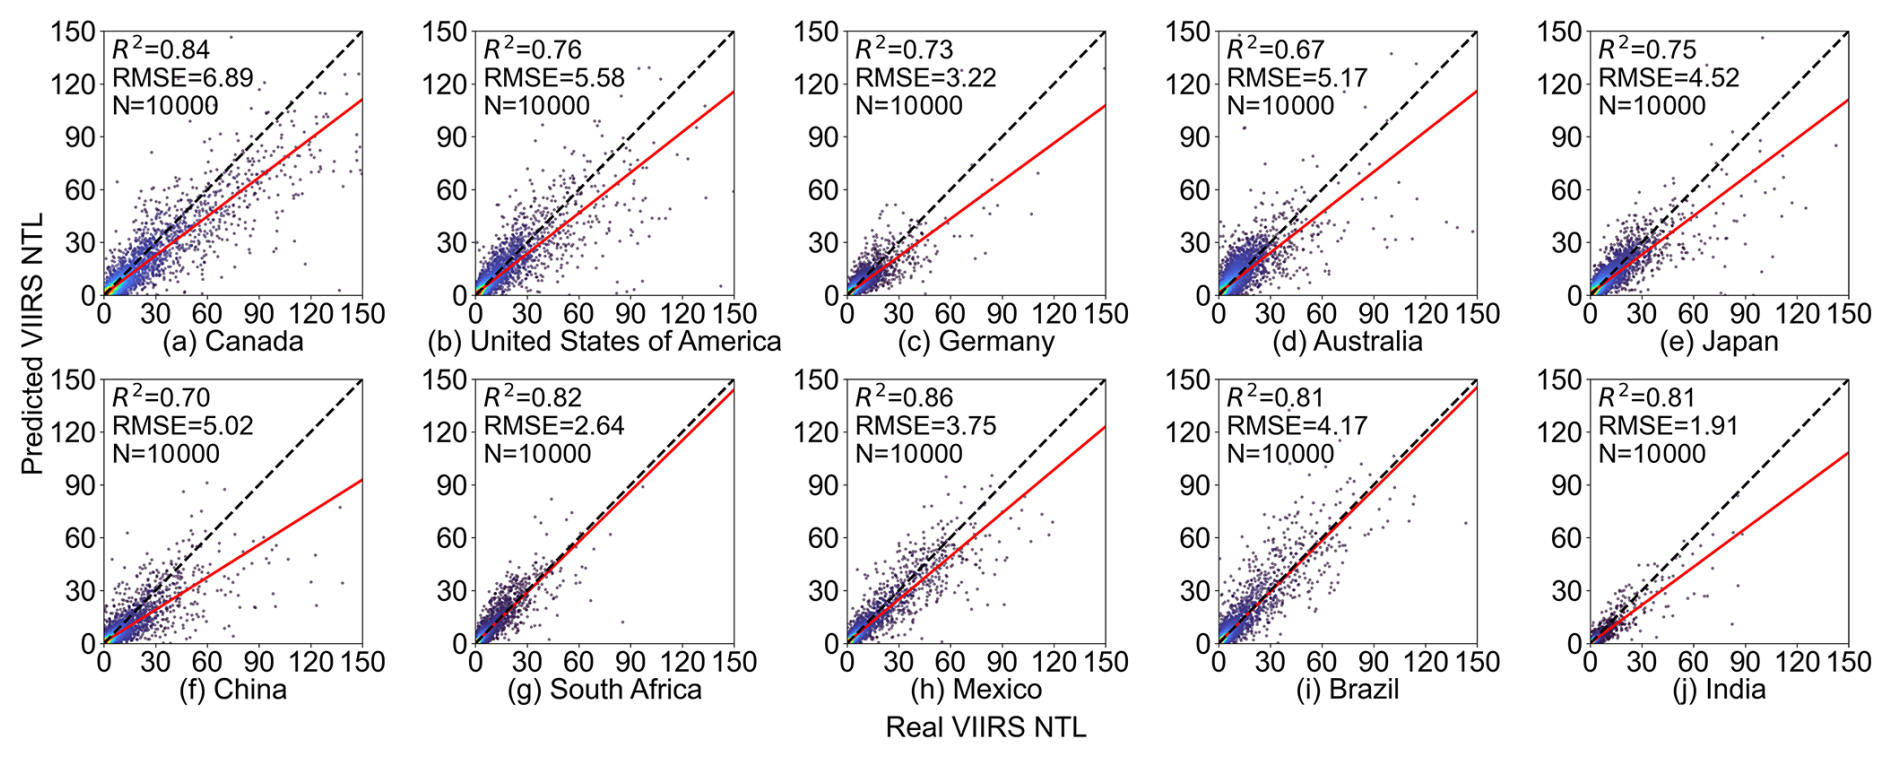
Figure 12Pixel-level scatter density plot of predicted and NPP-VIIRS NTL values for 10 selected countries in December 2012 (unit: ).
National-scale reconstruction consistency was further examined through city-level aggregation, as illustrated in Figs. 13 and 14 for April and December 2012. The city data used in our study is based on the GUB dataset from 2010 (Li et al., 2020b). Aggregating pixel-level signals to urban units effectively suppresses local noise and provides a more direct assessment of radiometric agreement at the country level. In both months, city-level scatter points across all countries cluster closely around the 1:1 reference line, with stable regression relationships and consistently high coefficients of determination, exceeding 0.95 for most cases. Correspondingly, RMSE values are markedly lower than those obtained from pixel-level evaluations, indicating enhanced consistency under spatial aggregation. The United States, Germany, Japan, Australia, and Brazil show particularly strong linear agreement in both months, with regression lines nearly coinciding with the 1:1 line, demonstrating the model's ability to accurately reproduce city-scale NTL totals. Although China, India, Mexico, and South Africa exhibit greater heterogeneity in urban size and lighting distribution, predicted values remain highly consistent with observations, indicating robust performance across diverse urban systems and development contexts. The results confirm that city-level aggregation substantially reinforces the stability and reliability of national-scale VIIRS-like NTL reconstruction.
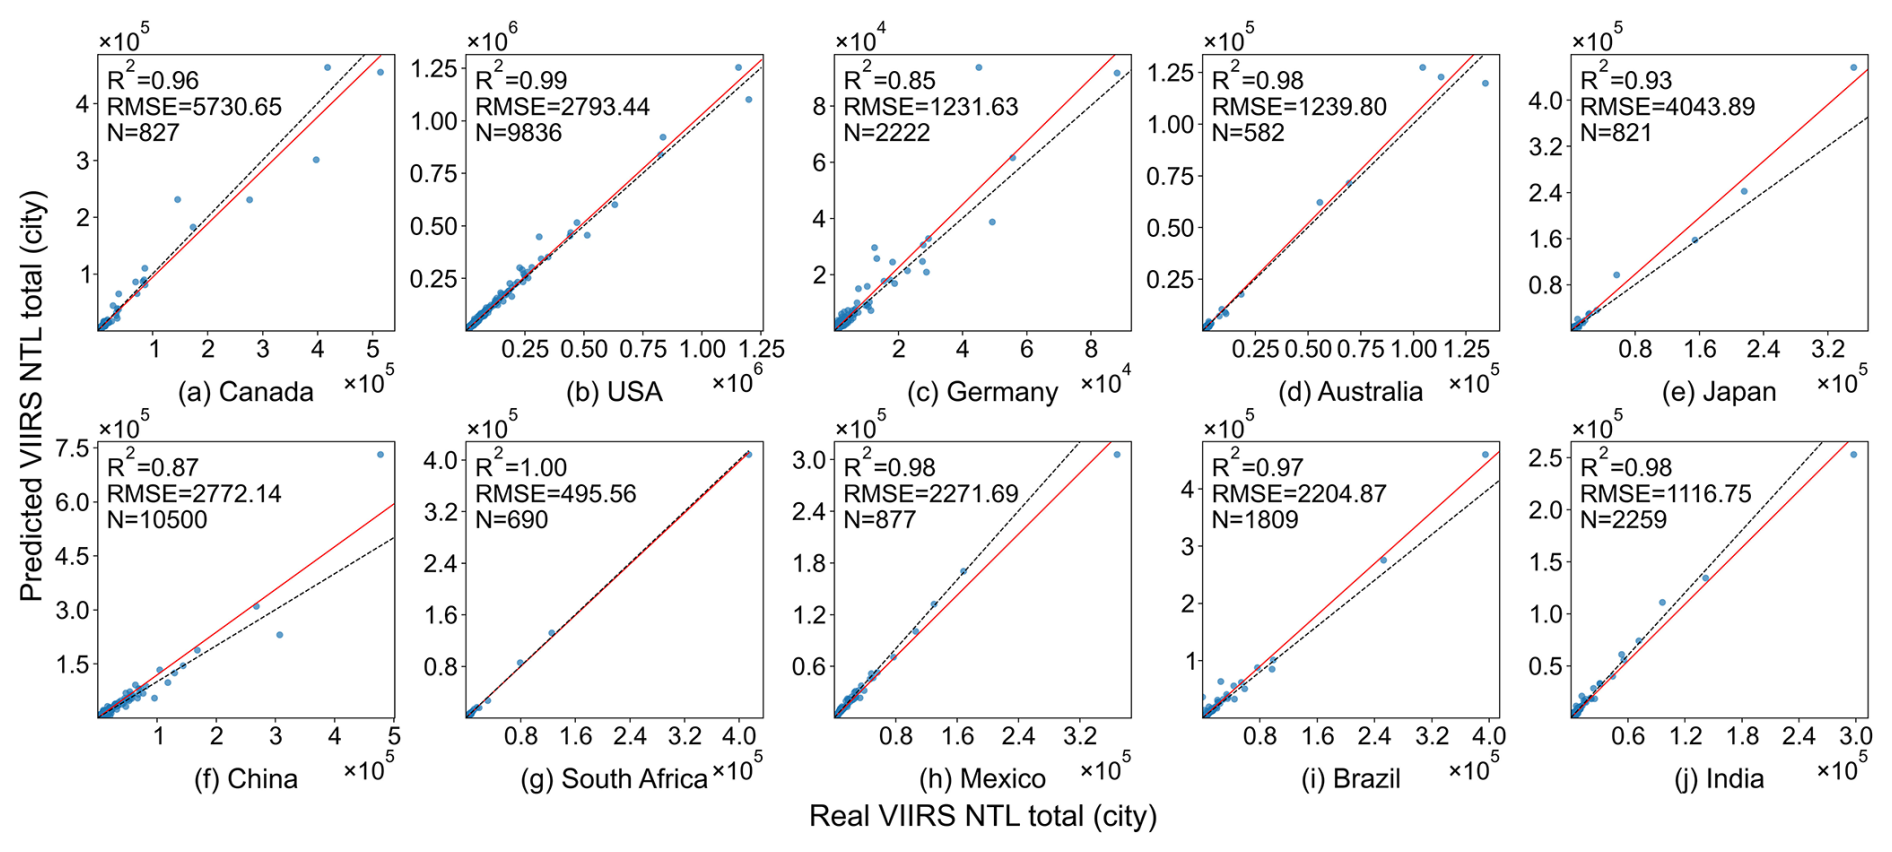
Figure 13City-level scatter density plot of predicted and NPP-VIIRS NTL values for 10 selected countries in April 2012 (unit: ).
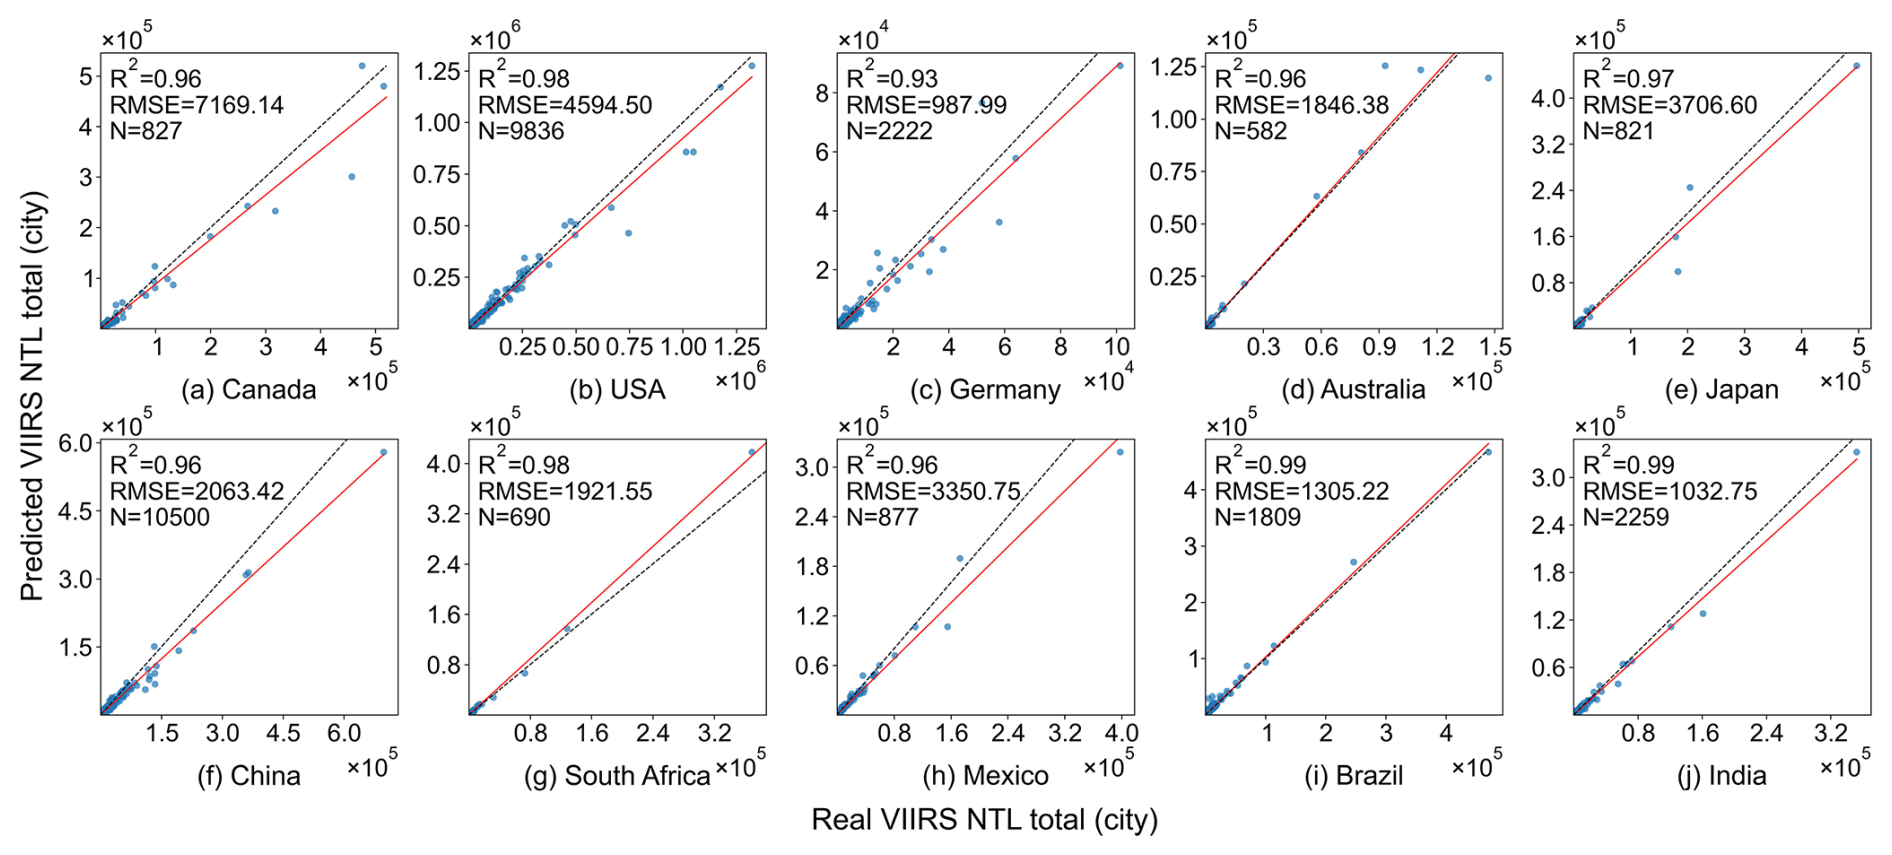
Figure 14City-level scatter density plot of predicted and NPP-VIIRS NTL values for 10 selected countries in December 2012 (unit: ).
Building on the monthly VIIRS-like products, annual NTL datasets were further generated through temporal averaging. Their reconstruction accuracy was quantitatively evaluated by comparing the proposed VIIRS-like annual results with two publicly available datasets, namely NPP-VIIRS-like (Chen et al., 2021b) and SVNL (Chen et al., 2024), at both pixel and city-aggregated scales, as shown in Fig. 15. The upper panels (a–c) illustrate pixel-level scatter relationships between each dataset and the corresponding NPP VIIRS annual observations, where the proposed VIIRS-like product exhibits the highest agreement with an R2 of 0.72, outperforming NPP-VIIRS-like with an R2 of 0.58 and SVNL with an R2 of 0.53, while also achieving lower RMSE values, indicating more stable radiance reconstruction performance. In contrast, the comparison datasets show greater dispersion at higher radiance levels and more pronounced deviations from the one-to-one reference. The lower panels (d–f) present the comparison at the city-aggregated level using total urban NTL, and all three datasets show strong linear relationships with NPP VIIRS. However, the proposed product demonstrates clear advantages in consistency and stability, with an R2 of 0.98 and substantially lower RMSE than the two reference datasets.
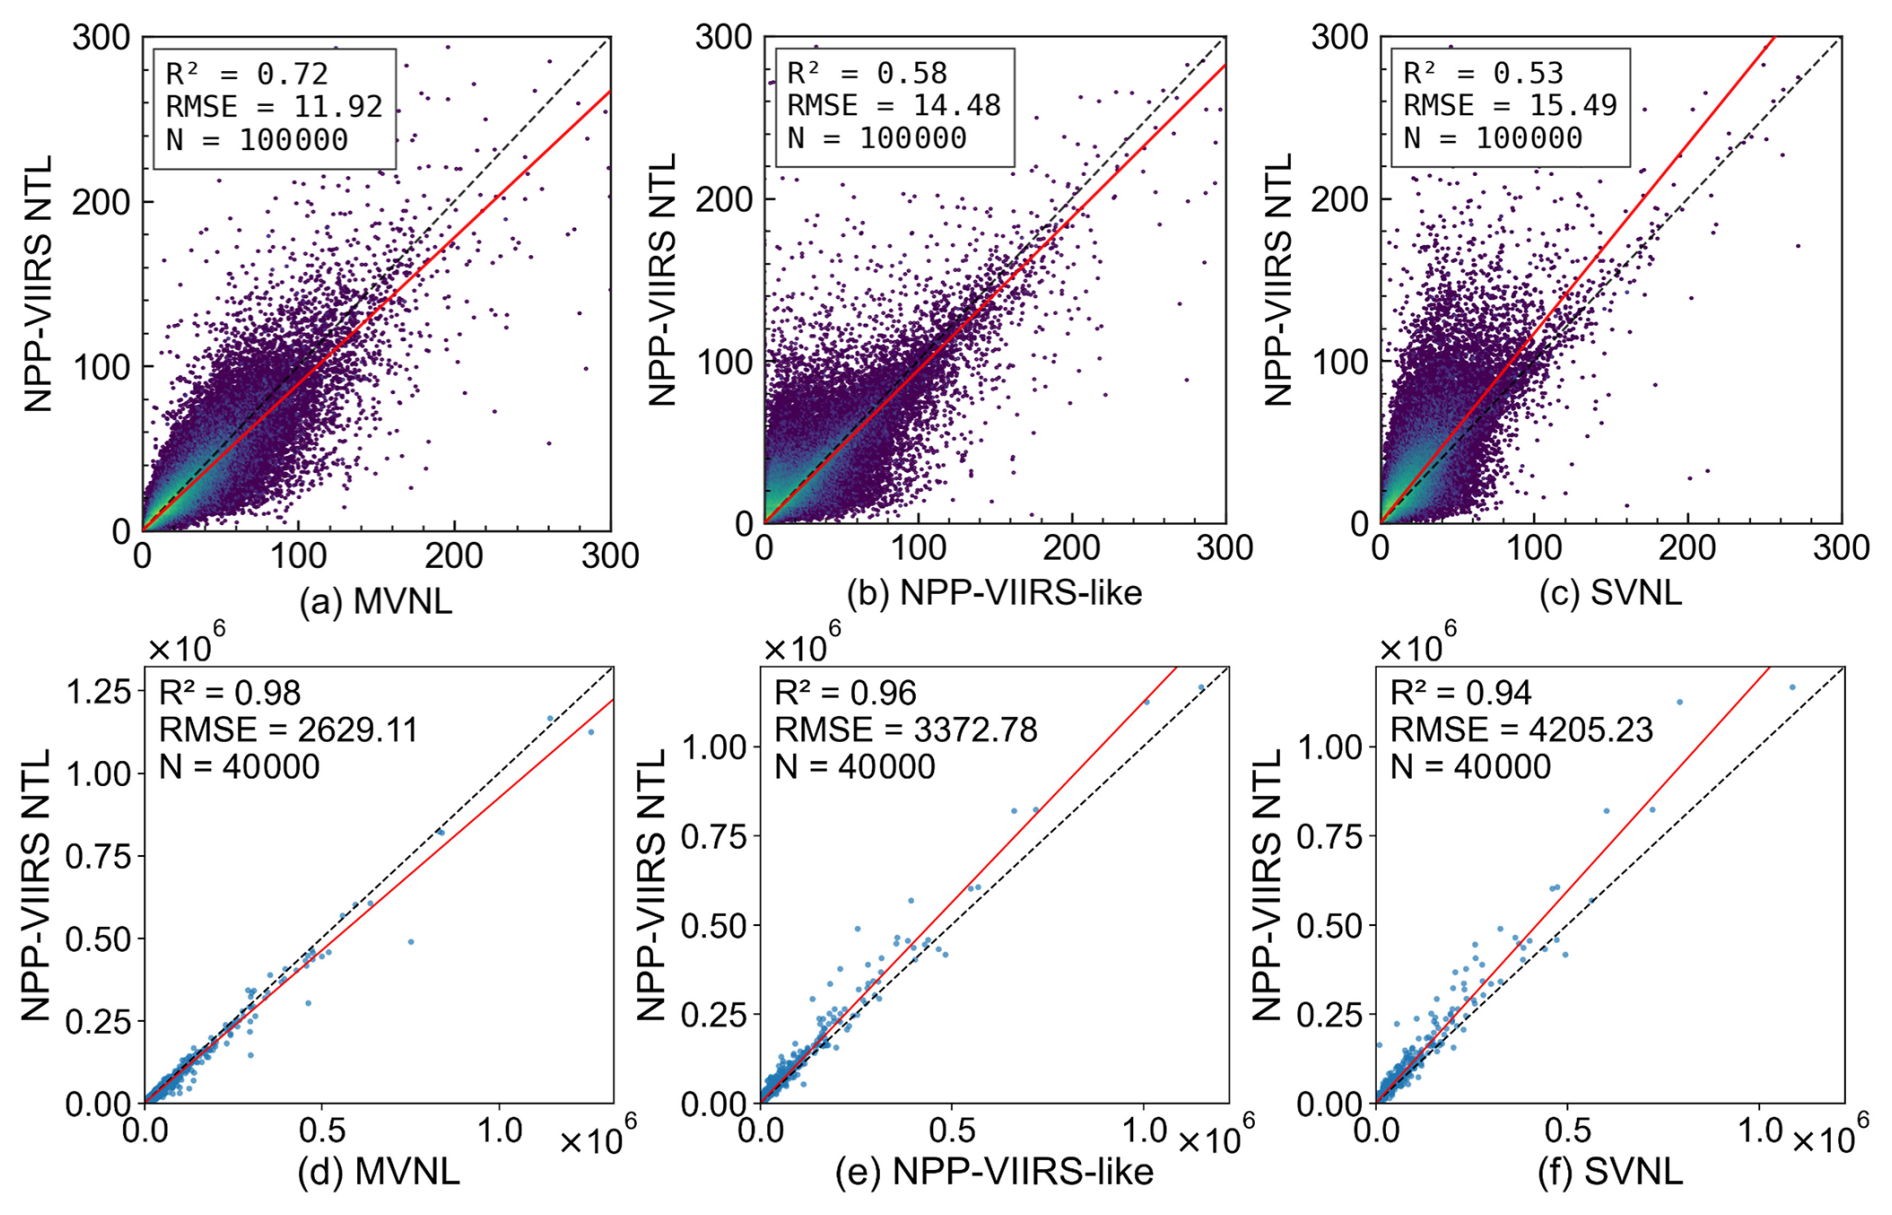
Figure 15Scatter plots comparing different simulated VIIRS-like NTL with NPP-VIIRS NTL data in 2012 at the global pixel level (a: Ours, b: NPP-VIIRS-like, c: SVNL) and the city level, with only the top 40 000 cities by area included (d: Ours, e: NPP-VIIRS-like, f: SVNL) (unit: ).
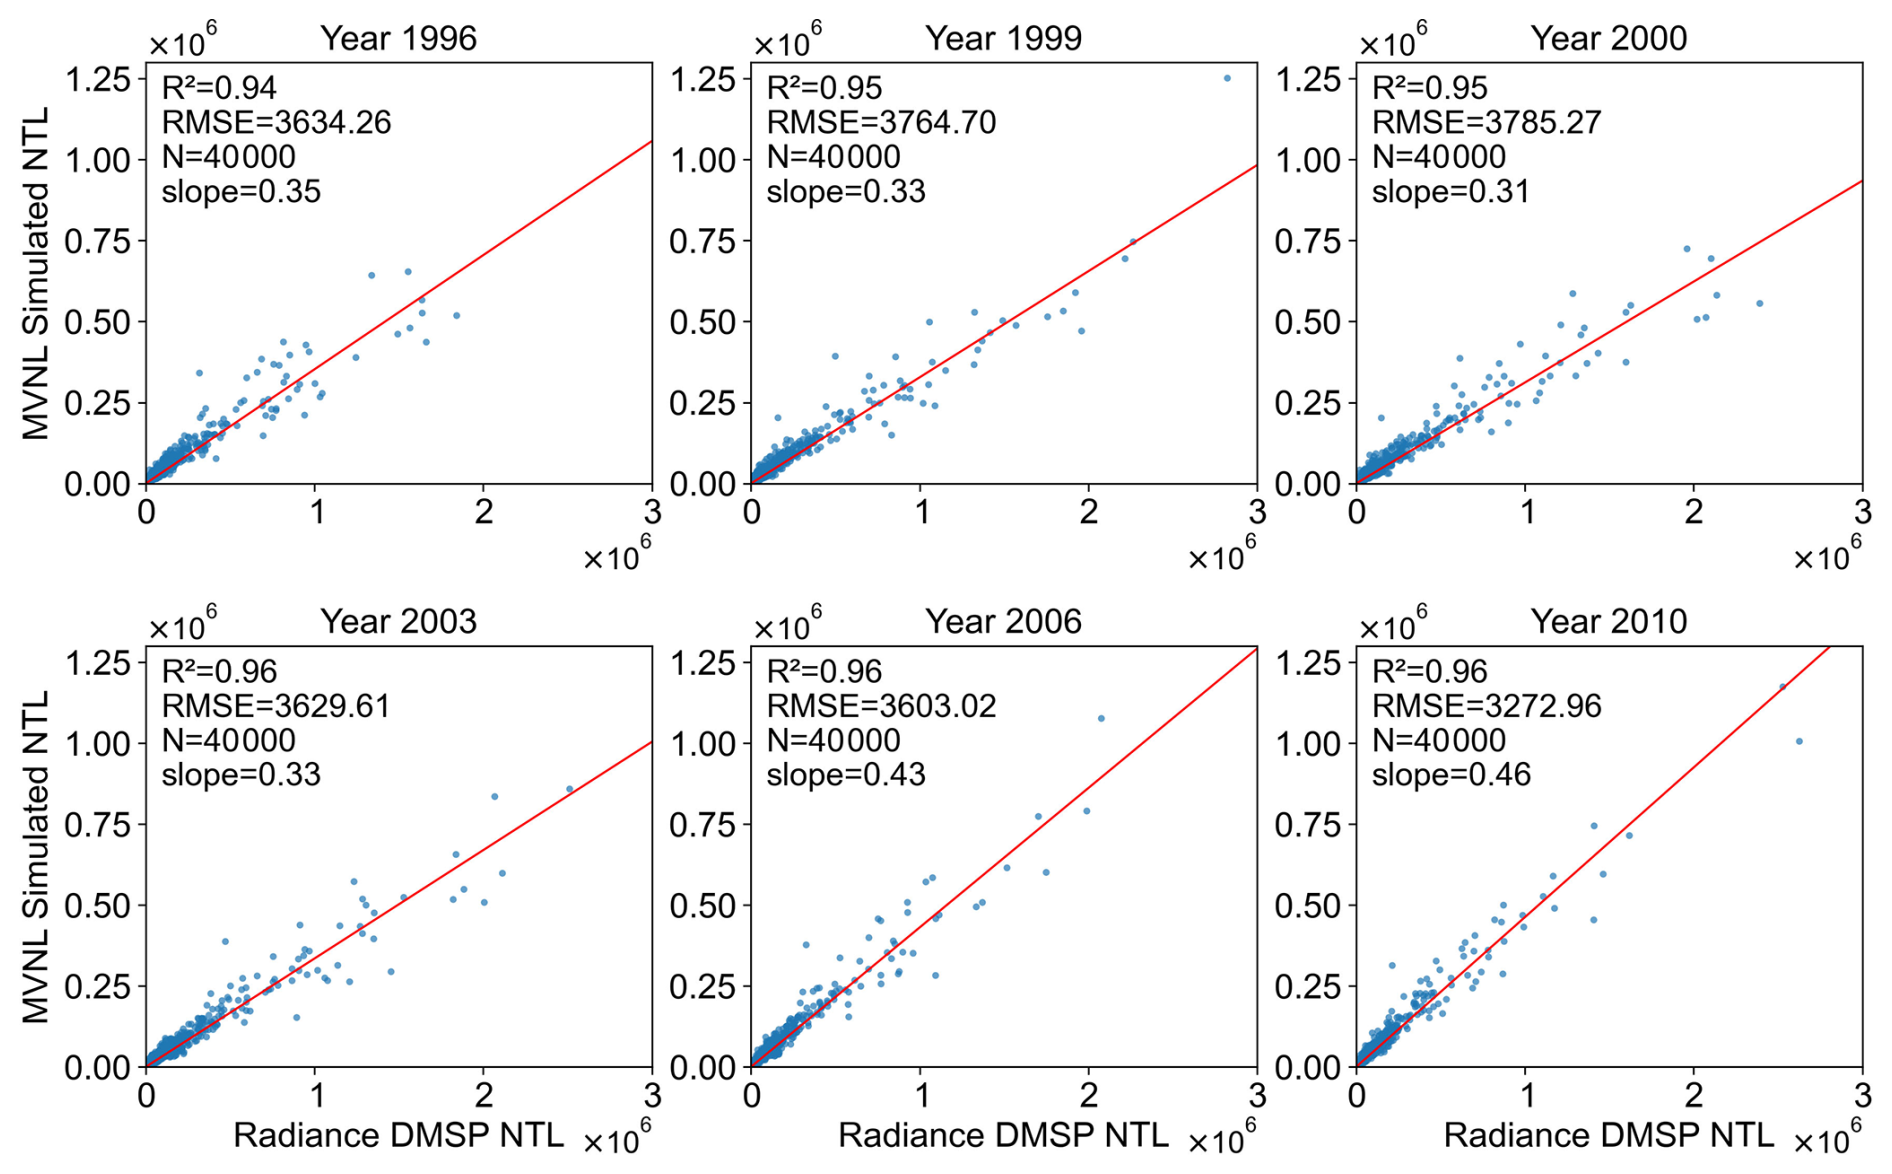
Figure 16Comparison between radiance-calibrated DMSP-OLS NTL and our extended NPP-VIIRS-like NTL (unit: ) at the city level for (a) 1996, (b) 1999, (c) 2000, (d) 2003, (e) 2006, and (f) 2010.
Building on the annual VIIRS-like products, Fig. 16 evaluates radiometric consistency across sensors and decades by comparing, at the city-aggregated level, radiance-calibrated DMSP-OLS NTL with the simulated VIIRS-like data. Six representative years, 1996, 1999, 2000, 2003, 2006, and 2010, are examined using scatter plots of city-level total radiance, with DMSP-OLS values on the horizontal axis and VIIRS-like values on the vertical axis. Across all years, strong linear relationships are observed, with R2 consistently between 0.94 and 0.96, indicating that VIIRS-like data preserve intercity brightness patterns over long-time spans. Regression slopes ranging from roughly 0.31 to 0.46 reflect a smooth transition to a higher dynamic range of radiance while maintaining relative spatial contrasts. RMSE values vary little across years, suggesting stable city-scale mapping performance. These results demonstrate a robust linkage between DMSP-OLS and VIIRS-like NTL at the urban scale, supporting the construction of a consistent long-term NTL record.
4.3 Long-term monthly time series (1992–2024) of globally reconstructed VIIRS-like NTL data
Based on the accuracy evaluation, a global monthly VIIRS-like NTL long-term time series covering 1992–2024 has been compiled. The temporal evolution of global monthly NTL totals and the effects of successive processing stages are summarized in Fig. 17. As illustrated in Fig. 17a, the original monthly VIIRS observations released by EOG for 2012–2024 are compared with the interpolated results. The missing areas in high-latitude regions are filled via interpolation, resulting in higher values. At the same time, the intrinsic month-to-month variability is preserved, and the overall temporal profile becomes smoother and more continuous. As shown in Fig. 17b, the VIIRS-like monthly series reconstructed from DMSP super-resolution results for 1992–2012 is presented before and after temporal calibration, demonstrating that the calibrated series achieves improved continuity with subsequent VIIRS observations in terms of long-term trends and interannual variability, alleviating potential systematic discontinuities during the cross-sensor transition. As presented in Fig. 17c, the final integrated global monthly VIIRS-like NTL dataset spanning 1992–2024 exhibits a stable long-term growth trajectory and pronounced seasonal fluctuations over more than three decades, without evident abrupt shifts or breaks.
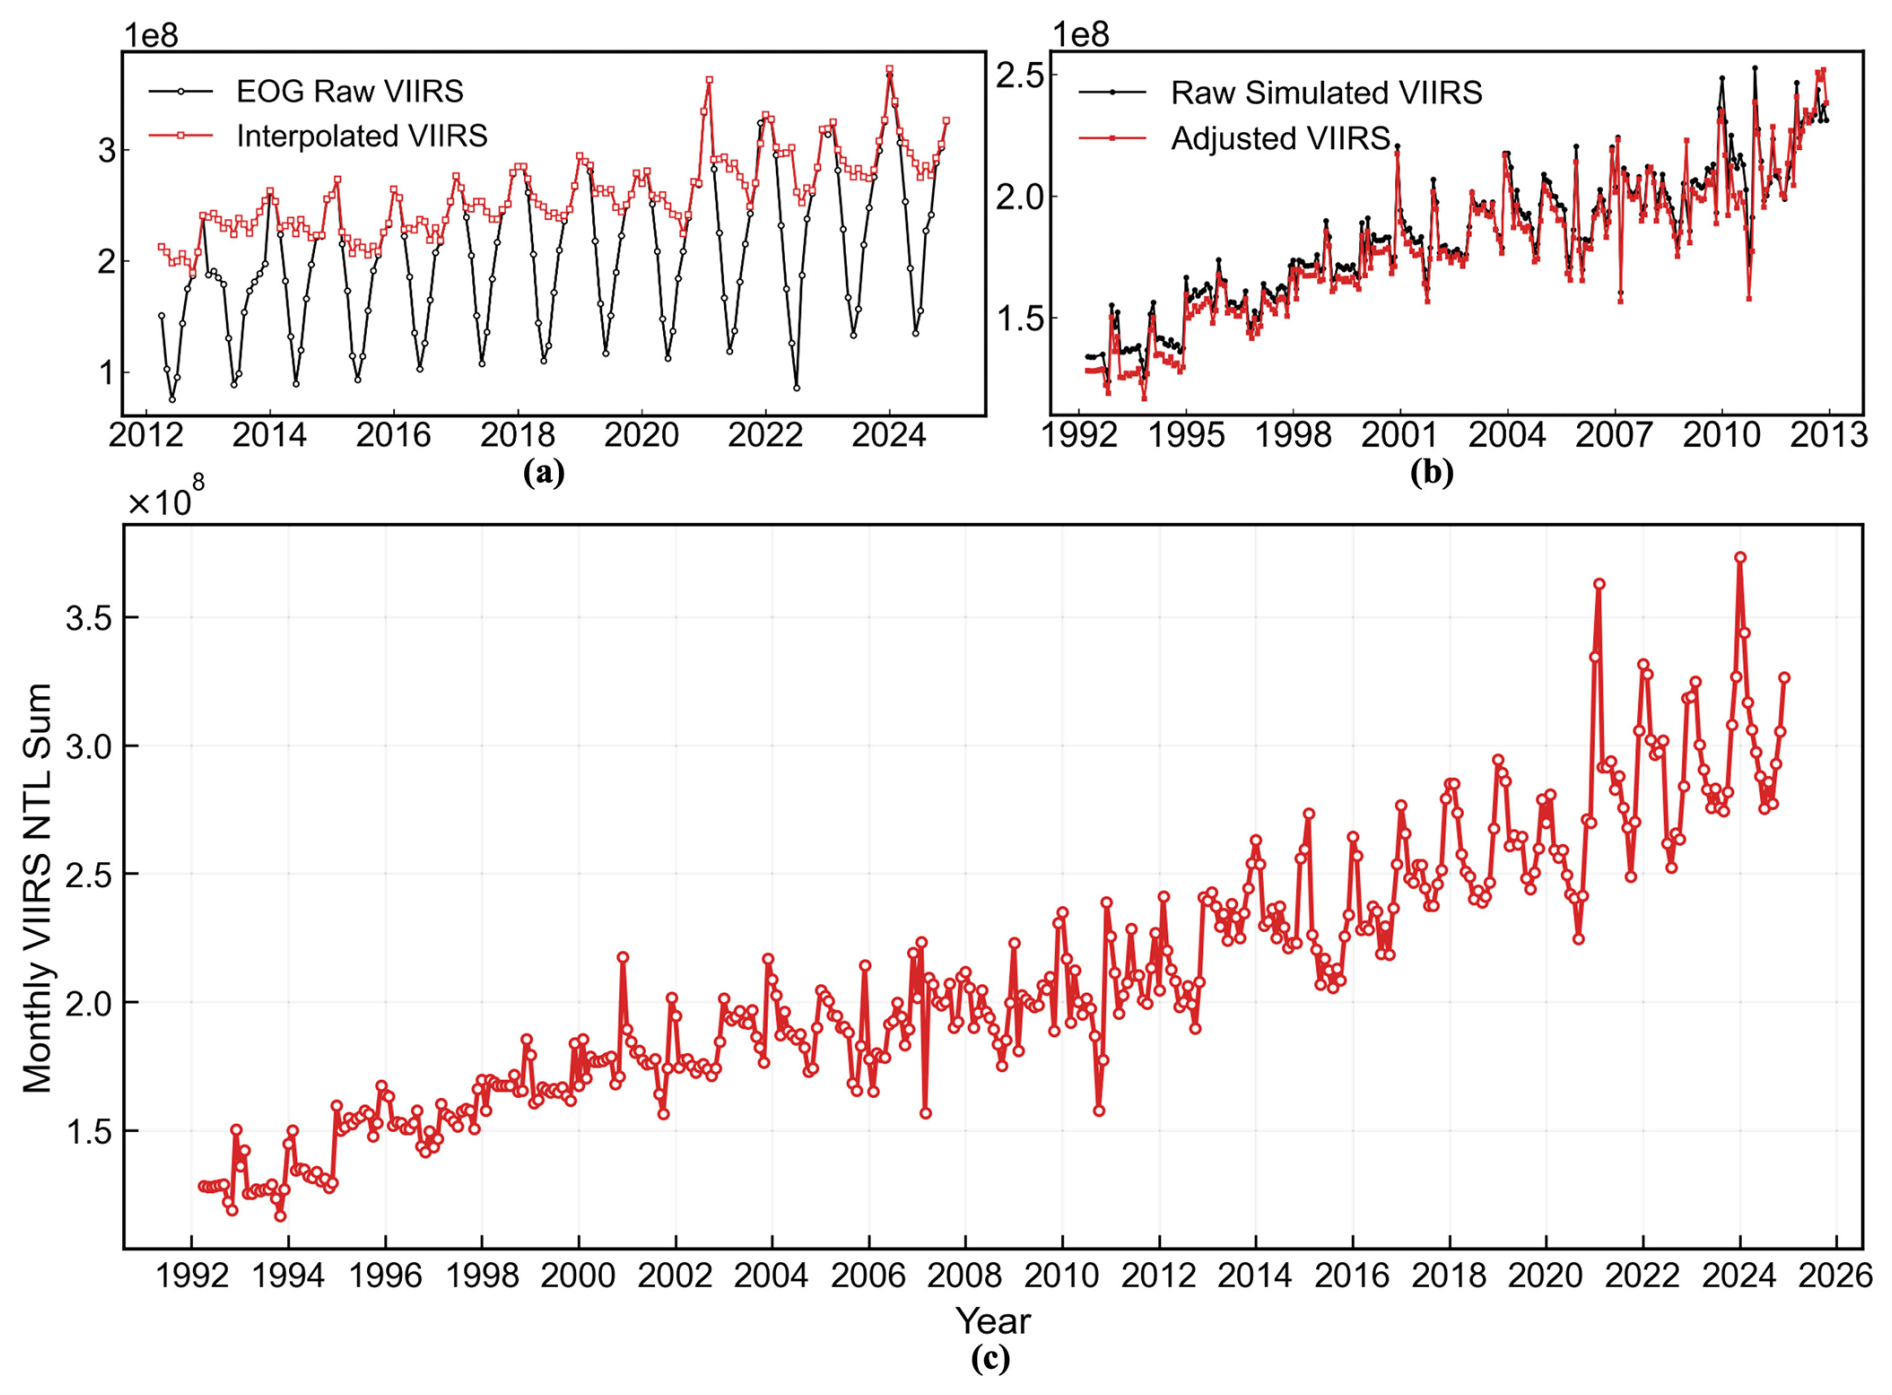
Figure 17Global monthly VIIRS NTL series (unit: ). (a) Global VIIRS observations from 2012 to 2024, before and after interpolation. (b) Simulated VIIRS-like series from 1992 to 2012 before and after temporal adjustment. (c) The final global monthly VIIRS-like NTL dataset (MVNL) spanning 1992 to 2024.
The long-term evolution of NTL intensity at the continental scale provides an essential basis for assessing the temporal consistency and applicability of the reconstructed VIIRS-like dataset. In this context, monthly total NTL trends across six continents during 1992–2024, derived from the reconstructed VIIRS-like data, are summarized in Fig. 18. As shown in Fig. 18, all continents exhibit clear long-term growth trajectories accompanied by pronounced monthly fluctuations, reflecting the sustained intensification of global human activities over long time horizons as well as their seasonal characteristics. Asia shows the most significant increase in total NTL, with a steep upward trend that underscores the persistent influence of rapid industrialization and urbanization on NTL intensity. Africa and South America remain at comparatively lower absolute levels but display steady growth, indicating the gradual expansion of economic activity and infrastructure in developing regions. Europe and North America maintain relatively high NTL levels throughout the study period, with more moderate long-term growth but more pronounced monthly variability, consistent with stable urban structures and pronounced seasonal energy-use patterns in mature economies. Oceania records the lowest total NTL levels but still demonstrates a clear upward trend, suggesting a continuous intensification of urban activities at the regional scale. The intercontinental comparison indicates that the reconstructed VIIRS-like monthly data reliably capture long-term evolutionary trends and seasonal variability in NTL at the continental scale, without evident abrupt changes or systematic discontinuities, supporting their temporal consistency and suitability for cross-regional and long-term .
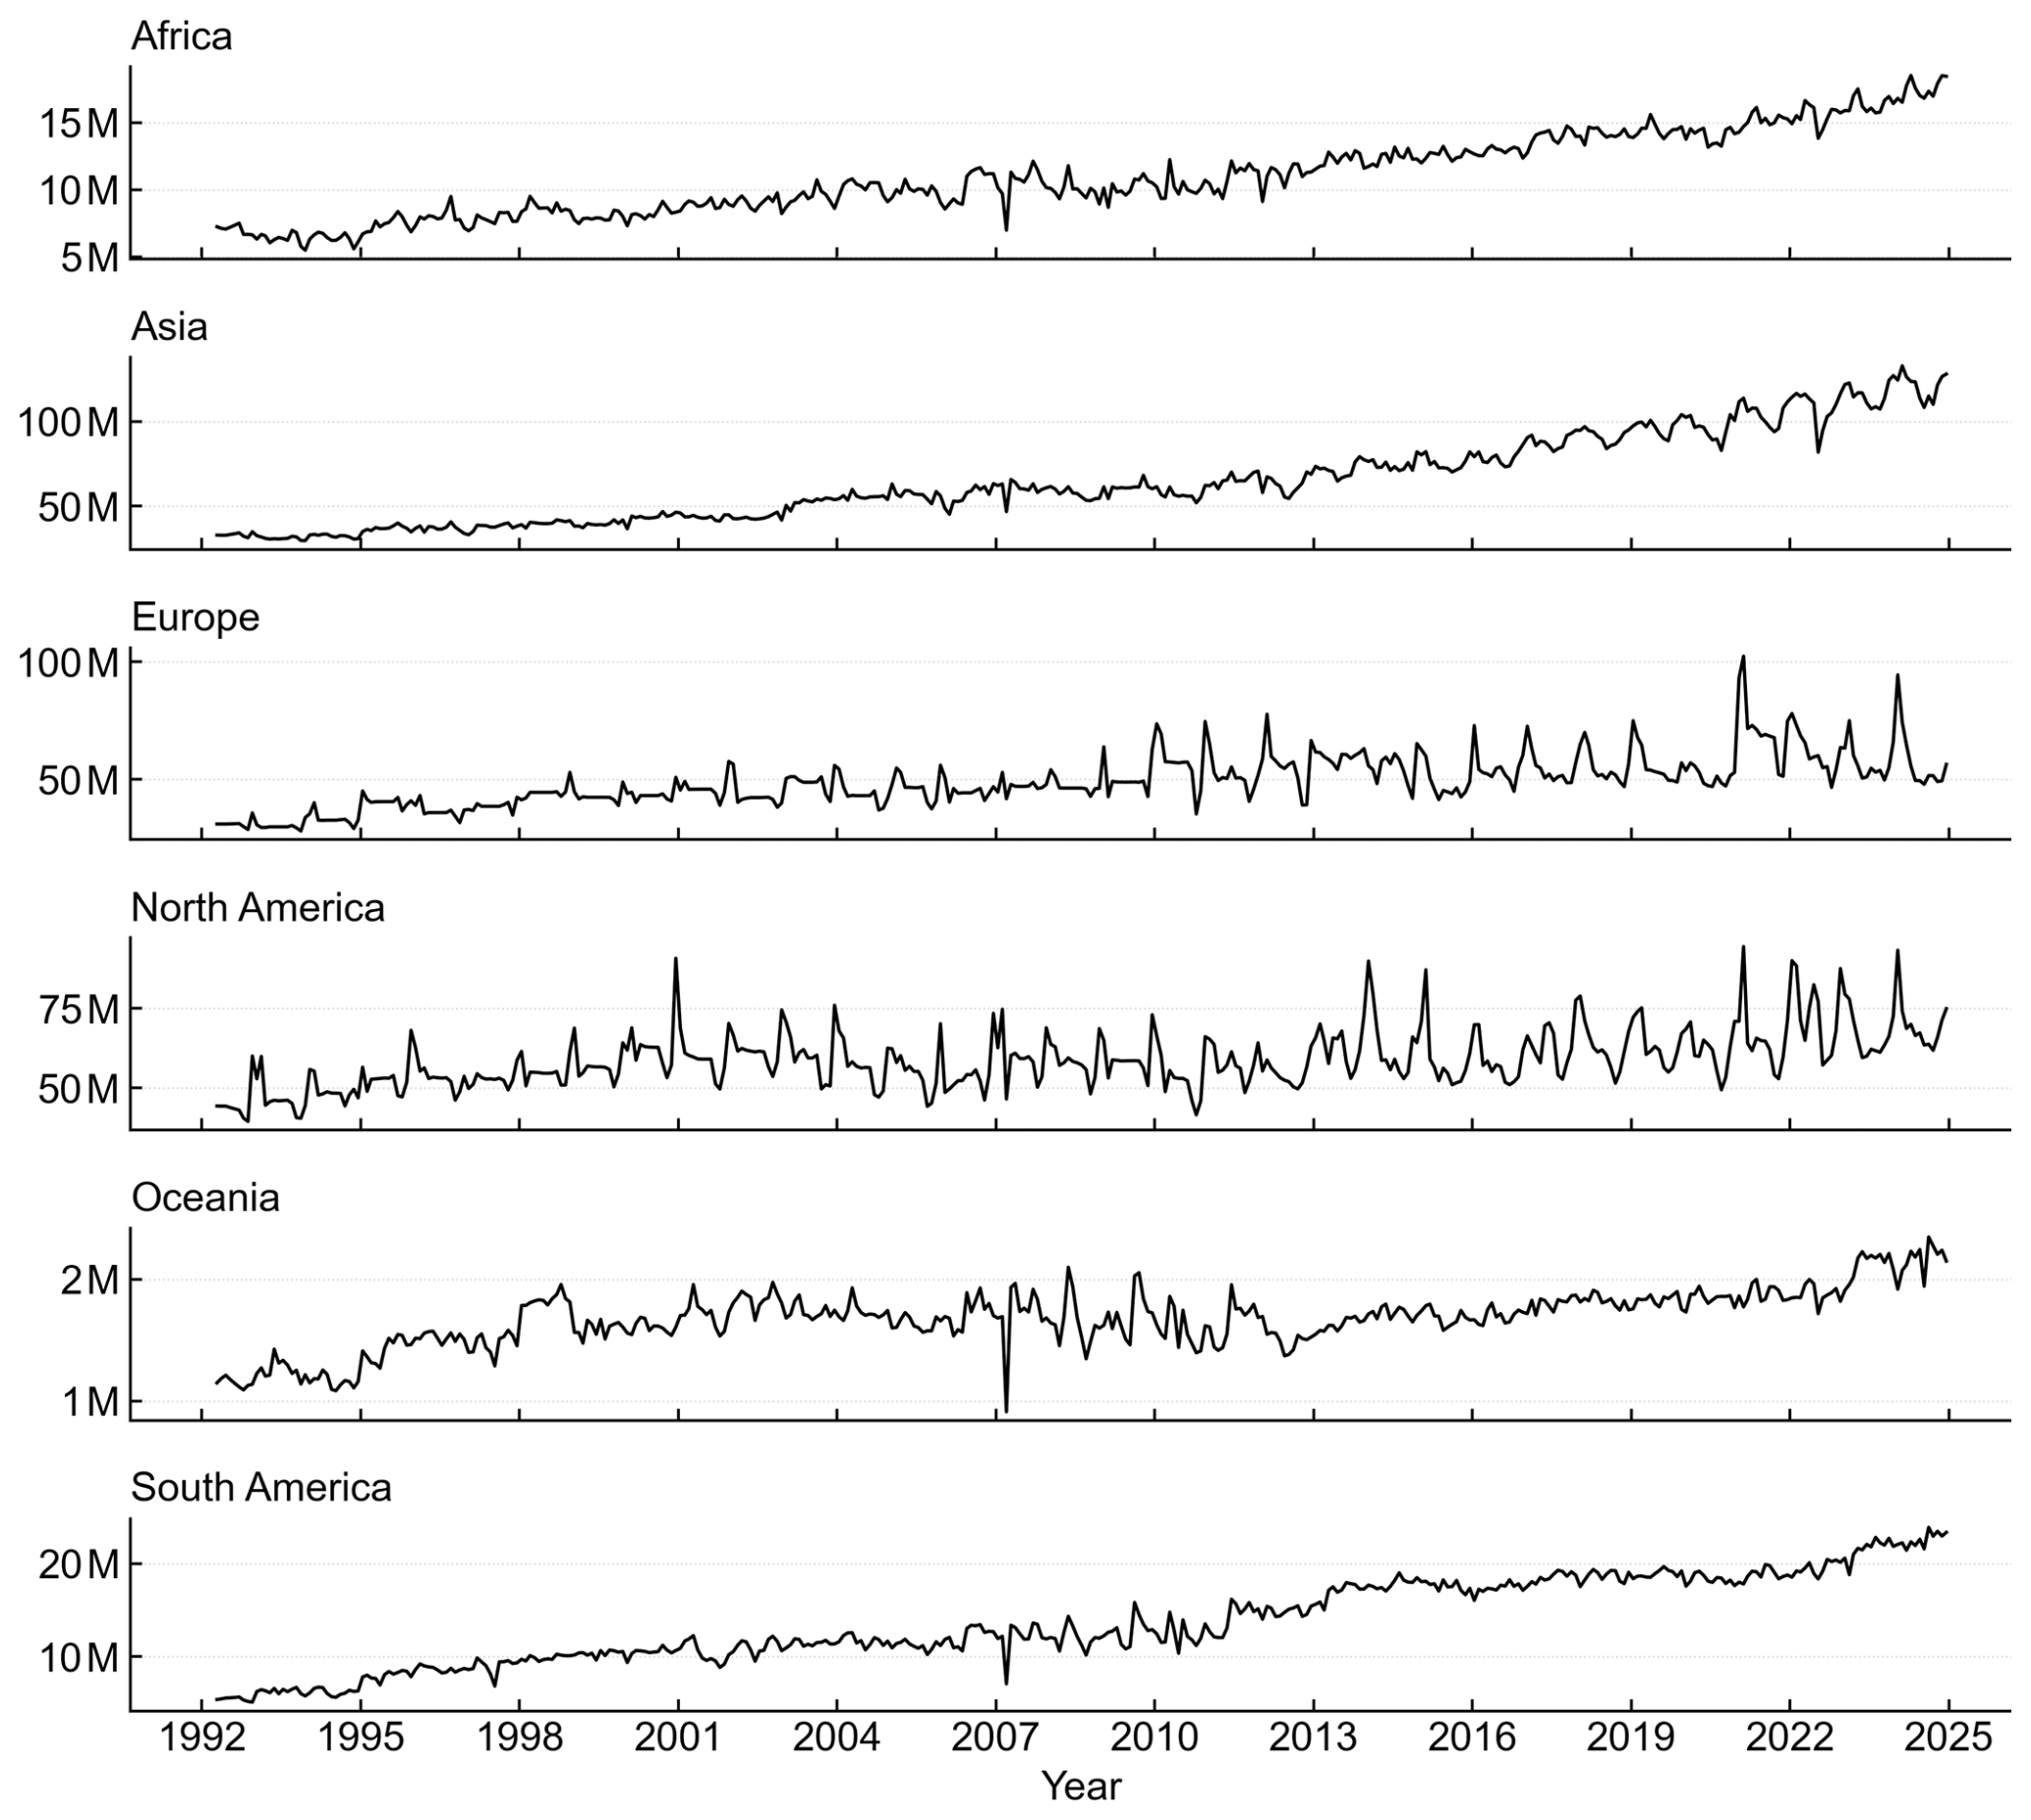
Figure 18Monthly total NTL trends for different continents during 1992–2024 from reconstructed VIIRS-like data (unit: ).
5.1 Spatial consistency evaluation
To characterize the long-term spatiotemporal evolution of NTL captured by the constructed dataset, reconstructed VIIRS-like NTL distributions for two representative developing megacities, Beijing and Shanghai, together with the corresponding DMSP observations, are presented for different months and key years during 1992–2012, as shown in Figs. 19 and 20. In both figures, representative years are arranged in columns and different months in rows, allowing the seasonal variability and interannual evolution of urban NTL to be directly visualized while enabling a side-by-side comparison between the original DMSP data and the reconstructed VIIRS-like results. In Beijing (Fig. 19), NTL data in the early years are mainly concentrated within the urban core, with limited spatial extent. Over time, both brightness intensity and illuminated coverage increase continuously and gradually expand toward peripheral areas, revealing clear signatures of urban expansion and functional spillover. Compared with the original DMSP observations, the reconstructed VIIRS-like results exhibit clearer boundaries, reduced blooming effects, and improved spatial separability. The spatial configuration remains relatively stable across months, indicating that seasonal variation is mainly reflected in brightness changes rather than in fundamental changes in spatial structure. In Shanghai (Fig. 20), the spatial pattern is characterized by stronger high-intensity aggregation, with a bright urban core already evident in the early years, followed by rapid outward expansion along major urban corridors and toward coastal areas in later years, resulting in progressively more continuous and compact NTL distributions. Compared with Beijing, Shanghai exhibits higher overall brightness levels and faster spatial expansion in most months, reflecting a more concentrated urban structure and stronger economic activity. The comparison with the DMSP images further shows that the reconstructed VIIRS-like NTL not only suppresses blooming effects but also alleviates saturation in highly illuminated areas.
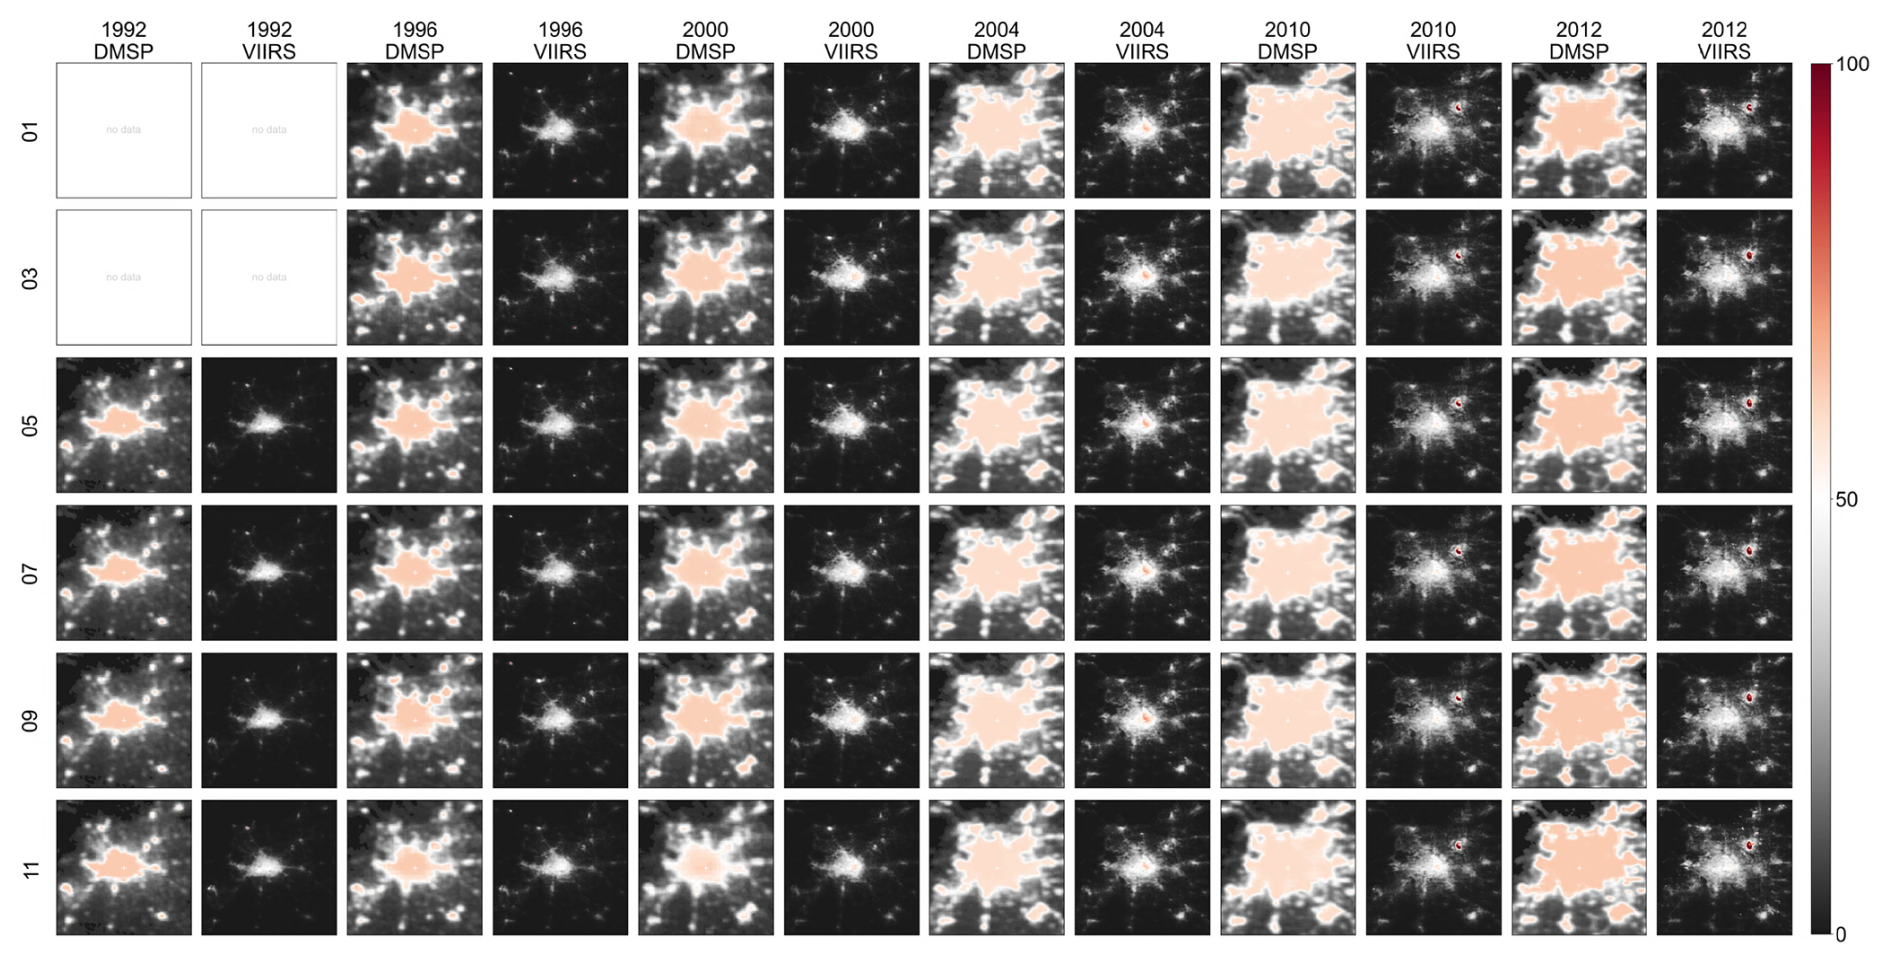
Figure 19Seasonal and interannual spatial patterns of DMSP and reconstructed VIIRS-like NTL in Beijing from 1992 to 2012.
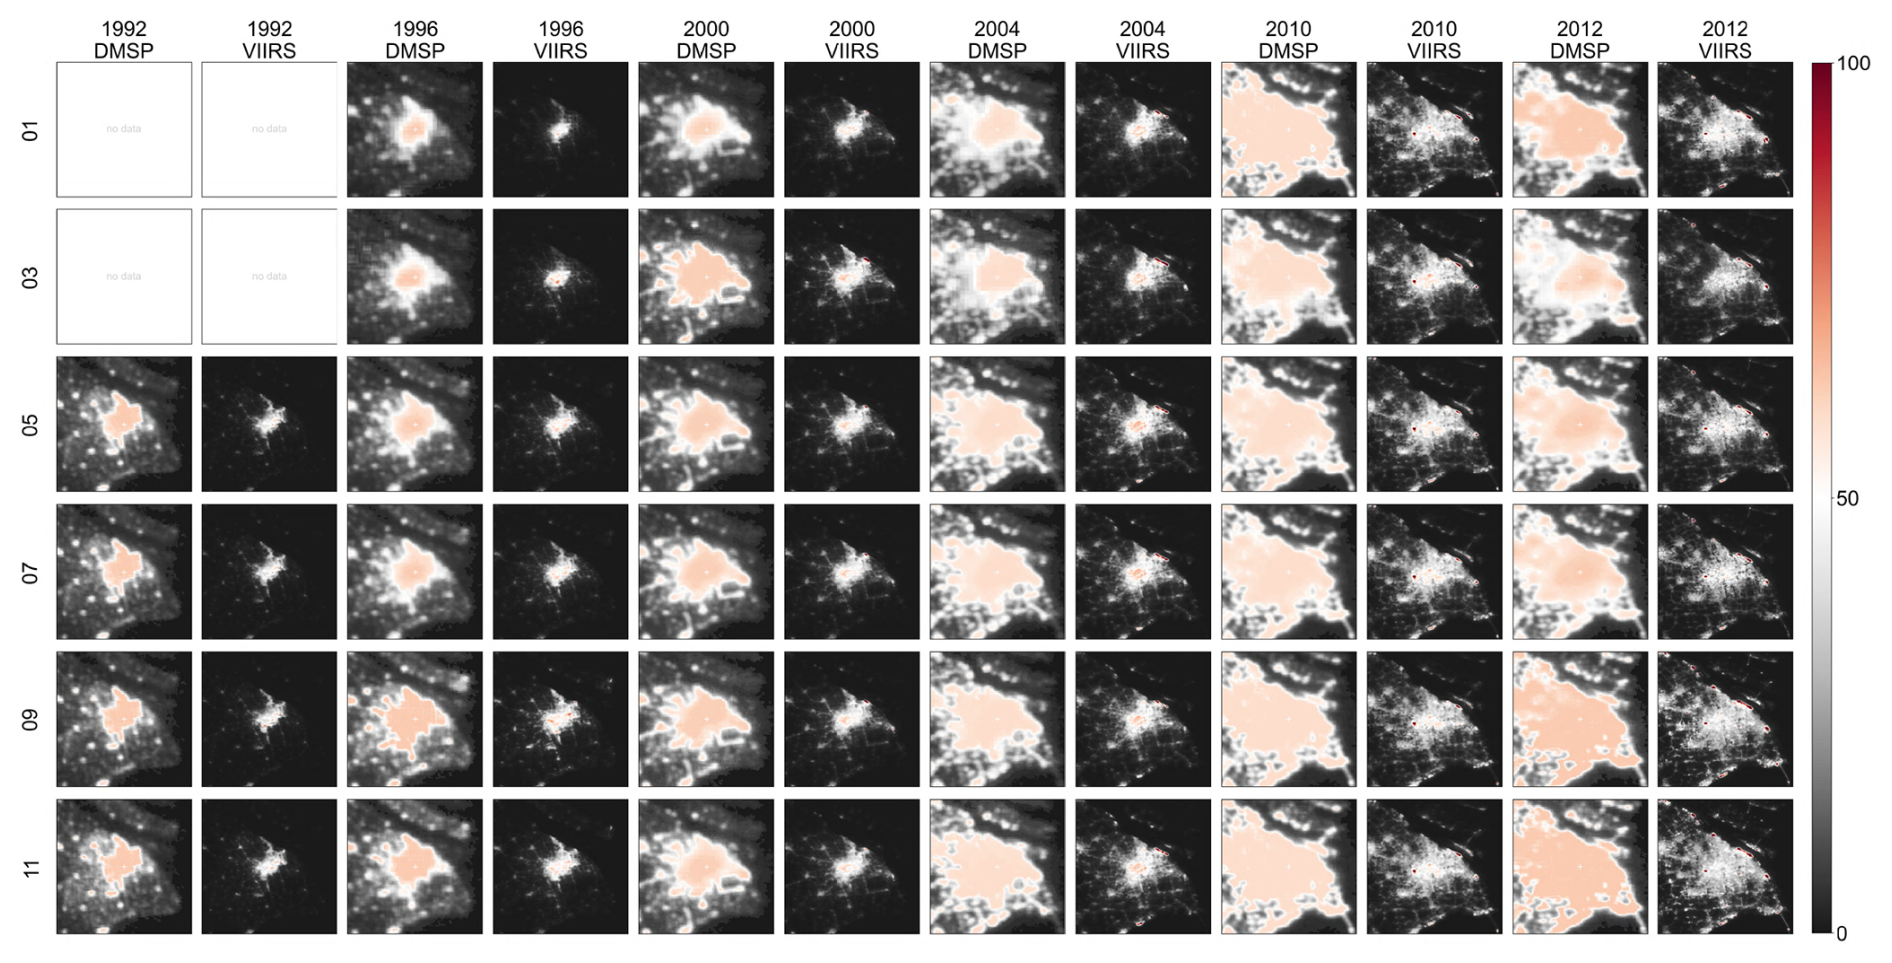
Figure 20Seasonal and interannual spatial patterns of DMSP and reconstructed VIIRS-like NTL in Shanghai from 1992 to 2012.
A quantitative assessment of the seasonal and interannual dynamics of total NTL intensity was further conducted for Beijing and Shanghai, as shown in Fig. 21. The temporal profiles reveal clear and consistent intra-annual fluctuations in both cities, indicating that the reconstructed VIIRS-like data effectively preserve seasonal variability while also reflecting long-term interannual growth. In Beijing (Fig. 21a), the simulated VIIRS-like series exhibits a smoother temporal trajectory than the original DMSP totals, with reduced abnormal peaks and compressed excessively bright values, suggesting that blooming effects have been substantially mitigated. In Shanghai (Fig. 21b), the reconstructed MVNL series not only shows a similar improvement in suppressing blooming effects but also exhibits consistently higher total light values than the corresponding DMSP DN totals after 2010. This pattern suggests that the saturation limitation in the original DMSP observations has been effectively alleviated, enabling the reconstructed data to more accurately capture the ongoing increase in NTL intensity associated with rapid urban growth.
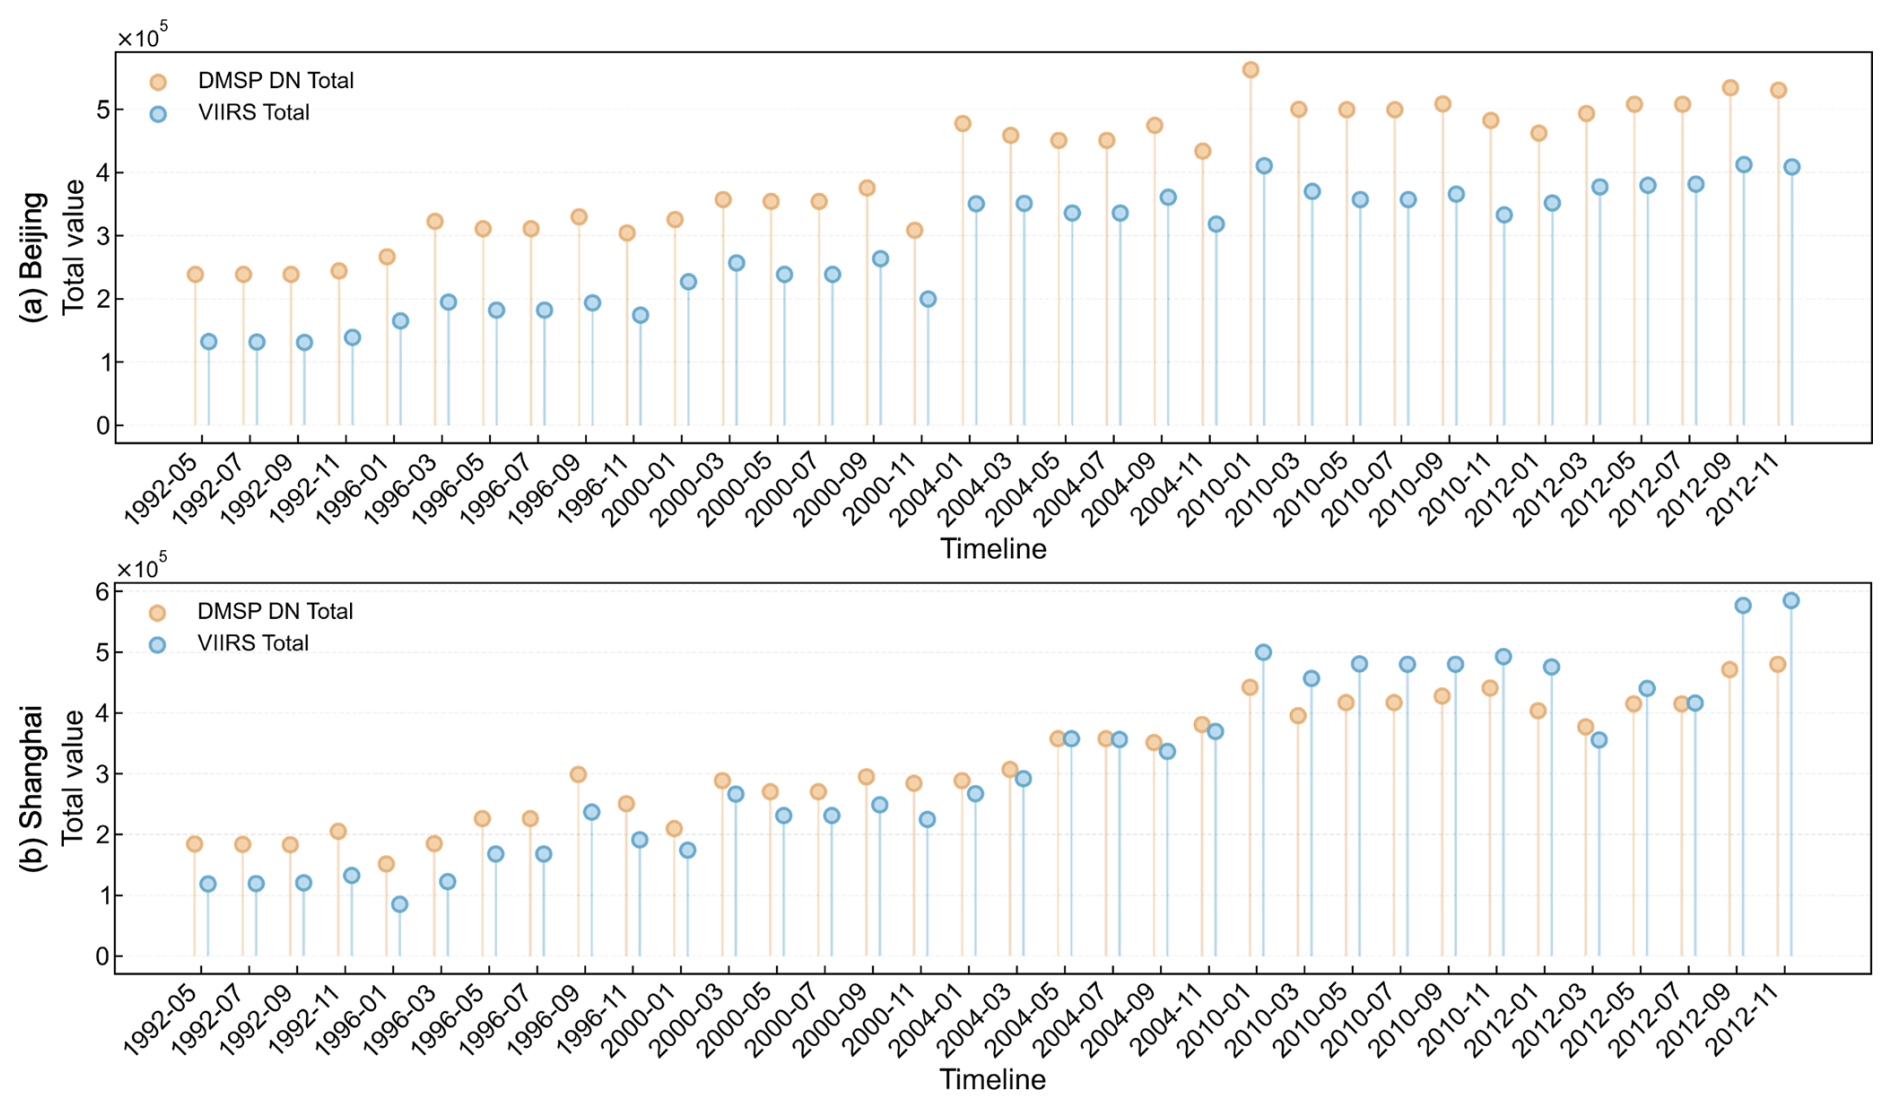
Figure 21Seasonal and interannual NTL comparison from DMSP and simulated VIIRS in representative cities: (a) Beijing and (b) Shanghai.
Building on the analysis of global and regional spatial patterns, we further examine local structural characteristics at the city scale to assess the model's performance at fine spatial resolution. Urban NTL distributions not only reflect overall brightness levels but also encode micro-scale spatial information, including road networks, dominant urban development axes, and intensity gradients around city cores. Representative cities – Paris, Tokyo, Beijing, and Dubai – were selected to compare the predicted VIIRS-like results with the corresponding raw observations, as shown in Fig. 22. For each city, the left panels display the reconstructed and observed NTL distributions, with profiles overlaid along the main urban development direction and its perpendicular axis, while the right panels present the extracted brightness profiles along these directions for quantitative comparison. The results show that the simulated data preserve the major brightness gradients along primary urban corridors and around central areas, with key structural features such as road networks and radial expansion patterns remaining clearly identifiable. Although slight underestimation is observed in a few extremely high-radiance pixels, the overall profile shapes and spatial contrasts are well reproduced.
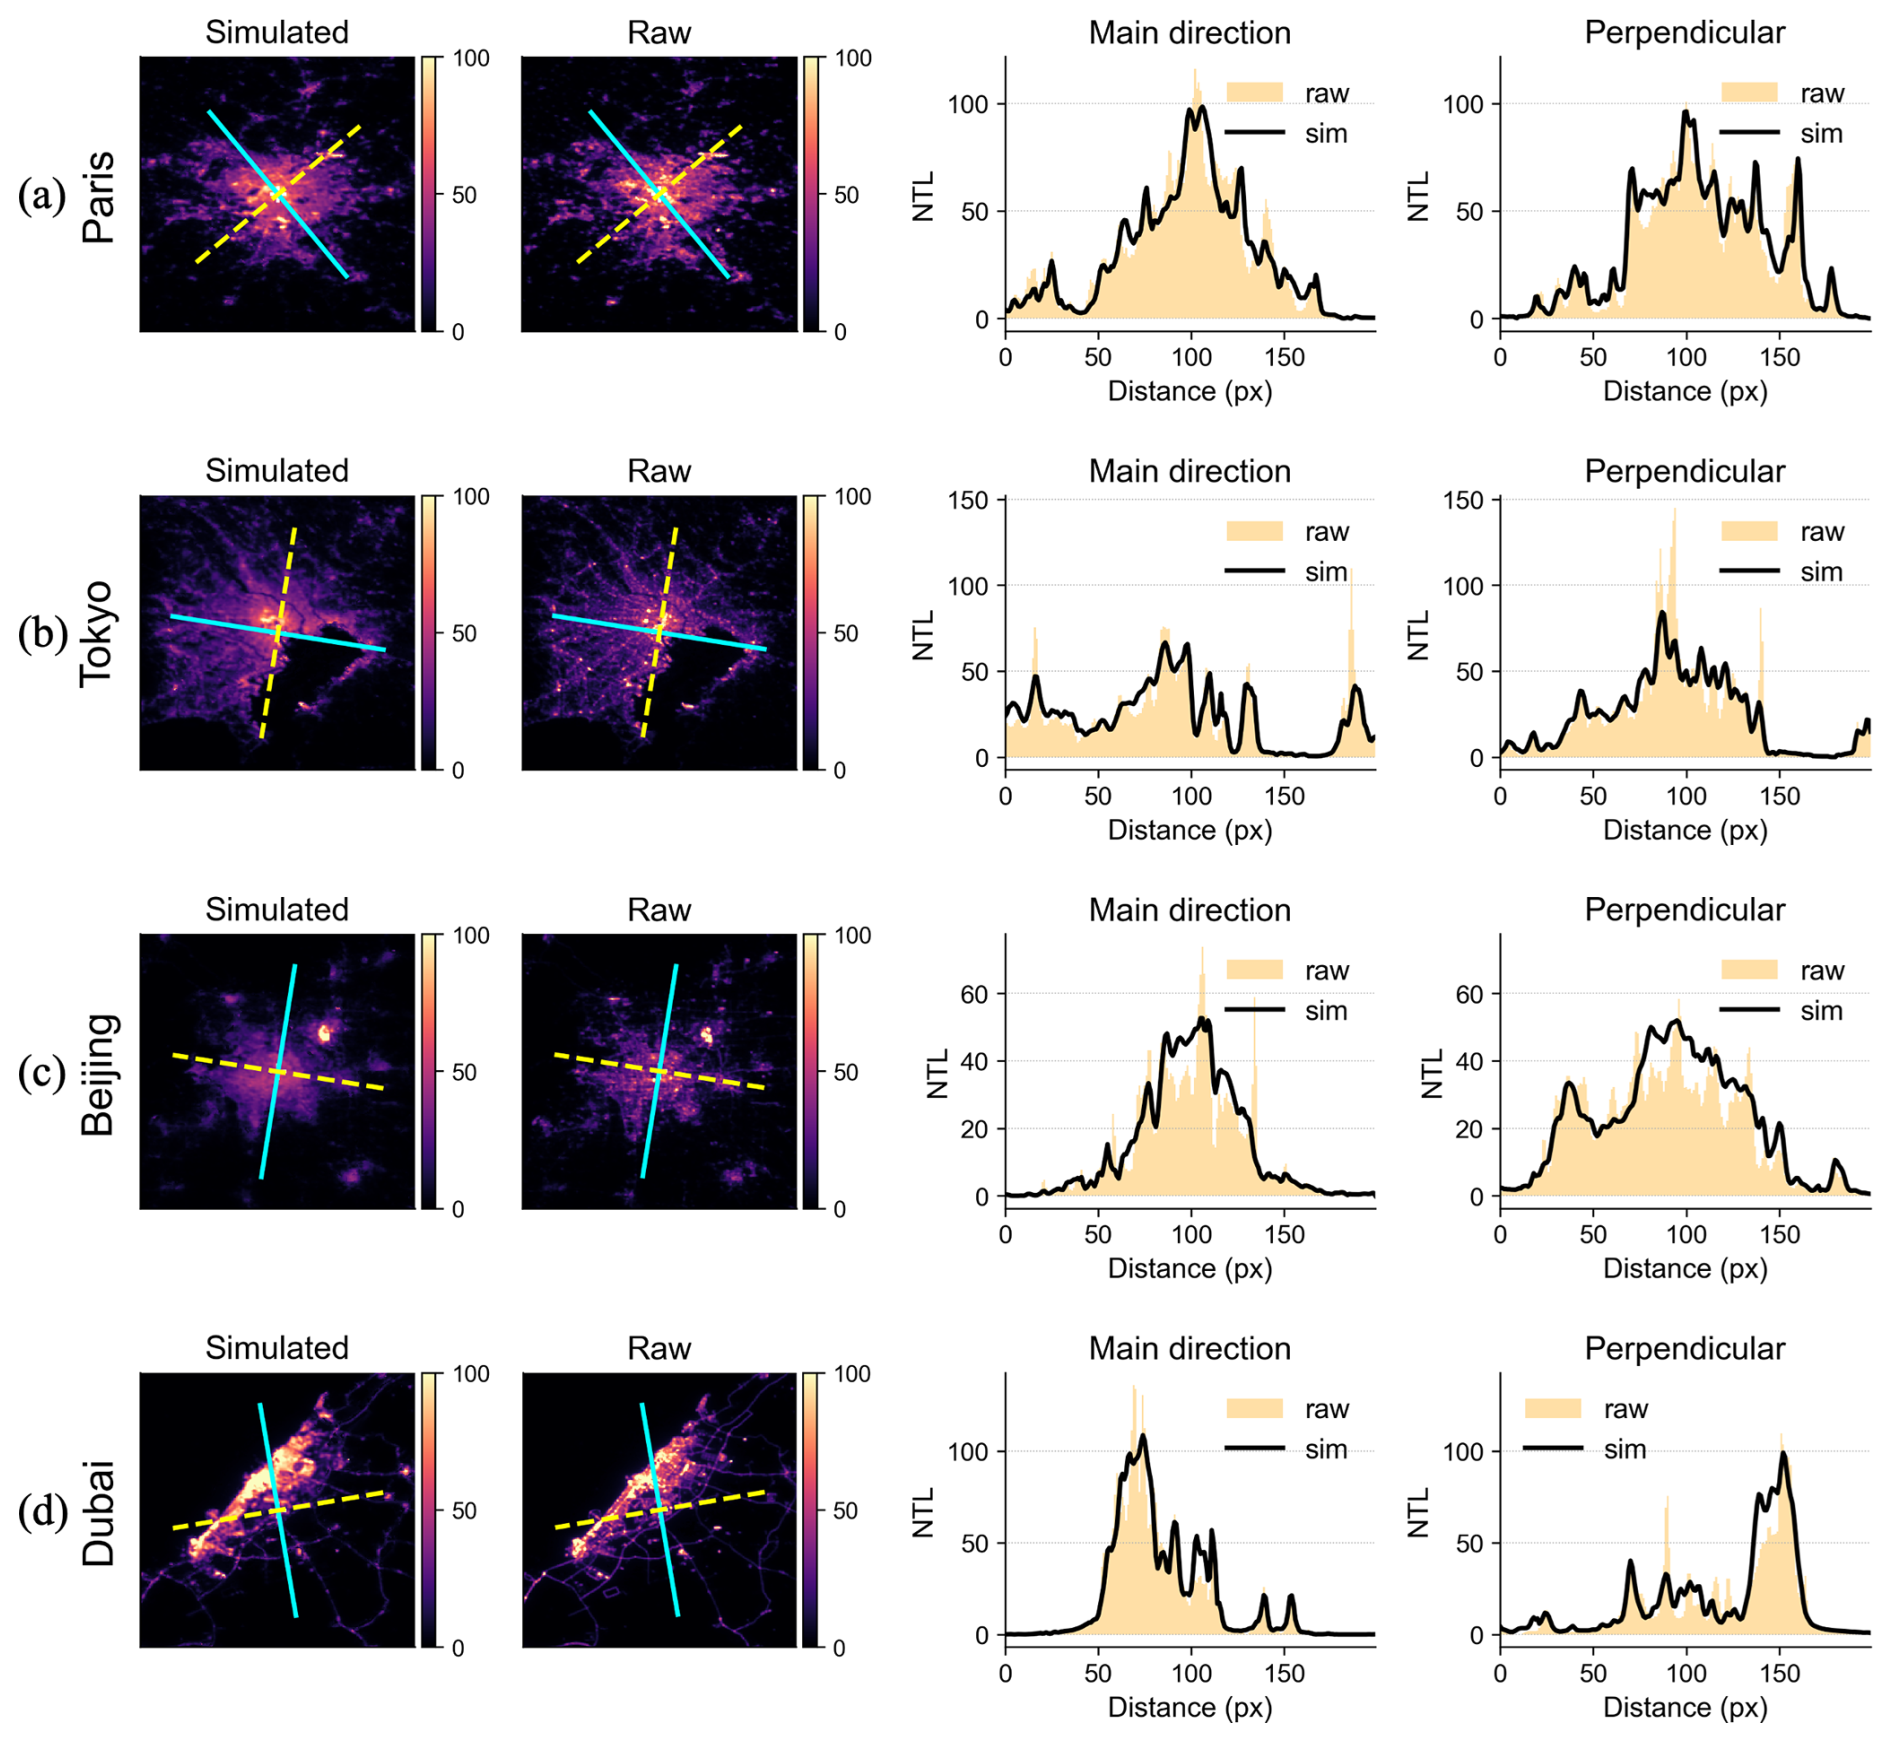
Figure 22Profiles of simulated VIIRS-like and raw NTL intensity (unit: ) in 2012 across (a) Paris, (b) Tokyo, (c) Beijing, and (d) Dubai. The solid cyan line denotes the main direction, while the yellow dashed line represents the perpendicular direction.
5.2 Temporal consistency evaluation
Assessing the temporal continuity and stability of the VIIRS-like NTL dataset is crucial for evaluating its quality and supporting its applications in long-term urbanization monitoring, economic fluctuation analysis, and energy studies. Given that the focus of this study is not on generating annual data and that a monthly dataset is unavailable, an annual composite approach was used for comparison with other published products. Figure 23 illustrates the annual total NTL intensity trends from 1992 to 2024 across four datasets: MVNL, NPP-VIIRS-like V1 (Chen et al., 2021b), NPP-VIIRS-like V2 (Chen et al., 2020, 2026), and SVNL (Chen et al., 2024). The global total NTL intensity shows a consistent upward trend, with notable fluctuations across the different datasets. Our MVNL (red) shows the largest increase in NTL, particularly post-2015, reflecting the model's strong performance in capturing global lighting trends. NPP-VIIRS-like V1 (orange) shows a more gradual growth pattern, especially in recent years, indicating a slower rate of increase in NTL intensity. NPP-VIIRS-like V2 (green), while following a similar upward trajectory to MVNL, displays less fluctuation. SVNL (blue), on the other hand, exhibits a less pronounced rise and more fluctuations, possibly due to its reliance on older calibration methods or the inclusion of less accurate regional data.
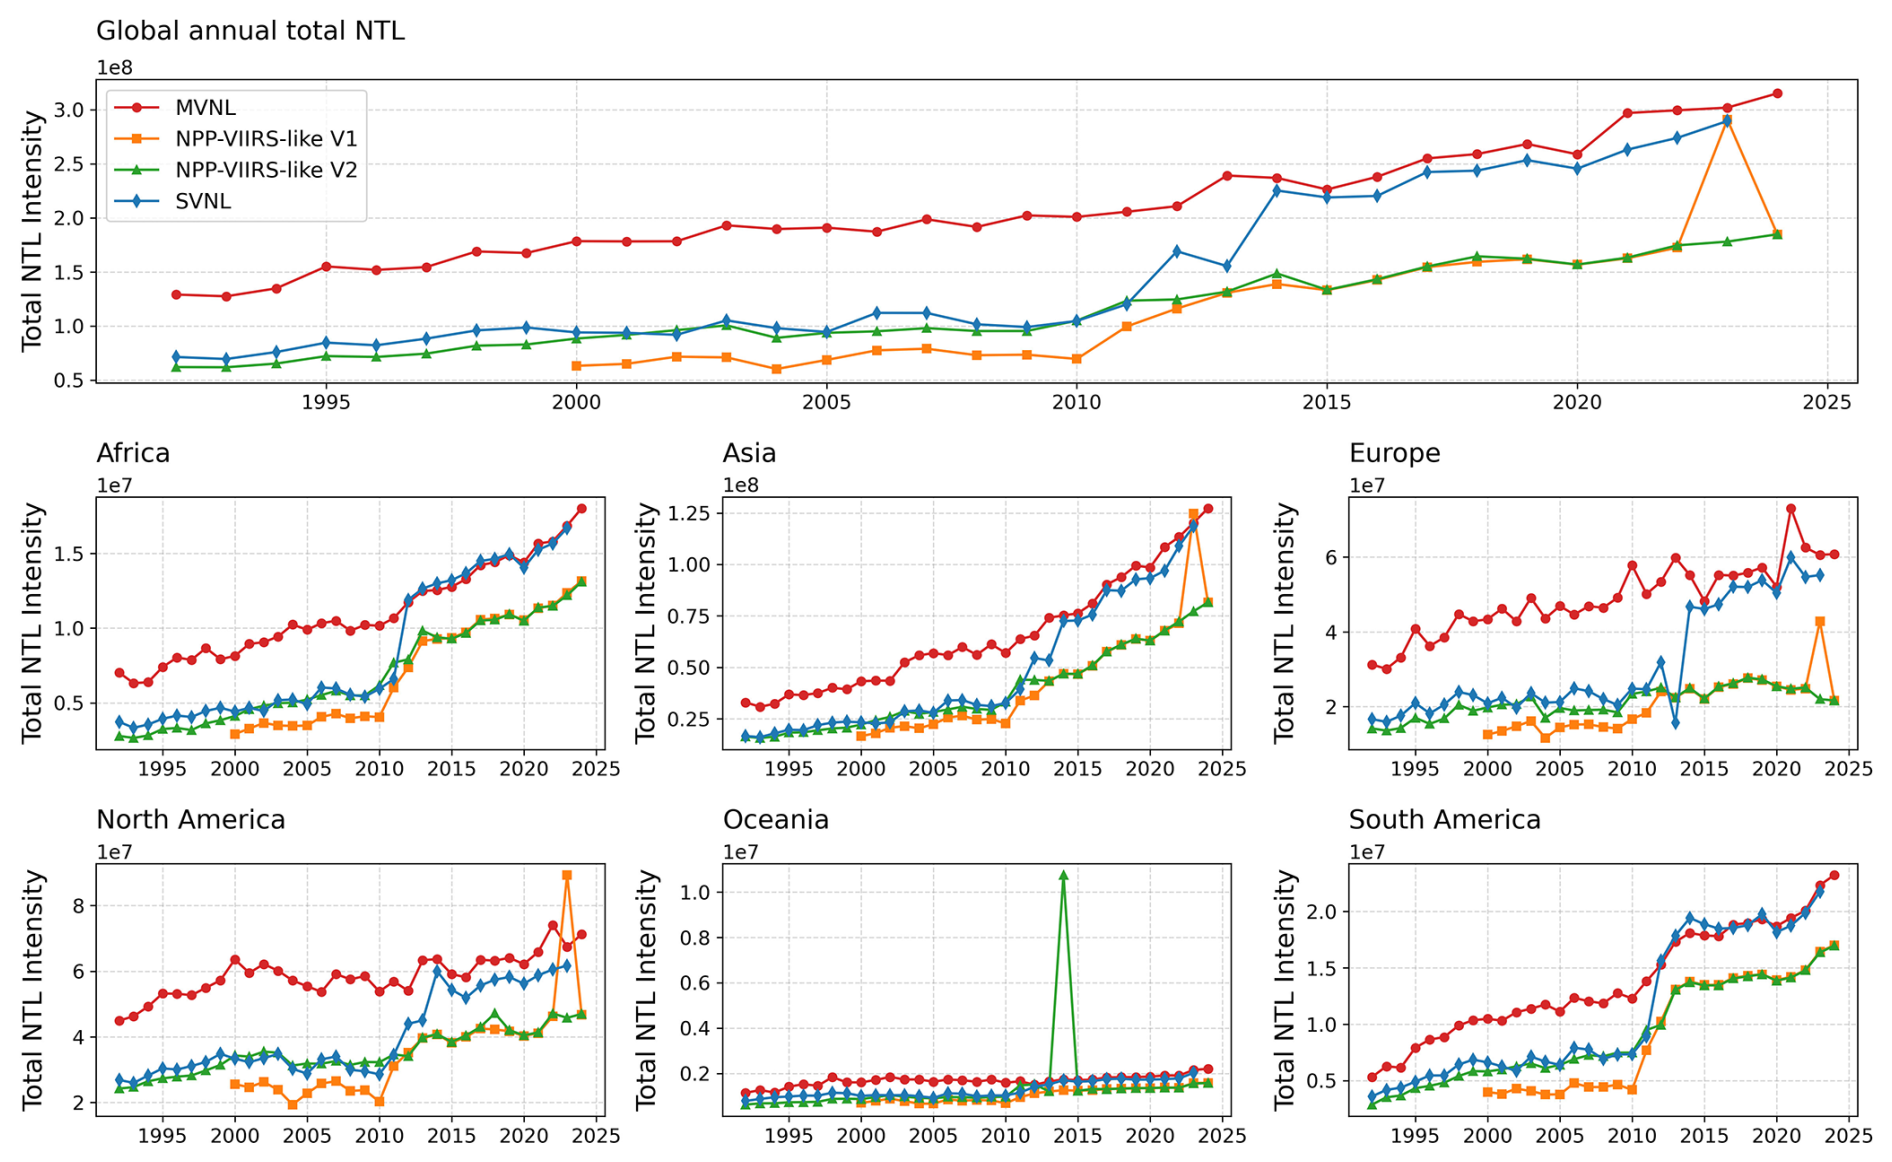
At the regional level, Asia and Europe demonstrate sharper increases in NTL intensity, consistent with rapid urbanization and economic development, with MVNL and NPP-VIIRS-like V2 showing stronger growth patterns in these regions. In contrast, North America and Oceania show more moderate growth, with the NTL intensity trends stabilizing earlier, indicating more mature urban structures and slower expansion. Africa and South America, however, display slower growth, particularly in the earlier years, reflecting less intense urbanization and lower illumination levels, which is consistent across all four datasets. The sharp rise in NTL after 2015, particularly in MVNL and NPP-VIIRS-like V2, aligns with technological advancements in satellite observation and significant changes in global urban lighting. This comparison underscores the differences between the datasets and highlights the MVNL dataset's robustness for global and regional studies.
To further assess the suitability of the reconstructed VIIRS-like NTL data for macro-scale socioeconomic analysis, Fig. 24 presents its relationships with GDP and population at both global and national scales. Figure 24a and b show the country-level coefficients of determination (R2) for NTL versus GDP and NTL versus population, respectively. A clear and systematic contrast is observed between the two relationships. Across most regions, NTL shows substantially stronger correlations with GDP than with population, indicating that NTL intensity aligns more closely with economic output than with population size alone. High R2 values for the NTL–GDP relationship are concentrated in regions with intensive economic activity and well-developed urban systems, including East Asia, Western Europe, and North America. In contrast, lower correlations are more common in parts of sub-Saharan Africa and Central Asia, where economic activity is spatially dispersed, and overall radiance levels remain relatively low.
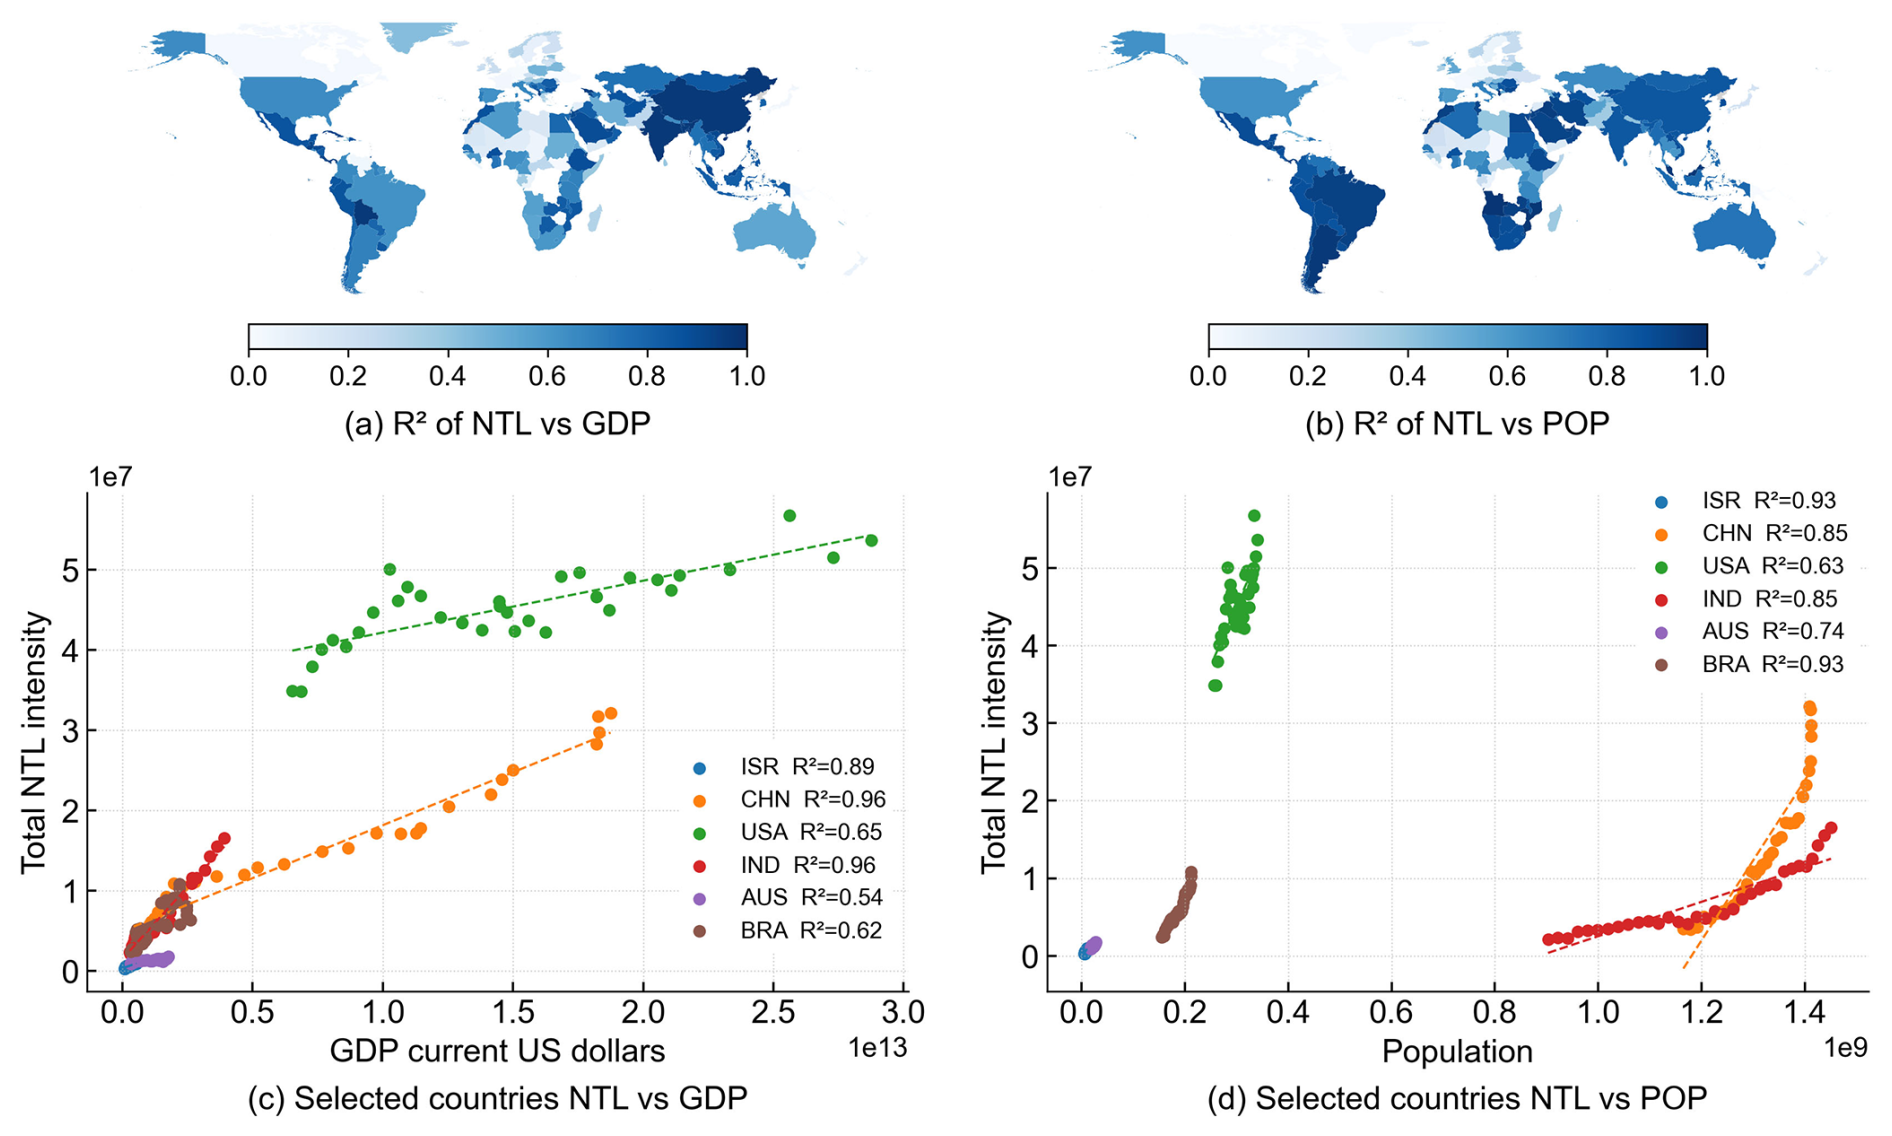
Figure 24Correlation of reconstructed VIIRS-like NTL with GDP and population across global and national scales. (a) national scale R2 between reconstructed VIIRS NTL and GDP, (b) national scale R2 between reconstructed VIIRS NTL and population, (c) selected country scatterplots of total NTL versus GDP, and (d) selected country scatterplots of total NTL versus population.
Figure 24c and d further illustrate these patterns through scatter comparisons for selected countries. The NTL–GDP relationship exhibits consistently strong, near-linear behavior, with steeper trajectories in rapidly developing economies such as China and India, reflecting the expansion of illuminated urban areas associated with industrialization and infrastructure expansion. By comparison, high-income economies such as the United States and Israel exhibit flatter trends at higher brightness levels, suggesting that economic growth increasingly occurs through structural upgrading and efficiency improvements rather than through proportional increases in NTL. The relationship between NTL and population is comparatively weaker and more dispersed across countries, suggesting that population size alone does not directly translate into NTL intensity without accounting for urban form, settlement patterns, and levels of electrification. These results indicate that the reconstructed VIIRS-like dataset reproduces the well-established differential sensitivities of NTL to economic activity and population, supporting its robustness and suitability for macro-scale socioeconomic analysis.
To evaluate the suitability of different NTL datasets for macro-scale socioeconomic representation, this study examines the correlations between annual total NTL intensity and GDP, as well as population, across multiple datasets, with the results summarized in Fig. 25. We compared the dataset constructed in our study (MVNL) with NPP-VIIRS-like V1 and V2, and SVNL, arranged by columns, where the top row shows the relationship between annual total NTL and GDP, and the bottom row shows the relationship with population. At the global scale based on annual totals, all datasets exhibit significant positive correlations between NTL intensity and GDP, although the strength of the association varies substantially. MVNL demonstrates a high level of consistency in the NTL–GDP relationship (R2=0.92), comparable to NPP-VIIRS-like V2 (R2=0.93), while NPP-VIIRS-like V1 and SVNL showed weaker correlations (R2=0.77 and 0.84, respectively). For the NTL–population relationship, all datasets also displayed high correlations, including MVNL (R2=0.95) and NPP-VIIRS-like V2 (R2=0.95), which primarily reflected the use of globally aggregated annual totals, in which population size and total NTL are intrinsically coupled at the macro-aggregate level. Such strong associations indicate consistency across the overall scale, whereas, at finer national or regional scales, the correlation between population and NTL typically decreases due to spatial structural heterogeneity.
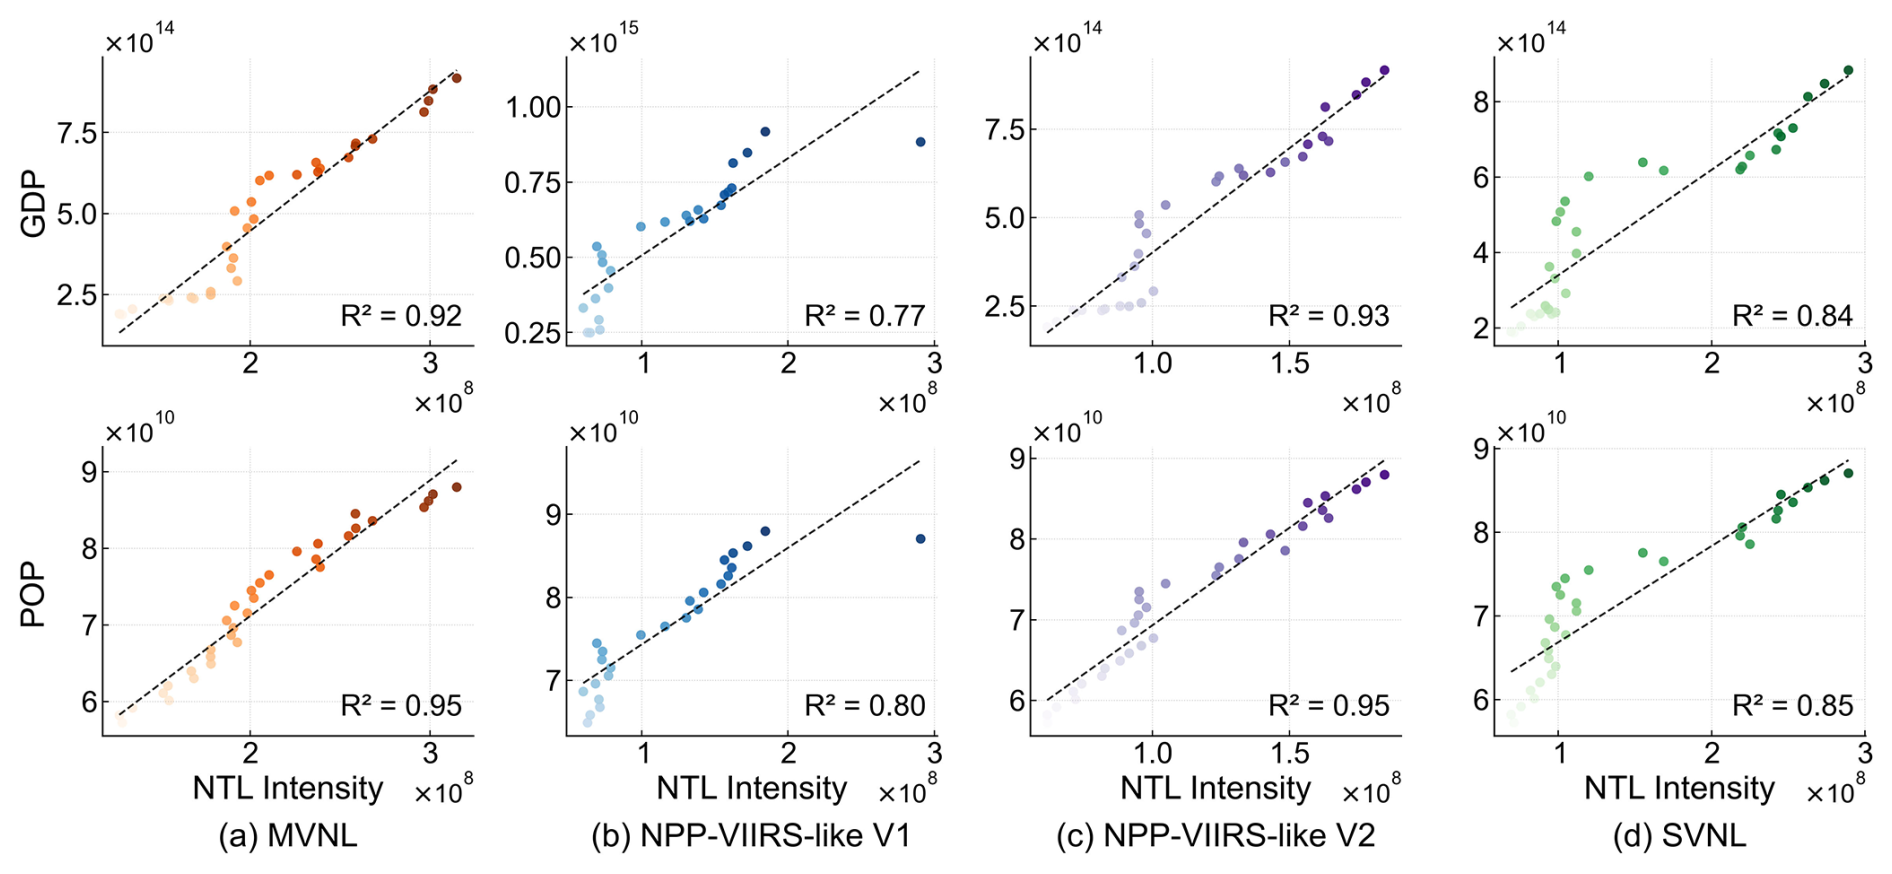
Figure 25Correlations between annual total NTL intensity and GDP, as well as population, across different datasets.
To validate the effectiveness of the monthly NTL dataset, we further analyzed its correlation with economic data. Given the lack of global monthly economic data, two representative countries – the United Kingdom and Mexico – were selected to collect relevant monthly economic data for validation. We modeled the relationships between Mexico's economic activity index (https://en.www.inegi.org.mx/programas/igae/2018/#tabular_data, last access: 3 February 2026) and total NTL intensity, as well as the relationship between the United Kingdom's total NTL intensity and the electricity, gas, steam, and air conditioning supply index (https://www.ons.gov.uk/economy/grossdomesticproductgdp/datasets/gdpmonthlyestimateuktimeseriesdataset, last access: 3 February 2026) with monthly NTL intensity, as shown in Fig. 26. In Fig. 26a, we compared the monthly economic activity index and total NTL intensity for Mexico from January 1993 to December 2024. The data points, color-coded by year, show a clear positive correlation, with an R2 of 0.75 from linear regression, indicating a significant positive relationship between economic activity intensity and NTL intensity. In Fig. 26b, we compared the total light intensity and the electricity, gas, steam, and air-conditioning supply index with the total NTL for the United Kingdom from January 1997 to December 2024, with data color-coded by year. The linear regression R2 value of 0.57 indicates a moderate correlation between the two variables. These results demonstrate that the MVNL dataset captures economic changes in developing countries and provides a reliable reflection of economic fluctuations in developed countries.
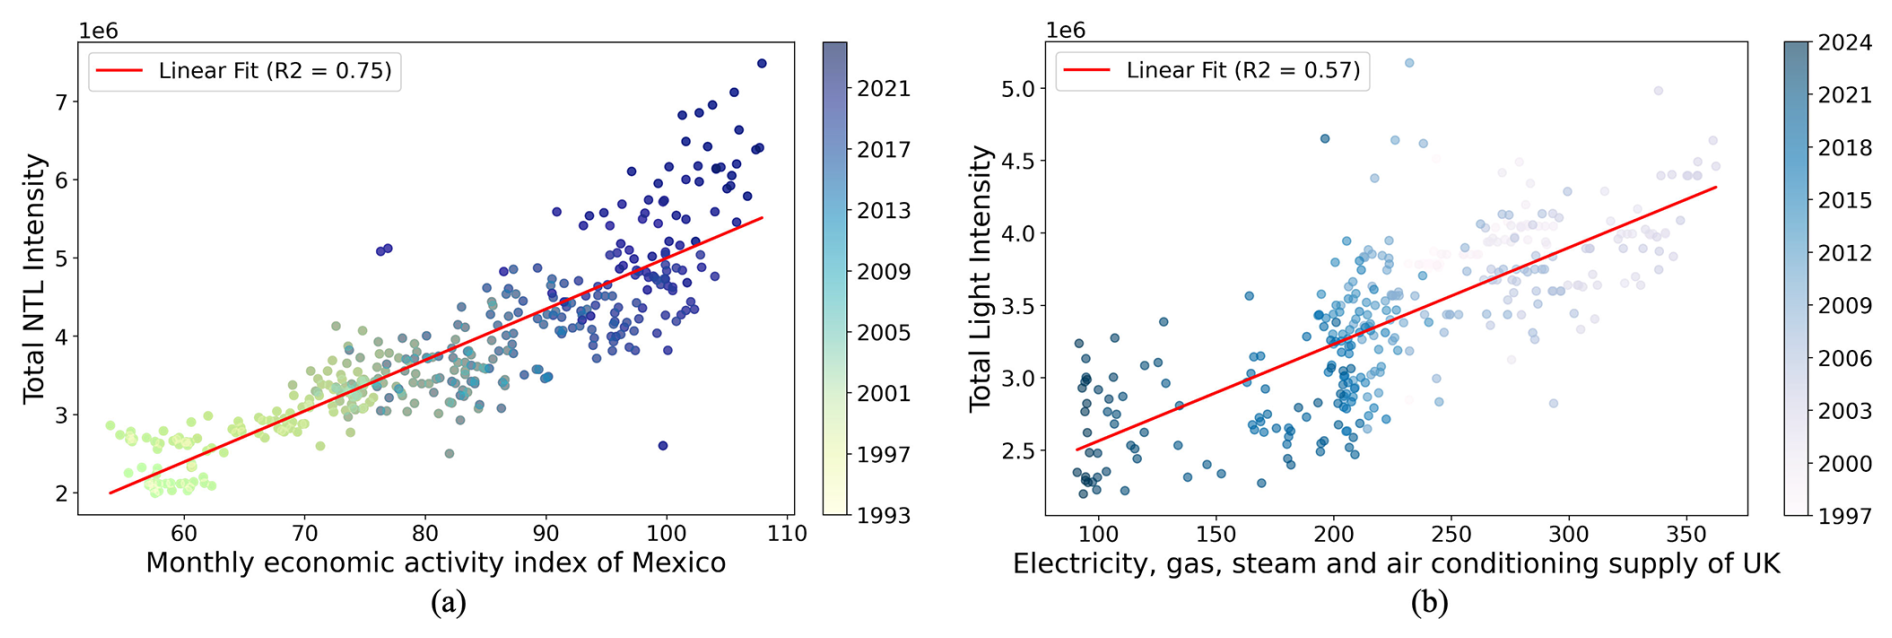
Figure 26Correlation between total NTL intensity and economic indicators: (a) Monthly economic activity index of Mexico; (b) Electricity, gas, steam, and air conditioning supply index of the UK.
5.3 Limitations
The global monthly VIIRS-like NTL dataset constructed shows consistent performance in cross-sensor linkage, temporal continuity, and multi-scale validation, while several limitations remain. The reconstruction framework focuses on terrestrial regions, so oceanic light sources are not represented. This design supports urban and regional analyses but limits its applications to marine illumination, such as offshore fisheries and maritime traffic. Future work, such as (Elvidge et al., 2025; Qiu et al., 2024), is expected to extend the processing pipeline to ocean areas by integrating water masks and marine-specific noise screening to separate persistent lights from transient sources. High-latitude gap-filling and temporal calibration substantially reduce missingness in monthly VIIRS observations, yet residual uncertainty can persist in extremely high-latitude regions, where seasonal observation constraints and sparse valid measurements remain challenging to address. Future studies could incorporate season-aware gap-filling strategies and uncertainty-weighted calibration to improve stability in polar environments (Zheng et al., 2022). The cross-sensor mapping is anchored to radiometric information and temporal relationships derived from annual NTL products, which can constrain the representation of extremely bright cores and highly heterogeneous urban morphologies. Future work could introduce additional monthly references and structure-aware constraints to better preserve high-intensity details and intra-urban variation (Zhang et al., 2024c). Finally, the super-resolution framework does not explicitly account for observation-related physical factors (Elvidge et al., 2021; Tan et al., 2023), such as viewing geometry and stray light effects, which can vary seasonally at high latitudes and may leave residual uncertainty under complex acquisition conditions. Future research could integrate these physical variables as auxiliary inputs or explicit constraints when long-term and globally consistent ancillary records become available.
The extended time series (1992–2024) of monthly VIIRS NTL data is available in WGS84 coordinates with a spatial resolution of 15 arcsec (approximately 500 m) and can be accessed free of charge via https://doi.org/10.25442/hku.31321315.v2 (Cheng et al., 2026a). Data are stored as monthly files and annual composite GeoTIFF products. The volume of monthly and annual VIIRS-like NTL data is around 83.75 GB. The NightNet code is available at https://doi.org/10.5281/zenodo.20134096 (Cheng et al., 2026b).
This study constructs a global, monthly, VIIRS-like nighttime light long-term dataset spanning 1992 to 2024. The dataset integrates two components: monthly VIIRS-like NTL data for April 1992–March 2012, reconstructed from DMSP observations using the proposed deep cross-sensor super-resolution model NightNet, and monthly NPP-VIIRS data for April 2012–December 2024, released by EOG and further processed with high-latitude gap filling, radiometric correction, and temporal consistency adjustment. A unified temporal calibration and stitching strategy was applied to ensure continuous linkage of NTL signals across sensors and decades, resulting in a globally consistent NTL time series with a spatial resolution of 500 m and a monthly temporal resolution.
Multi-scale quantitative validation shows that the reconstructed VIIRS-like data are consistent with contemporaneous NPP-VIIRS observations at pixel, city-aggregated, national, and continental scales. Annual-scale comparisons demonstrate that the proposed dataset achieves higher consistency and lower reconstruction errors at both pixel and city levels than several widely used public NTL products. Cross-decadal city-level analyses further indicate that the VIIRS-like data preserve the relative intercity brightness structure observed in DMSP-OLS while enabling a smooth transition toward a higher-dynamic-radiance system. From a temporal perspective, the global monthly NTL series from 1992 to 2024 exhibits a continuous long-term growth trajectory, with pronounced seasonal fluctuations and no evident abrupt shifts or systematic discontinuities. Continental-scale trends and city-level case studies confirm that the dataset consistently captures long-term global and regional evolution patterns as well as urban-scale changes in NTL intensity, spatial expansion, and structural form. Comparative analyses using GDP and population data further show that the constructed dataset maintains a stable, statistically significant relationship with global economic output, consistent with NTL's established role as a proxy for economic activity.
The cross-sensor super-resolution reconstruction framework proposed in this study, together with the resulting global monthly VIIRS-like nighttime light dataset, provides a robust data foundation for long-term investigations of global and regional urbanization processes, economic dynamics, and human activity patterns. As monthly VIIRS observations continue to be updated, the proposed framework also offers a feasible pathway for further temporal extension of the dataset.
YZ and XL conceptualized the study. HC developed and implemented the model, performed the analysis, validation, and visualized the results, and wrote the manuscript. MG acquired the raw data, performed data processing, explored and refined the methods, validated data quality, and contributed to the interpretation of results. HC, MG, XL, SL, MZ, CL, JW, PG, and YZ edited and revised the manuscript.
At least one of the (co-)authors is a member of the editorial board of Earth System Science Data. The peer-review process was guided by an independent editor, and the authors also have no other competing interests to declare.
Publisher's note: Copernicus Publications remains neutral with regard to jurisdictional claims made in the text, published maps, institutional affiliations, or any other geographical representation in this paper. The authors bear the ultimate responsibility for providing appropriate place names. Views expressed in the text are those of the authors and do not necessarily reflect the views of the publisher.
This work was supported in part by the Research Grants Council – Strategic Topics Grant (Grant no. STG2/P-705/24-R) and The University of Hong Kong HKU-100 Scholars Fund, in part by the postdoctoral project of the International Training for Excellent Young Scientific Talents, in part by the Open Fund of the Key Laboratory of Monitoring, Evaluation and Early Warning of Territorial Spatial Planning Implementation, Ministry of Natural Resources (Grant no. LMEE-KF2024015), and in part by the Major Key Project of PCL (Grant no. PCL2024A04).
This paper was edited by Yuqiang Zhang and reviewed by three anonymous referees.
Anwar, S., Khan, S., and Barnes, N.: A Deep Journey into Super-resolution: A Survey, ACM Comput. Surv., 53, 1–34, https://doi.org/10.1145/3390462, 2021.
Asare, Y. M., Forkuo, E. K., Forkuor, G., and Thiel, M.: Evaluation of gap-filling methods for Landsat 7 ETM+ SLC-off image for LULC classification in a heterogeneous landscape of West Africa, Int. J. Remote Sens., 41, 2544–2564, https://doi.org/10.1080/01431161.2019.1693076, 2020.
Badawi, M., Helder, D., Leigh, L., and Jing, X.: Methods for Earth-Observing Satellite Surface Reflectance Validation, Remote Sens.-Basel, 11, 1543, https://doi.org/10.3390/rs11131543, 2019.
Bagan, H. and Yamagata, Y.: Analysis of urban growth and estimating population density using satellite images of nighttime lights and land-use and population data, GISci. Remote Sens., 52, 765–780, https://doi.org/10.1080/15481603.2015.1072400, 2015.
Bao, L., Pan, H., Fan, D., Li, M., Jiang, L., and Zhang, Z.: Evaluation of Socio-Economic Development in Yunnan Province in 2018 Based on LJ-1 01 Nighttime Light Remote Sensing Image, IGARSS 2024 – 2024 IEEE International Geoscience and Remote Sensing Symposium, 1315–1318, https://doi.org/10.1109/igarss53475.2024.10641883, 2024.
Baugh, K., Elvidge, C. D., Ghosh, T., and Ziskin, D.: Development of a 2009 Stable Lights Product using DMSP-OLS data, APAN Proceedings, 30, 114, https://doi.org/10.7125/apan.30.17, 2010.
Bian, J., Li, A., Lei, G., Zhang, Z., Nan, X., and Liang, L.: Inter-Calibration of Nighttime Light Data Between DMSP/OLS And NPP/VIIRS in the Economic Corridors of Belt And Road Initiative, IGARSS 2019–2019 IEEE International Geoscience and Remote Sensing Symposium, 9028–9031, https://doi.org/10.1109/igarss.2019.8900373, 2019.
Chen, H., Wu, B., Yu, B., Chen, Z., Wu, Q., Lian, T., Wang, C., Li, Q., and Wu, J.: A New Method for Building-Level Population Estimation by Integrating LiDAR, Nighttime Light, and POI Data, J. Remote Sens., 2021, https://doi.org/10.34133/2021/9803796, 2021a.
Chen, L.-C., Zhu, Y., Papandreou, G., Schroff, F., and Adam, H.: Encoder-decoder with atrous separable convolution for semantic image segmentation, Proceedings of the European conference on computer vision (ECCV), 801–818, https://doi.org/10.1007/978-3-030-01234-2_49, 2018.
Chen, X., Wang, Z., Zhang, F., Shen, G., and Chen, Q.: A global annual simulated VIIRS nighttime light dataset from 1992 to 2023, Sci. Data, 11, 1380, https://doi.org/10.1038/s41597-024-04228-6, 2024.
Chen, Z., Yu, B., Ta, N., Shi, K., Yang, C., Wang, C., Zhao, X., Deng, S., and Wu, J.: Delineating Seasonal Relationships Between Suomi NPP-VIIRS Nighttime Light and Human Activity Across Shanghai, China, IEEE J. Sel. Top. Appl., 12, 4275–4283, https://doi.org/10.1109/jstars.2019.2916323, 2019.
Chen, Z., Yu, B., Yang, C., Zhou, Y., Yao, S., Qian, X., Wang, C., Wu, B., Wu, J., Liao, L., and Shi, K.: The global NPP-VIIRS-like nighttime light data (Version 2) for 1992–2024 (V9), Harvard Dataverse, https://doi.org/10.7910/DVN/YGIVCD, 2020.
Chen, Z., Yu, B., Yang, C., Zhou, Y., Yao, S., Qian, X., Wang, C., Wu, B., and Wu, J.: An extended time series (2000–2018) of global NPP-VIIRS-like nighttime light data from a cross-sensor calibration, Earth Syst. Sci. Data, 13, 889–906, https://doi.org/10.5194/essd-13-889-2021, 2021b.
Chen, Z., Wei, Y., Shi, K., Zhao, Z., Wang, C., Wu, B., Qiu, B., and Yu, B.: The potential of nighttime light remote sensing data to evaluate the development of digital economy: A case study of China at the city level, Comput. Environ. Urban, 92, 101749, https://doi.org/10.1016/j.compenvurbsys.2021.101749, 2022.
Chen, Z., Liao, L., Wang, C., Shi, K., and Yu, B.: The 1992–2024 Global NPP-VIIRS-like Nighttime Light Annual Data from Deep Learning Super-Resolution Reconstruction, J. Remote Sens., 6, 0874, https://doi.org/10.34133/remotesensing.0874, 2026.
Cheng, H., Zhou, Y., and Li, X.: The World's First Long-Term Global 500 m-Resolution Monthly VIIRS Nighttime Lights Dataset (1992–Present), HKU Data Hub [data set], https://doi.org/10.25442/hku.31321315.v2, 2026a.
Cheng, H., Geng, M., Li, X., and Zhou, Y.: NightNet, Zenodo [code], https://doi.org/10.5281/zenodo.20134096, 2026b.
Cipolla, R., Gal, Y., and Kendall, A.: Multi-task Learning Using Uncertainty to Weigh Losses for Scene Geometry and Semantics, in: 2018 IEEE/CVF Conference on Computer Vision and Pattern Recognition, 2018 IEEE/CVF Conference on Computer Vision and Pattern Recognition (CVPR), 7482–7491, https://doi.org/10.1109/CVPR.2018.00781, 2018.
Claverie, M., Vermote, E. F., Franch, B., and Masek, J. G.: Evaluation of the Landsat-5 TM and Landsat-7 ETM+ surface reflectance products, Remote Sens. Environ., 169, 390–403, https://doi.org/10.1016/j.rse.2015.08.030, 2015.
Ding, L. and Goshtasby, A.: On the Canny edge detector, Pattern Recogn., 34, 721–725, https://doi.org/10.1016/S0031-3203(00)00023-6, 2001.
Doll, C. N. H., Muller, J.-P., and Elvidge, C. D.: Night-time Imagery as a Tool for Global Mapping of Socioeconomic Parameters and Greenhouse Gas Emissions, AMBIO, 29, 157–162, https://doi.org/10.1579/0044-7447-29.3.157, 2000.
Dong, B., Zhang, R., Li, S., Ye, Y., and Huang, C.: A meta-analysis for the nighttime light remote sensing data applied in urban research: Key topics, hotspot study areas and new trends, Science of Remote Sensing, 11, 100186, https://doi.org/10.1016/j.srs.2024.100186, 2025.
Elvidge, C. D.: Mapping City Lights With Nighttime Data from the DMSP Operational Linescan System, Photogramm. Eng. Rem. S., 63, 727–734, 1997.
Elvidge, C. D., Imhoff, M. L., Baugh, K. E., Hobson, V. R., Nelson, I., Safran, J., Dietz, J. B., and Tuttle, B. T.: Night-time lights of the world: 1994–1995, ISPRS J. Photogramm., 56, 81–99, https://doi.org/10.1016/s0924-2716(01)00040-5, 2001.
Elvidge, C. D., Zhizhin, M., Ghosh, T., Hsu, F.-C., and Taneja, J.: Annual Time Series of Global VIIRS Nighttime Lights Derived from Monthly Averages: 2012 to 2019, Remote Sens.-Basel, 13, 922, https://doi.org/10.3390/rs13050922, 2021.
Elvidge, C. D., Ghosh, T., Chatterjee, N., Zhizhin, M., Sutton, P. C., and Bazilian, M.: A comprehensive global mapping of offshore lighting, Earth Syst. Sci. Data, 17, 579–594, https://doi.org/10.5194/essd-17-579-2025, 2025.
Gibson, J., Olivia, S., and Boe-Gibson, G.: Night Lights in Economics: Sources and Uses1, J. Econ. Surv., 34, 955–980, https://doi.org/10.1111/joes.12387, 2020.
Gibson, J., Olivia, S., Boe-Gibson, G., and Li, C.: Which night lights data should we use in economics, and where?, J. Dev. Econ., 149, 102602, https://doi.org/10.1016/j.jdeveco.2020.102602, 2021.
Glenn, E. P., Nagler, P. L., and Huete, A. R.: Vegetation Index Methods for Estimating Evapotranspiration by Remote Sensing, Surv. Geophys., 31, 531–555, https://doi.org/10.1007/s10712-010-9102-2, 2010.
Gong, P., Li, X., Wang, J., Bai, Y., Chen, B., Hu, T., Liu, X., Xu, B., Yang, J., Zhang, W., and Zhou, Y.: Annual maps of global artificial impervious area (GAIA) between 1985 and 2018, Remote Sens. Environ., 236, 111510, https://doi.org/10.1016/j.rse.2019.111510, 2020.
Henderson, J. V., Storeygard, A., and Weil, D. N.: Measuring Economic Growth from Outer Space, Am. Econ. Rev., 102, 994–1028, https://doi.org/10.1257/aer.102.2.994, 2012.
Hong, Y., Wu, B., Song, Z., Li, Y., Wu, Q., Chen, Z., Liu, S., Yang, C., Wu, J., and Yu, B.: A monthly night-time light composite dataset of NOAA-20 in China: a multi-scale comparison with S-NPP, Int. J. Remote Sens., 42, 7931–7951, https://doi.org/10.1080/01431161.2021.1969057, 2021.
Hsu, F.-C., Baugh, K., Ghosh, T., Zhizhin, M., and Elvidge, C.: DMSP-OLS Radiance Calibrated Nighttime Lights Time Series with Intercalibration, Remote Sens.-Basel, 7, 1855–1876, https://doi.org/10.3390/rs70201855, 2015.
Hu, Y., Chen, J., Cao, X., Chen, X., Cui, X., and Gan, L.: Correcting the Saturation Effect in DMSP/OLS Stable Nighttime Light Products Based on Radiance-Calibrated Data, IEEE T. Geosci. Remote, 60, 1–11, https://doi.org/10.1109/tgrs.2021.3060170, 2022.
Huang, C., Zhuang, Q., Meng, X., Guo, H., and Han, J.: An improved nightlight threshold method for revealing the spatiotemporal dynamics and driving forces of urban expansion in China, J. Environ. Manage., 289, 112574, https://doi.org/10.1016/j.jenvman.2021.112574, 2021a.
Huang, C., Ye, Y., Jin, Y., and Liang, B.: Research Progress, Hotspots, and Evolution of Nighttime Light Pollution: Analysis Based on WOS Database and Remote Sensing Data, Remote Sens.-Basel, 15, 2305, https://doi.org/10.3390/rs15092305, 2023.
Huang, R., Wu, W., and Yu, K.: Building consistent time series night-time light data from average DMSP/OLS images for indicating human activities in a large-scale oceanic area, Int. J. Appl. Earth Obs., 114, 103023, https://doi.org/10.1016/j.jag.2022.103023, 2022.
Huang, S., Tang, L., Hupy, J. P., Wang, Y., and Shao, G.: A commentary review on the use of normalized difference vegetation index (NDVI) in the era of popular remote sensing, J. Forestry Res., 32, 1–6, https://doi.org/10.1007/s11676-020-01155-1, 2021b.
Hughes, M. J. and Kennedy, R.: High-Quality Cloud Masking of Landsat 8 Imagery Using Convolutional Neural Networks, Remote Sens.-Basel, 11, 2591, https://doi.org/10.3390/rs11212591, 2019.
Jindal, M., Gupta, P. K., and Srivastav, S. K.: Generation of monthly VIIRS nighttime lights time-series (1992–2013) images using deep learning (cGAN) technique, Remote Sensing Applications: Society and Environment, 35, 101263, https://doi.org/10.1016/j.rsase.2024.101263, 2024.
Kong, D., Zhang, Y., Gu, X., and Wang, D.: A robust method for reconstructing global MODIS EVI time series on the Google Earth Engine, ISPRS J. Photogramm., 155, 13–24, https://doi.org/10.1016/j.isprsjprs.2019.06.014, 2019.
Li, S. and Cao, X.: Monitoring the modes and phases of global human activity development over 30 years: Evidence from county-level nighttime light, Int. J. Appl. Earth Obs., 126, 103627, https://doi.org/10.1016/j.jag.2023.103627, 2024.
Li, S., Cao, X., Zhao, C., Jie, N., Liu, L., Chen, X., and Cui, X.: Developing a Pixel-Scale Corrected Nighttime Light Dataset (PCNL, 1992–2021) Combining DMSP-OLS and NPP-VIIRS, Remote Sens.-Basel, 15, 3925, https://doi.org/10.3390/rs15163925, 2023.
Li, X. and Zhou, Y.: A Stepwise Calibration of Global DMSP/OLS Stable Nighttime Light Data (1992–2013), Remote Sens.-Basel, 9, 637, https://doi.org/10.3390/rs9060637, 2017a.
Li, X. and Zhou, Y.: Urban mapping using DMSP/OLS stable night-time light: a review, Int. J. Remote Sens., 38, 6030–6046, https://doi.org/10.1080/01431161.2016.1274451, 2017b.
Li, X., Zhou, Y., Zhao, M., and Zhao, X.: A harmonized global nighttime light dataset 1992–2018, Sci. Data, 7, 168, https://doi.org/10.1038/s41597-020-0510-y, 2020a.
Li, X., Gong, P., Zhou, Y., Wang, J., Bai, Y., Chen, B., Hu, T., Xiao, Y., Xu, B., Yang, J., Liu, X., Cai, W., Huang, H., Wu, T., Wang, X., Lin, P., Li, X., Chen, J., He, C., Li, X., Yu, L., Clinton, N., and Zhu, Z.: Mapping global urban boundaries from the global artificial impervious area (GAIA) data, Environ. Res. Lett., 15, 094044, https://doi.org/10.1088/1748-9326/ab9be3, 2020b.
Li, Y., Liu, C., Zhang, J., Zhang, P., and Xue, Y.: Monitoring Spatial and Temporal Patterns of Rubber Plantation Dynamics Using Time-Series Landsat Images and Google Earth Engine, IEEE J. Sel. Top. Appl., 14, 9450–9461, https://doi.org/10.1109/jstars.2021.3110763, 2021.
Liu, P., Wang, Q., Zhang, D., and Lu, Y.: An Improved Correction Method of Nighttime Light Data Based on EVI and WorldPop Data, Remote Sens.-Basel, 12, 3988, https://doi.org/10.3390/rs12233988, 2020.
Liu, Y., Delahunty, T., Zhao, N., and Cao, G.: These lit areas are undeveloped: Delimiting China's urban extents from thresholded nighttime light imagery, Int. J. Appl. Earth Obs., 50, 39–50, https://doi.org/10.1016/j.jag.2016.02.011, 2016.
Liu, Y., Huang, Y., and Liu, Y.: Global risk assessment of river pollution stress based on nighttime light remote sensing data, Sci. Total Environ., 949, 175146, https://doi.org/10.1016/j.scitotenv.2024.175146, 2024.
Long, J., Shelhamer, E., and Darrell, T.: Fully convolutional networks for semantic segmentation, Proceedings of the IEEE conference on computer vision and pattern recognition, 3431–3440, https://doi.org/10.1109/CVPR.2015.7298965, 2015.
Ma, J., Guo, J., Ahmad, S., Li, Z., and Hong, J.: Constructing a New Inter-Calibration Method for DMSP-OLS and NPP-VIIRS Nighttime Light, Remote Sens.-Basel, 12, 937, https://doi.org/10.3390/rs12060937, 2020.
Masek, J. G., Honzak, M., Goward, S. N., Liu, P., and Pak, E.: Landsat-7 ETM+ as an observatory for land cover: Initial radiometric and geometric comparisons with Landsat-5 Thematic Mapper, Remote Sens. Environ., 78, 118–130, https://doi.org/10.1016/s0034-4257(01)00254-1, 2001.
Nechaev, D., Zhizhin, M., Poyda, A., Ghosh, T., Hsu, F.-C., and Elvidge, C.: Cross-Sensor Nighttime Lights Image Calibration for DMSP/OLS and SNPP/VIIRS with Residual U-Net, Remote Sens.-Basel, 13, 5026, https://doi.org/10.3390/rs13245026, 2021.
Oudrari, H., McIntire, J., Xiong, X., Butler, J., Lee, S., Lei, N., Schwarting, T., and Sun, J.: Prelaunch Radiometric Characterization and Calibration of the S-NPP VIIRS Sensor, IEEE T. Geosci. Remote, 53, 2195–2210, https://doi.org/10.1109/tgrs.2014.2357678, 2015.
Pandey, B., Zhang, Q., and Seto, K. C.: Comparative evaluation of relative calibration methods for DMSP/OLS nighttime lights, Remote Sens. Environ., 195, 67–78, https://doi.org/10.1016/j.rse.2017.04.011, 2017.
Qiu, Y., Li, X.-M., Yan, L., and Chen, Z.: Synergic sensing of light and heat emitted by offshore oil and gas platforms in the South China Sea, Int. J. Digit. Earth, 17, 2441932, https://doi.org/10.1080/17538947.2024.2441932, 2024.
Ronneberger, O., Fischer, P., and Brox, T.: U-net: Convolutional networks for biomedical image segmentation, International Conference on Medical image computing and computer-assisted intervention, 234–241, https://doi.org/10.1007/978-3-319-24574-4_28, 2015.
Sahoo, S., Gupta, P. K., and Srivastav, S. K.: Inter-calibration of DMSP-OLS and SNPP-VIIRS-DNB annual nighttime light composites using machine learning, GISci. Remote Sens., 57, 1144–1165, https://doi.org/10.1080/15481603.2020.1848323, 2020.
Sun, J., Qi, Y., Guo, J., Zheng, J., Zhang, L., and Yang, X.: Impact of nighttime light data saturation correction on the application of carbon emissions spatialization: A comparative study of the correction effect and application effect based on five methods in China, J. Clean. Prod., 438, 140815, https://doi.org/10.1016/j.jclepro.2024.140815, 2024a.
Sun, Y., Xie, J., Wang, Y., Chan, T. O., and Sun, Z.-Y.: Mapping local-scale working population and daytime population densities using points-of-interest and nighttime light satellite imageries, Geo-spatial Information Science, 27, 1852–1867, https://doi.org/10.1080/10095020.2023.2273826, 2024b.
Tan, X., Chen, R., Zhu, X., Li, X., Chen, J., Sing Wong, M., Xu, S., and Xu, Y. N.: Spatial heterogeneity of uncertainties in daily satellite nighttime light time series, Int. J. Appl. Earth Obs., 123, 103484, https://doi.org/10.1016/j.jag.2023.103484, 2023.
Wang, J., Sun, K., Cheng, T., Jiang, B., Deng, C., Zhao, Y., Liu, D., Mu, Y., Tan, M., Wang, X., Liu, W., and Xiao, B.: Deep High-Resolution Representation Learning for Visual Recognition, IEEE T. Pattern Anal., 43, 3349–3364, https://doi.org/10.1109/TPAMI.2020.2983686, 2021.
Wang, L., Tan, W., Xu, H., He, H., Chen, N., Li, D., Chapman, M. A., and Li, J.: DEEP LEARNING-BASED METHOD TO EXTEND THE TIME SERIES OF GLOBAL ANNUAL VIIRS-LIKE NIGHTTIME LIGHT DATA, Int. Arch. Photogramm. Remote Sens. Spatial Inf. Sci., XLIII-B1-2022, 73–78, https://doi.org/10.5194/isprs-archives-XLIII-B1-2022-73-2022, 2022.
Woo, S., Park, J., Lee, J.-Y., and Kweon, I. S.: CBAM: Convolutional Block Attention Module, in: Computer Vision – ECCV 2018: 15th European Conference, Munich, Germany, 8–14 September 2018, Proceedings, Part VII, Munich, Germany, 3–19, https://doi.org/10.1007/978-3-030-01234-2_1, 2018.
Wu, B., Yang, C., Wu, Q., Wang, C., Wu, J., and Yu, B.: A building volume adjusted nighttime light index for characterizing the relationship between urban population and nighttime light intensity, Comput. Environ. Urban, 99, 101911, https://doi.org/10.1016/j.compenvurbsys.2022.101911, 2023.
Wu, J., Tu, Y., Chen, Z., and Yu, B.: Analyzing the Spatially Heterogeneous Relationships between Nighttime Light Intensity and Human Activities across Chongqing, China, Remote Sens.-Basel, 14, 5695, https://doi.org/10.3390/rs14225695, 2022.
Wu, Y. and Li, X.: Exploring the Drivers of Variations in Daily Nighttime Light Time Series From the Perspective of Periodic Factors, IEEE Geosci. Remote S., 21, 1–5, https://doi.org/10.1109/LGRS.2024.3358856, 2024.
Yang, L., Cao, J., Zhuo, L., and Shi, Q.: A Novel Consistency Calibration Method for DMSP-OLS Nighttime Stable Light Time-Series Images, IEEE J. Sel. Top. Appl., 15, 2621–2631, https://doi.org/10.1109/jstars.2022.3157906, 2022.
Yao, J., Du, P., Zhao, Y., and Wang, Y.: Simulating Nighttime Visible Satellite Imagery of Tropical Cyclones Using Conditional Generative Adversarial Networks, IEEE J. Sel. Top. Appl., 18, 12616–12633, https://doi.org/10.1109/jstars.2025.3567074, 2025.
Zhang, C., Mao, Z., Nie, J., Lai, Y., and Lei, D.: A Comparative Study of Deep Learning Methods for Super-Resolution of Npp-Viirs Nighttime Light Images, https://doi.org/10.2139/ssrn.5017152, 2024a.
Zhang, H. K., Luo, D., and Roy, D. P.: Improved Landsat Operational Land Imager (OLI) Cloud and Shadow Detection with the Learning Attention Network Algorithm (LANA), Remote Sens.-Basel, 16, 1321, https://doi.org/10.3390/rs16081321, 2024b.
Zhang, L., Dong, R., Yuan, S., Zhang, J., Chen, M., Zheng, J., and Fu, H.: DeepLight: Reconstructing High-Resolution Observations of Nighttime Light With Multi-Modal Remote Sensing Data, in: Proceedings of the Thirty-ThirdInternational Joint Conference on Artificial Intelligence, Thirty-Third International Joint Conference on Artificial Intelligence IJCAI-24, 7563–7571, https://doi.org/10.24963/ijcai.2024/837, 2024c.
Zhang, Q., Pandey, B., and Seto, K. C.: A Robust Method to Generate a Consistent Time Series From DMSP/OLS Nighttime Light Data, IEEE T. Geosci. Remote, 54, 5821–5831, https://doi.org/10.1109/tgrs.2016.2572724, 2016.
Zhang, S., Ma, Y., Chen, H., Shang, E., Yao, W., Yang, J., and He, G.: The Spatiotemporal Fusion for Nighttime Light Based on SDGSAT-1 and VIIRS Data, IEEE T. Geosci. Remote, 63, 1–19, https://doi.org/10.1109/tgrs.2025.3560092, 2025.
Zhao, C., Cao, X., Chen, X., and Cui, X.: A consistent and corrected nighttime light dataset (CCNL 1992–2013) from DMSP-OLS data, Sci. Data, 9, https://doi.org/10.1038/s41597-022-01540-x, 2022.
Zhao, M., Zhou, Y., Li, X., Cao, W., He, C., Yu, B., Li, X., Elvidge, C. D., Cheng, W., and Zhou, C.: Applications of Satellite Remote Sensing of Nighttime Light Observations: Advances, Challenges, and Perspectives, Remote Sens.-Basel, 11, 1971, https://doi.org/10.3390/rs11171971, 2019.
Zheng, Q., Weng, Q., and Wang, K.: Developing a new cross-sensor calibration model for DMSP-OLS and Suomi-NPP VIIRS night-light imageries, ISPRS J. Photogramm., 153, 36–47, https://doi.org/10.1016/j.isprsjprs.2019.04.019, 2019a.
Zheng, Q., Weng, Q., Zhou, Y., and Dong, B.: Impact of temporal compositing on nighttime light data and its applications, Remote Sens. Environ., 274, 113016, https://doi.org/10.1016/j.rse.2022.113016, 2022.
Zheng, Q., Seto, K. C., Zhou, Y., You, S., and Weng, Q.: Nighttime light remote sensing for urban applications: Progress, challenges, and prospects, ISPRS J. Photogramm., 202, 125–141, https://doi.org/10.1016/j.isprsjprs.2023.05.028, 2023.
Zheng, Y., Yang, K., Wei, C., Fu, M., and Fan, M.: An Improved Cross-Sensor Calibration Approach for DMSP-OLS and NPP-VIIRS Nighttime Light Data, IEEE J. Sel. Top. Appl., 18, 865–877, https://doi.org/10.1109/jstars.2024.3494551, 2025.
Zheng, Z., Yang, Z., Chen, Y., Wu, Z., and Marinello, F.: The Interannual Calibration and Global Nighttime Light Fluctuation Assessment Based on Pixel-Level Linear Regression Analysis, Remote Sens.-Basel, 11, 2185, https://doi.org/10.3390/rs11182185, 2019b.
Zhuo, L., Zheng, J., Zhang, X., Li, J., and Liu, L.: An improved method of night-time light saturation reduction based on EVI, Int. J. Remote Sens., 36, 4114–4130, https://doi.org/10.1080/01431161.2015.1073861, 2015.