the Creative Commons Attribution 4.0 License.
the Creative Commons Attribution 4.0 License.
 | 21 May 2026
Hydrometeorological and hydrological data from Baker Creek Research Watershed, Northwest Territories, Canada, release V.3
Christopher Spence
Newell Hedstrom
The V.3 data release from the Baker Creek Research Watershed documents hydrometeorological and hydrological conditions from 2003 to 2025. Baker Creek drains 155 km2 of subarctic Canadian Shield terrain in Treaty 11 in Canada's Northwest Territories. Half-hourly hydrometeorological data are available from the three most common landscape types, including exposed Precambrian bedrock ridges, open black spruce forest and lakes. Hydrometeorological data include radiation fluxes, precipitation, temperature, humidity, winds, barometric pressure and turbulent energy fluxes. Data from terrestrial sites include ground temperature and soil moisture. Spring maximum snowpack water equivalent, depth and density data are included. Daily streamflow data are available for six nested watersheds ranging in size from 9 to 155 km2. These data are unique in this remote region and provide communities with an opportunity to advance understanding of the hydrological response of a subarctic watershed subject to a warming trend and precipitation cycles. The data described here are available from the Federated Research Data Repository at: https://doi.org/10.20383/103.01579 (Spence and Hedstrom, 2026).
- Article
(5444 KB) - Full-text XML
- BibTeX
- EndNote


Locations of sustained intensive hydrometeorological and hydrological observations and research in cold regions remain limited in number (Laudon et al., 2017). These sites provide valuable data and information on the state of the environment as well as indicate emerging trends. The simultaneous research of physical processes at these locations facilitates explanation of the state and prediction of the future fate of hydrometeorological and hydrological regimes. As cold regions are warming faster than elsewhere on the globe (Manabe and Wetherald, 1975), observations and research are necessary if society is to detect and document the rate and consequences of change. This information has repercussions for society including sustaining traditional uses of the land, water availability, transportation infrastructure, engineering design, and selection of water treatment methodologies.
This situation is typified by the subarctic Canadian Shield. It is relatively sparsely populated (∼ 40 000) but its sheer size (1.26 million km2) and geology make it an important resource of critical minerals. Mining and hydroelectricity production are significant economic activities. The region aligns with the discontinuous permafrost zone (O'Neill et al., 2019; Gruber, 2012) and retains sizeable carbon storage in widespread peatlands. These two characteristics make it particularly vulnerable to changes in hydrological and aquatic chemistry regimes (Spence et al., 2020b) as less frozen ground can open new subsurface pathways for runoff and constituents (Lemieux et al., 2020). How the climate and hydrometeorology behave here has consequences beyond its borders. Areas with shallow shield geology occupy ∼ 20 % of the area that drains water to the Arctic Ocean so changes here can have influence elsewhere.
These data constitute the only integrated hydrological and hydrometeorological small watershed dataset in the western subarctic Canadian Shield. Previous justification for building such datasets included providing data from poorly gauged regions for model calibration and validation. The growing availability and advance of gridded climate products (e.g., CaSR, Gasset et al., 2021; ERA5, Hersbach et al., 2020) means today many modelling groups – especially large watershed modellers – rely less on observations. However, gridded products in remote regions are still derived from a sparse monitoring network and there is little evidence that accurate winds, humidity, temperature and precipitation are coincident in gridded products, even though these are necessary for correctly calculating water and energy budgets (Fischer and Knutti, 2013). Furthermore, research watershed observations such as those from Baker Creek often capture landscape unit variability that provide opportunities for testing algorithms in land surface schemes that gridded products cannot achieve.
The Baker Creek Research Watershed exists to address these ongoing needs for hydrological and hydrometeorological data and information. Observations and institutional research summarized here began in the early 2000s, but hydrological research activity in the watershed extends from the 1970s (Landals and Gill, 1972; Gibson et al., 1998). The data and information produced at the Research Watershed are meant to complement knowledge held by Indigenous peoples who have an intimate understanding of the environmental processes of the region, and there have been opportunities for knowledge exchange. There have been two previous data releases (Spence and Hedstrom, 2018, 2021). The data in this new release contain foundational information of how environmental systems may be changing as the time series is becoming long enough to have captured extremes, precipitation cycles, and a warming trend.
The Baker Creek Research Watershed is located on the traditional lands of the Yellowknives Dene, ![]() and North Slave Métis and is part of Treaty 11 and Canada's Northwest Territories. Baker Creek is characterized by numerous lakes connected by short streams and drains ∼ 165 km2 to Great Slave Lake. The Research Watershed is a 155 km2 portion upstream of the Water Survey of Canada (WSC) hydrometric gauge Baker Creek at the outlet of Lower Martin Lake (07SB013) (Fig. 1). The watershed contains discontinuous permafrost, which is present within glaciolacustrine clays, outwash and organic deposits, but absent below water bodies, exposed bedrock ridges and well-drained glaciofluvial sands (Morse et al., 2016). The thickness of overburden is as little as less than 1 m. Drilling into the overburden for well or borehole installations rarely involves drilling greater than 10 m before encountering bedrock. A ubiquitous organic soil layer is ∼ 0.25 m thick over fine grained soils. The most common tree species are black spruce (Picea mariana), jack pine (Pinus banksiana), tamarack (Larix laricina), and paper birch (Betula neoalaskana/papyrifera) and the understory is dominated by alder (Alnus), Labrador tea (Rhododendron groenlandicum), moss (Sphagnum spp.) and lichen (Cladonia spp.). Land cover data described in earlier data releases (Spence and Hedstrom, 2018) show that most of the watershed is exposed Precambrian bedrock (40 %) and water (23 %), followed by forested hillslopes (either coniferous or deciduous) (21 %) and wetlands (16 %). The watershed has relatively little relief as elevations range from 200 to 266 m a.s.l. Details of a 2007 Light Detection and Ranging survey are provided in Spence and Hedstrom (2018) and the 10 m digital elevation model was part of data release v.1. Climate normals (1990–2020) published by the Meteorological Service of Canada for the climate station Yellowknife A 15 km from the watershed suggest a cold continental climate with January daily average air temperatures of −26 °C and July daily average air temperatures of 17 °C. Thirty-nine percent of the 294 mm of annual unadjusted precipitation falls as snowfall. For much of the period of record (1983–2024) at WSC station 07SB013, the streamflow regime could be described as subarctic nival (Woo, 1986) but Spence et al. (2025) documented a shift near the turn of the century to a cold season pluvial regime as more than half the annual streamflow now occurs in winter. Annual average streamflow is 45 mm or 0.22 m3 s−1, which equates to an annual runoff ratio of 0.14. The streamflow regime is not necessarily tempered by the ∼ 350 lakes as the standard deviation is 35 mm or 0.17 m3 s−1, and annual runoff ratios range from 0.0006 to 0.34. The highest streamflow on record at 07SB013 is 8.7 m3 s−1 but as discussed below there can be prolonged periods of zero flow.
and North Slave Métis and is part of Treaty 11 and Canada's Northwest Territories. Baker Creek is characterized by numerous lakes connected by short streams and drains ∼ 165 km2 to Great Slave Lake. The Research Watershed is a 155 km2 portion upstream of the Water Survey of Canada (WSC) hydrometric gauge Baker Creek at the outlet of Lower Martin Lake (07SB013) (Fig. 1). The watershed contains discontinuous permafrost, which is present within glaciolacustrine clays, outwash and organic deposits, but absent below water bodies, exposed bedrock ridges and well-drained glaciofluvial sands (Morse et al., 2016). The thickness of overburden is as little as less than 1 m. Drilling into the overburden for well or borehole installations rarely involves drilling greater than 10 m before encountering bedrock. A ubiquitous organic soil layer is ∼ 0.25 m thick over fine grained soils. The most common tree species are black spruce (Picea mariana), jack pine (Pinus banksiana), tamarack (Larix laricina), and paper birch (Betula neoalaskana/papyrifera) and the understory is dominated by alder (Alnus), Labrador tea (Rhododendron groenlandicum), moss (Sphagnum spp.) and lichen (Cladonia spp.). Land cover data described in earlier data releases (Spence and Hedstrom, 2018) show that most of the watershed is exposed Precambrian bedrock (40 %) and water (23 %), followed by forested hillslopes (either coniferous or deciduous) (21 %) and wetlands (16 %). The watershed has relatively little relief as elevations range from 200 to 266 m a.s.l. Details of a 2007 Light Detection and Ranging survey are provided in Spence and Hedstrom (2018) and the 10 m digital elevation model was part of data release v.1. Climate normals (1990–2020) published by the Meteorological Service of Canada for the climate station Yellowknife A 15 km from the watershed suggest a cold continental climate with January daily average air temperatures of −26 °C and July daily average air temperatures of 17 °C. Thirty-nine percent of the 294 mm of annual unadjusted precipitation falls as snowfall. For much of the period of record (1983–2024) at WSC station 07SB013, the streamflow regime could be described as subarctic nival (Woo, 1986) but Spence et al. (2025) documented a shift near the turn of the century to a cold season pluvial regime as more than half the annual streamflow now occurs in winter. Annual average streamflow is 45 mm or 0.22 m3 s−1, which equates to an annual runoff ratio of 0.14. The streamflow regime is not necessarily tempered by the ∼ 350 lakes as the standard deviation is 35 mm or 0.17 m3 s−1, and annual runoff ratios range from 0.0006 to 0.34. The highest streamflow on record at 07SB013 is 8.7 m3 s−1 but as discussed below there can be prolonged periods of zero flow.
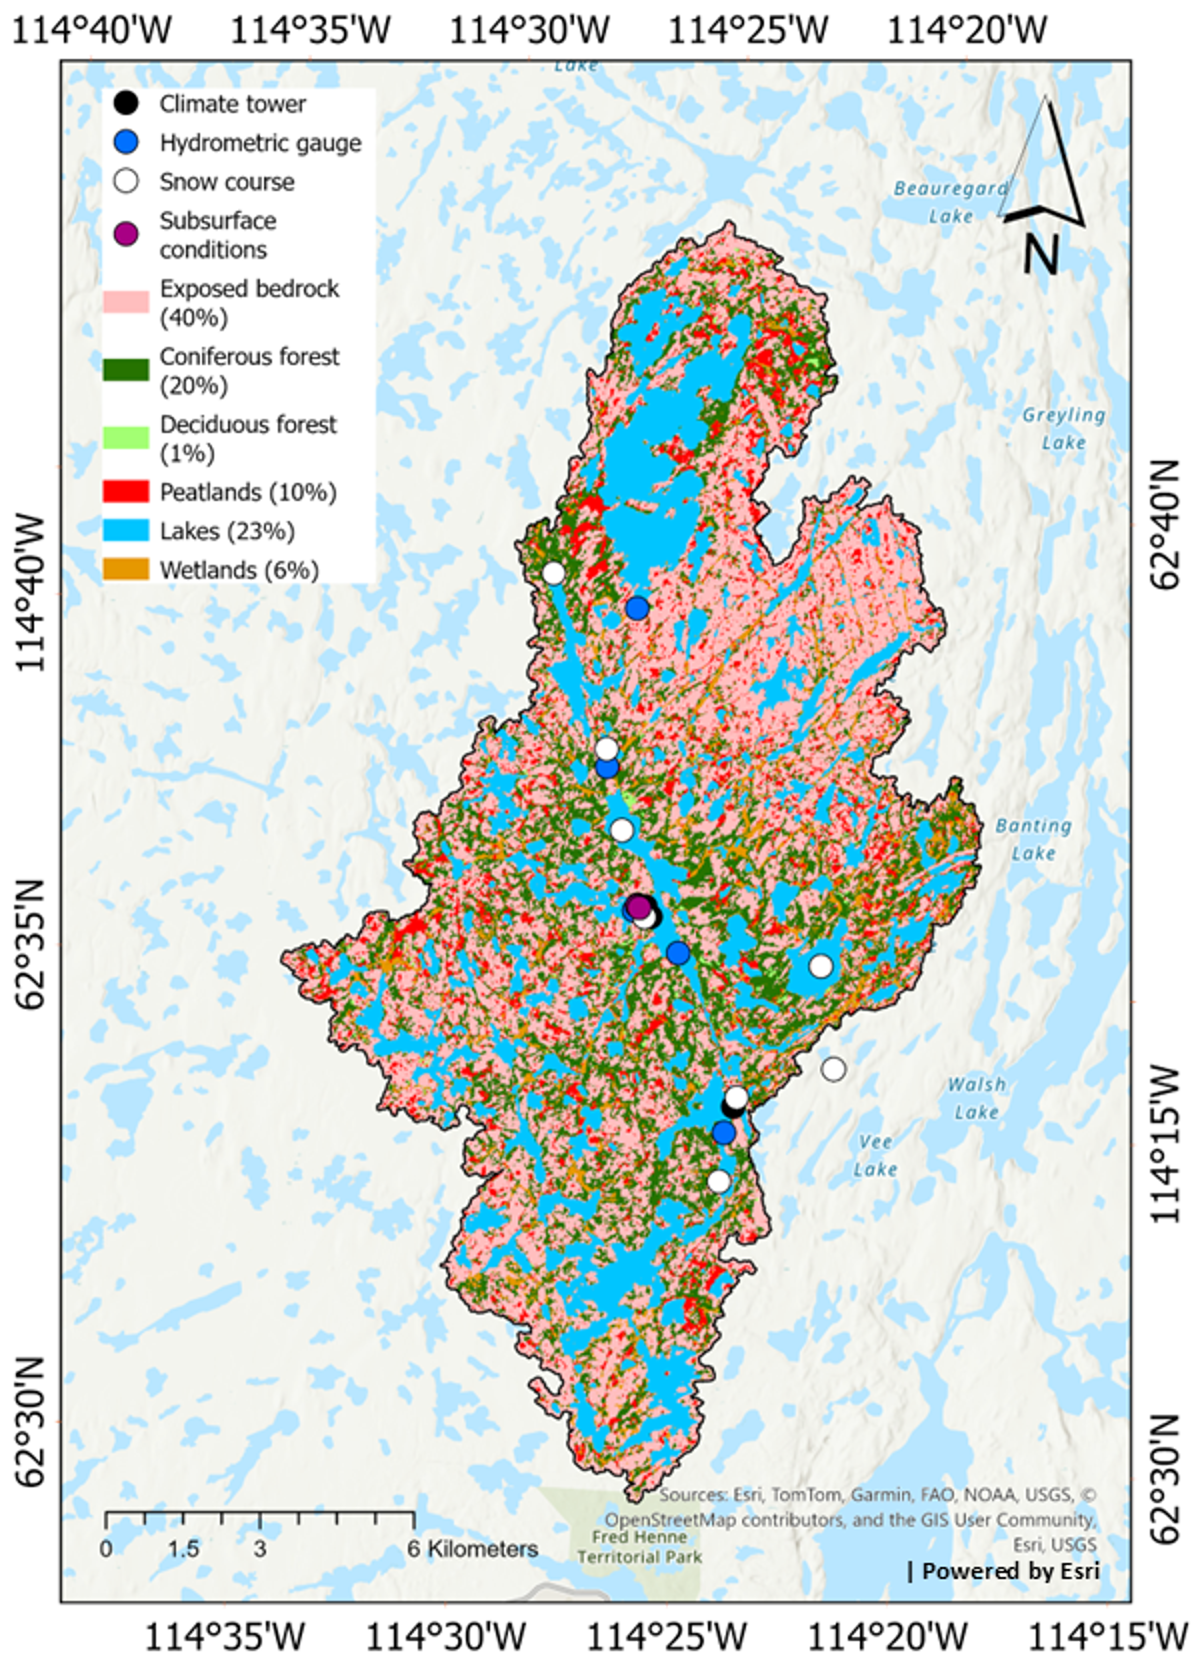
Figure 1Extent of the Baker Creek Research Watershed illustrating land cover distribution and locations of instrumentation. Background map layer developed by ESRI | Powered by ESRI using sources from ESRI Canada, TomTom, Garmin, SafeGraph, METI/NASA, USGS, EPA, USDA, NRCan, Parks Canada and Esri.
Climate tower installations at Baker Creek are stratified by land cover (Table 1). The primary climate towers occupy bedrock, lake and forested areas. These three landscape types occupy the majority of the watershed (84 %). All have been equipped with eddy covariance systems for at least a portion of their lifespan. The original forest tower was a tripod structure installed in 2014, which was upgraded to include eddy covariance sensors in 2023 and shifted to a taller scaffolding structure. Towers described in Spence and Hedstrom (2018) were replaced because of beaver-induced flooding at Landing Lake that began in 2019, and the bedrock tower collapsing in 2021. The lake tower was relocated to higher ground on an island in 2022 after ice shove removed the original. The bedrock tower was relocated in 2023 to a ridge on the drainage divide of the watershed in which the forest tower resides. During this period of renewal, instrumentation was upgraded and aligned among all three towers (Table 2; Fig. 2). Radiometers (Kipp and Zonen CNR4's) are mounted to face south. Wind speed and direction are measured with RM Young 05013 wind sensors and surface temperatures with Apogee SI-111 infra-red thermometers. There are Texas Instruments TE525M tipping buckets at each tower, the data from which are discussed in the next section. The eddy covariance systems are Campbell Scientific IRGASONs with integrated 3D sonic anemometer and H2O and CO2 gas analyzers. Only the sensible and latent heat fluxes are published as part of this data release. High frequency measurements are at 10 Hz and block averaged and reported half hourly to align with the meteorological data. Corrections to the eddy covariance measurements include coordinate rotation (Kaimal and Finnigan, 1994), the Webb–Pearman–Leuning (WPL) adjustment (Webb et al., 1980), sonic path length, high frequency attenuation and sensor separation (Massman, 2000; Horst, 1997) and analytic correction for filtering effects were computed following Moncrieff et al. (1997, 2005). Spikes in the half hourly data were identified as those greater than the absolute value of the mean plus or minus 3.5 times the standard deviation over a moving, overlapping window of 2 d, and removed. The released data have not been adjusted for energy budget closure, which can be poor with eddy covariance systems. Spence et al. (2024) report energy budget closure at these towers of approximately 0.83. There are numerous gaps in the record because of sensor malfunction or loss of power. None of the gaps have been filled. The stations typically operate from April through October but have remained running through some winters if data were required for specific research projects (e.g., Rafat et al., 2023).
Table 1List of monitoring locations in the Baker Creek Research Watershed.
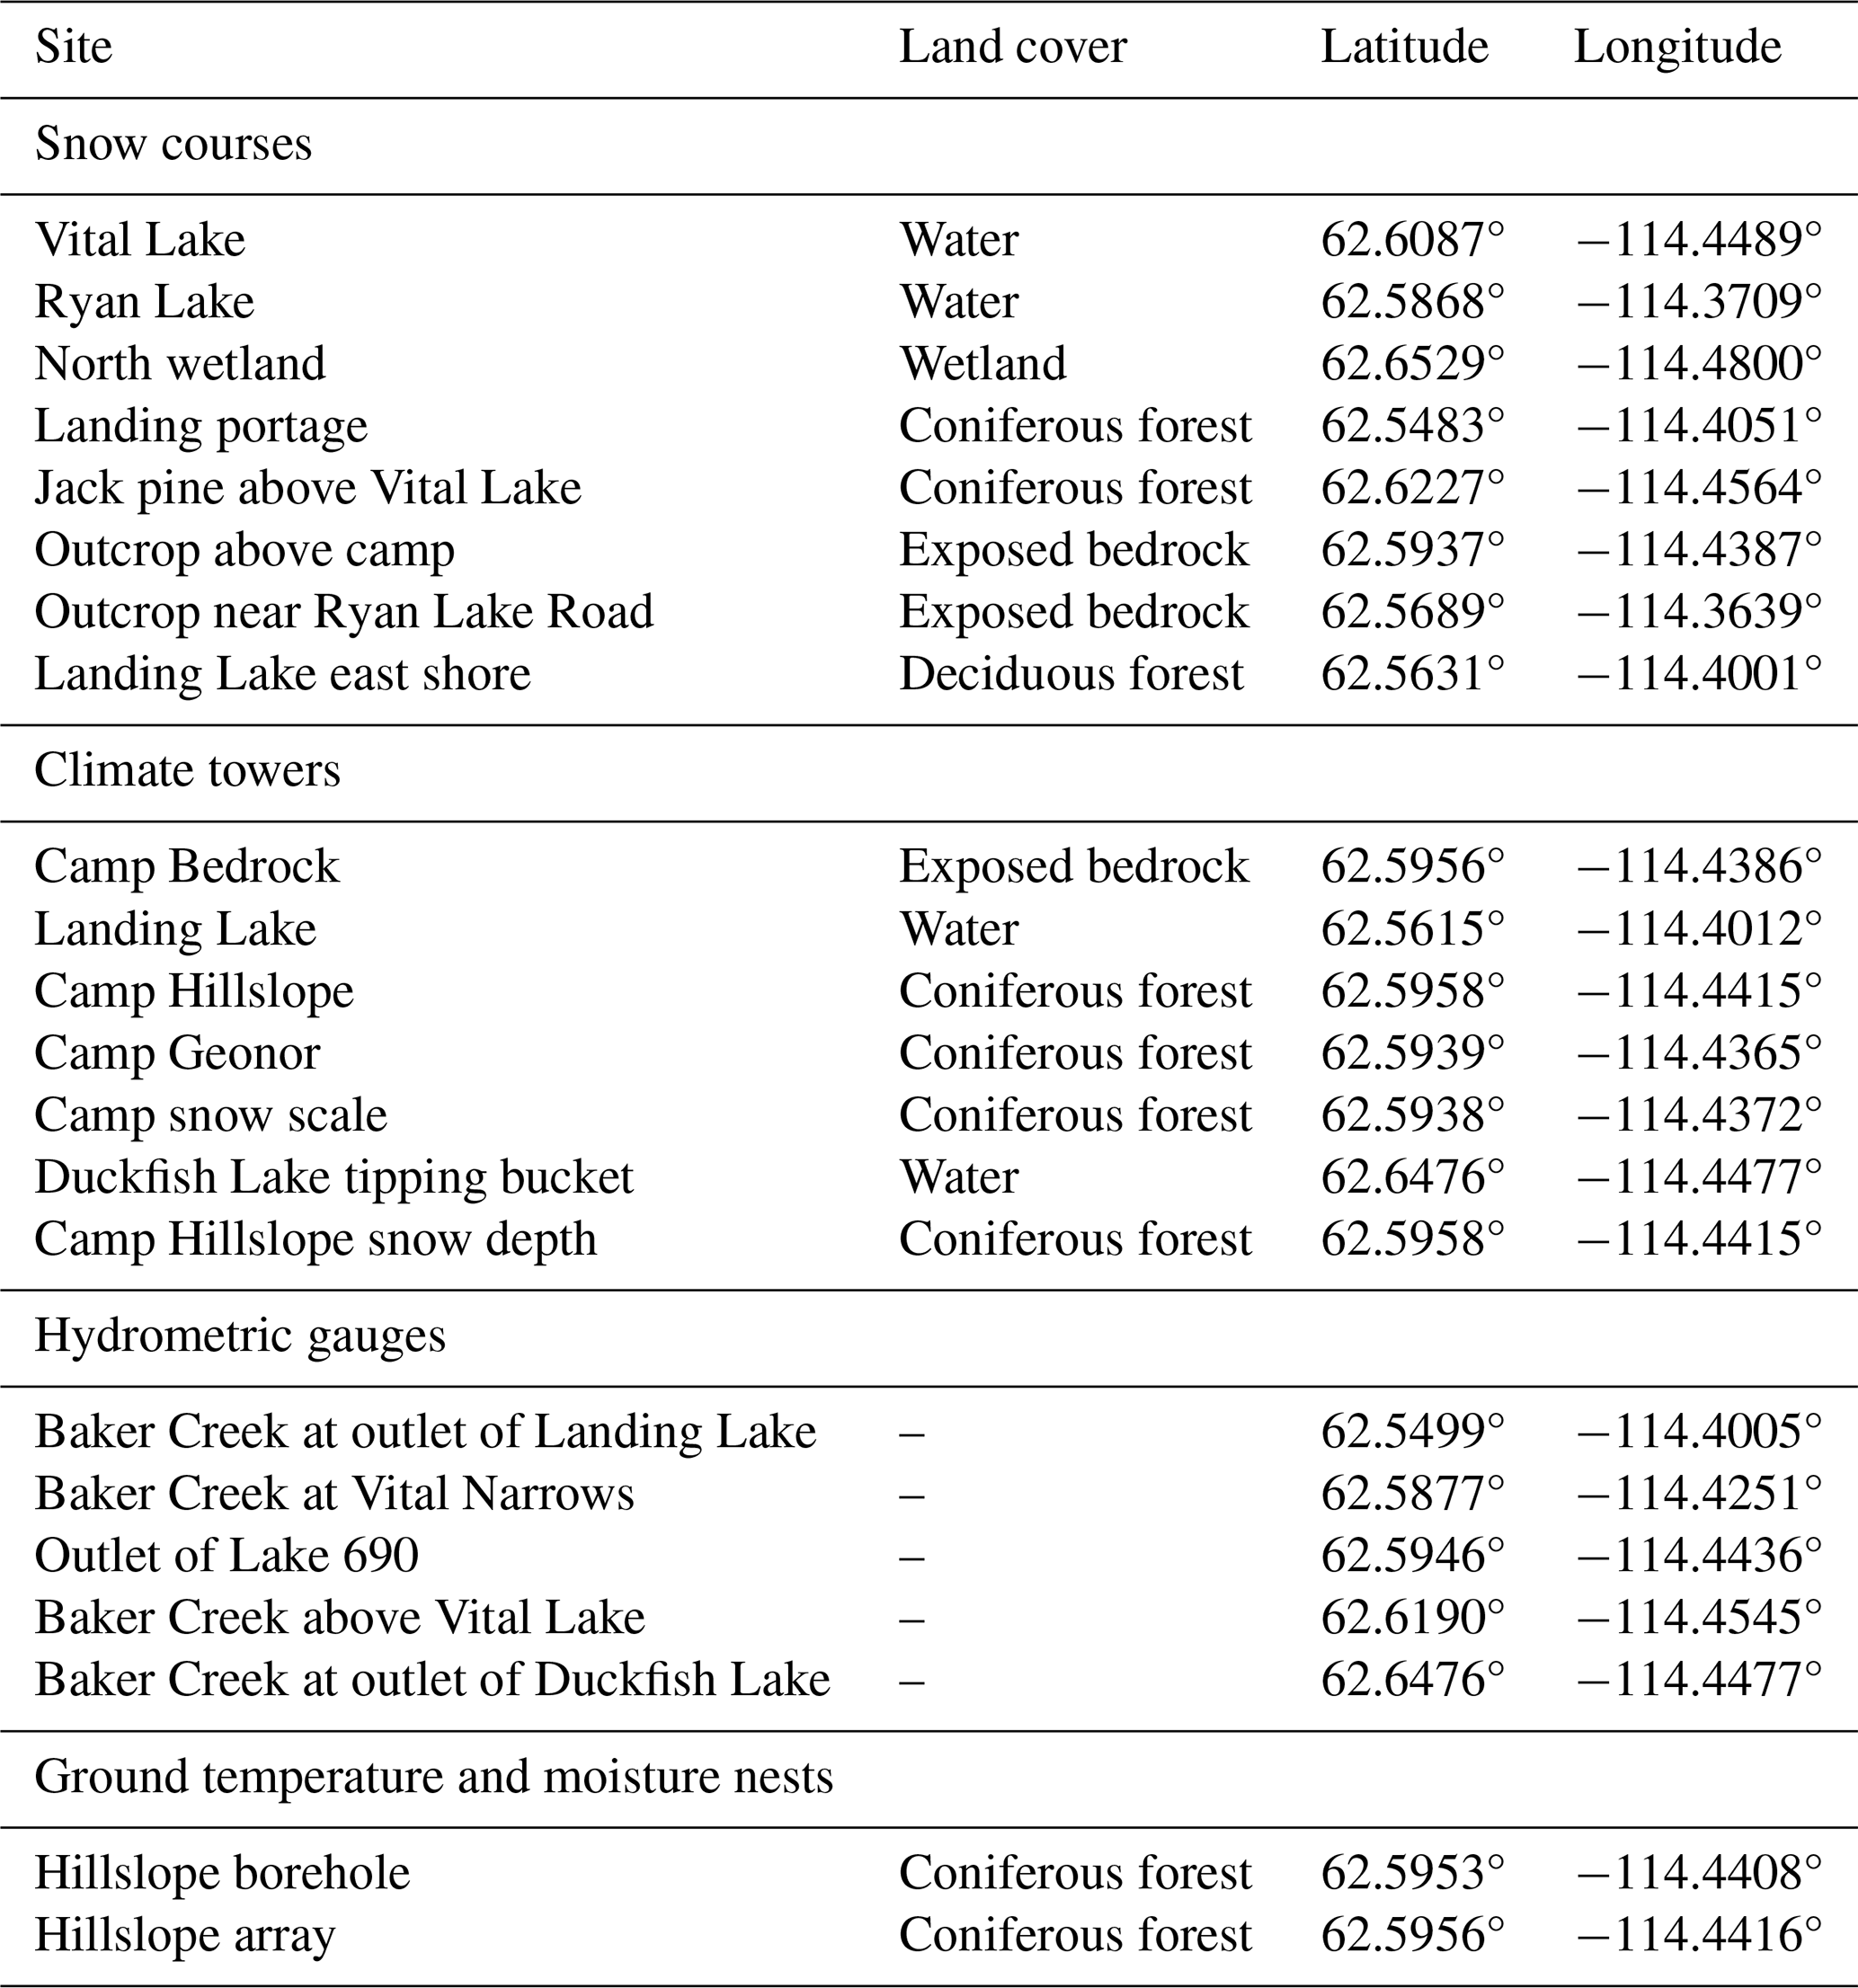
Table 2Sensor suites at the active climate stations in the forested hillslope, bedrock ridge, and at Landing Lake. All heights above ground are in meters. Dates each station became operational are provided in the text. NA denotes a sensor that is not deployed on the tower.
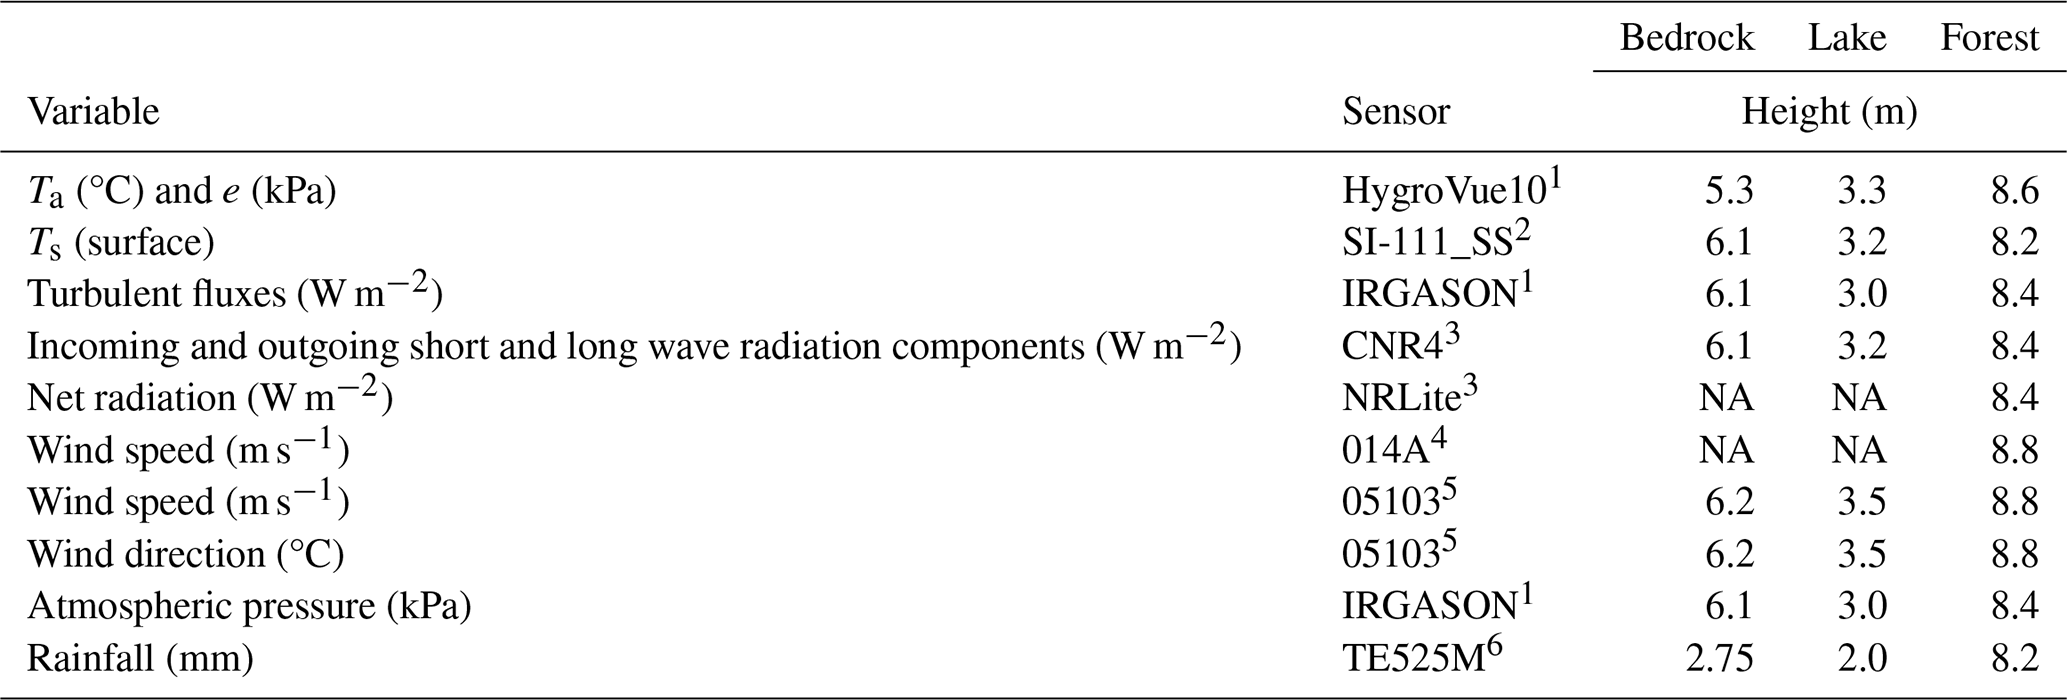
1 Manufactured by Campbell Scientific, Logan, UT, USA 2 Manufactured by Apogee, Logan, UT, USA 3 Manufactured by Kipp and Zonen, Delft, The Netherlands 4 Manufactured by Met One, Grants Pass, OR, USA 5 Manufactured by RM Young, Traverse City, MI, USA 6 Manufactured by Texas Instruments, Dallas, TX, USA
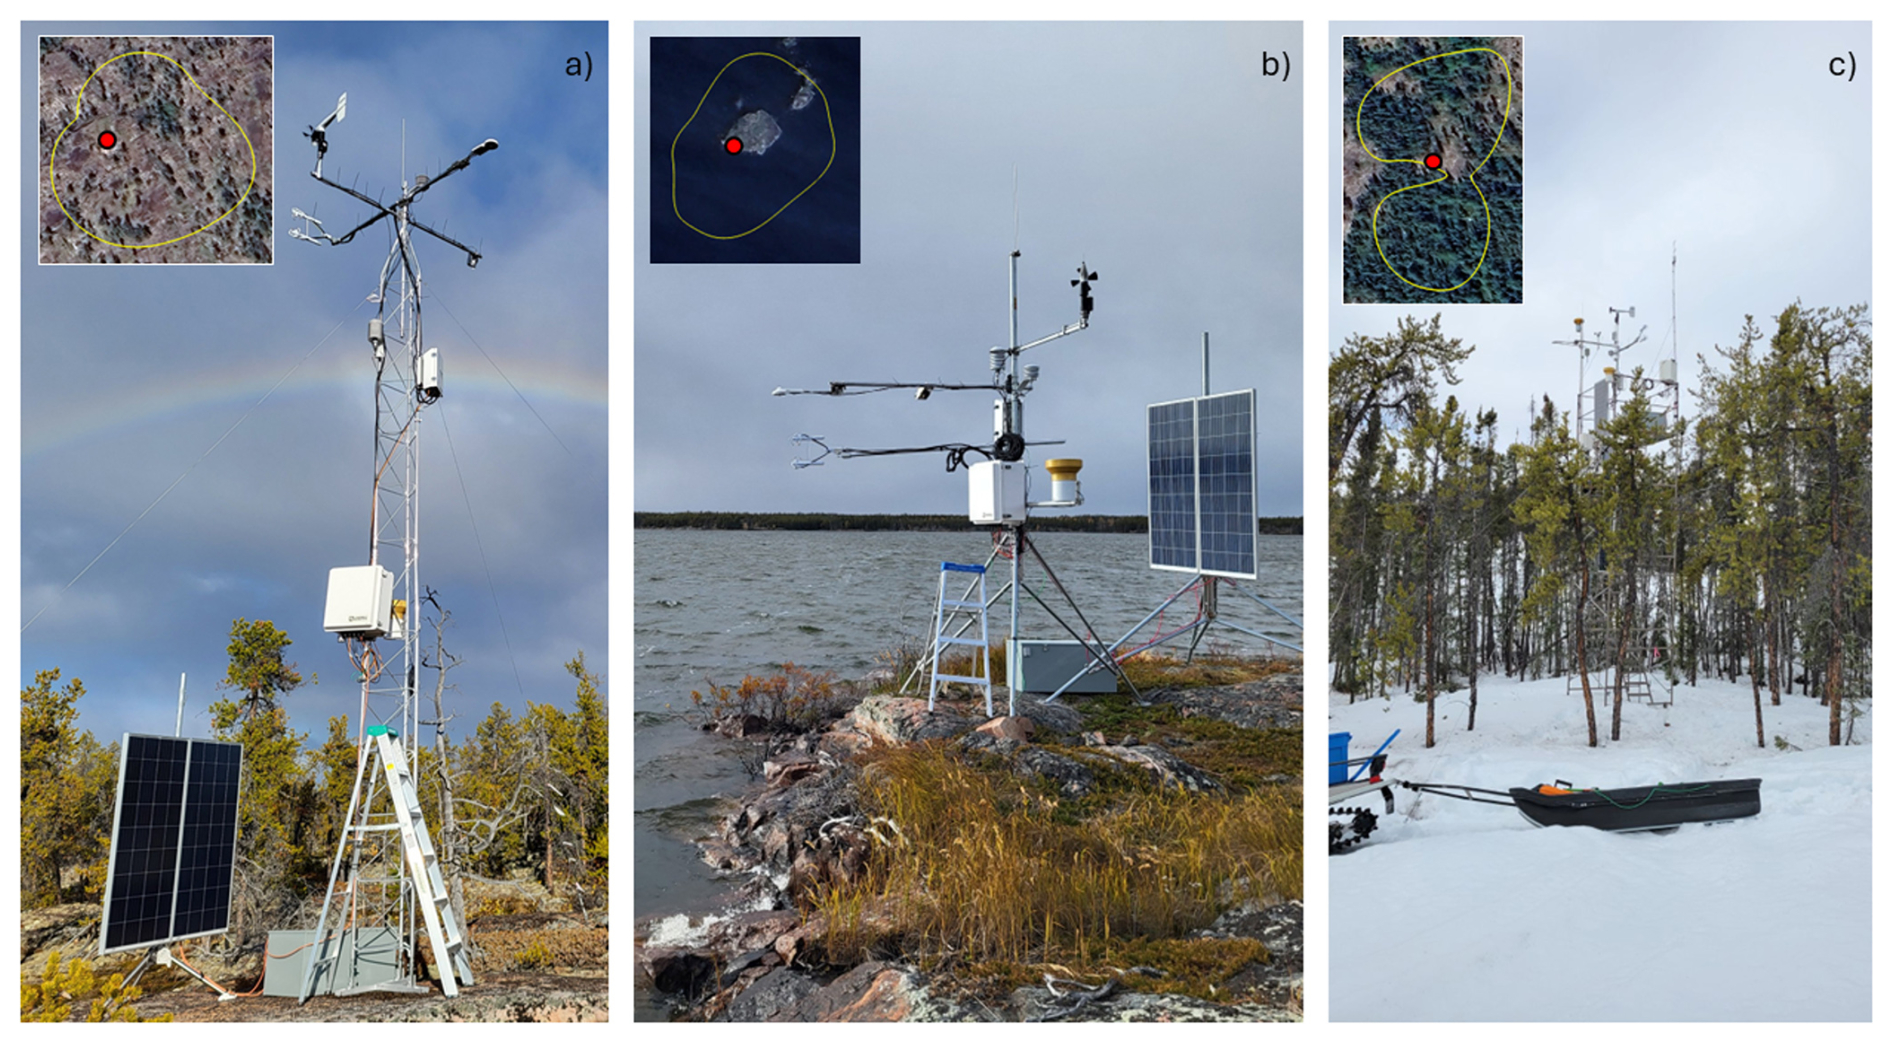
Figure 2Climate towers (a) on the bedrock ridge; (b) at Landing Lake and (c) the coniferous forested lower hillslope. Inserts illustrate tower footprints within which 90 % of the measurement tends to occur. Authors are the creators/copyright holders of the oblique photos. Satellite imagery: © 2026 Airbus, Map data: © 2026 Google Earth.
There is strong seasonality in the energy budget at this latitude. Net radiation remains negative from late October to early April. The spring increase in net radiation is delayed over lakes until the ice cover disappears in May or June. There are notable differences in energy budgets among the three landscape units (Fig. 3). Bowen ratios at the terrestrial towers are consistently above one and growing season averages often exceed 2.5 (Table 3), which has been observed elsewhere in Canada's subarctic (Eaton et al., 2001). There is higher growing season net radiation over the forest because of lower albedos, especially in the late spring and early summer, enhancing turbulent fluxes relative to the bedrock. Bowen ratios would be expected to be higher and the portion of net radiation as latent heat lower on the drier upper bedrock ridges, but conditions have been dry since eddy covariance systems were installed in the forest (described in the section on precipitation and snow), so the division of net radiation is more similar between the forest and bedock than documented during wetter periods (Spence et al., 2024). The lake energy budget differs substantially from terrestrial sites with Bowen ratios less than unity and sustained turbulent fluxes later into the year as Landing Lake remains open into late October and November, well after senescence (Fig. 3; Table 3). The high fraction of lakes increases watershed scale evapotranspiration 26 % above what it would be if they were absent, a reasonable estimate in comparison to data reported for the region by Rouse et al. (2005).
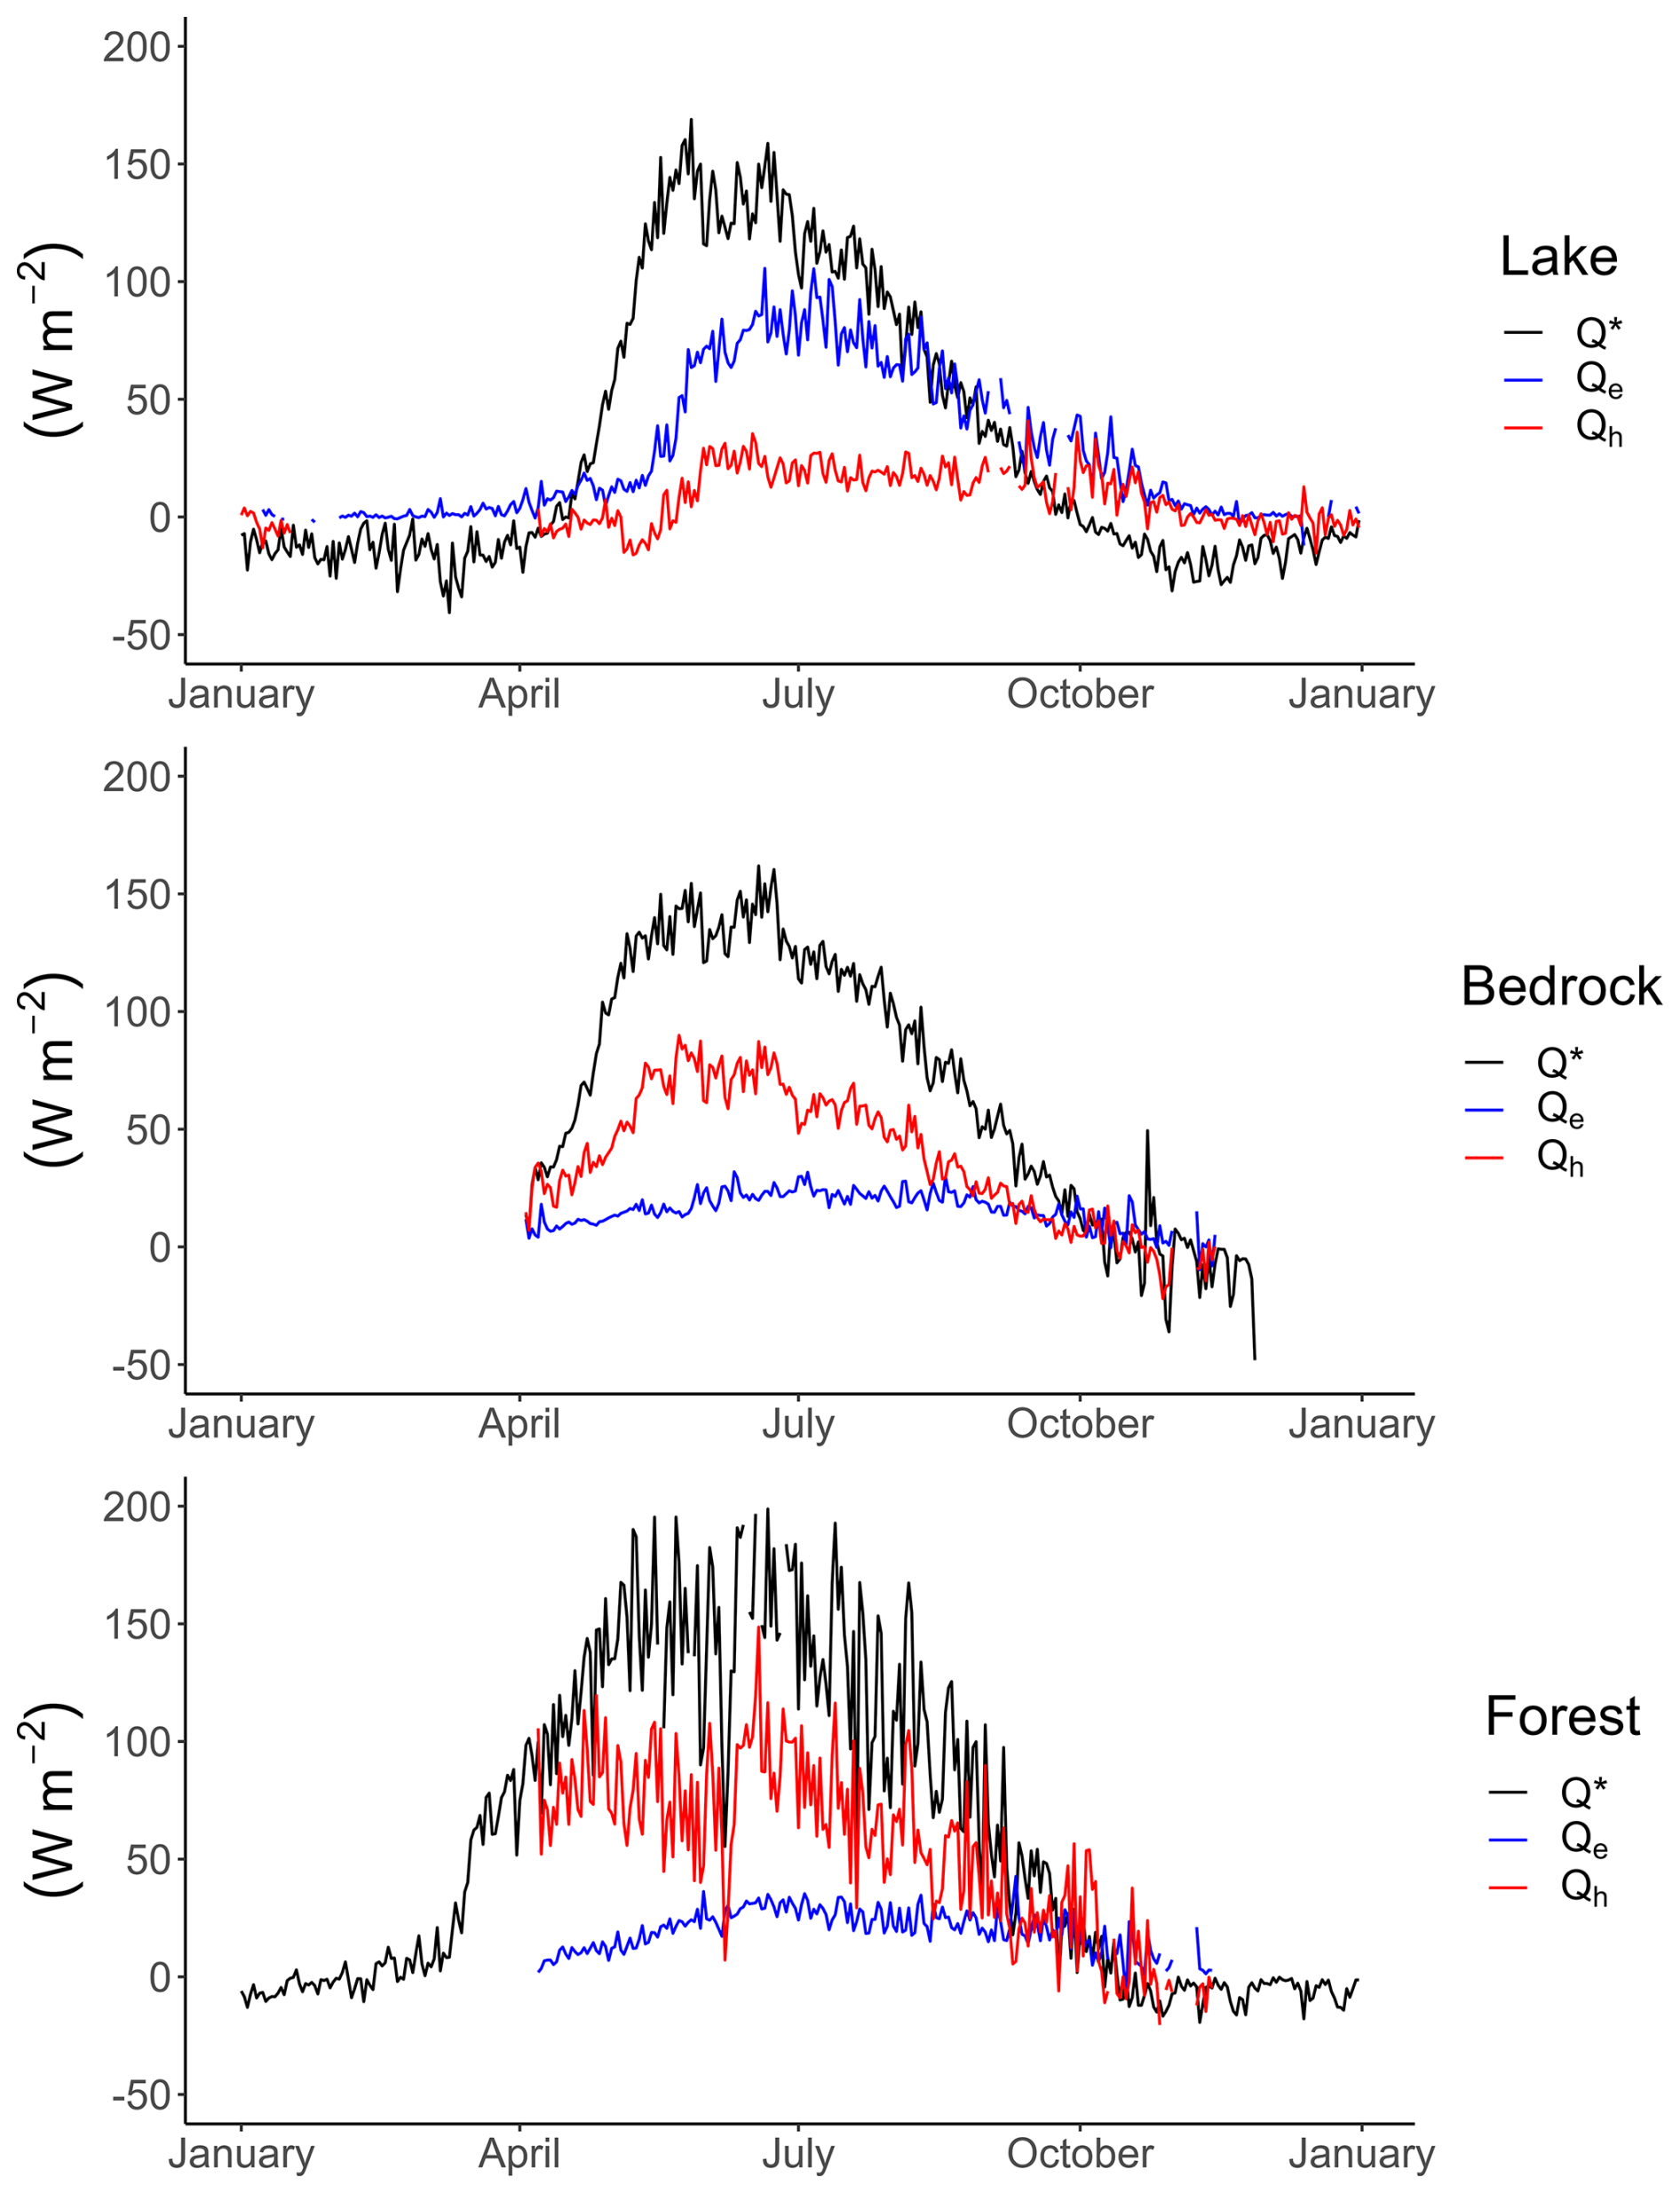
Figure 3Average daily net radiation (Q*), sensible heat (Qh) and latent heat (Qe) measured at each of the three major climate towers. The shorter time series available at the forest is reflected in the higher daily variability.
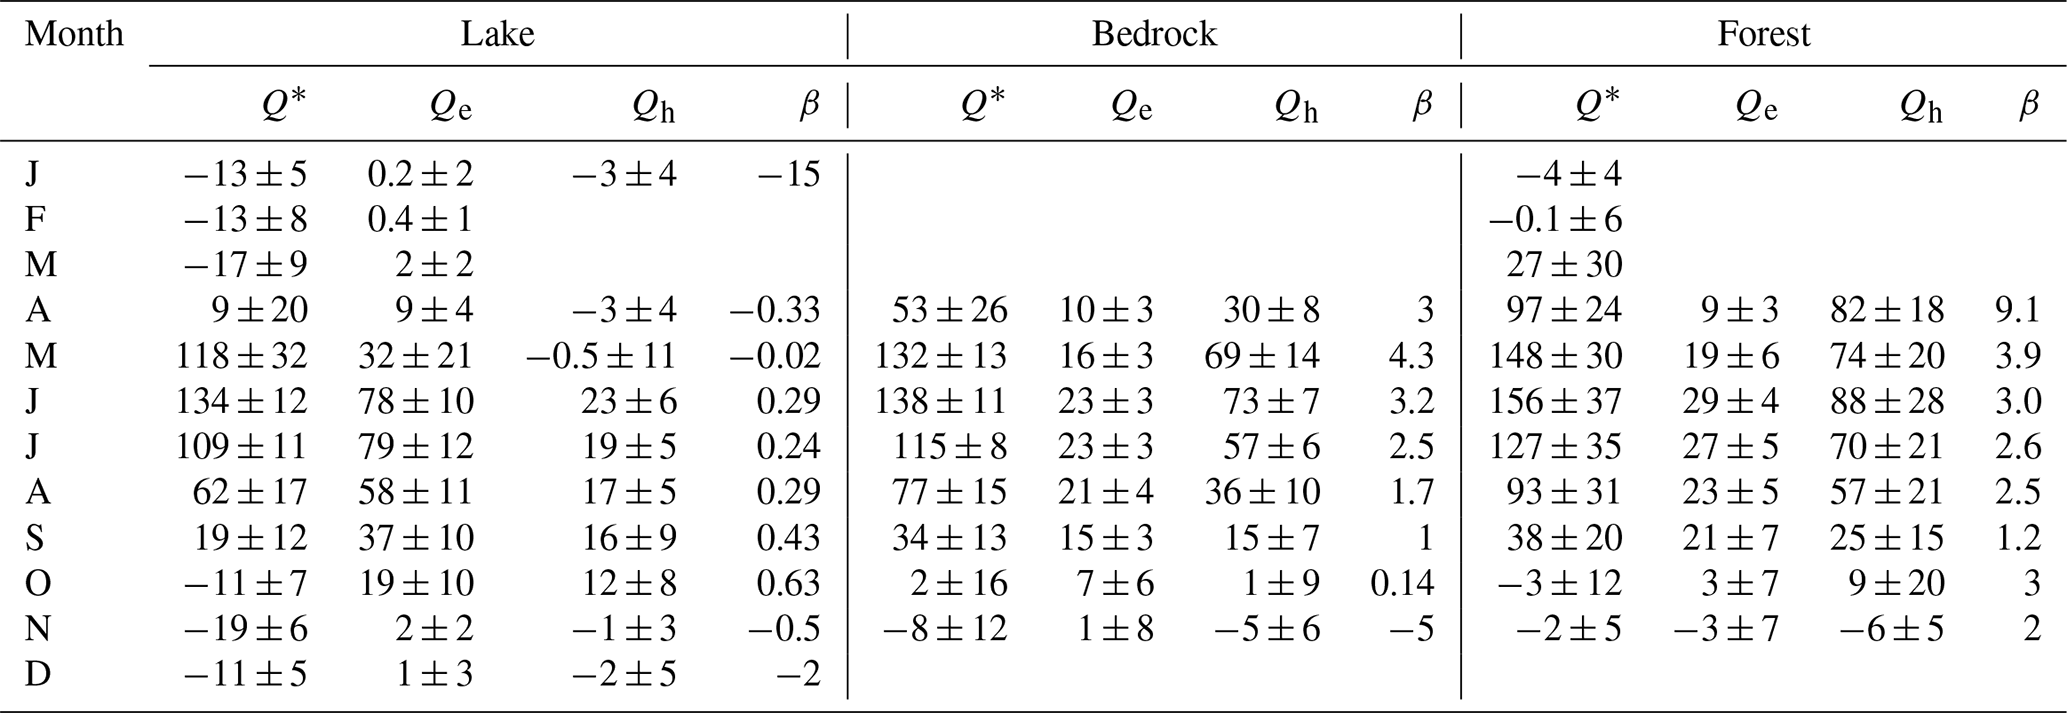
Table 3Monthly average net radiation, latent and sensible heat fluxes including one standard deviation and Bowen ratios (β) measured at the three active climate stations. All units are in W m−2.
The temperature record from Baker Creek and the longer term nearby MSC station Yellowknife A have both documented clear warming trends (Fig. 4). A ∼ 0.5 °C per decade warming has been observed in average annual temperatures at Yellowknife since the turn of the century, with the trend extending to the beginning of the record in the mid-20th century. The most intact air temperature record at Baker Creek is from mid-summer (1 July to 15 August). The shorter record from the bedrock tower implies faster recent summer temperature warming but this is tempered when compared to the longer record measured at Yellowknife A. It is this warming that has created the conditions necessary for the change in streamflow regime documented by Spence et al. (2025) with data described below.
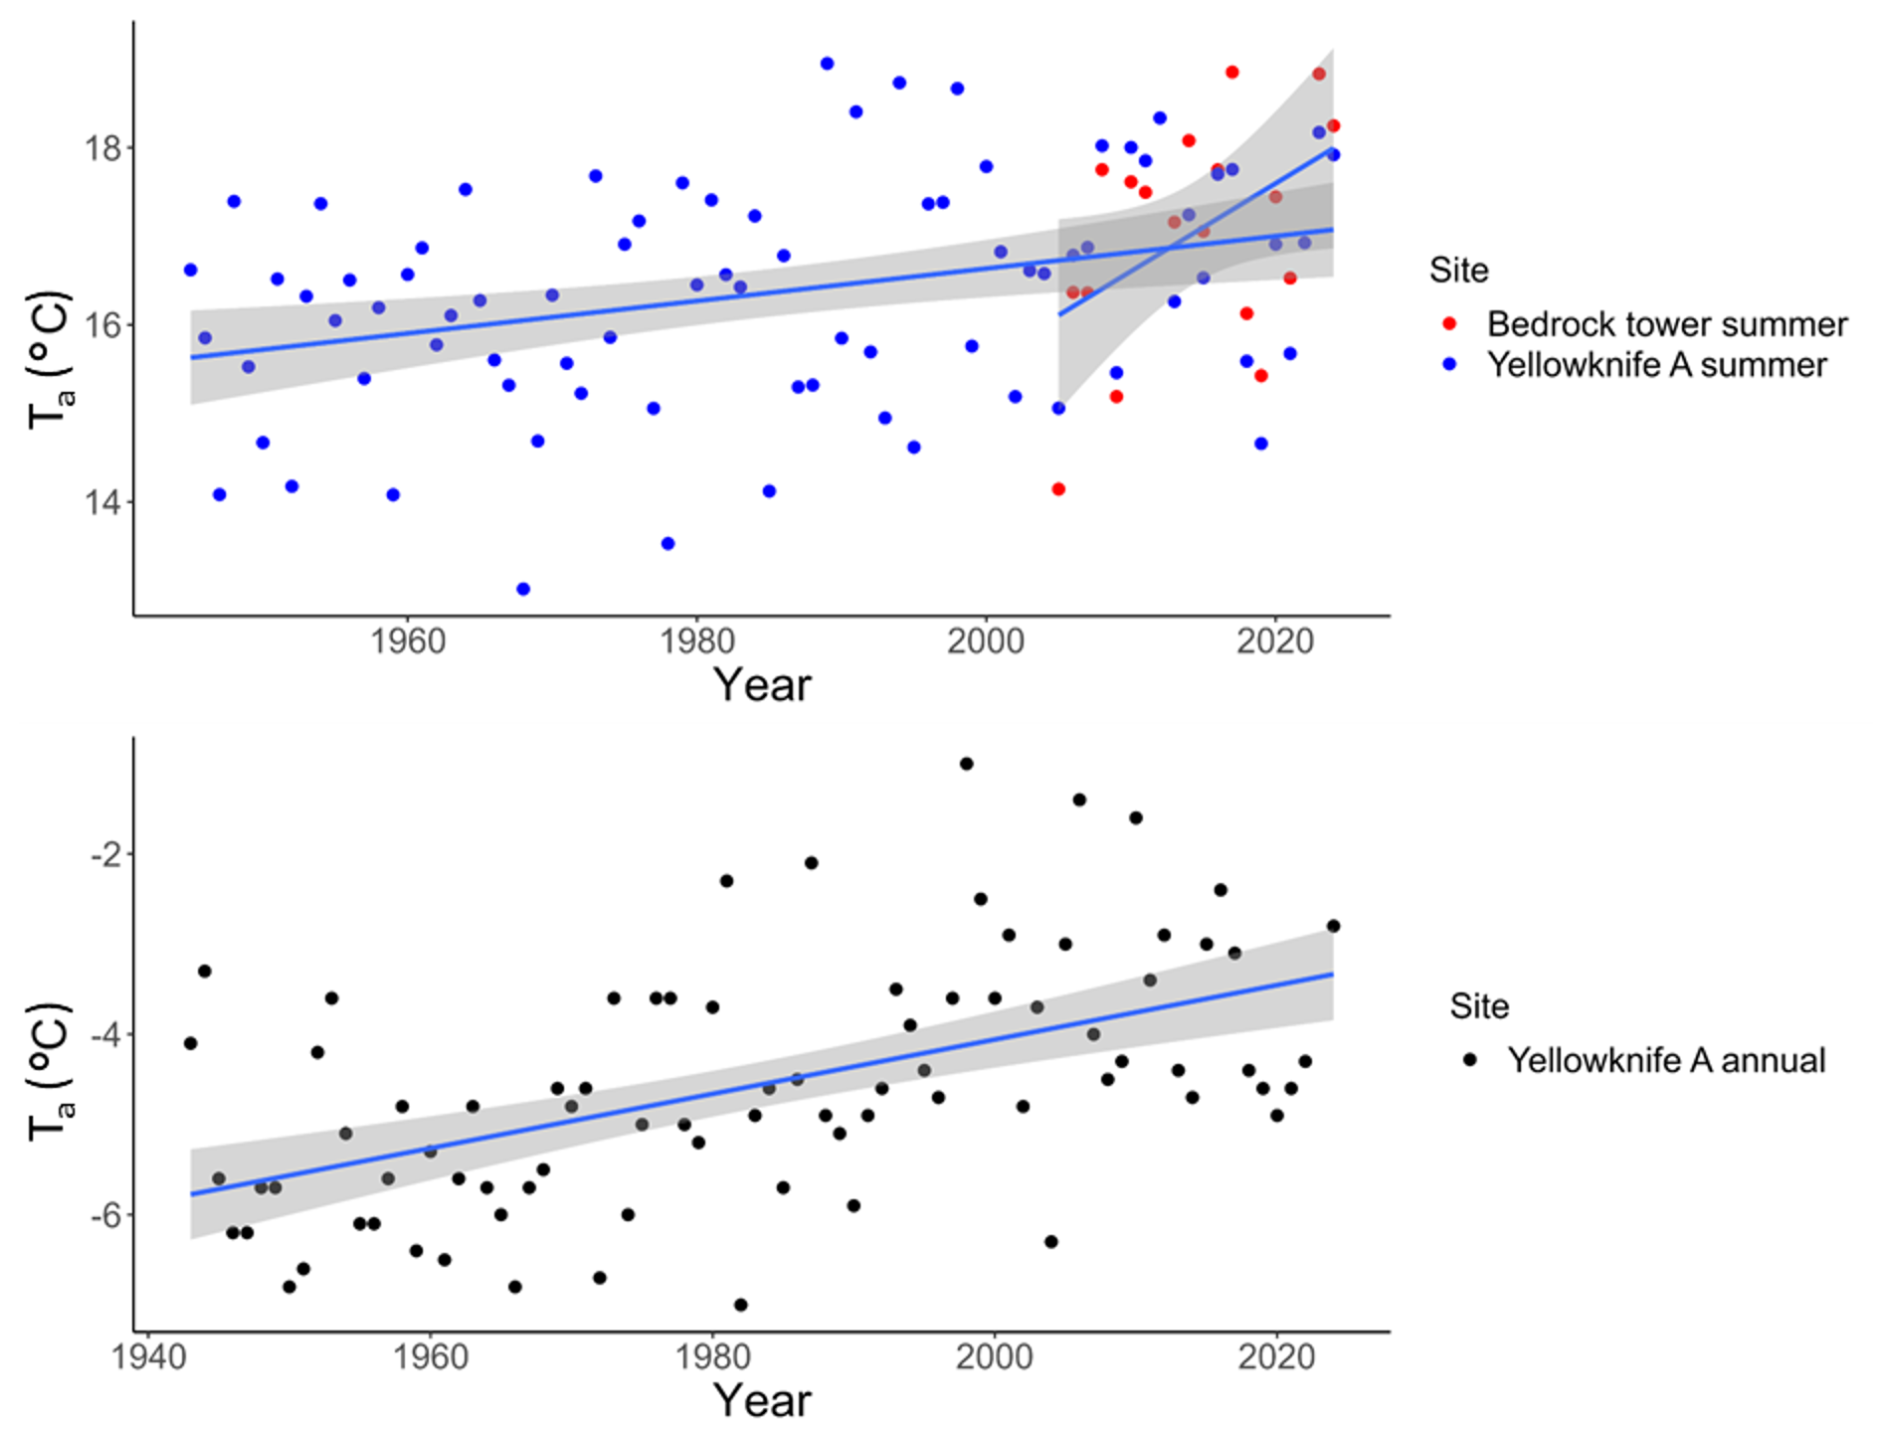
Figure 4Annual air temperatures (Ta) from 1943 to 2024 at the Meteorological Service of Canada station Yellowknife A (lower panel), and summer air temperatures (upper panel) also measured Yellowknife A and at the bedrock ridge climate towers from 2003 to 2025. Lines of best fit are included with the shaded area denoting the 90 % confidence bounds.
There are a variety of precipitation sensors deployed through the watershed. As noted above, TE525M tipping buckets are located at each of the main climate towers. Additional tipping buckets are co-located with the Duckfish and Landing Lake hydrometric gauges described below (Table 1). To improve measurement of solid precipitation a one-wire Geonor T-200B series all weather precipitation gauge with an Alter shield was added to the CR1000 data logger at the Vital Lake hydrometric gauge in October 2014. Post-processing of the raw data from the sensor includes filtering for negative values, removal of trace events below 0.2 mm and adjustments for wind-induced undercatch (Kochendorfer et al., 2017). A Campbell Scientific SR50 snow depth sensor was installed at the forest tower in October of 2014. Finally, in October 2022 a Sommer SSG snow scale was added to the watershed instrumentation suite. The snow scale sensor provides a single channel analog signal to a Campbell Scientific CR1000 data logger; logging averages half hourly. The released dataset is the half hourly data aggregated daily (Fig. 5).
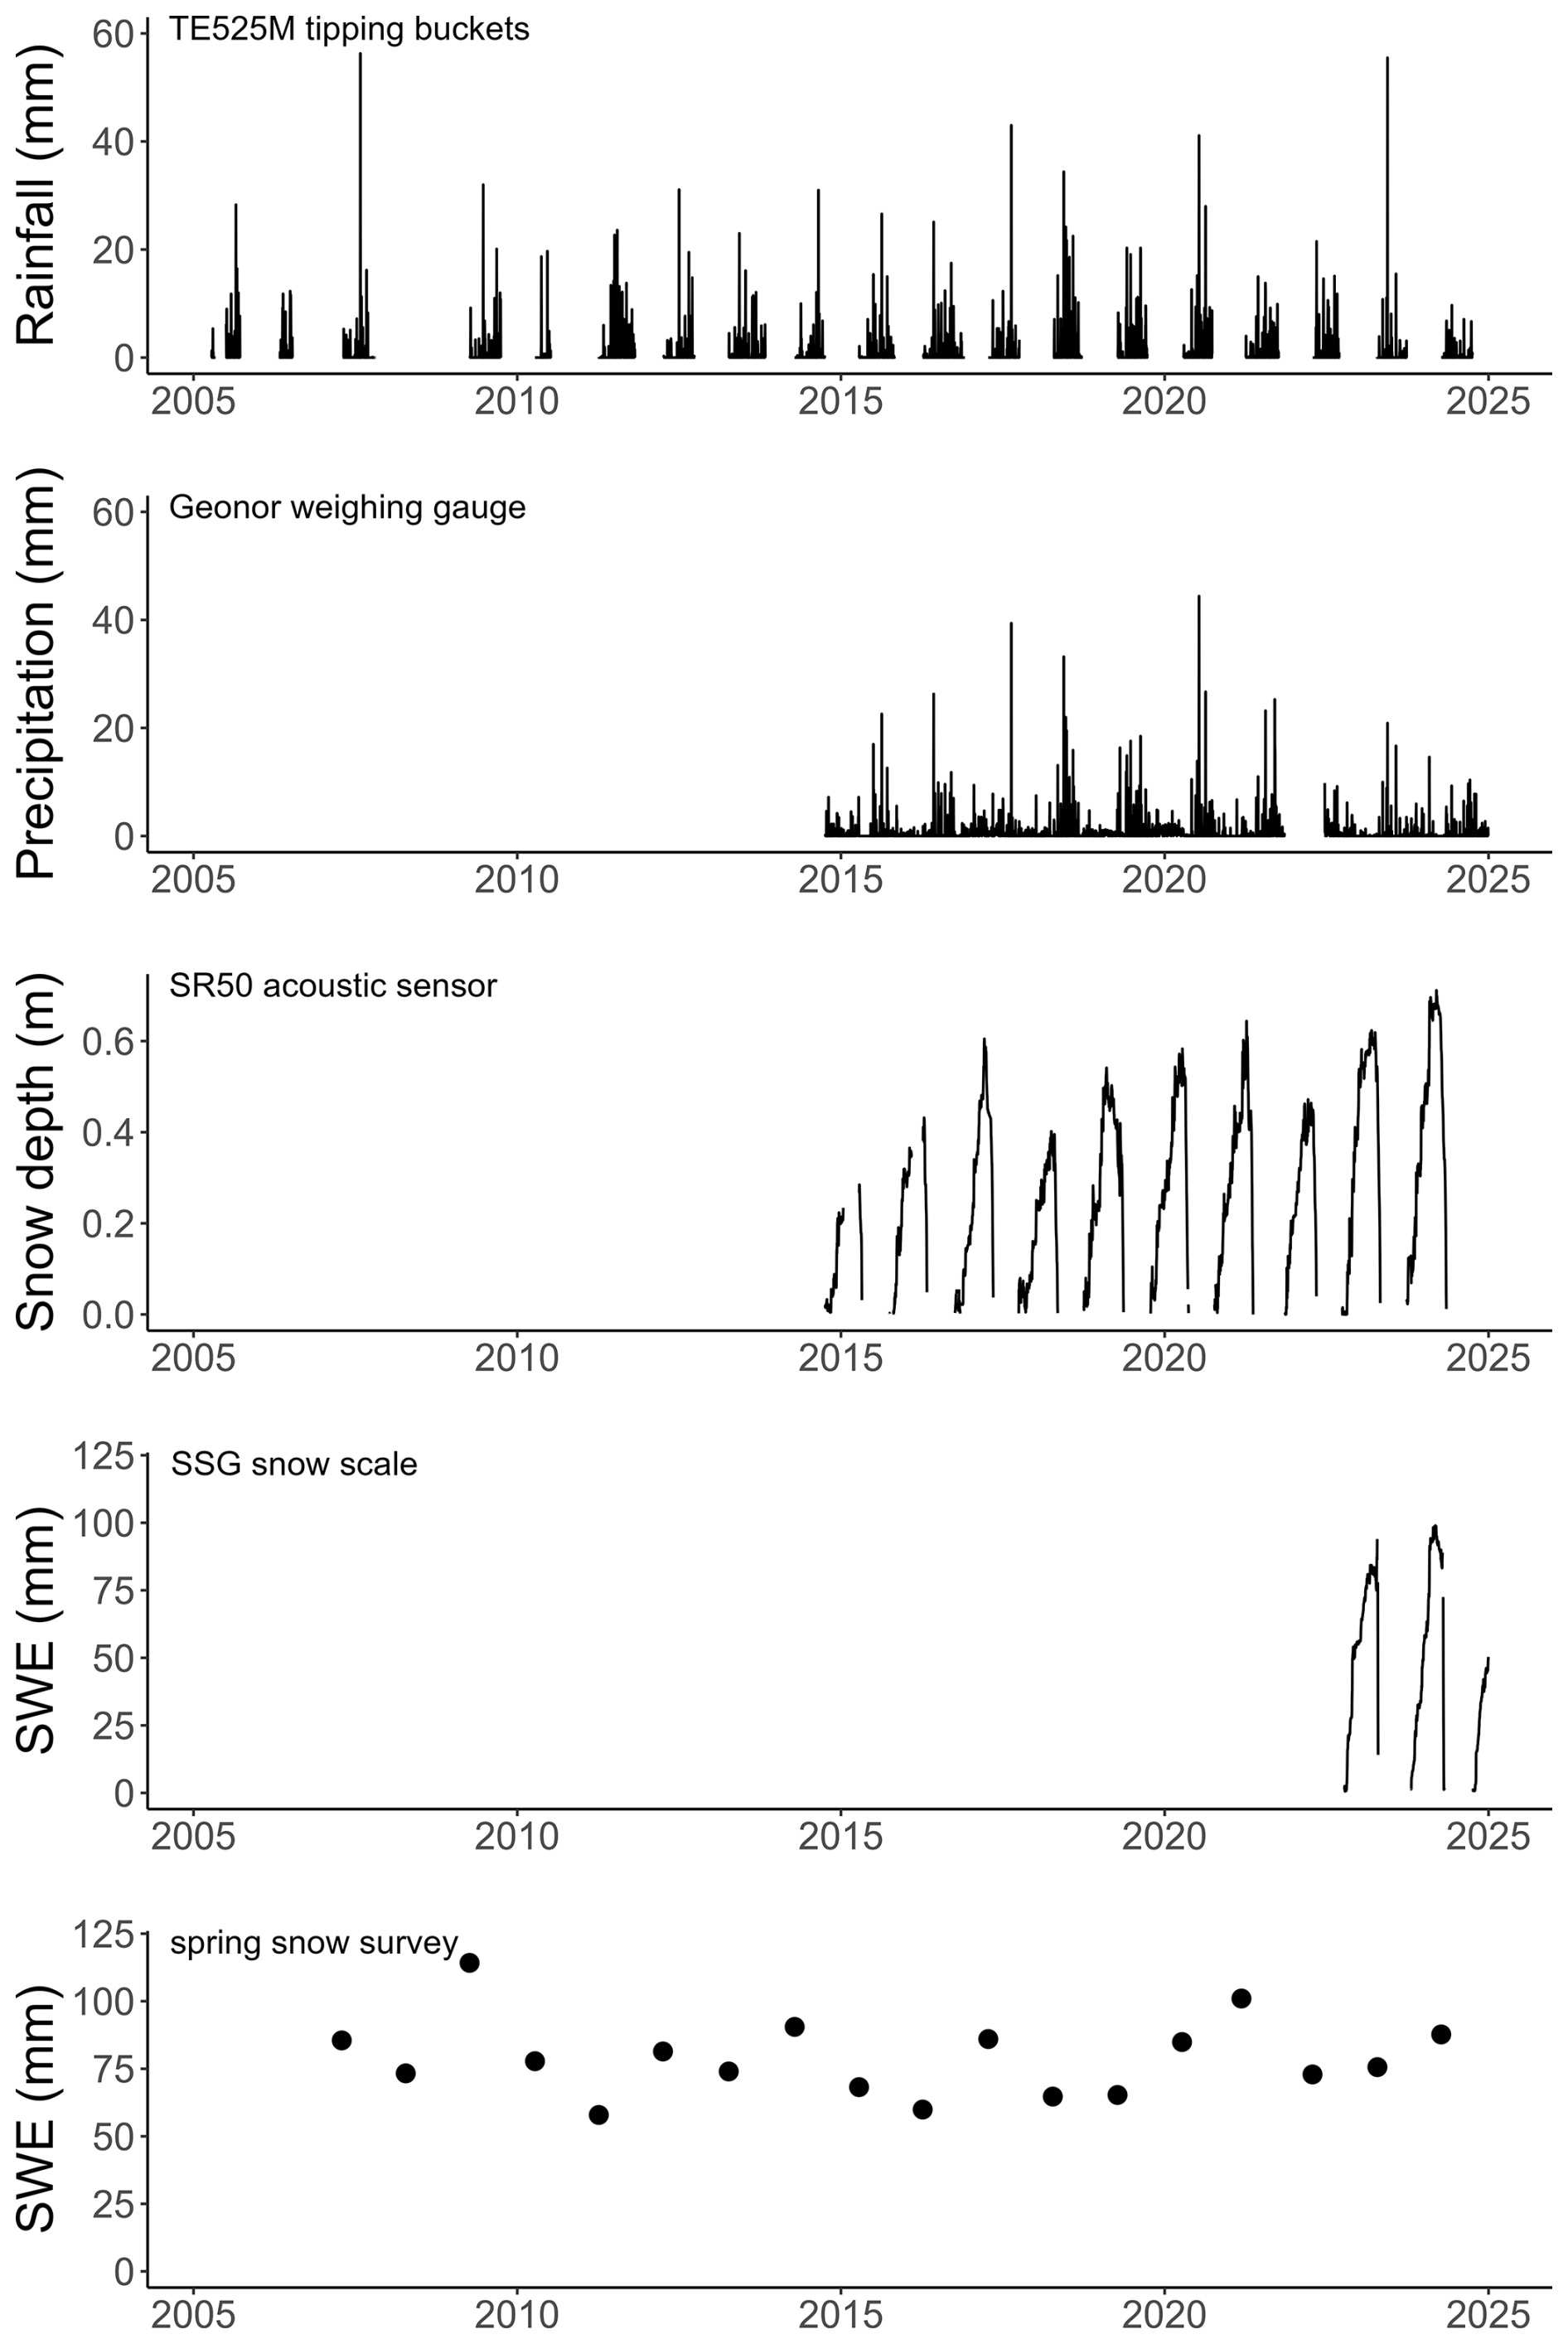
Figure 5Precipitation time series from April 2005 to December 2024 from (top to bottom); maximum daily rainfall from the tipping buckets, daily precipitation from the Geonor weighing gauge, snow depth measured at the forested hillslope tower, snow water equivalent measured at the snow scale, and watershed average snow water equivalent measured using the annual snow survey. Gaps in rainfall, precipitation, snow depth and snow water equivalent time series because of sensor inoperability or inactivation are evident from breaks in the time series.
Each spring (except 2006) a land cover stratified spring maximum snow survey has been conducted (Fig. 5; Table 1). Within each of the five land cover types, there is at least one 25-point snow course. Depth is recorded using a 1 cm graduated aluminum rod at each point, which are at least 10 m apart. At each fifth depth measurement a sample is taken using an ESC-30 snow corer and weighed. Snow depth (m) and density (kg m−3) are averaged and used to estimate snow water equivalent (mm) at each course for each land cover type. The watershed wide average is calculated by pro-rating these estimates by the land cover fraction in the watershed. Spring snowpacks are rarely over 60 cm deep, and do not exhibit covariance between depth and density (Pomeroy and Gray, 1995).
Between 2025 and the earlier v.1 data release in 2018, annual precipitation ranged from a high of 322 mm in 2019 to a low 145 mm in 2023. The precipitation cycles are evident in both the rainfall and total precipitation records, with drought conditions from 2014–2015 and post-2020. Snowpacks do not exhibit the same cyclicity, so dry conditions are differentiated from wet by a lack of rain. The record captures the wettest June on record in Yellowknife when 115 mm fell; 40 % of the annual average precipitation in one month.
In data release v.1 (Spence and Hedstrom, 2018) soil moisture and temperature was reported from a network of six EM50 ECH20 data loggers with Decagon 5TM capacitance soil moisture and temperature sensors at the ground surface (i.e. 1 cm depth) and 25 cm depth installed among landscape types. These systems proved to be difficult to maintain. In October 2014 a soil moisture/temperature array was installed at a representative coniferous forest hillslope within the footprint of the forest climate tower. This nest includes seven profiles within a 100 m2 rectangular area with measurements at the surface and at 15, 30 and 45 cm depth using Stevens Hydraprobes wired to a CR1000 data logger. Soil moisture values are calibrated using site and soil depth specific correction curves. While data are logged every 10 min, data reported in this release are dailys.
These data from the soil array provide new information on the soil climate (Fig. 6). Soil thaw begins the second half of April (day 105). Surface temperatures approach 13 °C by the end of June (day 180). The soil column is warmest around the end of August (day 240). Surface soils freeze by the end of October, but soils at depth require at least another month to freeze. The average conditions illustrated in Fig. 6 smooth out annual peaks from snowmelt inputs to the soil column, which tend to increase soil moisture in mid to late April. This moist layer is kept closer to the surface by the frost table and drier conditions at depth early in the warm season reflect frozen conditions. The surface remains dry, with water draining to depth as the frost table descends. Wetter conditions in the fall with lower evaporative demand permit rainfall to wet the soil. However, the near surface, on average, freezes with very little soil moisture.
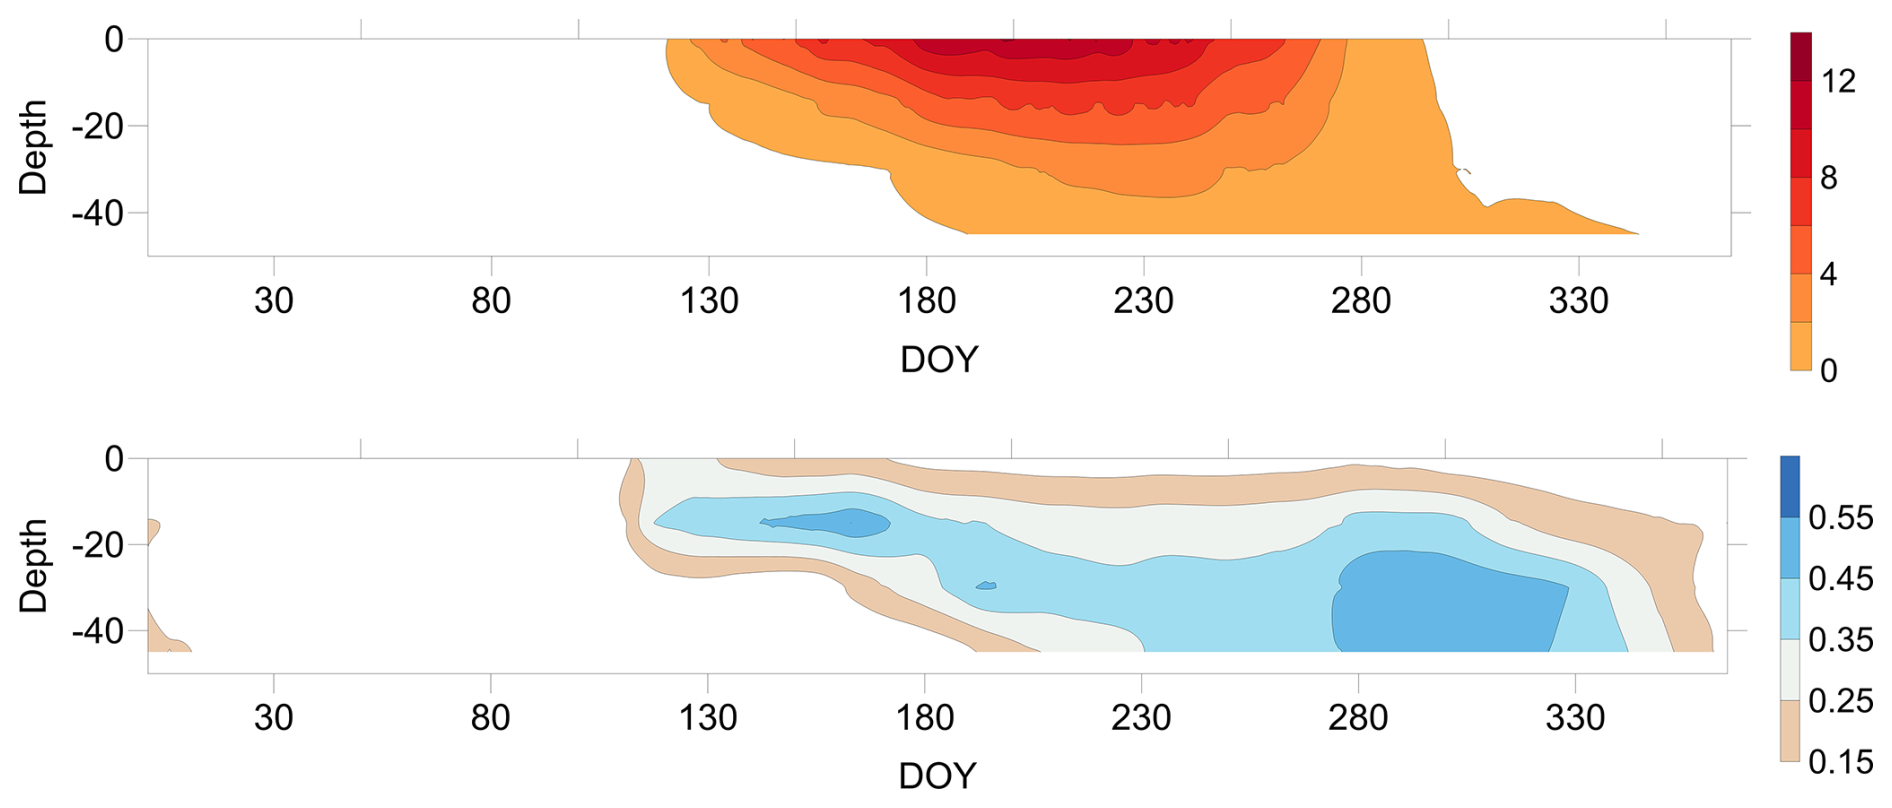
Figure 6Average daily soil temperature in °C (top) and volumetric liquid water fraction (bottom) measured at the hillslope soil array (2014 to 2025).
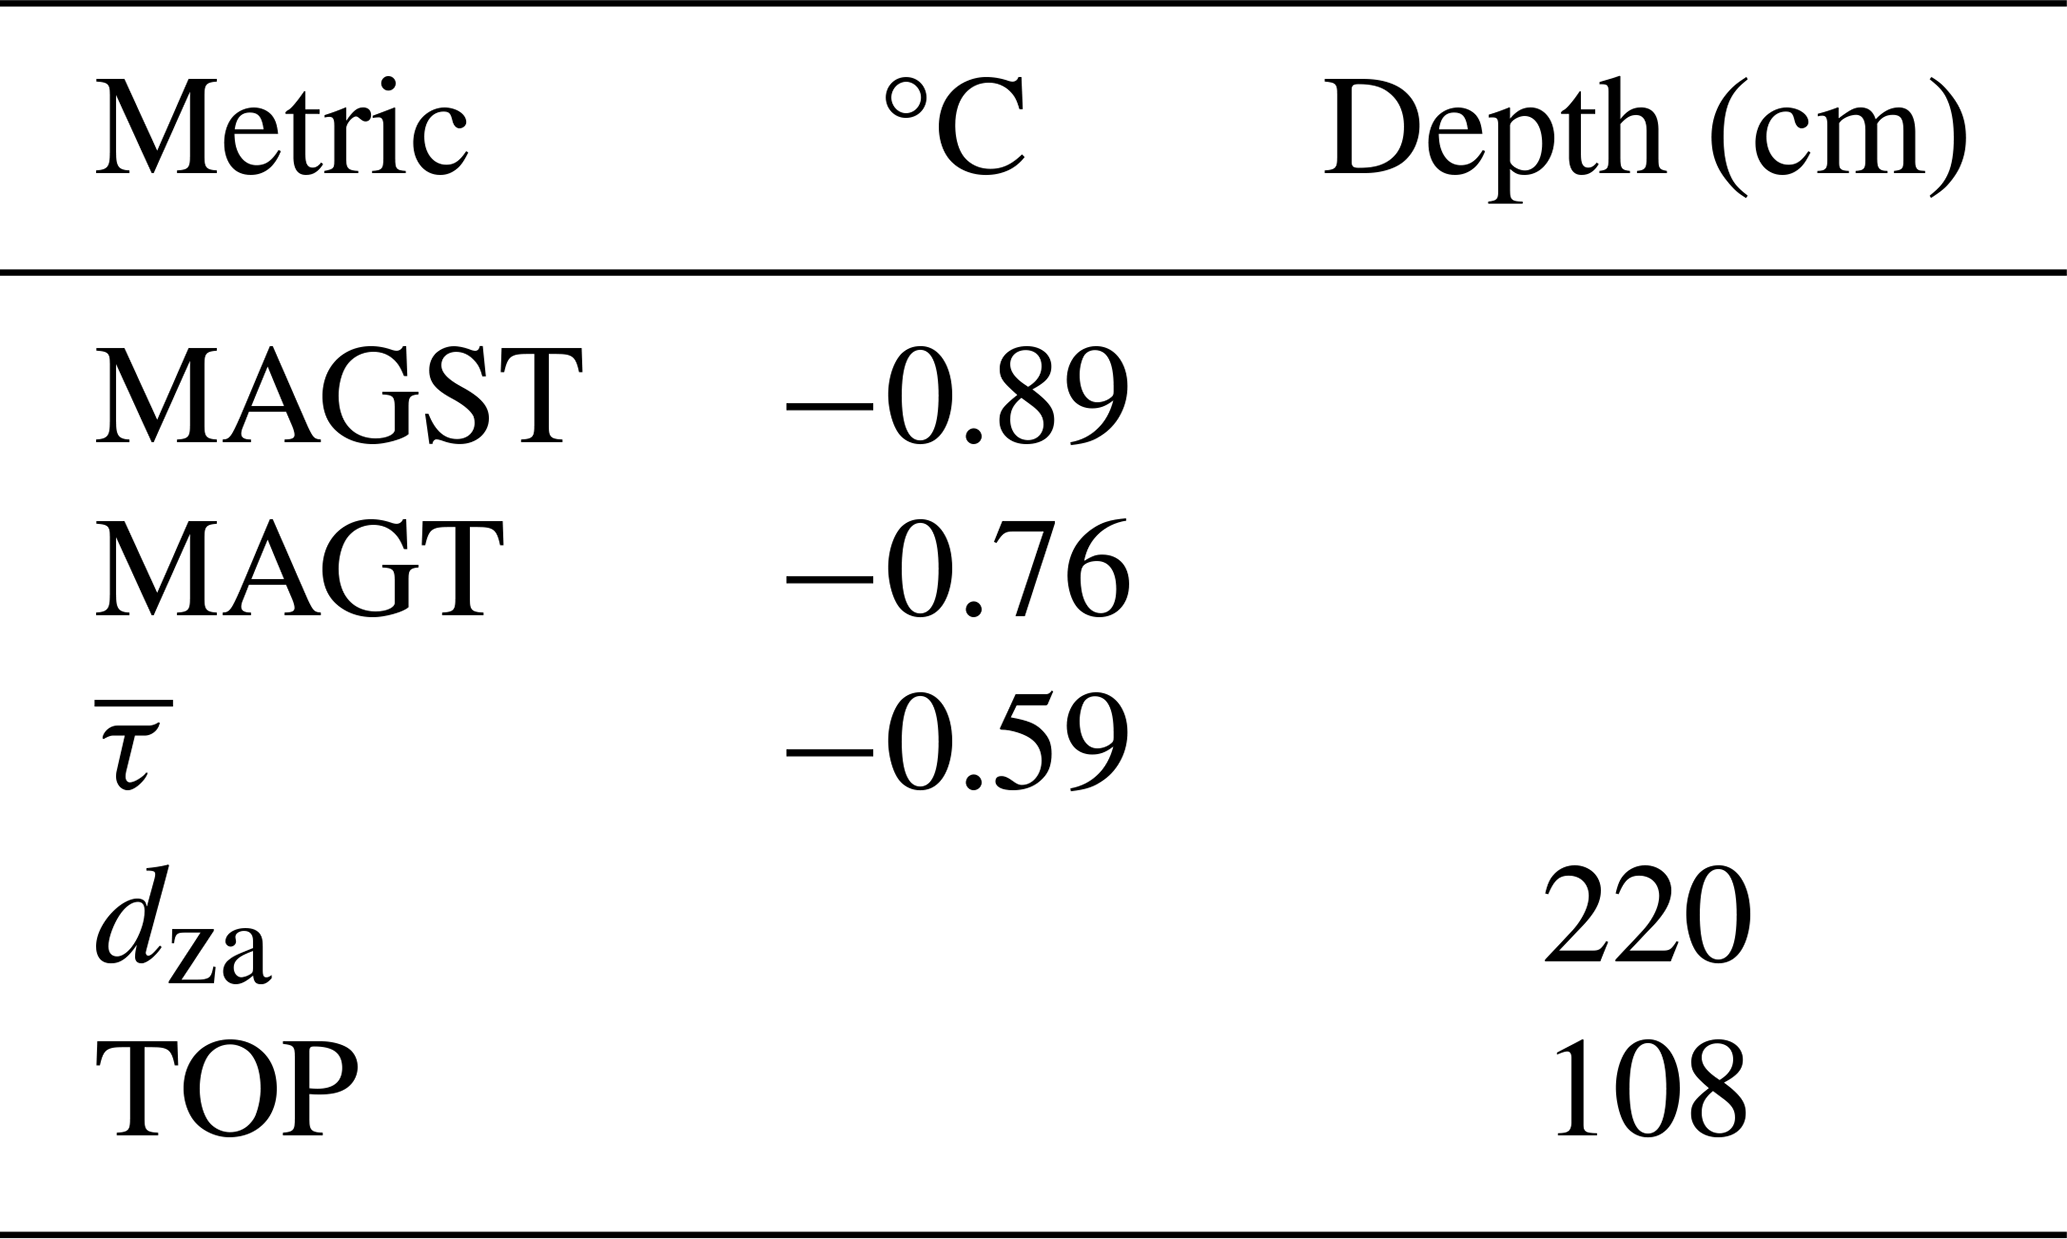
While the soil array provides some information on shallow soil conditions, it was unable to reliably capture active layer depth or other permafrost traits. To address a data gap of permafrost characteristics in the research watershed, a borehole was drilled in October 2024 using a Talon system to ∼ 3 m depth on the same hillslope ∼ 50 m from the soil array. An area with a more open canopy was selected to provide room for the drill operations. A casing capped at the bottom was inserted to a depth of 1.9 m before encountering resistance from material that had sloughed into the borehole. Campbell Scientific 107B thermistors were inserted at 0.25 m intervals from 1.9 to 0.5 m depth and 0.1 m intervals from 0.5 to 0.1 m depth. Silicon oil was used to backfill the inner casing. Sand was used to backfill the borehole outside the casing, with bentonite sealing the casing at the ground surface. Brown and Gruber (2026) have proposed a diversity of metrics with which to assess permafrost state. Table 4 lists these metrics from the initial year of data (Fig. 7) that suggest the mean annual ground temperature is −0.81 °C, the top of permafrost is near 108 cm and the depth of zero annual amplitude is near 230 cm. These values are within the range of those documented in the region by Karunaratne et al. (2008).
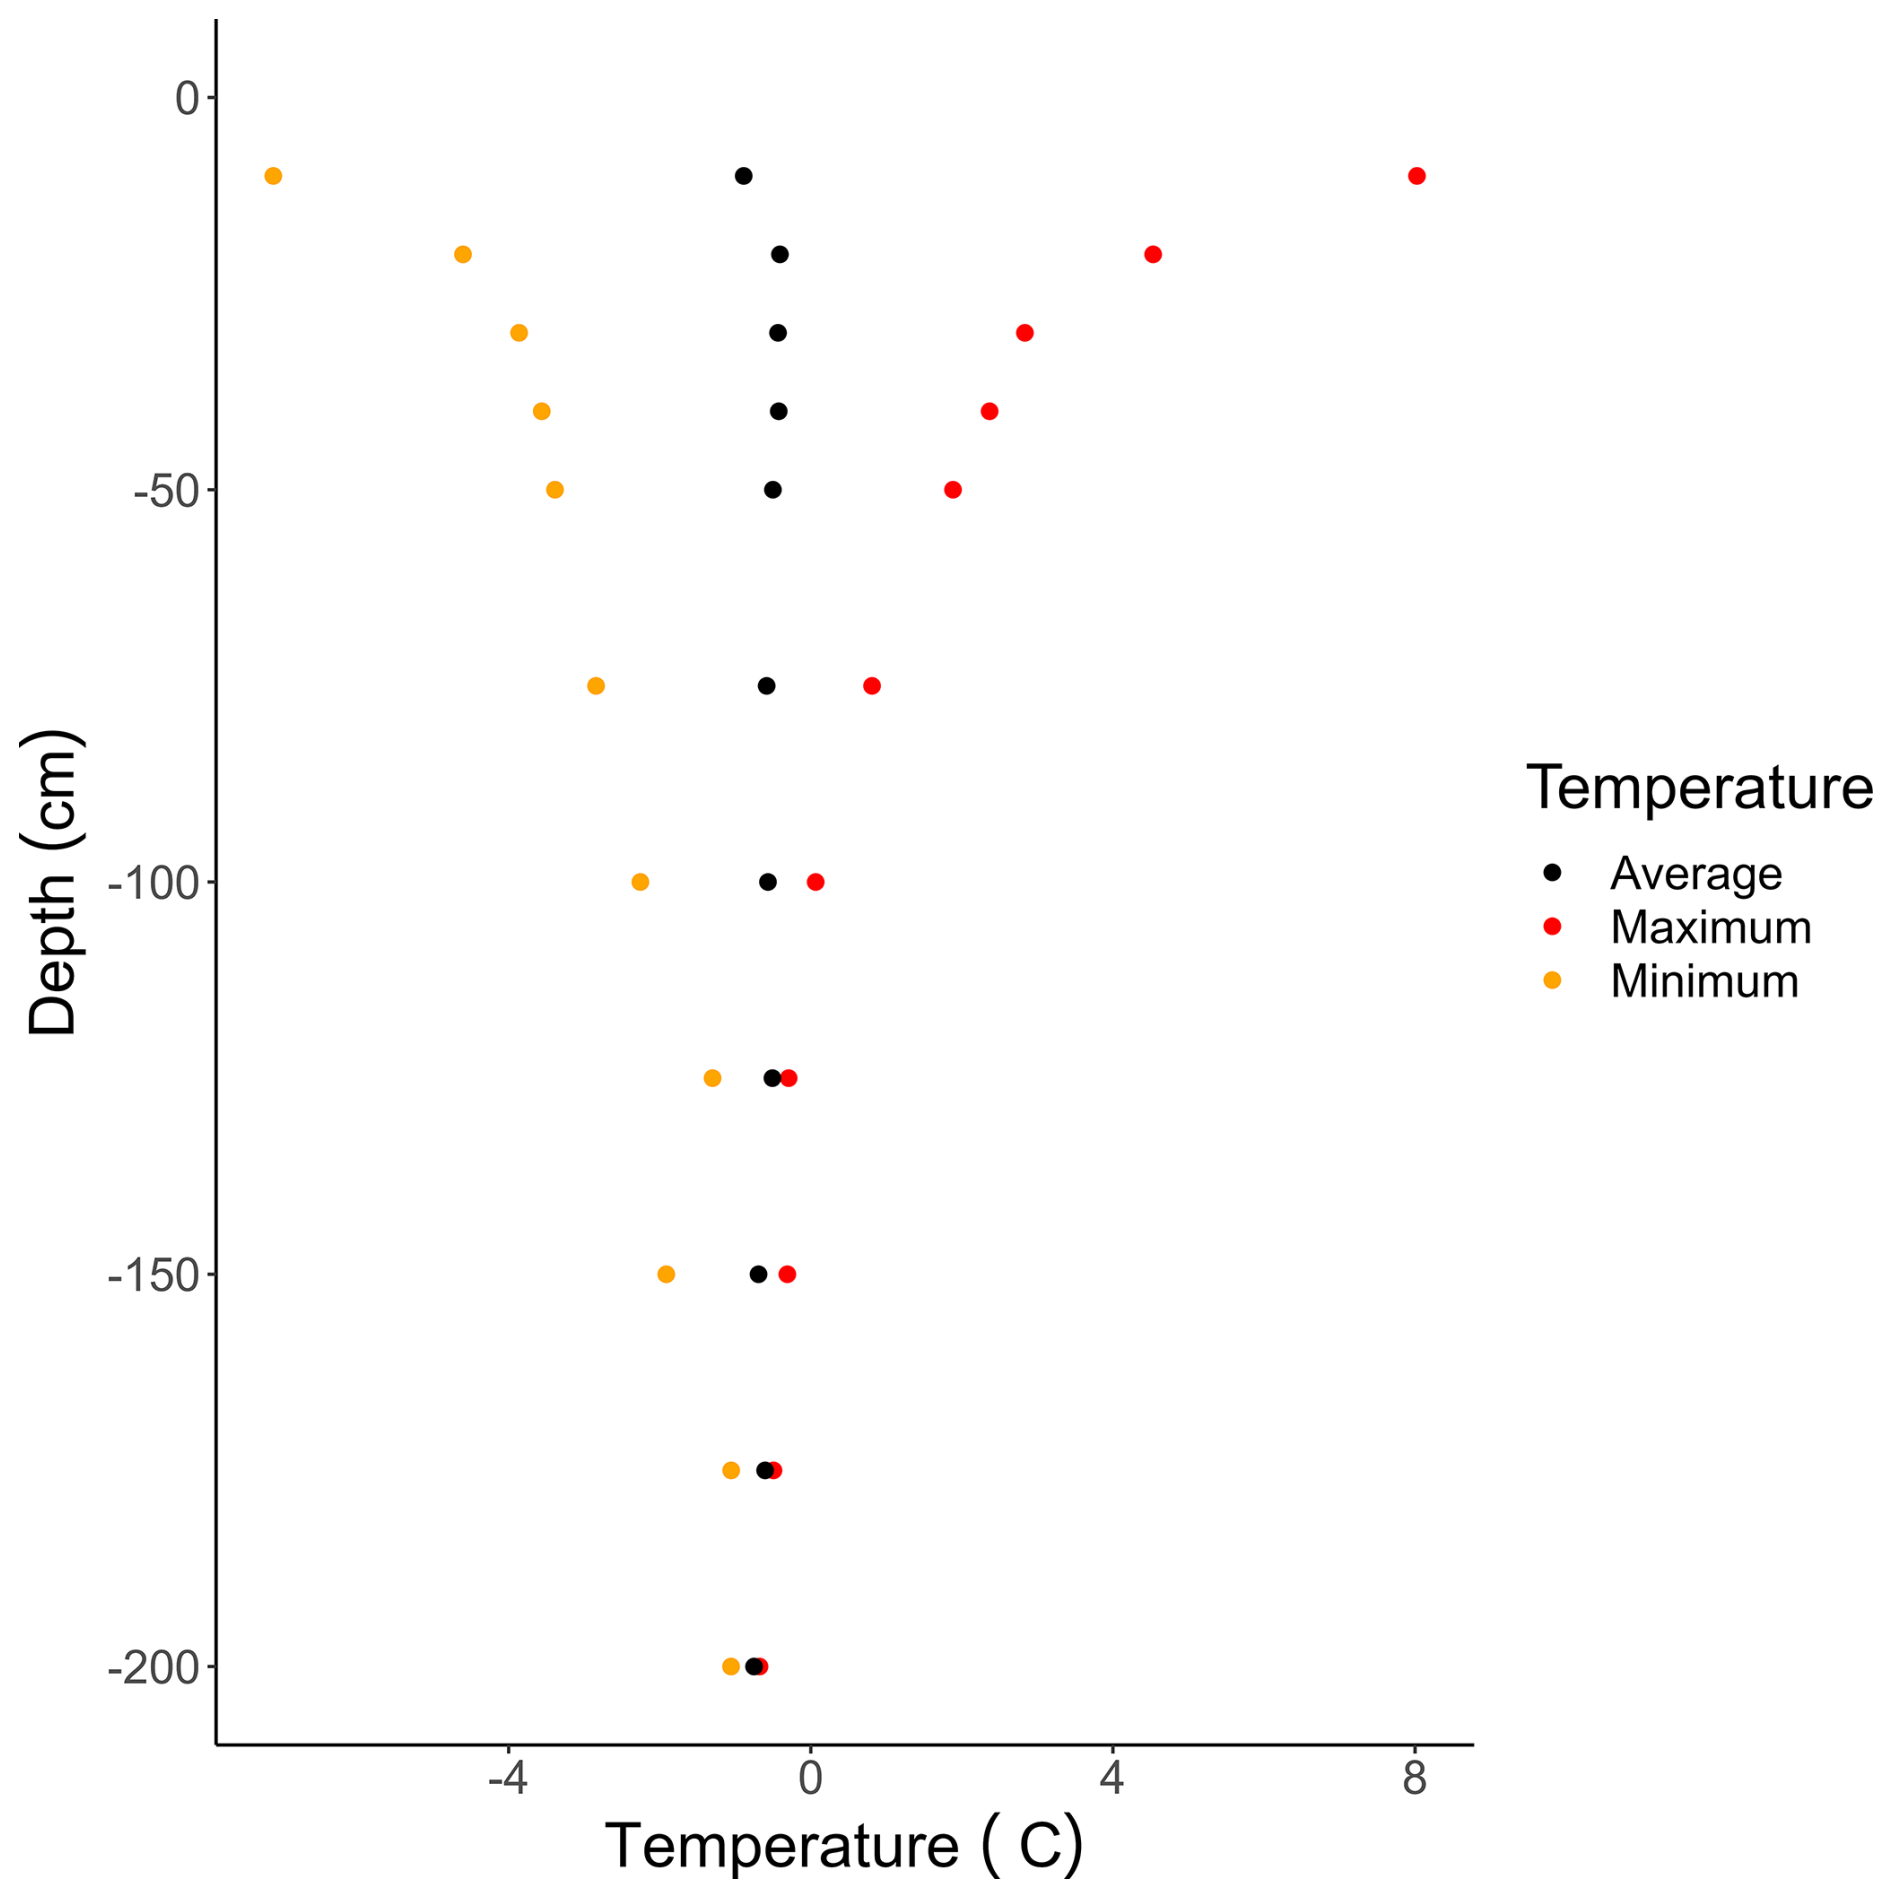
Figure 7Trumpet plot of ground temperatures measured at the hillslope borehole from October 2024 to October 2025.
Table 4Permafrost metrics for the period October 2024–October 2025 at the hillslope borehole. MAGST is mean annual ground surface temperature, MAGT is mean annual ground temperature, is the thermal integral, dza denotes the depth of zero annual amplitude in temperature and TOP is the top of permafrost.
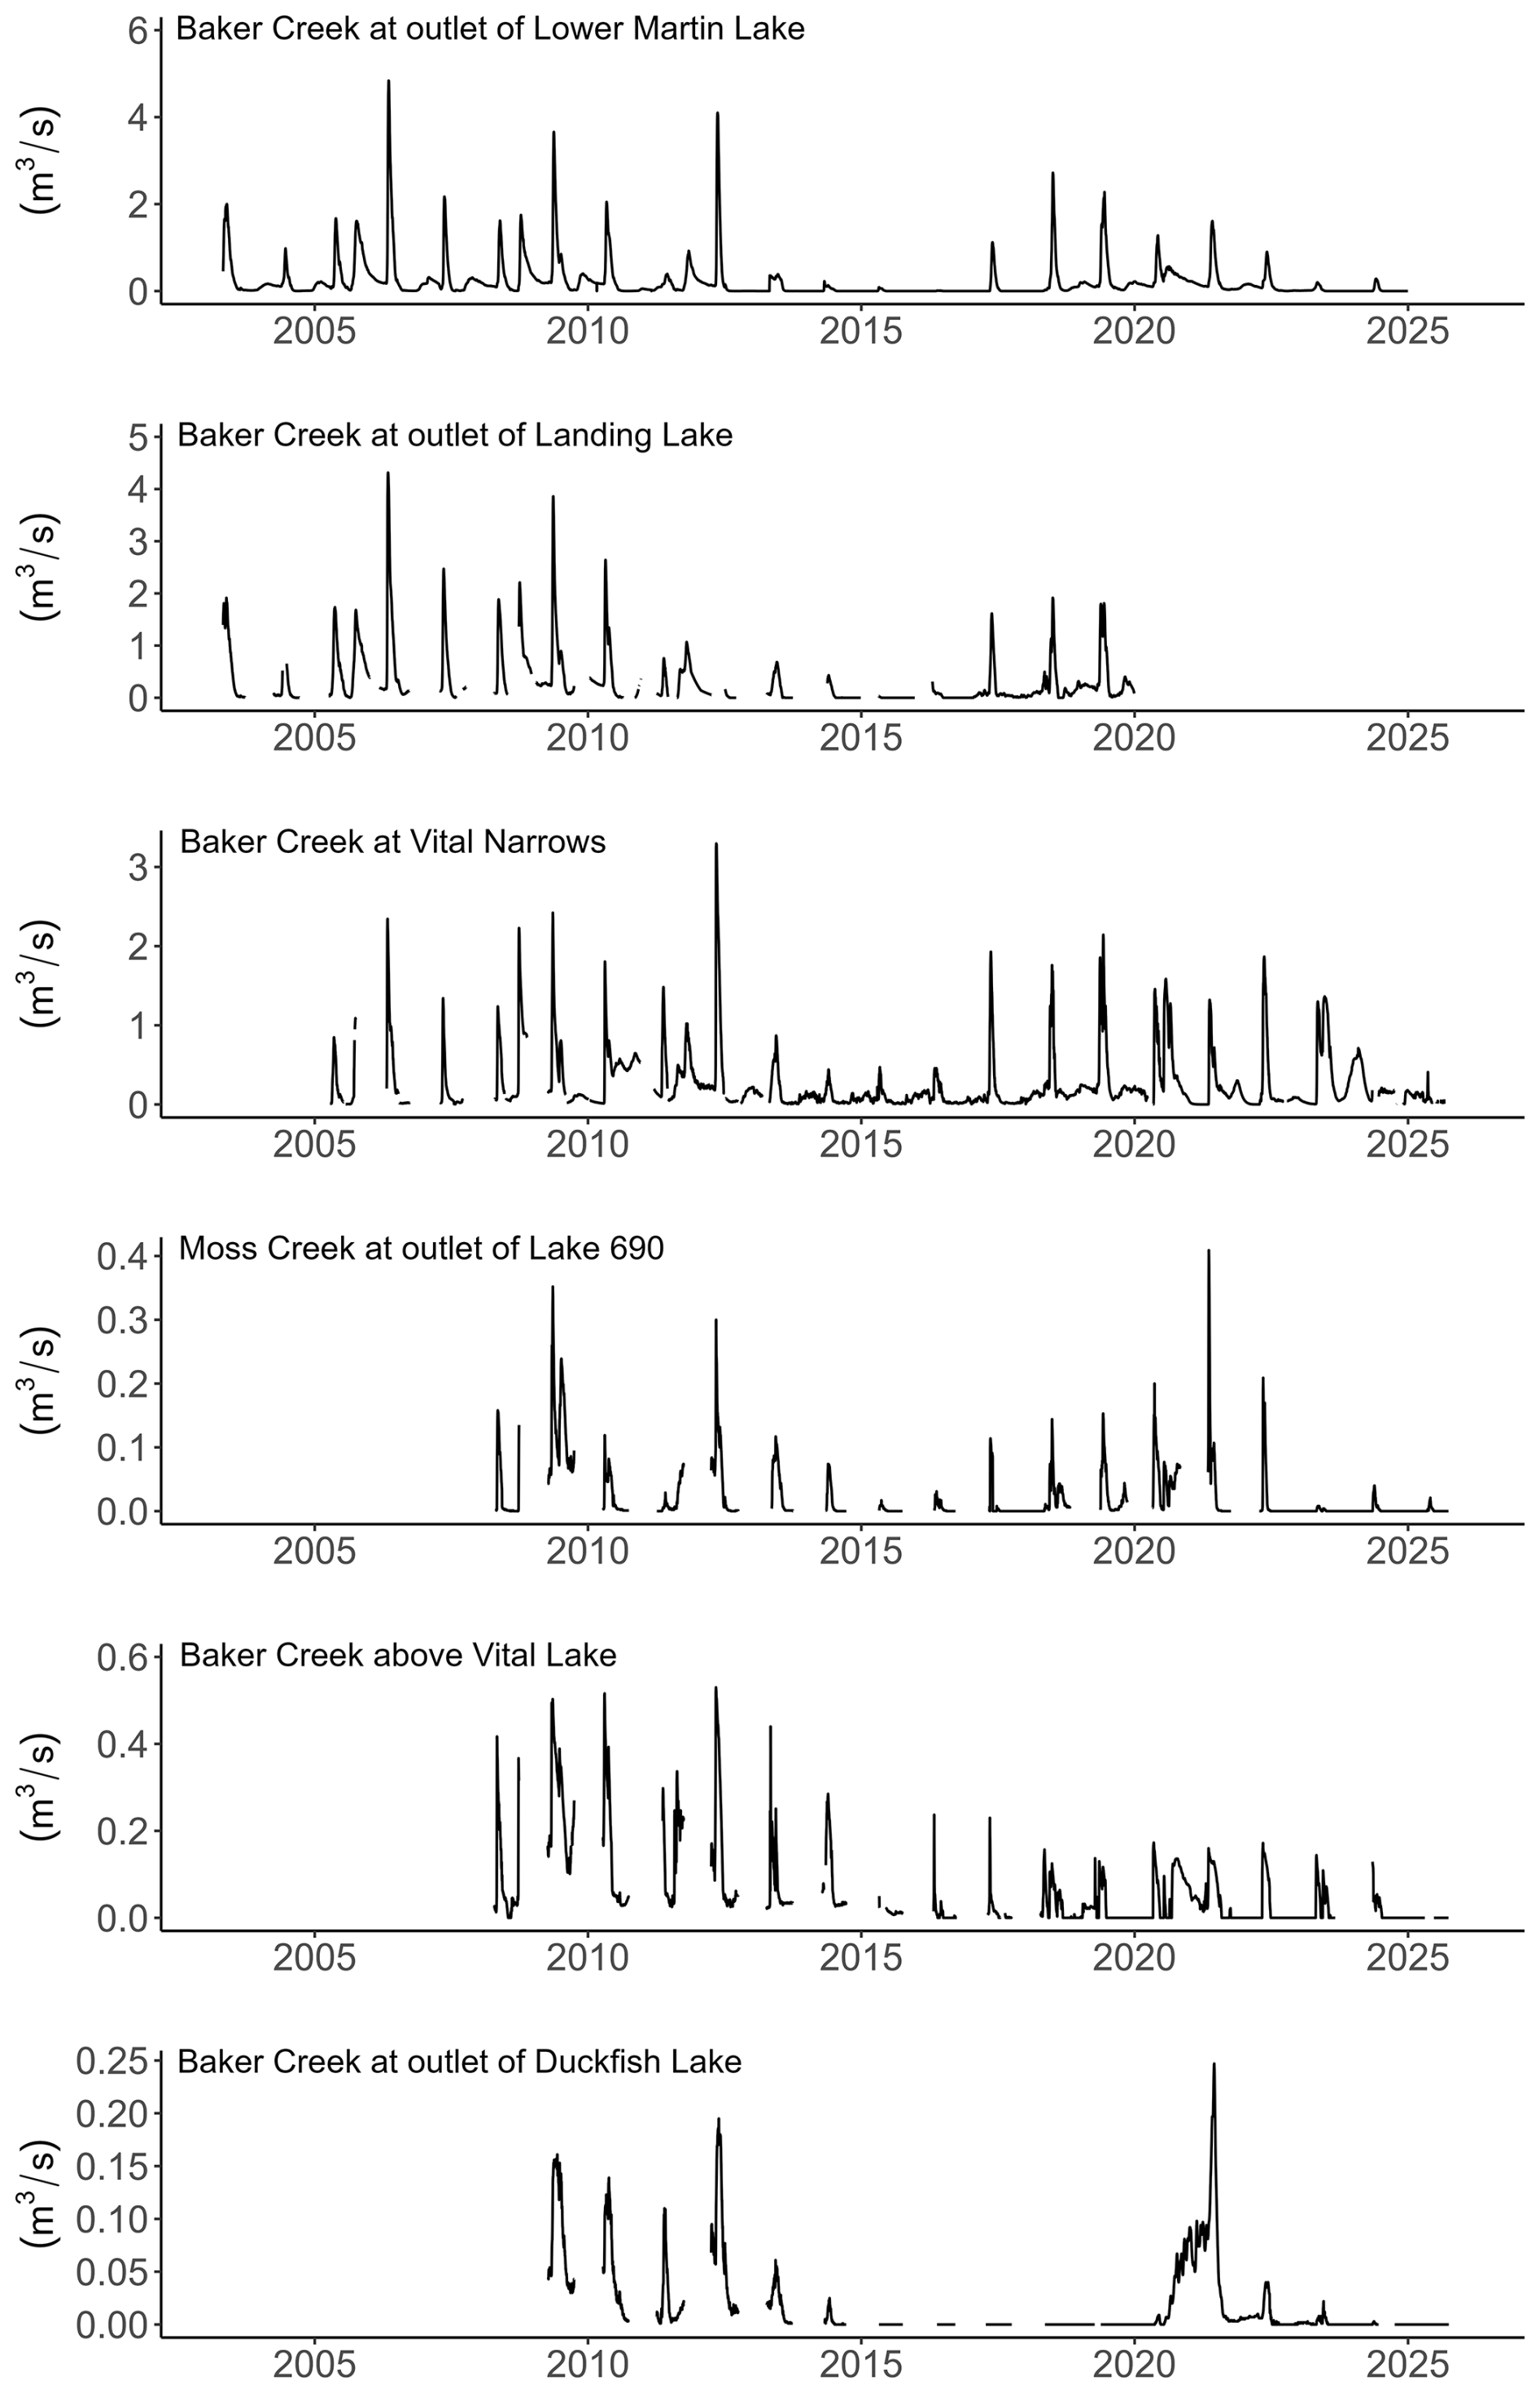
There are six hydrometric gauges in nested configuration on Baker Creek and its tributaries (Table 5). The furthest downstream gauge Baker Creek at the outlet of Lower Martin Lake has been operated by the Water Survey of Canada (07SB013) since 1983, with data available from https://wateroffice.ec.gc.ca (last access: 15 January 2026). The bedrock nature of the cross section at the bottom of Lower Martin Lake results in a nearly complete record of high quality streamflow data foundational to research watershed operations. Expansion of the hydrometric gauge network began in 2003 with the installation of Baker Creek at the outlet of Landing Lake and culminated in 2009 with the start of observations at Baker Creek at the outlet of Duckfish Lake. Initial installations were seasonal as unvented Solinst Levelloggers were used with partner Barologgers deployed at a central location in the watershed. Sites were slowly upgraded (Table 5) to continuous operation with the installation of Campbell Scientific CS451 pressure transducers, operated with Campbell CR1000 data loggers. Permanent benchmarks have always been used that allow stages to be referenced to datum. Arbitrary local datum were used initially, but Baker Creek was selected as a Canadian calibration/validation site for the Surface Water Ocean Topography satellite mission so four gauges now employ benchmarks installed in bedrock referenced to meters above sea level using orthometric heights in CGVD2013 and spatially referenced to NAD83. Water levels are surveyed at least quarterly each year and these surveys are used to convert the half hourly water depth data stored on the data loggers to water stage. Half hourly stage data are aggregated to daily values which are converted to streamflow data using stage-discharge rating curves constructed using coincident velocity-depth measurements with a SonTek Flowtracker. Streamflow measurements have been taken during open water conditions opportunistically to capture the range of observed stage. Regression coefficients of stage-discharge curves are not less than 0.92 but error in daily estimates can be as high as 25 %–30 % (Spence et al., 2010). The stage-discharge curves are not applied during periods of ice cover, backwater and beaver activity and this creates gaps in the daily time series. Notably, beavers built a dam at the outlet of Landing Lake in 2019 after which streamflow estimates are unavailable from that gauge. To improve streamflow estimates at Baker Creek at Vital Narrows during the common backwater conditions there each summer, a SonTek Argonaut-SW was installed in 2011 to measure velocities half hourly. An aufeis can form below the gauge Baker Creek above Vital Lake in the wet years, blocking the channel downstream. Alsafi et al. (2024) summarizes the method to identify these conditions and estimate streamflow as aufeis forms and degrades. No gaps in the streamflow record have been filled. These gaps include instances of known zero flow that do not appear in the official record.
Table 5Hydrometric gauges in the Baker Creek watershed, including their location, drainage areas and benchmark elevations. Water depth instruments deployed at each hydrometric gauge. Note that Baker Creek at the outlet of Duckfish Lake and above Vital Lake, and Moss Creek were ungauged prior to 2008, and Baker Creek at the outlet of Lower Martin Lake has been gauged since 1983. All sensors have a measurement uncertainty of ±0.3 cm except for the DISI 1210, which has a measurement uncertainty of ±0.1 cm. NA: not available.
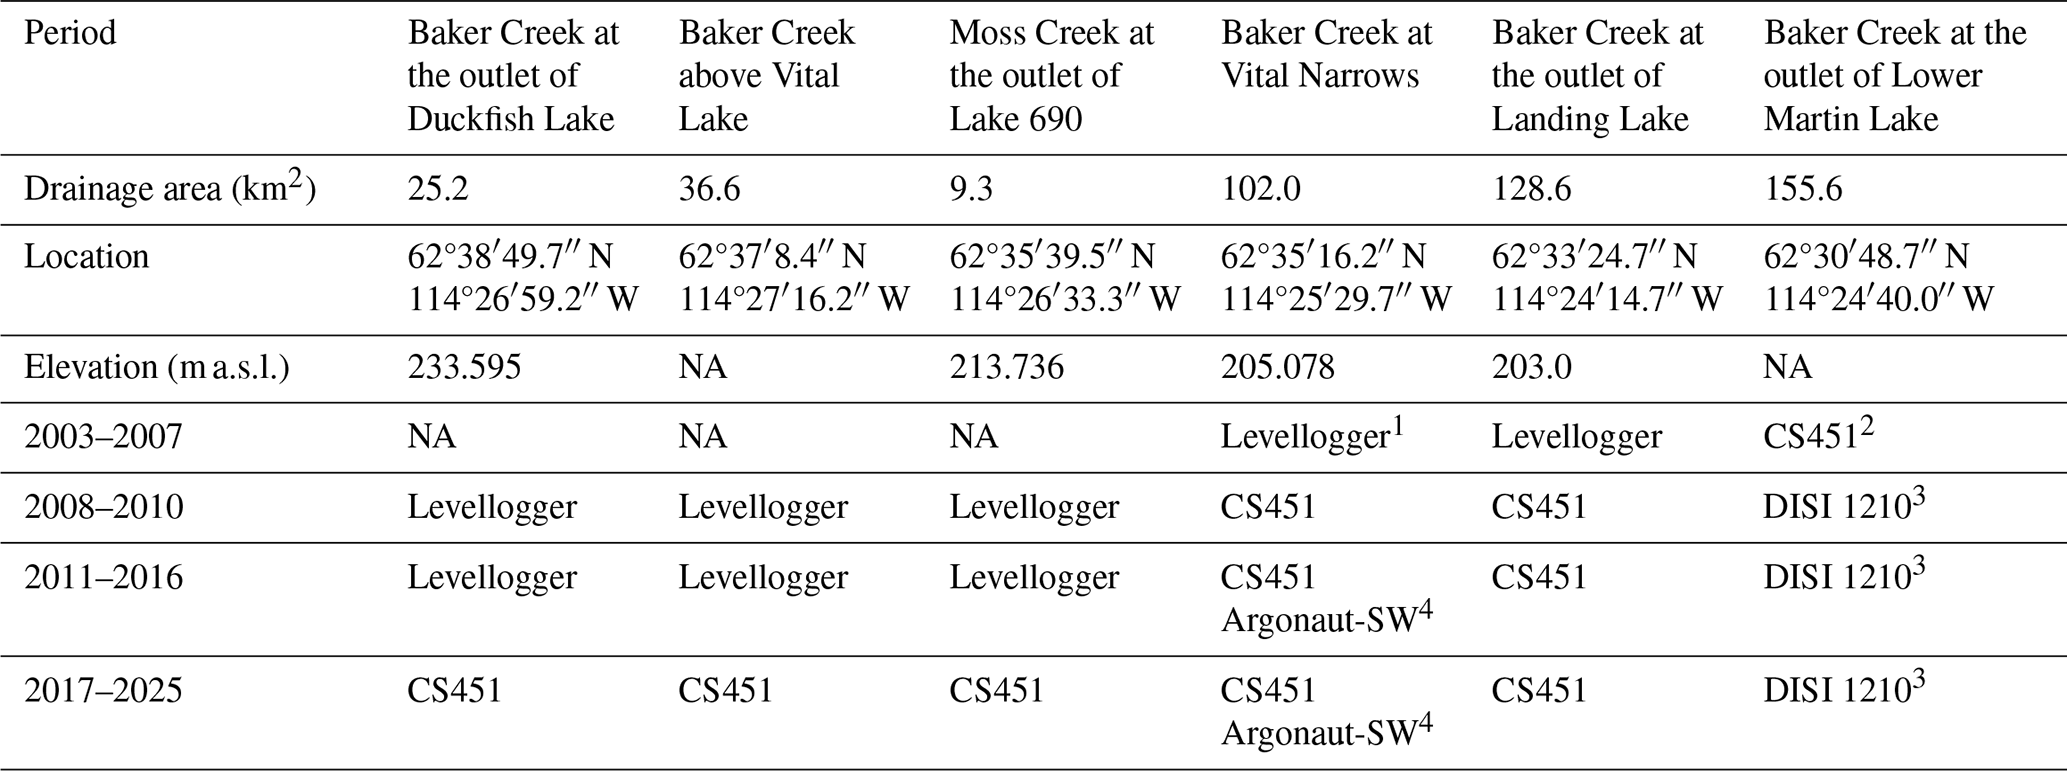
1 Manufactured by Solinst, Georgetown, ON, Canada 2 Manufactured by Campbell Scientific, Logan, UT, USA 3 Manufactured by Tavis Corporation, Maroposa, CA, USA
4 Manufactured by Sontek, San Diego, CA, USA
Table 6Annual average streamflow (m3 s−1) and runoff (mm) at each hydrometric gauge in the Baker Creek Research Watershed for the period 2017–2022. Streamflow was not calculated for 2020–2022 at the outlet of Landing Lake because of beaver activity and is not available (NA).
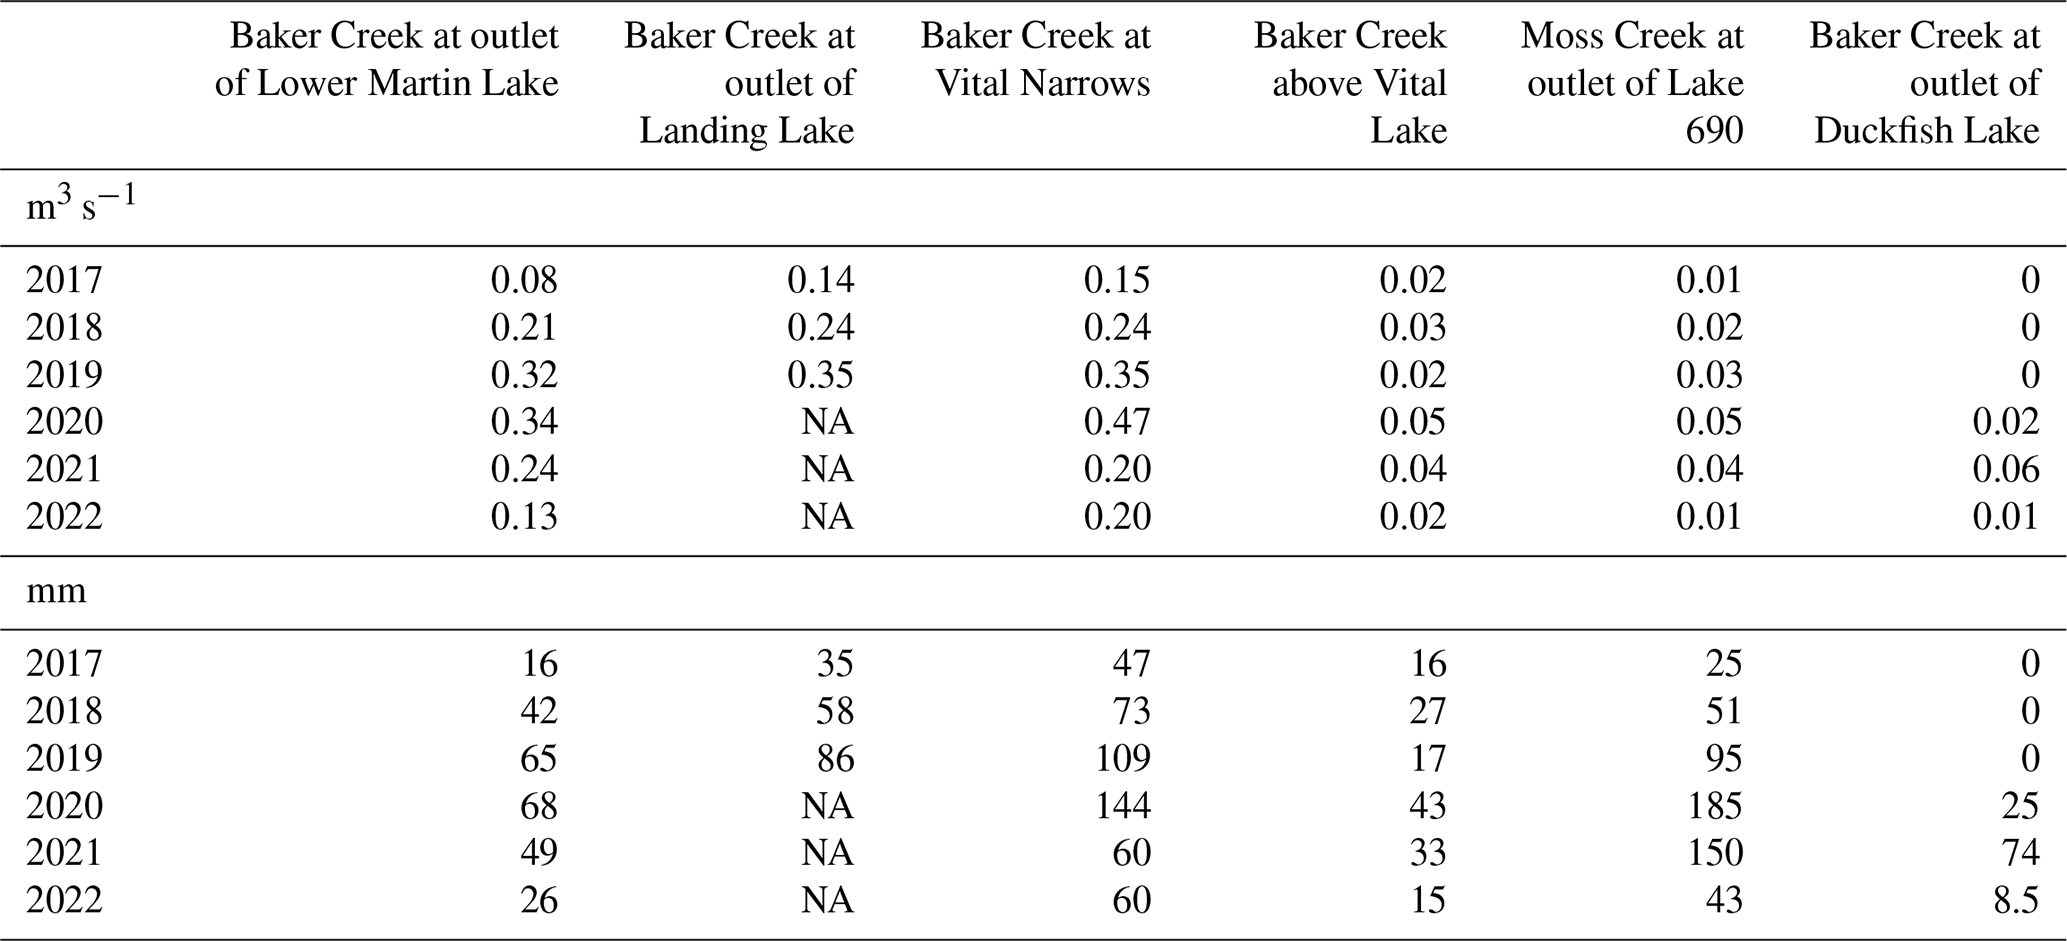
These streamflow data have proven useful for use within hydrological and water quality process studies and model testing (Sharma et al., 2023; Spence et al., 2010; Phillips et al., 2011; Spence et al., 2024; Alsafi et al., 2024; Palmer et al., 2021). The non continuous nature of the data (Fig. 8) makes it difficult to construct a continuous record of yield. However, the years 2017–2022 provide a near uninterrupted record from all six hydrometric gauges that can be used to demonstrate streamflow behaviour across the watershed. The record from the WSC gauge provides long-term context for these six years and shows the beginning and end of this subset are defined by dry conditions, with average streamflow in 2018–2021 above average (Table 6). The dry conditions are epitomized by zero flows from Duckfish Lake in 2017 and 2018, but these began in 2015 when the water level dropped below the outlet elevation after the beginning of meteorological drought in 2013 (Fig. 8) (Spence et al., 2021). This dry state during which large portions of the watershed are disconnected from the watershed outlet is a common trait of Baker Creek and the broader Taiga Shield landscape (Spence et al., 2010). Watershed runoff depths vary widely as streamflow released from individual lakes can behave independent of one another, especially during periods of disconnectivity caused by drought. Runoff is controlled by the relative geometry and topology of the storage capacity among landscape units (i.e., exposed bedrock, downslope forests, wetlands and water bodies) and the hysteretic, non-linear relationships between streamflow and antecedent wetness (Spence et al., 2010; Phillips et al., 2011).
The Federated Research Data Repository provides a single online location from which Canadian research data are shared, preserved, discovered, curated and cited. The data described here are available at: https://doi.org/10.20383/103.01579 (Spence and Hedstrom, 2026).
The data in this release are the culmination of > 20 years of observation of water and energy budgets in a representative subarctic Canadian Shield watershed. These data are provided to facilitate investigation of environmental processes, medium-term patterns and potential changes in this extensive landscape. They have proven fit for purpose in support of research of lake evaporation (Granger and Hedstrom, 2011) lake ice dynamics (Rafat et al., 2023), permafrost state (Muenchrath et al., 2024), terrestrial ecosystems (Sniderhan et al., 2023; Perron et al., 2024; Spence et al., 2024); aufeis processes (Alsafi et al., 2023), wildfire impacts (Spence et al., 2020a), water chemistry processes and prediction (Palmer et al., 2024; Spence et al., 2015; Sharma et al., 2023) and remote sensing of regional water levels (Pietroniro et al., 2019).
Both authors were involved in field work to collect the data in this recent release, including processing, quality assurance and quality control. Both authors contributed to writing and editing the manuscript.
The contact author has declared that neither of the authors has any competing interests.
Publisher's note: Copernicus Publications remains neutral with regard to jurisdictional claims made in the text, published maps, institutional affiliations, or any other geographical representation in this paper. The authors bear the ultimate responsibility for providing appropriate place names. Views expressed in the text are those of the authors and do not necessarily reflect the views of the publisher.
This dataset is the result of work of several people beyond the authors who deserve recognition. These include Shawne and Steve Kokelj, Meg McCluskie, Stefan Goodman, and Ryan Gregory from the Government of the Northwest Territories; May Guan, Ross Phillips, Kirby Ebel, Aram Jalali Bouraban, Alana Munencrath, Colin Whitfield and Andrew Ireson from the University of Saskatchewan; Ana Sniderhan, Homa Kheyrollah Pour, Arash Rafat and Jennifer Baltzer from Wilfrid Laurier University; and Cuyler Onclin, Mark Russell and Daryl Halliwell from the Environment and Climate Change Canada Water Science and Technology Directorate. The Yellowknife office of the Water Survey of Canada has provided outstanding logistical support for the research watershed.
Collection of data has been funded by Environment and Climate Change Canada, the Canadian Foundation for Atmospheric Sciences, the Garfield Weston Foundation, the Natural Sciences and Engineering Research Council of Canada, Polar Knowledge Canada and Global Water Futures.
This paper was edited by Chris DeBeer and reviewed by Ryan Connon and one anonymous referee.
Alsafi, N. E., Palmer, M. J., Kokelj, S. V., Ensom, T. P., Spence, C., and Tank, S. E.: Icings as sentinels and modifiers of water flow through winter landscapes: An exploration of physico-chemical processes on the lake-dominated, discontinuous permafrost Taiga Shield, Hydrol. Process., 38, e15251, https://doi.org/10.1002/hyp.15251, 2024.
Brown, N. and Gruber, S.: Beyond MAGT: learning more from permafrost thermal monitoring data with additional metrics, The Cryosphere, 20, 1771–1796, https://doi.org/10.5194/tc-20-1771-2026, 2026.
Eaton, A. K., Rouse, W. R., Lafleur, P. M., Marsh, P., and Blanken, P. D.: Surface energy balance of the western and central Canadian subarctic: Variations in the energy balance among five major terrain types, J. Climate, 14, 3692–3703, https://doi.org/10.1175/1520-0442(2001)014%3C3692:SEBOTW%3E2.0.CO;2, 2001.
Fischer, E. M. and Knutti, R.: Robust projections of combined humidity and temperature extremes, Nat. Clim. Change, 3, 126–130, https://doi.org/10.1038/nclimate1682, 2013.
Gasset, N., Fortin, V., Dimitrijevic, M., Carrera, M., Bilodeau, B., Muncaster, R., Gaborit, É., Roy, G., Pentcheva, N., Bulat, M., Wang, X., Pavlovic, R., Lespinas, F., Khedhaouiria, D., and Mai, J.: A 10 km North American precipitation and land-surface reanalysis based on the GEM atmospheric model, Hydrol. Earth Syst. Sci., 25, 4917–4945, https://doi.org/10.5194/hess-25-4917-2021, 2021.
Gibson, J. J., Reid, R., and Spence C.: A six-year isotopic record of lake evaporation at a mine site in the Canadian subarctic: results and validation, Hydrol. Process., 12, 1779–1792, https://doi.org/10.1002/(SICI)1099-1085(199808/09)12:10/11<1779::AID-HYP694>3.0.CO;2-7, 1998.
Granger, R. J. and Hedstrom, N.: Modelling hourly rates of evaporation from small lakes, Hydrol. Earth Syst. Sci., 15, 267–277, https://doi.org/10.5194/hess-15-267-2011, 2011.
Gruber, S.: Derivation and analysis of a high-resolution estimate of global permafrost zonation, The Cryosphere, 6, 221–233, https://doi.org/10.5194/tc-6-221-2012, 2012.
Hersbach, H., Bell, B., Berrisford, P., Hirahara, S., Horányi, A., Muñoz-Sabater, J., Nicolas, J., Peubey, C., Radu, R., Schepers, D., and Simmons, A.: The ERA5 global reanalysis, Q. J. Roy. Meteor. Soc., 146, 1999-2049, https://doi.org/10.1002/qj.3803, 2020.
Horst, T. W.: A simple formula for attenuation of eddy fluxes measured with first order response scalar sensors, Bound.-Lay. Meteorol., 94, 517–520, https://doi.org/10.1023/A:1000229130034, 1997.
Kaimal, J. C. and Finnigan, J. J.: Atmospheric Boundary Layer Flows – Their Structure and Measurement, Oxford University Press, New York, ISBN 0-19-506239-6, 1994.
Karunaratne, K. C., Kokelj, S. V., and Burn, C. R.: Near-surface permafrost conditions near Yellowknife, Northwest Territories, Canada, in: Proceedings, Ninth International Conference on Permafrost, 29, University of Alaska Fairbanks, Alaska, USA, 907–912, https://www.permafrost.org/event/icop9 (last access: 13 May 2026), 2008.
Kochendorfer, J., Nitu, R., Wolff, M., Mekis, E., Rasmussen, R., Baker, B., Earle, M. E., Reverdin, A., Wong, K., Smith, C. D., Yang, D., Roulet, Y.-A., Buisan, S., Laine, T., Lee, G., Aceituno, J. L. C., Alastrué, J., Isaksen, K., Meyers, T., Brækkan, R., Landolt, S., Jachcik, A., and Poikonen, A.: Analysis of single-Alter-shielded and unshielded measurements of mixed and solid precipitation from WMO-SPICE, Hydrol. Earth Syst. Sci., 21, 3525–3542, https://doi.org/10.5194/hess-21-3525-2017, 2017.
Landals, A. and Gill, D.: Differences in volume of surface runoff during the snowmelt period: Yellowknife, NWT, in: The Role of Snow and Ice in Hydrology, 107, International Association of Hydrological Sciences, 927–942, 1972.
Laudon, H., Spence, C., Buttle, J., Carey, S. K., McDonnell, J.J., McNamara, J., Soulsby, C., and Tetzlaff, D.: Save Northern High-Latitude Catchments, Nat. Geosci., 10, 324–325, https://doi.org/10.1038/ngeo2947, 2017.
Lemieux, J. M., Fortier, R., Murray, R., Dagenais, S., Cochand, M., Delottier, H., Therrien, R., Molson, J., Pryet, A., and Parhizkar, M.: Groundwater dynamics within a watershed in the discontinuous permafrost zone near Umiujaq (Nunavik, Canada), Hydrogeol. J., 28, 833–851, https://doi.org/10.1007/s10040-020-02110-4, 2020.
Manabe, S. and Wetherald, R. The effects of doubling the CO2 concentration on the climate of a general circulation model, J. Atmos. Sci., 32, 3–15, https://doi.org/10.1175/1520-0469(1975)032%3C0003:TEODTC%3E2.0.CO;2, 1975.
Massman, W. J.: A simple method for estimating frequency response corrections for eddy covariance systems, Agr. Forest Meteorol., 104, 185–198, https://doi.org/10.1016/S0168-1923(00)00164-7, 2000.
Moncrieff, J., Massheder, J. M., de Bruin, H., Elbers, J., Friborg, T., Heusinkveld, B., Kabat, P., Scott, S., Soegaard, H., and Verhoef, A.: A system to measure surface fluxes of momentum, sensible heat, water vapour and carbon dioxide, J. Hydrol., 188–189, 589–611, https://doi.org/10.1016/S0022-1694(96)03194-0, 1997.
Moncrieff, J., Clement, R., Finnigan, J., and Meyers, T.: Averaging, detrending, and filtering of eddy covariance time series, in: Handbook of Micrometeorology: A Guide for Surface Flux Measurement and Analysis, edited by: Lee, X., Massman, W., and Law, B., Springer, 7–31, https://doi.org/10.1007/1-4020-2265-4_2, 2005.
Morse, P. D., Wolfe, S. A., Kokelj, S. V., and Gaanderse, A. J. R.: The occurrence and thermal disequilibrium state of permafrost in forest ecotopes of the Great Slave region, Northwest Territories, Canada, Permafrost Periglac., 27, 145–192, https://https://doi.org/10.1002/ppp.1858, 2016.
Muenchrath, A., Spence, C., and Ireson, A.: The role of soil moisture on active layer thaw near Yellowknife, NWT, 12th International Conference on Permafrost Proceedings, edited by: Beddoe, R. and Karunaratne, K., V.2, 16–20 June 2024, Whitehorse, Canada: International Permafrost Association, 382–383, https://www.permatfrost.org/proceedings-of-the-12th-international-conference-on-permafrost-icop (last access: 13 May 2026), 2024.
O'Neill, H. B., Wolfe, S. A., and Duchesne, C.: New ground ice maps for Canada using a paleogeographic modelling approach, The Cryosphere, 13, 753–773, https://doi.org/10.5194/tc-13-753-2019, 2019.
Palmer, M. J., Chételat, J., Jamieson, H. E., Richardson, M., and Amyot, M.: Hydrologic control on winter dissolved oxygen mediates arsenic cycling in a small subarctic lake, Limnol. Oceanogr., 66, S30–S46, https://doi.org/10.1002/lno.11556, 2021.
Palmer, M. J., Richardson, M., Chételat, J., Spence, C., Connon, R., and Jamieson, H. E.: Watershed hydrology mediates the recovery of an arsenic impacted subarctic landscape, Environ. Pollut., 358, 124480, https://doi.org/10.1016/j.envpol.2024.124480, 2024.
Perron, N. Baltzer, J., Detto, M., Nehemy, M., Spence, C., Hould-Gosselin, G., Alcock, H., Hadiwijaya, B., Laroque, C., and Sonnentag, O.: Radiation, air temperature and soil water availability drive tree water deficit across temporal scales in Canada's western boreal forest, Geophys. Res. Lett., 51, e2023GL107477, https://doi.org/10.1029/2023GL107477, 2024.
Phillips, R. W., Spence, C., and Pomeroy, J. W.: Connectivity and runoff dynamics in heterogeneous basins, Hydrol. Process., 25, 3061–3075, https://doi.org/10.1002/hyp.8123, 2011.
Pietroniro, A., Peters, D. L., Yang, D., Fiset, J. M., Saint-Jean, R., Fortin, V., Leconte, R., Bergeron, J., Llanet Siles, G., Trudel, M., and Garnaud, C.: Canada's Contributions to the SWOT Mission–Terrestrial Hydrology (SWOT-C TH), Can. J. Remote Sens., 45, 116–138, https://doi.org/10.1080/07038992.2019.1581056, 2019.
Pomeroy, J. W. and Gray, D. M.: Snowcover: Accumulation, Relocation and Management, National Hydrology Research Institute Science Report #7, 144 pp., ISBN 0660158167, 1995.
Rafat, A., Pour, H. K., Spence, C., Palmer, M. J., and MacLean, A.: An analysis of ice growth and temperature dynamics in two Canadian subarctic lakes, Cold Reg. Sci. Technol., 210, 103808, https://doi.org/10.1016/j.coldregions.2023.103808, 2023.
Rouse, W. R., Oswald, C. J., Binyamin, J., Spence, C., Schertzer, W.M., Blanken, P. D., Bussières, N., and Duguay, C. R.: The role of northern lakes in a regional energy balance, J. Hydrometeorol., 6, 291–305, https://doi.org/10.1175/JHM421.1, 2005.
Sharma, S., Futter, M. N., Spence, C., Venkiteswaran, J. J., and Whitfield, C. J.: Modelling Subarctic watershed dissolved organic carbon response to hydroclimatic regime, Sci. Total Environ., 857, 159382, https://doi.org/10.1016/j.scitotenv.2022.159382, 2023.
Sniderhan, A., Spence, C., Kokelj, S. V., and Baltzer, J.: The right place at the right time: evidence for unexpected net permafrost aggradation driven by local hydrology and climatic triggers, Environ. Res. Lett., 18, 115001, https://doi.org/10.1088/1748-9326/acff0f, 2023.
Spence, C. and Hedstrom, N.: Hydrometeorological data from Baker Creek Research Watershed, Northwest Territories, Canada, Earth Syst. Sci. Data, 10, 1753–1767, https://doi.org/10.5194/essd-10-1753-2018, 2018.
Spence, C. and Hedstrom, N.: The Baker Creek Research Watershed: Streamflow data highlighting the behaviour of an intermittent Canadian Shield stream through a wet–dry–wet cycle, Hydrol. Process., 35, e14038, https://doi.org/10.1002/hyp.14038, 2021.
Spence, C. and Hedstrom, N.: Baker Creek Research Catchment Hydrometeorological and Hydrological Data, Federated Research Data Repository [data set], https://doi.org/10.20383/103.01579, 2026.
Spence, C., Guan, X. J., Phillips, R. W., Hedstrom, N., Granger, R., and Reid, R.: Storage Dynamics and Streamflow in a Catchment with a Variable Contributing Area, Hydrol. Process., 24, 2209–2221, https://doi.org/10.1002/hyp.7492, 2010.
Spence, C., Hedstrom, N., Tank, S.E., Quinton, W.L., Olefeldt, D., Goodman, S., and Dion, N.: Water budget resilience to forest fire in the subarctic Canadian Shield, Hydrol. Process., 34, 4940–4958, https://doi.org/10.1002/hyp.13915, 2020a.
Spence, C., Norris, M., Bickerton, G., Bonsal, B. R., Brua, R., Culp, J. M., Dibike, Y., Gruber, S., Morse, P. D., Peters, D. L., and Shrestha, R.: The Canadian water resource vulnerability index to permafrost thaw (CWRVIPT), Arctic Science, 6, 437–462, https://doi.org/10.1139/as-2019-0028, 2020b.
Spence, C., Coles, A., Gibson, J. J., Nicholls, E. M., Perron, N., Sniderhan, A., Sonnentag, O., and Baltzer, J. L.: The influence of tree infilling on energy partitioning, vegetation water use, and soil water state in sparse conifer stands of the Taiga Shield ecoregion, Water Resour. Res., 60, e2024WR037454, https://doi.org/10.1029/2024WR037454, 2024.
Spence, C., Galloway, J. M., Hedstrom, N., Kokelj, S. V., Kokelj, S. A., Muise, P., Newton, B. W., Patterson, R. T., Pisaric, M. F. J., and Swindles, G. T.: Process synchrony a key control of resilience in a subarctic freshwater system, Earth's Future, 13, e2024EF005518, https://doi.org/10.1029/2024EF005518, 2025.
Webb, E. K., Pearman, G. I., and Leuning, R.: Correction of flux measurements for density effects due to heat and water vapour transfer, Q. J. Roy. Meteor. Soc., 106, 85–100, https://doi.org/10.1002/qj.49710644707, 1980.
Woo, M. K.: Permafrost hydrology in North America, Atmos. Ocean, 24, 201–234, https://doi.org/10.1080/07055900.1986.9649248, 1986.