the Creative Commons Attribution 4.0 License.
the Creative Commons Attribution 4.0 License.
 | 18 May 2026
OasisMap30: a 30 m annual land cover dataset of China's oases from 1987 to 2024
Peng Chen
Qiang Tang
Yanxu Liu
Yuchuan Luo
Linhai Cheng
Yijia Wang
Wenxuan Xu
Shuai Wang
High spatio-temporal resolution maps of oasis land cover are valuable for understanding ecological and societal development processes in dryland regions. However, the relatively late development of oasis research, combined with the highly fragmented structure of oases and their frequent land cover transitions, has made it challenging to construct high spatio-temporal resolution land cover datasets for oases. As a result, dedicated data products of this kind are still lacking. Here, we developed a framework for annual 30 m land cover mapping that integrates Landsat satellite imagery, machine learning, a temporal segmentation approach (LandTrendr), and principal component analysis. Using this framework, we produced a 30 m resolution annual land-cover dataset for Chinese oases (OasisMap30) for the period 1987–2024 on the Google Earth Engine (GEE) platform. Accuracy assessment based on more than 6300 visually interpreted samples demonstrates high accuracy of OasisMap30 (overall accuracy > 90 %). In cross-product comparisons based on visually interpreted and third-party test samples, OasisMap30 exhibits considerable advantages in terms of classification accuracy and error reduction. Moreover, in comparison with several 30 m resolution thematic products for impervious surface, cropland, and surface water, we found an impressive consistency between OasisMap30 and these datasets. Using OasisMap30, we investigated the changes in land cover patterns of Chinese oases. The results show that oasis area expanded by 45.87 % (+7.75 Mha) between 1987 and 2024, primarily driven by cropland expansion and grassland restoration. Specifically, 4.04 Mha of desert were restored to grassland, and 3.19 Mha were converted from desert to cropland. In addition, OasisMap30 reveals the expansion of impervious surfaces (0.58 Mha) and surface water (0.35 Mha), as well as conversions among land cover types, such as the conversion of 3.12 Mha of grassland to cropland. Overall, the consistent, high-resolution OasisMap30 data can substantially support studies on the evolution of oasis landscape patterns, socio-ecological responses, and spatial pattern optimization, thereby contributing to the sustainable development of oasis regions. The full archive of OasisMap30 is freely available at https://doi.org/10.6084/m9.figshare.30798032 (Chen et al., 2025).
- Article
(7204 KB) - Full-text XML
-
Supplement
(2369 KB) - BibTeX
- EndNote


Oases are the most productive and vulnerable landscapes in drylands (Chen et al., 2024a). An oasis is generally defined as a geographical complex formed in arid desert regions, with deserts serving as the surrounding landscape matrix, sustained by relatively stable water resources, characterized by azonal vegetated landscapes, and capable of supporting human activities such as agriculture, animal husbandry, and industrial production (Lin et al., 2024; Zhou et al., 2015). Over the past few decades, Chinese oases have undergone pronounced changes in their extent and internal structure under the combined influences of climate change and human activities (Zeng et al., 2019). In particular, the continued expansion of cropland and grassland has supported rapid increases in regional food and livestock production, but has also altered the relationships among water resources, food production and ecosystems in oasis regions (Chen et al., 2024b). These shifts have led to a range of ecological and hydrological problems, including groundwater decline, soil desiccation, vegetation degradation and intensified desertification, thereby sharpening the tension between oasis development and environmental sustainability (Chen et al., 2024a). Therefore, understanding how changes in oasis landscape patterns affect regional ecological and hydrological conditions is crucial for alleviating this tension (Lin et al., 2024). This knowledge also supports progress towards several sustainable development goals (SDGs), particularly SDG 15.3 on land degradation neutrality in drylands, as well as SDG 2 on food security and SDG 6 on sustainable water management (UN, 2015). However, due to the relatively late development of the oasis discipline, as well as difficulties in delineating oasis boundaries and highly fragmented internal land cover, high spatio-temporal resolution land-cover datasets for oasis regions are still lacking.
Remote sensing technology provides a vital means for monitoring land-cover information (Yang and Huang, 2021a). With advancements in satellite and remote sensing technologies, the spatial and temporal resolution of mapping has significantly improved (Tu et al., 2024). In recent years, a series of land-cover datasets with continuous or annual observations have been developed at global and regional scales, greatly improving the capacity to monitor long-term land-cover dynamics. Representative datasets include the Moderate Resolution Imaging Spectroradiometer (MODIS)-based annual land-cover product (MCD12Q1, 500 m) (Sulla-Menashe et al., 2019) and the European Space Agency Climate Change Initiative Land Cover dataset (ESA CCI LC, 300 m) (Copernicus Climate Change Service, 2019). At finer spatial resolution, Landsat-based products include the China Land Cover Dataset (CLCD, 30 m) (Yang and Huang, 2021a), the temporally consistent annual land cover maps over China (ALCC, 30 m) (Li et al., 2026), and the Global Land-Cover product with Fine Classification System (GLC_FCS30, 30 m) (Liu et al., 2020; Zhang et al., 2021). These datasets have provided important support for land-change studies. However, their application to oasis studies remains limited. Coarse-resolution products are often affected by mixed pixels, making them unsuitable for fine-scale change analysis (Yang and Huang, 2021a). Higher-resolution products can better capture spatial details, and several existing datasets have reported good overall accuracy. Nevertheless, these advantages do not necessarily guarantee equally reliable performance in oasis regions because land cover in these regions often shows strong interannual variability.
The accuracy of each annual map used for monitoring oasis dynamics is crucial (Xie et al., 2014). In annual change analyses, classification errors in individual maps can accumulate over time and introduce substantial uncertainties into the final results (Zhu, 2017). Reducing per-map errors is therefore particularly important. To address this issue, previous studies have employed methods such as spatio-temporal filtering, consistency checks, and disturbance-based time-series analysis to improve the accuracy of land-cover products (Li et al., 2015; Zhu, 2017). Among these, the LandTrendr algorithm (Landsat-based detection of trends in disturbance and recovery) has shown excellent performance in detecting abrupt surface changes (Pasquarella et al., 2022). LandTrendr fits a piecewise linear trajectory to the full per-pixel time series of data values, effectively denoising interannual variability and smoothing long-term trends (Kennedy et al., 2010). From the fitted segments, it identifies disturbance events and quantifies their magnitude, timing and duration. These metrics can then be used to detect both abrupt surface-change events and longer-term change trends (Tu et al., 2024). However, when LandTrendr is applied to individual spectral bands or indices, a disturbance signal in a single variable (for example, near-infrared reflectance or the normalized difference vegetation index) may not be sufficient to confirm a true land-cover change. Robust land-cover change detection therefore requires integrating information from multiple indicators. Principal component analysis (PCA) provides an effective way to reduce dimensionality by summarizing information from multiple correlated variables into a few composite components (Mugiraneza et al., 2020). By applying PCA to the disturbance magnitudes of multiple indicators derived from the LandTrendr algorithm, these disturbance signals can be integrated into a single composite metric. This integrated disturbance signal allows land-cover change areas to be identified more reliably than when relying on any individual index alone. The integration of these two methods provides a potential way to improve the reliability of annual land-cover mapping. However, in oasis regions with complex landscape patterns and strong interannual variability, accurately capturing land-cover changes and limiting error propagation remain key challenges for achieving long-term land-cover mapping at high spatial and temporal resolution.
In this study, we developed a new framework for annual land-cover mapping at fine resolution by combining random forest classification with the LandTrendr algorithm and principal component analysis. Based on this framework, we integrated multi-source remote sensing data to produce an annual 30 m resolution land cover dataset for Chinese oases (OasisMap30) from 1987 to 2024. We further assessed the accuracy of OasisMap30 using visually interpreted and third-party test samples, evaluated its performance through inter-comparison with existing land-cover and thematic datasets, and investigated the long-term dynamics of land-cover change in China's oases over the past four decades.
2.1 Delineation of China's oasis extent
To determine where oases are located across China, we first compiled oasis distributions reported in previous studies (Gao, 1987; Wei et al., 2018; Xie et al., 2014; Zhou et al., 2017). These literature-based maps were combined with NDVI information to obtain an initial, coarse delineation of potential oasis areas for the period 1987–2024. On this basis, we manually inspected the imagery and masked out mountain regions and clearly unvegetated desert areas, while retaining oasis areas within desert regions, and then delineated the final study area for classification on the GEE platform. To ensure that oases which may have disappeared by 2024 but existed in earlier years are not overlooked, land cover classification was performed over a region larger than the previously observed oasis extent. Within this study area, we classified land cover into seven types: impervious surface, surface water, cropland, shrubland, forest, grassland and barren land. Based on the conceptual definition of oasis and the land-cover classification system used in this study, vegetated land-cover types together with surface water and impervious surfaces within the delineated oasis extent were treated as components of oasis landscapes, whereas barren land was excluded.
2.2 Data source
We used all available Landsat Level 2 Tier 1 surface reflectance (SR) data (TM 5, ETM+ 7, OLI 8) covering our study area from 1987 to 2024, with these data having undergone atmospheric correction. Considering the differences between Landsat sensors, we applied conversion factors recommended by Roy et al. (2016) to normalize Landsat 8 reflectance to Landsat 5 and 7 reflectance. This ensures comparability between multi-temporal images across years. Digital elevation data were sourced from the Shuttle Radar Topography Mission (SRTM).
2.3 Feature space construction
Based on Landsat imagery and SRTM DEM data, we derived the predictor variables used in the random forest classification (Breiman, 2001). Among these, slope, aspect, and hillshade were computed from the DEM data. To enhance classification performance, we further applied the tasseled cap transformation to derive brightness, greenness, and wetness components (Crist, 1985; Huang et al., 2002; Baig et al., 2014). The final feature indicators comprise four categories: spectral features, terrain features, tasseled-cap transform, and gray-level co-occurrence matrix. The detailed variables used in the classification are listed in Table 1.
Table 1Independent variables of the random forest model for land-cover classification.
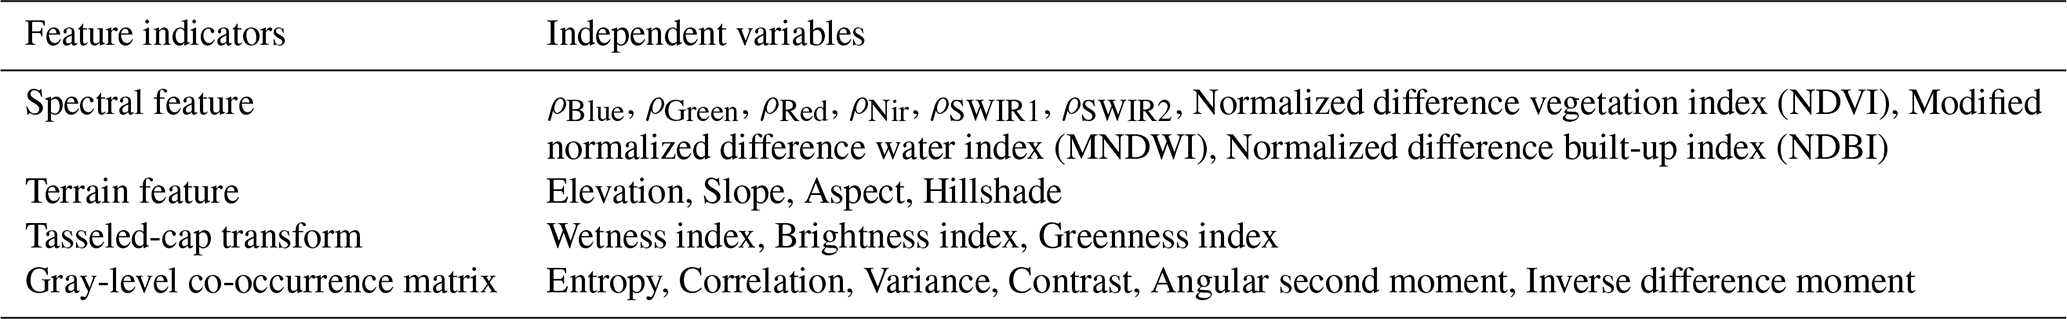
Note: ρBlue, ρGreen, ρRed, ρNir, ρSWIR1, ρSWIR2 are the surface reflectance values in the blue, green, red, near infrared, shortwave infrared 1, and 2 bands of the Landsat image, respectively.
2.4 Land-cover classification
We used a random forest algorithm for land-cover classification (Fig. 1). Landsat images were first imported into GEE and pre-processed, including cloud and snow masking and mosaicking. Visually interpreted samples for different land-cover types were then collected based on the pre-processed Landsat imagery in combination with Google Earth historical imagery. To ensure a spatially uniform distribution of samples across the oasis region, the oasis area was divided into approximately 1100 independent units using regular hexagons with a 10 km side length, and 25 sample points were randomly generated within each unit. After visual interpretation and quality screening, at least 27 000 samples were retained for each year (Fig. S1 in the Supplement).
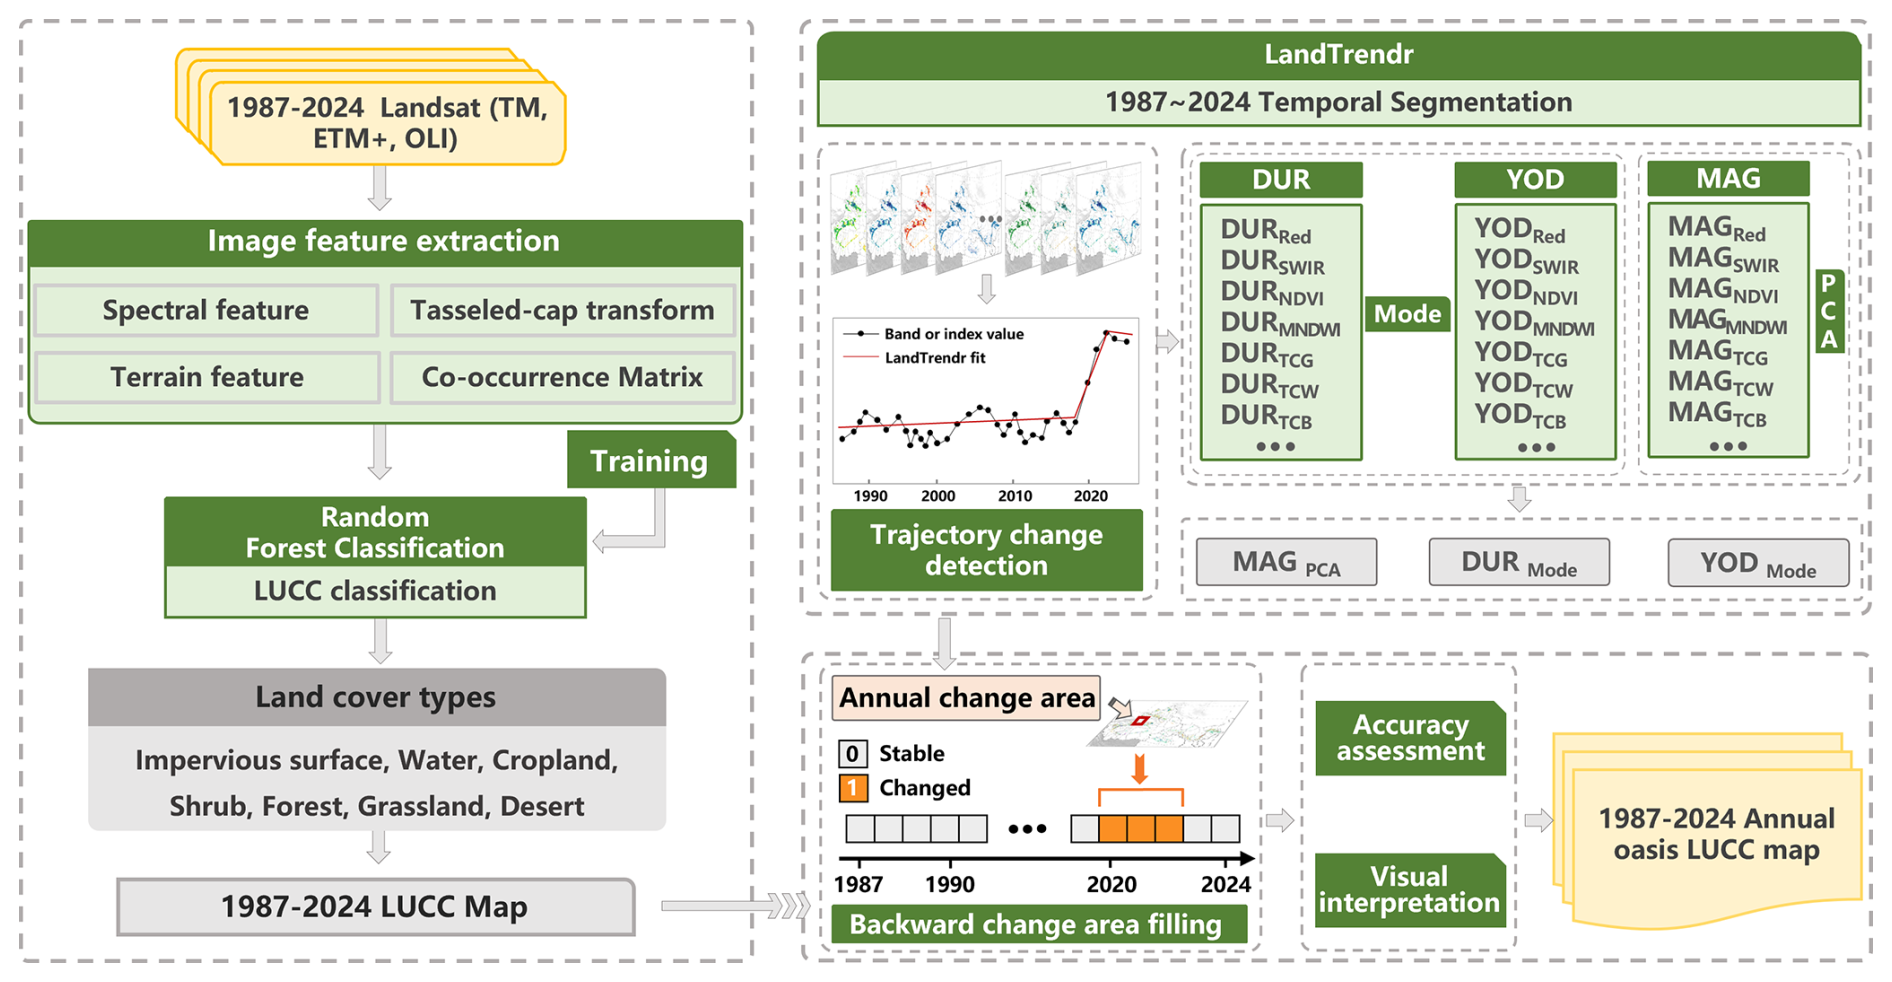
Figure 1Flowchart of this study for mapping annual oasis land-cover. DUR: disturbance duration; YOD: year of disturbance; MAG: disturbance magnitude.
For each sample, the predictor variables described in Sect. 2.3 were extracted from the annual Landsat image composites and SRTM DEM, including spectral features, terrain features, tasseled-cap components, and gray-level co-occurrence matrix features (Table 1). The calculation methods for each indicator are detailed in Table S1 in the Supplement. The samples were then divided into training and validation subsets at a ratio of 7:3. The training subset was used to train the random forest classifier, whereas the validation subset was used to assess classification performance. The trained classifier was then applied to the Landsat image composites to generate the initial land-cover maps.
We selected 2024 as the baseline year for subsequent annual land-cover mapping. The oasis land-cover map for 2024 produced by the random forest classifier was further corrected by visual interpretation to obtain the final 2024 oasis land-cover map. Six experts independently conducted visual inspection and manual corrections based on high-resolution imagery. The final 2024 oasis land-cover map was then used as the baseline for subsequent annual land-cover mapping.
2.5 LandTrendr–PCA based annual land-cover mapping
Land-cover classification is prone to error propagation, especially when producing annual map series, where classification errors can accumulate over time. Employing the LandTrendr algorithm to identify areas exhibiting abrupt changes in surface reflectance, followed by machine learning classification of these areas, can effectively reduce the impact of error propagation. Therefore, to map land-cover dynamics from 1987 to 2024 while limiting the propagation of classification errors, we used the final 2024 oasis land-cover dataset as the baseline map and applied the LandTrendr algorithm to the annual time series of spectral indices, with the main parameter settings provided in Table S2.
Since a single index's change cannot conclusively indicate land-cover change (for example, abrupt shifts in near-infrared reflectance or NDVI do not necessarily imply land-cover change), we combined LandTrendr with PCA to more accurately identify the locations and timing of land-cover change. For each pixel, we first extracted the disturbance magnitude (MAG), year of disturbance (YOD) and duration (DUR) from the fitted temporal trajectory for each index. We then applied PCA to the disturbance magnitudes of multiple indices to derive a single composite disturbance metric (MAGPCA), which integrates consistent disturbance signals across indices. Pixels exhibiting significant disturbance were flagged as candidate land-cover change areas. Subsequently, by taking the mode values of DUR and YOD distribution for all indicators, we obtained DURmode and YODmode maps, thereby defining the time windows for potential transitions.
Based on these candidate change areas and time windows, annual land-cover classification was performed for pixels identified as potentially changed, using the same feature types as for 2024 but with Landsat imagery from the corresponding years. Pixels without detected disturbance retained their land-cover class from the 2024 reference map or from the pre-disturbance period, thereby limiting the temporal propagation of classification errors. Finally, the annual oasis land-cover maps for 1987–2024 were visually inspected and manually corrected by six experts, ensuring the consistency and reliability of the complete time series.
2.6 Evaluation of disturbance timing consistency
Because we used YODmode as the starting time for surface changes, dispersion in YOD across indices could interfere with the accurate identification of the true onset time of disturbance and thus affect classification accuracy. To verify the accuracy of the disturbance timing identified by this method, we examined the dispersion of the YOD distribution across indices (Eq. 1). The results indicate that YODindicator exhibits a high degree of consistency (Fig. S2). In addition, after identifying the years in which land cover may have changed, we have to further detect whether land cover types have changed through land cover classification and visual interpretation, and if not, this process will be repeated for the next year. Therefore, YODdispersion > 0 in this study has a limited impact on the identification of land cover change.
where YODindicator indicates the YOD identified by the different indicators, and YODdispersion indicates the dispersion of YOD. When the YODdispersion = 0, YODindicator is consistent with YODmode; when YODdispersion < 0, YODindicator is earlier than YODmode; and when YODdispersion > 0, YODindicator is later than YODmode.
2.7 Accuracy and error assessment
We used a visually interpreted test dataset (at least 6300 samples annually) and a third-party test dataset (Geo-Wiki), both of which were independent of the samples used for model training and validation, to evaluate the accuracy of OasisMap30 (Fritz et al., 2017). To assure the spatial uniformity and spatial balance across land cover types in the validation of the visually interpreted test samples, we employed a stratified random sampling method based on a hexagonal grid. Each unit was treated as an independent sampling unit for land cover type sampling, ensuring an even distribution of validation samples across the entire area. For each independent hexagon, the area proportion of seven land-cover types was calculated based on 30 m resolution land cover data. Stratified random sampling was then conducted according to these proportions and the predetermined total sample size. This method accounts for spatial distribution uniformity and land cover area proportions, effectively reducing sampling bias in validation samples. During the evaluation, five experts independently interpreted the data, and each validation point was confirmed by at least two researchers. For points with disagreements, a third researcher made the final decision. If interpretations remain controversial, the point is discarded. We ensured that the number of validation points for rare land cover classes (e.g., forest) was no fewer than 50, as recommended by Olofsson et al. (2014). After removing points with low confidence from each land cover class, we retained at least 6300 validation samples annually.
Finally, we assessed the accuracy of OasisMap30 quantitatively using producer accuracy (PA), user accuracy (UA), overall accuracy (OA), and the F1 score. The F1 score represents the balance between producer accuracy and user accuracy (Eq. 2). And we estimated the accuracy, area of each land-cover type, and uncertainty of the oasis map at 95 % confidence intervals. For a detailed description of the estimation methods, see Olofsson et al. (2014).
2.8 Datasets inter-comparison
We compared OasisMap30 with several widely used and well-validated land cover products, including three global datasets, namely MCD12Q1, ESACCI_LC, and GLC_FCS30, with spatial resolutions of 500, 300, and 30 m, respectively (Table S3). We also selected CLCD and ALCC, both of which are annual 30 m land cover datasets for China, with reported overall accuracies of 79.3 % and 81.11 %, respectively. In addition, we assessed the accuracy of OasisMap30 through inter-comparison with 30 m resolution thematic data derived from Landsat imagery. The current primary impervious surface datasets covering oasis regions include Global Impervious Surface Area (GISA) (Huang et al., 2021a, b) and Global Artificial Impervious Area (GAIA) (Gong et al., 2020). GISA and GAIA provide long-term information on impervious surface dynamics, covering the periods 1972–2021 and 1985–2024, respectively. Crop-related thematic datasets mainly comprise Global Land Analysis & Discovery Cropland Data (GLAD) (Potapov et al., 2021), the Hybrid Cropland Maps of China (CCropland30) (Zhang et al., 2024; Zhang, 2024), and the Annual Cropland Dataset of China (CACD) (Tu et al., 2023, 2024). GLAD is a globally consistent cropland dataset covering the period 2000–2019, with maps produced at 4-year intervals. CCropland30 and CACD are cropland distribution datasets for China, covering 2000–2020 with maps produced at 5-year intervals and 1986–2021 with annual maps, respectively. For surface water, the Global Surface Water (GSW) dataset was selected (Pekel et al., 2016), which covers the period 1985–2021. Compared with OasisMap30, GSW provides a much denser temporal record (monthly). To facilitate comparison, we calculated annual mean surface-water extent from the monthly GSW data. These thematic datasets have been shown to have good accuracy in previous studies.
To assess the spatial consistency between OasisMap30 and the thematic products, we first aggregated the 30 m datasets to a 0.05° × 0.05° spatial grid. For each grid cell, we then calculated the fractional area for each category and used these values to construct scatterplots. The coefficient of determination (R2) and root mean square error (RMSE) were used to assess the level of consistency between OasisMap30 and the thematic products.
3.1 The accuracy and error verification of the OasisMap30
Based on all available Landsat imagery data on GEE, we produced a 30 m resolution annual Chinese oasis land cover dataset. Verification results based on visually interpreted samples indicate that OasisMap30 has a high accuracy rate (Fig. 2). Overall accuracy ranges from 90.40 % to 94.05 % (Table S4), with a mean of 91.96 ± 1.55 % (Fig. S3h). Among each category, cropland achieved the highest F1 score (93.25 % ± 1.93 %), followed by surface water (92.14 % ± 2.09 %), grassland (91.50 % ± 1.06 %), barren land (90.68 % ± 0.47 %), and impervious surfaces (87.49 % ± 3.69 %), while the average F1 scores for forest and shrubland also exceed 84 % (Fig. S3). In addition, we evaluated the error and uncertainty of OasisMap30 using the methods recommended by Olofsson et al. (2014). Taking 2022 as an example, cropland and grassland areas in Chinese oases are estimated at 12.81 and 8.48 Mha, with associated errors of only 0.133 and 0.134 Mha, respectively (Table S5). Shrubland and forest have the largest classification errors among all land cover types, but their error ranges are still limited to 0.55 ± 0.05 and 0.29 ± 0.034 Mha (Table S5). These evaluation results further demonstrate the robustness of OasisMap30.
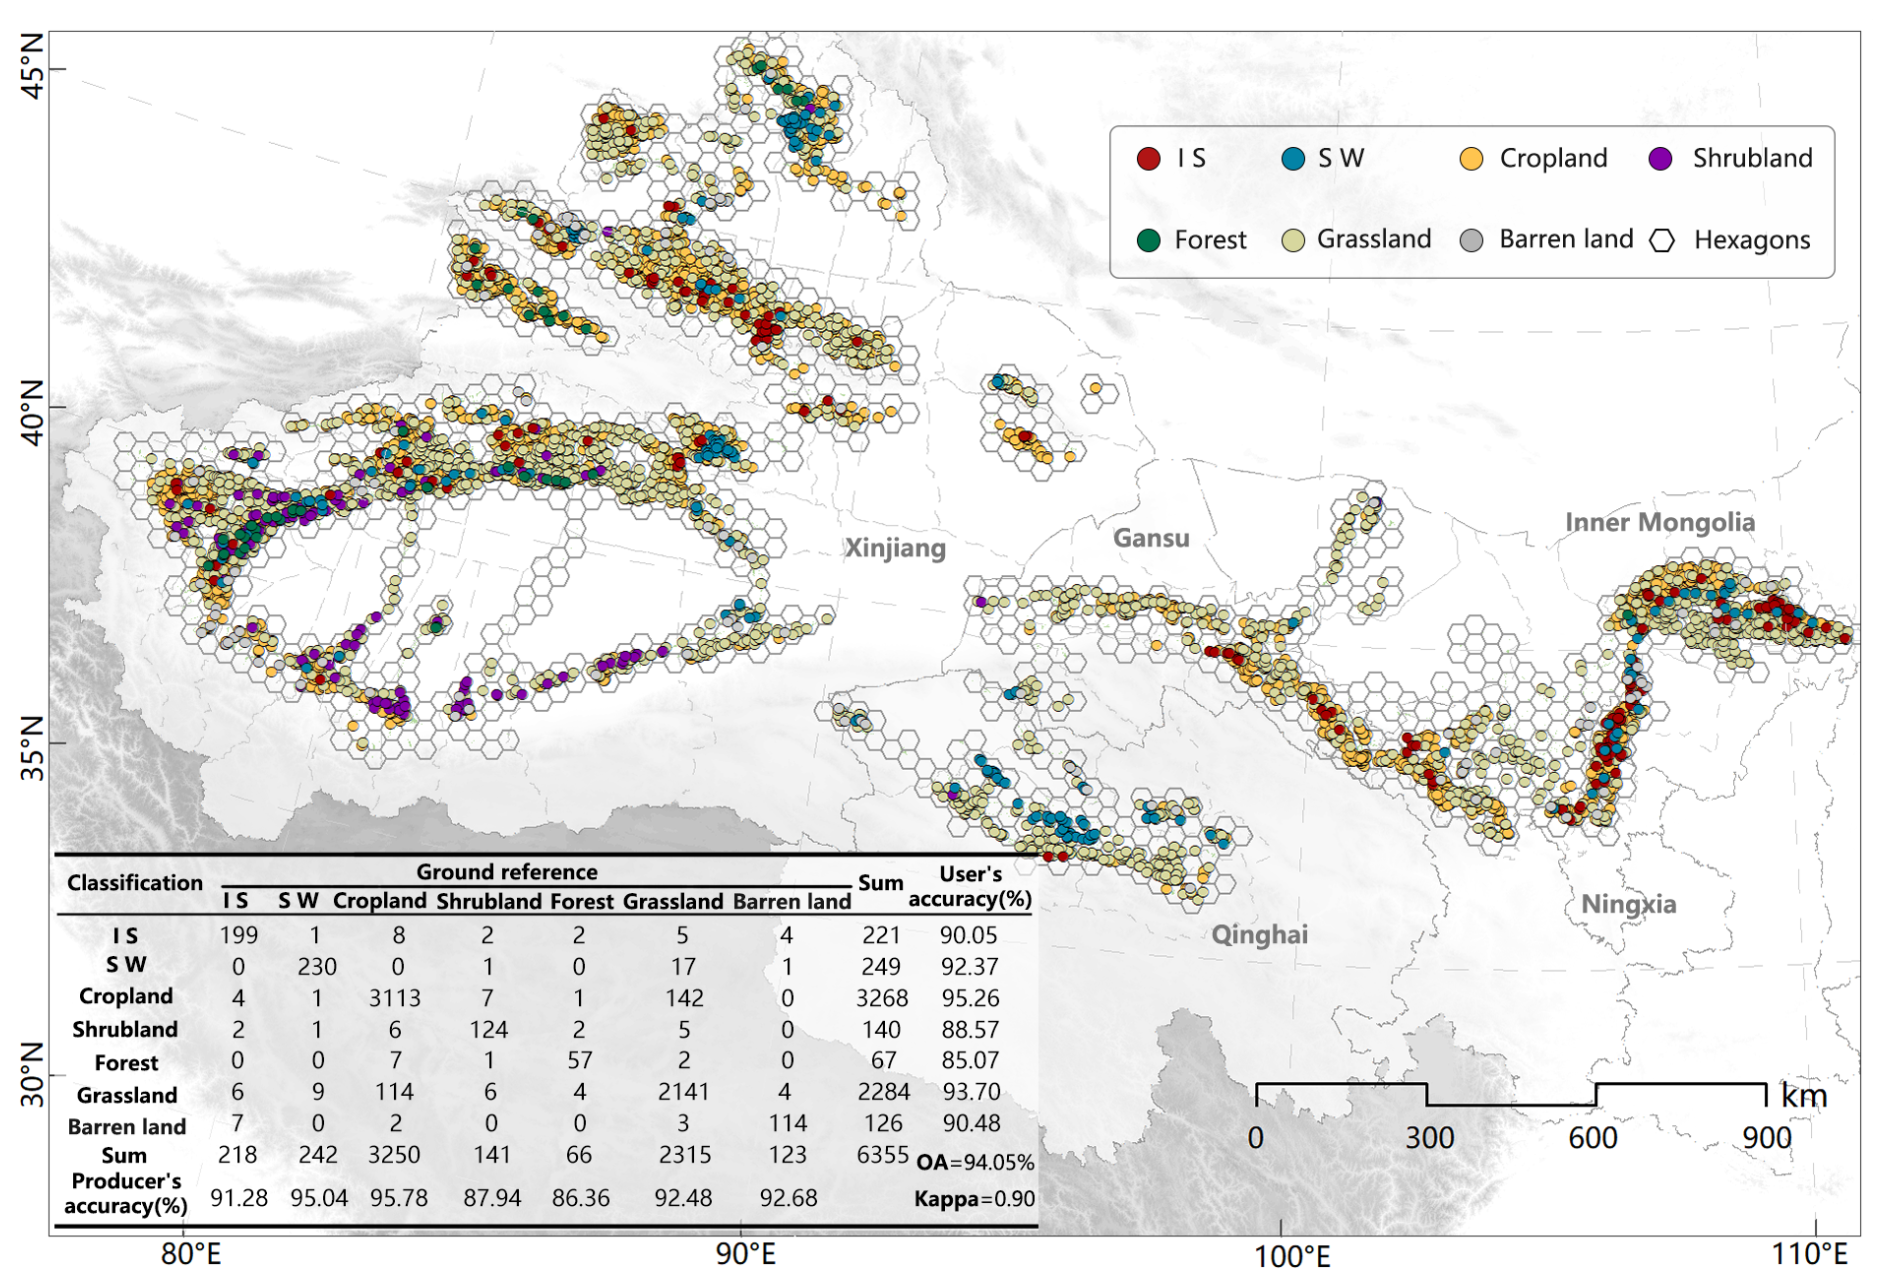
Figure 2Accuracy assessment of the OasisMap30 dataset based on visually interpreted samples (taking the year 2024 as an example). I S: Impervious surface; S W: Surface water.
3.2 Comparison with existing Land cover datasets
Cross-dataset comparisons show that, for oasis regions in China, OasisMap30 exhibited substantially higher overall accuracy (93.64 % in 2022) than CLCD (75.72 %), ALCC (71.16 %), GLC_FCS30 (74.13 %), ESACCI_LC (66.22 %) and MCD12Q1 (50.55 %) (Tables S6–S30). For each land cover category, OasisMap30 achieved higher and more stable F1 scores compared to datasets such as CLCD, ALCC, GLC_FCS30, and ESACCI_LC (Fig. S3). OasisMap30 also showed a good ability to capture fine-scale details of oasis land cover (Fig. 3). We further evaluated the accuracy of OasisMap30 using Geo-Wiki test samples (Table S31). The results showed that OasisMap30 achieves an overall accuracy of 74.36 %, substantially higher than that of the other datasets (50.09 %–64.31 %). For individual land cover classes, OasisMap30 also showed consistently higher classification accuracy than the five comparison datasets.
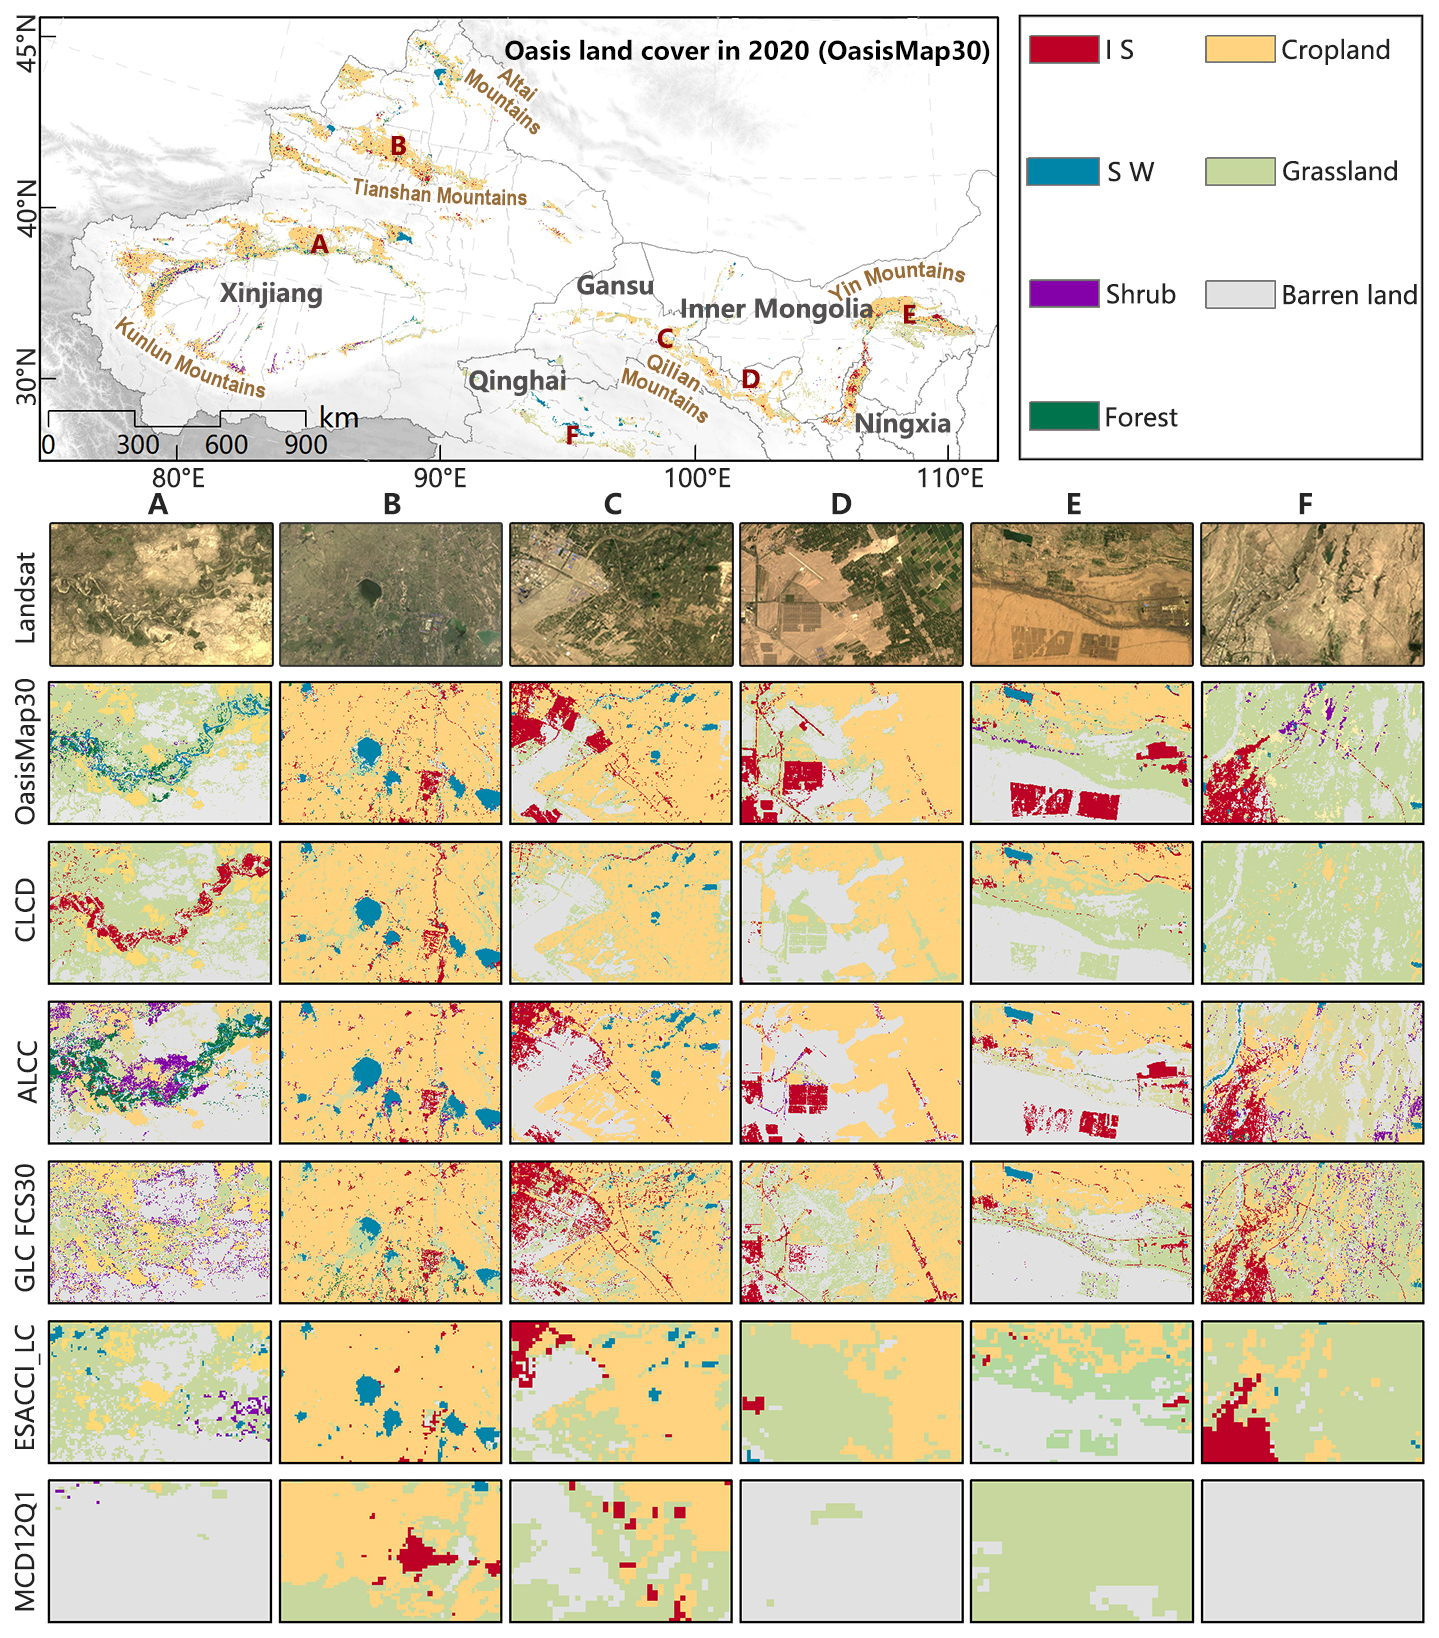
Figure 3Regional comparison of oasis land-cover products. The first row shows Landsat imagery. The second to sixth rows show the spatial distribution of oasis land cover from OasisMap30 and five existing land-cover datasets. I S: Impervious surface; S W: Surface water. All the Landsat images are freely provided by USGS.
3.3 Comparison with other 30 m thematic products
Based on the GISA and GAIA datasets, we found that the impervious surface area within oasis regions exhibited a gradual expansion trend between 1987 and 2024, at rates of 0.014 and 0.037 Mha yr−1, respectively (Fig. 4). The statistical results from OasisMap30 demonstrate good consistency with those from the two datasets (0.019 Mha yr−1). Moreover, the trends in cropland and surface water changes estimated by OasisMap30 also exhibit well agreement with the results from thematic datasets. We did not conduct comparative analyses for grasslands due to the lack of a 30 m resolution grassland thematic dataset covering China's oasis regions. However, validation results based on visually interpreted samples and third-party test samples provide evidence that the grassland classification within OasisMap30 exhibits a high accuracy (Tables S6–S11 and S31).
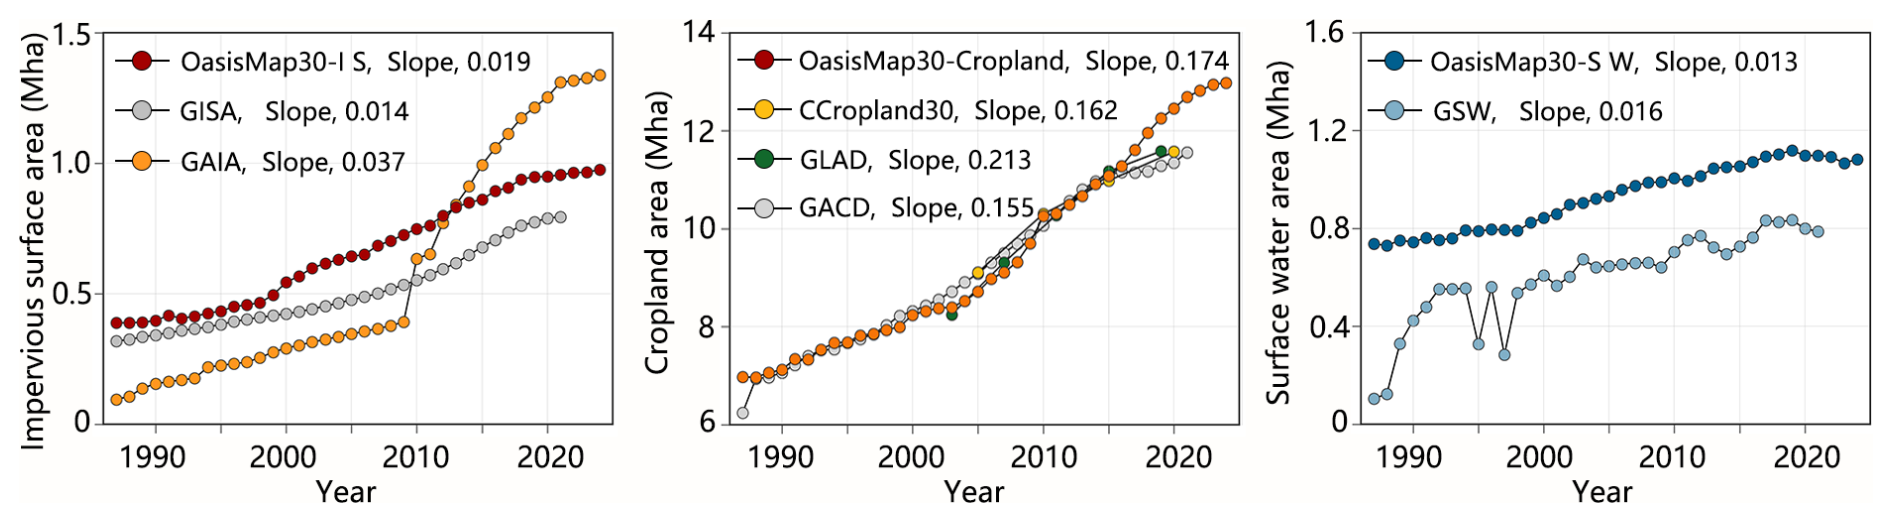
Figure 4Comparison of temporal changes in different land cover areas of Chinese oases between OasisMap30 and various thematic datasets from 1987 to 2024. I S: Impervious surface; S W: Surface water.
3.3.1 Comparison with the spatial distribution of cropland thematic data
We assessed the accuracy of OasisMap30 in capturing the spatial dynamics of cropland through inter-comparison with GLAD, CCropland30, and CACD data (Fig. 5). The scatter plot in Fig. 5 shows the fraction of cropland after aggregating 30 m data into 0.05° × 0.05° spatial grids. It was found that OasisMap30-cropland showed high consistency with CLAD, CCropland30, and CACD data in spatial distribution (0.88 < R2 < 0.93), indicating that OasisMap30 has a high reliability in cropland classification.
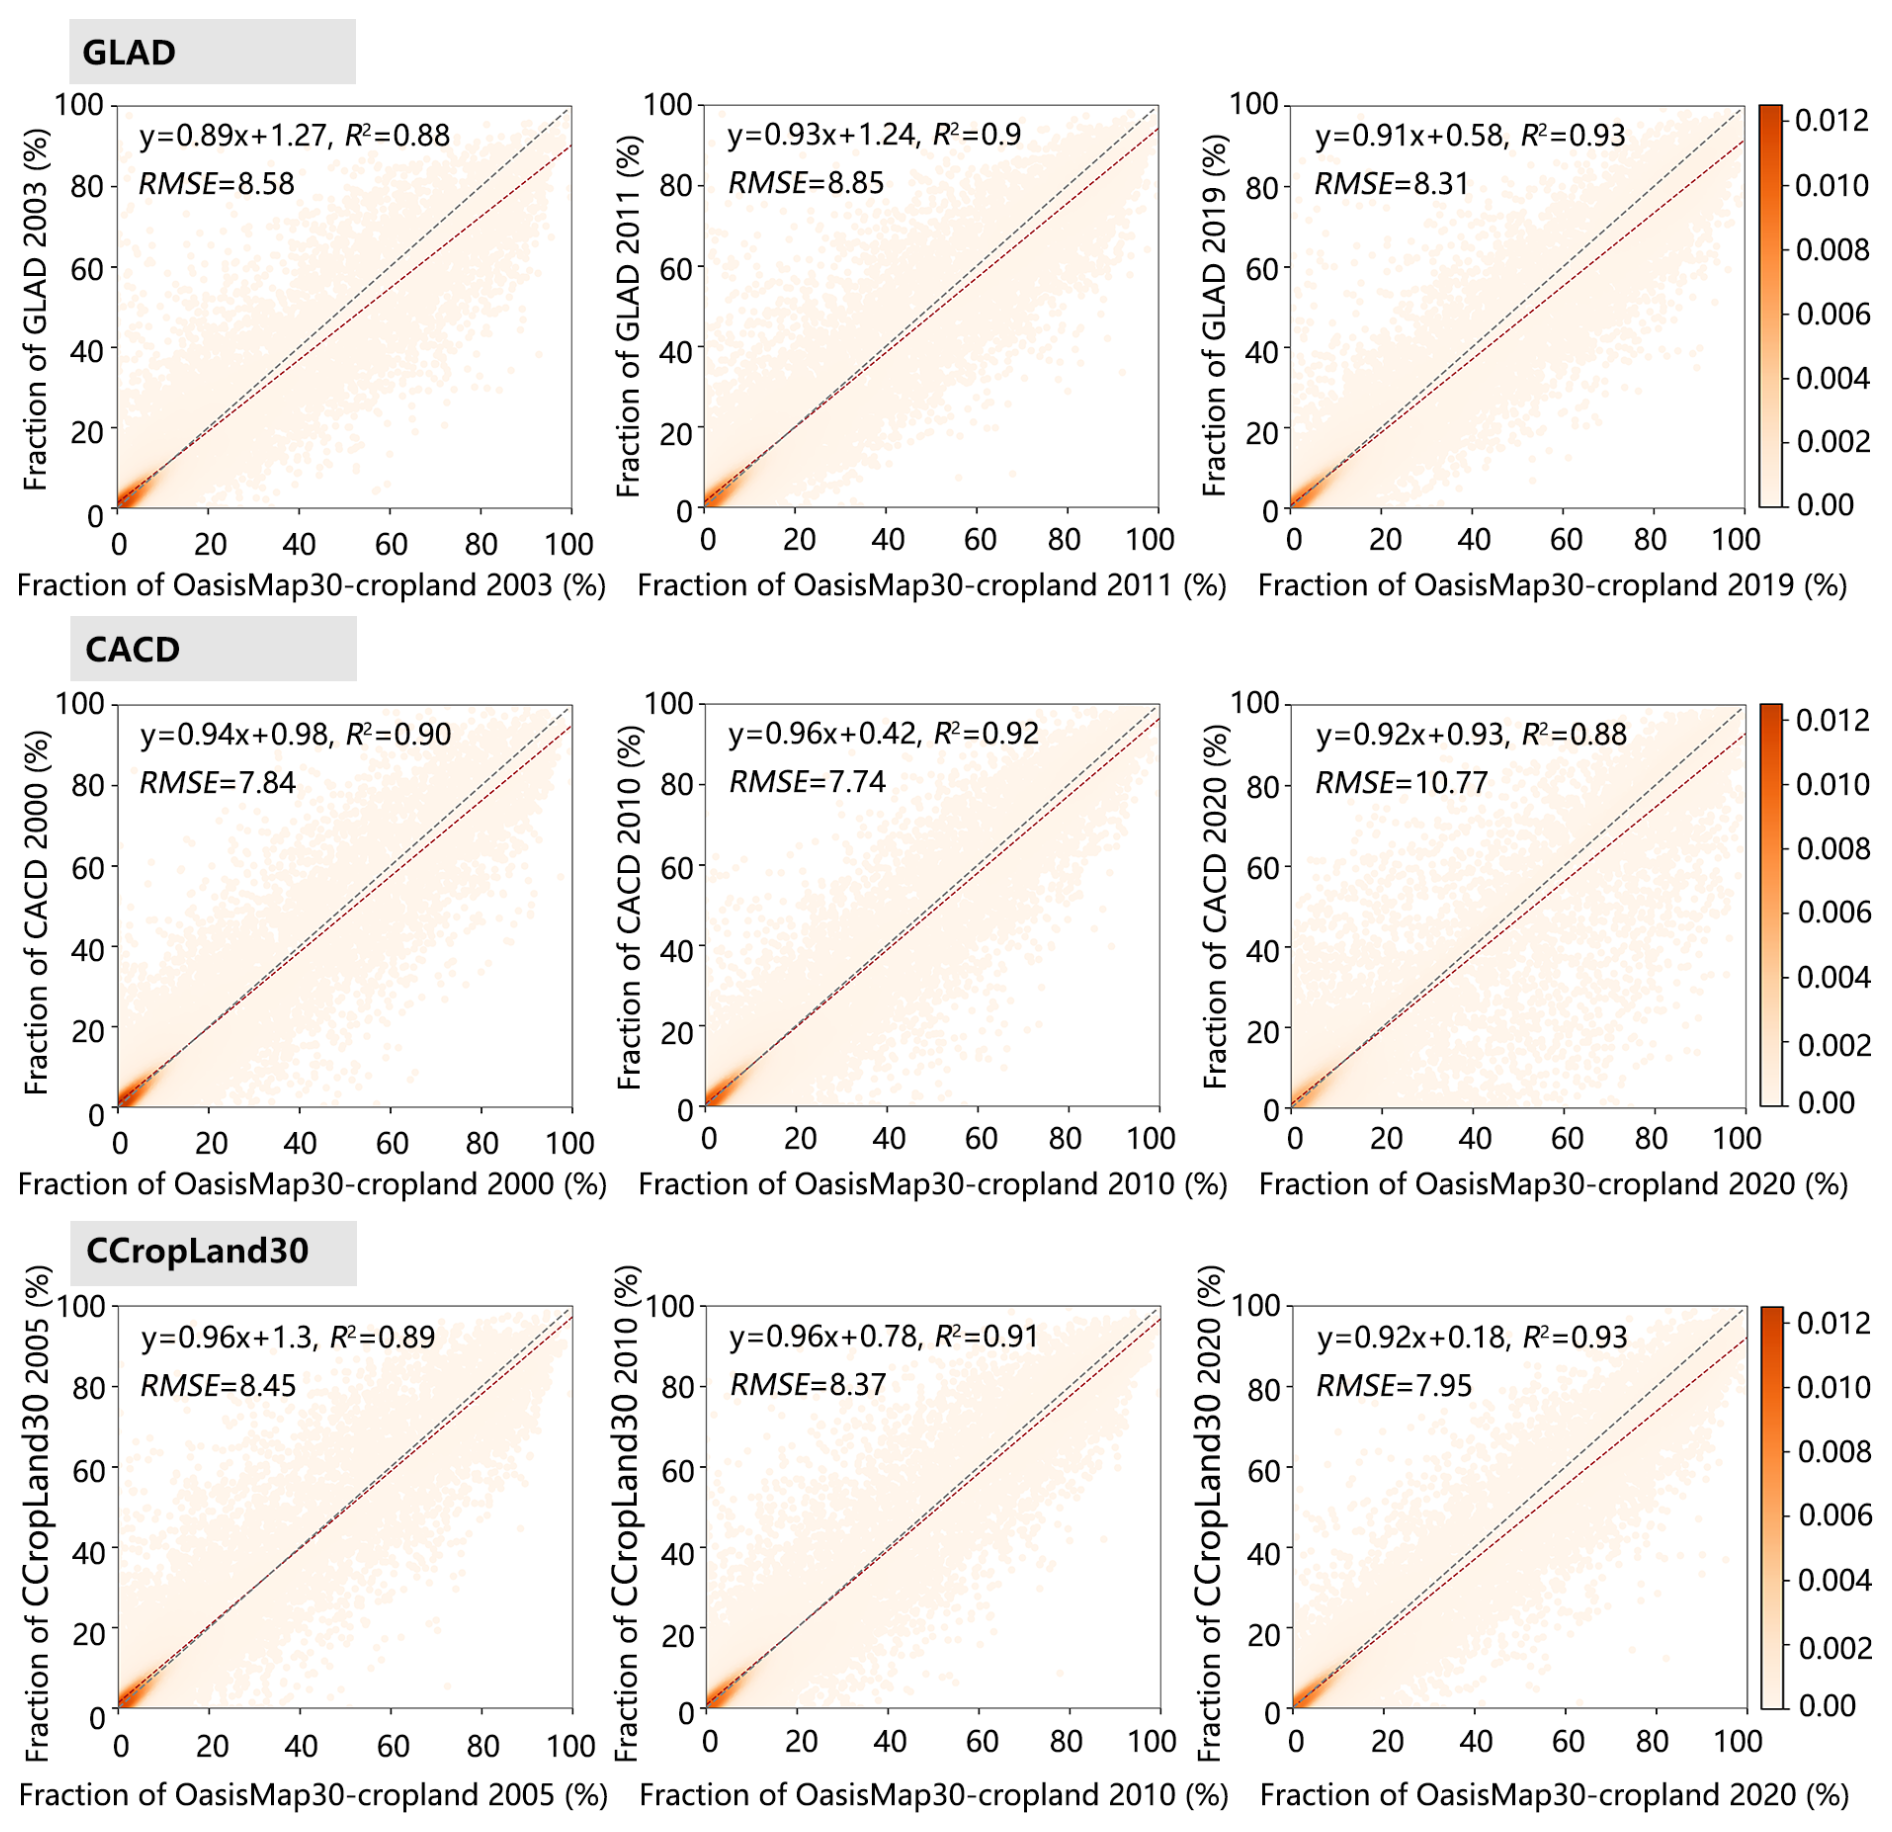
Figure 5Scatter plots of cropland fraction between the OasisMap30, GLAD, CACD and CCropland30. Cropland fraction was aggregated within the 0.05° × 0.05° spatial grid.
3.3.2 Comparison with the spatial distribution of surface water thematic data
Surface water trends in oasis regions over the past decades exhibit substantial spatial heterogeneity due to the comprehensive implications of human activities and climate change. We aggregated the surface water fraction of OasisMap30 and GSW data into 0.05° × 0.05° spatial grids, and then assessed the accuracy of OasisMap30 in identifying oasis surface water dynamics (Fig. 6). High decision coefficients (0.8 < R2 < 0.88) indicate strong consistency between OasisMap30-Water and GSW data.
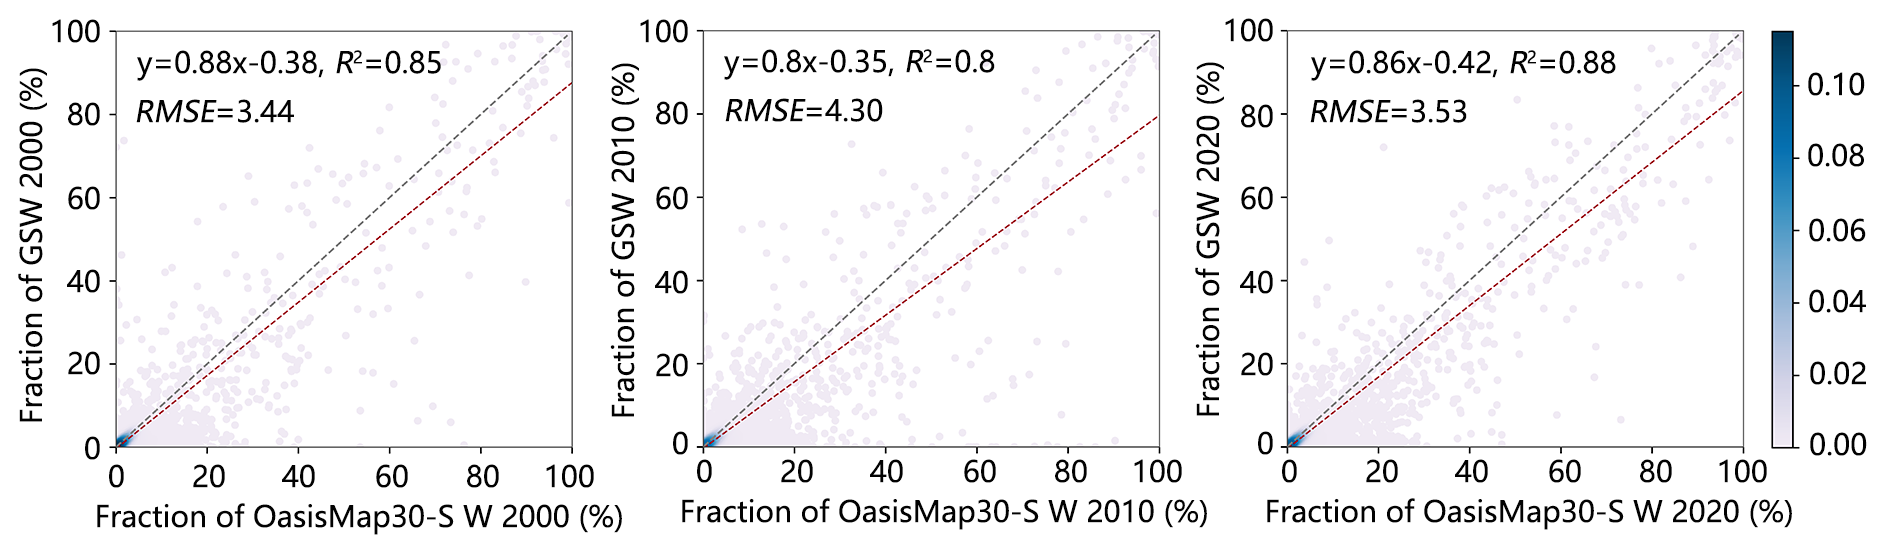
Figure 6Scatterplots of surface water fraction between the OasisMap30 and GSW. Surface water fraction was aggregated within the 0.05° × 0.05° spatial grid. S W: Surface water.
3.3.3 Comparison with the spatial distribution of impervious surface thematic data
The area of impervious surfaces serves as a key indicator for urbanization. With rapid economic development, the urbanization level in China's oasis regions has gradually increased. We assessed the accuracy of impervious surface in OasisMap30 through inter-comparison o with impervious surface thematic datasets (Fig. 7). By calculating the impervious surface fraction within 0.05° × 0.05° spatial grids, we found high consistency between OasisMap30 with GAIA and GISA (0.62 < R2 < 0.85). Moreover, the R2 between OasisMap30-IS and two products exceeded 0.84 in 2020, indicating the reliability of OasisMap30.
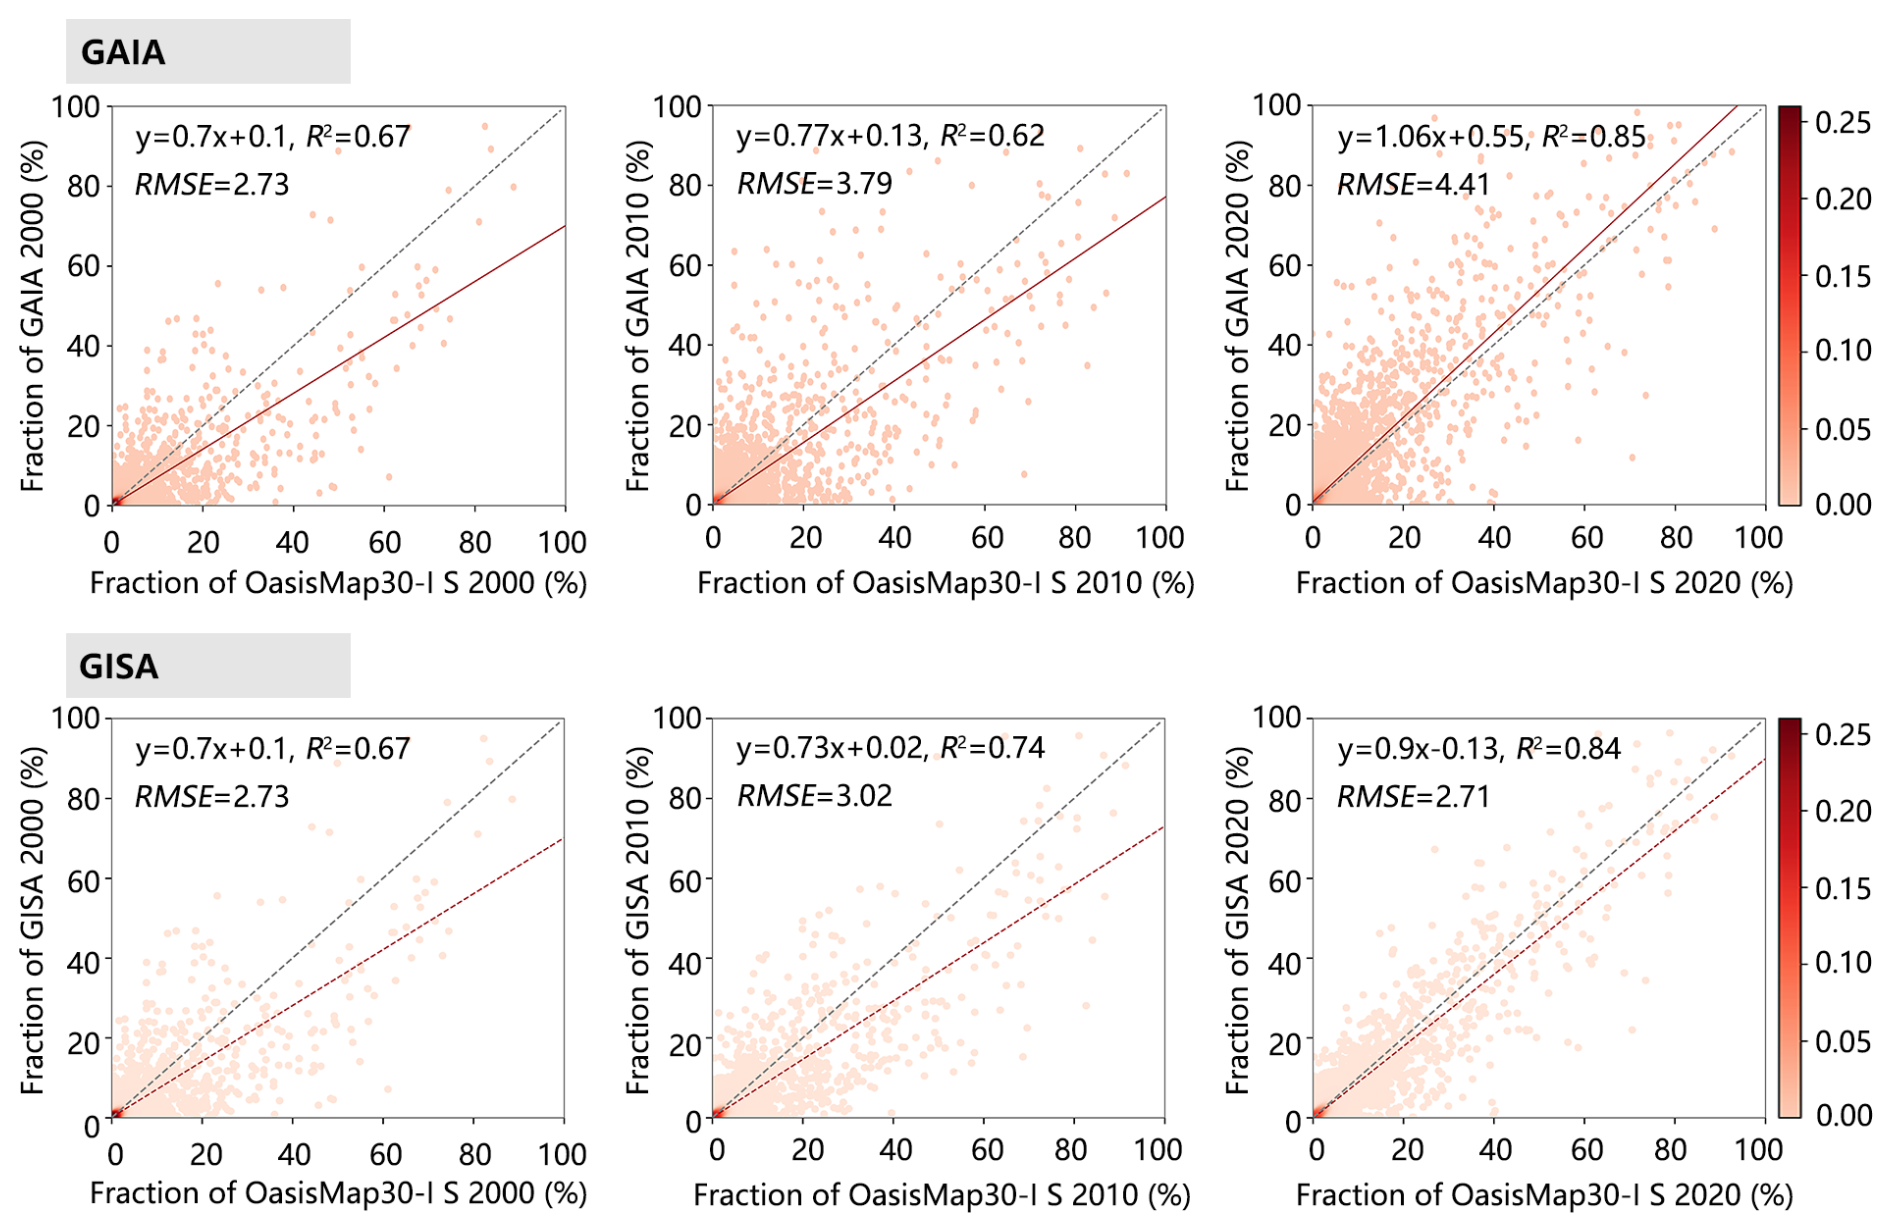
Figure 7Scatterplots of impervious surface fraction between the OasisMap30, GAIA and GASA. Impervious surface fraction was aggregated within the 0.05° × 0.05° spatial grid. I S: Impervious surface.
4.1 Dynamics of land cover in China's oases from 1987 to 2024
Over the past few decades, Chinese oases have undergone rapid expansion. Between 1987 and 2024, oasis area increased from 16.89 to 24.65 Mha, at a rate of 0.22 Mha yr−1 (Fig. 8a). Among land cover types, cropland exhibited the fastest expansion rate, followed by impervious surfaces. To compensate for the loss of large areas of high-quality cropland in southern China and to safeguard national food security under increasing population pressure, oases and the surrounding deserts, which are among important strategic reserve lands in China, have been extensively converted to cropland (Kuang et al., 2022). Statistics derived from OasisMap30 show that cropland area within oases expanded from 6.97 to 12.98 Mha during this period, at a rate of 0.17 Mha yr−1. Due to the high expansion rate, cropland gradually replaced grassland to become the largest land cover type within oases. The implementation of several livelihood-related policies has also accelerated the urbanization process in oasis areas (Fig. S4), contributing to an expansion of impervious surfaces from 0.39 to 0.97 Mha. Moreover, grassland areas increased from 8.21 to 8.76 Mha at a rate of 0.007 Mha yr−1, while forest and shrubland areas also showed slight growth, attributable to the implementation of ecological restoration projects (Figure S5). Benefiting from glacial melt due to climate warming, increased precipitation, and the construction of reservoirs and hydropower stations (Zhang et al., 2022; Huang et al., 2025), the area of surface water in oasis regions has continuously increased (+0.35 Mha). Notably, the trends in the areas of oases and each land type indicated by OasisMap30 are largely consistent with those of datasets such as CLCD, ALCC, and CLC_FCS30 (Fig. 8).
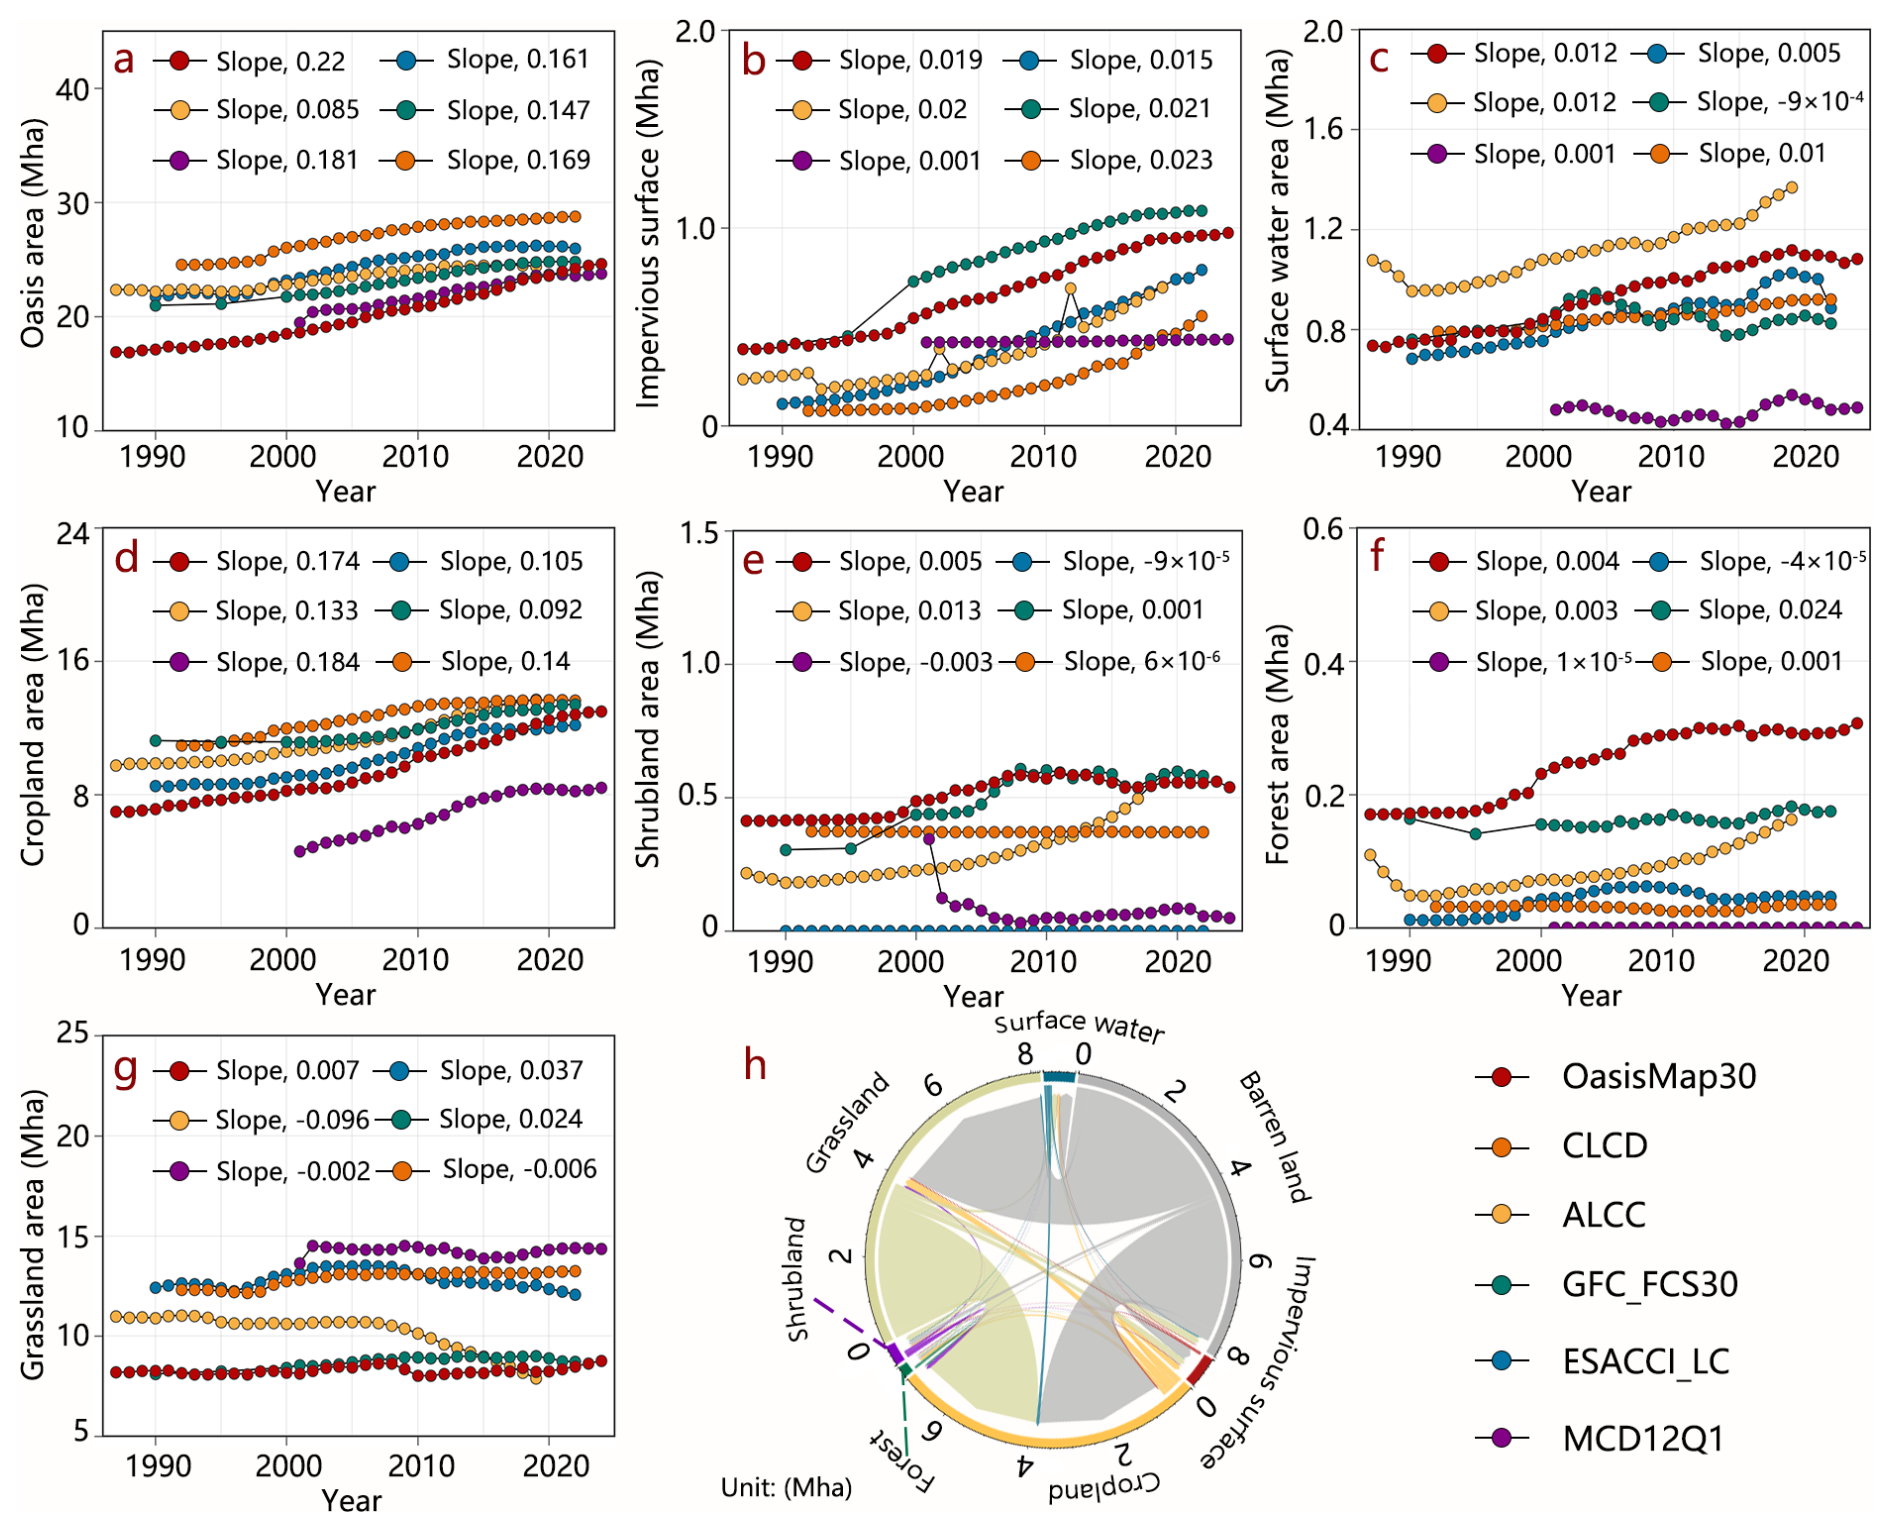
Figure 8Comparison of temporal changes in different land cover areas of Chinese oases between OasisMap30 and various land cover datasets from 1987 to 2024 (a–g); Changes of seven land cover types during the period of 1987–2024 in oasis of China.
At the provincial level, oases are unevenly distributed across five provinces. Xinjiang has the largest oasis area among the five provinces, accounting for 66.24 % of the total oasis area in China by 2024, followed by Inner Mongolia, Gansu, Qinghai, and Ningxia (13.74 %, 10.84 %, 5.14 %, and 4.04 %, respectively) (Fig. S5). Xinjiang not only ranks first among provinces in terms of cropland expansion, but also shows the fastest increase in impervious surface area, driven by the rapid sprawl of cities like Urumqi over recent decades (Wu et al., 2025). Qinghai exhibited the fastest expansion rate of surface water area. With the warming and moistening climate, inflow runoff to the principal lakes of the Qaidam Basin has progressively increased, resulting in a rapid expansion of surface water area at a rate of 0.006 Mha yr−1 in the Qinghai oasis region (Lu et al., 2025). The Inner Mongolia Autonomous Region saw the largest net increase in grassland area (0.91 Mha), which can be primarily attributed to the successful reversal of desertification in desert regions such as Kubuqi (Chen et al., 2022).
Based on the OasisMap30 dataset, we further revealed the process of land-cover conversion in oasis regions. Overall, grassland restoration contributed the most to the expansion of oasis areas, followed by the cropland reclamation (Fig. 8h). Between 1987 and 2024, 4.04 Mha of barren land was successfully restored to grassland, accounting for 50.56 % of the oasis's newly expanded area. Concurrently, 3.19 Mha of barren land was cultivated to cropland, accounting for 39.94 % of the oasis expansion. With the expansion of cropland and grassland, many previously scattered and isolated oases in northwest China gradually expanded and merged into a contiguous oasis belt, demonstrating a representative pattern of oasis evolution in China (Fig. S6).
Within the oasis, land cover transitions are widely recorded. The largest land cover conversion pattern is grassland converted to cropland. During this period, 3.12 Mha of grassland within the oasis were converted to cropland, which resulted in cropland gradually surpassing grassland to become the dominant land cover type within oases. A total of 45.00 % of the impervious surface area gain came from barren land (such as the rapidly expanding photovoltaic panels in regions like Kubuqi and the Hexi Corridor) (Xia et al., 2024), while 52.21 % came from the grassland and cropland (e.g., Ganzhou, Zhangye) (Zhou et al., 2015; Liu et al., 2019). The expansion of surface water primarily stems from grasslands (24.63 %) and barrens (60.94 %). This conversion is highly correlated with the warming and moistening trend in northwest China, where accelerated glacial melting and gradually increasing precipitation have provided more water resources to oasis regions (Yao et al., 2022). Ecological water conveyance engineering (such as those for the Juyan Lake and Taitema Lake) also played a positive role in the expansion of surface water area (Wang et al., 2019; Ling et al., 2020). Overall, OasisMap30 performs excellently in capturing land cover changes, and can provide valuable support for studies on human-environment relationships, water-food-ecosystem nexus, and environmental sustainability in oasis regions.
4.2 Value and potential applications of OasisMap30
This study developed a long-term, high-spatial-resolution land-cover dataset for Chinese oases based on an annual mapping framework for oasis regions. Compared with existing continuous land-cover products, OasisMap30 has several clear advantages for long-term oasis mapping. the 30 m spatial resolution enables it to better capture fragmented land-cover patterns in oasis regions. Within oases, cropland, grassland, surface water, impervious surfaces, and barren land are often form a complex mosaic, making it difficult for coarse-resolution products to accurately characterize fine-scale land-cover patterns (Yang and Huang, 2021a). Meanwhile, the LandTrendr–PCA based disturbance detection framework can help reduce error propagation in long-term high-spatio-temporal-resolution mapping. The LandTrendr–PCA method integrates surface disturbance signals from multiple indicators, thereby reducing error propagation during annual mapping (Mugiraneza et al., 2020). By combining random forest classification with this method, temporal consistency can be improved while preserving spatial detail. Therefore, this framework is therefore particularly suitable for oasis regions, where land-cover changes are substantial and landscape patterns are complex.
Overall, OasisMap30 shows strong capability in capturing land-cover changes. The dataset provides fundamental data for studies on oasis expansion, land-cover transitions, and their eco-hydrological effects, and also provides valuable support for research on human-environment relationships, the water-food-ecosystem nexus, and environmental sustainability in oasis regions.
4.3 Limitations and prospects
Due to differences between the Landsat 5 TM, 7 ETM+ and 8 OLI sensors, as well as the lack of high-quality remote sensing imagery in earlier years (Figs. S7 and S8), we used remote sensing images from adjacent years when suitable imagery was unavailable for the target year. This may have resulted in some land cover changes being overlooked. Spatially, there may be variations in mapping accuracy across different regions. Due to the extremely sparse vegetation in oasis-desert buffer zones, delineating oasis boundaries only with Landsat imagery can be challenging. Consequently, some sparsely vegetated buffer zones may be misclassified as barren. Moreover, the dispersion of YOD between different indicators based on the LandTrendr algorithm may affect mapping accuracy. In addition, precipitation and water availability in arid regions often exhibit strong interannual fluctuations, which may affect vegetation and water related spectral signals. As a result, some abrupt spectral changes may not indicate land-cover change. To reduce this effect, we integrated disturbance information from multiple indicators through the LandTrendr–PCA framework rather than relying on abrupt changes in a single index. Nevertheless, climate-driven spectral anomalies may still contribute to uncertainty in annual land-cover mapping. Although visual interpretation helped reduce inevitable land-cover misclassification, complete error correction cannot be guaranteed. In the future, the increased availability of field-based land cover survey data, combined with optical and high-resolution remote sensing imagery, will facilitate more precise delineation of oasis boundaries. In addition, the integration of the USGS Landsat global archive will provide more historical Landsat imagery for the GEE platform. As the availability of high-quality Landsat images increases, the accuracy of oasis mapping will be further improved.
The OasisMap30 product generated in this study can be accessed at https://doi.org/10.6084/m9.figshare.30798032 (Chen et al., 2025). Landsat SR, SRTM, MCD12Q1, GLAD, and GSW (v1.2) were acquired from the Google Earth Engine (available at http://code.earthengine.google.com, last access: 9 December 2025). CLCD and GLC_FCS30 were provided by Wuhan University (available at https://doi.org/10.5281/zenodo.4417810, Yang and Huang, 2021b) and Aerospace Information Research Institute, Chinese Academy of Sciences (available at https://doi.org/10.5281/zenodo.3986872, Liangyun et al., 2020). The ESACCI_LC was assessed from the European Space Agency climate office (available at https://doi.org/10.24381/cds.006f2c9a, Copernicus Climate Change Service, 2019). The GISA and GAIA were obtained from the Wuhan University (available at https://doi.org/10.5281/zenodo.5136330, Huang et al., 2021b) and Tsinghua University (available at https://doi.org/10.6084/m9.figshare.27245775, Peng, 2024). The CACD and CCropland30 were provided by Tsinghua University (available at https://doi.org/10.5281/zenodo.7936885, Tu et al., 2023) and National Tibetan Plateau Data Center (available at https://doi.org/10.11888/Terre.tpdc.301077, Zhang, 2024).
Oases represent the most productive yet also the most ecologically fragile regions in drylands, serving as the core areas for human production, livelihoods and economic development. Given their importance, a high spatio-temporal resolution land cover dataset is essential for understanding patterns of oasis evolution and their ecological impacts. This study developed a new framework for high spatio-temporal resolution land cover mapping and produced an annual 30 m resolution land-cover dataset for Chinese oases (namely OasisMap30). Accuracy assessments and comparisons with other datasets show that OasisMap30 performs well in terms of both reliability and capturing the dynamic changes in oases. Based on OasisMap30, we found that Chinese oases have undergone rapid expansion in recent decades. Between 1987 and 2024, oasis area increased from 16.89 to 24.64 Mha at a rate of 0.22 Mha yr−1, with cropland expansion and grassland restoration being the main drivers of this gradual growth. In addition, we also observed large-scale land-cover conversions within oases, such as 3.12 Mha of grassland converted to cropland. The 30 m resolution OasisMap30 dataset is expected to provide important support for oasis landscape planning, water resource management, and research on socio-ecological interactions in drylands.
The supplement related to this article is available online at https://doi.org/10.5194/essd-18-3289-2026-supplement.
PC and SW designed the research, PC conducted the research and wrote the initial draft, PC and QT reviewed and edited the paper before submission. All authors participated in the review and discussion of the manuscript.
The contact author has declared that none of the authors has any competing interests.
Publisher's note: Copernicus Publications remains neutral with regard to jurisdictional claims made in the text, published maps, institutional affiliations, or any other geographical representation in this paper. The authors bear the ultimate responsibility for providing appropriate place names. Views expressed in the text are those of the authors and do not necessarily reflect the views of the publisher.
The authors are grateful to all the data contributors who made it possible to complete this research.
This work was supported by the National Natural Science Foundation of China (grant no. W2412142), the Fundamental Research Funds for the Central Universities (grant no. SWU-KQ 25002), the State Key Laboratory of Earth Surface Processes and Disaster Risk Reduction (grant no. 2025-KF-04), and the Sichuan Science and Technology Program (grant no. 2025ZNSFSC1160).
This paper was edited by Peng Zhu and reviewed by three anonymous referees.
Baig, M. H. A., Zhang, L., Shuai, T., and Tong, Q.: Derivation of a tasselled cap transformation based on Landsat 8 at-satellite reflectance, Remote Sens. Lett., 5, 423–431, https://doi.org/10.1080/2150704X.2014.915434, 2014.
Breiman, L.: Random Forests, Mach. Learn., 45, 5–32, https://doi.org/10.1023/A:1010933404324, 2001.
Chen, P., Wang, S., Song, S., Wang, Y., Wang, Y., Gao, D., and Li, Z.: Ecological restoration intensifies evapotranspiration in the Kubuqi Desert, Ecol. Eng., 175, 106504, https://doi.org/10.1016/j.ecoleng.2021.106504, 2022.
Chen, P., Wang, S., Liu, Y., Wang, Y., Song, J., Tang, Q., Yao, Y., Wang, Y., Wu, X., Wei, F., and Feng, S.: Spatio-Temporal Dynamics of Aboveground Biomass in China's Oasis Grasslands Between 1989 and 2021, Earths Future, 12, e2023EF003944, https://doi.org/10.1029/2023EF003944, 2024a.
Chen, P., Tang, Q., Liu, Y., Luo, Y., Cheng, L., Xu, W., Wang, Y., and Wang, S.: OasisMap30: A 30 m annual land cover dataset of China's oases from 1987 to 2024, figshare [data set], https://doi.org/10.6084/m9.figshare.30798032, 2025.
Chen, Y., Fang, G., Li, Z., Zhang, X., Gao, L., Elbeltagi, A., Shaer, H. E., Duan, W., Wassif, O. M. A., Li, Y., Luo, P., Selmi, A., Yu, R., Yang, J., Hu, Y., Liu, C., Long, Y., Malik, I., Fu, A., Wistuba, M., Yang, Y., Zhu, C., and Gao, Y.: The Crisis in Oases: Research on Ecological Security and Sustainable Development in Arid Regions, Annu. Rev. Env. Resour., 49, 1–20, https://doi.org/10.1146/annurev-environ-111522-105932, 2024b.
Copernicus Climate Change Service: Land cover classification gridded maps from 1992 to present derived from satellite observations, accessed on 9 December 2025, Copernicus Climate Change Service (C3S) Climate Data Store (CDS) [data set], https://doi.org/10.24381/cds.006f2c9a, 2019.
Crist, E. P.: A TM Tasseled Cap equivalent transformation for reflectance factor data, Remote Sens. Environ., 17, 301–306, https://doi.org/10.1016/0034-4257(85)90102-6, 1985.
Fritz, S., See, L., Perger, C., McCallum, I., Schill, C., Schepaschenko, D., Duerauer, M., Karner, M., Dresel, C., Laso-Bayas, J.-C., Lesiv, M., Moorthy, I., Salk, C. F., Danylo, O., Sturn, T., Albrecht, F., You, L., Kraxner, F., and Obersteiner, M.: A global dataset of crowdsourced land cover and land use reference data, Sci. Data, 4, 170075, https://doi.org/10.1038/sdata.2017.75, 2017.
Gao, H.: The distribution and types of oases in China, Arid Land Geography, 10, 23–29, 1987 (in Chinese).
Gong, P.: Global Artificial Impervious Area (GAIA), figshare [data set], https://doi.org/10.6084/m9.figshare.27245775.v1, 2024.
Gong, P., Li, X., Wang, J., Bai, Y., Chen, B., Hu, T., Liu, X., Xu, B., Yang, J., Zhang, W., and Zhou, Y.: Annual maps of global artificial impervious area (GAIA) between 1985 and 2018, Remote Sens. Environ., 236, 111510, https://doi.org/10.1016/j.rse.2019.111510, 2020.
Huang, C., Wylie, B., Yang, L., Homer, C., and Zylstra, G.: Derivation of a tasselled cap transformation based on Landsat 7 at-satellite reflectance, Int. J. Remote Sens., 23, 1741–1748, https://doi.org/10.1080/01431160110106113, 2002.
Huang, E., Zhu, G., Meng, G., Wang, Y., Chen, L., Miao, Y., Wang, Q., Shi, X., Zhao, L., Wang, Q., Qi, X., Zhang, X., Jiao, Y., Lu, S., Li, R., and Li, W.: Historical dataset of reservoir construction in arid regions, Sci. Data, 12, 1428, https://doi.org/10.1038/s41597-025-05712-3, 2025.
Huang, X., Li, J., Yang, J., Zhang, Z., Li, D., and Liu, X.: 30 m global impervious surface area dynamics and urban expansion pattern observed by Landsat satellites: From 1972 to 2019, Sci. China Earth Sci., 64, 1922–1933, https://doi.org/10.1007/s11430-020-9797-9, 2021a.
Huang, X., Li, J., Yang, J., Zhang, Z., Li, D., and Liu, X.: 30 m global impervious surface area dynamics and urban expansion pattern observed by Landsat satellites: from 1972 to 2019 (1.0.0), Zenodo [data set], https://doi.org/10.5281/zenodo.5136330, 2021b.
Kennedy, R. E., Yang, Z., and Cohen, W. B.: Detecting trends in forest disturbance and recovery using yearly Landsat time series: 1. LandTrendr – Temporal segmentation algorithms, Remote Sens. Environ., 114, 2897–2910, https://doi.org/10.1016/j.rse.2010.07.008, 2010.
Kuang, W., Liu, J., Tian, H., Shi, H., Dong, J., Song, C., Li, X., Du, G., Hou, Y., Lu, D., Chi, W., Pan, T., Zhang, S., Hamdi, R., Yin, Z., Yan, H., Yan, C., Wu, S., Li, R., Yang, J., Dou, Y., Wu, W., Liang, L., Xiang, B., and Yang, S.: Cropland redistribution to marginal lands undermines environmental sustainability, Natl. Sci. Rev., 9, nwab091, https://doi.org/10.1093/nsr/nwab091, 2022.
Li, B., Liu, X., Zhuang, H., Shi, Q., Zeng, L., Cai, Y., Zhang, H., Cai, Y., Wu, C., and Xu, X.: ALCC: Temporally Consistent Annual Land Cover Maps over China from 1985 to 2022 Based on an Ensemble Change Detection Method, J. Remote Sens., 6, 1029, https://doi.org/10.34133/remotesensing.1029, 2026.
Li, X., Gong, P., and Liang, L.: A 30-year (1984–2013) record of annual urban dynamics of Beijing City derived from Landsat data, Remote Sens. Environ., 166, 78–90, https://doi.org/10.1016/j.rse.2015.06.007, 2015.
Lin, J., Gui, D., Liu, Y., Liu, Q., Zhang, S., and Liu, C.: A high-precision oasis dataset for China from remote sensing images, Sci. Data, 11, 726, https://doi.org/10.1038/s41597-024-03553-0, 2024.
Ling, H., Guo, B., Yan, J., Deng, X., Xu, H., and Zhang, G.: Enhancing the positive effects of ecological water conservancy engineering on desert riparian forest growth in an arid basin, Ecol. Indic., 118, 106797, https://doi.org/10.1016/j.ecolind.2020.106797, 2020.
Liu, Y., Song, W., and Deng, X.: Understanding the spatiotemporal variation of urban land expansion in oasis cities by integrating remote sensing and multi-dimensional DPSIR-based indicators, Ecol. Indic., 96, 23–37, https://doi.org/10.1016/j.ecolind.2018.01.029, 2019.
Liu, L., Zhang, X., Chen, X., Gao, Y., and Mi, J.: GLC_FCS30: Global land-cover product with fine classification system at 30 m using time-series Landsat imagery (Version v1), Zenodo [data set], https://doi.org/10.5281/zenodo.3986872, 2020.
Lu, C., Zhang, Q., Woolway, R. I., Ma, L., Liu, T., Wang, G., Sun, D., Singh, V. P., Bai, Y., Sun, B., and Huang, X.: Global Warming Will Increase the Risk of Water Shortage in Northwest China, Earths Future, 13, e2025EF006199, https://doi.org/10.1029/2025EF006199, 2025.
Mugiraneza, T., Nascetti, A., and Ban, Y.: Continuous Monitoring of Urban Land Cover Change Trajectories with Landsat Time Series and LandTrendr-Google Earth Engine Cloud Computing, Remote Sens., 12, 2883, https://doi.org/10.3390/rs12182883, 2020.
Olofsson, P., Foody, G. M., Herold, M., Stehman, S. V., Woodcock, C. E., and Wulder, M. A.: Good practices for estimating area and assessing accuracy of land change, Remote Sens. Environ., 148, 42–57, https://doi.org/10.1016/j.rse.2014.02.015, 2014.
Pasquarella, V. J., Arévalo, P., Bratley, K. H., Bullock, E. L., Gorelick, N., Yang, Z., and Kennedy, R. E.: Demystifying LandTrendr and CCDC temporal segmentation, Int. J. Appl. Earth Obs., 110, 102806, https://doi.org/10.1016/j.jag.2022.102806, 2022.
Pekel, J.-F., Cottam, A., Gorelick, N., and Belward, A. S.: High-resolution mapping of global surface water and its long-term changes, Nature, 540, 418–422, https://doi.org/10.1038/nature20584, 2016.
Potapov, P., Turubanova, S., Hansen, M. C., Tyukavina, A., Zalles, V., Khan, A., Song, X.-P., Pickens, A., Shen, Q., and Cortez, J.: Global maps of cropland extent and change show accelerated cropland expansion in the twenty-first century, Nat. Food, 1–10, https://doi.org/10.1038/s43016-021-00429-z, 2021.
Roy, D. P., Kovalskyy, V., Zhang, H. K., Vermote, E. F., Yan, L., Kumar, S. S., and Egorov, A.: Characterization of Landsat-7 to Landsat-8 reflective wavelength and normalized difference vegetation index continuity, Remote Sens. Environ., 185, 57–70, https://doi.org/10.1016/j.rse.2015.12.024, 2016.
Sulla-Menashe, D., Gray, J. M., Abercrombie, S. P., and Friedl, M. A.: Hierarchical mapping of annual global land cover 2001 to present: The MODIS Collection 6 Land Cover product, Remote Sens. Environ., 222, 183–194, https://doi.org/10.1016/j.rse.2018.12.013, 2019.
Tu, Y., Wu, S., Chen, B., Weng, Q., Bai, Y., Yang, J., Yu, L., and Xu, B.: A 30 m annual cropland dataset of China from 1986 to 2021 (Version v0), Zenodo [data set], https://doi.org/10.5281/zenodo.7936885, 2023.
Tu, Y., Wu, S., Chen, B., Weng, Q., Bai, Y., Yang, J., Yu, L., and Xu, B.: A 30 m annual cropland dataset of China from 1986 to 2021, Earth Syst. Sci. Data, 16, 2297–2316, https://doi.org/10.5194/essd-16-2297-2024, 2024.
UN: Transforming our world: The 2030 agenda for sustainable development, United Nations, New York, 35 pp., A/RES/70/1, 2015.
Wang, S., Fu, B., Bodin, Ö., Liu, J., Zhang, M., and Li, X.: Alignment of social and ecological structures increased the ability of river management, Sci. Bull., 64, 1318–1324, https://doi.org/10.1016/j.scib.2019.07.016, 2019.
Wei, H., Xu, Z., Liu, H., Ren, J., Fan, W., Lu, N., and Dong, X.: Evaluation on dynamic change and interrelations of ecosystem services in a typical mountain-oasis-desert region, Ecol. Indic., 93, 917–929, https://doi.org/10.1016/j.ecolind.2018.05.051, 2018.
Wu, J., Wang, H., Wang, C., Huang, X., Wang, Z., Zhang, C., Chen, B., Yiming, Y., and Zhou, C.: Which exerts a greater impact on ecosystem resilience: Cropland expansion or urban expansion? Insights from a spatiotemporal analysis, Ecol. Inform., 90, 103314, https://doi.org/10.1016/j.ecoinf.2025.103314, 2025.
Xia, Z., Li, Y., Guo, S., Chen, R., Zhang, W., Guo, X., Zhang, X., and Du, P.: Satellites Reveal Spatial Heterogeneity in Dryland Photovoltaic Plants' Effects on Vegetation Dynamics, Earths Future, 12, e2024EF004427, https://doi.org/10.1029/2024EF004427, 2024.
Xie, Y., Gong, J., Sun, P., and Gou, X.: Oasis dynamics change and its influence on landscape pattern on Jinta oasis in arid China from 1963a to 2010a: Integration of multi-source satellite images, Int. J. Appl. Earth Obs., 33, 181–191, https://doi.org/10.1016/j.jag.2014.05.008, 2014.
Yang, J. and Huang, X.: The 30 m annual land cover dataset and its dynamics in China from 1990 to 2019, Earth Syst. Sci. Data, 13, 3907–3925, https://doi.org/10.5194/essd-13-3907-2021, 2021a.
Yang, J. and Huang, X.: 30 m annual land cover and its dynamics in China from 1990 to 2019 (1.0.0), Zenodo [data set], https://doi.org/10.5281/zenodo.4417810, 2021b.
Yao, J., Chen, Y., Guan, X., Zhao, Y., Chen, J., and Mao, W.: Recent climate and hydrological changes in a mountain–basin system in Xinjiang, China, Earth-Sci. Rev., 226, 103957, https://doi.org/10.1016/j.earscirev.2022.103957, 2022.
Zeng, H., Wu, B., Zhu, W., and Zhang, N.: A trade-off method between environment restoration and human water consumption: A case study in Ebinur Lake, J. Clean. Prod., 217, 732–741, https://doi.org/10.1016/j.jclepro.2018.12.284, 2019.
Zhang, J., Wang, S., He, Y., Ren, Y., and Huang, J.: Contribution of the Precipitation-Recycling Process to the Wetting Trend in Xinjiang, China, J. Geophys. Res.-Atmos., 127, e2021JD036407, https://doi.org/10.1029/2021JD036407, 2022.
Zhang, L.: CCropLand30: High-resolution hybrid cropland maps of China, National Tibetan Plateau/Third Pole Environment Data Center [data set], https://doi.org/10.11888/Terre.tpdc.301077, 2024.
Zhang, L., Wang, W., Ma, Q., Hu, Y., Ma, H., and Zhao, Y.: CCropLand30: High-resolution hybrid cropland maps of China created through the synergy of state-of-the-art remote sensing products and the latest national land survey, Comput. Electron. Agr., 218, 108672, https://doi.org/10.1016/j.compag.2024.108672, 2024.
Zhang, X., Liu, L., Chen, X., Gao, Y., Xie, S., and Mi, J.: GLC_FCS30: global land-cover product with fine classification system at 30 m using time-series Landsat imagery, Earth Syst. Sci. Data, 13, 2753–2776, https://doi.org/10.5194/essd-13-2753-2021, 2021.
Zhou, D., Wang, X., and Shi, M.: Human Driving Forces of Oasis Expansion in Northwestern China During the Last Decade—A Case Study of the Heihe River Basin, Land Degrad. Dev., 28, 412–420, https://doi.org/10.1002/ldr.2563, 2017.
Zhou, S., Huang, Y., Yu, B., and Wang, G.: Effects of human activities on the eco-environment in the middle Heihe River Basin based on an extended environmental Kuznets curve model, Ecol. Eng., 76, 14–26, https://doi.org/10.1016/j.ecoleng.2014.04.020, 2015.
Zhu, Z.: Change detection using landsat time series: A review of frequencies, preprocessing, algorithms, and applications, ISPRS J. Photogramm., 130, 370–384, https://doi.org/10.1016/j.isprsjprs.2017.06.013, 2017.