the Creative Commons Attribution 4.0 License.
the Creative Commons Attribution 4.0 License.
 | 12 May 2026
A new dataset of Mesoscale Convective Complexes (MCC) derived from FY-2G satellite data
Shuyun Zhao
Jianchuan Shu
Wuke Wang
Qimin Deng
Zaheer Ahmad Babar
Mesoscale Convective Complexes (MCCs) are major convective weather systems occurring in midlatitude regions, typically associated with significant weather phenomena such as heavy rainfall, thunderstorms, strong winds, and hail. Based on the cloud-top temperature (CTT) data of the FY-2G satellite, and through multi-threshold screening combined with morphological analysis, an automated algorithm for MCC identification and tracking was developed. The algorithm is then applied to generate an hourly dataset of MCC variables over mainland China from June 2015 to December 2024. The dataset encompasses variables describing the spatial extent of the cold-core region (CTT < −52 °C) of MCCs, the minimum cloud-top temperature within the cold cloud shields, and the geographic coordinates (longitude and latitude) of the centroids of the cold cloud shields. This work also conducts a preliminary analysis of the spatial and temporal distribution characteristics of MCCs over mainland China based on the dataset. Results indicate that MCCs occur more frequently in Southwest China than in other regions of the country, and over 70 % of MCC events occur in summer both in Southwest China and mainland China as a whole. Moreover, MCC frequency in Southwest China exhibits significant interannual variability. The dataset is publicly available at https://doi.org/10.5281/zenodo.17349888 (Xu, 2025).
- Article
(6043 KB) - Full-text XML
- BibTeX
- EndNote


MCCs represent an important class of organized deep convection characterized by large (meso-α scale), long-lived, and circular cloud shields (Schumacher and Rasmussen, 2020). MCCs form through the merger of multiple thunderstorms, often persist for 6–12 h, and typically produce widespread heavy precipitation and severe weather (Houze, 1977; Cotton and Anthes, 1989). MCCs play a significant role in the global hydrological cycle and frequently cause damaging floods through prolonged rainfall (Maddox, 1980). It was found that 91 % of major floods in East Asia are linked to meso-scale convective systems (Ding et al., 2023).
Previous studies have conducted extensive and systematic research on MCCs, based on manual census. Augustine and Howard (1991) documented MCC activity during 1985–1987 in North America using digitized satellite imagery, significantly advancing understanding of MCC structure and evolution in the region. Prior researches have also investigated MCCs in South America, the western Pacific, the Indian subcontinent and Africa, respectively, thoroughly documenting the climatological characteristics of MCCs in these regions (Velasco and Fritsch, 1987; Miller and Fritsch, 1991; Silva Dias and Ferreira, 1992; Laing and Fritsch, 1993; Le Barbé et al., 2002; Blamey and Reason, 2012; Febrizky et al., 2023). It is indicated in these research that MCCs exhibit distinct nocturnal characteristics, primarily forming over continental regions and preferentially occurring on the leeward or downwind sides of large-scale elevated terrain, such as plateaus and major mountain ranges, with lifetimes of 8–14 h (Machado et al., 1992; Machado and Rossow, 1993; Machado et al., 1998; Mathon and Laurent, 2001; Houze, 2012). Abisusmita et al. (2023) investigated three MCC events that occurred in South Sulawesi during 2018–2020, all located over the Makassar Strait, and revealed that their variation was jointly influenced by the Southern Oscillation, the Madden–Julian Oscillation, and sea surface temperature anomalies.
Southwest China – encompassing the provinces of Sichuan, Guizhou, and Yunnan, along with Chongqing Municipality – exhibits complex topography and a pronounced monsoon climate. Frequent summertime MCCs in this region often produce heavy rainfall that triggers severe mountain hazards, underscoring the critical need to quantify their hydrometeorological characteristics for improved disaster risk reduction (Hua et al., 2020; Zhang et al., 2025). While numerous studies have investigated MCCs over Southwest China, the majority rely on case analysis or labor-intensive manual surveys, which are often constrained by limited temporal coverage and spatial extent. Jing et al. (2014) manually identified MCCs over China from 2005 to 2011 using FY-2 satellite imagery and MICAPS data, and performed a comprehensive analysis of their spatiotemporal distributions and meteorological characteristics. Their results show that MCCs are predominantly concentrated in the Yunnan-Guizhou-Guangxi-Guangdong region, where they exhibit a pronounced noctural frequancy maximum in June and July. These convective systems are closely associated with heavy rainfall, often leading to flooding.
The aforementioned studies on MCCs have predominantly relied on manual identification methods, typically involving the analysis of enhanced infrared imagery. While this approach is considered reliable, it is inherently labor-intensive and time-consuming, rendering it impractical for generating long-term, large-scale MCC datasets. Laing and Fritsch (1993) employed a computerized MCC program, with pixeled cloud shield temperature, latitude, and longitude values as input, to document the characteristics of MCCs over the Indian subcontinent region. Lakshmanan et al. (2003) pioneered the use of the K-Means clustering algorithm for thunderstorm identification. Matthews and Trostel (2010) introduced the DBSCAN (Density-Based Spatial Clustering of Applications with Noise) algorithm for thunderstorm detection. Compared with the K-Means clustering algorithm, the DBSCAN algorithm does not require the number of clusters to be predefined, is insensitive to initial centroid selection, and can effectively identify thunderstorms with diverse and irregular morphologies. Yan et al. (2020) used an improved DBSCAN method for identifying the three-dimensional structure of thunderstorms based on radar reflectivity. Shah et al. (2015) developed a fully automated thunderstorm detection algorithm that adaptively determines optimal multi-parameter thresholds by combining optimized radar reflectivity thresholding with the SALdEdA (structure, amplitude, location, eccentricity difference and areal difference) tracking technique. Duan and Guo (2016) employed digital image processing and fuzzy pattern recognition techniques for the automated identification and tracking of meso-scale convective system cloud clusters. Nevertheless, the method still necessitated manual intervention to handle newly formed cloud clusters, and its identification and tracking accuracy could be influenced by satellite projection geometry and coordinate transformation errors.
Although numerous automated detection methods have been developed, most are not specifically designed for MCC identification or have not been applied to regions over China (Vila et al., 2008). As a result, a long-term MCC dataset suitable for studying the evolution and variability of these meso-α-scale weather systems remains scarce. To address this gap, we develop an adaptive MCC detection algorithm based on FY-2G satellite data, which integrates cloud-top temperature thresholds, area criteria, and morphological characteristics of cloud shields. The open-source algorithm and the resulting MCC dataset are expected to support operational MCC recognition and tracking, and research on the variability of convective systems under global warming. By applying this method, we construct a comprehensive MCC event dataset spanning 10 years (June 2015 to December 2024) over mainland China, which will be regularly updated in the future.
The FY-2G satellite, a member of China's Fengyun-2 geostationary meteorological satellite series operated by the China Meteorological Administration (CMA), was launched on 31 December 2014 and has since maintained a geostationary orbit at an altitude of approximately 35 800 km. It carries the second-generation Visible and Infrared Spin-Scan Radiometer (VISSR-II, also referred to as S-VISSR) as primary imaging payload. Through multispectral sensing in the visible, infrared, and water-vapor bands, cloud-top temperatures are monitored comprehensively. The satellite's longitude has undergone two relocations: it was positioned at 99.5° E before 1 June 2015; then at 105° E from that date until 16 April 2018; and has since been stationed at 99.2° E. VISSR-II operates at a temporal resolution of one hour during the non-flood season and 30 min during the flood season, providing hourly observational data to the public, supporting applications in weather forecasting, climate research, and environmental monitoring.
In this study, we utilize the FY-2G CTT product (https://satellite.nsmc.org.cn/, last access: 1 April 2026). In contrast to Black Body Temperature (TBB), CTT is retrieved through multi-band infrared data inversion integrated with atmospheric modeling, yielding a more accurate representation of actual cloud-top thermal conditions. Because the MCC signatures – extensive cold-cloud shields, near-circular morphology, and prolonged lifetimes – are readily discerned in CTT imagery derived from infrared satellite observations, physically retrieved CTTs are particularly advantageous for MCC identification and tracking. The FY-2G CTT product has a spatial resolution of approximately 5 km × 5 km and an hourly temporal resolution; it is available from June 2015 to the present, of which the subset spanning from June 2015 to December 2024 are used for analysis in this study.
3.1 Parameter Optimization
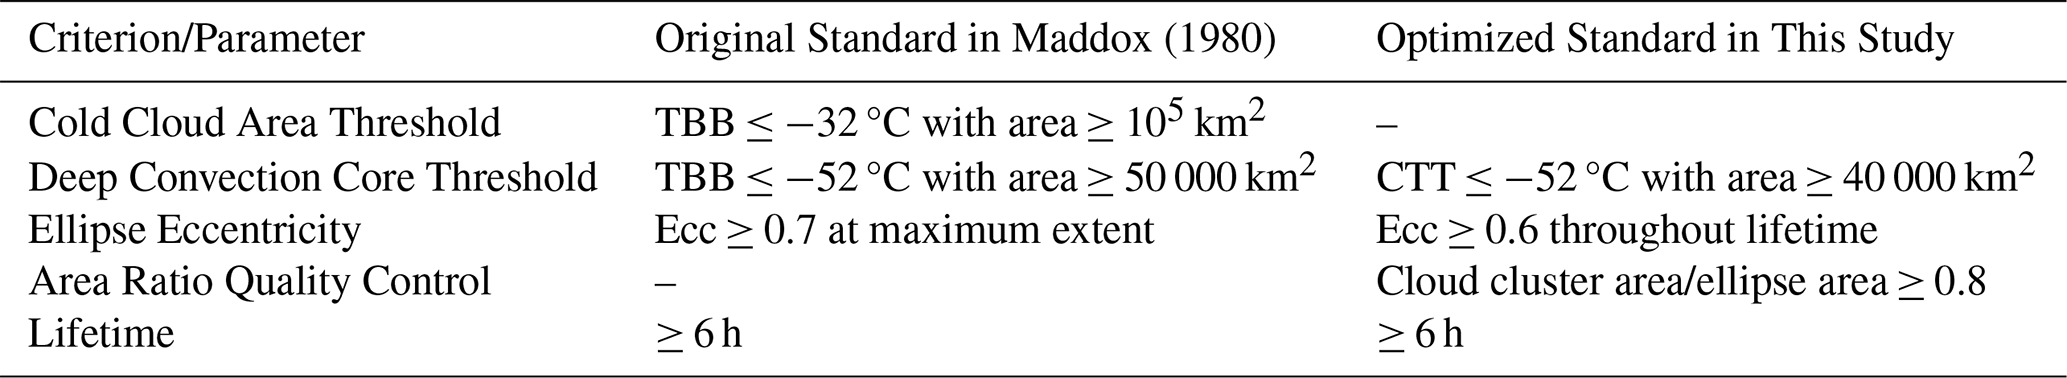
This study develops an automated detection algorithm for MCCs using CTT data retrieved from the infrared channels of the FY-2G satellite. The initial detection criteria are anchored in the morphological and lifecycle criteria for MCCs proposed by Maddox (1980) (Table 1). However, manual census of MCC occurrence over China reveals that the area, morphology and lifecycle parameters – originally derived from MCC characteristics over North America – are not fully applicable to China, and therefore warrant region-specific modification.
It was demonstrated by Augustine and Howard (1991) that the original cold-cloud shield requirement (CTT ≤ −32 °C with area ≥ 105 km2) in Maddox (1980) is overly permissive; although all genuine MCCs satisfy this condition, it does little to exclude other convective systems. By contrast, the deep-convection core requirement (CTT ≤ −52 °C with an area ≥ 50 000 km2), has been shown to be overly restrictive in some contexts (Augustine and Howard, 1991; Fei et al., 2011). We carefully examined several MCC cases over China manually and also found that well-organized MCCs can have cloud shield with CTT ≤ −52 °C slightly smaller than 50 000 km2. Based on these considerations, the threshold for the area with CTT ≤ −52 °C is set to ≥ 40 000 km2.
To represent the quasi-circular morphology typical of MCCs, the cold cloud region is extracted and best-fitting ellipse is computed, with the ellipse eccentricity (ecc) serves as a quantitative measure of roundness. Following Xiang (1995), who reported smaller eccentricity values for MCCs in China than in North America, the ecc criterion is relaxed from ecc ≥ 0.7 at maximum extent to ecc ≥ 0.6 throughout the MCC lifecycle to accommodate morphological variability. This adjustment enables the algorithm to capture the complete MCC lifecycle from initiation to dissipation. For identification accuracy, additional morphological quality-control constraint is incorporated. The cloud cluster must cover at least 80 % of the fitted ellipse's area (area ratio ≥ 0.8), thereby filtering fragmented or spuriously connected patches. Finally, a system is classified as an MCC only if all above morphological and area criteria are satisfied continuously for at least 6 h, ensuring consistency in both structural integrity and lifecycle evolution (Table 1).
Table 1Comparison of MCC parameters/criteria between Maddox (1980) and this study.
3.2 Automated Identification Algorithm
Based on the aforementioned criteria, the steps of the automated identification algorithm were correspondingly designed and tailored for the specific analysis of the China region (Fig. 1).
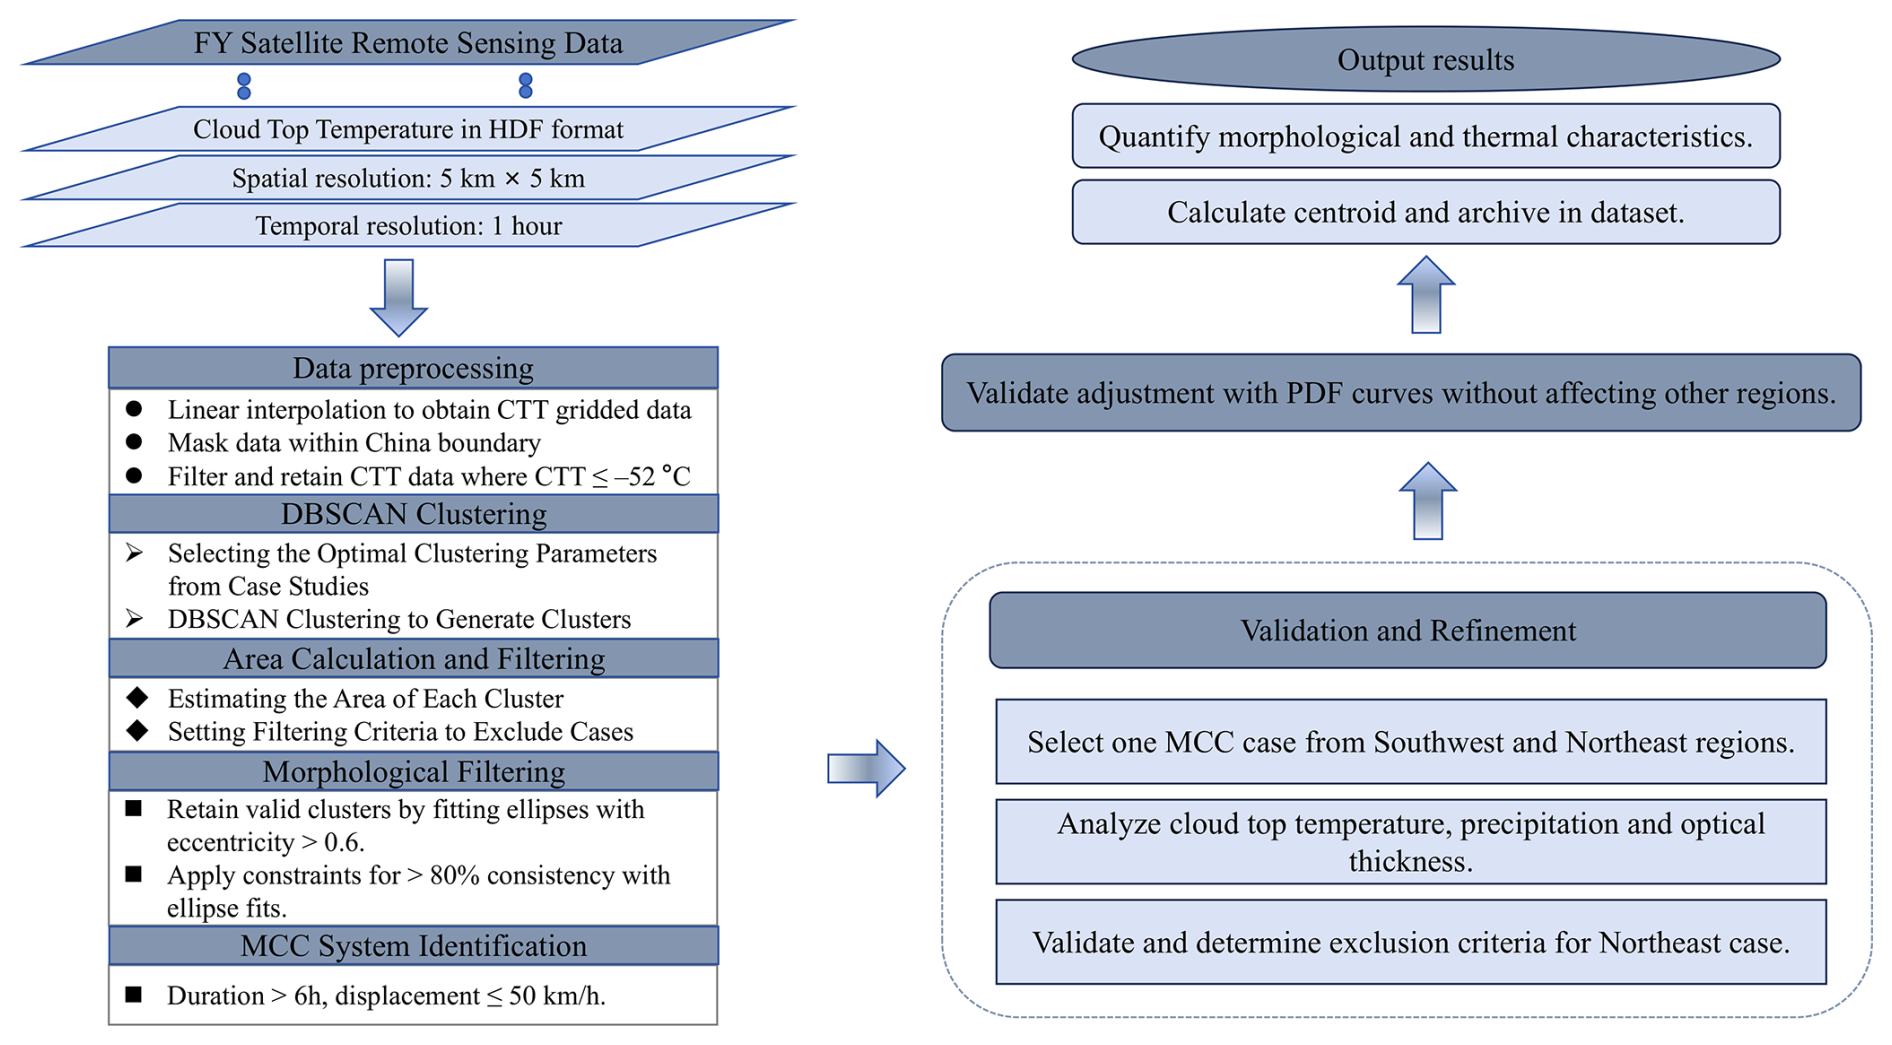
Figure 1Flowchart of the automated MCC identification and tracking process. The left panel delineates the steps for algorithmic identification, while the right panel outlines the procedures for data validation and output.
- a.
The first procedure involved geographically masking the original FY-2G satellite data to isolate the China region. The masked data were then resampled to a 0.1° × 0.1° grid, to optimize computational efficiency for subsequent analysis. Finally, the initial extraction of potential cold cloud pixels was performed by applying a Cloud Top Temperature (CTT) threshold of ≤ −52 °C (Fig. 2a).
- b.
The second phase comprised the application of the density-based DBSCAN algorithm to cluster the discrete cold cloud pixels, a technique chosen for its proficiency in identifying dense clusters amidst noise (Fig. 2b). Following the clustering application, the critical parametrization of DBSCAN was performed. The core parameters – neighborhood radius (eps) and minimum points (min_samples) – were optimized through analysis of 50 historical MCC event samples (Table 2), with the optimal parameter combination ultimately determined as eps = 0.5 and min_samples = 36.
- c.
The third procedure involved the estimation of the spatial extent for each cluster generated in the previous step. The area was derived by computing the cumulative area of all pixels belonging to a given cluster. The area of each cluster, which incorporates a geometric correction for the Earth's sphericity, is defined as Eq. (1):
where R denotes the Earth's radius (≈ 6371 km), Δφi and Δ λi represent the latitudinal and longitudinal spans in radians, |cos(φi)| is the correction factor for the latitudinal variation in longitudinal arc length. The total cluster area Si was subsequently obtained by multiplying the unit pixel area by ni, the number of grid points in the cluster.
- d.
The fourth phase consisted of a multi-tiered filtering process. It commenced with a preliminary screening that eliminated cloud clusters with an area below 40 000 km2. For clusters satisfying this area threshold, a two-stage morphological filtering approach was then executed based on minimum bounding ellipse fitting. The first filtering criterion mandated an ellipse-fitted eccentricity of ≥ 0.6, a deliberately permissive threshold to encompass systems in their early stages (Fig. 2c). The second filtering criterion required clusters to maintain at least 80 % areal coverage relative to their fitted ellipses, thereby enforcing morphological regularity and physical plausibility (Fig. 2d).
- e.
The final processing stage entailed the definitive classification of the screened MCC candidates. These candidates first underwent standardized parameter extraction. Subsequently, their validity as MCC events was determined by evaluating spatiotemporal continuity against strict criteria: a maximum centroid displacement of 50 km and a minimum duration of continuous convective activity of 6 h. This concluding phase of the algorithm ensured that only systems demonstrating the requisite persistence and spatial coherence were formally classified as MCC events and archived for subsequent analysis.
Table 2Algorithm performance evaluation across parameter configurations using 50 manually verified MCC cases.
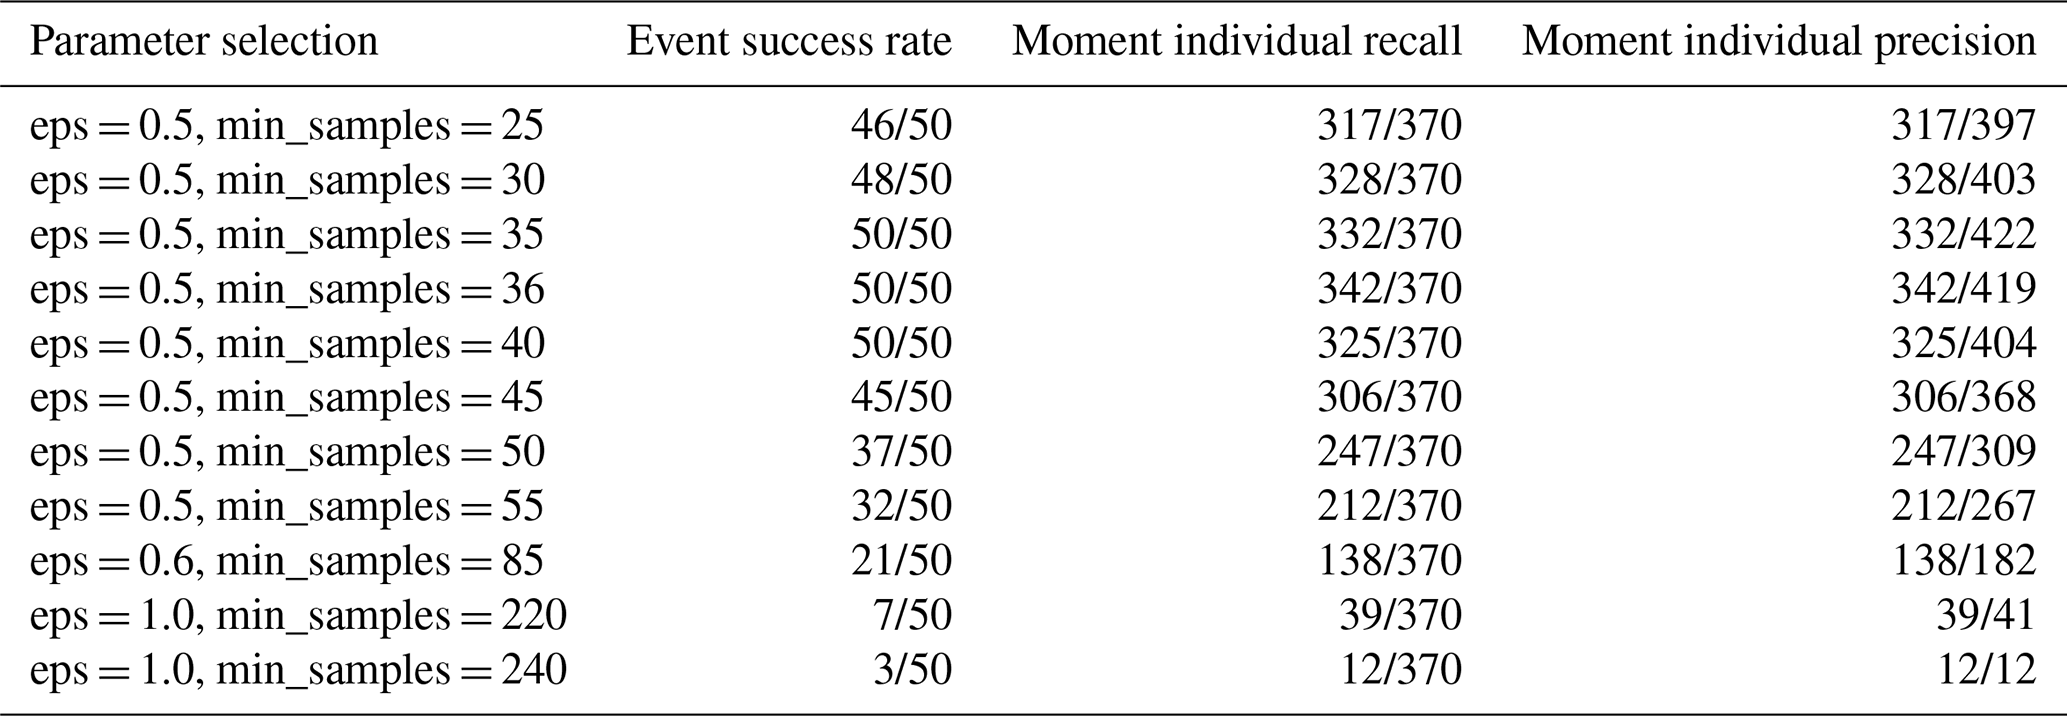
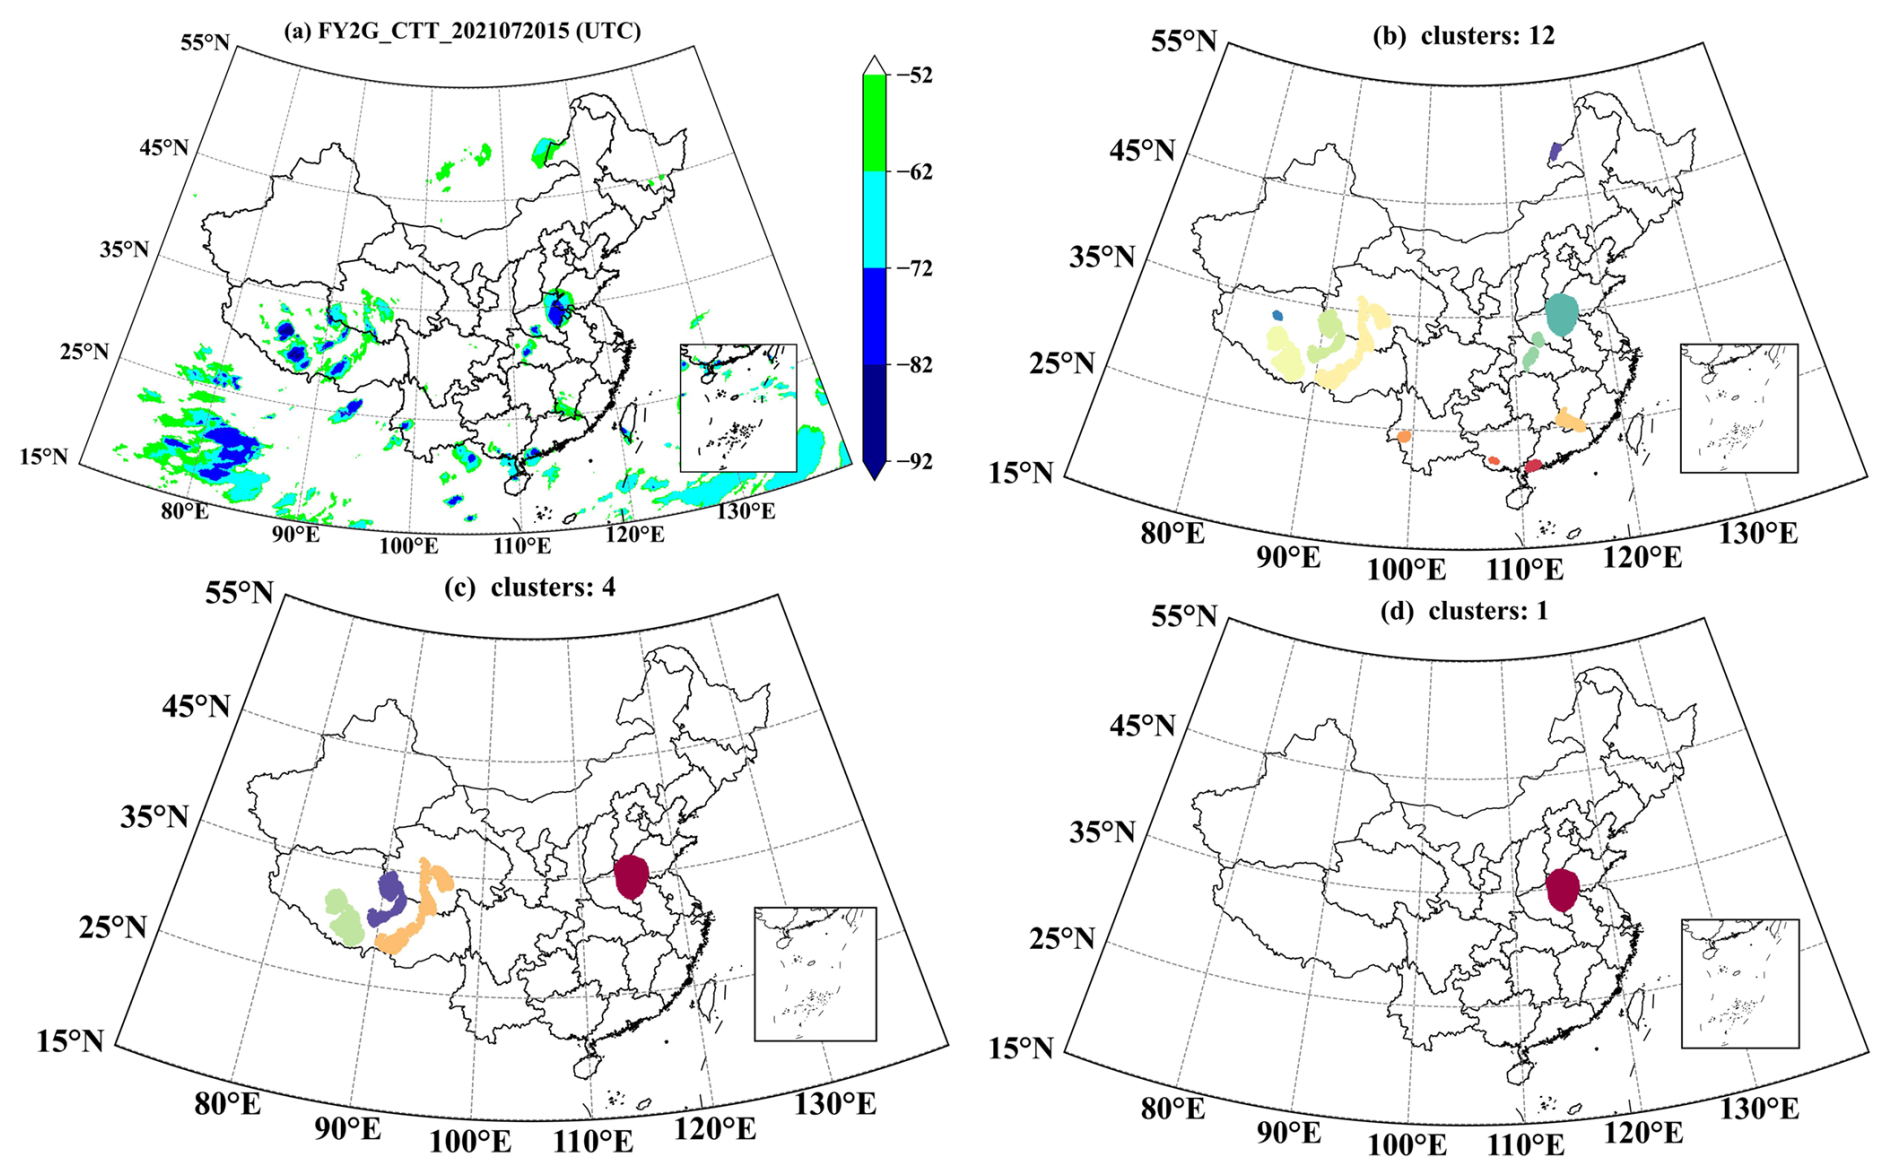
Figure 2(a) Spatial distribution of cloud-top temperature (CTT) below −52 °C across China and adjacent regions at [20 July 2021, 15:00 UTC], derived from FY-2G satellite observations. (b) Spatial distribution of clustered cold-cloud systems identified through DBSCAN algorithm, where distinct colors represent individual clusters meeting MCC candidate criteria (CTT ≤ −52 °C). (c) Spatial distribution of clustered cold-cloud systems after area threshold filtering (≥ 4 × 10⁴ km2), where distinct colors represent individual valid MCC candidates. (d) Final MCC candidates after morphological filtering, where color-filled areas represent systems meeting all criteria (elliptical eccentricity ≥ 0.6, area ratio ≥ 0.8).
3.3 Validation and Refinement
The initial analysis of the MCC dataset (June 2015–December 2024) produced by our algorithm reveals several key spatial patterns (Fig. 3). The warm-season concentration in southern China is consistent with the canonical pattern described by Chang(2015) and serves to benchmark the algorithm's performance. Notably, the occurrence frequency in northeastern China is significantly higher than in other regions, with this pattern being particularly pronounced in winter (December–February), which contrasts with the findings of Chang (2015). It is essential to consider whether this pattern points to a genuine climatological feature or highlights a potential limitation of the identification algorithm in capturing the morphological characteristics of MCCs in northeastern China.
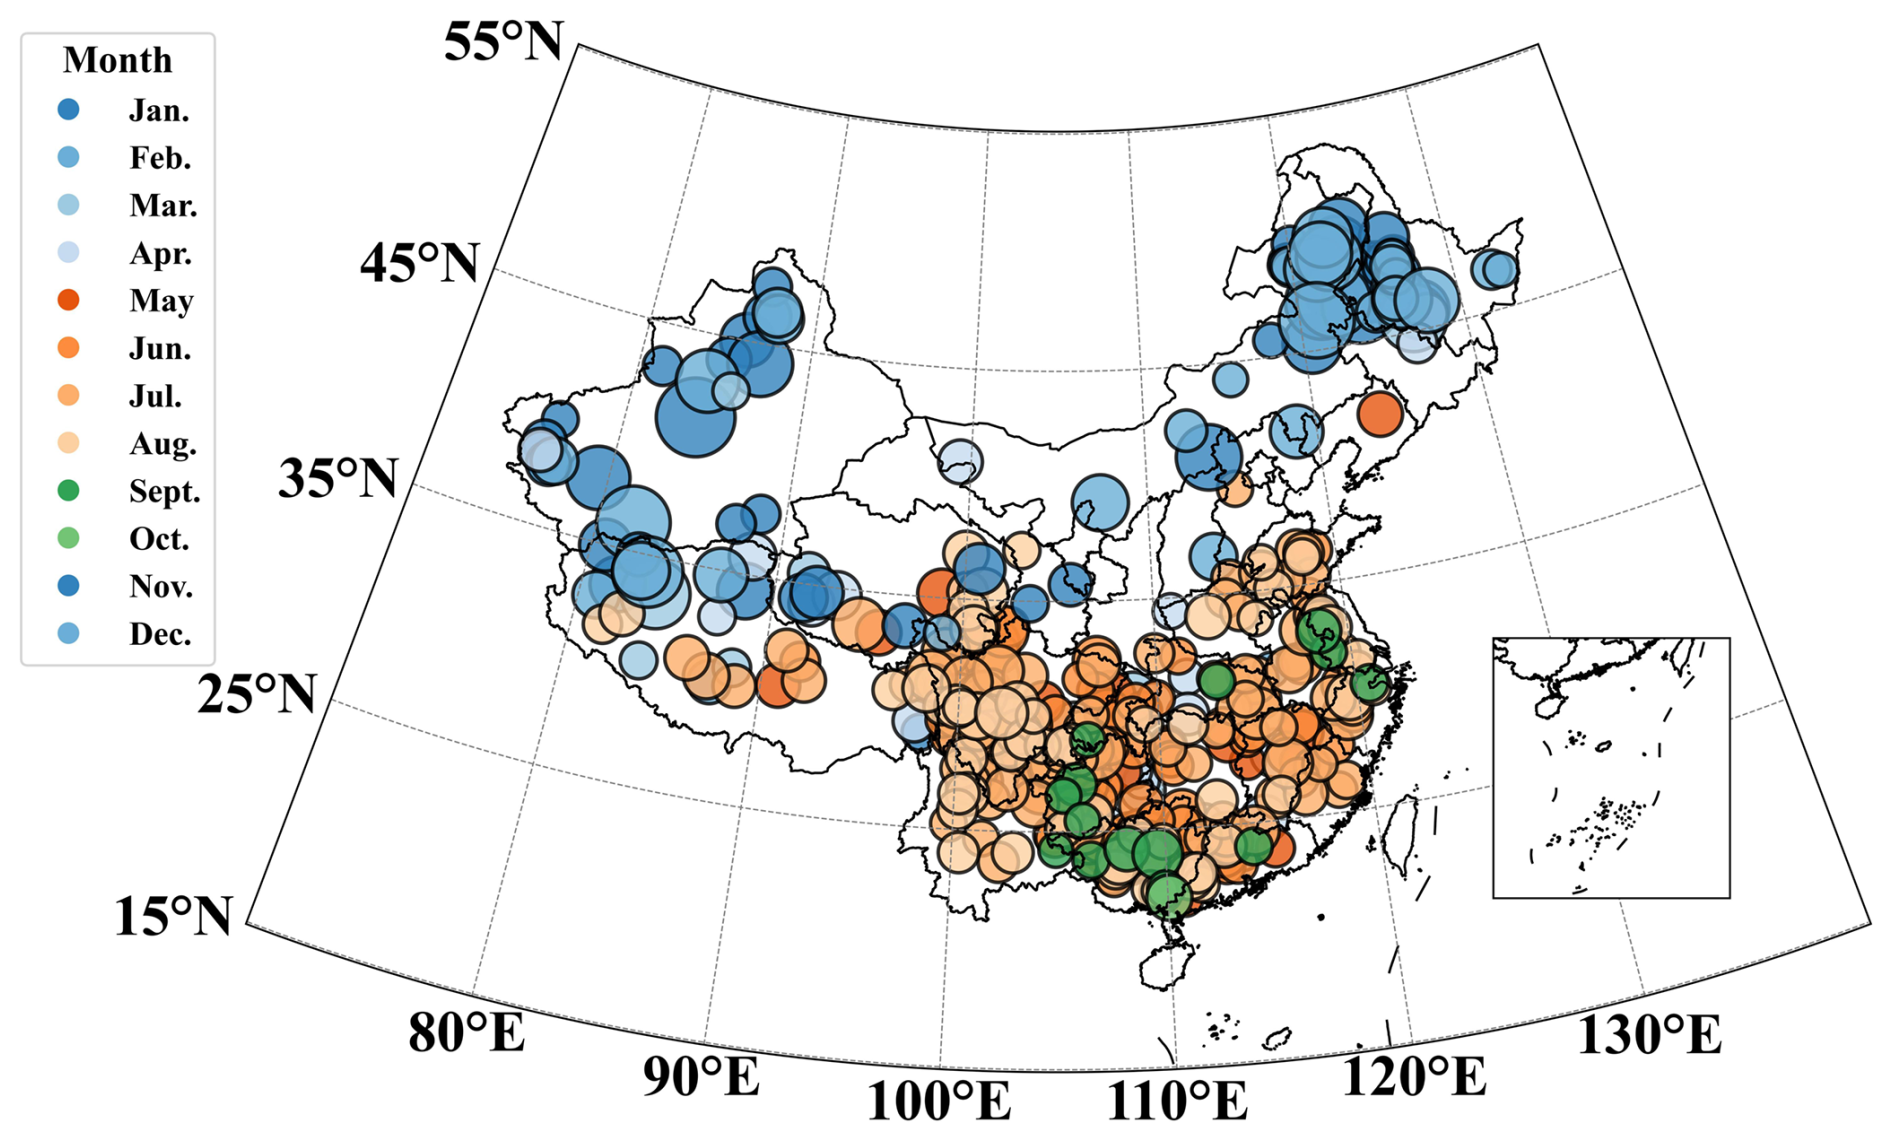
Figure 3Spatial distribution of MCCs identified by the algorithm across China (2015–2024). Each marker represents an individual MCC, with its size proportional to the areal extent (CTT ≤ −52 °C) at the onset of its lifetime. Colors represent different months.
To evaluate the accuracy of the elevated frequency of MCCs identified in northeastern China, comparative analysis was conducted between two randomly selected cases identified by the algorithm, one from northeastern China and the other from southern China, with the latter verified through manual inspection (Fig. 4). The CTT distribution of the northeastern China case lacks a coherent structure, exhibiting dispersed cold regions without a defined core (Fig. 4a). In contrast, the southern China case displays a compact deep convective system featuring a pronounced cold center below −92 °C, indicative of high cloud tops (Fig. 4d). This contrast is further corroborated by the optical thickness distribution: the northeastern China case appears nearly cloud-free or covered by thin clouds (Fig. 4b), while the southern China case shows extremely high values (τ≈ 100), suggestive of deep cumulonimbus (Fig. 4e). Similarly, the rainfall distribution for the northeastern China case shows negligible precipitation (Fig. 4c), whereas the southern China case features a strong rainfall maximum co-located with the cloud system (Fig. 4f). Validation of additional algorithm-identified cases in northeastern China consistently yielded similar results, leading to the conclusion that the northeastern China case does not represent a genuine MCC event. This demonstrates that conventional MCC identification algorithms based solely on satellite CTT thresholds are prone to misidentification in northeastern China, underscoring the necessity for region-specific adaptations that reflect the region's unique climatic characteristics.
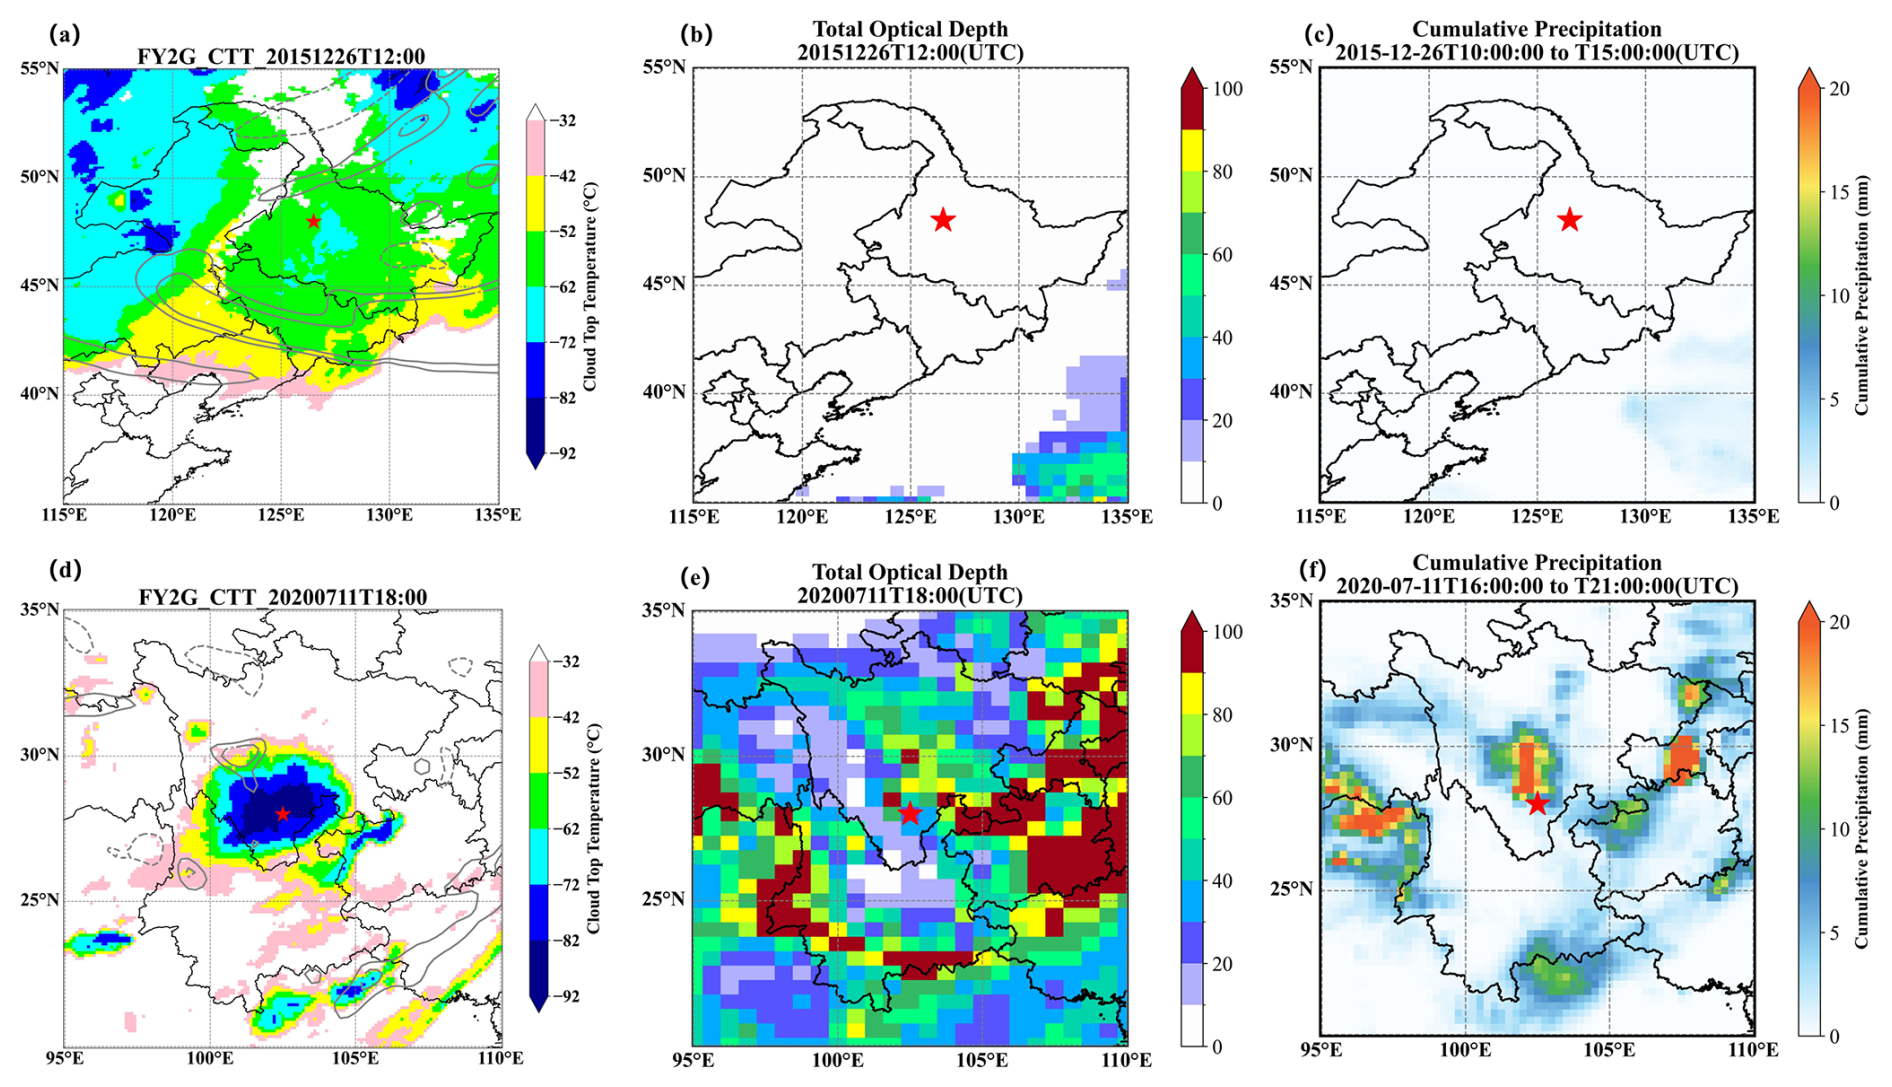
Figure 4(a–b) (shaded, °C) with 500 hPa relative vorticity (contours, 10−5 s−1); (c–d) Total optical thickness (unitless); (e–f) 6 h accumulated precipitation (mm) centered on peak −52 °C cloud area, for a northeastern China case (upper panel) and a southern China case (lower panel).
Based on the preceding analysis of individual MCC cases, we found that winter cases automatically identified in northeastern China were likely false positives. To mitigate these spurious detections, a seasonal filtering excluding winter observations was applied. After filtering, the spatial distribution of MCC occurrences across China shows significantly improved agreement with the patterns documented in Chang (2015). To quantitatively evaluate the performance of the seasonal filtering, we defined a validation reference zone (20–30° N, 100–120° E) within which all algorithm-detected cases were manually verified against key MCC characteristics, including cloud-top structure, lifetime duration, and associated precipitation. This rigorously validated region subsequently served as a benchmark for assessing the detection accuracy in other geographic domains.
A comparative analysis of the probability distribution function (PDF) of MCC areal extent between the full set of cases across China and the subset obtained after seasonal filtering shows that the latter exhibits greater consistency with the validated reference region (Fig. 5). The areal extent PDF of all MCCs without seasonal filtering exhibits a long tail to the right, attributable to the false and large winter cases over northeastern China shown in Fig. 3. The comparative analysis demonstrates that the exclusion of winter cases effectively suppresses false MCC identifications in northeastern China while preserving true MCC cases in other regions. The seasonal filtering therefore effectively improves the overall reliability of the identified MCC dataset.
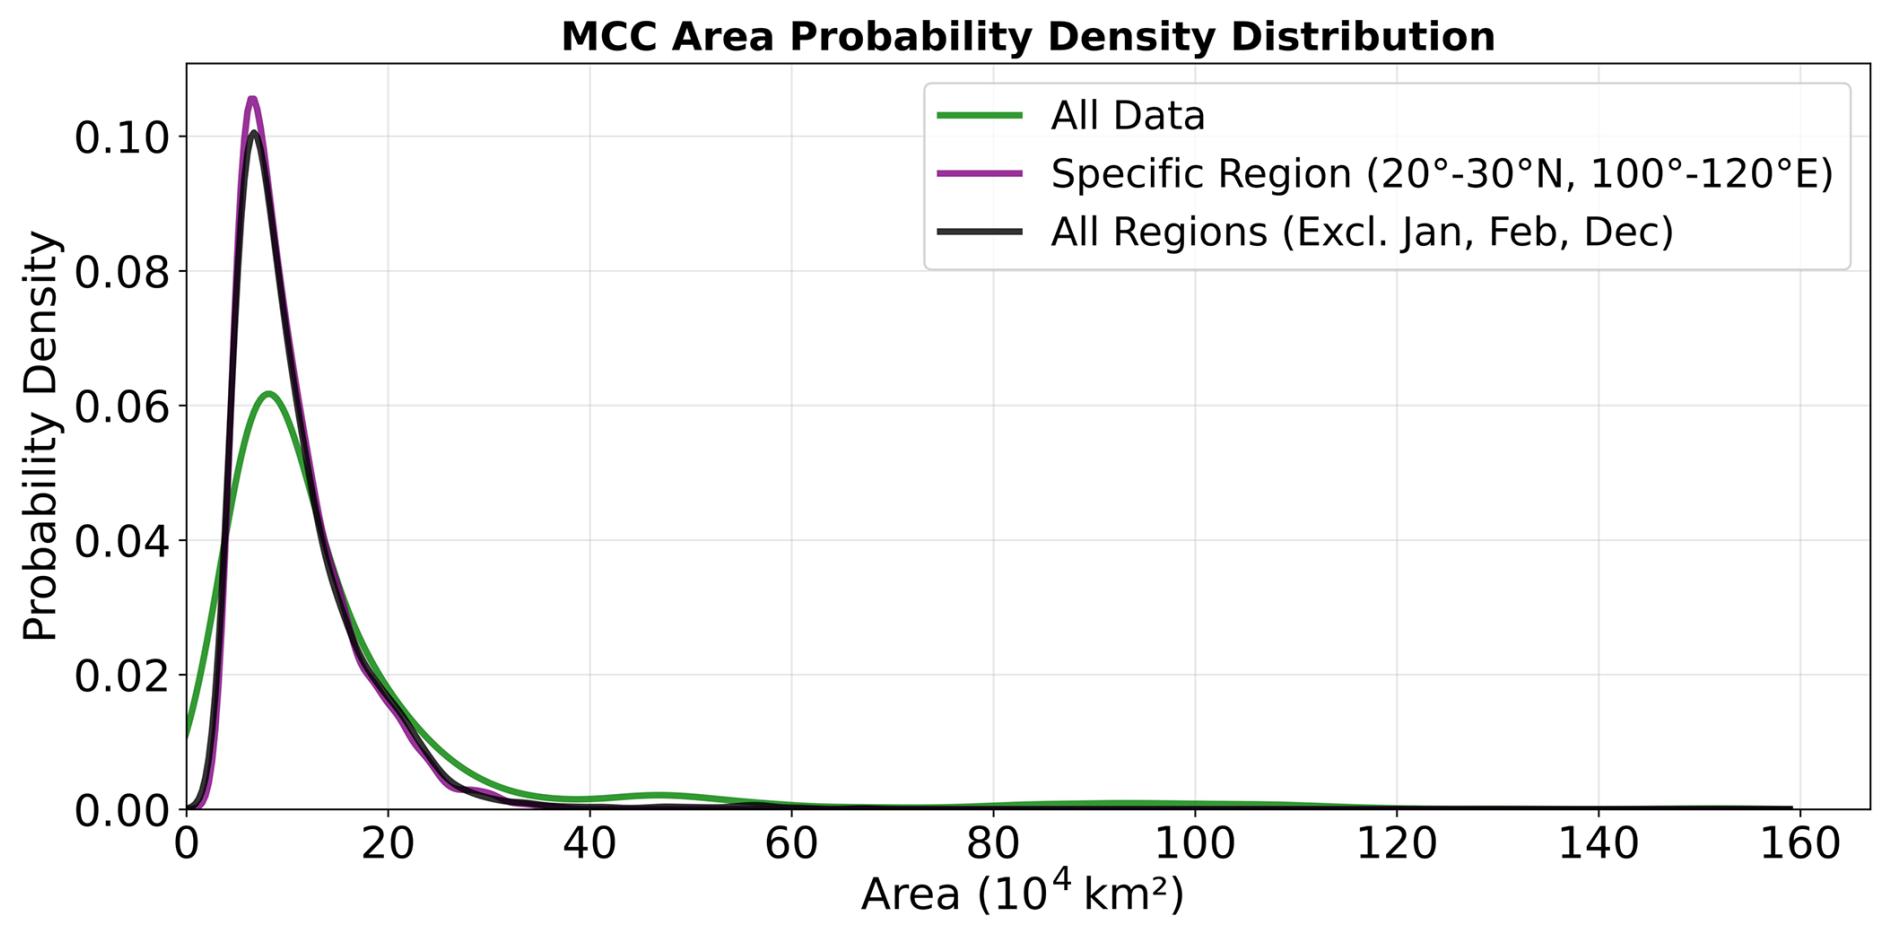
Figure 5PDF of MCC areal extent for the full set of cases across China, the validated subset over a selected region (20–30° N, 100–120° E), and the subset across China after excluding winter months (December–February).
The above results highlight that integrating seasonal and regional specificity is critical for advancing MCC detection methodology. Our empirical results demonstrate the limited applicability of the standard MCC identification criteria to northeastern China during the winter season. This finding underscores the necessity for future algorithm optimization to account for regionally-specific parameters.
3.4 Data Output
The algorithmic outputs were consolidated into a structured dataset representing the spatiotemporal and physical characteristics of the identified MCC events. Each record includes quantified metrics such as cloud shield area, minimum CTT, and centroid location, stored alongside necessary metadata in standardized text formats (Table 3). This final dataset is readily accessible for climatological analysis, model validation, and comparative studies.
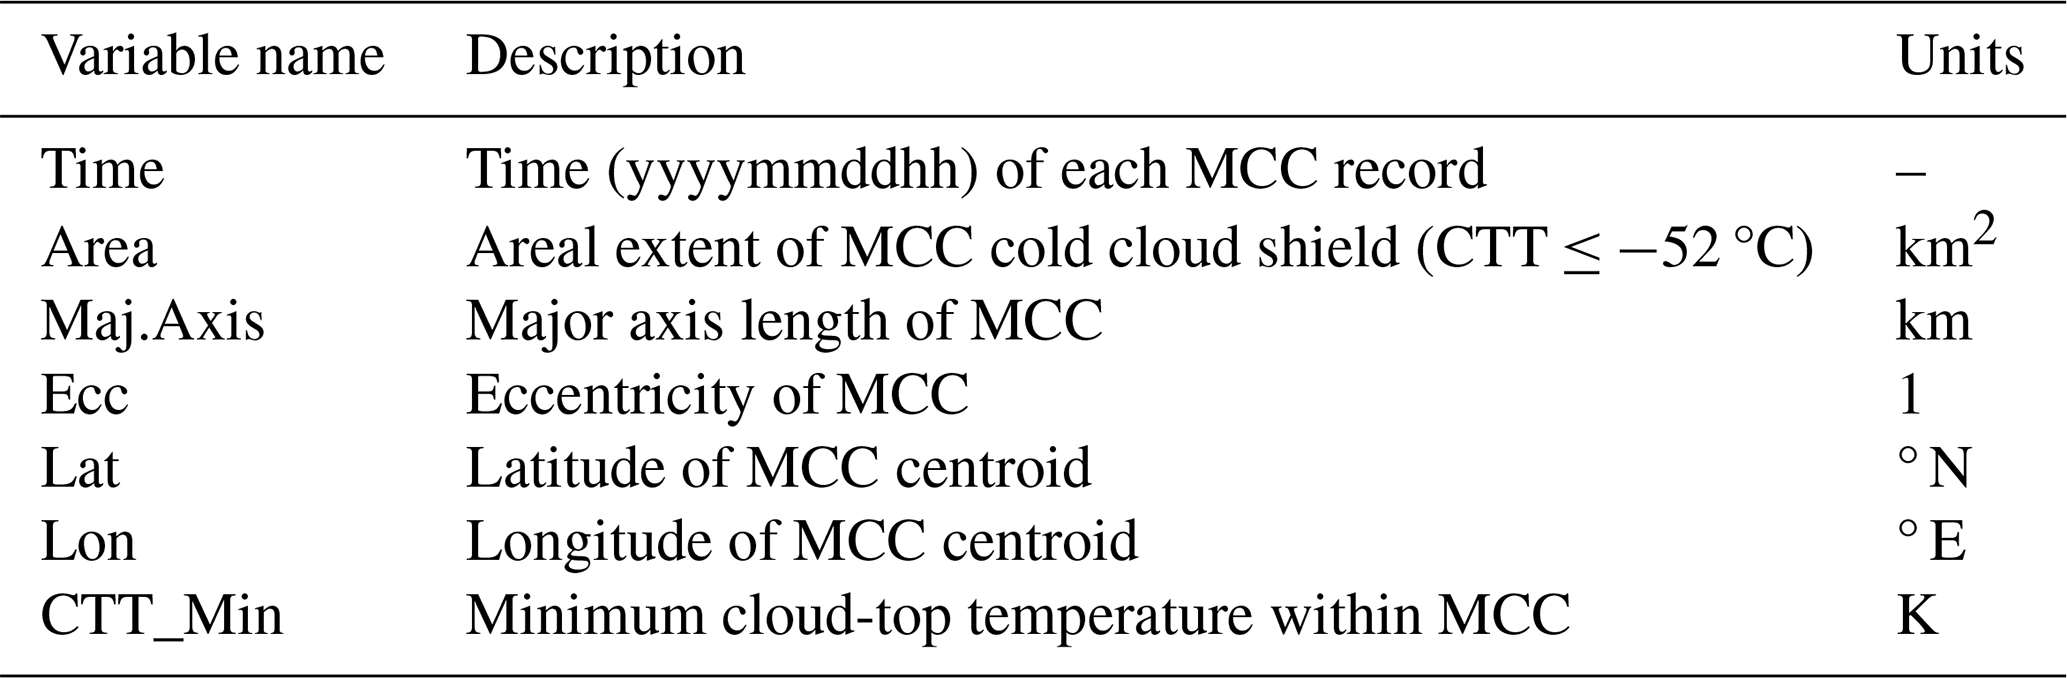
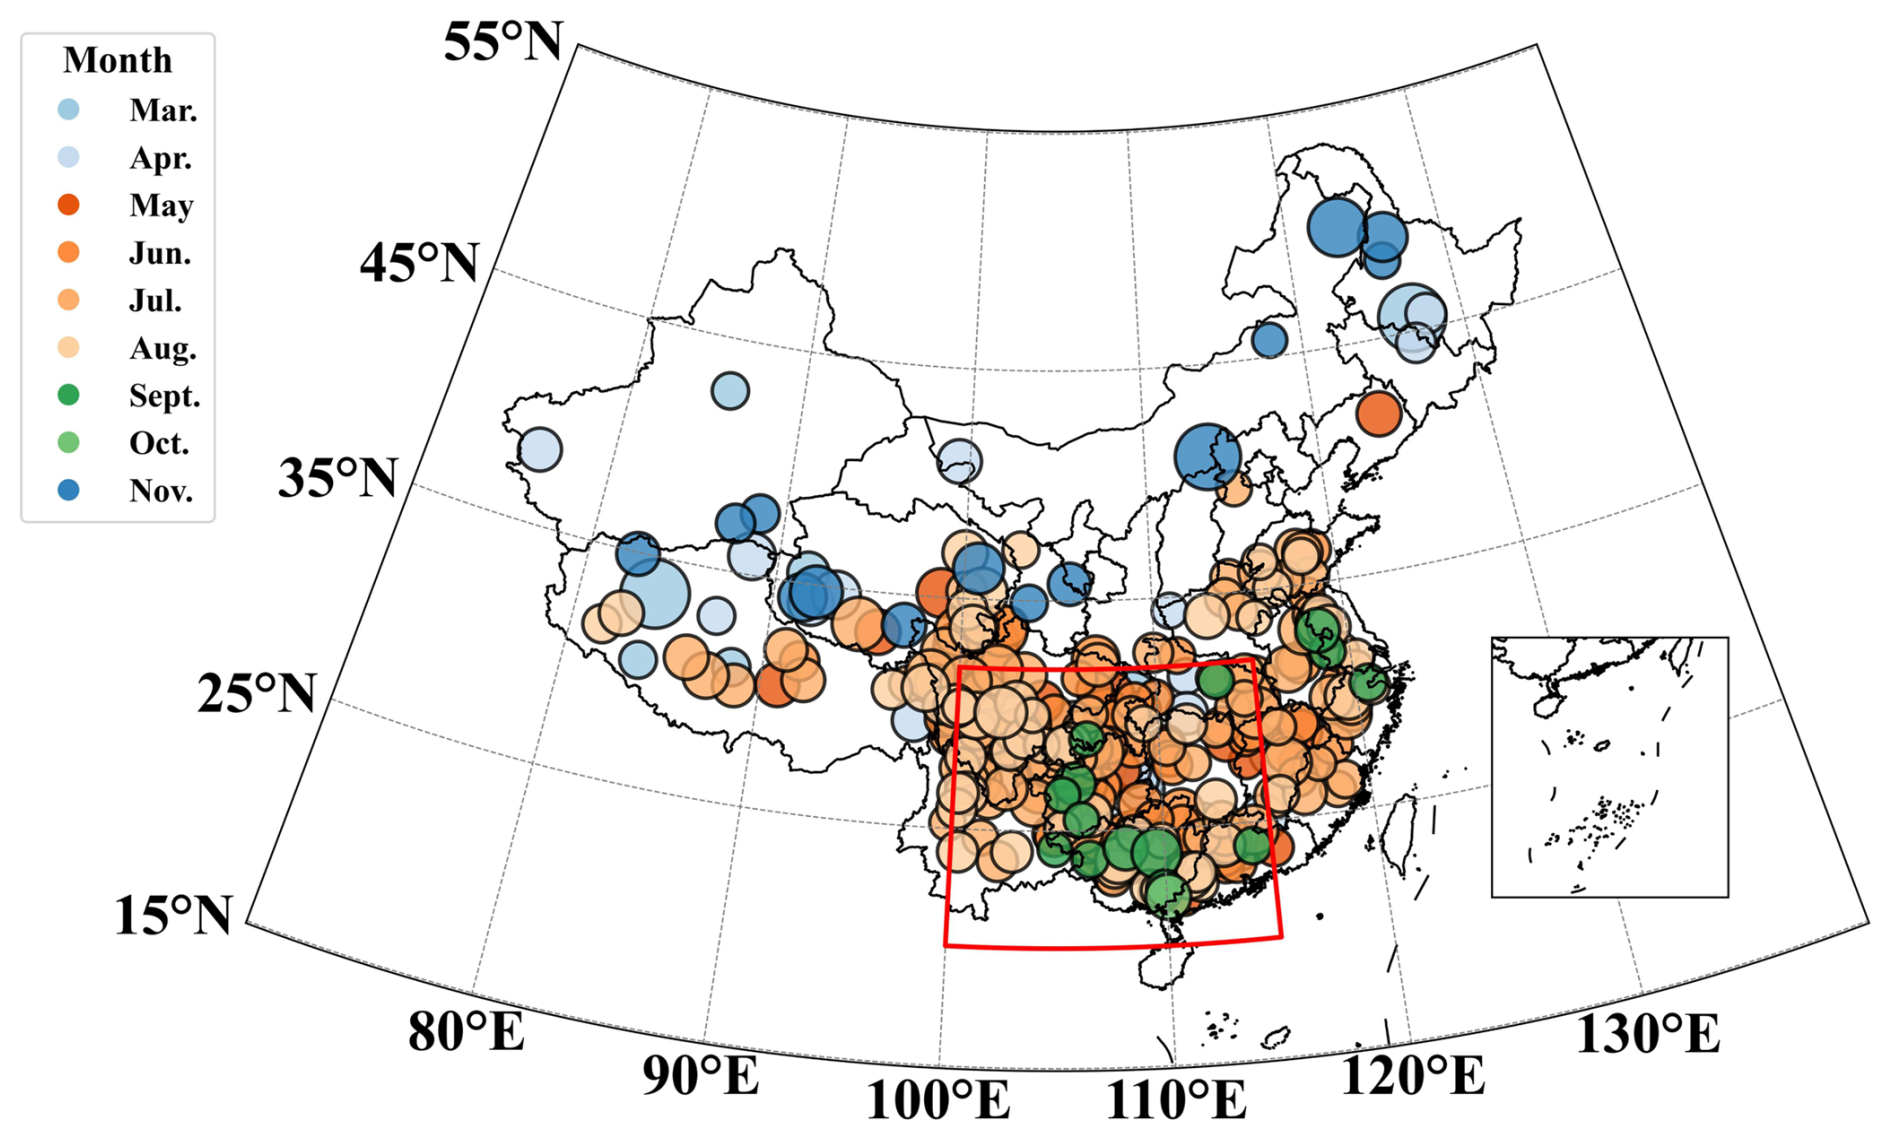
Figure 6Same as Fig. 3, but with winter months excluded. Red box denotes the southwestern China in this study.
We perform a preliminary statistical analysis of the comprehensive MCC dataset to delineate the spatial and seasonal distribution of MCC occurrences across China (Fig. 6). The results reveal pronounced regional heterogeneity. Over the past decade, the total number of MCC events has been highest in Southwest China, far exceeding that in other regions. The Yangtze River Basin, the South China coast, and the Sichuan Basin are also identified as hotspots for MCC occurrence. A distinct north-south seasonal contrast is evident, with MCCs in northern China relatively rare and occurring during spring and autumn, whereas those in southern China frequent and predominantly concentrated in summer. Furthermore, the spatial scales of the MCCs, represented by the circle sizes in Fig. 6, indicate that summer systems rarely attain an areal extent exceeding 20 × 104 km2. An exception is Southwest China, where MCCs from June to August are both larger in scale and more frequent than their autumn (September–November) counterparts.
Given the significantly higher frequency of MCC occurrences and associated extreme rainfall and secondary disasters in Southwest China compared to other regions, this area (demarcated in Fig. 6) is analyzed separately in addition to the analysis for mainland China as a whole.
As a primary distribution area for MCCs in China, Southwest China accounts for approximately 32 % of the national total frequency, underscoring its prominence in the regional climatology (Fig. 7). The seasonal distribution of MCC occurrences in this region aligns with the broader pattern observed across mainland China, characterized by a dominant peak in boreal summer (June–August), a secondary frequency in spring (March–May), and notably subdued activity in autumn (September–November). This temporal regime is principally governed by monsoon-modulated dynamics and the thermodynamic environment, in which the availability of low-level moisture and the degree of convective instability during the warm season serve as critical controlling factors (Zhang et al., 2025). As evidenced in Fig. 7, the summer months alone account for a substantial majority (75 %–80 %) of all annual MCC events identified in the region.
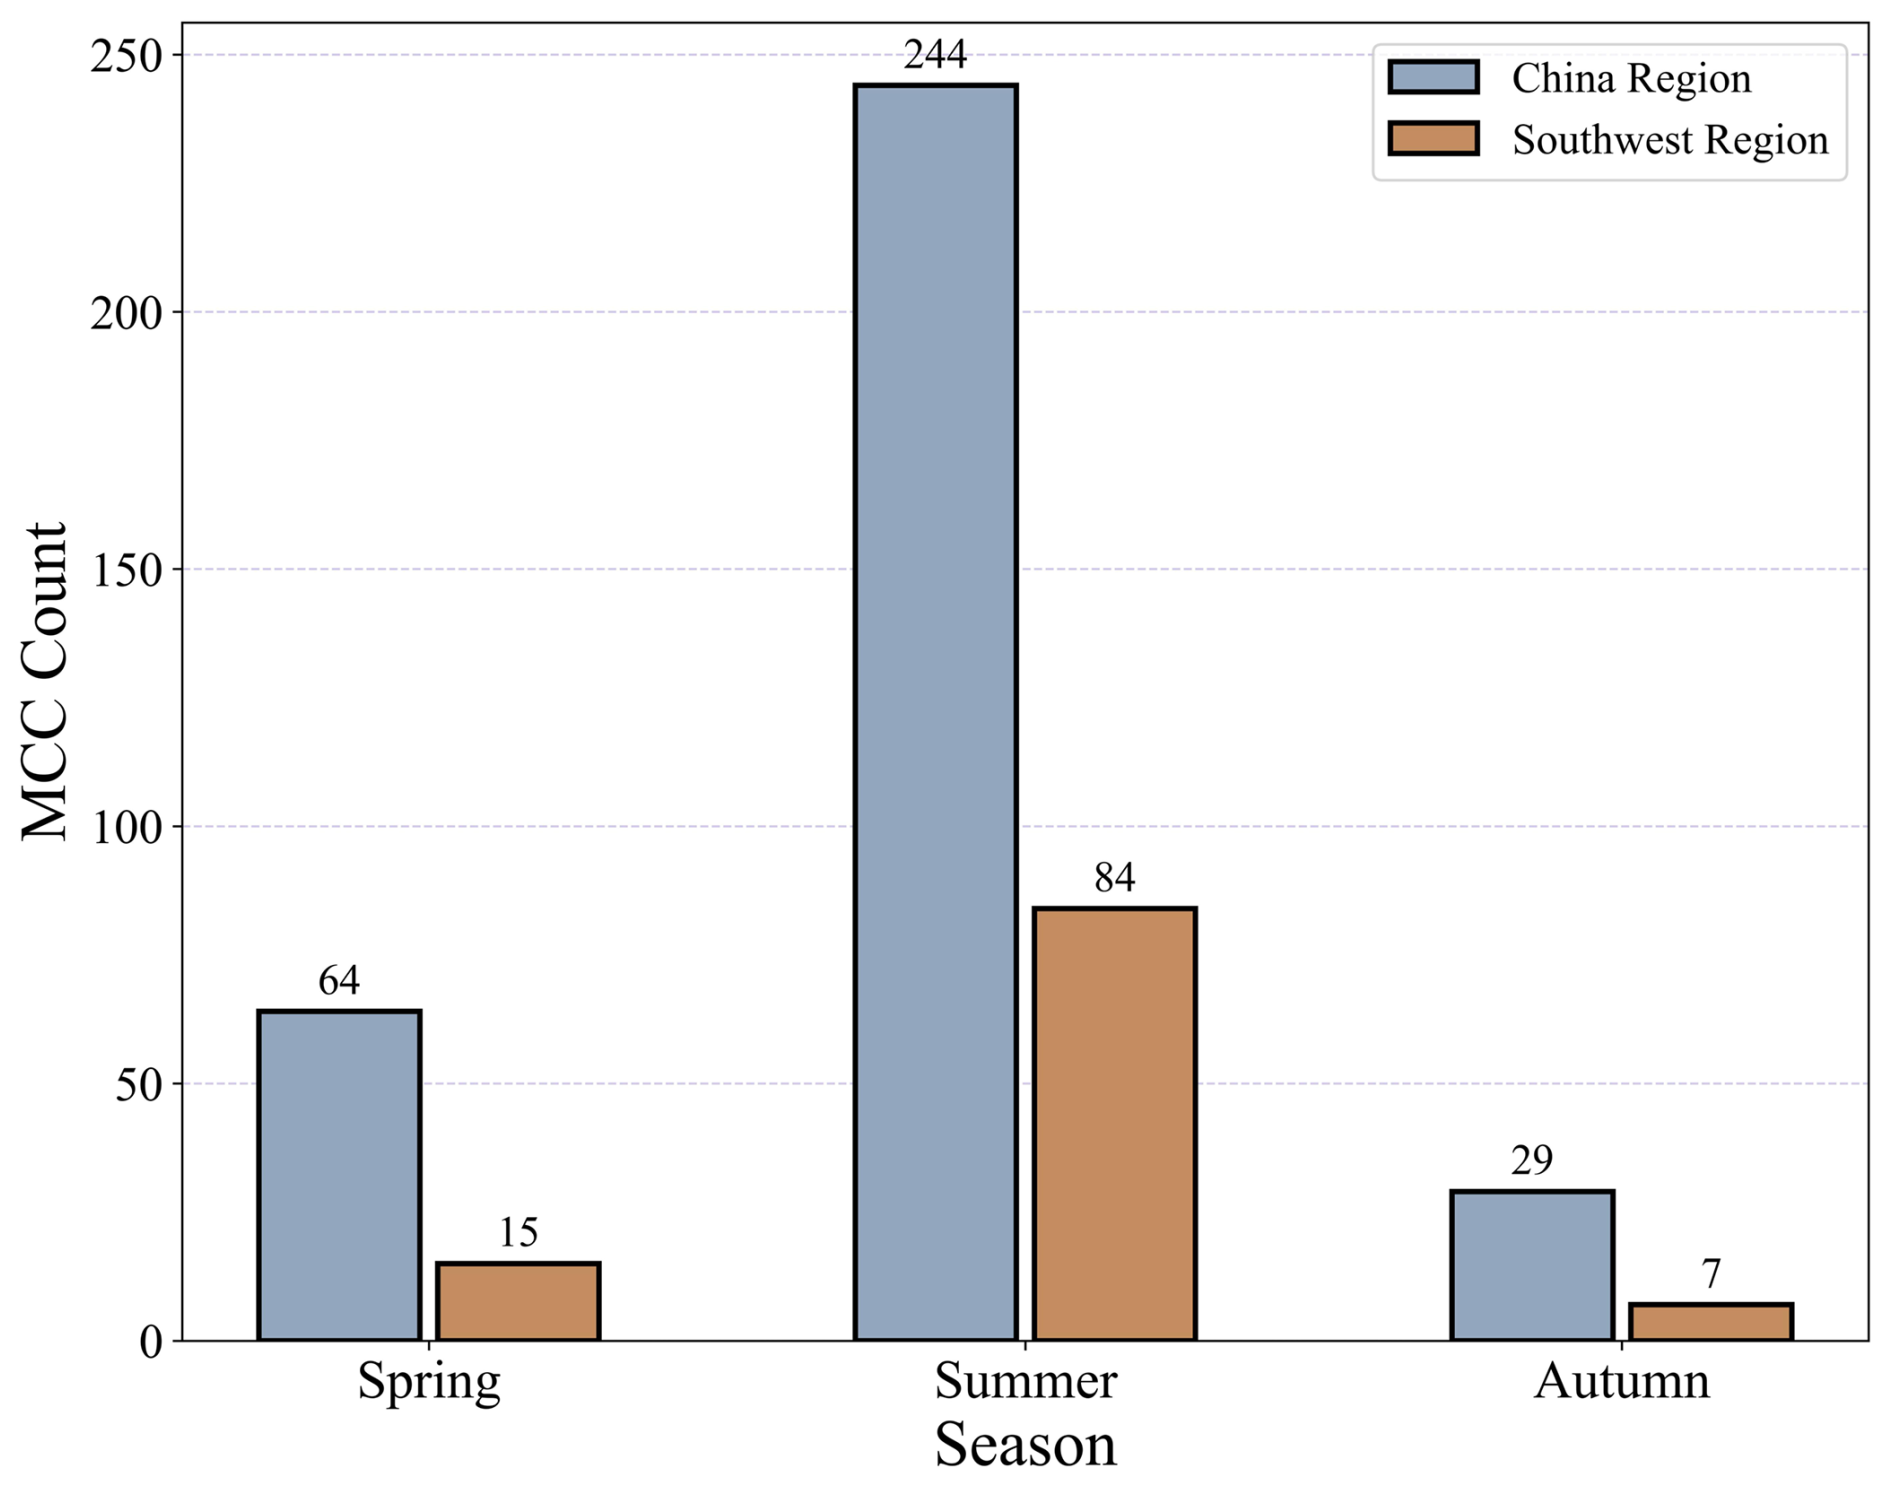
Figure 7Seasonal distribution of MCC frequency over China (blue bars) and the southwestern region (brown bars).
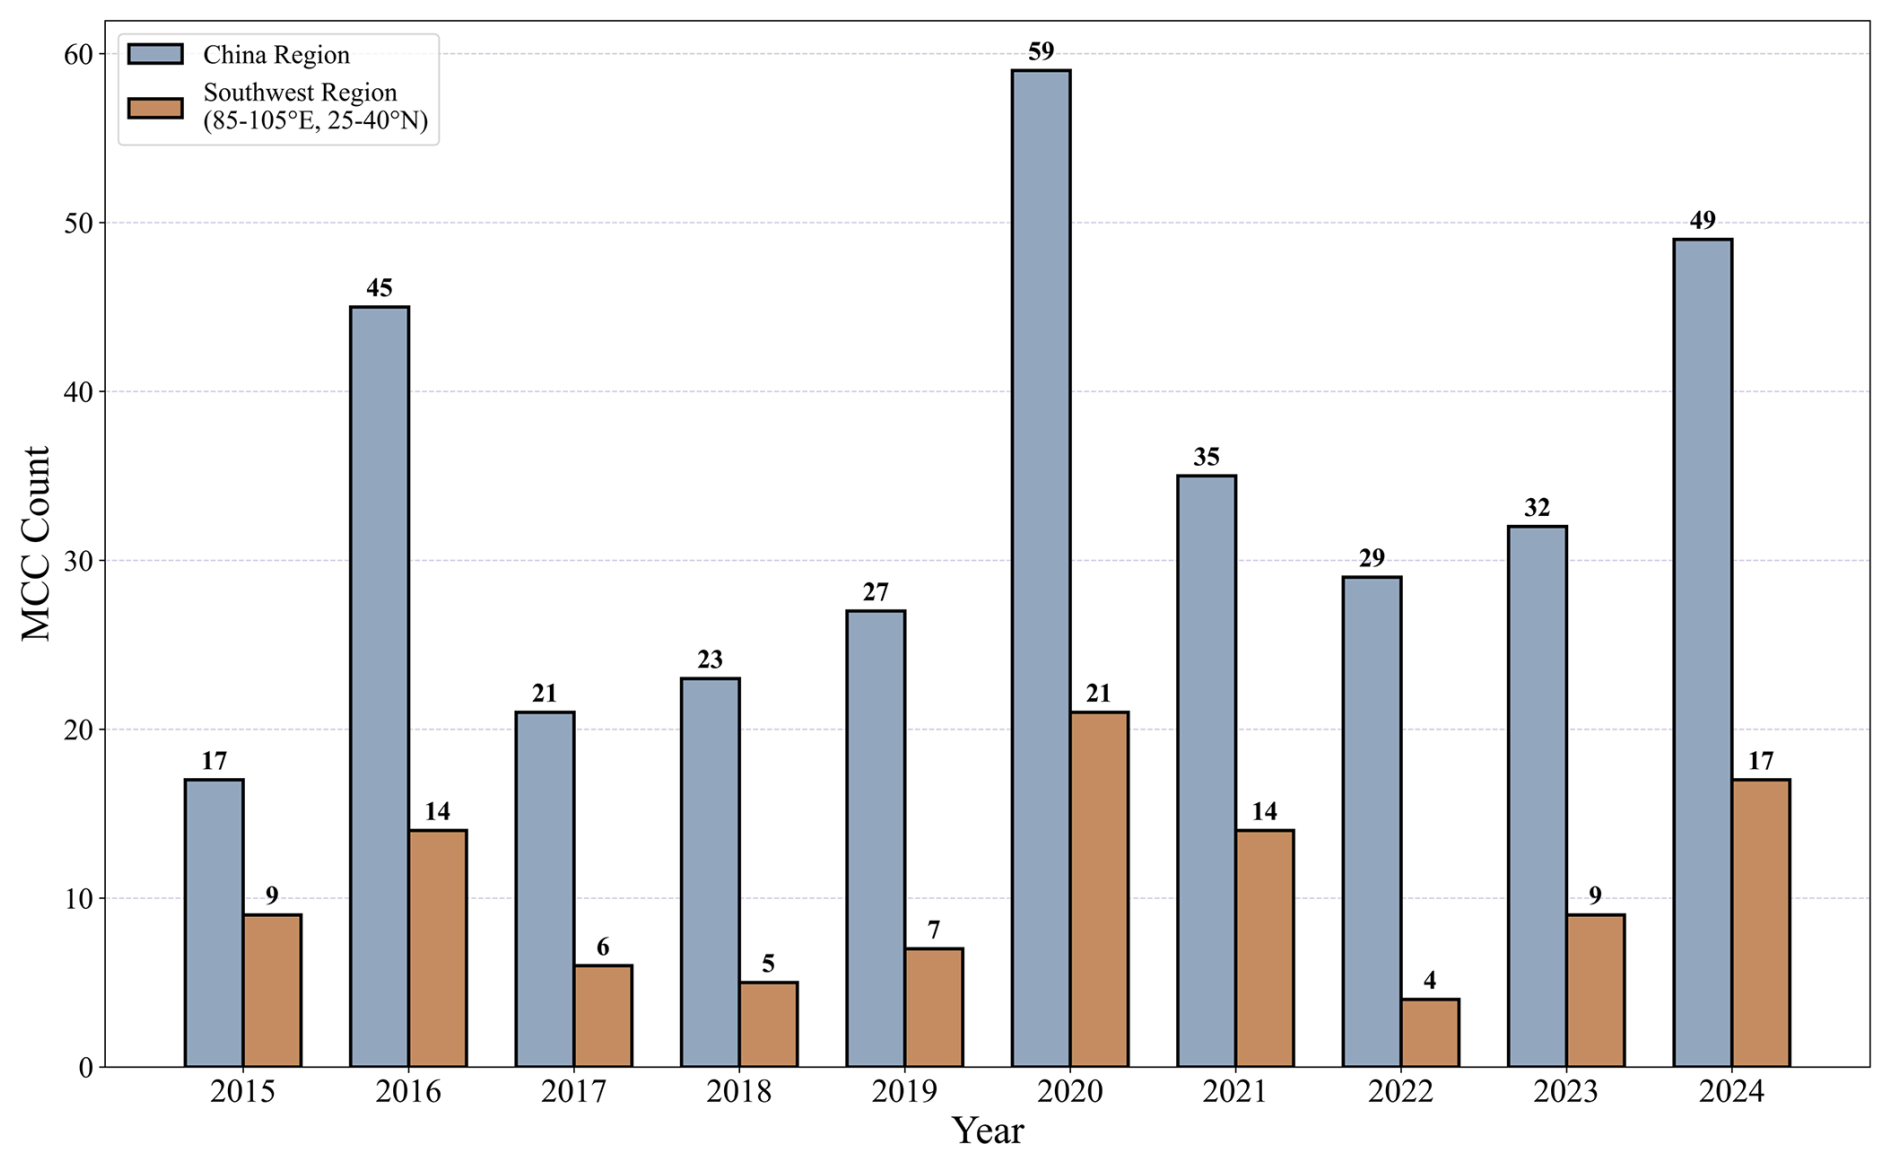
Figure 8Interannual variation of MCC frequency over China (blue bars) and the southwestern region (brown bars).
Figure 8 depicts the annual frequency of MCC occurrences over mainland China and Southwest China from 2015 to 2024. Both time series exhibit substantial interannual variability. The mainland China series fluctuates between a minimum of 17 (2015) and a maximum of 59 (2020), with notably higher frequencies also recorded in 2016 and 2024. Similarly, Southwest China witnesses MCC counts ranging from 4 (2022) to 21 (2020). The coherence of the peak in 2020, as well as the periodicity, across mainland China and Southwest China implicates a common set of large-scale climatic drivers that are particularly conducive to MCC development during that year.
The interannual variability of MCC occurrence in Southwest China appears to be influenced by the El Niño-Southern Oscillation (ENSO). For instance, the peak years of MCC occurrence in Southwest China (2016, 2020, 2024), consistently coincided with the decaying phase of El Niño and/or the developing phase of La Niña. Conversely, the annual trough of MCC occurrence in 2018 corresponded to the decaying year of La Niña and the developing year of El Niño. Statistical fitting of the 2015–2024 time series further corroborates this relationship, revealing a significant periodicity of 4.27 years (p-value < 0.0001), which is strikingly close to the mean period of the ENSO. This result strongly suggests that the statistical characteristics of annual MCC occurrences in Southwest China are modulated by large-scale air-sea interactions, although the underlying mechanisms require further investigation.
The database is available via Zenodo at https://doi.org/10.5281/zenodo.17349888 (Xu, 2025).
This study develops an automatic MCC detection and tracking algorithm based on the cloud top temperature from the FY-2G satellite, by employing a combination of DBSCAN clustering, multi-threshold screening, and morphological filtering. And a long-term (2015–2014) MCC dataset across mainland China is generated. The algorithm effectively captures MCC events. The Exclusion of winter data substantially enhances detection accuracy in northeastern China, where cold surface conditions and thin and high clouds can lead to false identifications. This necessity of region-specific adaptations to the MCC indentification protocol.
Analysis of the spatial distribution of MCCs across mainland China reveals pronounced regional heterogeneity. Southwestern China stands out as a primary hotspot for MCC occurrence, exhibiting a notably higher frequency than other regions that accounts for approximately 32 % of the national total. MCC activity demonstrates clear seasonal variability, with a primary peak during boreal summer and a secondary maximum in spring. Furthermore, both mainland China and Southwest China exhibit marked interannual variability in annual MCC frequency. The interannual fluctuations in MCC occurrence over Southwest China are likely modulated by the El Niño-Southern Oscillation.
The primary objective of this work is the development of a novel MCC detection algorithm; consequently, the analysis of the spatiotemporal distribution of MCCs across mainland China remains preliminary. Our findings, however, clearly identify Southwestern China as a region of exceptionally high frequency of MCCs and associated disaster risk. This insight paves the way for our future research, which will leverage the generated dataset to focus on this hotspot region. We will investigate the region's key meteorological characteristics, MCC triggering conditions, and maintenance mechanisms, ultimately elucidating their relationship with ENSO. Furthermore, the rapid advancement of satellite technology and increasing availablility of high-resolution data present a critical avenue for future research: the adaptation of this algorithm for practical application in operational convective systems monitoring and nowcasting.
SZ supervised the entire study. KX and SZ jointly conceived the study and designed the methodology. They were also responsible for data curation and formal analysis. KX uploaded the dataset to the repository and drafted the original manuscript. SZ and XM provided critial feedback and assisted in revision. All authors participated in discussions throughout the research process and approved the final manuscript.
The contact author has declared that none of the authors has any competing interests.
Publisher's note: Copernicus Publications remains neutral with regard to jurisdictional claims made in the text, published maps, institutional affiliations, or any other geographical representation in this paper. The authors bear the ultimate responsibility for providing appropriate place names. Views expressed in the text are those of the authors and do not necessarily reflect the views of the publisher.
The authors acknowledge the financial support from the National Key Research and Development Program of China and the Heavy Rain and Drought-Flood Disasters in Plateau and Basin Key Laboratory of Sichuan Province.
This research has been supported by the National Key Research and Development Program of China (grant no. 2024YFF0807904) and the Heavy Rain and Drought-Flood Disasters in Plateau and Basin Key Laboratory of Sichuan Province (grant no. SZKT202306).
This paper was edited by Graciela Raga and reviewed by two anonymous referees.
Abisusmita, R. W., Arsyad, M., and Subaer, S.: Karakteristik Mesoscale Convective Complex (MCC) di Wilayah Sulawesi Selatan dan Sekitarnya, Jurnal Fisika Unand, 12, 283–290, https://doi.org/10.25077/jfu.12.2.282-289.2023, 2023.
Augustine, J. A. and Howard, K. W.: Mesoscale Convective Complexes over the United States during 1986 and 1987, Mon. Weather Rev., 119, 1575–1589, https://doi.org/10.1175/1520-0493(1991)119<1575:MCCOTU>2.0.CO;2, 1991.
Blamey, R. C. and Reason, C. J. C.: Mesoscale Convective Complexes over Southern Africa, J. Climate, 25, 753–766, https://doi.org/10.1175/JCLI-D-10-05013.1, 2012.
Chang, C. D. Z.: Distribution characteristics of MCCs east of the Tibetan Plateau in China during summer 2007–2012, Journal of the Meteorological Sciences, 35, 445–453, https://doi.org/10.3969/2014jms.0008, 2015 (in Chinese).
Cotton, W. R. and Anthes, R. A.: Storm and Cloud Dynamics, Academic Press, San Diego, California, USA, 1989.
Ding, T., Guo, Z., Zou, L., and Zhou, T.: Impact of Convection-Permitting and Model Resolution on the Simulation of Mesoscale Convective System Properties Over East Asia, J. Geophys. Res., 128, e2023JD039395, https://doi.org/10.1029/2023JD039395, 2023.
Duan, L. and Guo, G.: Research on Method for MCS Automatic Identification and Tracking Based on FY Satellite Cloud Image, Electronic Science and Technology, 29, 116–126, 2016 (in Chinese).
Febrizky, L., Fadli, M., and Wiliam, W.: IDENTIFIKASI MESOSCALE CONVECTIVE COMPLEX (MCC) BERBASIS DATA SATELIT HIMAWARI-8 DI PULAU PAPUA DAN SEKITARNYA DESEMBER 2021-NOVEMBER 2022, OPTIKA: Jurnal Pendidikan Fisika., 7, 294–305, https://doi.org/10.37478/optika.v7i2.3132, 2023.
Fei, Z. W. H., Zhang, Y., Song, S., and Liu, J.: Automatic identification and tracking of MCS based on geostationary satellite infrared imagery, Journal of Applied Meteorological Science, 22, 115–122, 2011 (in Chinese).
Houze, R. A.: Structure and Dynamics of a Tropical Squall–Line System, Mon. Weather Rev., 105, 1540–1567, https://doi.org/10.1175/1520-0493(1977)105<1540:SADOAT>2.0.CO;2, 1977.
Houze Jr., R. A.: Orographic effects on precipitating clouds, Rev. Geophys., 50, https://doi.org/10.1029/2011RG000365, 2012.
Hua, S., Xu, X., and Chen, B.: Influence of Multiscale Orography on the Initiation and Maintenance of a Precipitating Convective System in North China: A Case Study, J. Geophys. Res.-Atmos., 125, e2019JD031731, https://doi.org/10.1029/2019JD031731, 2020.
Jing, X., Jing, Y., Chen, C., Tu, N., Wan, H., and Chen, H.: Characteristics and Causes of Meso-β Scale Flood-Causing Rainstorm on the Loess Plateau, Meteorological Monthly, 40, 1183–1193, https://doi.org/10.7519/j.issn.1000-0526.2014.10.003, 2014.
Laing, A. G. and Fritsch, J. M.: Mesoscale Convective Complexes in Africa, Mon. Weather Rev., 121, 2254–2263, https://doi.org/10.1175/1520-0493(1993)121<2254:MCCIA>2.0.CO;2, 1993.
Lakshmanan, V., Rabin, R., and DeBrunner, V.: Multiscale storm identification and forecast, Atmos. Res., 67–68, 367–380, https://doi.org/10.1016/S0169-8095(03)00068-1, 2003.
Le Barbé, L., Lebel, T., and Tapsoba, D.: Rainfall Variability in West Africa during the Years 1950–90, J. Climate, 15, 187–202, https://doi.org/10.1175/1520-0442(2002)015<0187:RVIWAD>2.0.CO;2, 2002.
Li, Y. W. J., Zheng, X., Guo, W., and Huang, W.: A study of Mesoscale Convective Complexes (MCC) in Southwest-South China, Atmospheric Sciences, 13, 415–422, https://doi.org/10.3878/j.issn.1006-9895.1989.04.05, 1989 (in Chinese).
Machado, L. A. T. and Rossow, W. B.: Structural Characteristics and Radiative Properties of Tropical Cloud Clusters, Mon. Weather Rev., 121, 3234–3260, https://doi.org/10.1175/1520-0493(1993)121<3234:SCARPO>2.0.CO;2, 1993.
Machado, L. A. T., Desbois, M., and Duvel, J.-P.: Structural Characteristics of Deep Convective Systems over Tropical Africa and the Atlantic Ocean, Mon. Weather Rev., 120, 392–406, https://doi.org/10.1175/1520-0493(1992)120<0392:SCODCS>2.0.CO;2, 1992.
Machado, L. A. T., Rossow, W. B., Guedes, R. L., and Walker, A. W.: Life Cycle Variations of Mesoscale Convective Systems over the Americas, Mon. Weather Rev., 126, 1630–1654, https://doi.org/10.1175/1520-0493(1998)126<1630:LCVOMC>2.0.CO;2, 1998.
Maddox, R. A.: Mesoscale convective complexes, B. Am. Meteorol. Soc., 61, 1374–1387, 1980.
Mathon, V. and Laurent, H.: Life cycle of Sahelian mesoscale convective cloud systems, Q. J. Roy. Meteor. Soc., 127, 377–406, https://doi.org/10.1002/qj.49712757208, 2001.
Matthews, J. and Trostel, J.: An improved storm cell identification and tracking (SCIT) algorithm based on DBSCAN clustering and JPDA tracking methods, American Meteorological Society, Atlanta, GA, http://ams.confex.com/ams/90annual/techprogram/paper_164442.htm (last access: 1 April 2026), 2010.
Miller, D. and Fritsch, J. M.: Mesoscale Convective Complexes in the Western Pacific Region, Mon. Weather Rev., 119, 2978–2992, https://doi.org/10.1175/1520-0493(1991)119<2978:MCCITW>2.0.CO;2, 1991.
Schumacher, R. S. and Rasmussen, K. L.: The formation, character and changing nature of mesoscale convective systems, Nature Reviews Earth & Environment, 1, 300–314, https://doi.org/10.1038/s43017-020-0057-7, 2020.
Shah, S., Notarpietro, R., and Branca, M.: Storm Identification, Tracking and Forecasting Using High-Resolution Images of Short-Range X-Band Radar, Atmosphere, 6, 579–606, https://doi.org/10.3390/atmos6050579, 2015.
Silva Dias, M. A. F. and Ferreira, R. N.: Application of a linear spectral model to the study of Amazonian squall lines during GTE/ABLE 2B, J. Geophys. Res., 97, 20405–20419, https://doi.org/10.1029/92JD01333, 1992.
Velasco, I. and Fritsch, J. M.: Mesoscale convective complexes in the Americas, J. Geophys. Res., 92, 9591–9613, https://doi.org/10.1029/JD092iD08p09591, 1987.
Vila, D. A., Machado, L. A. T., Laurent, H., and Velasco, I.: Forecast and Tracking the Evolution of Cloud Clusters (ForTraCC) Using Satellite Infrared Imagery: Methodology and Validation, Weather Forecast., 23, 233–245, https://doi.org/10.1175/2007WAF2006121.1, 2008.
Xiang, X. J. J.: Mesoscale Convective Complexes in southern China, Journal of Applied Meteorological Science, 6, 9–17, 1995 (in Chinese).
Xu, K.: A new dataset of MCC derived from FY-2G satellite data, Zenodo [data set], https://doi.org/10.5281/zenodo.17349888, 2025.
Yan, W. H. X., Zhao, Y., Yang, T., and Ni, H.: Introduction to a 3D structure identification technique for thunderstorm cells based on an improved DBSCAN clustering algorithm, J. Trop. Meteorol., 36, 542–551, https://doi.org/10.16032/j.issn.1004-4965.2020.050, 2020 (in Chinese).
Zhang, Y., Chen, H., Li, P., and Li, J.: The characteristics of summer mesoscale convective systems with different moving paths over Southwest China, Clim. Dynam., 63, 77, https://doi.org/10.1007/s00382-025-07586-y, 2025.