the Creative Commons Attribution 4.0 License.
the Creative Commons Attribution 4.0 License.
 | 12 May 2026
A comprehensive database of thawing permafrost locations across Alaska: version 2.0.0
Hailey Webb
Ethan Pierce
Benjamin W. Abbott
William B. Bowden
Yaping Chen
Yating Chen
Thomas A. Douglas
Joel F. Eklof
Eugénie S. Euskirchen
Moritz Langer
Isla H. Myers-Smith
Irina Overeem
Jens Strauss
Katey Walter Anthony
Kang Wang
Matthew A. Whitley
Merritt R. Turetsky
The Arctic is warming nearly four times faster than the global average, leading to widespread permafrost thaw degradation with profound implications for ecosystems and infrastructure. While gradual permafrost thaw occurs over decades, abrupt thaw events – such as thermokarst formation or retrogressive thaw slumps – can rapidly alter ecosystems and severely damage infrastructure. Although abrupt thaw is increasingly widespread, comprehensive datasets that map its spatial distribution at regional scales for land managers and local governments are still lacking. To address this gap, we created the Alaska Permafrost Thaw Database, an open-access, collaborative database which compiles 19 540 permafrost thaw and thermokarst locations across Alaska from 44 sources, integrating field observations, remote sensing products, and the published literature. This database spans observations from 1950 through the present and incorporates datasets of varying spatial resolution, ranging from field-based point measurements to remotely sensed products (1–125 m), providing statewide coverage across Alaska. The dataset includes abrupt thaw features and sites experiencing gradual top-down thaw that can help to support comparative analysis and predictive modeling. We used this database to explore relationships between thaw type (abrupt vs. non-abrupt) and topographic metrics (i.e., slope, relative elevation, and potential incoming solar radiation), analyze the distribution of various thaw features across Alaska's major ecoregions, and compare the database to current spatial datasets of ground ice and Yedoma. Our analysis shows abrupt thaw features are more prevalent in lowlands and depressions while gradual top-down and lateral thaw features are more commonly associated with areas receiving higher potential incoming solar radiation such as south facing slopes and open clearings. We also found substantial mismatches between ice-driven thaw processes and existing ground ice and Yedoma maps, likely reflecting the coarse resolution of current mapping products relative to the fine-scale nature of field measurements and highlighting the limitations of current datasets for local-scale prediction. The database provides direct, empirical evidence of actively thawing and stable permafrost locations and can be used to inform and validate ground ice mapping. By comparing the database with physiographic characteristics and remotely sensed measurements, the database can guide future field campaigns in areas with little to no observations. As permafrost thaw transforms Arctic landscapes, high-resolution, accessible spatial data – such as our thaw database – will be critical for informing mitigation and adaptation strategies. The Alaska Permafrost Thaw Database is openly available at Zenodo (https://doi.org/10.5281/zenodo.16996415, Webb et al., 2025b), which provides a link to the GitHub repository and access to all versions; this paper describes version 2.0.0.
- Article
(2572 KB) - Full-text XML
- BibTeX
- EndNote


The Arctic is one of the most rapidly changing environments on Earth (Ballinger et al., 2025). Ongoing widespread permafrost thaw, increased wildfire activity, changes in snowfall and precipitation, and sea level rise are all disrupting Indigenous and local communities and affecting infrastructure (Bamber et al., 2019; Bigalke and Walsh, 2022; Hjort et al., 2022; McCarty et al., 2021; Stepien et al., 2014; Streletskiy et al., 2023; Vincent, 2020). Permafrost underlies approximately 80 % of the land surface in Alaska and serves as a critical component of the state's ecosystems, landscape stability, hydrology, and carbon dynamics (Andresen et al., 2020; Jorgenson et al., 2006; Schuur et al., 2015). Terrestrial permafrost stores at least two times the amount of carbon currently in the atmosphere (between 1460–1600 Gt) (Schuur et al., 2022; Strauss et al., 2025). When permafrost thaws, microorganisms partially decompose soil carbon and release it in the form of greenhouse gases including carbon dioxide and methane (Mackelprang et al., 2016).
Abrupt permafrost thaw could impact up to 20 % of the permafrost region (Olefeldt et al., 2016). Unlike gradual thaw, which occurs when the active layer thickens by a few centimeters a year and causes a gradual shift in vegetation and slower, sustained shift in the carbon balance (Harris et al., 1988), abrupt thaw processes initiate within a few decades and cause severe impacts on the surrounding ecosystem (Turetsky et al., 2019; Webb et al., 2025a). Many abrupt thaw processes are triggered by the melting of ground ice, but not all forms of abrupt thaw depend on high ground ice to occur (i.e., coastal erosion, wildfire-induced top-down thaw) (Webb et al., 2025a). In upland and/or sloped regions, abrupt thaw can manifest as, for example, thaw slumps and active layer detachments while collapse scar wetlands and thermokarst lakes form in more poorly drained lowlands (Olefeldt et al., 2016; Turetsky et al., 2020). These processes are especially pronounced in regions underlain by Yedoma – ice-rich Pleistocene-aged permafrost containing large ice wedges (Strauss et al., 2021) – where thawing drives ground subsidence and exposes large stores of previously frozen, bioavailable carbon. Besides the impact of abrupt thaw on ecosystem structure and carbon cycling, abrupt thaw events also pose significant threats to infrastructure (Hjort et al., 2022). In Alaska, maintaining and rebuilding infrastructure damaged by permafrost thaw is expected to cost between USD 14.2–24.5 billion by 2050 (Streletskiy et al., 2023). Understanding the spatial distribution of permafrost thaw events is essential for predicting future permafrost degradation and informing mitigation strategies.
Despite the increasing occurrence of abrupt thaw events, comprehensive datasets documenting their spatial distribution are limited. Existing datasets either focus on specific regions (Jones and Zuck, 2016; Nitze et al., 2020b; Swanson, 2021; Whitley et al., 2018) or, if pan-Arctic, are limited to a single type of abrupt thaw such as retrogressive thaw slumps (Olefeldt et al., 2016; Yang et al., 2025). In Alaska, datasets contain too few thaw features to support robust modeling and often rely on automated methods that are less reliable than direct field observations (Witharana et al., 2022; Yang et al., 2023). To address this gap, we compiled a dataset of 19 540 permafrost thaw and thermokarst occurrences across Alaska from 44 different sources. This dataset includes various abrupt thaw features (i.e., thermokarst lakes, retrogressive thaw slumps, thermokarst wetlands) as well as locations that are not experiencing abrupt thaw that represent areas of more stable permafrost or permafrost subject to gradual top-down thaw. These so-called “non-abrupt thaw features” were compiled from a combination of permafrost monitoring networks, active layer depth surveys, and photo-interpretations of landscape change through time. These sites represent gradual thaw processes and are located in areas distinct from abrupt thaw features, allowing them to be treated as independent observations. These non-abrupt thaw locations serve as control points for comparison and provide a valuable reference for modeling permafrost dynamics, helping to distinguish the environmental conditions associated with abrupt thaw from those where thaw may be occurring more gradually or not at all. While the absence of visible abrupt thaw does not guarantee low risk, these locations could represent potential locations for infrastructure development and provide insights into the physiographic characteristics of permafrost more stable to change than abrupt thaw locations.
In this study, we carried out an extensive search of peer-reviewed literature, published datasets, and unpublished field observations to assemble the most comprehensive database of permafrost thaw locations across Alaska to date. We use the database to analyze topographic differences between abrupt and non-abrupt thaw sites, including slope, relative elevation, and potential incoming solar radiation. We also evaluate the ability of current ground ice maps to capture fine-scale susceptibility to ice-dependent abrupt thaw processes and quantify the proportion of these processes that occur within the Yedoma domain. This study represents the first large-scale, field-based comparison of mapped ground ice distributions with observed thaw features, assessing the ability of these maps to reliably predict abrupt thaw vulnerability. Specifically, we compare ice-dependent abrupt thaw features with the widely used ground ice map for Alaska developed by Jorgenson et al. (2008), the circumpolar ground ice map by Heginbottom et al. (2002) and the Database of Ice-Rich Yedoma Permafrost by Strauss et al. (2022). By comparing observed thaw features with mapped ground ice, Yedoma distribution, and topographic variables, we aim to assess current model limitations and identify key environmental characteristics associated with abrupt thaw across Alaska. These insights can help refine permafrost hazard assessments and guide the development of more accurate predictive tools for abrupt thaw formation and adaptation planning.
2.1 Data Sources and Consolidation Methods
We compiled the database from a combination of ground-truthed field observations and remotely sensed data across Alaska. Table 1 provides a summary of the sources used to extract thaw occurrence locations. We sourced these locations from a variety of formats including geospatial databases, coordinates reported in published journal articles, field campaigns, and photo-interpreted sites of landscape change. Given that spatial datasets were often in different formats such as points, polylines, and polygons, we standardized the database by converting all locations to point features based on the centroid of the feature (polygons) or the midpoint of the line (polylines).
Table 1Summary and descriptions of the published sources used to create the thaw database.
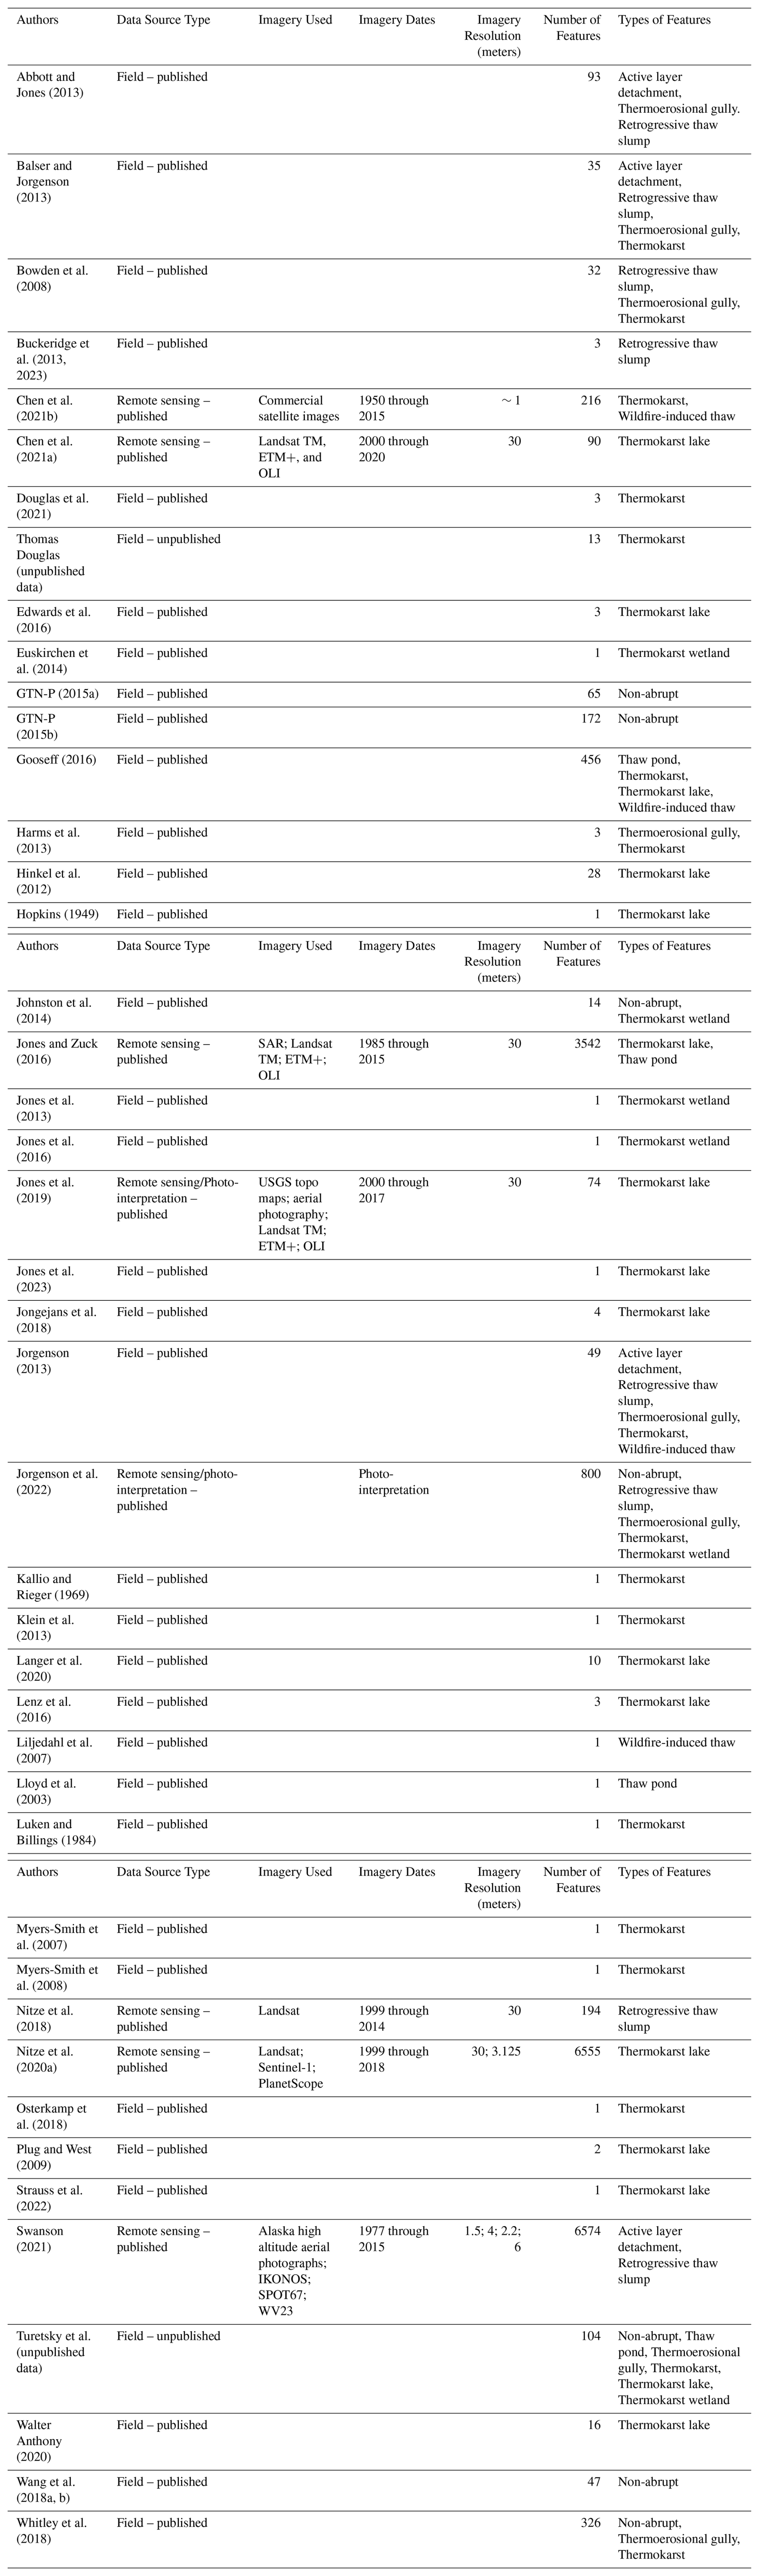
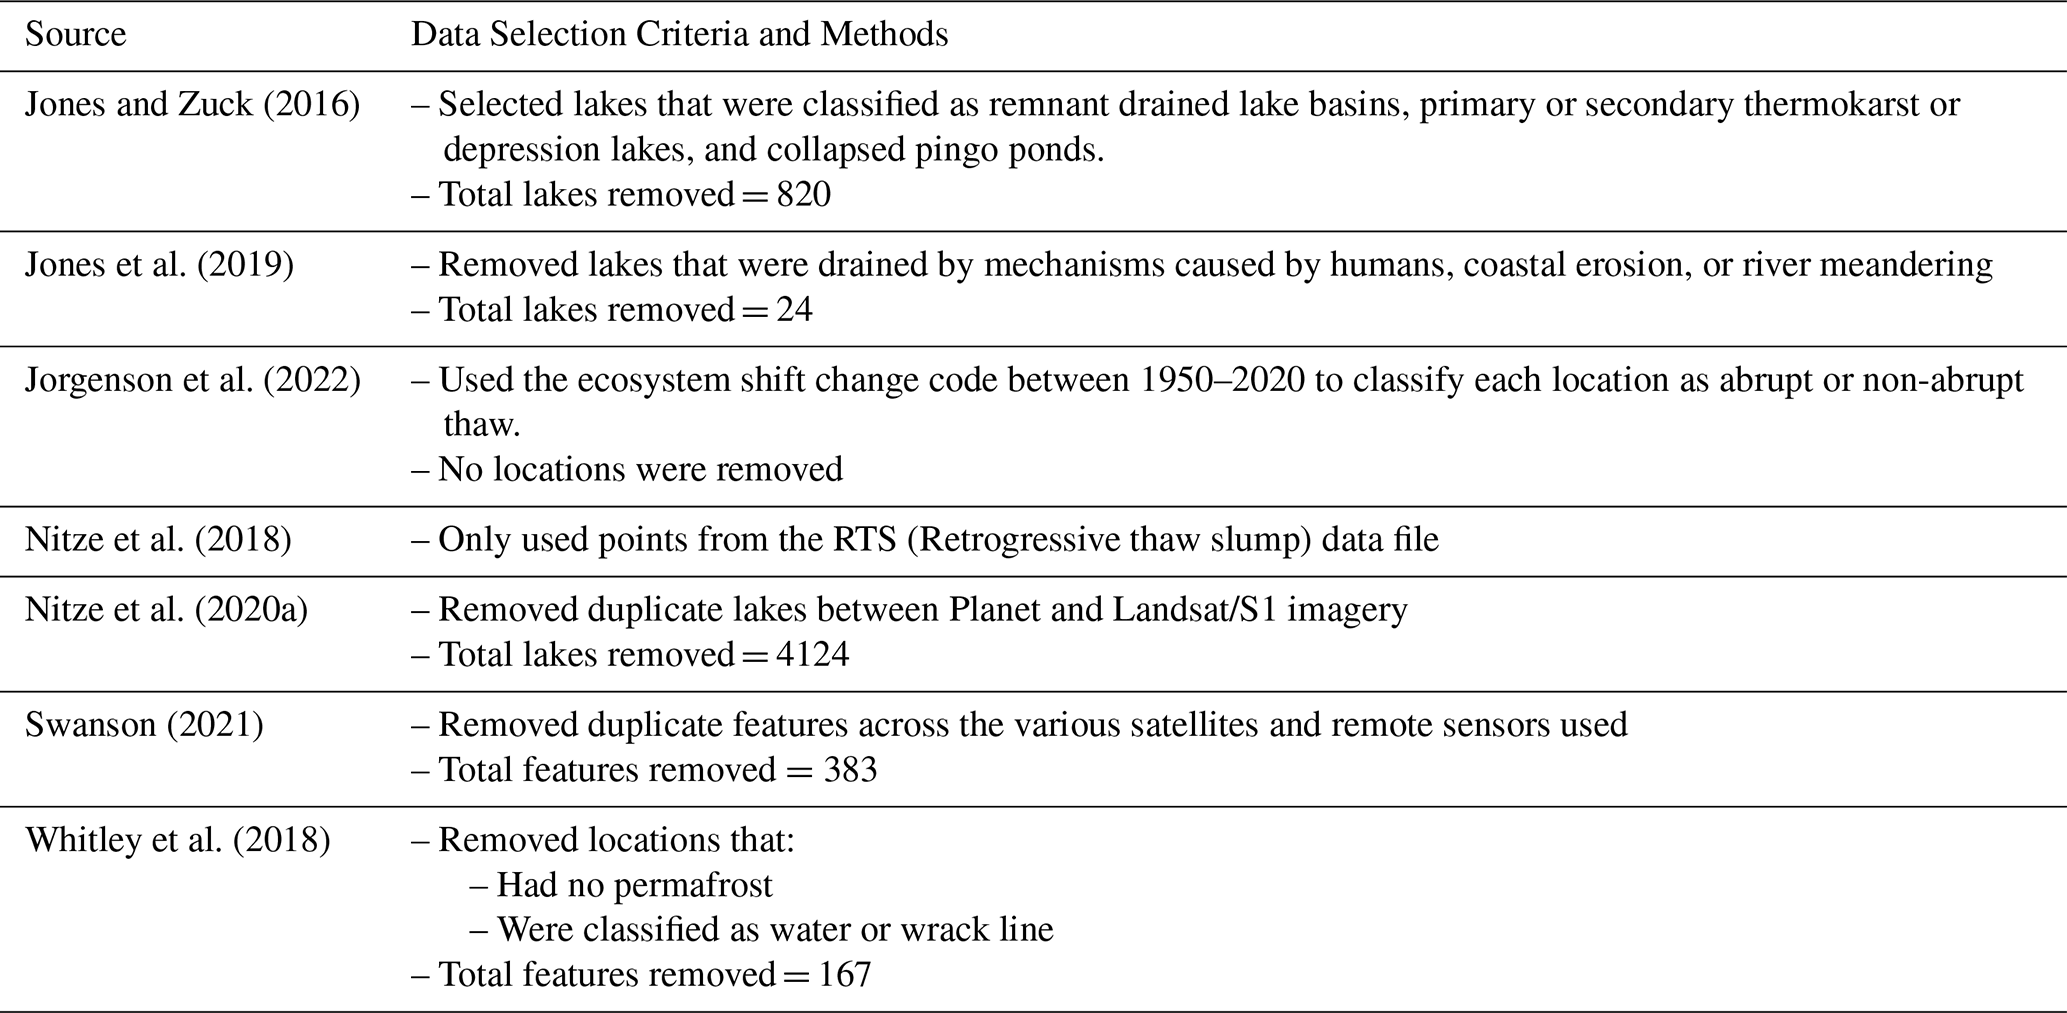
Each of these sources employed different data collection methods resulting in varying levels of accuracy in their final outputs. In particular, the spatial and temporal resolution of remote sensing data has improved significantly over time. Older studies often relied on moderate-resolution imagery such as Landsat (30 m), while more recent measurements frequently utilize high-resolution datasets like ArcticDEM (2 m), enabling more precise detection and characterization of thaw features. We did not manually verify each individual feature, and the features in the database reflect the accuracy of their source dataset. While a comprehensive and quantitative statistical uncertainty analysis is not possible due to the heterogeneity and lack of validation data for our input sources, we have provided metadata on source type, satellite(s) or sensor(s) used (if remotely sensed data), data year(s), and spatial resolution. This level of documentation allows the reliability and limitations of the dataset to be evaluated transparently by users. In addition, the open-access and collaborative nature of the database enables community feedback including the identification and correction of errors, duplicates, omissions, or regional gaps, and provides clear opportunities for continued refinement and expansion as new data become available. To increase consistency across sources, we applied several post-processing techniques to improve data quality (Table 2). These methods included filtering out points located outside the zone of mapped permafrost in Alaska, using only the most recent thaw data when multiple years of thaw data was presented from each source, and removing duplicate locations. Duplicate entries of thaw features with identical names were removed, keeping only the first occurrence of each named feature. For example, both Wang et al. (2018a, b) and the Global Terrestrial Network for Permafrost included sites from the Circumpolar Active Layer Monitoring Network (CALM).
Table 2Description of post-processing methods applied to the relevant database sources. If a source from Table 1 is not listed here, it indicates that no additional quality control measures were needed for the data.
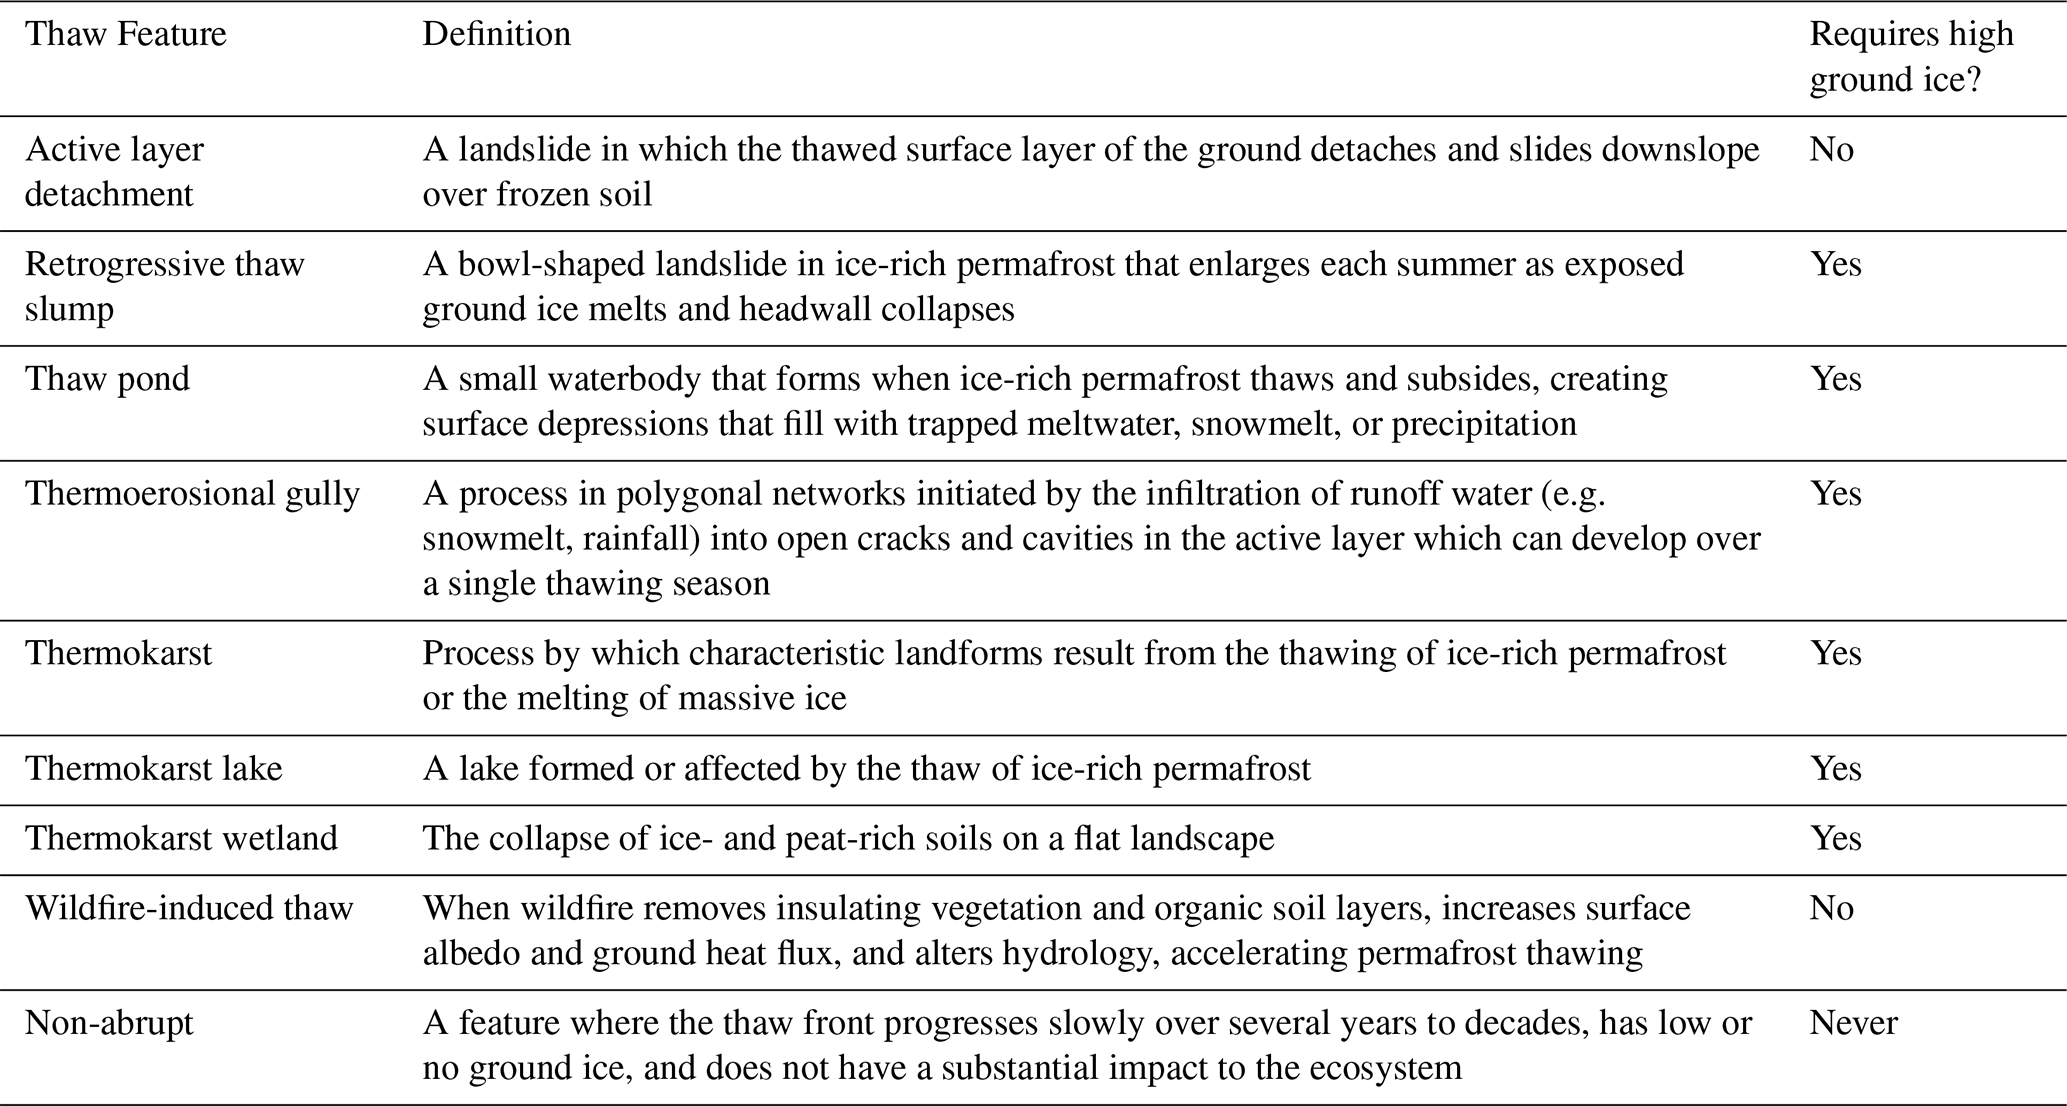
For each point feature, we recorded the identifying source information (authors, DOI), the type of source (field or remote sensing) and its publication status, feature name (if applicable), latitude and longitude (in WGS 84), feature type as reported by the source (i.e., retrogressive thaw slump, thermokarst fen), feature category (feature type simplified into a broader category), type of thaw (abrupt or non-abrupt), and the imagery used along with relevant mapping information such as imagery dates and resolution. Table 3 details these attributes and Table 4 defines the thaw feature categories used in our database. We classified features as abrupt or non-abrupt thaw according to the framework outlined in Webb et al. (2025a), specifically using the decision tree in Fig. 5. Under this scheme, a thaw event is considered abrupt if it develops within 30 years and meets at least one of the following criteria: it involves substrate with high ground ice content (>20 %) or it results in a major ecosystem impact, even in the absence of high ground ice. All other features were classified as non-abrupt.
Table 3Attributes recorded for each point feature in the database including units (when relevant) and descriptions of variables.
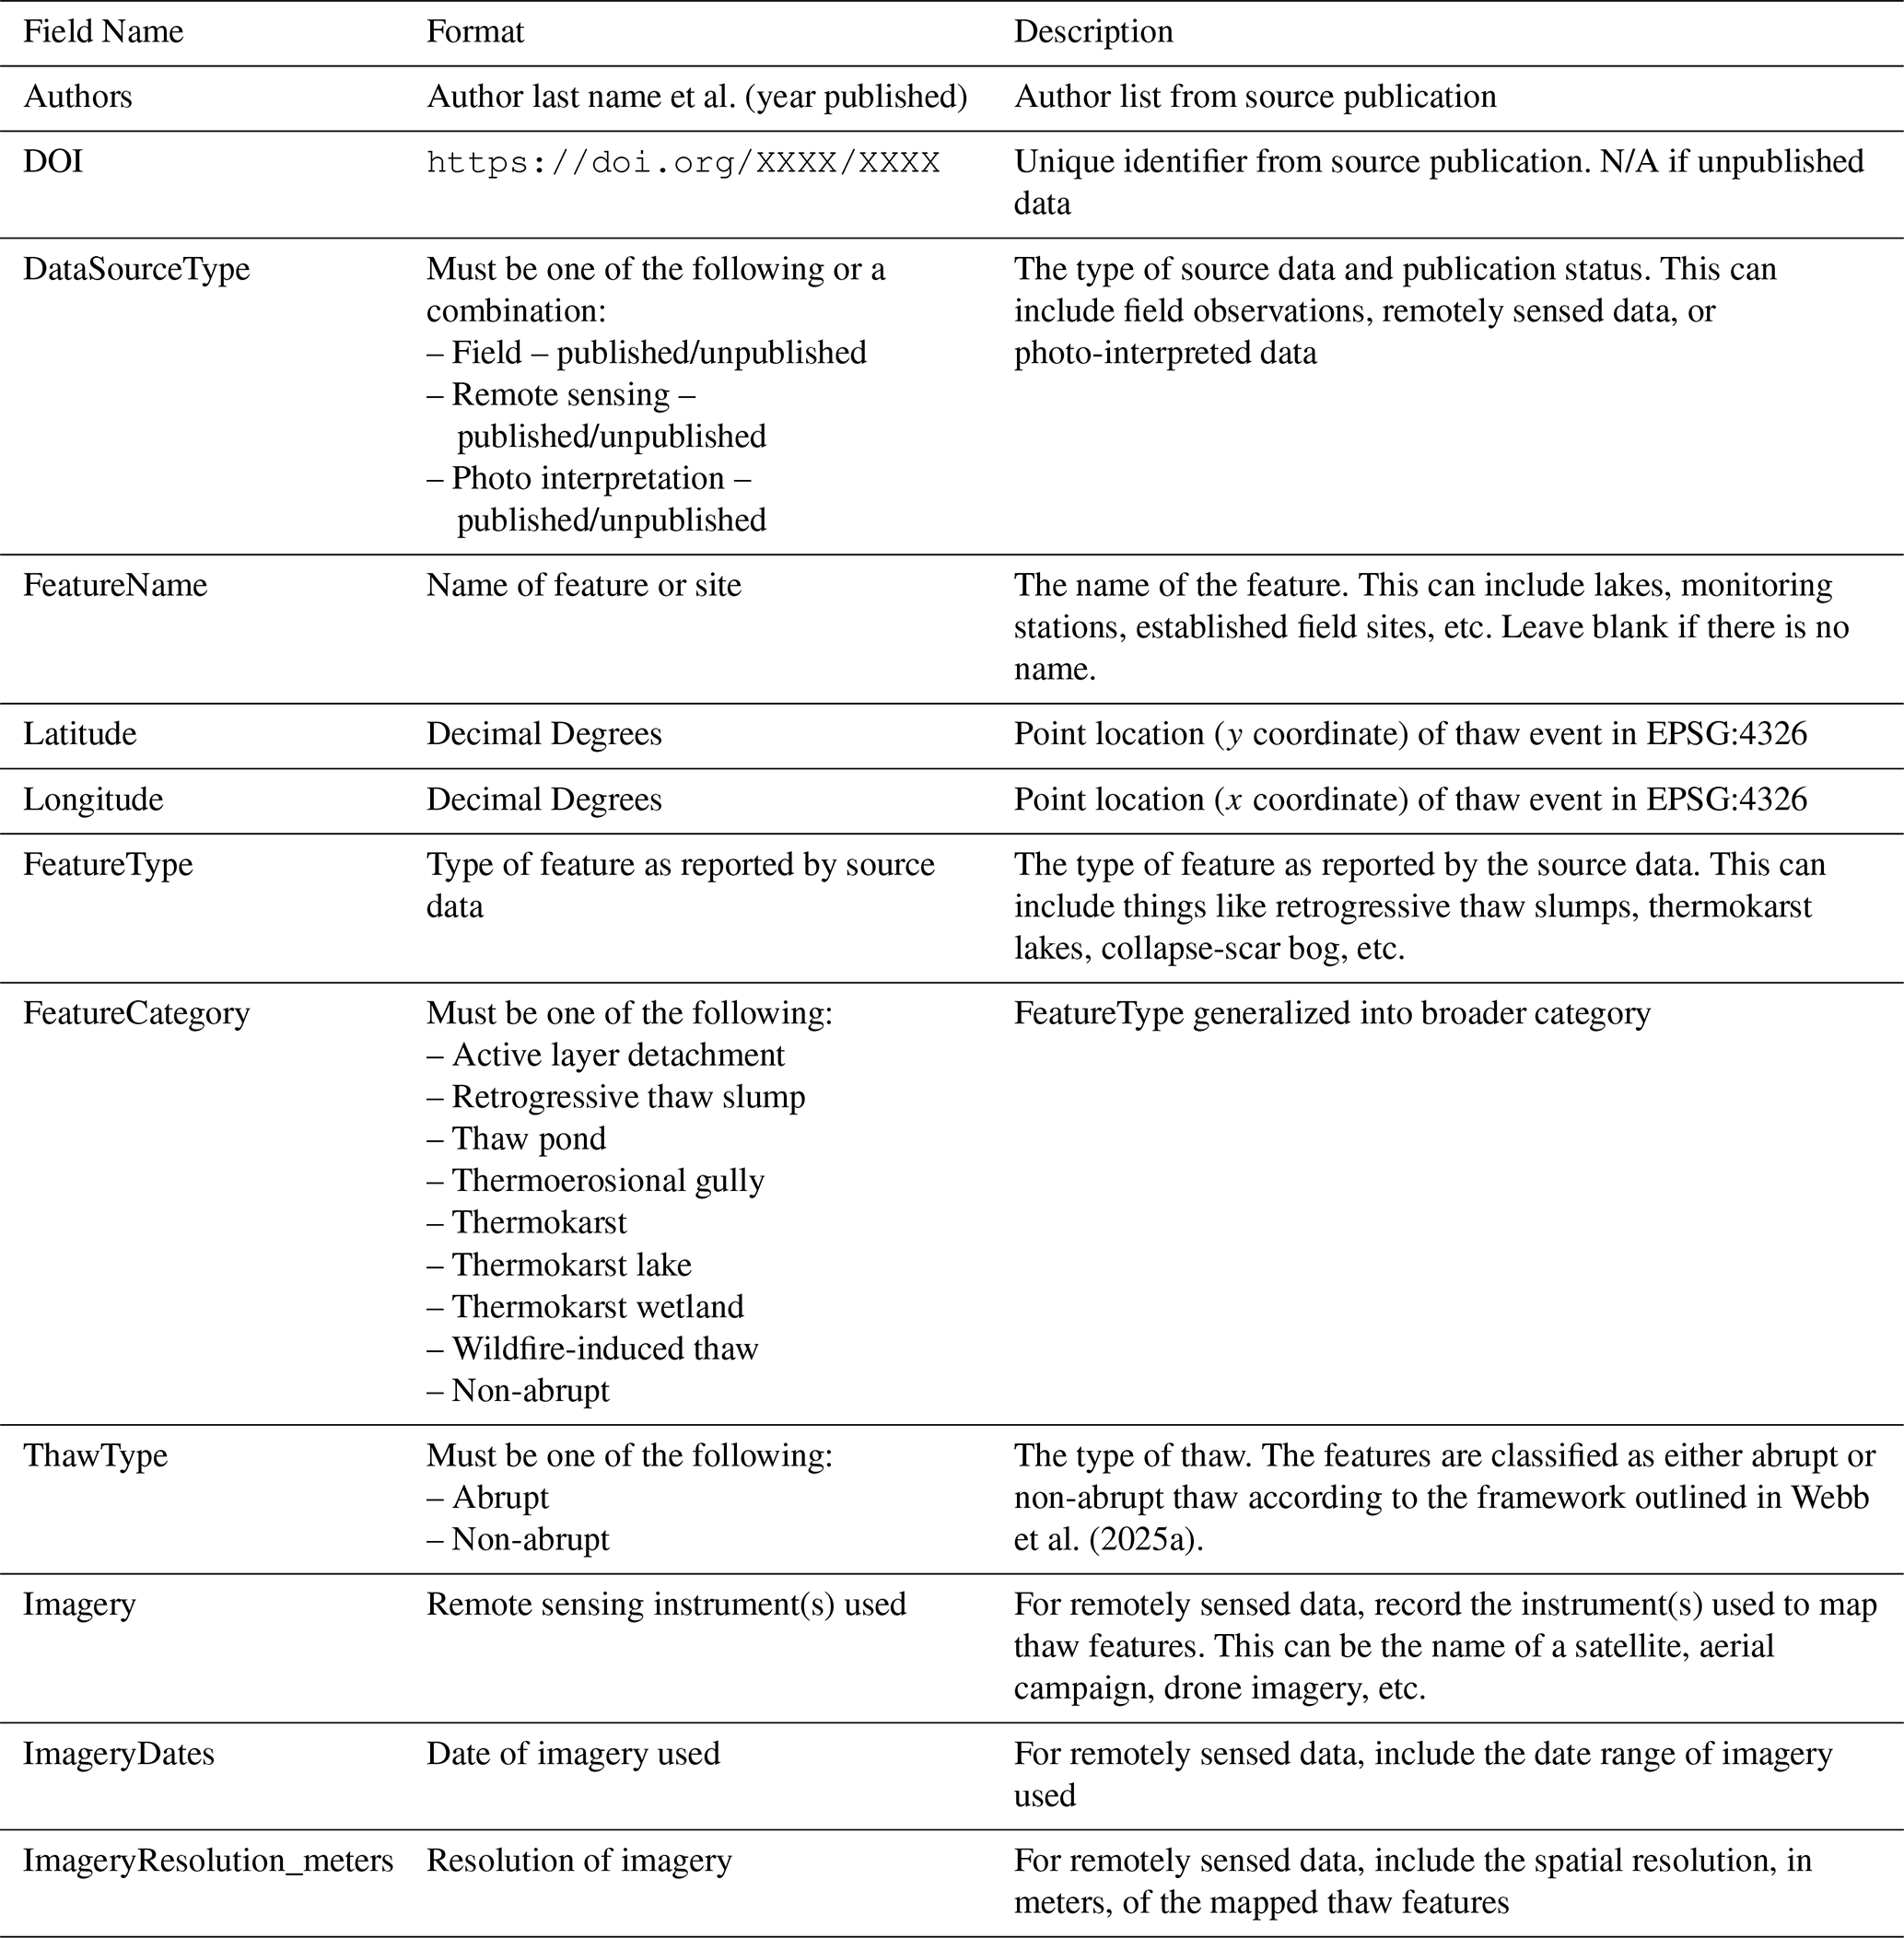
Table 4Definitions for the major permafrost thaw categories in the thaw database. Definitions for features were derived from (Gagnon et al., 2024; Gibson et al., 2018; Lewkowicz et al., 2024; Li et al., 2017; National Snow and Ice Data Center (NSIDC), 2025; Wendel, 2016; Yoshikawa et al., 2002).
2.2 Ecoregion Classification
We divided Alaska into ecoregions based on the EPA's Level III Ecoregions map (Gallant et al., 1995), using Level II classifications with some adjustments (Fig. 1). We distinguished the Brooks Range from the Arctic Tundra, grouped the southern mountain ranges together under a single “Southern Mountains” ecoregion, and classified all areas along the southern coast as “Maritime”. Then, we spatially joined the thaw database with the ecoregion map and quantified the occurrence of various abrupt thaw features within each unique ecoregion.
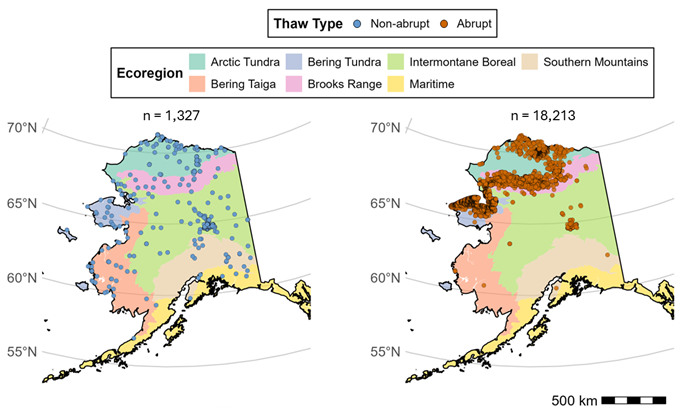
Figure 1Map of non-abrupt (left) and abrupt (right) permafrost thaw locations across Alaska's ecoregions slightly modified from the Level III U.S. EPA Alaska Ecoregions Map (Gallant et al., 1995).
2.3 Environmental Data Extraction
To characterize terrain conditions at observed thaw features, we extracted high-resolution topographic variables from the ArcticDEM (V.4.1) (Porter et al., 2023) using Google Earth Engine (GEE) (Gorelick et al., 2017). We calculated elevation (m), slope (degrees), and aspect (degrees) using the terrain function in GEE. The terrain function derives slope in degrees using a 3 × 3 pixel window around each point. Since the ArcticDEM has a spatial resolution of 2 m, slope was computed from a 36 m2 neighborhood centered on each point. To quantify a thaw feature's topographic position on the landscape, we computed relative elevation by subtracting the mean elevation within a 100 m circular neighborhood from the elevation at each thaw point (Eq. 1). This first-order approximation yields values less than 0 for depressions and values greater than 0 for elevated terrain.
hrel(i) = Relative elevation; hi = Elevation at point i; = Mean elevation within a 100 m circular neighborhood around i.
We calculated a solar radiation index (SRI) following the methods outlined in Fu and Rich (2002) (Eq. 2). The SRI estimates the potential incoming solar radiation under clear-sky conditions at solar noon on the summer solstice (21 June). To define a representative solar azimuth angle for Alaska, we used the NOAA Solar Calculator and selected the geographic center of the state (64.73° N, 152.47° W) since solar azimuth varies minimally across Alaska that time of year. We approximated the solar zenith angle, which varies with latitude, by calculating the absolute difference between each thaw location's latitude and solar declination on the solstice. We acknowledge that the SRI is a simplified proxy for solar energy input, and that local factors such as canopy cover, microclimate, and seasonal daylength variation also influence site-specific solar exposure. However, the SRI provides a useful estimate of potential solar energy input that may affect permafrost thaw vulnerability and is more informative than aspect alone. Because Alaska is at high latitude, the solar radiation index values are centered around ∼ 0.75 for flat terrain, with higher values indicating steeper, south-facing slopes and lower values indicating north-facing slopes or less-exposed terrain.
θZ = solar zenith angle; β = slope; ϕ = aspect; α = solar azimuth angle.
To examine topographic variation in slope, relative elevation, and SRI between abrupt and non-abrupt thaw locations, we performed non-parametric Wilcoxon rank-sum tests (McKnight and Najab, 2010). Because the database is heavily skewed towards abrupt thaw features, we used a bootstrapping approach to balance sample sizes (Efron and Tibshirani, 1993). We conducted 1000 iterations of stratified random sampling, selecting 500 abrupt thaw points and 500 non-abrupt thaw points with replacement in each iteration. We calculated 95 % confidence intervals for the mean values of each variable within abrupt and non-abrupt thaw groups based on the bootstrapped samples. All statistical analyses were conducted in R (version 4.5.0) and the associated code and results can be found at our GitHub repository: https://github.com/ArcticWebb/Alaska_Permafrost_Thaw_Database (last access: 9 April 2026).
2.4 Spatial Comparison with Ground Ice and Yedoma Maps
Areas with high ground ice content are especially prone to abrupt permafrost thaw due to substantial volume loss when ice melts. Ground ice is widely recognized as one of the most influential factors driving abrupt thaw (Jorgenson et al., 2006; Teufel and Sushama, 2019; Turetsky et al., 2020) and many permafrost thaw prediction models use it as a key variable for identifying areas at risk. We acknowledge that precipitation, vegetation, snow cover, and other factors can also influence abrupt thaw, however, many of these drivers are indirectly represented in ground ice maps because those maps are developed using environmental indicators as model inputs. Existing ground ice maps for Alaska were produced at coarse spatial resolutions (statewide or circumpolar) which limits their utility for fine-scale mapping (Heginbottom et al., 2002; Karjalainen et al., 2022). For this study, we compared two of the most widely used datasets: one developed specifically for Alaska and another designed for pan-Arctic ground ice conditions. The Permafrost Characteristics of Alaska map by Jorgenson et al. (2008) estimates ground ice content within the upper 20 m of permafrost based on terrain originally described in Kreig and Reger (1982) and is supplemented with field observations. Inconsistent or patchy permafrost distribution is classified as variable, <10 % as low, 10 %–40 % as moderate, and >40 % as high. In contrast, the Circum-Arctic Map of Permafrost and Ground-Ice Conditions, Version 2 by Heginbottom et al. (2002) summarizes permafrost conditions and ground ice distribution across the Northern Hemisphere (20 to 90° N). Ground ice classification is also based on the upper 20 m of permafrost, with <10 % defined as low, 10 %–20 % as moderate, and >20 % as high. Because the two datasets use different percentage thresholds to define moderate and high ground ice content, we combined the moderate and high classes into a single category for each map while retaining low ground ice as a distinct class since both maps define it as <10 %. This approach groups the majority of landscapes where abrupt thaw is considered probable or highly likely (moderate or high ground ice) while retaining a smaller class where abrupt thaw should be unlikely (low ground ice).
We assessed the ability of these ground ice maps to capture ground ice distribution at a finer scale using our thaw database. Prior to analysis, we removed abrupt thaw processes that do not require ground ice melting, ensuring that the abrupt thaw points used for this analysis only represented ice-dependent thaw processes (Table 4). We then overlaid the maps with the updated thaw database points, extracted the ground ice classification, and calculated the proportion of abrupt and non-abrupt thaw points within each ground ice class. We expected abrupt thaw points to predominantly occur in high or moderate ground ice areas and non-abrupt thaw points to occur in low to no ground ice areas. Finally, we overlaid the ice-dependent abrupt thaw points from our database with the Database of Ice-Rich Yedoma Permafrost by Strauss et al. (2022) and calculated the proportion of these thaw processes within the Yedoma domain. Although duplicate features were removed (Sect. 2.1), some study sites include multiple thaw features which may result in spatial clustering of observations. Therefore, results in Sect. 3.3 should be interpreted as representing broad regional patterns rather than statistically independent observations.
3.1 Database Characteristics
The final database contains 19 540 permafrost thaw locations spanning all ecoregions of Alaska (Fig. 1). Spatial coverage is statewide and the temporal resolution varies because the sources used to map thaw features are based on imagery spanning the past ∼ 70 years. Of these, 18 213 points represent abrupt thaw including 10 625 thermokarst lakes, 5463 active layer detachments, 1450 retrogressive thaw slumps, 280 generic thermokarst processes, 209 wildfire-induced abrupt thaw features, 134 thermokarst wetlands, 47 thermoerosional gullies, and 5 thaw ponds (Fig. 1). An additional 1327 points represent non-abrupt thaw. Abrupt thaw locations were concentrated in northern Alaska (Fig. 1), reflecting the higher abundance of continuous permafrost with near-surface ground ice in this region. The classification of thaw features follows the terminology used in the source data. If the thermokarst type was not specified (i.e., fen, water track), the observation was recorded as “thermokarst” and is hereafter referred to as generic thermokarst processes. Thaw features influenced by wildfire were designated as a distinct class called “wildfire-induced thaw” and were therefore not double-counted with other categories.
3.2 Environmental Characteristics
There were distinct regional differences in types of abrupt thaw across Alaska (Fig. 2). Active layer detachments and retrogressive thaw slumps dominated in mountainous areas like the Brooks Range, while lowland regions like the Arctic and Bering Tundra primarily experienced thermokarst lake expansion and general thermokarst activity. Abrupt thaw accounted for more than 97 % of features in the Arctic Tundra, Bering Tundra, and Brooks Range. In contrast, only 36 % of features in Interior Alaska and 17 % in the Bering Taiga were abrupt thaw while the Southern Mountains and Maritime ecoregions had virtually none. Interior Alaska exhibited the most diverse array of abrupt thaw features, with thermokarst wetlands and wildfire-driven thaw being the most common. We tested whether the distribution of abrupt thaw features differed significantly between Alaska's ecoregions using a chi-square test of independence with Monte Carlo simulation (10 000 replicates) to account for sparse data. The test revealed a highly significant association between thaw feature type and ecoregion (χ2 = 27 509, p<0.001), indicating that abrupt thaw features are not evenly distributed across regions.
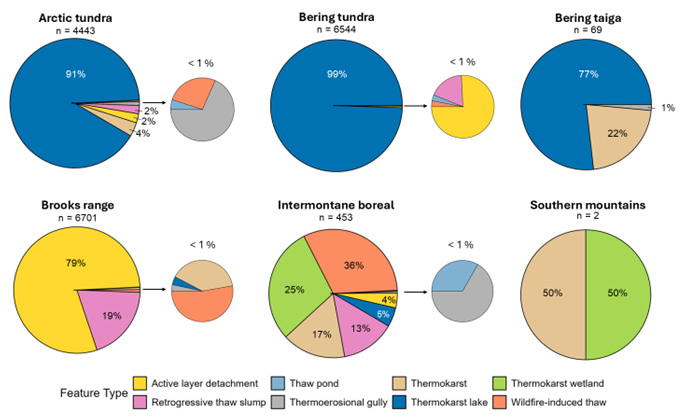
Figure 2Proportion of abrupt thaw feature types across Alaska's major ecoregions. Smaller pie charts adjacent to each main pie highlight feature types that account for less than 1 % of the total within each ecoregion. Ecoregion boundaries were adapted from the Level III U.S. EPA Alaska Ecoregions Map (Gallant et al., 1995).
Two out of three topographic variables (relative elevation and SRI) showed statistically significant differences between abrupt and non-abrupt thaw locations. Slope was not significantly different between abrupt (mean = 5.36°, 95 % CI: [4.70, 6.07]) and non-abrupt thaw locations (mean = 4.01°, 95 % CI: [3.50, 4.60]; p = 0.51). Relative elevation was significantly lower at abrupt thaw locations (mean = −0.66 m, 95 % CI: [−0.78, −0.56]) compared to non-abrupt thaw locations (mean = 0.04 m, 95 % CI: [−0.13, 0.21]; p<0.001). Less intuitively, solar radiation index was significantly lower at abrupt thaw locations (mean = 0.71, 95 % CI: [0.70, 0.71]) compared to non-abrupt thaw locations (mean = 0.75, 95 % CI: [0.74, 0.76]; p < 0.001). Most solar radiation index values fall between 0.6 and 1 and are clustered around 0.75 because the majority of thaw features occur on flat terrain with slopes near 0°. These findings suggest that abrupt thaw is more prevalent in lowlands or depressions and in areas with lower potential solar radiation (Fig. 3), while slope has no significant effect.
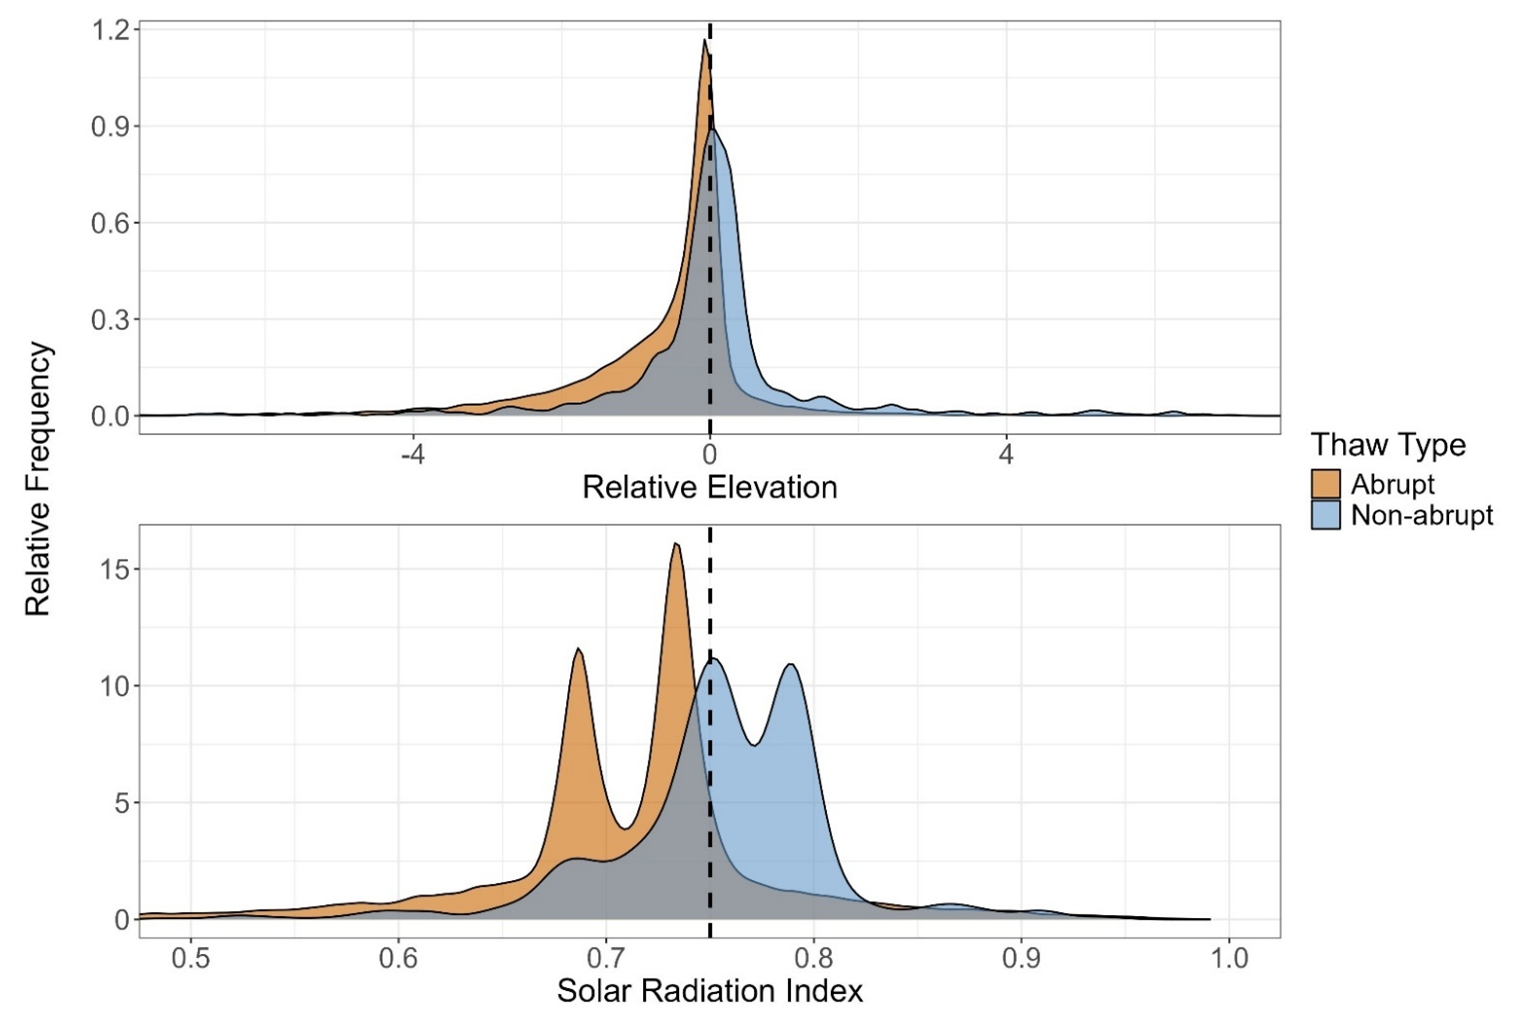
Figure 3Distributions of relative elevation (top) and SRI (bottom) for abrupt and non-abrupt thaw locations across Alaska. In the top panel, values left of the dotted line indicate local depressions while values to the right indicate elevated terrain. In the bottom panel, the x-axis is centered at 0.75 to represent the average SRI value for flat terrain. Density curves show the relative frequency of each thaw type.
3.3 Spatial Comparison with Ground Ice Maps and Yedoma
When we compared our thaw database with the Jorgenson et al. (2008) ground ice map, only 65 % of ice-dependent abrupt thaw locations fell within areas classified as high or moderate ground ice while 35 % occurred in areas labeled low, variable, or unfrozen (Fig. 4). This indicates that this ground ice map only captures about two-thirds of locations where ice-dependent abrupt thaw processes actually occur, revealing a substantial mismatch between the map and observed thaw features. Spatial overlays with the Heginbottom et al. (2002) map showed that 60 % of ice-dependent abrupt thaw locations occurred in areas classified as high or moderate ground ice while 40 % were in low-ice regions (Fig. 4). The spatial distribution of ice-dependent abrupt thaw events in areas classified as having low ground ice content is not uniform across Alaska, with most of the discrepancies being in the Seward peninsula, northern tundra, and parts of interior Alaska. Because the abrupt thaw processes used in this analysis require substantial ice content to develop, these results highlight the potential limitations of existing ground ice datasets for accurately representing permafrost vulnerability at the local scale.
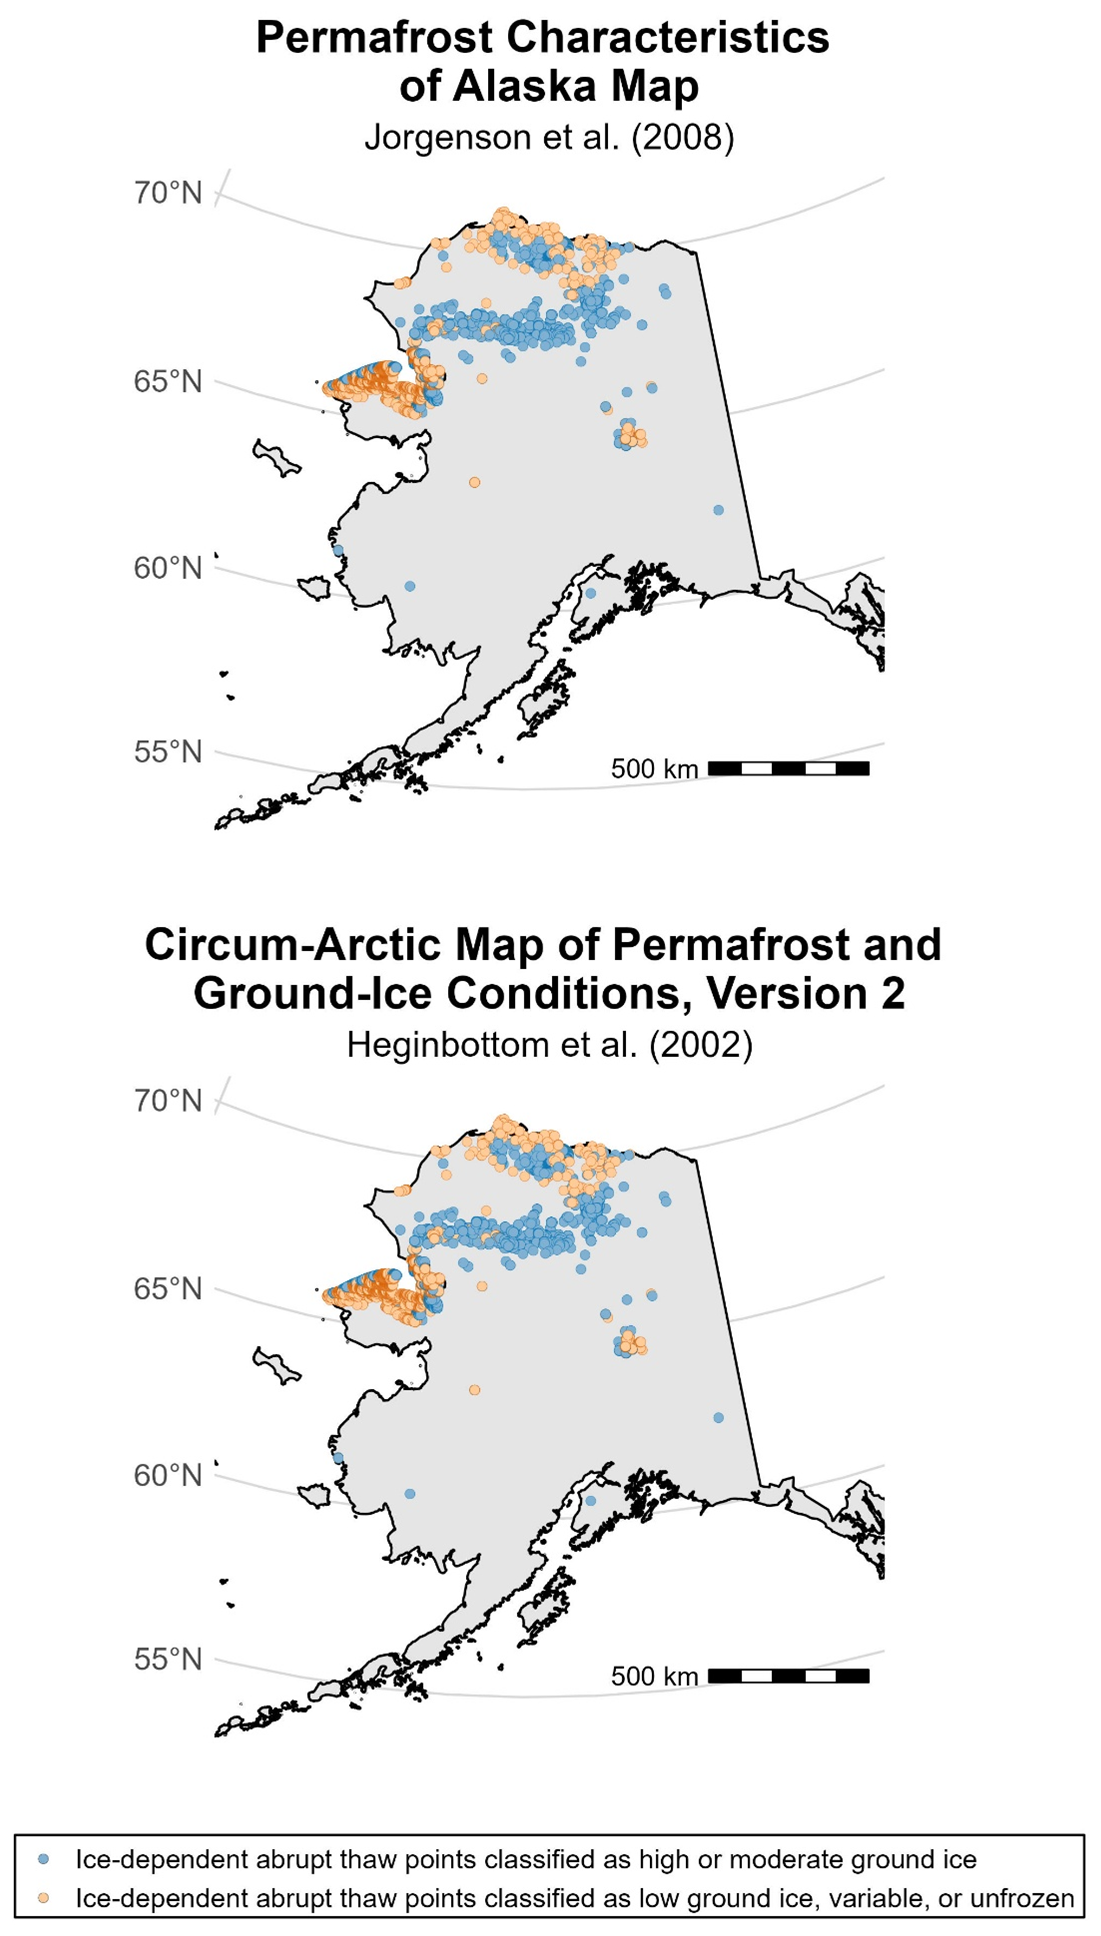
Figure 4Locations of potential misclassifications based on ground ice content from the Permafrost Characteristics of Alaska map (top) and Circum-Arctic Map of Permafrost and Ground-Ice Conditions, Version 2 (bottom). Orange dots represent ice-dependent abrupt thaw features that are misclassified (i.e., mapped in areas of low, variable or unfrozen ground ice) while blue dots represent ice-dependent abrupt thaw features mapped in areas of high or moderate ground ice. Each map shows 12 492 ice-dependent abrupt thaw features from the database.
We also examined the level of agreement between the two ground ice maps across Alaska (Fig. 5). Although Jorgenson et al. (2008) and Heginbottom et al. (2002) show comparable accuracy in identifying ice-dependent abrupt thaw features within areas classified as having high or moderate ground ice, substantial discrepancies remain in their spatial distribution of ground ice content (Fig. 5). Excluding regions without permafrost, the two maps assign the same ground ice class to only 73 % of the permafrost zone, while 27 % is classified differently, meaning that there is conflicting representation on more than one quarter of ground ice distribution in Alaska's permafrost zone. These findings suggest the maps are not only inconsistent with our fine-scale thaw database but also show considerable disagreement with each other.
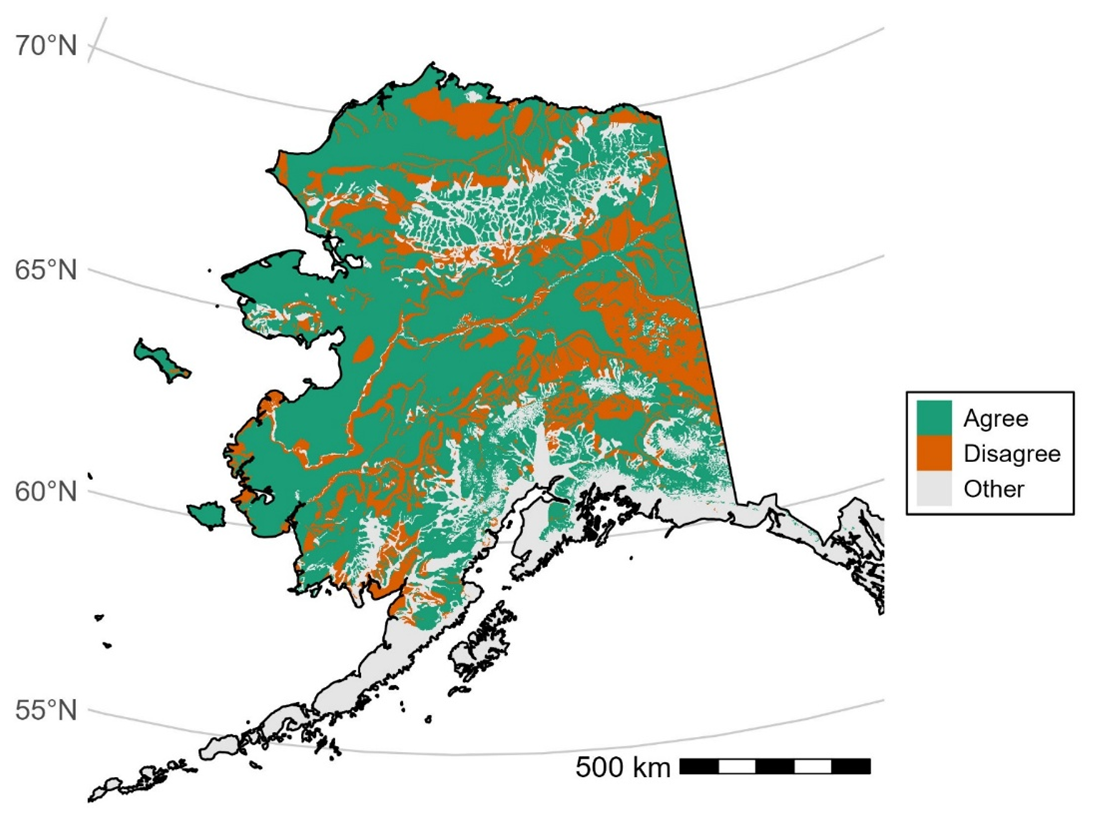
Figure 5Map of areas where Jorgenson et al. (2008) and Heginbottom et al. (2002) agree in ground ice classification (green) and areas where the two maps disagree (orange). Note that we combined the moderate and high classes into a single category for each map while retaining low ground ice as a distinct class.
In addition to evaluating ground ice maps, we examined the spatial relationship between ice-dependent abrupt thaw features (i.e., thaw processes that require high ground ice content to form) and Yedoma. The Yedoma domain covers 38 % of Alaska, yet it includes nearly 60 % of ice-dependent abrupt thaw features from our database, indicating that a substantial proportion of these thaw processes are located in regions underlain by extremely ice- and carbon-rich permafrost (Fig. 6).
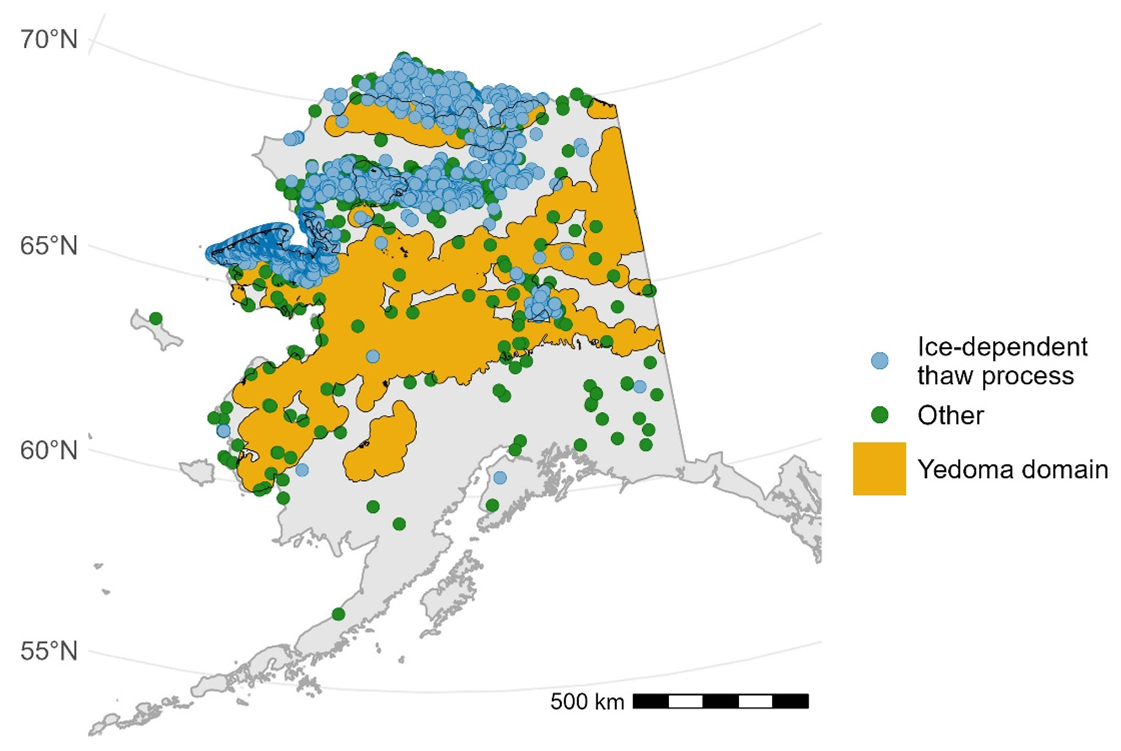
Figure 6Map of ice-dependent (blue) abrupt thaw processes and either ice-independent abrupt thaw processes or gradual thaw processes (green) that occur within or outside the mapped Yedoma domain (yellow) according to Strauss et al. (2022).
Our topographic analysis indicates that abrupt thaw is disproportionately concentrated in local depressions and valley bottoms, suggesting that these low-lying areas may serve as hotspots for abrupt thaw processes. Lowlands often experience greater aeolian or fluvial deposition of fine sediments and more peatland development which are conditions that favor high ground ice content and, over longer timescales, Yedoma formation, both of which increase thaw susceptibility. This finding aligns with previous studies showing that poor drainage in lowlands can promote permafrost degradation (Kokelj and Jorgenson, 2013; Natali et al., 2015; Schuur and Mack, 2018). We found that both relative elevation and SRI were significantly lower at abrupt thaw sites compared to non-abrupt thaw sites. One possible explanation for the higher SRI values for non-abrupt thaw features is that south-facing slopes may have a reduced capacity to accumulate and preserve large amounts of ground ice due to warmer air and soil temperatures from increased solar radiation, leading to drier, better-drained soils that are less prone to ice development and subsequent thermokarst processes. Steep slopes and high gradient areas typically have lower ground ice and shallower depth to bedrock permafrost which will not exhibit thaw features (Van Soest et al., 2025). In contrast, low SRI sites such as north-facing slopes or valley bottoms have cooler, wetter conditions conducive to ice formation, making them more susceptible to abrupt thaw once thaw initializes. It is also important to note that our SRI metric does not incorporate canopy cover or low-lying vegetation which can limit the amount of sunlight that reaches the ground surface. Dense vegetation cover in low-SRI areas could further protect ice-rich permafrost and lead to more accumulation of ground ice over time, ultimately increasing the risk of eventual ground subsidence. We observed no significant relationship between slope steepness and thaw type (abrupt vs. non-abrupt), suggesting that slope alone is not a primary control on abrupt thaw and reinforcing the need to consider multiple environmental variables such as vegetation, local hydrology, storm events, and soil temperature when assessing thaw risk.
Although current ground ice datasets, such as Jorgenson et al. (2008) and Heginbottom et al. (2002), are valuable for regional to pan-Arctic scale assessments, they were not designed to capture fine-scale (i.e., 10s to 100s of meters) heterogeneity in ground ice conditions that represent typical thaw feature sizes. The spatial clustering of apparent misclassifications suggests that localized ice-rich deposits may not always be resolved in regional maps. These discrepancies may rise from sub-grid heterogeneity, including ice-wedge polygon terrain, or from thermokarst legacy landscapes where thaw features formed when ground ice content was higher in the past. Our analysis revealed that only 60 %–65 % of abrupt thaw locations fall within areas classified as high or moderate ground ice, suggesting that current datasets may have limitations in quantifying the distribution of ice-rich permafrost at finer scales. Of these ice-dependent abrupt thaw processes, more than half (∼ 59 %) occur within the mapped Yedoma domain (which only occupies 38 % of our study area) and are exceptionally ice-rich and contain large stores of organic carbon. Thaw in these regions could drive rapid ground subsidence and release vast amounts of bioavailable carbon (Strauss et al., 2017), including methane which is about 28.5 times more potent as a greenhouse gas than carbon dioxide over a 100-year time period (Bäck et al., 2024). Outside the Yedoma domain, this vulnerability is generally concentrated in the upper ∼ 3 m of permafrost as deeper gravels or bedrock tend to slow down vertical thaw feature expansion. The presence of abrupt thaw outside mapped ice-rich zones underscores the limited utility of existing maps for local-scale prediction and highlights the urgent need for higher-resolution ground ice products across Alaska and the broader Arctic to improve modeling accuracy and risk assessment for abrupt thaw. Recent efforts to explicitly map permafrost vulnerability, such as the fine-scale study of three military training lands in interior Alaska by Jorgenson et al. (2025), demonstrate the potential of integrating soil thermal conditions and permafrost characteristics into vulnerability frameworks. These detailed assessments are regional in scope, but our statewide thaw database provides an observational foundation for extending these approaches to broader landscapes. Together, these complementary efforts can create a path towards more accurate representations of permafrost thaw risk.
Our database of 19 540 features represents the most comprehensive compilation of permafrost thaw observations across Alaska. However, there are a few limitations. Spatial coverage is uneven, with denser sampling along road systems, at long term field sites, and in more accessible regions, highlighting the need for observations in underrepresented areas. There are three regions in particular that would benefit from more field observations: (1) the Northwestern Arctic Slope uplands including the Colville River drainage and the northern foothills of the Brooks Range; (2) Western Interior Alaska including much of Denali National Park and sections of the Yukon River drainage; and (3) Eastern Alaska including the northeastern Brooks Range, eastern Interior, and northeastern Alaska Range. The majority of these regions have no road access and are some of the most remote parts of Alaska; however, they comprise a large area of the state and should be prioritized in future field campaigns because additional data from these areas would improve the representativeness of the database. Because observations in our database are not randomly sampled, the results of our statistical tests should be interpreted with caution. Sampling is biased toward regions that have had more research activity, resulting in overrepresentation of areas including the Brooks Range, Seward Peninsula, and Arctic tundra lowlands. Our database is also limited by relatively few non-abrupt thaw points, largely due to observational bias since non-thawing or gradually thawing landscapes are harder to detect with remote sensing and are less frequently studied. Another limitation is the dominance of thermokarst lakes in the dataset, which could skew model outputs toward aquatic thaw processes while underrepresenting terrestrial forms of abrupt thaw. While the dataset can be filtered to focus on specific thaw features, we retained all observations to preserve flexibility for diverse research applications.
In summary, our analyses reveal how topography both governs and is transformed by abrupt thaw, yet current ground ice maps remain too coarse for reliable local-scale prediction. Future research should build on these relationships by integrating our database with geospatial layers such as soil thermal conditions, ground ice, hydrology, vegetation, and weather data to model permafrost thaw vulnerability across Alaska. This approach would inform thaw susceptibility in regions where field observations are sparse and provide more accurate prediction of abrupt thaw at local scales. Consequently, our database provides an unprecedented resource for studying the spatial patterns of permafrost thaw in Alaska while also laying the groundwork for improved methods of modeling future thaw in a rapidly changing Arctic.
The Alaska Permafrost Thaw Database is publicly available at https://github.com/ArcticWebb/Alaska_Permafrost_Thaw_Database and https://doi.org/10.5281/zenodo.16996415 (Webb et al., 2025b).
Our Google Earth Engine Script is publicly available at https://github.com/ArcticWebb/Alaska_Permafrost_Thaw_Database/tree/main/Scripts (last access: 10 November 2025) and https://doi.org/10.5281/zenodo.16996415 (Webb et al., 2025b).
Our database represents the most spatially comprehensive synthesis of abrupt and non-abrupt permafrost thaw observations across Alaska to date. Our analysis reveals key topographic and environmental drivers of thaw: abrupt thaw is more prevalent in low-elevation valley bottoms and in areas with less solar radiation potential. While current ground ice maps remain valuable for large-scale assessments, their limitations at finer resolutions emphasize the need for improved products to support local-scale planning and risk mitigation. Notably, more than half of ice-dependent abrupt thaw features in our database occur in Yedoma deposits, which are exceptionally ice- and carbon-rich, highlighting these regions as potential hotspots for greenhouse gas emissions.
The Alaska Permafrost Thaw Database provides an open-access, collaborative framework that invites continual addition, refinement, and expansion of thaw observations and serves as a foundational tool for diverse applications. It enables researchers to identify data gaps and prioritize future field campaigns while also offering critical training and validation data for modeling and machine learning efforts. By including both abruptly thawing and more stable permafrost locations, the dataset provides the contrast needed for robust modeling of thaw vulnerability. Its utility extends to local governments, planning agencies, Indigenous communities, the U.S. military, and others seeking to develop targeted adaptation and mitigation strategies in the face of accelerating permafrost degradation. As permafrost thaw continues to reshape Arctic landscapes, high-quality, accessible spatial data such as this database will be essential for anticipating change. The Alaska Permafrost Thaw Database not only provides a baseline for ongoing monitoring and modeling but also advances collective efforts to understand, prepare for, and respond to the complex impacts of permafrost thaw in a warming world.
We welcome contributions of new abrupt or non-abrupt permafrost thaw locations across Alaska. Contributions are accepted via pull requests on the GitHub repository: https://github.com/ArcticWebb/Alaska_Permafrost_Thaw_Database. See the CONTRIBUTING.md file for detailed instructions on how to submit new thaw locations.
H.W. and M.R.T. conceived the study and methodology. H.W. compiled the database, developed the Google Earth Engine script, and conducted all analyses. E.P., T.A.D., and I.O. contributed to validation by providing feedback and suggestions on the analyses. B.W.A., W.B.B., Y.C., Y.C., J.E., E.S.E., M.L., I.H.M., J.S., K.W.A., K.W., M.A.W. contributed published data to help form this database and provided feedback and suggestions to ensure their data were represented accurately. H.W. prepared the original draft of the manuscript and all authors contributed to review and editing.
The contact author has declared that none of the authors has any competing interests.
Any errors and opinions are not those of the Army Research Office or Department of Defense and are attributable solely to the authors.
Publisher's note: Copernicus Publications remains neutral with regard to jurisdictional claims made in the text, published maps, institutional affiliations, or any other geographical representation in this paper. The authors bear the ultimate responsibility for providing appropriate place names. Views expressed in the text are those of the authors and do not necessarily reflect the views of the publisher.
The research reported here was funded in part by the Army Research Office/Army Research Laboratory via grant #W911NF-23-1-0311 to the University of Colorado Boulder. This material is based upon work supported by the Broad Agency Announcement Program and the Cold Regions Research and Engineering Laboratory (ERDC-CRREL) under Contract No. W913E524C0003. I.O. and E.P. initiated permafrost terrain analysis codes with support of NSF-OPP award 1844181. T.A.D. was supported by the Strategic Environmental Research and Development Program (project RC18-1170) and the Environmental Security Technology Demonstration Program (project NH22-7408). J.S. was supported by the Virtual Institute for the Carbon Cycle (VICC, project Rapid Permafrost Thaw Carbon Trajectories – PeTCaT, funded by Schmidt Sciences).
We would also like to acknowledge the contributions of the many scientists and research teams whose published data form the foundation of this database. In total, 44 independent sources were integrated, representing decades of work across Alaska. We thank these authors for their invaluable contributions (see Table 1 and References for full source list).
This research has been supported by the Army Research Office (grant no. W911NF-23-1-0311), the U.S. Army Corps of Engineers (grant no. W913E524C0003), the Office of Polar Programs (grant no. 1844181), the Strategic Environmental Research and Development Program (grant no. RC18-1170), and the U.S. Department of Defense (grant no. NH22-7408).
This paper was edited by Achim A. Beylich and reviewed by two anonymous referees.
Abbott, B. and Jones, J.: Soil respiration, water chemistry, and soil gas data for thermokarst features and undisturbed tundra on the North Slope of Alaska, NSF Arctic Data Center, https://doi.org/10.18739/A23T9D71C, 2013.
Andresen, C. G., Lawrence, D. M., Wilson, C. J., McGuire, A. D., Koven, C., Schaefer, K., Jafarov, E., Peng, S., Chen, X., Gouttevin, I., Burke, E., Chadburn, S., Ji, D., Chen, G., Hayes, D., and Zhang, W.: Soil moisture and hydrology projections of the permafrost region – a model intercomparison, The Cryosphere, 14, 445–459, https://doi.org/10.5194/tc-14-445-2020, 2020.
Bäck, H., May, R., Naidu, D. S., and Eikenberry, S.: Effect of methane mitigation on global temperature under a permafrost feedback, Glob. Environ. Change Adv., 2, 100005, https://doi.org/10.1016/j.gecadv.2024.100005, 2024.
Ballinger, T. J., Crawford, A., and Serreze, M. C.: NOAA Arctic Report Card 2025: Surface Air Temperature, NOAA Tech. Rep. OAR ARC 25-02, https://doi.org/10.25923/CJ60-9S07, 2025.
Balser, A. and Jorgenson, M.: Surface and Upper Permafrost Site Properties, Northern Alaska, NSF Arctic Data Center, https://doi.org/10.18739/A2JG7M, 2013.
Bamber, J. L., Oppenheimer, M., Kopp, R. E., Aspinall, W. P., and Cooke, R. M.: Ice sheet contributions to future sea-level rise from structured expert judgment, P. Natl. Acad. Sci., 116, 11195–11200, https://doi.org/10.1073/pnas.1817205116, 2019.
Bigalke, S. and Walsh, J. E.: Future Changes of Snow in Alaska and the Arctic under Stabilized Global Warming Scenarios, Atmosphere, 13, 541, https://doi.org/10.3390/atmos13040541, 2022.
Bowden, W. B., Gooseff, M. N., Balser, A., Green, A., Peterson, B. J., and Bradford, J.: Sediment and nutrient delivery from thermokarst features in the foothills of the North Slope, Alaska: Potential impacts on headwater stream ecosystems, J. Geophys. Res.-Biogeosci., 113, 2007JG000470, https://doi.org/10.1029/2007JG000470, 2008.
Buckeridge, K. M., Shimel, J. P., Mack, M. C., and Schurr, E.: Ecosystem nutrient cycling following thermokarst disturbance, NSF Arctic Data Center, https://doi.org/10.18739/A2V97ZS2J, 2013.
Buckeridge, K. M., McLaren, J. R., Mack, M. C., Schuur, E. A. G., and Schimel, J.: Missing nitrogen source during ecosystem succession within retrogressive thaw slumps in Alaska, Environ. Res. Lett., 18, 065003, https://doi.org/10.1088/1748-9326/acd0c2, 2023.
Chen, Y., Liu, A., and Cheng, X.: A dataset of thermokarst lake drainage events in northern Alaska (2000–2020), Zenodo, https://doi.org/10.5281/ZENODO.4998099, 2021a.
Chen, Y., Lara, M., Jones, B., Frost, G., and Hu, F. S.: Thermokarst acceleration in Arctic tundra driven by climate change and fire disturbance, NSF Arctic Data Center, 1950–2015, https://doi.org/10.18739/A2610VT0G, 2021b.
Douglas, T. A., Hiemstra, C. A., Anderson, J. E., Barbato, R. A., Bjella, K. L., Deeb, E. J., Gelvin, A. B., Nelsen, P. E., Newman, S. D., Saari, S. P., and Wagner, A. M.: Recent degradation of interior Alaska permafrost mapped with ground surveys, geophysics, deep drilling, and repeat airborne lidar, The Cryosphere, 15, 3555–3575, https://doi.org/10.5194/tc-15-3555-2021, 2021.
Edwards, M., Grosse, G., Jones, B. M., and McDowell, P.: The evolution of a thermokarst-lake landscape: Late Quaternary permafrost degradation and stabilization in interior Alaska, Sediment. Geol., 340, 3–14, https://doi.org/10.1016/j.sedgeo.2016.01.018, 2016.
Efron, B. and Tibshirani, R. J.: An Introduction to the Bootstrap, Springer US, Boston, MA, Chapman and Hall/CRC, https://doi.org/10.1201/9780429246593, 1993.
Euskirchen, E. S., Edgar, C. W., Turetsky, M. R., Waldrop, M. P., and Harden, J. W.: Differential response of carbon fluxes to climate in three peatland ecosystems that vary in the presence and stability of permafrost: Carbon fluxes and permafrost thaw, J. Geophys. Res.-Biogeo., 119, 1576–1595, https://doi.org/10.1002/2014JG002683, 2014.
Fu, P. and Rich, P. M.: A geometric solar radiation model with applications in agriculture and forestry, Comput. Electron. Agr., 37, 25–35, https://doi.org/10.1016/S0168-1699(02)00115-1, 2002.
Gagnon, S., Fortier, D., Godin, É., and Veillette, A.: The cryostratigraphy of thermo-erosion gullies in the Canadian High Arctic demonstrates the resilience of permafrost, The Cryosphere, 18, 4743–4763, https://doi.org/10.5194/tc-18-4743-2024, 2024.
Gallant, A. L., Binnian, E. F., Omernik, J., and Shasby, M.: Ecoregions of Alaska: U.S. Geological Survey Professional Paper 1567, Report: iv, 73 pp., Plate: 39.00 x 20.50 inches, https://doi.org/10.3133/pp1567, 1995.
Gibson, C. M., Chasmer, L. E., Thompson, D. K., Quinton, W. L., Flannigan, M. D., and Olefeldt, D.: Wildfire as a major driver of recent permafrost thaw in boreal peatlands, Nat. Commun., 9, 3041, https://doi.org/10.1038/s41467-018-05457-1, 2018.
Gooseff, M.: Ground temperature at and near thermokarst sites around Toolik Lake Field Station, Summer 2009–Summer 2012, NSF Arctic Data Center, https://doi.org/10.18739/A2M89X, 2016.
Gorelick, N., Hancher, M., Dixon, M., Ilyushchenko, S., Thau, D., and Moore, R.: Google Earth Engine: Planetary-scale geospatial analysis for everyone, Remote Sens. Environ., 202, 18–27, https://doi.org/10.1016/j.rse.2017.06.031, 2017.
GTN-P: Global Terrestrial Network for Permafrost metadata for active layer monitoring (CALM) sites, PANGAEA, https://doi.org/10.1594/PANGAEA.842815, 2015a.
GTN-P: Global Terrestrial Network for Permafrost metadata for permafrost boreholes (TSP), PANGAEA, https://doi.org/10.1594/PANGAEA.842820, 2015b.
Harms, T. K., Abbott, B. W., and Jones, J. B.: Thermo-erosion gullies increase nitrogen available for hydrologic export, Biogeochemistry, 117, 299–311, https://doi.org/10.1007/s10533-013-9862-0, 2013.
Harris, S. A., French, H. M., Heginbottom, J. A., Johnston, G. H., Ladanyi, B., Sego, D. C., and van Everdingen, R. O.: Glossary of permafrost and related ground-ice terms, Assoc. Comm. Geotech. Res. Natl. Res. Counc. Can. Ott., 156, 63–64, 1988.
Heginbottom, J., Brown, J., Ferrians, O., and Melnikov, E. S.: Circum-Arctic Map of Permafrost and Ground-Ice Conditions, Version 2, National Snow and Ice Data Center, https://doi.org/10.7265/SKBG-KF16, 2002.
Hinkel, K. M., Sheng, Y., Lenters, J. D., Lyons, E. A., Beck, R. A., Eisner, W. R., and Wang, J.: Thermokarst Lakes on the Arctic Coastal Plain of Alaska: Geomorphic Controls on Bathymetry, Permafrost. Periglac., 23, 218–230, https://doi.org/10.1002/ppp.1744, 2012.
Hjort, J., Streletskiy, D., Doré, G., Wu, Q., Bjella, K., and Luoto, M.: Impacts of permafrost degradation on infrastructure, Nat. Rev. Earth Environ., 3, 24–38, https://doi.org/10.1038/s43017-021-00247-8, 2022.
Hopkins, D. M.: Thaw Lakes and Thaw Sinks in the Imuruk Lake Area, Seward Peninsula, Alaska, J. Geol., 57, 119–131, 1949.
Johnston, C. E., Ewing, S. A., Harden, J. W., Varner, R. K., Wickland, K. P., Koch, J. C., Fuller, C. C., Manies, K., and Jorgenson, M. T.: Effect of permafrost thaw on CO2 and CH4 exchange in a western Alaska peatland chronosequence, Environ. Res. Lett., 9, 085004, https://doi.org/10.1088/1748-9326/9/8/085004, 2014.
Jones, B. and Zuck, C. A.: Fish Creek Watershed Lake Classification, NPRA, Alaska, 2016, U.S. Geological Survey, https://doi.org/10.5066/F7H70CXB, 2016.
Jones, B., Arp, C., Grosse, G., Nitze, I., Lara, M., Whitman, M., Farquharson, L., Kanevskiy, M., Parsekian, A., Breen, A., Ohara, N., Rangel, R., and Hinkel, K.: Historic Lake Drainage on the Western Arctic Coastal Plain in Northern Alaska from Remote Sensing Datasets, 1955–2017, NSF Arctic Data Center, https://doi.org/10.18739/A2DR2P85H, 2019.
Jones, B. M., Baughman, C. A., Romanovsky, V. E., Parsekian, A. D., Babcock, E. L., Stephani, E., Jones, M. C., Grosse, G., and Berg, E. E.: Presence of rapidly degrading permafrost plateaus in south-central Alaska, The Cryosphere, 10, 2673–2692, https://doi.org/10.5194/tc-10-2673-2016, 2016.
Jones, B. M., Schaeffer Tessier, S., Tessier, T., Brubaker, M., Brook, M., Schaeffer, J., Ward Jones, M. K., Grosse, G., Nitze, I., Rettelbach, T., Zavoico, S., Clark, J. A., and Tape, K. D.: Integrating local environmental observations and remote sensing to better understand the life cycle of a thermokarst lake in Arctic Alaska, Arct. Antarct. Alp. Res., 55, 2195518, https://doi.org/10.1080/15230430.2023.2195518, 2023.
Jones, M. C., Booth, R. K., Yu, Z., and Ferry, P.: A 2200-Year Record of Permafrost Dynamics and Carbon Cycling in a Collapse-Scar Bog, Interior Alaska, Ecosystems, 16, 1–19, https://doi.org/10.1007/s10021-012-9592-5, 2013.
Jongejans, L. L., Strauss, J., Lenz, J., Peterse, F., Mangelsdorf, K., Fuchs, M., and Grosse, G.: Table S1: Sedimentological and biogeochemical data of yedoma and thermokarst deposits in Baldwin Peninsula, West-Alaska, PANGAEA, https://doi.org/10.1594/PANGAEA.892306, 2018.
Jorgenson, M., Yoshikawa, K., Kanevskiy, M., Shur, Y., Romanovsky, V., Marchenko, S., Grosse, G., Brown, J., and Jones, B.: Permafrost characteristics of Alaska, Institute of Northern Engineering, University of Alaska Fairbanks, Citation ID: 29801, 2008.
Jorgenson, M. T., Shur, Y. L., and Pullman, E. R.: Abrupt increase in permafrost degradation in Arctic Alaska, Geophys. Res. Lett., 33, L02503, https://doi.org/10.1029/2005GL024960, 2006.
Jorgenson, M. T., Brown, D. R. N., Hiemstra, C. A., Genet, H., Marcot, B. G., Murphy, R. J., and Douglas, T. A.: Drivers of historical and projected changes in diverse boreal ecosystems: fires, thermokarst, riverine dynamics, and humans, Environ. Res. Lett., 17, 045016, https://doi.org/10.1088/1748-9326/ac5c0d, 2022.
Jorgenson, M. T., Douglas, T. A., Shur, Y. L., and Kanevskiy, M. Z.: Mapping the Vulnerability of Boreal Permafrost in Central Alaska in Relation to Thaw Rate, Ground Ice, and Thermokarst Development, J. Geophys. Res.-Earth Surf., 130, e2024JF008030, https://doi.org/10.1029/2024JF008030, 2025.
Jorgenson, T.: Permafrost soil database with information on site, topography, geomorphology, hydrology, soil stratigraphy, soil carbon, ground ice isotopes, and vegetation at thermokarst features near Toolik and Noatak River, 2009–2013, NSF Arctic Data Center, https://doi.org/10.18739/A2CP5C, 2013.
Kallio, A. and Rieger, S.: Recession of Permafrost in a Cultivated Soil of Interior Alaska, Soil Sci. Soc. Am. J., 33, 430–432, https://doi.org/10.2136/sssaj1969.03615995003300030028x, 1969.
Karjalainen, O., Aalto, J., Kanevskiy, M. Z., Luoto, M., and Hjort, J.: Ground ice content predictions for the Northern Hemisphere permafrost region at 1-km resolution, version 1.1 (Version 1.1), Zenodo, https://doi.org/10.5281/ZENODO.7009875, 2022.
Klein, E. S., Yu, Z., and Booth, R. K.: Recent increase in peatland carbon accumulation in a thermokarst lake basin in southwestern Alaska, Palaeogeogr. Palaeocl., 392, 186–195, https://doi.org/10.1016/j.palaeo.2013.09.009, 2013.
Kokelj, S. V. and Jorgenson, M. T.: Advances in Thermokarst Research, Permafrost. Periglac., 24, 108–119, https://doi.org/10.1002/ppp.1779, 2013.
Kreig, R. A. and Reger, R. D.: Air-photo analysis and summary of landform soil properties along the route of the trans-Alaska pipeline system, Alaska Division of Geological & Geophysical Surveys, https://doi.org/10.14509/426, 1982.
Langer, M., Kaiser, S., Oehme, A., and Jacobi, S.: Bathymetry data of thermokarst lakes in the North Slope of Alaska (USA) and Manitoba (Canada) in 2019, PANGAEA, https://doi.org/10.1594/PANGAEA.918918, 2020.
Lenz, J., Jones, B. M., Wetterich, S., Tjallingii, R., Fritz, M., Arp, C. D., Rudaya, N., and Grosse, G.: Bulk sediment parameter of three sediment cores from permafrost lowlands, Alaska Arctic Coastal Plain, PANGAEA, https://doi.org/10.1594/PANGAEA.864814, 2016.
Lewkowicz, A., Wolfe, S., Geological Survey of Canada, Roujanski, V., Tetra Tech Canada, Hoeve, E., HoeveEng Consulting Ltd, O'Neill, B., Geological Survey of Canada, Gruber, S., Carleton University, Roy-Léveillée, P., Université Laval, Brown, N., Carleton University, Koenig, C., BGC Engineering, Brooks, H., BGC Engineering, Rudy, A., Northwest Territories Geological Survey, Bonnaventure, P., University of Lethbridge, Paquette, M., and Stantec: An Illustrated Permafrost Dictionary, Canadian Permafrost Association (CPA), https://doi.org/10.52381/CPA.permafrostdictionary.1, 2024.
Li, B., Heijmans, M. M. P. D., Blok, D., Wang, P., Karsanaev, S. V., Maximov, T. C., Van Huissteden, J., and Berendse, F.: Thaw pond development and initial vegetation succession in experimental plots at a Siberian lowland tundra site, Plant Soil, 420, 147–162, https://doi.org/10.1007/s11104-017-3369-8, 2017.
Liljedahl, A., Hinzman, L., Busey, R., and Yoshikawa, K.: Physical short-term changes after a tussock tundra fire, Seward Peninsula, Alaska, J. Geophys. Res.-Earth Surf., 112, 2006JF000554, https://doi.org/10.1029/2006JF000554, 2007.
Lloyd, A. H., Yoshikawa, K., Fastie, C. L., Hinzman, L., and Fraver, M.: Effects of permafrost degradation on woody vegetation at arctic treeline on the Seward Peninsula, Alaska, Permafrost. Periglac., 14, 93–101, https://doi.org/10.1002/ppp.446, 2003.
Luken, J. O. and Billings, W. D.: Changes in Bryophyte Production Associated with a Thermokarst Erosion Cycle in a Subarctic Bog, Lindbergia, 9, 163–168, 1984.
Mackelprang, R., Saleska, S. R., Jacobsen, C. S., Jansson, J. K., and Taş, N.: Permafrost Meta-Omics and Climate Change, Annu. Rev. Earth Planet. Si., 44, 439–462, https://doi.org/10.1146/annurev-earth-060614-105126, 2016.
McCarty, J. L., Aalto, J., Paunu, V.-V., Arnold, S. R., Eckhardt, S., Klimont, Z., Fain, J. J., Evangeliou, N., Venäläinen, A., Tchebakova, N. M., Parfenova, E. I., Kupiainen, K., Soja, A. J., Huang, L., and Wilson, S.: Reviews and syntheses: Arctic fire regimes and emissions in the 21st century, Biogeosciences, 18, 5053–5083, https://doi.org/10.5194/bg-18-5053-2021, 2021.
McKnight, P. E. and Najab, J.: Mann-Whitney U Test, in: The Corsini Encyclopedia of Psychology, edited by: Weiner, I. B. and Craighead, W. E., Wiley, https://doi.org/10.1002/9780470479216.corpsy0524, 2010.
Myers-Smith, I. H., McGuire, A. D., Harden, J. W., and Chapin, F. S.: Influence of disturbance on carbon exchange in a permafrost collapse and adjacent burned forest, J. Geophys. Res.-Biogeosci., 112, 2007JG000423, https://doi.org/10.1029/2007JG000423, 2007.
Myers-Smith, I. H., Harden, J. W., Wilmking, M., Fuller, C. C., McGuire, A. D., and Chapin, F. S.: Ages and isotopic signatures of peat cores from a boreal landscape, Interior Alaska, PANGAEA, https://doi.org/10.1594/PANGAEA.817460, 2008.
Natali, S. M., Schuur, E. A. G., Mauritz, M., Schade, J. D., Celis, G., Crummer, K. G., Johnston, C., Krapek, J., Pegoraro, E., Salmon, V. G., and Webb, E. E.: Permafrost thaw and soil moisture driving CO2 and CH4 release from upland tundra, J. Geophys. Res.-Biogeosci., 120, 525–537, https://doi.org/10.1002/2014JG002872, 2015.
National Snow and Ice Data Center (NSIDC): Cryosphere Glossary, Cooperative Institute for Research in Environmental Sciences, University of Colorado Boulder, https://nsidc.org/learn/cryosphere-glossary, last access: 24 October 2025.
Nitze, I., Grosse, G., Jones, B. M., Romanovsky, V. E., and Boike, J.: Remote sensing quantifies widespread abundance of permafrost region disturbances across the Arctic and Subarctic, Datasets, PANGAEA, https://doi.org/10.1594/PANGAEA.894755, 2018.
Nitze, I., Cooley, S. W., Duguay, C. R., Jones, B. M., and Grosse, G.: Spatial lake dynamics and lake-ice datasets of the Northern Seward and Baldwin Peninsulas in Alaska, PANGAEA, https://doi.org/10.1594/PANGAEA.922808, 2020a.
Nitze, I., Cooley, S. W., Duguay, C. R., Jones, B. M., and Grosse, G.: The catastrophic thermokarst lake drainage events of 2018 in northwestern Alaska: fast-forward into the future, The Cryosphere, 14, 4279–4297, https://doi.org/10.5194/tc-14-4279-2020, 2020b.
Olefeldt, D., Goswami, S., Grosse, G., Hayes, D., Hugelius, G., Kuhry, P., McGuire, A. D., Romanovsky, V. E., Sannel, A. B. K., Schuur, E. A. G., and Turetsky, M. R.: Circumpolar distribution and carbon storage of thermokarst landscapes, Nat. Commun., 7, 13043, https://doi.org/10.1038/ncomms13043, 2016.
Osterkamp, T. E., Viereck, L., Shur, Y., Jorgenson, M. T., Racine, C., Doyle, A., and Boone, R. D.: Observations of Thermokarst and Its Impact on Boreal Forests in Alaska, U.S.A., Arct. Antarct. Alp. Res., 32, 303–315, https://doi.org/10.1080/15230430.2000.12003368, 2018.
Plug, L. J. and West, J. J.: Thaw lake expansion in a two-dimensional coupled model of heat transfer, thaw subsidence, and mass movement, J. Geophys. Res.-Earth Surf., 114, 2006JF000740, https://doi.org/10.1029/2006JF000740, 2009.
Porter, C., Howat, I., Noh, M.-J., Husby, E., Khuvis, S., Danish, E., Tomko, K., Gardiner, J., Negrete, A., Yadav, B., Klassen, J., Kelleher, C., Cloutier, M., Bakker, J., Enos, J., Arnold, G., Bauer, G., Morin, P., and Polar Geospatial Center: ArcticDEM – Mosaics, Version 4.1 (1.0), Polar Geospatial Center, https://doi.org/10.7910/DVN/3VDC4W, 2023.
Schuur, E. A. G. and Mack, M. C.: Ecological Response to Permafrost Thaw and Consequences for Local and Global Ecosystem Services, Annu. Rev. Ecol. Evol. Syst., 49, 279–301, https://doi.org/10.1146/annurev-ecolsys-121415-032349, 2018.
Schuur, E. A. G., McGuire, A. D., Schädel, C., Grosse, G., Harden, J. W., Hayes, D. J., Hugelius, G., Koven, C. D., Kuhry, P., Lawrence, D. M., Natali, S. M., Olefeldt, D., Romanovsky, V. E., Schaefer, K., Turetsky, M. R., Treat, C. C., and Vonk, J. E.: Climate change and the permafrost carbon feedback, Nature, 520, 171–179, https://doi.org/10.1038/nature14338, 2015.
Schuur, E. A. G., Abbott, B. W., Commane, R., Ernakovich, J., Euskirchen, E., Hugelius, G., Grosse, G., Jones, M., Koven, C., Leshyk, V., Lawrence, D., Loranty, M. M., Mauritz, M., Olefeldt, D., Natali, S., Rodenhizer, H., Salmon, V., Schädel, C., Strauss, J., Treat, C., and Turetsky, M.: Permafrost and Climate Change: Carbon Cycle Feedbacks From the Warming Arctic, Annu. Rev. Env. Resour., 47, 343–371, https://doi.org/10.1146/annurev-environ-012220-011847, 2022.
Stepien, A., Koivurova, T., Gremsperger, A., and Niemi, H.: Arctic Indigenous Peoples and the Challenge of Climate Change, in: Arctic Marine Governance, edited by: Tedsen, E., Cavalieri, S., and Kraemer, R. A., Springer Berlin Heidelberg, Berlin, Heidelberg, 71–99, https://doi.org/10.1007/978-3-642-38595-7_4, 2014.
Strauss, J., Schirrmeister, L., Grosse, G., Fortier, D., Hugelius, G., Knoblauch, C., Romanovsky, V., Schädel, C., Schneider Von Deimling, T., Schuur, E. A. G., Shmelev, D., Ulrich, M., and Veremeeva, A.: Deep Yedoma permafrost: A synthesis of depositional characteristics and carbon vulnerability, Earth-Sci. Rev., 172, 75–86, https://doi.org/10.1016/j.earscirev.2017.07.007, 2017.
Strauss, J., Laboor, S., Schirrmeister, L., Fedorov, A. N., Fortier, D., Froese, D., Fuchs, M., Günther, F., Grigoriev, M., Harden, J., Hugelius, G., Jongejans, L. L., Kanevskiy, M., Kholodov, A., Kunitsky, V., Kraev, G., Lozhkin, A., Rivkina, E., Shur, Y., Siegert, C., Spektor, V., Streletskaya, I., Ulrich, M., Vartanyan, S., Veremeeva, A., Anthony, K. W., Wetterich, S., Zimov, N., and Grosse, G.: Circum-Arctic Map of the Yedoma Permafrost Domain, Front. Earth Sci., 9, 758360, https://doi.org/10.3389/feart.2021.758360, 2021.
Strauss, J., Laboor, S., Schirrmeister, L., Fedorov, A. N., Fortier, D., Froese, D. G., Fuchs, M., Günther, F., Grigoriev, M. N., Harden, J. W., Hugelius, G., Jongejans, L. L., Kanevskiy, M. Z., Kholodov, A. L., Kunitsky, V., Kraev, G., Lozhkin, A. V., Rivkina, E., Shur, Y., Siegert, C., Spektor, V., Streletskaya, I., Ulrich, M., Vartanyan, S. L., Veremeeva, A., Walter Anthony, K. M., Wetterich, S., Zimov, N. S., and Grosse, G.: Database of Ice-Rich Yedoma Permafrost Version 2 (IRYP v2), PANGAEA, https://doi.org/10.1594/PANGAEA.940078, 2022.
Strauss, J., Fuchs, M., Hugelius, G., Miesner, F., Nitze, I., Opfergelt, S., Schuur, E., Treat, C., Turetsky, M., Yang, Y., and Grosse, G.: Organic matter storage and vulnerability in the permafrost domain, in: Encyclopedia of Quaternary Science, Elsevier, 399–410, https://doi.org/10.1016/B978-0-323-99931-1.00164-1, 2025.
Streletskiy, D. A., Clemens, S., Lanckman, J.-P., and Shiklomanov, N. I.: The costs of Arctic infrastructure damages due to permafrost degradation, Environ. Res. Lett., 18, 015006, https://doi.org/10.1088/1748-9326/acab18, 2023.
Swanson, D. K.: Permafrost thaw-related slope failures in Alaska's Arctic National Parks, 1980–2019, Permafrost. Periglac., 32, 392–406, https://doi.org/10.1002/ppp.2098, 2021.
Teufel, B. and Sushama, L.: Abrupt changes across the Arctic permafrost region endanger northern development, Nat. Clim. Change, 9, 858–862, https://doi.org/10.1038/s41558-019-0614-6, 2019.
Turetsky, M. R., Abbott, B. W., Jones, M. C., Walter Anthony, K., Olefeldt, D., Schuur, E. A. G., Koven, C., McGuire, A. D., Grosse, G., Kuhry, P., Hugelius, G., Lawrence, D. M., Gibson, C., and Sannel, A. B. K.: Permafrost collapse is accelerating carbon release, Nature, 569, 32–34, https://doi.org/10.1038/d41586-019-01313-4, 2019.
Turetsky, M. R., Abbott, B. W., Jones, M. C., Anthony, K. W., Olefeldt, D., Schuur, E. A. G., Grosse, G., Kuhry, P., Hugelius, G., Koven, C., Lawrence, D. M., Gibson, C., Sannel, A. B. K., and McGuire, A. D.: Carbon release through abrupt permafrost thaw, Nat. Geosci., 13, 138–143, https://doi.org/10.1038/s41561-019-0526-0, 2020.
Van Soest, M. A. J., Anderson, N. J., and Bullard, J. E.: Arctic soil development under changing climate conditions, CATENA, 254, 108938, https://doi.org/10.1016/j.catena.2025.108938, 2025.
Vincent, W. F.: Arctic Climate Change: Local Impacts, Global Consequences, and Policy Implications, in: The Palgrave Handbook of Arctic Policy and Politics, edited by: Coates, K. S. and Holroyd, C., Springer International Publishing, Cham, 507–526, https://doi.org/10.1007/978-3-030-20557-7_31, 2020.
Walter Anthony, K.: Methane ebullition hotspot point data locations in interior Alaska thermokarst lakes from April 2011 through October 2019, NSF Arctic Data Center, https://doi.org/10.18739/A2NP1WK35, 2020.
Wang, K., Overeem, I., Jafarov, E., Clow, G., Romanovsky, V., Schaefer, K., Urban, F., Cable, W., Piper, M., Schwalm, C., Zhang, T., Kholodov, A., Sousanes, P., Loso, M., Swanson, D., and Hill, K.: A synthesis dataset of near-surface permafrost conditions for Alaska, 1997–2016, NSF Arctic Data Center, https://doi.org/10.18739/A2KG55, 2018a.
Wang, K., Jafarov, E., Overeem, I., Romanovsky, V., Schaefer, K., Clow, G., Urban, F., Cable, W., Piper, M., Schwalm, C., Zhang, T., Kholodov, A., Sousanes, P., Loso, M., and Hill, K.: A synthesis dataset of permafrost-affected soil thermal conditions for Alaska, USA, Earth Syst. Sci. Data, 10, 2311–2328, https://doi.org/10.5194/essd-10-2311-2018, 2018b.
Webb, H., Fuchs, M., Abbott, B. W., Douglas, T. A., Elder, C. D., Ernakovich, J. G., Euskirchen, E. S., Göckede, M., Grosse, G., Hugelius, G., Jones, M. C., Koven, C., Kropp, H., Lathrop, E., Li, W., Loranty, M. M., Natali, S. M., Olefeldt, D., Schädel, C., Schuur, E. A. G., Sonnentag, O., Strauss, J., Virkkala, A.-M., and Turetsky, M. R.: A Review of Abrupt Permafrost Thaw: Definitions, Usage, and a Proposed Conceptual Framework, Curr. Clim. Change Rep., 11, 7, https://doi.org/10.1007/s40641-025-00204-3, 2025a.
Webb, H., Pierce, E., Abbott, B. A., Bowden, W. B., Chen, Y., Chen, Y., Douglas, T. A., Eklof, J. F., Euskirchen, E., Jones, M. C., Langer, M., Myers-Smith, I. H., Overeem, I., Strauss, J., Walter Anthony, K., Wang, K., Whitley, M. A., and Turetsky, M.: The Alaska Permafrost Thaw Database (Version 2.0.0), Zenodo [data set, code], https://doi.org/10.5281/zenodo.16996415, 2025b.
Wendel, J.: Map Reveals Hot Spots for Arctic Greenhouse Gas Emissions, EOS, 97, https://doi.org/10.1029/2016EO061233, 2016.
Whitley, M., Frost, G. V., Jorgenson, M. T., Macander, M. J., Maio, C. V., and Winder, S. G.: Arctic-Boreal Vulnerability Experiment (ABoVE)ABoVE: Permafrost Measurements and Distribution Across the Y-K Delta, Alaska, 2016, ORNL Distributed Active Archive Center, https://doi.org/10.3334/ORNLDAAC/1598, 1 January 2018.
Witharana, C., Udawalpola, M. R., Liljedahl, A. K., Jones, M. K. W., Jones, B. M., Hasan, A., Joshi, D., and Manos, E.: Automated Detection of Retrogressive Thaw Slumps in the High Arctic Using High-Resolution Satellite Imagery, Remote Sens., 14, 4132, https://doi.org/10.3390/rs14174132, 2022.
Yang, Y., Rogers, B. M., Fiske, G., Watts, J., Potter, S., Windholz, T., Mullen, A., Nitze, I., and Natali, S. M.: Mapping retrogressive thaw slumps using deep neural networks, Remote Sens. Environ., 288, 113495, https://doi.org/10.1016/j.rse.2023.113495, 2023.
Yang, Y., Rodenhizer, H., Rogers, B. M., Dean, J., Singh, R., Windholz, T., Poston, A., Potter, S., Zolkos, S., Fiske, G., Watts, J., Huang, L., Witharana, C., Nitze, I., Nesterova, N., Barth, S., Grosse, G., Lantz, T., Runge, A., Lombardo, L., Nicu, I. C., Rubensdotter, L., Makopoulou, E., and Natali, S.: A Collaborative and Scalable Geospatial Data Set for Arctic Retrogressive Thaw Slumps with Data Standards, Sci. Data, 12, 18, https://doi.org/10.1038/s41597-025-04372-7, 2025.
Yoshikawa, K., Bolton, W. R., Romanovsky, V. E., Fukuda, M., and Hinzman, L. D.: Impacts of wildfire on the permafrost in the boreal forests of Interior Alaska, J. Geophys. Res.-Atmos., 107, https://doi.org/10.1029/2001JD000438, 2002.