the Creative Commons Attribution 4.0 License.
the Creative Commons Attribution 4.0 License.
 | 05 May 2026
Improved global daily nitrogen dioxide concentrations from 2005 to 2023 derived using a deep learning approach
Jiangshan Mu
Chenliang Tao
Zhou Liu
Yingnan Zhang
Na Zhao
Bin Luo
Qionghui Zhou
Qingzhu Zhang
Hongliang Zhang
Likun Xue
Nitrogen dioxide (NO2) is a critical air pollutant with significant environmental and human health impacts, yet global and long-term NO2 datasets with daily continuity and fine spatial resolution remain limited. In this study, we construct a continuous global daily NO2 concentration (https://doi.org/10.5281/zenodo.13842191, Mu and Tao, 2025) spanning from 2005 to 2023 at a 0.1° resolution using the advanced Air Transformer deep learning framework that integrates satellite observations, ground-based measurements, meteorological reanalysis, land-use information, and auxiliary geophysical variables. The resulting dataset shows robust performance across diverse regions and pollution regimes, with improved spatial consistency and reduced biases relative to existing global products. Based on this dataset, we characterize the spatiotemporal evolution of global NO2 concentrations over the past two decades. Global annual mean NO2 increased from 2005 to 2015, followed by a moderate decline during 2016–2019, a pronounced decrease in 2020 associated with COVID-19-related reductions in economic activity and transportation, and a partial rebound thereafter, reaching 3.38 ppbv in 2023. The Northern Hemisphere and tropical regions largely followed the global trend, whereas the Southern Hemisphere exhibited distinct behaviour, with relatively stable or declining NO2 levels prior to 2015, a sharp decrease in 2020, and a stronger post-pandemic rebound during 2021–2023. As one of the global, multi-decadal NO2 datasets with daily resolution, this dataset provides a valuable resource for air quality assessment, exposure analysis, and atmospheric model evaluation.
- Article
(3620 KB) - Full-text XML
-
Supplement
(2533 KB) - BibTeX
- EndNote


Nitrogen dioxide (NO2) is a key atmospheric pollutant that plays a central role in tropospheric chemistry and air quality, and has significant implications for public health and environmental sustainability (Health Effects Institute, 2024). As an important precursor of ground-level ozone (O3) and secondary fine particulate matter (PM2.5), NO2 strongly influences atmospheric oxidation processes and regional pollution levels (Li et al., 2019; Xue et al., 2014), contributing to respiratory and cardiovascular diseases while disproportionately affecting vulnerable populations (WHO, 2021; Freire et al., 2010; Sentís et al., 2017; Kim et al., 2014; Schmidt, 2019; Chowdhury et al., 2021). Anthropogenic combustion sources, including vehicle traffic, power generation, and industrial activities, dominate global NO2 emissions and are highly concentrated in urban and industrialized regions, resulting in pronounced spatial and temporal variability in surface concentrations. In addition to anthropogenic sources, natural processes such as soil NOx emissions, lightning-produced NOx, and biomass burning also contribute to background NO2 levels, particularly in rural and remote regions where monitoring coverage is sparse (Fei et al., 2016; Hall et al., 1996; Xing et al., 2018).
At the global scale, NO2 concentrations exhibit substantial regional differences driven by variations in emission intensity, energy structure, and economic activity. Rapid urbanization and industrial development have led to increasing NO2 levels in many regions, while emission control policies and technological improvements have contributed to declines elsewhere. Understanding these contrasting regional trends requires long-term, spatially consistent observations that can capture both gradual changes and abrupt perturbations associated with large-scale events, such as sudden emission reductions.
Current efforts to characterize global NO2 distributions remain constrained by limitations in data availability and modeling approaches. Ground-based monitoring networks, while essential, are unevenly distributed, with most stations concentrated in high-income urban areas (Huang et al., 2023, 2018; Cooper et al., 2022; Di et al., 2019), whereas monitoring infrastructure in regions such as Africa and much of Latin America remains severely lacking. This spatial imbalance leads to greater uncertainty in NO2 estimates for developing regions. Chemical transport models and traditional statistical approaches, including land-use regression models, often face challenges in reproducing fine-scale spatial heterogeneity and long-term temporal variability at the global scale, particularly when observational constraints are limited.
Recent advancements in remote sensing and data-driven methodologies provide promising opportunities to overcome these challenges (Huang et al., 2023; Cooper et al., 2022; Di et al., 2019; Huang et al., 2018). Satellite observations, such as the Ozone Monitoring Instrument (OMI) and the TROPOspheric Monitoring Instrument (TROPOMI), offer near-global coverage of NO2 concentrations (Sekiya et al., 2022; Levelt et al., 2006; Veefkind et al., 2012), while machine learning techniques facilitate the integration of diverse geophysical, atmospheric, and socio-economic datasets (Huang et al., 2023; Chan et al., 2021; Wong et al., 2021; Chi et al., 2022; Long et al., 2022). These innovations enable the development of high-resolution datasets that capture spatial and temporal variations in NO2 exposure, providing critical insights into the extent and drivers of environmental inequality. In recent years, several global or regional NO2 products developed using these approaches have achieved spatial resolutions ranging from ∼ 0.25 to 0.1°, with temporal resolutions from annual or monthly averages to limited daily estimates, and reported performance of R2≈ 0.6–0.8 (Larkin et al., 2023; Long et al., 2022; Shao et al., 2023; Sun et al., 2024; Wei et al., 2022, 2023). However, existing approaches often suffer from several limitations, such as lacking the spatial and temporal resolution needed to accurately reflect local variations, a documented difficulty in accurately representing NO2 concentrations in rural and low-concentration regions, and failing to incorporate essential geophysical and atmospheric parameters (Di et al., 2019; Qu et al., 2021).
To address these challenges, we have developed a comprehensive global daily NO2 dataset spanning from 2005 to 2023 at a 0.1° resolution using the Air Transformer (AiT) deep learning method. By taking advantage of the unique strengths of AiT in predicting atmospheric pollutant concentrations which will be discussed later, and incorporating important geophysical, atmospheric, and socio-economic parameters, the model mitigates the retrieval uncertainties and better captures local variations in NO2 concentrations, resulting in a more accurate and comprehensive understanding of NO2 dynamics on a global scale. This high-resolution dataset aims to provide more precise and reliable insights into NO2 trends and their driving factors, thereby overcoming the shortcomings of previous studies. Using this dataset, we further analyze the spatial and temporal evolution of NO2 concentrations at global and regional scales, offering a robust data foundation for studies of atmospheric composition and air quality dynamics.
2.1 Data Collection and Processing
Surface NO2 measurements with hourly resolution from 2005 to 2023 were collected from approximately 7021 ground-based monitoring stations worldwide, including China National Environmental Monitoring Centre (CNEMC), Environmental Protection Agency (EPA), European Environment Agency (EEA), Tropospheric Ozone Assessment Report database (TOAR), and Open Air Quality (OpenAQ). To create model labels, duplicate data were removed by retaining the highest priority measurements according to the specified order (CNEMC/EPA/EEA > TOAR > OpenAQ). The raw data underwent additional quality control measures, including removal of outliers such as negative values, duplicate values (occurring for more than three consecutive hours), and extreme values (exceeding the 99.9th percentile). Days with at least 18 valid hourly NO2 measurements were identified to calculate the daily average for each monitoring site. To ensure consistency with auxiliary variables, all daily NO2 measurements were adjusted to the Universal Time Coordinated (UTC) zone and then used for independent training and validation of the machine learning model. Finally, daily observations were spatially aggregated to unique grid locations based on geographic coordinates, and the distribution of sample counts and NO2 descriptive statistics is summarized in Table S2 in the Supplement.
To accurately predict NO2 concentrations, we incorporated a total of 17 independent features derived from multiple data sources. Meteorological reanalysis data were obtained from the ECMWF Reanalysis v5 (ERA5) dataset, including boundary layer height (BLH), temperature (TEMP), wind speed (WS), dewpoint temperature (DEW), pressure (PRE), precipitation (PRECIP), evaporation (EVA), and long-wave solar radiation (LWSR), all at a spatial resolution of 0.25° × 0.25° for the period 2005–2023. These meteorological variables are known to play key roles in controlling pollutant dispersion, vertical mixing, chemical reaction rates, and surface–atmosphere exchanges, and therefore provide essential physical constraints for NO2 prediction. Satellite data of tropospheric column NO2, formaldehyde (HCHO), and O3 were retrieved from the L3 level products in OMI instrument at a resolution of 0.25° × 0.25° for 2005–2018, and from the L2 level products in TROPOMI instrument at a finer resolution of 5.5 km × 3.5 km for 2019–2023, providing complementary chemical information related to NOx emissions, photochemical activity, and oxidant levels.
To enable consistent long-term analysis and minimize discrepancies arising from differences in sensor characteristics, retrieval algorithms, horizontal resolution, and overpass time between OMI and TROPOMI, we applied a seasonal, grid-specific adjustment to OMI products using TROPOMI as a reference during their overlap period (2019–2022). This harmonization step is particularly important for long-term trend analyses, as uncorrected inter-sensor differences could introduce artificial discontinuities into the time series. Specifically, OMI observations for years without TROPOMI coverage were corrected according to
where
where , , is adjusted OMI, original OMI and original TROPOMI products for grid i at year yr season m, respectively. ΔΩweights(i,m) represents the difference between OMI and TROPOMI at target resolution. This correction strategy preserves the spatial patterns and seasonal variability of the original satellite products while ensuring temporal continuity and consistency of satellite-derived chemical variables across the entire study period.
Aerosol Optical Depth (AOD) data, an important proxy for particulate matter, were sourced from MODIS product (MCD19A2CMG) at a resolution of 0.05° × 0.05° for 2005–2023. The frequent occurrence of clouds in optical remote sensing images hampers the detection of trace gases beneath the cloud layer, leading to gaps in satellite data. To address this challenge, we implemented the eXtreme Gradient Boosting (XGBoost) machine learning algorithm, known for its efficiency, to fill these gaps and obtain spatially comprehensive retrieval data. This gap-filling procedure improves the representativeness of aerosol-related information and reduces potential biases associated with uneven data availability.
Additionally, we also included NDVI (2005–2023, MCD19A3CMG) to account for vegetation cover, population density data (2005–2020, WorldPop, https://www.worldpop.org/, last access: 29 April 2026) to capture human activity, land use data (2005–2022, MCD12C1, providing sub-pixel proportions of nine class in forests, shrublands, savannas, wetlands, croplands, urban, snow and ice, barren, water) to understand land cover changes, and road network density and Digital Elevation Model (DEM) to incorporate infrastructural and topographical influences.
To ensure consistency across all input variables, the higher spatial resolution variables were aggregated to a homogeneous 0.1° × 0.1° grid using averaging, while the lower spatial resolution variables were resampled to the same grid using bilinear interpolation. Bilinear interpolation estimates values at target grid cells by linearly weighting the four nearest neighboring grid points in both latitude and longitude directions, thereby providing a smooth spatial transition while preserving large-scale gradients and avoiding abrupt discontinuities. This approach is widely adopted in atmospheric and remote sensing applications for spatial resampling, as it balances computational efficiency with the need to retain spatial coherence. This harmonization process enables the seamless integration of multi-source datasets within the machine learning framework. These processed variables were then used for subsequent air pollution modeling. This diverse set of features enabled a comprehensive machine learning approach to modeling NO2 concentrations, providing robust predictions across various spatial and temporal scales.
2.2 Air Transformer
This study applied an innovative deep learning model, the Air Transformer (AiT), to improve the accuracy of atmospheric pollutant concentration prediction. The AiT model is based on the Transformer architecture and is specifically designed to capture the spatiotemporal dependencies of atmospheric pollutants. The AiT model structure builds on the successful application of the Transformer in natural language processing, incorporating cross-channel self-attention alongside pixel self-attention and utilizing a decoder for enhanced prediction capabilities. The multi-dimensional attention mechanism enables the model to capture dependencies not only across temporal and spatial dimensions but also among data channels, such as different pollutant concentrations and meteorological parameters. Transformers have the advantage of having no recurrent units, and therefore require less training time than earlier recurrent neural architectures (RNNs) such as long short-term memory (LSTM) (Zhao et al., 2019; Liu et al., 2024).
The self-attention mechanism is the core component of the AiT model. For each input sequence, attention weights are generated by computing the dot product between the query, key, and value vectors. These weights are used to perform a weighted sum of the input sequence values, producing new feature representations. The self-attention mechanism further enhances the model's representational power by allowing it to simultaneously focus on different parts of the input data, capturing richer spatiotemporal dependencies. In this study, the AiT model establishes a robust global surface–column relationship by integrating variables related to pollutant transport, chemical transformation, and column density within approximately 20 km of each target grid, enabling the reconstruction of gapless daily surface NO2 concentrations at a spatial resolution of 10 km.
Multi-source data were input into AiT as model features and labels. These data were pre-processed through feature extraction layers and then fed into the Transformer's encoder. The encoder comprises multiple self-attention layers and feedforward neural network layers. Utilizing the multi-head attention mechanism, it processes input data in parallel, capturing features at various temporal and spatial scales. The AiT model is trained using supervised learning, leveraging a large amount of historical data. The model's loss function comprises prediction errors (such as mean squared error (MSE), Root Mean Square Error (RMSE)) and regularization terms to ensure prediction accuracy and stability. To improve the model's generalization ability, we introduced a multi-task learning strategy which was detailed discussed in our previous work (Tao et al., 2024). Specifically, the model not only predicts pollutant concentrations but also simultaneously predicts related meteorological parameters and remote sensing observations. This multi-task learning strategy helps the model better understand the interrelationships between different variables, thereby enhancing prediction performance.
Model training was conducted for 300 epochs using the LAMB optimizer, which supports large batch sizes without sacrificing convergence performance, thereby accelerating training on large-scale datasets. A warmup learning rate schedule was applied, with the learning rate peaking at 0.001, and a batch size of 6144 was used. An early stopping strategy was implemented and triggered after 30 consecutive epochs without improvement. To mitigate overfitting, dropout was applied within linear layers and self-attention modules, and a Gaussian Error Linear Unit (GeLU) activation function was employed throughout the network.
The AiT model was implemented and trained using the PyTorch framework. Prior to training, all input features were normalized across the entire dataset. Model performance was evaluated using both sample-based and site-based cross-validation approaches. In these evaluations, all samples and monitoring sites were randomly divided into five folds, with four folds used for training and one fold reserved for independent validation, allowing for a rigorous assessment of the model's spatiotemporal generalization capability.
2.3 Random- and Spatial-based cross-validation
The performance of our models was evaluated using two five-fold cross-validation approaches: random-based and spatial-based. The random-based approach involved 16 841 418 samples, with 3 368 283 samples used for validation in each fold. This approach ensures a comprehensive assessment of the model's predictive performance across diverse temporal and spatial conditions represented in the full dataset, effectively testing the model's ability to reproduce observed NO2 variability under a wide range of atmospheric and environmental settings. By randomly partitioning samples, this strategy primarily evaluates the overall fitting accuracy and stability of the model when predicting NO2 concentrations at locations and times similar to those seen during training.
In contrast, the spatial-based approach was designed to explicitly assess the model's spatial transferability. This evaluation included data from 7021 monitoring sites, of which 1404 sites were held out for validation in each fold. By withholding entire monitoring locations from the training process, this approach tests the model's ability to generalize to previously unseen locations, which is critical for producing reliable spatially continuous NO2 fields, particularly in regions with sparse or no ground observations. This site-based validation provides a more stringent and realistic assessment of model performance for global-scale mapping applications.
In both cross-validation approaches, validation data were strictly excluded from model training, ensuring an unbiased evaluation of predictive performance. Together, the random-based and spatial-based cross-validation strategies provide complementary perspectives on model accuracy and generalization capability, with the former primarily reflecting interpolation performance within the sampled space–time domain and the latter evaluating extrapolation ability to unmonitored locations. This combined evaluation framework is particularly well suited for global NO2 mapping applications, where reliable prediction in regions with limited observational constraints is essential.
2.4 Regional weighted averages
To accurately assess regional pollution levels and the potential health impacts, we employ two complementary weighted averaging methods: geographically area-weighted averaging (Eq. 3) and population-weighted averaging (Eq. 4). These equations incorporate spatial area and population data to produce weighted averages that more accurately reflect both geographical and demographic factors in regional NO2 concentration assessments.
where Ci is the NO2 concentration in the ith region, Ai is the area of the ith region, and n is the total number of regions.
where Ci is the NO2 concentration in the ith region, Pi is the population of the ith region, and n is the total number of regions. We used WorldPOP population datasets for this study. Population-weighted NO2 concentration is a crucial indicator for assessing the public health impact of air pollution, as it integrates both pollutant concentration levels and the distribution of human populations across different regions. This metric is particularly useful for capturing the actual exposure of populations to NO2 pollution, which is not adequately represented by area-weighted concentrations alone. By incorporating population density, the population-weighted NO2 concentration metric provides a more accurate reflection of the exposure risk faced by people living and working in polluted areas.
3.1 AiT-NO2 performance
The detailed discussion about the Transformer can be seen in the Methods. Here we mainly focus on the performance evaluation from the AiT-NO2 products. We first evaluate the model using Random cross-validation and Spatial cross-validation. In the Random cross-validation, the NO2 model exhibited outstanding predictive accuracy, with an R2 of 0.91, an RMSE of 2.32 ppbv, and an MAE of 1.56 ppbv for daily predictions (Fig. 1a). The performance further improved for monthly and annual predictions, achieving R2 values of 0.98 and 0.99, RMSE values of 0.97 and 0.59 ppbv, and MAE values of 0.64 ppbv and 0.33 ppbv, respectively (Fig. 1c, e). This improvement reflects the reduction of short-term noise and random variability through temporal aggregation, indicating that the model effectively captures both high-frequency variability and long-term NO2 signals.
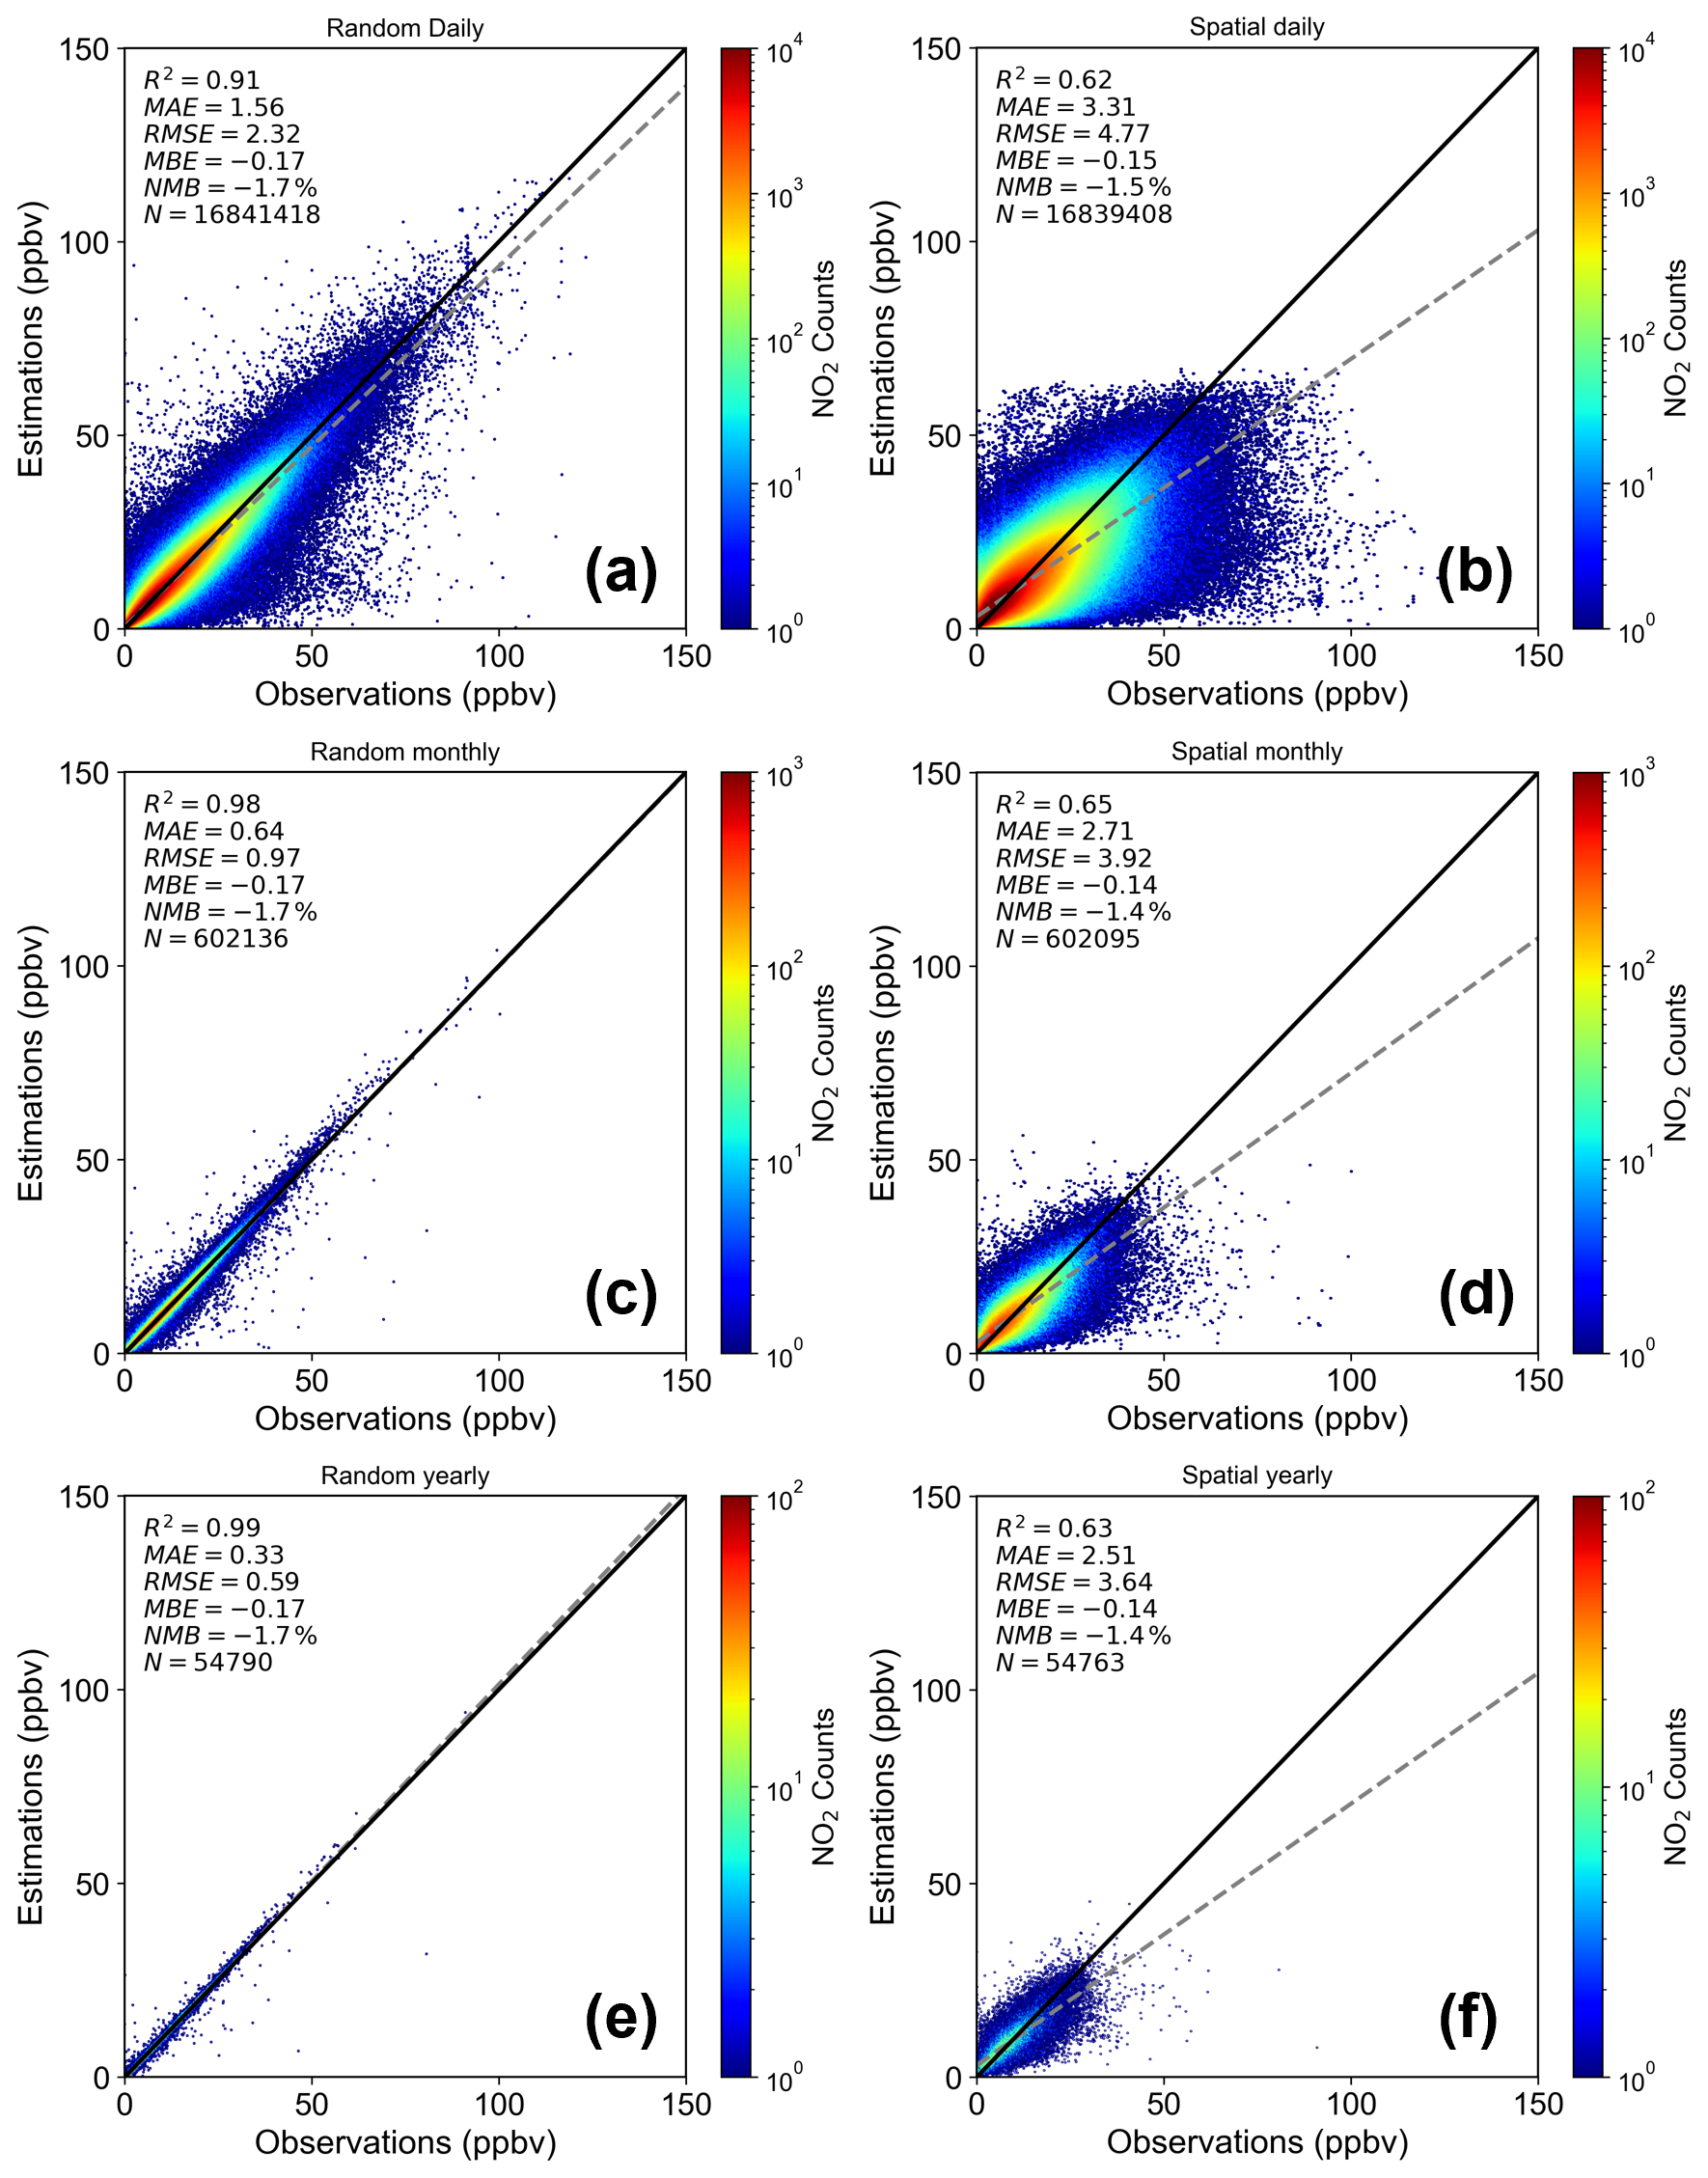
Figure 1Model validation and uncertainties from the Random-based (left) and Spatial-based (right) cross-validation. Black lines are 1:1 lines, and grey dashed lines are best-fit lines from linear regression. Additional statistical metrics given are the correlation coefficient (R2), mean absolute error (MAE), root-mean-square error (RMSE), mean bias error (MBE), normalized mean bias (NMB), and sample number.
Similarly, the Spatial cross-validation results were also impressive. For daily predictions, the NO2 model achieved an R2 of 0.62, an RMSE of 4.77 ppbv, and an MAE of 3.31 ppbv (Fig. 1b). For monthly and annual predictions, the model showed R2 values of 0.65 and 0.63, RMSE values of 3.92 and 3.64 ppbv, and MAE values of 2.71 and 2.51 ppbv, respectively (Fig. 1d, f). As expected, predictive performance under Spatial cross-validation is lower than that under Random cross-validation, reflecting the greater difficulty of extrapolating to previously unseen locations. Nevertheless, the relatively stable performance across temporal scales indicates that the model maintains robust spatial transferability and is capable of reproducing NO2 variability in regions with limited or no monitoring coverage.
In addition to the global evaluation, continental-scale performance is summarized in Table S2. Under random cross-validation, the model maintains high predictive accuracy across Europe, Asia, North America, and South America (R2= 0.89–0.92). Spatial cross-validation results show greater variability across continents, with R2 values ranging from 0.54 to 0.68 in regions with dense monitoring coverage. Performance in Africa and Australia is substantially lower under spatial cross-validation, which is attributable to the limited number of available monitoring grids in this region.
Overall, the performance metrics obtained from both validation strategies demonstrate that the AiT-NO2 model performs consistently well across multiple temporal scales and validation settings. Compared with previous studies, our framework not only provides improvements in spatial resolution (0.1°) and temporal coverage (daily estimates from 2005–2023), but also achieves higher or comparable predictive performance. For example, reported random cross-validation R2 values in previous regional NO2 modeling studies typically range from 0.70 to 0.88, with RMSE values between approximately 3–6 ppbv depending on region and temporal aggregation (Chan et al., 2021; Shao et al., 2023; Wong et al., 2021). In contrast, our model achieves an R2 of 0.91 and an RMSE of 2.32 ppbv for daily predictions under random cross-validation at the global scale. Notably, many earlier studies were conducted at regional or national scales, often benefiting from dense monitoring networks and region-specific tuning, whereas globally consistent daily surface NO2 datasets with comparable resolution remain relatively limited. Furthermore, the Spatial cross-validation results are generally comparable to, or exceed, those reported in previous global and regional NO2 modeling studies (Wei et al., 2019, 2023), underscoring the robustness and reliability of the AiT-based framework for constructing spatially continuous, long-term NO2 datasets.
As we mentioned earlier, the SoGA2024 for the first time included NO2 in its report, as well as the annual NO2 concentration datasets they generated using a global LUR model (Anenberg et al., 2022; Larkin et al., 2023). The LUR-based dataset was selected for comparison due to its adoption in the State of Global Air (SoGA) assessment for global NO2 health burden estimation, where it functions as an authoritative and policy-relevant exposure benchmark. Here, we mainly focus on the performance of the two datasets in simulating NO2 concentration in major urban observation sites in several observation-dense countries, such as Austria, Belgium, China, France, Germany, India, Poland, Spain, and US. Overall, the AiTNO2 model shows much better alignment with observational values, outperforming the LUR model. In most countries, except the US, predictions from the AiTNO2 model tend to be slightly higher or almost comparable to the observational data, whereas the LUR model consistently underestimates NO2 concentrations. For countries like China and India, where pollution levels are particularly high, the AiTNO2 model provides significantly more accurate predictions, closely reflecting the actual pollution patterns observed in these regions. This highlights the efficacy of the AiTNO2 model. We estimated that the LUR method could significantly underestimate the regional NO2 concentration by at least 50 % for most of the regions, except for HI (Fig. S3; Table S2). When examining different regions, our results has much higher NO2 estimation compared to LUR NO2, particularly in the Northern Hemisphere (1.6 to 2.1 times) and tropical regions (2.5 to 3.0 times), where there are more monitoring stations and higher pollution levels (Fig. S4). The primary reason for this discrepancy is that the AiTNO2 model relies on urban stations data for training, which are typically located in city centres with high pollution levels, enabling it to more effectively capture elevated NO2 concentrations in these localized urban areas. In contrast, the LUR model relies on a set of spatial predictor variables derived from land-use and environmental datasets, including population density, impervious surface area, road networks, vegetation indices (e.g., NDVI and tree cover), elevation, and satellite-based NO2 observations from OMI. As a result, the LUR framework is less capable of fully reflecting high NO2 concentration areas, especially in urban settings. In addition, we further compared our product with another independent NO2 dataset (Copper et al., 2022) to provide a broader evaluation of model performance (Fig. S10). Furthermore, the AiTNO2 model was featured in higher sensitivity in capturing the temporal and spatial variations of atmospheric pollutants, accurately predicting these changes by learning from time series data (Tao et al., 2024).
In conclusion, both cross-validation approaches confirm the strong predictive capabilities of our model. The Random validation highlights the model's accuracy across diverse data points, while the Spatial validation underscores its effectiveness in generalizing to new urban locations in regions with strong monitoring infrastructure. These comprehensive evaluations attest to the high quality and reliability of our predictive models, making them valuable tools for accurate NO2 concentration predictions. The AiTNO2 model shows higher accuracy in predicting NO2 concentrations across the selected countries, especially in regions with severe pollution and dense monitoring networks. While the LUR model captures the general trends in NO2 variation, it may provide relatively conservative estimates in urban areas and may underestimate concentrations in rural environments in some countries. The AiTNO2 model, by leveraging deep learning and observational data, compensates for these limitations and demonstrates its potential as a valuable tool for air pollution monitoring and forecasting. These advantages highlight the value of the AiT-based approach for constructing high-resolution global NO2 datasets and for improving the representation of surface NO2 concentrations in data-driven air quality analyses.
3.2 Global Trend of NO2
Based on the geographically area-weighted average AiTNO2, we have a systematic understanding of the global spatial and temporal trends in NO2. The global annual average concentration of NO2 exhibited distinct trends among regions from 2005 to 2023 (Fig. S5a). Specifically, from 2005 to 2010, NO2 concentrations remained relatively stable, increasing slightly from 3.32 to 3.44 ppbv. From 2010 to 2015, concentrations continued to rise, peaking at 4.05 ppbv in 2015. This upward phase coincides with rapid industrial expansion, increasing fossil fuel consumption, and accelerated urbanization in several emerging economies, which contributed to sustained growth in anthropogenic NOx emissions during this period. Subsequently, despite a decrease to 3.73 ppbv by 2019, concentrations remained relatively high. The post-2015 decline is broadly consistent with the implementation of stricter emission standards, large-scale installation of pollution control technologies, and structural shifts in energy systems in major emitting regions. These policy-driven reductions partially offset emission growth from ongoing economic activities. In 2020, due to the significant reduction in global economic activities and transportation caused by the COVID-19 pandemic, NO2 concentrations notably dropped to 3.42 ppbv. This abrupt decline highlights the strong sensitivity of surface NO2 to short-term changes in transportation intensity and industrial output, underscoring the dominant contribution of anthropogenic combustion sources. From 2021 to 2023, with the gradual recovery of economic activities, NO2 concentrations rebounded slightly in 2021 but then declined again in 2022 and 2023, reaching 3.38 ppbv in 2023. The post-pandemic evolution suggests that while mobility and economic activity resumed, ongoing structural adjustments in emission sources and continued regulatory efforts may have moderated the rebound in NO2 concentrations.
Figures S5b and 5c show that the NO2 concentrations in the Northern Hemisphere and tropical regions exhibited similar trends. This similarity reflects the dominance of anthropogenic NOx emissions in the Northern Hemisphere, which accounts for the majority of global industrial production, transportation activity, and energy consumption. As a result, large-scale emission control policies and economic transitions in this hemisphere exert a disproportionate influence on global NO2 variability. In contrast to global trends, the Southern Hemisphere exhibited unique characteristics in the annual average NO2 concentrations from 2005 to 2023 (Fig. S5d). Between 2005 and 2009, NO2 levels decreased from 2.83 to 2.66 ppbv, likely due to the initial implementation of air pollution control measures in certain regions. From 2010 to 2015, NO2 concentrations fluctuated, overall declining from 2.68 to 2.65 ppbv. This period's fluctuations may reflect the dynamic balance between economic activities and air quality management policies. Between 2016 and 2019, NO2 levels remained relatively stable, ranging from 2.63 ppbv to 2.69 ppbv, indicating a balance between ongoing mitigation efforts and economic growth. In 2020, the COVID-19 pandemic led to a significant reduction in economic activities and transportation, causing NO2 concentrations to drop sharply to 2.45 ppbv, highlighting the substantial impact of anthropogenic activities on NO2 emissions. From 2021 to 2023, as economic activities gradually resumed, NO2 levels increased markedly, reaching 3.15 ppbv in 2022 before slightly declining to 3.11 ppbv in 2023. This upward trend is likely associated with economic recovery, increased traffic, and the relaxation of emission control measures in some areas. Compared with the Northern Hemisphere, the Southern Hemisphere is characterized by lower anthropogenic emission densities, different energy consumption patterns, and a relatively larger influence of natural sources such as biomass burning and lightning-produced NOx. In particular, interannual variability associated with fire activity and meteorological conditions may play a more prominent role in shaping regional NO2 patterns. Moreover, the smaller extent of highly industrialized urban clusters limits sustained long-term anthropogenic-driven growth in NO2 concentrations.
Overall, these results highlight pronounced regional differences in long-term NO2 evolution and underscore the combined influence of anthropogenic activity, emission control measures, and large-scale external perturbations on global and hemispheric NO2 concentrations.
3.3 Spatial and Temporal Trends based on AiTNO2
We examine the spatial distribution and regional evolution of NO2 concentrations from 2005 to 2023 to characterize geographic heterogeneity and regional hotspots. Significant spatial heterogeneous in NO2 concentration across regions have been identified from 2005 to 2023 (Fig. S7), with hotspots in eastern China and northern India. In 2005, regions including the Beijing-Tianjin-Hebei area and the Yangtze River Delta exhibited very high NO2 concentrations due to their status as major industrial and economic centres. However, after 2013, these regions experienced significant reductions in NO2 levels, largely attributed to the Chinese government's stringent air quality management policies, including the Air Pollution Prevention and Control Action Plan, which effectively reduced industrial emissions and vehicle exhaust (Feng et al., 2019; Liu et al., 2024; Gao et al., 2022; Geng et al., 2019). In India, NO2 hotspots are concentrated in major cities located in the Indo-Gangetic Plain such as Delhi and Mumbai. Between 2005 and 2015, NO2 concentrations in these cities gradually increased due to rapid urbanization and industrialization. However, recent years have seen a decrease in NO2 levels as the Indian government has intensified efforts to control air pollution (Xie et al., 2024). Conversely, Western European countries like Germany, France, and the United Kingdom had high NO2 concentrations in 2005, reflecting their industrialized cities and busy transportation networks, and then significantly decreased due to the European Union's strict emission standards and air quality regulations (Guerreiro et al., 2014; Sicard et al., 2021; Georgoulias et al., 2019; Crippa et al., 2016). In North America, the northeastern industrial corridor of the US and Canada, along with major cities like Los Angeles and New York, shared a similar pattern as Western European countries. While overall NO2 concentrations are lower in Africa and South America, industrial centres and major cities like Johannesburg in South Africa and Sao Paulo in Brazil have shown increased NO2 levels in certain years. These areas require further pollution control measures to improve air quality.
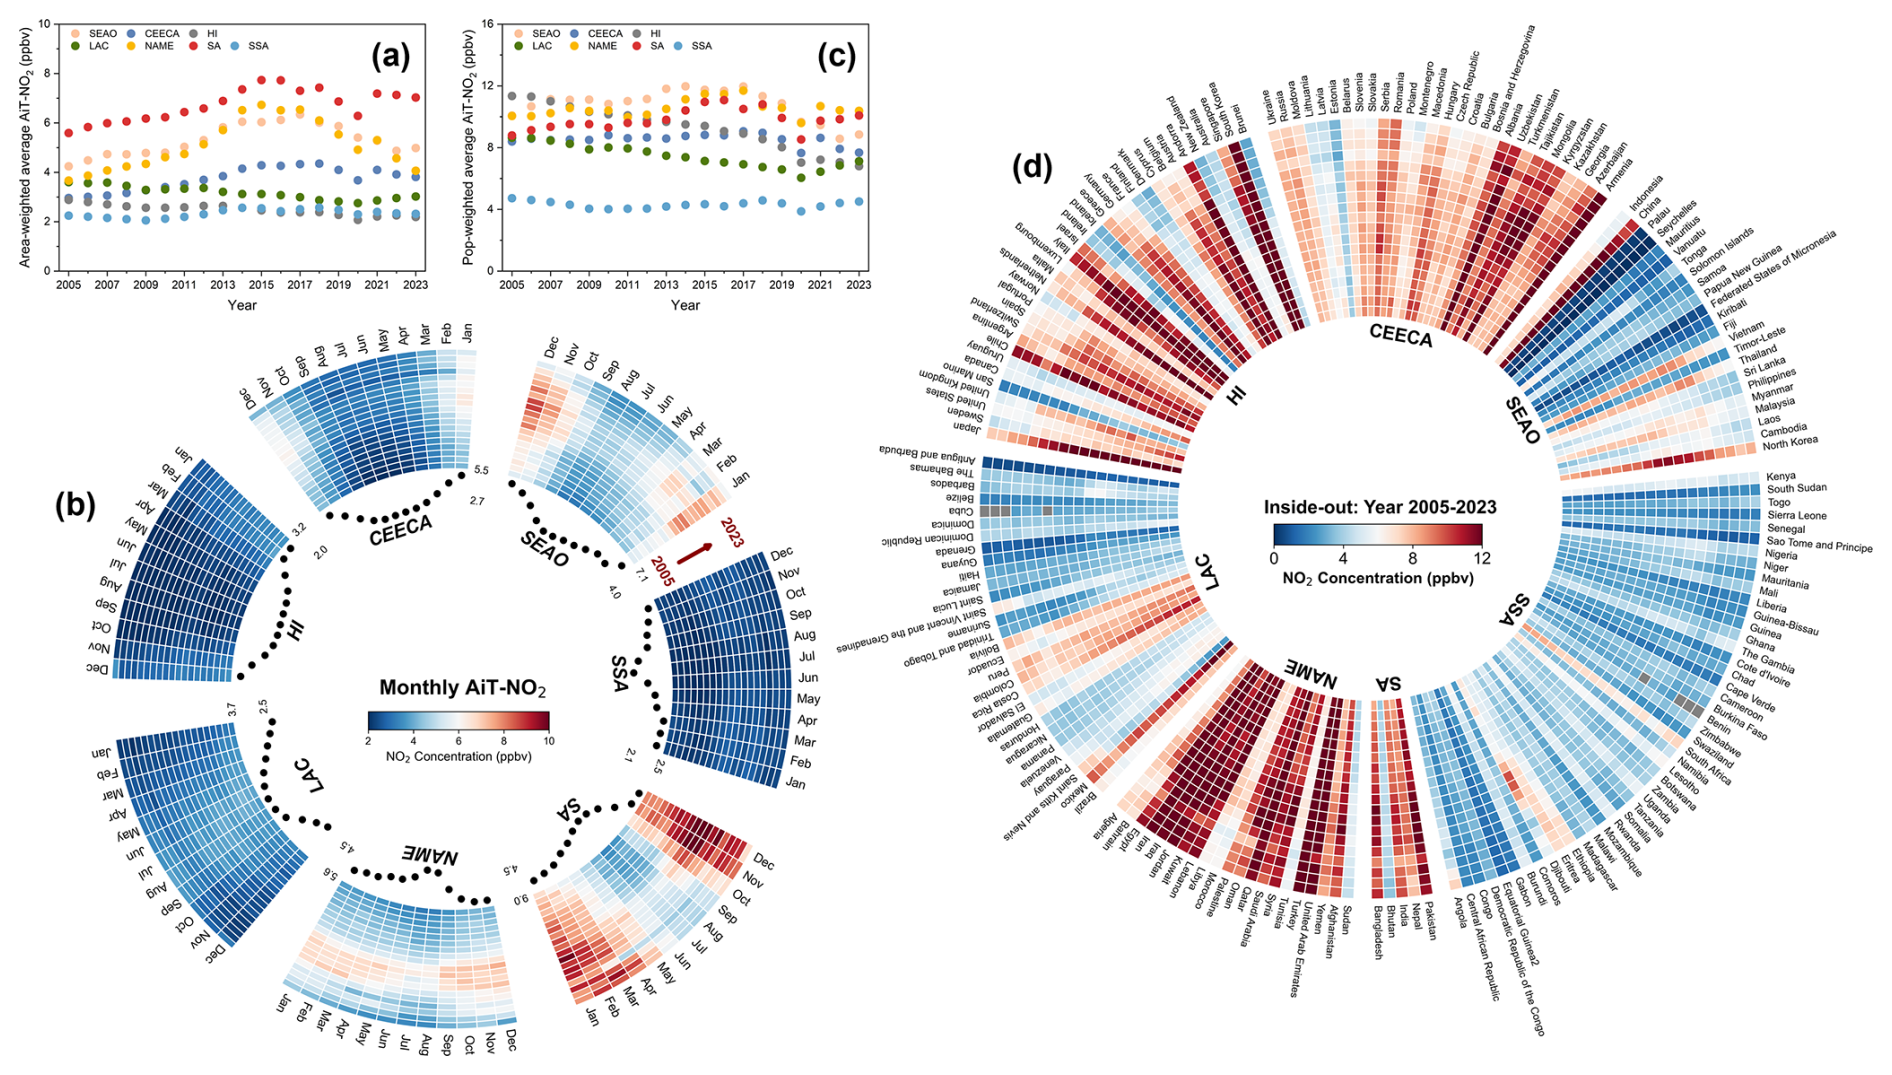
Figure 2Temporal trends of annual NO2 concentration from 2005 to 2023 in seven GBD super-regions for (a) area-weighted average; (c) population-weighted average. (b) Heatmap of monthly area-weighted average, with scatter plots indicating monthly averages over the 19-year period. (d) Heatmap of annual population-weighted average NO2 concentrations for each country within the super-regions from 2005 to 2023. The seven super-regions defined in GBD are South-East Asia, East Asia & Oceania (SEAO), Central Europe, Eastern Europe & Central Asia (CEECA), High-income (HI), Latin America & Caribbean (LAC), North Africa & Middle East (NAME), South Asia (SA), and Sub-Saharan Africa (SSA).
We further discussed the annual NO2 changes in seven super-regions (Fig. 2a, b) following the definitions by Global Burden of Disease (GBD) (Fig. S2): South-East Asia, East Asia & Oceania (SEAO), Central Europe, Eastern Europe & Central Asia (CEECA), High-income (HI), Latin America & Caribbean (LAC), North Africa & Middle East (NAME), South Asia (SA), and Sub-Saharan Africa (SSA). SA region has consistently the highest area-weighted NO2 levels among all regions, followed by SEAO and NAME. NO2 concentrations in these regions, as well as in CEECA, showed an increasing trend until 2015. In SA, SEAO, and NAME, the rise was primarily driven by rapid industrialization, urbanization, and increased transportation demand, while in CEECA, the increase was also linked to a reliance on fossil fuels and slower implementation of emission control measures. After 2015, NO2 levels began to stabilize or decline due to local emission reduction efforts and global events like the COVID-19 pandemic.
In contrast, AiTNO2 concentrations in other super-regions (LAC, HI, and SSA) are relatively low, with annual averages of less than 4 ppbv for the past two decades (Fig. 2a). The LAC region benefits from a combination of lower vehicle density in rural areas and successful urban air quality initiatives in major cities (Riojas-Rodríguez et al., 2016; Huneeus et al., 2020). The lower NO2 levels in the HI region are largely due to stringent environmental regulations, advanced pollution control technologies, and a significant shift towards cleaner energy sources. SSA presents a unique case where low industrialization and vehicle ownership contribute to lower NO2 levels. However, the region is still impacted by biomass burning for cooking and heating, which can lead to localized spikes in NO2 (Fig. S7).
When considering the population exposure, we found that high levels of NO2 were also observed in some developed regions, such as HI (including North America, Western Europe, Southern Latin America, Asia Pacific, and Australasia), which ranked first among the seven super-regions from 2005 to 2007 (Figs. 2c and S9). The higher population-weighted average of NO2 in HI was mainly attributed to several population dense countries, including South Korea, Japan, Singapore, Andorra, Germany and Italy (Figs. 2d and S9). Figure 3 illustrates the proportion of super regions that include the top ten countries with the highest population-weighted NO2 exposure over the past two decades. During the early years of the study period, the HI region accounted for 60 % of the top ten countries in terms of NO2 exposure. However, this proportion gradually decreased, leaving only one country from the HI region among the top ten in recent years. In contrast, the NAME region experienced a sharp increase in its share of countries with high NO2 exposure, eventually becoming the predominant area for such countries. This shift underscores the dynamic nature of NO2 exposure distribution, influenced by both changes in NO2 emissions and population dynamics.
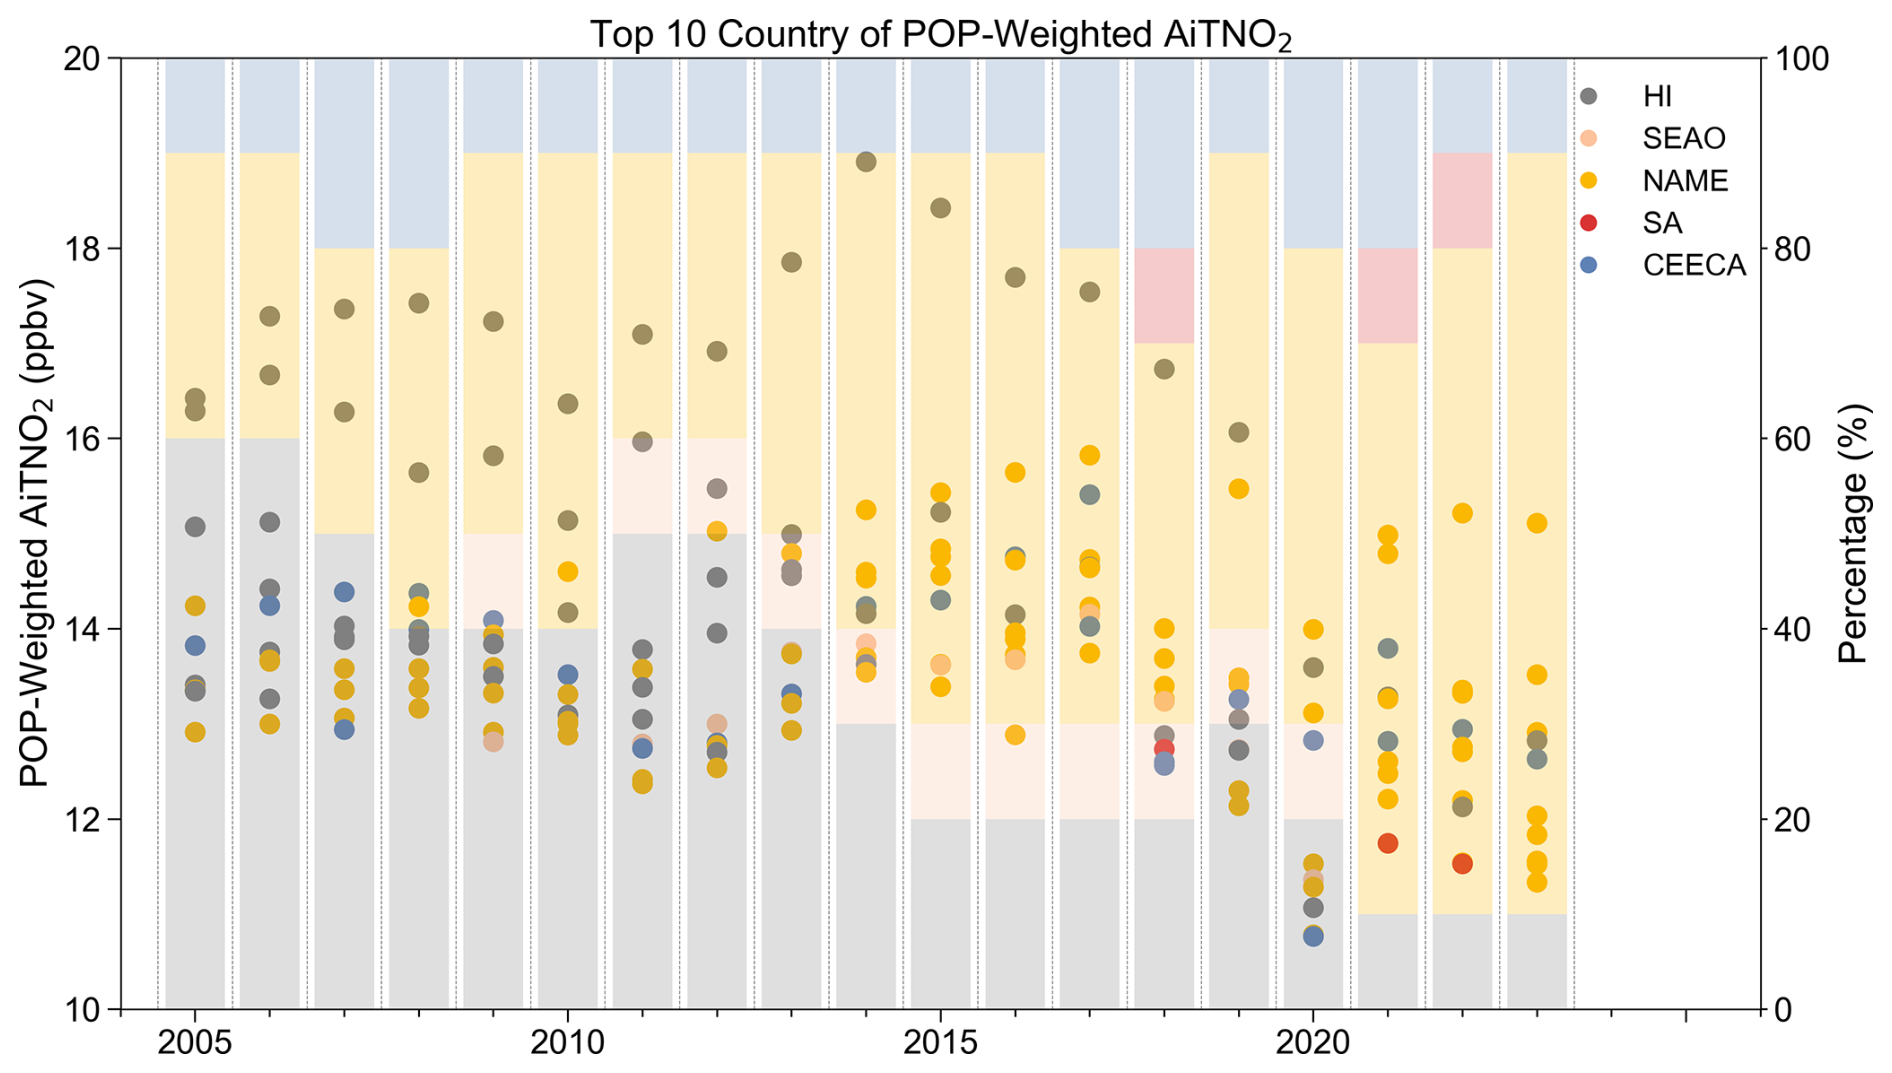
Figure 3Top 10 countries ranked by population-weighted NO2 concentration (2005–2023) and their regional distribution. The left y axis corresponds to the scatter plot, representing population-weighted AiTNO2 concentrations in parts per billion by volume (ppbv) for each country. The right y axis corresponds to the background colors, which represent the proportion of countries from different super-regions (HI, SEAO, NAME, SA, and CEECA) that are ranked in the top 10 based on AiTNO2 concentration. The background color segments show the percentage of top 10 countries that belong to each region, reflecting how the regional representation in the top 10 has evolved over time.
We estimated that in recent years, SEAO, NAME, and SA are among the top regions with the highest population-weighted NO2 concentration, with multiple year average of 10.78 ± 1.02, 10.54 ± 0.55, 9.81 ± 0.70 ppbv from 2005 to 2023, respectively. NO2 exposure was increasing by 0.19 and 0.72 ppbv per decade in NAME and SA, while decreasing by 0.68, 0.40, 2.53, 0.85, 0.12 ppbv per decade in SEAO, CEECA, HI, LAC, and SSA, respectively (Fig. 2c). These contrasting trends highlight substantial temporal changes in population-weighted NO2 distributions across super-regions, reflecting the combined influence of evolving emission patterns and regional population dynamics.
The global NO2 dataset developed using the Air Transformer (AiT) framework is available at: https://doi.org/10.5281/zenodo.13842191 (Mu and Tao, 2025).
This study delivers a long-term, spatially consistent global nitrogen dioxide (NO2) data resource that supports systematic analyses of NO2 variability and evolution across regions with contrasting emission characteristics. By providing a unified representation of surface NO2 concentrations over nearly two decades, the dataset enables comparative investigations of regional patterns and temporal changes and facilitates intercomparison with existing observation- and model-based products. As a globally consistent data foundation, it helps improve the coherence of long-term NO2 analyses across different geographic and climatic regimes and provides valuable insights for future epidemiological research. In addition, the dataset may facilitate downstream assessments that relate NO2 distributions to commonly used guideline values.
This dataset consists of high-resolution global daily surface NO2 concentrations for the period 2005–2023, generated using the Air Transformer (AiT) deep learning model. The dataset represents a major advancement in air quality research by overcoming the limitations of traditional ground-based monitoring networks and providing a fine-scale temporal resolution capable of capturing daily variations in NO2 concentrations. Such high-frequency data is crucial for understanding the short-term dynamics of NO2 pollution, which are often influenced by transient meteorological conditions, industrial emissions, and traffic patterns. The model's robust validation against independent datasets demonstrates its reliability and predictive performance, offering a more detailed depiction of NO2 pollution trends across diverse geographical regions, including both densely populated urban areas and remote locations with limited observational data.
Compared with conventional machine learning approaches, the Transformer-based AiT framework offers advantages in modeling long-range spatial and temporal dependencies through its attention mechanism. This structure allows the model to dynamically weight multi-source inputs and capture complex non-linear interactions among meteorological, geophysical, and satellite-derived variables. Such capability enhances the stability of predictions across heterogeneous regions and improves spatial transferability relative to traditional regression-based or tree-based models.
The implications of this work extend far beyond conventional air quality monitoring. The dataset provides a valuable resource for analysing spatial patterns of anthropogenic NO2 emissions, including those associated with industrial production and urban development, as well as for evaluating the effectiveness of pollution control measures. Its fine spatial resolution enables improved characterization of NO2 variability, particularly in urban regions and in areas with relatively dense monitoring coverage. This fine-grained understanding of NO2 distribution is particularly critical in densely populated areas, where exposure to elevated NO2 levels poses significant public health risks, including respiratory and cardiovascular diseases. The dataset's high spatial and temporal resolution enhances the precision of exposure assessments, supporting epidemiological studies and the formulation of targeted public health interventions.
Furthermore, the framework established in this study has the potential to be adapted and extended for the monitoring of other air pollutants, such as ozone (O3) and fine particulate matter (PM2.5), which also exhibit significant spatial and temporal variability. This versatility underscores the broader applications of the AiT model in environmental policy and public health management. By enabling more accurate and granular assessments of air quality, this dataset can inform regulatory actions and contribute to the development of more effective strategies for mitigating air pollution and protecting human health.
Future work should focus on expanding data sources, such as emissions inventories, traffic data, and other dynamic activity indicators, to further improve the model's accuracy, especially in less urbanized regions. Incorporating additional episodic drivers (e.g., wildfire-related products in fire-prone regions) may provide incremental improvements where such processes substantially influence NO2 variability. These refinements would enable more comprehensive global assessments of NO2 pollution and contribute to the development of more targeted and effective air quality management strategies.
The supplement related to this article is available online at https://doi.org/10.5194/essd-18-2999-2026-supplement.
YQZ conceived the study, and reviewed and edited the manuscript. LX secured project funding and reviewed the manuscript. JM drafted the original manuscript, contributed to methodology development and visualization, refined the methods, and edited the manuscript. CT contributed to methodology development and visualization and refined the methods. ZL, YNZ, NZ, BL, and QHZ contributed to methodology development. QZZ and HZ reviewed the manuscript. JM and CT contributed equally to this work.
At least one of the (co-)authors is a member of the editorial board of Earth System Science Data. The peer-review process was guided by an independent editor, and the authors also have no other competing interests to declare.
Publisher's note: Copernicus Publications remains neutral with regard to jurisdictional claims made in the text, published maps, institutional affiliations, or any other geographical representation in this paper. The authors bear the ultimate responsibility for providing appropriate place names. Views expressed in the text are those of the authors and do not necessarily reflect the views of the publisher.
We gratefully acknowledge the data providers whose publicly available datasets supported this study, including the China National Environmental Monitoring Centre, the U.S. Environmental Protection Agency, the European Environment Agency, the Tropospheric Ozone Assessment Report database, OpenAQ, ECMWF ERA5, NASA OMI, TROPOMI, MODIS, and WorldPop, etc.
This work was funded by the National Key Technology Research and Development Program of the Ministry of Science and Technology of China (grant no. 2022YFC3701101).
This paper was edited by Jing Wei and reviewed by two anonymous referees.
Anenberg, S. C., Mohegh, A., Goldberg, D. L., Kerr, G. H., Brauer, M., Burkart, K., Hystad, P., Larkin, A., Wozniak, S., and Lamsal, L.: Long-term trends in urban NO2 concentrations and associated paediatric asthma incidence: estimates from global datasets, Lancet Planet. Health, 6, e49–e58, https://doi.org/10.1016/S2542-5196(21)00255-2, 2022.
Chan, K. L., Khorsandi, E., Liu, S., Baier, F., and Valks, P.: Estimation of surface NO2 concentrations over Germany from TROPOMI satellite observations using a machine learning method, Remote Sens., 13, 969, https://doi.org/10.3390/rs13050969, 2021.
Chi, Y., Fan, M., Zhao, C., Yang, Y., Fan, H., Yang, X., Yang, J., and Tao, J.: Machine learning-based estimation of ground-level NO2 concentrations over China, Sci. Total Environ., 807, 150721, https://doi.org/10.1016/j.scitotenv.2021.150721, 2022.
Chowdhury, S., Haines, A., Klingmüller, K., Kumar, V., Pozzer, A., Venkataraman, C., Witt, C., and Lelieveld, J.: Global and national assessment of the incidence of asthma in children and adolescents from major sources of ambient NO2, Environ. Res. Lett., 16, 035020, https://doi.org/10.1088/1748-9326/abe909, 2021.
Cooper, M. J., Martin, R. V., Hammer, M. S., Levelt, P. F., Veefkind, P., Lamsal, L. N., Krotkov, N. A., Brook, J. R., and McLinden, C. A.: Global fine-scale changes in ambient NO2 during COVID-19 lockdowns, Nature, 601, 380–387, https://doi.org/10.1038/s41586-021-04229-0, 2022.
Crippa, M., Janssens-Maenhout, G., Dentener, F., Guizzardi, D., Sindelarova, K., Muntean, M., Van Dingenen, R., and Granier, C.: Forty years of improvements in European air quality: regional policy-industry interactions with global impacts, Atmos. Chem. Phys., 16, 3825–3841, https://doi.org/10.5194/acp-16-3825-2016, 2016.
Di, Q., Amini, H., Shi, L., Kloog, I., Silvern, R., Kelly, J., Sabath, M. B., Choirat, C., Koutrakis, P., and Lyapustin, A.: Assessing NO2 concentration and model uncertainty with high spatiotemporal resolution across the contiguous United States using ensemble model averaging, Environ. Sci. Technol., 54, 1372–1384, https://doi.org/10.1021/acs.est.9b03358, 2019.
Fei, L., Chan, L. Y., Bi, X., Guo, H., Liu, Y., Lin, Q., Wang, X., Peng, P., and Sheng, G.: Effect of cloud-to-ground lightning and meteorological conditions on surface NOx and O3 in Hong Kong, Atmos. Res., 182, 132–141, https://doi.org/10.1016/j.atmosres.2016.07.021, 2016.
Feng, Y., Ning, M., Lei, Y., Sun, Y., Liu, W., and Wang, J.: Defending blue sky in China: effectiveness of the “Air Pollution Prevention and Control Action Plan” on air quality improvements from 2013 to 2017, J. Environ. Manage., 252, 109603, https://doi.org/10.1016/j.jenvman.2019.109603, 2019.
Freire, C., Ramos, R., Puertas, R., Lopez-Espinosa, M.-J., Julvez, J., Aguilera, I., Cruz, F., Fernandez, M.-F., Sunyer, J., and Olea, N.: Association of traffic-related air pollution with cognitive development in children, J. Epidemiol. Commun. H., 64, 223–228, https://doi.org/10.1136/jech.2008.084574, 2010.
Gao, J., Yang, Y., Wang, H., Wang, P., Li, H., Li, M., Ren, L., Yue, X., and Liao, H.: Fast climate responses to emission reductions in aerosol and ozone precursors in China during 2013–2017, Atmos. Chem. Phys., 22, 7131–7142, https://doi.org/10.5194/acp-22-7131-2022, 2022.
Geng, G., Xiao, Q., Zheng, Y., Tong, D., Zhang, Y., Zhang, X., Zhang, Q., He, K., and Liu, Y.: Impact of China's air pollution prevention and control action plan on PM2.5 chemical composition over eastern China, Sci. China Earth Sci., 62, 1872–1884, https://doi.org/10.1007/s11430-018-9353-x, 2019.
Georgoulias, A. K., van der A, R. J., Stammes, P., Boersma, K. F., and Eskes, H. J.: Trends and trend reversal detection in 2 decades of tropospheric NO2 satellite observations, Atmos. Chem. Phys., 19, 6269–6294, https://doi.org/10.5194/acp-19-6269-2019, 2019.
Guerreiro, C. B., Foltescu, V., and De Leeuw, F.: Air quality status and trends in Europe, Atmos. Environ., 98, 376–384, https://doi.org/10.1016/j.atmosenv.2014.09.017, 2014.
Hall, S. J., Matson, P. A., and Roth, P. M.: NOx emissions from soil: implications for air quality modeling in agricultural regions, Annu. Rev. Env. Resour., 21, 311–346, https://doi.org/10.1146/annurev.energy.21.1.311, 1996.
Health Effects Institute: State of Global Air 2024, Special Report, Health Effects Institute, Boston, MA, https://www.stateofglobalair.org (last access: 29 April 2026), 2024.
Huang, K., Xiao, Q., Meng, X., Geng, G., Wang, Y., Lyapustin, A., Gu, D., and Liu, Y.: Predicting monthly high-resolution PM2.5 concentrations with random forest model in the North China Plain, Environ. Pollut., 242, 675–683, https://doi.org/10.1016/j.envpol.2018.07.016, 2018.
Huang, K., Zhu, Q., Lu, X., Gu, D., and Liu, Y.: Satellite-based long-term spatiotemporal trends in ambient NO2 concentrations and attributable health burdens in China from 2005 to 2020, GeoHealth, 7, e2023GH000798, https://doi.org/10.1029/2023GH000798, 2023.
Huneeus, N., van Der Gon, H. D., Castesana, P., Menares, C., Granier, C., Granier, L., Alonso, M., de Fatima Andrade, M., Dawidowski, L., and Gallardo, L.: Evaluation of anthropogenic air pollutant emission inventories for South America at national and city scale, Atmos. Environ., 235, 117606, https://doi.org/10.1016/j.atmosenv.2020.117606, 2020.
Kim, E., Park, H., Hong, Y.-C., Ha, M., Kim, Y., Kim, B.-N., Kim, Y., Roh, Y.-M., Lee, B.-E., and Ryu, J.-M.: Prenatal exposure to PM10 and NO2 and children's neurodevelopment from birth to 24 months of age: Mothers and Children's Environmental Health (MOCEH) study, Sci. Total Environ., 481, 439–445, https://doi.org/10.1016/j.scitotenv.2014.01.107, 2014.
Larkin, A., Anenberg, S., Goldberg, L. D., Mohegh, A., Brauer, M., and Hystad, P.: A global spatial-temporal land use regression model for nitrogen dioxide air pollution, Front. Environ. Sci., 11, https://doi.org/10.3389/fenvs.2023.1125979, 2023.
Levelt, P. F., Van Den Oord, G. H., Dobber, M. R., Malkki, A., Visser, H., De Vries, J., Stammes, P., Lundell, J. O., and Saari, H.: The ozone monitoring instrument, IEEE T. Geosci. Remote, 44, 1093–1101, https://doi.org/10.1109/TGRS.2006.872333, 2006.
Li, K., Jacob, D. J., Liao, H., Shen, L., Zhang, Q., and Bates, K. H.: Anthropogenic drivers of 2013–2017 trends in summer surface ozone in China, P. Natl. Acad. Sci. USA, 116, 422–427, https://doi.org/10.1073/pnas.1812168116, 2019.
Liu, R., Shao, M., and Wang, Q.: Multi-timescale variation characteristics of PM2.5 in different regions of China during 2014–2022, Sci. Total Environ., 920, 171008, https://doi.org/10.1016/j.scitotenv.2024.171008, 2024.
Liu, X., Zhang, X., Wang, R., Liu, Y., Hadiatullah, H., Xu, Y., Wang, T., Bendl, J., Adam, T., and Schnelle-Kreis, J.: High-precision microscale particulate matter prediction in diverse environments using a Long Short-Term Memory neural network and street view imagery, Environ. Sci. Technol., 58, 3869–3882, https://doi.org/10.1021/acs.est.3c06511, 2024.
Long, S., Wei, X., Zhang, F., Zhang, R., Xu, J., Wu, K., Li, Q., and Li, W.: Estimating daily ground-level NO2 concentrations over China based on TROPOMI observations and machine learning approach, Atmos. Environ., 289, 119310, https://doi.org/10.1016/j.atmosenv.2022.119310, 2022.
Mu, J. and Tao, C.: GlobalNO2_AIT: 0.1° annual resolution global ground-level NO2 dataset, Zenodo [data set], https://doi.org/10.5281/zenodo.13842191, 2025.
Qu, Z., Jacob, D. J., Silvern, R. F., Shah, V., Campbell, P. C., Valin, L. C., and Murray, L. T.: US COVID-19 shutdown demonstrates importance of background NO2 in inferring NOx emissions from satellite NO2 observations, Geophys. Res. Lett., 48, e2021GL092783, https://doi.org/10.1029/2021GL092783, 2021.
Riojas-Rodríguez, H., da Silva, A. S., Texcalac-Sangrador, J. L., and Moreno-Banda, G. L.: Air pollution management and control in Latin America and the Caribbean: implications for climate change, Rev. Panam. Salud Públ., 40, 150–159, 2016.
Schmidt, C. W.: Environmental factors in successful aging: the potential impact of air pollution, Environ. Health Persp., 127, 102001, https://doi.org/10.1289/EHP4579, 2019.
Sekiya, T., Miyazaki, K., Eskes, H., Sudo, K., Takigawa, M., and Kanaya, Y.: A comparison of the impact of TROPOMI and OMI tropospheric NO2 on global chemical data assimilation, Atmos. Meas. Tech., 15, 1703–1728, https://doi.org/10.5194/amt-15-1703-2022, 2022.
Sentís, A., Sunyer, J., Dalmau-Bueno, A., Andiarena, A., Ballester, F., Cirach, M., Estarlich, M., Fernández-Somoano, A., Ibarluzea, J., and Íñiguez, C.: Prenatal and postnatal exposure to NO2 and child attentional function at 4–5 years of age, Environ. Int., 106, 170–177, https://doi.org/10.1016/j.envint.2017.05.021, 2017.
Shao, Y., Zhao, W., Liu, R., Yang, J., Liu, M., Fang, W., Hu, L., Adams, M., Bi, J., and Ma, Z.: Estimation of daily NO2 with explainable machine learning model in China, 2007–2020, Atmos. Environ., 314, 120111, https://doi.org/10.1016/j.atmosenv.2023.120111, 2023.
Sicard, P., Agathokleous, E., De Marco, A., Paoletti, E., and Calatayud, V.: Urban population exposure to air pollution in Europe over the last decades, Environ. Sci. Eur., 33, 1–12, https://doi.org/10.1186/s12302-020-00450-2, 2021.
Sun, W., Lu, K., and Li, R.: Global estimates of ambient NO2 concentrations and long-term health effects during 2000–2019, Environ. Pollut., 359, 124562, https://doi.org/10.1016/j.envpol.2024.124562, 2024.
Tao, C., Peng, Y., Zhang, Q., Zhang, Y., Gong, B., Wang, Q., and Wang, W.: Diagnosing ozone–NOx–VOC–aerosol sensitivity and uncovering causes of urban–nonurban discrepancies in Shandong, China, using transformer-based estimations, Atmos. Chem. Phys., 24, 4177–4192, https://doi.org/10.5194/acp-24-4177-2024, 2024.
Veefkind, J. P., Aben, I., McMullan, K., Förster, H., De Vries, J., Otter, G., Claas, J., Eskes, H., De Haan, J., and Kleipool, Q.: TROPOMI on the ESA Sentinel-5 Precursor: A GMES mission for global observations of the atmospheric composition for climate, air quality and ozone layer applications, Remote Sens. Environ., 120, 70–78, https://doi.org/10.1016/j.rse.2011.09.027, 2012.
Wei, J., Huang, W., Li, Z., Xue, W., Peng, Y., Sun, L., and Cribb, M.: Estimating 1-km-resolution PM2.5 concentrations across China using the space-time random forest approach, Remote Sens. Environ., 231, 111221, https://doi.org/10.1016/j.rse.2019.111221, 2019.
Wei, J., Li, Z., Chen, X., Li, C., Sun, Y., Wang, J., Lyapustin, A., Brasseur, G. P., Jiang, M., and Sun, L.: Separating daily 1 km PM2.5 inorganic chemical composition in China since 2000 via deep learning integrating ground, satellite, and model data, Environ. Sci. Technol., 57, 18282–18295, https://doi.org/10.1021/acs.est.3c00272, 2023.
Wei, J., Liu, S., Li, Z., Liu, C., Qin, K., Liu, X., Pinker, R., Dickerson, R., Lin, J., Boersma, K., Sun, L., Li, R., Xue, W., Cui, Y., Zhang, C., and Wang, J.: Ground-level NO2 surveillance from space across China for high resolution using interpretable spatiotemporally weighted artificial intelligence, Environ. Sci. Technol., 56, 9988–9998, https://doi.org/10.1021/acs.est.2c03834, 2022.
Wong, P.-Y., Su, H.-J., Lee, H.-Y., Chen, Y.-C., Hsiao, Y.-P., Huang, J.-W., Teo, T.-A., Wu, C.-D., and Spengler, J. D.: Using land-use machine learning models to estimate daily NO2 concentration variations in Taiwan, J. Clean. Prod., 317, 128411, https://doi.org/10.1016/j.jclepro.2021.128411, 2021.
World Health Organization: WHO global air quality guidelines: particulate matter (PM2.5 and PM10), ozone, nitrogen dioxide, sulfur dioxide and carbon monoxide, https://www.who.int/publications/i/item/9789240034228 (last access: 29 April 2026), 2021.
Xie, Y., Zhou, M., Hunt, K. M., and Mauzerall, D. L.: Recent PM2.5 air quality improvements in India benefited from meteorological variation, Nat. Sustain., 1–11, https://doi.org/10.1038/s41893-024-01366-y, 2024.
Xing, X., Zhou, Y., Lang, J., Chen, D., Cheng, S., Han, L., Huang, D., and Zhang, Y.: Spatiotemporal variation of domestic biomass burning emissions in rural China based on a new estimation of fuel consumption, Sci. Total Environ., 626, 274–286, https://doi.org/10.1016/j.scitotenv.2018.01.048, 2018.
Xue, L. K., Wang, T., Gao, J., Ding, A. J., Zhou, X. H., Blake, D. R., Wang, X. F., Saunders, S. M., Fan, S. J., Zuo, H. C., Zhang, Q. Z., and Wang, W. X.: Ground-level ozone in four Chinese cities: precursors, regional transport and heterogeneous processes, Atmos. Chem. Phys., 14, 13175–13188, https://doi.org/10.5194/acp-14-13175-2014, 2014.
Zhao, Y., Wang, L., Luo, J., Huang, T., Tao, S., Liu, J., Yu, Y., Huang, Y., Liu, X., and Ma, J.: Deep learning prediction of polycyclic aromatic hydrocarbons in the high arctic, Environ. Sci. Technol., 53, 13238–13245, https://doi.org/10.1021/acs.est.9b05000, 2019.