the Creative Commons Attribution 4.0 License.
the Creative Commons Attribution 4.0 License.
 | 21 Apr 2026
Deriving regional and point source nitrogen oxides emissions in China from TROPOMI using the directional derivative approach with nonlinear chemical lifetime fitting
Ling Chen
Zhaonan Cai
Dongxu Yang
Mingming Li
Lingyun Zhu
An appropriate representation of the NO ratio and NOx lifetime is essential for estimating NOx emissions from satellite NO2 observations. We introduce a satellite-based, data-driven approach that applies variable NO ratio and derives the nonlinear chemical lifetime using a piecewise fitting method based on the directional derivative approach (DDA). This method enables the estimation of both regional and point-source NOx emissions across China, representing the first application of a lightweight, satellite-driven method to directly capture nonlinear NOx lifetime for emission estimation over large, topographically complex region. The incorporation of a variable NO ratio enhances the accuracy of source divergence and emission estimates and the improved fitting scheme captures the nonlinear behavior of NOx chemistry. Anthropogenic contributions are isolated by subtracting natural sources from satellite-derived total emissions, with natural NOx identified using a seasonal criterion and further constrained by Nighttime Light (NTL) data. Estimated anthropogenic NOx emissions in China from 2019 to 2024 are 20.2, 18.5, 19.4, 18.9, 20.7 and 18.8 Tg, respectively, with annual uncertainties of 27 %–30 %. These values show good agreement with both bottom-up inventories and top-down inversions, with national scale discrepancies ranging from −11.8 % to 0.8 %. The DDA captures key spatial and temporal emission patterns, including consistent decline in NOx emissions in megacities and provincial disparities linked to urbanization and economic development. The DDA estimates are consistent with previous studies on power plant emissions, and emissions from 124 plants vary between 0.02–2.13 kg s−1 for 2019–2024, with uncertainties spanning 4 %–78 %, averaging 16 %. This satellite-based, lightweight method enables low-latency, long-term monitoring of NOx emissions and offers a promising alternative to bottom-up inventories and resource-intensive top-down models. The data are publicly available at https://doi.org/10.5281/zenodo.18923337 (Chen et al., 2026).
- Article
(8021 KB) - Full-text XML
-
Supplement
(1878 KB) - BibTeX
- EndNote


Nitrogen oxides (NOx= NO + NO2) are key reactive trace gases and major air pollutants in the troposphere, influencing ozone photochemistry, particulate matter and acid rain formation (Galloway et al., 2004). Accurate and near-real-time estimation of NOx emissions is crucial for air pollution control and provides a practical approach for estimating co-emitted CO2 (Reuter et al., 2014, 2019; Miyazaki and Bowman, 2023; Li and Zheng, 2024).
NO2 tropospheric vertical column densities (TVCDs) retrieved from new generation satellite instruments at unprecedented high spatiotemporal resolution and accuracy (Verhoelst et al., 2021; van Geffen et al., 2022) have accelerated the development of lightweight, mass conservation-based inversion approaches for top-down NOx emission estimation. Methods such as the cross-sectional flux (CSF) (Reuter et al., 2019; Santaren et al., 2025), integrated mass enhancement (IME) (Santaren et al., 2025) and flux divergence approach (FDA) (Beirle et al., 2019, 2021, 2023) have advanced rapidly due to their low computational cost and minimal latency. These methods rely on NO2 data and approximate meteorological transport velocities to estimate emissions. The CSF and IME methods first identify sources and then integrate emissions within plume contours based on enhancements above background. They are highly sensitive to wind speed and best suited for strong, distinct point sources with synchronous wind observations (Frankenberg et al., 2016; Koene et al., 2024; Krings et al., 2011; Varon et al., 2018). In contrast, the FDA generates a regional emission map and identifies sources by calculating the divergence of the horizontal flux. It is especially effective for detecting point sources without additional a priori knowledge (Ayazpour et al., 2025; Beirle et al., 2019, 2021, 2023; Koene et al., 2024).
Since its proposal by Beirle et al. (2019), the FDA has been widely applied and refined for NOx emissions estimation, primarily driven by TROPOspheric Monitoring Instrument (TROPOMI) NO2 data (Beirle et al., 2021, 2023; De Foy and Schauer, 2022; Koene et al., 2024). It has also been extended to long-lived gases like CH4 (Veefkind et al., 2023) and CO2 (Santaren et al., 2025). The FDA theory recommends explicit background subtraction (Koene et al., 2024), even for short-lived species like NO2 (Cifuentes et al., 2025). However, a well-defined NO2 background field may not exist (Koene et al., 2024). In practice, the NO2 background is either empirically removed (Beirle et al., 2019; De Foy and Schauer, 2022; Rey-Pommier et al., 2022, 2023) or the entire column is treated as the enhanced field (Beirle et al., 2021, 2023). An alternative to the FDA is the directional derivative approach (DDA) as proposed by Sun (2022), which replaces the flux divergence term by a directional derivative, i.e., the inner product between horizontal wind and gradient of column amounts. Both the FDA and DDA establish the link between satellite-observed column amounts and emissions by vertically integrating the three-dimensional continuity equation, incorporating reasonable assumptions and approximations (Ayazpour et al., 2025; Koene et al., 2024). The primary difference between the FDA and DDA is the upper limit of vertical column integration (Ayazpour et al., 2025; Lonsdale and Sun, 2023). Integration in DDA is performed from surface to an intermediate altitude that does not need to be explicitly defined. As demonstrated in Ayazpour et al. (2025), the different upper limit used in the DDA ultimately leads to the directional derivative term and a topography term, which in combination replace the flux divergence term in the FDA. By spatially differentiating the column amounts, the DDA implicitly removes the background field that is invariant at the spatial scale of single grid cells. Another resultant benefit of the DDA is that the adopted horizontal wind does not have to approximate the full wind profile but only the lower levels, which leads to higher accuracy and error tolerance.
Two key challenges remain for NOx emission estimation using the FDA and DDA, including the NO ratio and the nonlinear NOx lifetime. When emitted, NOx is dominated by NO, which is rapidly oxidized by ozone (O3) to form NO2. As the plume mixes with ambient air, the balance between NO and NO2 is determined by the availability of oxidants that oxidizes NO to NO2 and radiations that photolyze NO2 to NO. The dominant sink of NOx is the reaction between NO2 and OH, which is modulated by the complex interplay between NOx, O3, and volatile organic compounds (VOCs) (Laughner and Cohen, 2019). This nonlinear photochemical evolution causes significant variations in the NO ratio and NOx lifetime, both over time and distance from the emission source (Krol et al., 2024; Meier et al., 2024). Constrained by the availability of observational data and the rationale for maintaining algorithmic efficiency, both existing FDA and DDA applications have necessarily involved substantial simplifications. Previous studies have accounted for the variability of NO ratios across different pixels using auxiliary data (Beirle et al., 2021, 2023; Ayazpour et al., 2025; Cifuentes et al., 2025; Meier et al., 2024), rather than assuming a constant value (Beirle et al., 2019; De Foy and Schauer, 2022; Lonsdale and Sun, 2023; Sun, 2022). Efforts have also been made to consider factors such as NOx concentration, latitude, season (Beirle et al., 2023; Lange et al., 2022) and distance from the emission source (Krol et al., 2024; Meier et al., 2024) to account for the variability of NOx lifetime. However, capturing these nonlinear variations (Laughner and Cohen, 2019) remains difficult. Meanwhile, due to the challenges above, most existing studies focus on point sources rather than emissions from large regions.
In this work, we augment the DDA by applying a variable NO ratio from a global high-resolution chemical transport model and deriving a more realistic nonlinear NOx lifetime using an improved satellite data-driven piecewise fitting approach. Based on the augmented DDA, we estimate NOx emissions in China from 2019 to 2024. We evaluate the estimated emissions by comparing regional and point-source emissions with bottom-up inventories and top-down datasets. The paper is structured as follows: Sect. 2 describes the input datasets. Section 3 outlines the methods with a focus on NOx lifetime fitting, the isolating anthropogenic NOx from total emissions, and uncertainties. Section 4 presents the validation, along with the distribution and variations of emissions. Section 5 discusses limitations, followed by the conclusions (Sect. 7).
2.1 TROPOMI NO2
The operational offline TROPOMI NO2 TVCD product (S5P_L2__NO2___HiR2) (van Geffen et al., 2024) from NASA GES DISC (https://daac.gsfc.nasa.gov/datasets/, last access: 17 April 2026) for 2019–2024 is used in this study. TROPOMI is on board of ESA's Sentinel-5 Precursor (S5P) early-afternoon LEO satellite with a high signal-to-noise ratio (Veefkind et al., 2012). It provides global daily coverage with a spatial resolution of 7.0 km × 3.5 km before 6 August 2019 and updated to 5.5 km × 3.5 km thereafter. The data are filtered according to the following criteria: qa > 0.75 and cloud fraction (CF) < 0.3 to remove very cloudy scenes, ice-snow cover scenes and erroneous retrievals (van Geffen et al., 2022; Verhoelst et al., 2021); solar zenith angle (SZA) < 65° to exclude observations with low solar elevation, and viewing zenith angles (VZA) < 56° to minimize unfavorable viewing conditions at the edges of the swath, following Beirle et al. (2023).
2.2 Wind fields data
Wind fields are provided by the European Centre for Medium-Range Weather Forecasts (ECMWF) ERA5 reanalysis data (https://cds.climate.copernicus.eu/datasets/, last access: 17 April 2026). The 500 m wind fields are interpolated from hourly data on pressure levels, while the 10 m wind fields are directly obtained from hourly data on single levels. Both datasets have a spatial resolution of 0.25° × 0.25°. Details on the selection of wind heights and data processing are provided in Sect. 3.1.
2.3 Chemical data
The chemical data for NO and NO2 are sourced from the Goddard Earth Observing System composition forecast (GEOS-CF) system (https://gmao.gsfc.nasa.gov/gmao-products/geos-cf/, last access: 16 April 2026) to derive the NO ratio. GEOS-CF integrates the offline GEOS-Chem chemistry module into the GEOS weather and aerosol modeling system, enabling global near real-time estimates (hindcasts) and 5 d forecasts of atmospheric constituents at a high spatial resolution of 25 km × 25 km (Keller et al., 2021; Knowland et al., 2022). The NO ratios are highest near emission sources because freshly emitted NO rapidly consumes local ozone and is subsequently oxidized to NO2 as the plume mixes with background air (Meier et al., 2024). Following Beirle et al. (2021, 2023), NO2 columns are converted to NOx using the near-surface photostationary state, with the NO ratio from the near-surface model layer with a 1-hour temporal resolution (chm_tavg_1hr_g1440x721_v1) used in this study to better represent near-source conditions and the resulting NOx gradients (Ayazpour et al., 2025; Sun, 2022).
2.4 Inventories
Two inventories for natural and anthropogenic sources are used. Soil NOx emissions are obtained from the CAMS global emission inventory (https://ads.atmosphere.copernicus.eu/datasets/cams-global-emission-inventories/, last access: 17 April 2026), which provides monthly estimates from fertilizer/manure application and atmospheric deposition at a 0.5° resolution (Hoesly et al., 2018; Simpson et al., 2014; Yienger and Levy II, 1995). Since the inventory is updated only until 2018 and soil NOx variability is relatively small compared to total emissions, the 2018 data serve as a proxy for 2019–2024.
Biomass burning and vegetation fires NOx emissions are derived from the CAMS global biomass burning emissions (GFAS) (https://ads.atmosphere.copernicus.eu/datasets/cams-global-fire-emissions-gfas/, last access: 17 April 2026). GFAS v1.2 provides near-real-time daily averaged fire NOx fluxes using satellite observations of fire radiative power (FRP) on a global 0.1° × 0.1° grid (Kaiser et al., 2012). The data covers 2019–2024.
Anthropogenic NOx emissions for validation are sourced from the Multi-resolution Emission Inventory model for Climate and air pollution research (MEIC, v1.4, 2019–2020, http://meicmodel.org.cn, last access: 17 April 2026) and the Emissions Database for Global Atmospheric Research (EDGAR, v8.1, 2019–2022, https://edgar.jrc.ec.europa.eu, last access: 17 April 2026). MEIC provides high-resolution, multi-scale databases of anthropogenic emissions for China at a 0.25° × 0.25° resolution (Geng et al., 2024; Li et al., 2017). EDGAR delivers global coverage at 0.1° × 0.1° resolution, with emissions derived through statistical downscaling of national inventories using high-resolution spatial proxies (Crippa et al., 2024; Solazzo et al., 2021).
2.5 Point source data
The point source emissions derived from DDA are evaluated against the point source catalog provided by Beirle et al. (2023). For point source detection, their catalog uses coal, gas, and oil power plants with capacities ≥ 100 MW from the Global Power Plant Database (Byers et al., 2019), identifying over 1100 NOx point sources worldwide. Their validation shows good agreement in Germany and the United States, demonstrating the catalog's reliability.
2.6 Nighttime light data
NASA's Black Marble nighttime lights (NTL) product suite, derived from the Visible Infrared Imaging Radiometer Suite (VIIRS) Day/Night Band (DNB) onboard the Suomi National Polar-orbiting Partnership (SNPP), serves as a constraint on anthropogenic emissions (Román et al., 2018; Wang et al., 2021). The Lunar BRDF-Adjusted Nighttime Lights Yearly L3 Global 15 arcsec Linear Lat/Lon Grid product (VNP46A4) provides high spatial resolution at 500 m and is available from January 2012 onward (https://viirsland.gsfc.nasa.gov/Products/NASA/BlackMarble.html, last access: 17 April 2026). This study uses data from 2019 to 2023. Due to the current unavailability of VNP46A4 data for 2024, the 2023 dataset is applied as a substitute.
2.7 National accounts data
National accounts data of annual Gross Domestic Product (GDP) and provincial Gross Regional Product (GRP) are from National Bureau of Statistics of China (https://data.stats.gov.cn, last access: 17 April 2026).
3.1 Framework of the directional derivative approach
The mathematical framework of the DDA is detailed in Sun (2022) and further developed by Ayazpour et al. (2025). Based on satellite-observed NO2 TVCDs, NOx emissions E can be estimated as:
where ∇ denotes the two-dimensional horizontal vector differential operator in Cartesian coordinates, i.e., ∇= (, . No terrain-following coordinate system is used in this formulation. Ω is NO2 TVCD, f is the NO ratio, u is the profile-weighted horizontal wind from surface to a conceptual altitude (z1) which is not explicitly needed and defined, u0 is surface wind, and z0 is surface altitude. X and τ are fitting parameters representing the inverse of scale height and NOx lifetime, respectively. The tendency term () becomes negligible when averaging over a month or longer or under the steady-state approximation. It should be noted that this approximation may not hold for a single satellite overpass, potentially leading to significant errors (Koene et al., 2024). Assuming X and τ stay constant over the averaging period, the spatiotemporal averaged emissions 〈E〉 for a given time period and horizontal resolution can be expressed as:
Here, the operator 〈〉 denotes spatiotemporal averaging. The first and second terms of Eq. (2) are referred as the DDf estimator (Ayazpour et al., 2025), reflecting the contributions of advection transport to local NOx emissions. The third component is the topography correction as emphasized by Ayazpour et al. (2025), it is directly derived from the continuity equation rather than serving merely as an empirical adjustment (Koene et al., 2024). The sum of the first three terms is referred to as DDf_topo estimator. The last term describes the NOx chemistry approximated by first-order loss.
Integration in DDA is performed from z0 to an intermediate altitude z1. While the ideal approach would involve winds at all vertical levels, the full wind profile is typically unavailable. Instead, a single-layer wind, known as the effective wind field, is used to approximate the average state of the full profile. Ayazpour et al. (2025) utilized the effective wind field height using WRF-CMAQ simulations and found that the 500 m wind is most suitable, which aligns with Beirle et al. (2023). Consequently, the horizontal wind u is interpolated to 500 m above the surface, while u0 directly obtained as the 10 m wind from ERA5.
To apply Eq. (2), the physics-based oversampling approach (Sun et al., 2018) is used to resample the level 2 pixels into 0.025° × 0.025° grid cells with appropriate weighting, then coarsened to 0.05° × 0.05°. Winds in ERA5, the NO ratio (f) in GEOS-CF data are resampled to match this spatial resolution and temporally aligned with satellite overpasses, allowing for the calculation of all bracketed terms in Eq. (2). Yearly NTL data from SNPP/VIIRS are also resampled at the same spatial resolution. The spatial differentiation in gradient calculation is conducted on 0.05° × 0.05° grid cells with second order central difference. All bracketed terms are averaged at a monthly scale before X and τ are fitted (see in Sect. 3.2) to derive emissions 〈E〉 in mol m−2 s−1, and the conversion to mass assumes NOx as NO2.
3.2 Nonlinear NOx lifetime fitting
To avoid additional assumptions and external computations (Beirle et al., 2021, 2023), DDA performs a data-driven fitting approach based on monthly fluxes to determine X and τ across grids with negligible emissions (〈E〉≈ 0) (Ayazpour et al., 2025; Lonsdale and Sun, 2023; Sun, 2022), where Eq. (2) can be rewritten as:
Here, −β1 is an estimate of X, −β2 is an estimate of the inverse of τ, β0 and ε represent the offset and random error in the predicted variable, which cannot be accounted for by any linear combinations of predictors.
Both the FDA and DDA methods in prior studies have exhibited substantial negative emissions and/or underestimation of total emissions (Ayazpour et al., 2025; Beirle et al., 2019, 2021, 2023; De Foy and Schauer, 2022; Lonsdale and Sun, 2023; Sun, 2022). A single τ fitted in relatively clean region tends to overestimate the chemistry lifetime, then the NOx flux is underestimated. Therefore, a more realistic representation of NOx lifetime is critical for accurate emission estimation (Beirle et al., 2023; Krol et al., 2024; Laughner and Cohen, 2019; Meier et al., 2024). The photochemical reactions of NOx–O3–VOCs depends on the concentrations of NOx, O3, and VOCs, as well as on photolysis and meteorological conditions (Pusede et al., 2015; Sillman et al., 1990; Souri et al., 2023). Even under identical NOx concentrations and at the same latitude (Beirle et al., 2023; Lange et al., 2022), the lifetime still vary considerably due to the complex interplay of NOx and VOC chemistry (Laughner and Cohen, 2019).
To derive more realistic lifetime, we fit β2 across stratified column amount intervals 〈Ω〉 within subregions instead of fitting a single lifetime across the domain to account for the NOx reactivity nonlinearity. We partition the study domain into four subregions by employing NOx concentration as the primary criterion due to its dominant control over chemical lifetime (Pusede et al., 2015) with additional consideration of latitude and terrain effects. Figure 1a shows the four subregions. The east (E) and west (W) sections are divided by the Hu line (HL) that extends from Heihe (127.54° E, 50.25° N) to Tengchong (98.50° E, 25.03° N). The E and W sections are further subdivided into north (N) and south (S) subregions by latitudes 35° N for the west and 30° N for the east. The resultant four subregions are denoted as WN, WS, EN, ES thereafter. The HL is a well-known natural geographical boundary that divides China into two contrasting regions in terms of terrain, climate, population density, and economic activity. The eastern part, encompassing most of China's plains and rivers (Fig. 1b), is dominated by the East Asian monsoon, supports 96 % of the population, contributes the majority of national productivity, and faces severe air pollution. In contrast, the western region is characterized by elevated terrain, a westerly climate, and sparse population (Hu, 1935; Zhang et al., 2022). So, the above factors implicitly account for variations in O3 and its precursors influenced by human activities (Jin et al., 2020; Martin et al., 2004; Souri et al., 2023), differences in natural VOCs emissions from vegetation under varying climatic and geographical conditions (Guenther et al., 1995; Sprengnether et al., 2002; Palmer et al., 2006), and meteorological influences on transport and photochemistry (Duncan et al., 2010; Li et al., 2020; Pusede et al., 2015).
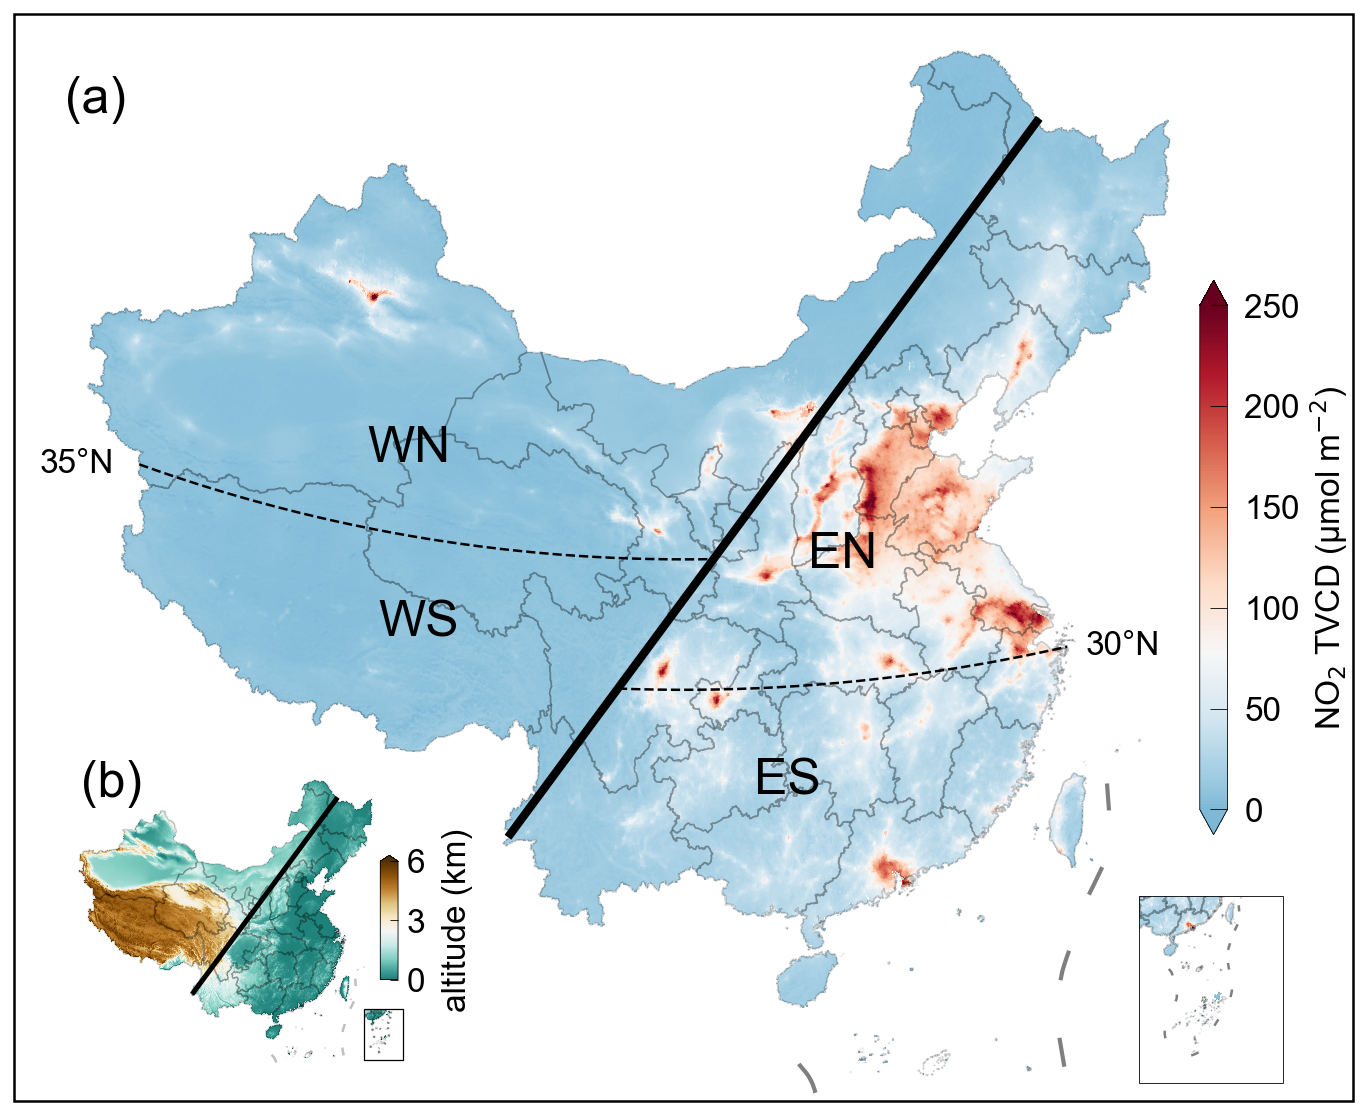
Figure 1Four subregions divided by the Hu line and (a) average NO2 TVCDs of 2019 as an example; (b) altitude.
Given the small interannual variability and limited impact on reactive species emission estimation (Ayazpour et al., 2025), β1 is fitted using the same climatological months, whereas β2 is fitted for each individual month using NO2 TVCD percentile bins constructed independently for that month and subsequently averaged over the same months for each subregion during 2019–2024. First, β1 is fitted in grid cells with rough terrain (0.001 m s 0.1 m s−1), where emissions are negligible (DDf < 5 × 10⁻⁹ mol m−2 s−1). Then, β2 is fitted in flat terrain (where 0.001 m s−1) without strong NOx emission sources (DDf_topo < 10−10 mol m−2 s−1). The fitting is performed across piecewise bins defined by NO2 TVCD percentiles. TVCD percentiles are binned at 10 % intervals for each month in WN and EN, while in WS and ES, due to narrower lower percentile ranges, bin widths are expanded to 20 % below the 80th percentile and remain 10 % above it to ensure robust fitting performance. For month-bins where fitting fails (p>0.01 or β2>0), appropriate adjustments are made by merging neighboring bins or revising percentile thresholds. A total of 1393 month-bins are successfully fitted across the four subregions. The number of grid cells per bin ranges from 3 to 9388 (10th percentile: 17; median: 91; mean: 199), indicating that most bins contain sufficient data for robust lifetime fitting, while bins with very small sample sizes are rare and have negligible influence on the overall regression. For each subregion, average TVCD and β2 per month-bin are calculated from successfully fitted bins. TVCDs can be grouped into intervals as described above, the mean TVCD of each interval is matched to the nearest month-bin and the corresponding β2 is used to calculate flux.
3.3 Anthropogenic NOx emissions separation
The DDA quantifies total NOx emissions, from which anthropogenic contributions to the total emission rates over a certain area need to be isolated by subtracting natural sources. Globally, anthropogenic emissions dominant, while natural sources, such as soil emissions, biomass burning, and lightning, account for approximately 30 %–40 % (Jaeglé et al., 2005; Müller and Stavrakou, 2005). Regional variation of natural sources contributions is substantial, with around 14 % in East Asia (Zhao and Wang, 2009), and 8 % in eastern China (Lin, 2012). Nevertheless, these estimates involve significant uncertainties (Ding et al., 2017; Rey-Pommier et al., 2022), including potential underestimation (Song et al., 2021). Previous studies typically designated regions dominated by anthropogenic emissions as mean NO2 TVCDs higher than 1.0 × 10¹⁵ molec. cm−2 (Li and Zheng, 2024; Liu et al., 2016a). However, due to the presence of unexpectedly high or poorly understood natural NOx emissions over this threshold (Kong et al., 2023; Song et al., 2021), it is not applied to filter natural sources in this study. Since natural NOx is primarily emitted during the summer and remains low in winter (Liu et al., 2016a; van der A et al., 2006), while anthropogenic NOx emissions typically peak in winter (Lonsdale and Sun, 2023), we identify natural-source grid cells based on seasonal criterion and further constrain them using NTL data. Grid cells with either the highest averaged NO2 TVCDs in summer or the lowest values in winter comparing to other seasons, and with NTL < 0.01 nW cm−2 sr−1, are classified as natural NOx sources and excluded from the areal integration to get anthropogenic NOx emission rates. For the remaining grid cells, we subtract soil and biomass burning emissions (from CAMS data) from the satellite-derived emissions to isolate anthropogenic contributions.
3.4 Uncertainty analysis
To quantify uncertainties, DDf is calculated as the mean directional derivative along the zonal/meridional () and diagonal directions () (Li et al., 2026) on a 0.05° × 0.05° grid:
Standard deviation of the difference between DDf and DDf is used to estimate random error σ of DDf:
The random errors at daily, monthly, and annual scales for 2019–2024 consistently decrease as the mean satellite data coverage (N) increases (Fig. 2). This observed scaling follows the theoretical relationship (black line in Fig. 2), in agreement with the central limit theorem for independent random errors. Here, σ0 reflects the precision of a single satellite overpass, calculated at the monthly scale as:
where σi and Ni denote the random error and mean satellite coverage for month i, respectively. The results further demonstrate that temporal averaging effectively reduces random errors in emission quantification.
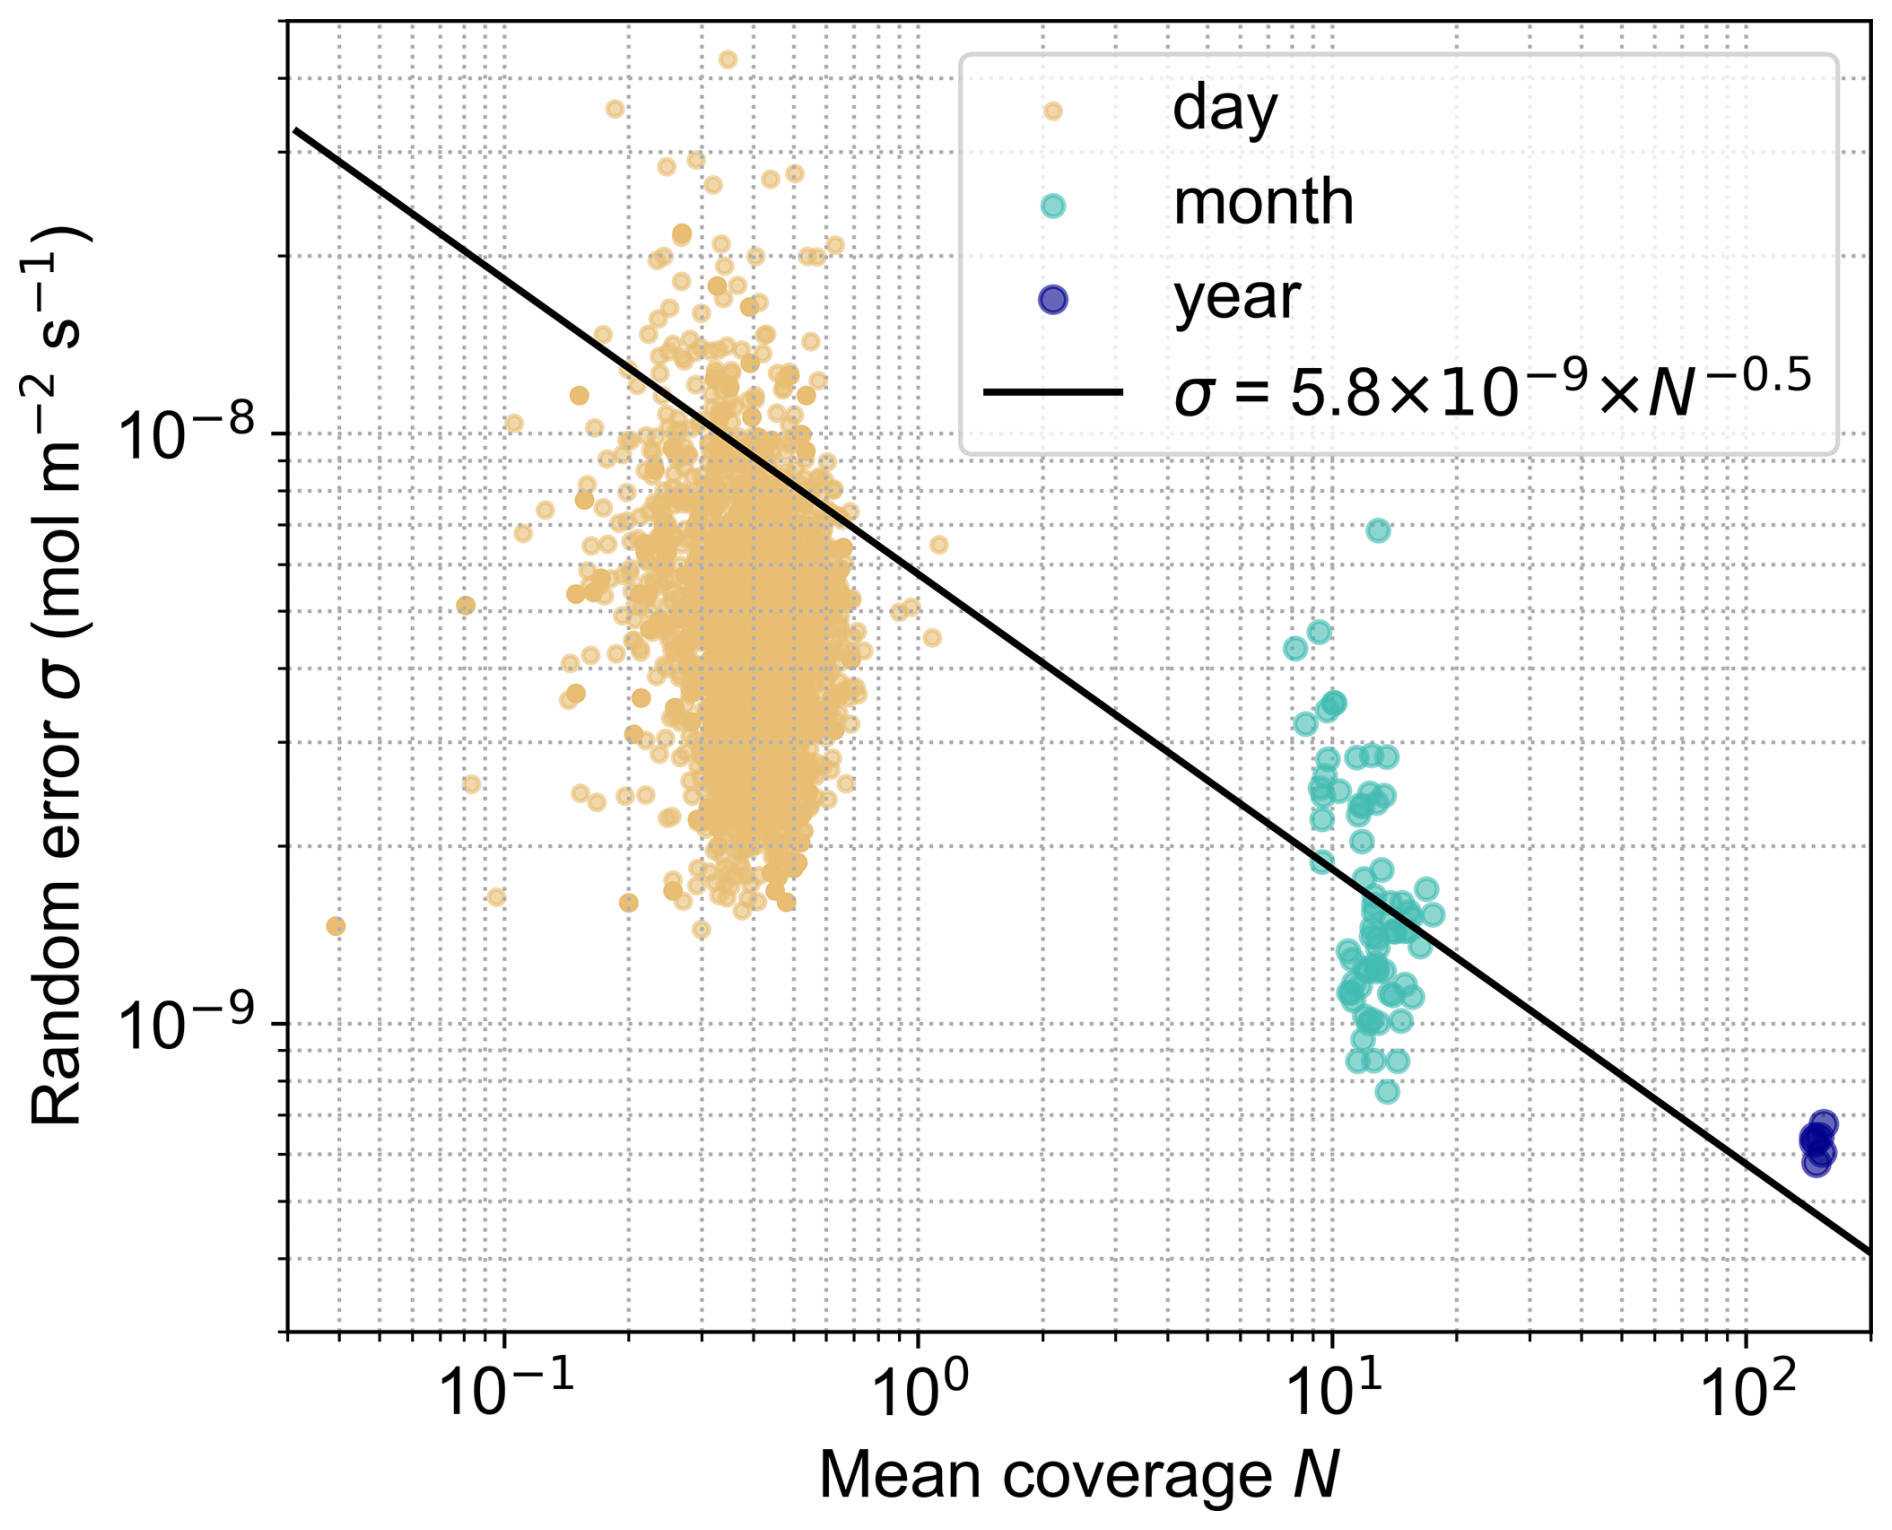
Figure 2The relationship between the random error (σ) and mean satellite data coverage (N) at different time scales.
Since the topography correction and chemical loss terms in Eq. (2) are determined through fitting, only the overall Root Mean Square Error (RMSE) can be evaluated, rather than grid-level precision. Therefore, the random error of DDf is employed to characterize the uncertainties in DDA emission estimation, encompassing both satellite retrieval noise and the random error arising from the DDf estimator.
4.1 Effects of NO ratio correction and lifetime fitting
To illustrate the developments in this study, Fig. 3 compares three DDA-based results before and after applying the NO ratio correction and improved fitting scheme: (1) a constant NO ratio of 1.32 and monthly single-lifetime fitting (fixed_f and single_τ), corresponding to the original DDA framework by Sun (2022); (2) the variable NO ratio and monthly single-lifetime fitting (variable_f and single_τ), based on the modification by Ayazpour et al. (2025) and marking the first application of GEOS-CF chemical data in satellite-based emission estimation; (3) a combination of the variable NO ratio and piecewise fitting with nonlinear NOx lifetime for each month (variable_f and nonlinear_τ), while the latter represents the major improvement in this study. Using a variable NO ratio better captures strong NOx gradients near point sources, improving the accuracy of point source emission estimates. However, this approach still leads to notable underestimation of regional emissions. The nonlinear lifetime fitting more effectively accounts for the balance among local emissions, horizontal transport, and chemical loss, reducing negative emission grids and increasing regional emission estimates. Consequently, the improved fitting scheme minimizes artifacts in mountainous and remote regions compared to earlier results (Ayazpour et al., 2025; Beirle et al., 2023; Lonsdale and Sun, 2023; Sun, 2022).
4.2 NOx lifetime
The lifetime of NOx is known as a complicated function of NOx chemistry regimes (Laughner and Cohen, 2019). At very low NOx concentration, NOx lifetime increases with NOx concentration. As NOx concentration rises, the lifetime decreases because increased NO enhances the chain reactions involving organic compounds (RH) and HOx (HOx= OH + HO2+ RO2), accelerating RH oxidation to produce O3 (“NOx-limited” regime) and further oxidizing NO. At high NOx concentration, as NOx reaches saturation, the reaction between OH and NO2 becomes much faster than the reaction between OH and RH, dominating the fate of HOx and slowing O3 production (“NOx-suppressed” regime), resulting in the opposite trend in NOx lifetime (Laughner and Cohen, 2019; Pusede et al., 2015).
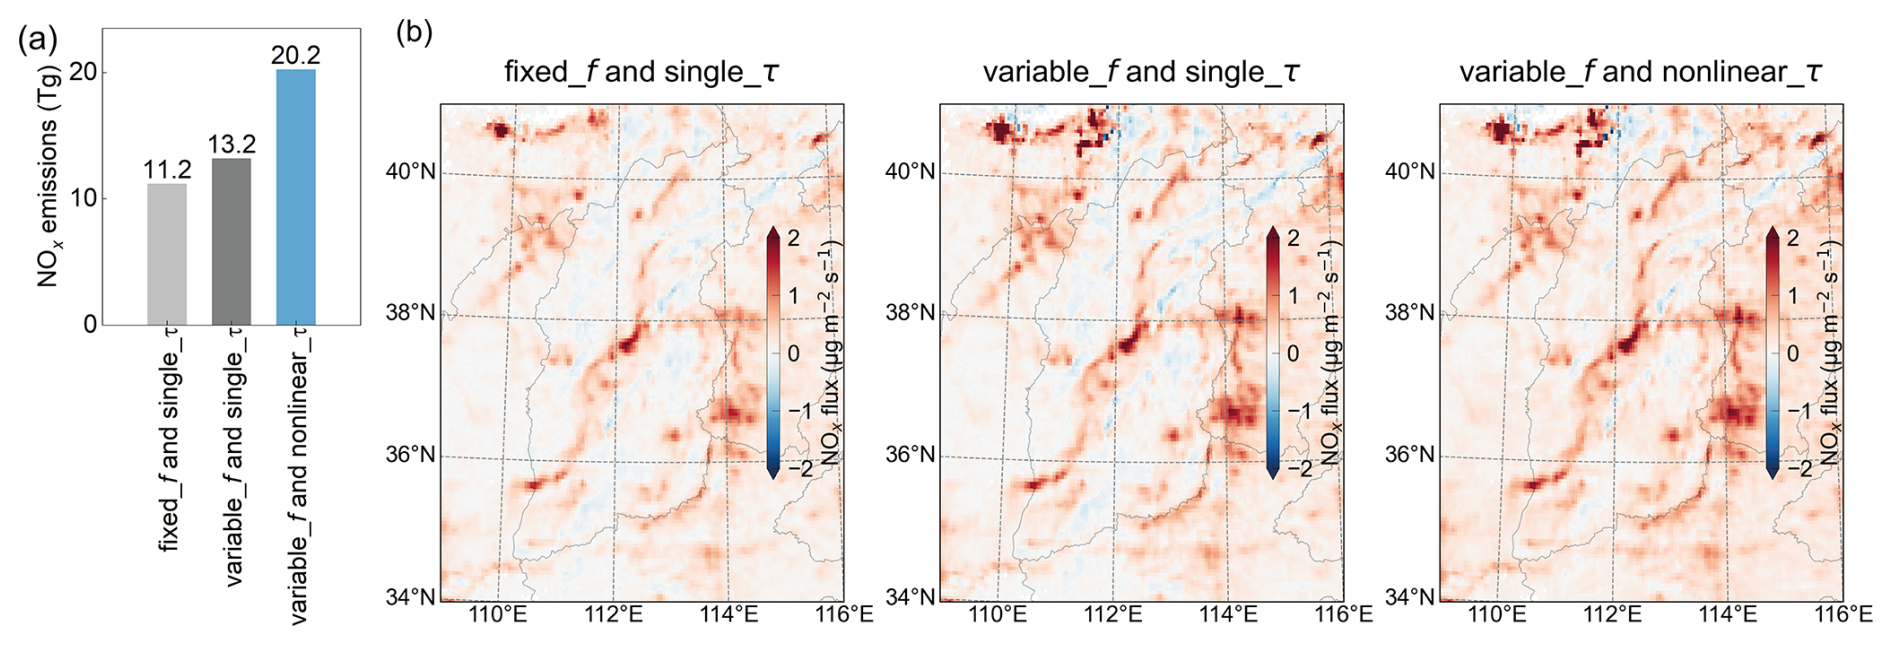
Figure 3Comparison of three DDA-based results, including (a) anthropogenic NOx emissions estimates in China for 2019 and (b) spatial distribution in Shanxi province for 2019, shown as an example of complex topography.
Figure 4 shows the monthly climatology of NOx lifetimes from the improved fitting scheme described in Sect. 3.2. For each subregion and each climatological month, the fitted lifetime is shown as bubbles corresponding to bins of NO2 TVCD. The size of bubbles scales with the mean NO2 TVCD for the bin. The results clearly demonstrate the nonlinear variability of NOx lifetime as a function of TVCDs and show significant discrepancies between subregions. The results closely match the theoretical calculated NOx lifetime versus NOx concentrations under different VOC reactivities by Laughner and Cohen (2019), capturing the turning points marked by an increase in lifetime at low NOx concentrations (region I), the subsequent decrease with rising NOx (region II), and the eventual increase under NOx-saturated conditions (region III). The range of lifetimes vary from 0.71–26.47 h, and the average values across the subregions range from 3.17–7.85 h. Due to fitting failures in July–August, the number of bins in WN is substantially reduced, requiring broad bin merging and resulting in lifetimes that are likely overestimated and unrepresentative. The results are consistent with the 2–8 h range reported by Lange et al. (2022) as well as the 2 h (low NO2) to over 7 h (high NO2) given by Laughner and Cohen (2019).
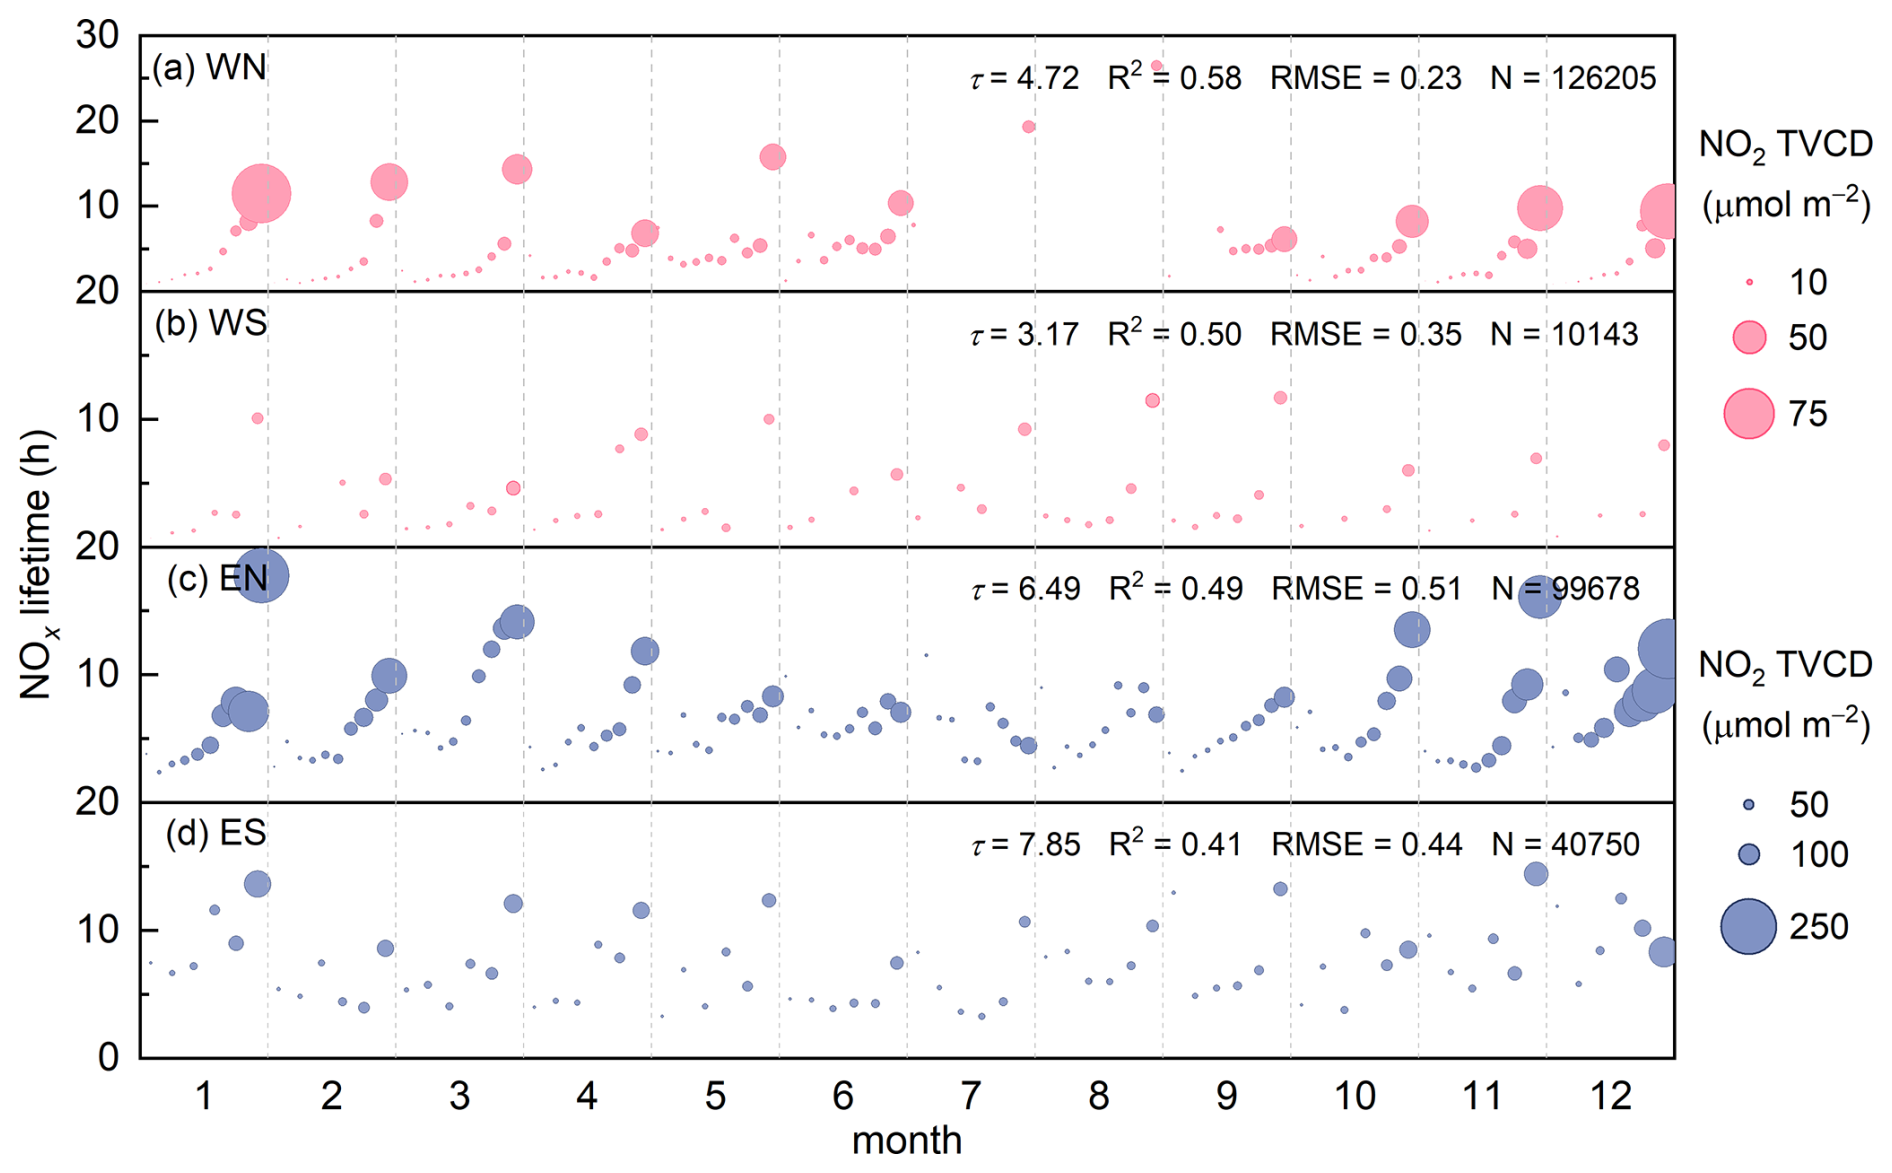
Figure 4Monthly NOx lifetimes for (a) WN, (b) WS, (c) EN, and (d) ES. The bubble size indicates monthly mean NO2 TVCD (µmol m−2) per bin. The τ (h), R2 (coefficient of determination), and RMSE (root mean square error, nmol m−2 s−1) for each subregion represent the month-bin averages. N denotes the count of fitting grids across all months.
The consistent lifetime patterns highlight the dominant role of NOx concentration in determining τ. However, even at comparable NOx levels and over the same periods, τ exhibits subregional variations driven by distinct ambient conditions (e.g., O3 and VOCs concentrations, meteorological parameters) and differences in NOx emission sources. WN is located in the northern China, sees increased NOx emissions during the colder half of the year due to heating demand. WS is situated on the sparsely populated Tibetan Plateau, has primarily natural NOx sources, including unexpectedly high NO emissions from lakes (Kong et al., 2023). EN exhibits distinct anthropogenic emissions, with higher NOx and longer τ in winter due to heating, and lower NOx in summer, where intense photochemical reactions result in a shorter τ. ES is located in southern China with smaller annual temperature variations, shows less pronounced seasonal discrepancies in τ. Additionally, high natural VOCs emissions during the growing season of vegetables (Cao et al., 2022) in ES contribute to a longer τ (Laughner and Cohen, 2019).
We provide detailed comparisons of the lifetime fitting parameters for the three DDA-based approaches in Table S1 in the Supplement. The variable NO ratio correction improves the accuracy of source divergence and emission estimates, while the piecewise fitting approach captures nonlinear NOx chemistry and yields a shorter overall lifetime with lower fitting RMSE. Across the four subregions, NOx lifetimes without ratio correction and fitting scheme improvement are approximately 2 to 3 times those derived in this study, specifically 1.7 times in ES, 2.8–2.9 times in EN and WN, and 3.3 times in WS (figure omitted), although the values primarily represent the mean state associated with the nonlinear characterization of lifetime. These results highlight the great importance of accounting for the variable NO ratio and nonlinear NOx lifetime, particularly in clean and heavily polluted regions, while the influence is comparatively less pronounced in moderately polluted areas.
In addition, the scale height () fitting results for each subregion are presented in Fig. S1. Scale height shows clear seasonal and regional variability, generally higher in the cleaner and more remote regions (WN and WS) than in the more polluted regions (EN and ES). Its variability is primarily controlled by boundary layer mixing, as X links surface concentration to column density, reflecting the effective vertical mixing depth (Lonsdale and Sun, 2023; Sun, 2022).
4.3 Regional NOx emissions
4.3.1 Comparison with inventories
The spatial distribution of national anthropogenic NOx emissions based on DDA in China for 2019 is shown in Fig. 5a, with the corresponding total emissions provided in Fig. S2. The identified hotspots align closely with areas of intensive human activity, covering both urban and rural regions as well as transportation routes. Traces of faint anthropogenic emissions remain clearly visible even in the remote, sparsely populated Northwest China (Fig. S3).
The derived anthropogenic emissions of China from 2019 to 2024 are compared with: (1) two bottom-up emission inventories (MEIC and EDGAR), and (2) two top-down datasets, the Inversed Emission Inventory for Chinese Air Quality (CAQIEI) (Kong et al., 2024) and results from Li and Zheng (2024). CAQIEI assimilates surface observations using an ensemble Kalman filter (EnKF) and the Nested Air Quality Prediction Modeling System, while the results provided by Li and Zheng (2024) are based on TROPOMI NO2 combined with GEOS-Chem. Note that these datasets are only available in limited years, while DDA covers all years. National scale comparisons show that DDA agrees well with other inventories and produces slightly lower estimates (Fig. 5b). Based on DDA calculations, the anthropogenic NOx emissions of China are estimated to be 20.2, 18.5, 19.4, 18.9, 20.7 and 18.8 Tg from 2019 to 2024, with uncertainties of 27 %–30 %. The corresponding total emissions are 29.8, 28.8, 28.7, 28.2, 28.7 and 27.4 Tg, respectively, with uncertainties of 29 %–32 %. These results indicate fluctuating trends in anthropogenic NOx emissions: a sharp decline in 2020 due to the COVID-19 lockdowns (Lonsdale and Sun, 2023; Miyazaki et al., 2021; Cooper et al., 2022), a modest rebound in 2021–2022, a peak in 2023 (surpassing 2019 levels despite total NOx remaining lower), and a subsequent drop in 2024 to 7.1 % below 2019 levels. The differences between DDA and EDGAR, MEIC, CAQIEI and Li and Zheng are −8.7 % to 0.8 %, −6.3 % to −3.4 %, −7.2 % to −4.5 %, and −11.8 % to −3.8 %, respectively. Notably, the DDA approach provides long-term emission estimates with low latency, demonstrating a key advantage of this satellite-based lightweight estimation method over conventional bottom-up inventories and computationally intensive top-down data assimilation systems.
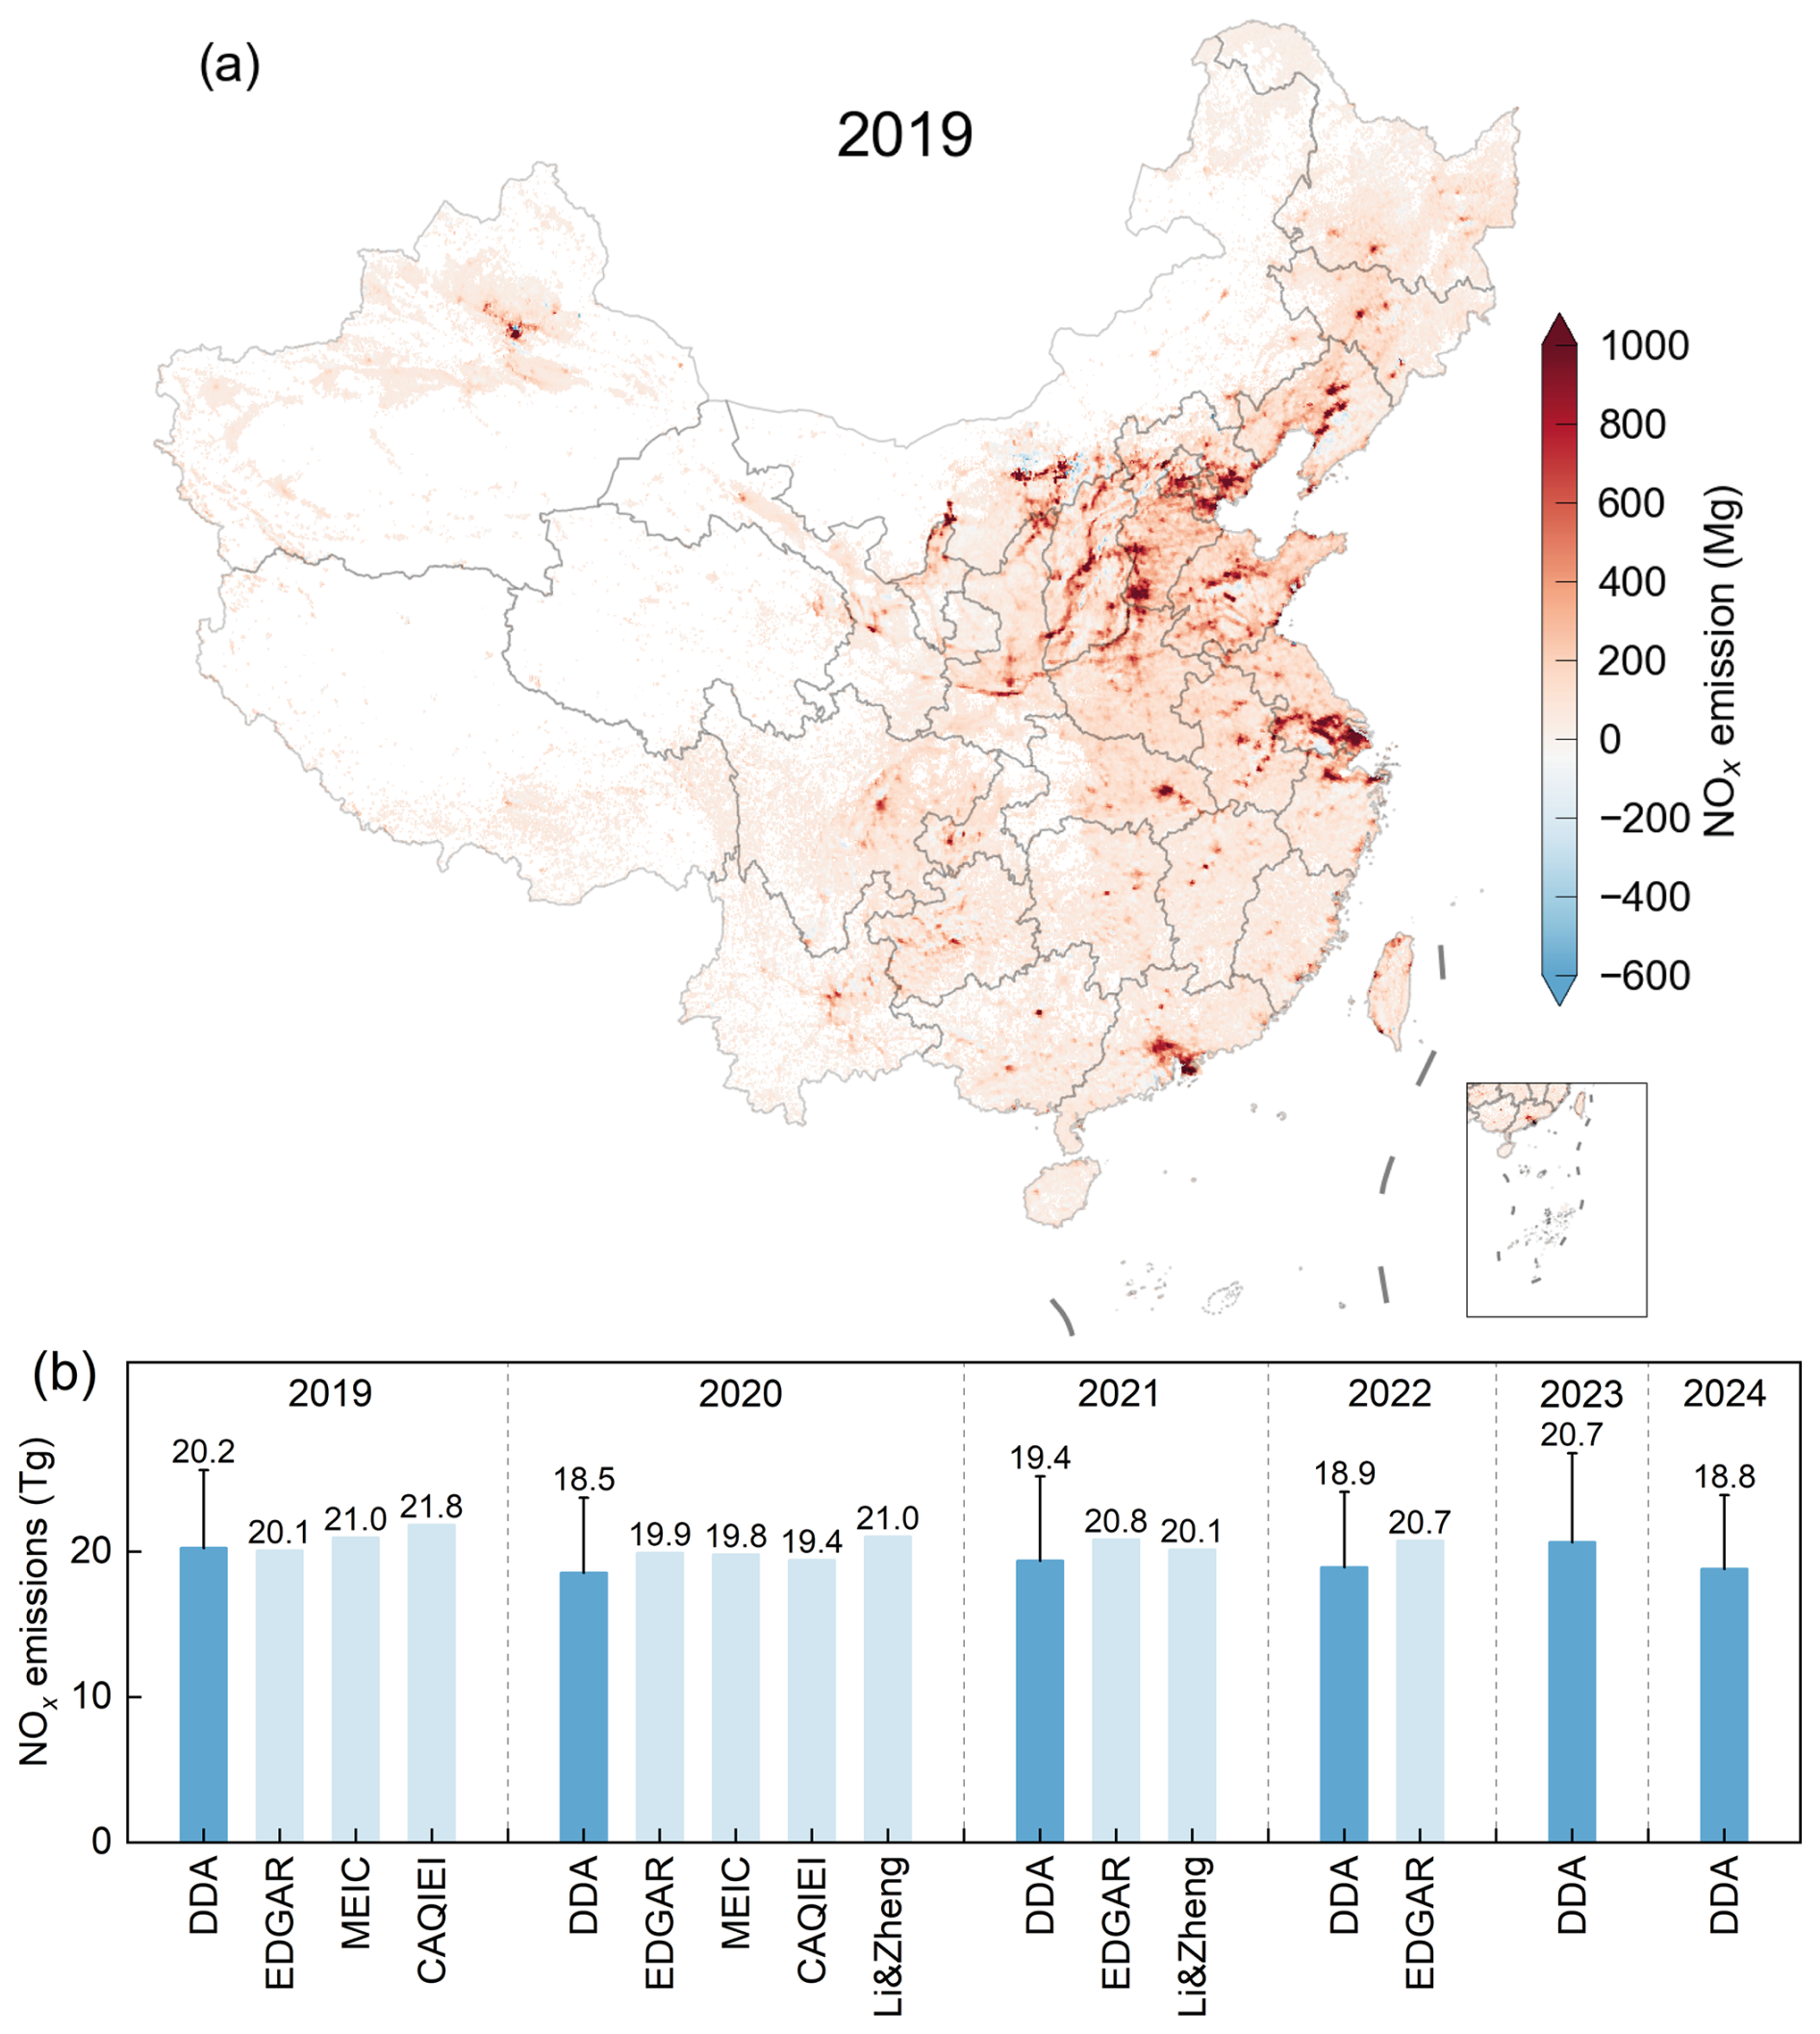
Figure 5National anthropogenic NOx emissions of China for (a) spatial distribution at 0.05° × 0.05°, with 2019 as an example, and (b) comparisons with previous inventories from 2019–2024.
The primary cause of the lower estimates is the systematic low bias in TROPOMI NO2 column amounts (Beirle et al., 2023; Liu et al., 2024), most likely due to a priori assumptions and a tropospheric negative bias of approximately 30 % from ground-based validation (van Geffen et al., 2022). Meanwhile, we attribute a larger proportion of total emissions to natural sources compared to the latter two top-down methods, varying between 28.1 %–35.6 %, with an average of 32.1 % (Fig. S4). CAQIEI assigned soil and biomass burning NOx from CAMS and GFAS as natural sources (approximately 2.0 Tg) and subtracts them from the total NOx estimates (23.8 Tg in 2019 and 21.4 Tg in 2020, relative to 29.8 and 28.8 Tg in DDA). While Li and Zheng (2024) designated regions dominated by natural emissions as grids with mean NO2 TVCDs less than 1.0 × 10¹⁵ molec. cm−2, this threshold is not applied in this study, as described in Sect. 3.3. Based on satellite observations, Kong et al. (2023) found unexpectedly high NO emissions from remote lakes on the Tibetan Plateau, with per-unit-area emissions exceeding those from crop fields in summer. Lin et al. (2024) highlighted a severe underestimation of soil NOx in the current CAMS inventory, while Opacka et al. (2025) also identified underestimated soil and lightning NOx. Using natural nitrogen isotopes in precipitation to trace atmospheric NOx sources, Song et al. (2021) showed that the relative contributions of natural NOx average 57 ± 13 % in East Asia, a value that had long been underestimated. In this work, we identify natural sources based on seasonal emission patterns and constrain them with NTL data. From 2019 to 2023, the number of grid cells indicative of human activity increased by 48.6 % (Fig. S5). As a result, anthropogenic NOx emissions in 2023 are 0.5 Tg higher than in 2019, despite total NOx in 2023 being 1.1 Tg lower.
Table S2 shows NOx emissions from sensitivity tests of the anthropogenic NOx filter threshold, and Fig. S6 presents the probability density function (PDF) of NTL to support the selection of the NTL threshold. The results indicate that without applying the NTL constraint, anthropogenic NOx emissions would be underestimated. The differences among results obtained with different NTL thresholds are relatively small (−4.9 % to 3.6 %). Under the selected threshold of 0.01 nW cm−2 sr−1, more than 90 % of NTL grids are identified as anthropogenic sources, and this threshold also helps minimize the resampling effect from 500 m to 0.05° in dark regions. Overall, the small differences among different thresholds and the good agreement with other datasets demonstrate the robustness of the anthropogenic NOx source filtering approach used in this study. Although separating anthropogenic and natural sources in dimly lit grids remains challenging, it is clear that natural emissions in China are indeed underestimated, as noted by Song et al. (2021) and isolating these contributions from total emissions continues to require further work.
For subnational scale (Fig. 6a, b), DDA shows excellent agreement with inventories in the Central, North, and Southwest regions; slightly higher values in the Northeast and Northwest; somewhat lower values in the South; and significantly lower values in East China during 2019–2020. The results also demonstrate a stronger consistency between DDA and MEIC (The Pearson correlation coefficient (r) ranges from 0.86–0.87) compared to EDGAR (r 0.76–0.79). MEIC uses high-resolution localized data, while EDGAR relies on coarser global datasets, resulting in discrepancies in spatial allocation accuracy for China (Crippa et al., 2024; Liu et al., 2016b). Given the good agreement of DDA with inventories in 2019–2021 (Fig. 5b), the discrepancy with EDGAR in 2022 does not undermine the reliability of the estimates in this work, despite the current lack of inventories for comparison.
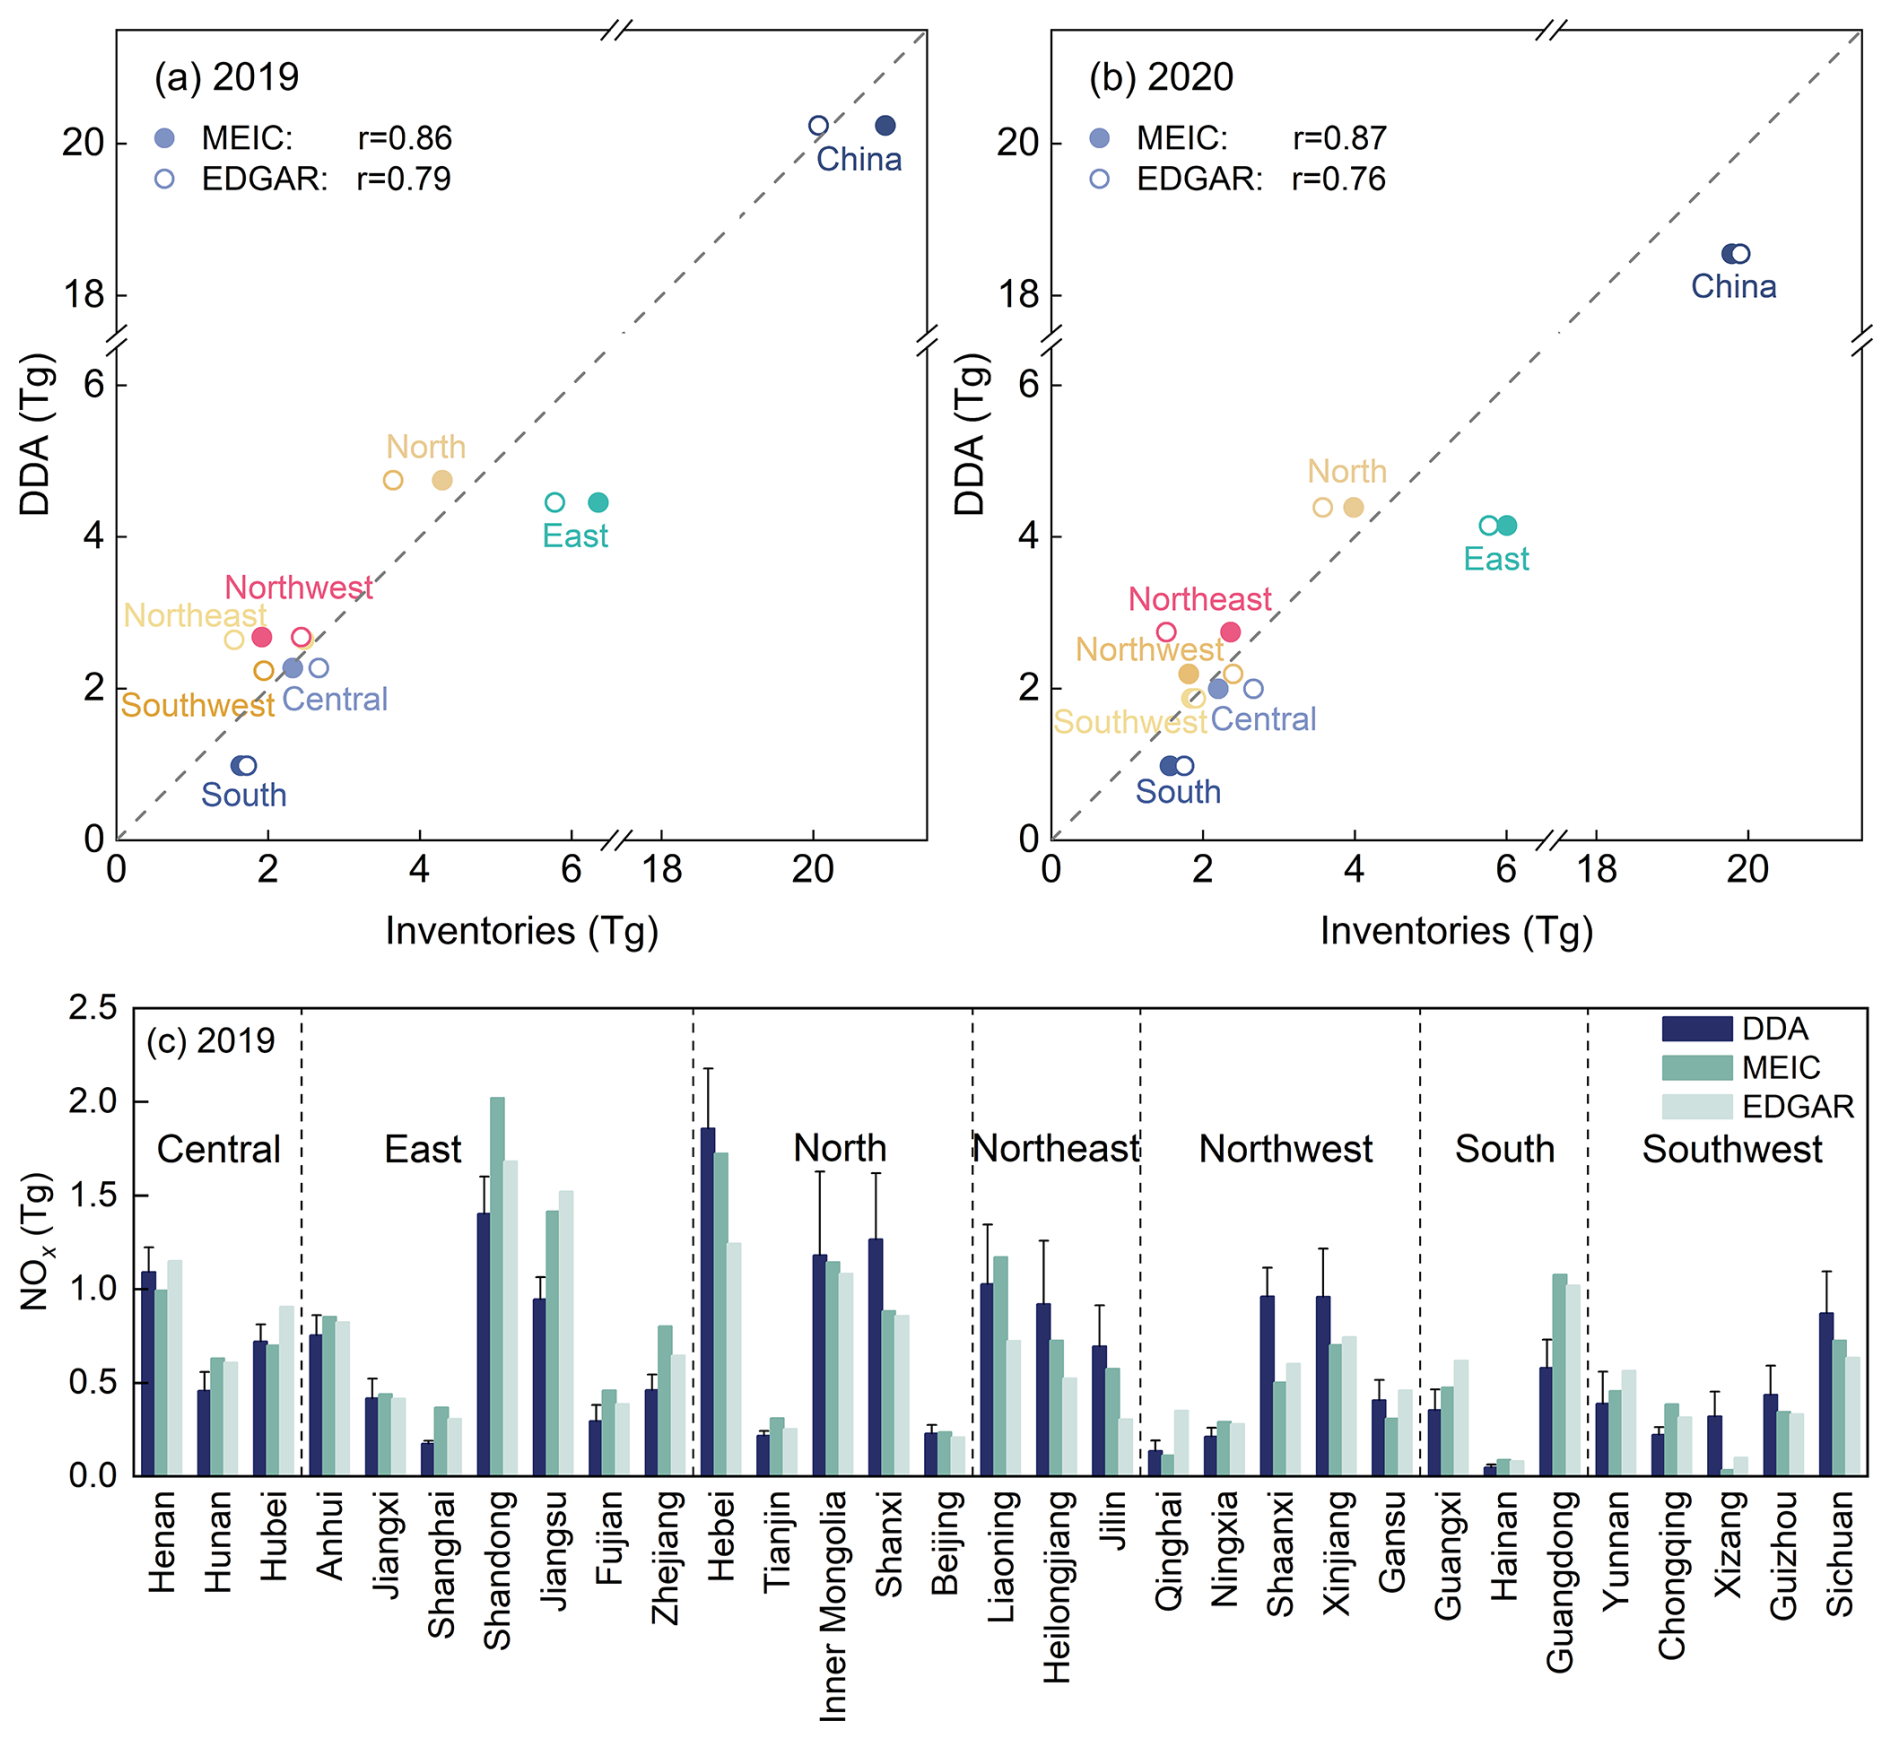
Figure 6Comparisons of anthropogenic NOx emissions between DDA, MEIC and EDGAR for (a) national and subnational scales in 2019, and (b) same as (a) but in 2020, (c) provincial scale in 2019.
At the provincial scale (Fig. 6c), NOx emissions derived from DDA align well with bottom-up inventories, with about 80 % of provinces falling within ±60 % of MEIC and EDGAR. DDA shows consistently lower emissions in economically developed provinces (mostly in East and South China) and higher in less developed western provinces. The significant difference in Xizang's emissions arises from DDA identifying substantially more human activity than reported in inventories.
4.3.2 Differentiated patterns in provincial NOx emissions changes
The anthropogenic NOx emissions map reveals a significant decline in urban areas, particularly in heavily pollutant regions, from 2019 to 2024 (Fig. 7a). However, certain localized areas or point sources, particularly those in the Northeast, Northwest, and South, exhibit noticeable increases. At provincial scale (Fig. 7b), NOx emissions increase by less than 10 % in Gansu, Hunan, and Inner Mongolia; by 10 %–30 % in Chongqing, Guangxi, Qinghai, Yunnan, and Xinjiang; and by more than 50 % in Xizang. At the subnational scale (Fig. 7c), which aggregates total emissions from provincial groups, NOx emissions decline by more than 10 % in the North and East, and by less than 10 % in the Northeast, Central, and South, while slight increases under 10 % are observed in the Southwest and Northwest. Year-on-year changes in anthropogenic emissions from 2020 to 2024 are shown in Fig. S7. In other words, NOx emissions at the provincial scale display a differentiated temporal pattern, with declines in the central and eastern regions but increases in the west.
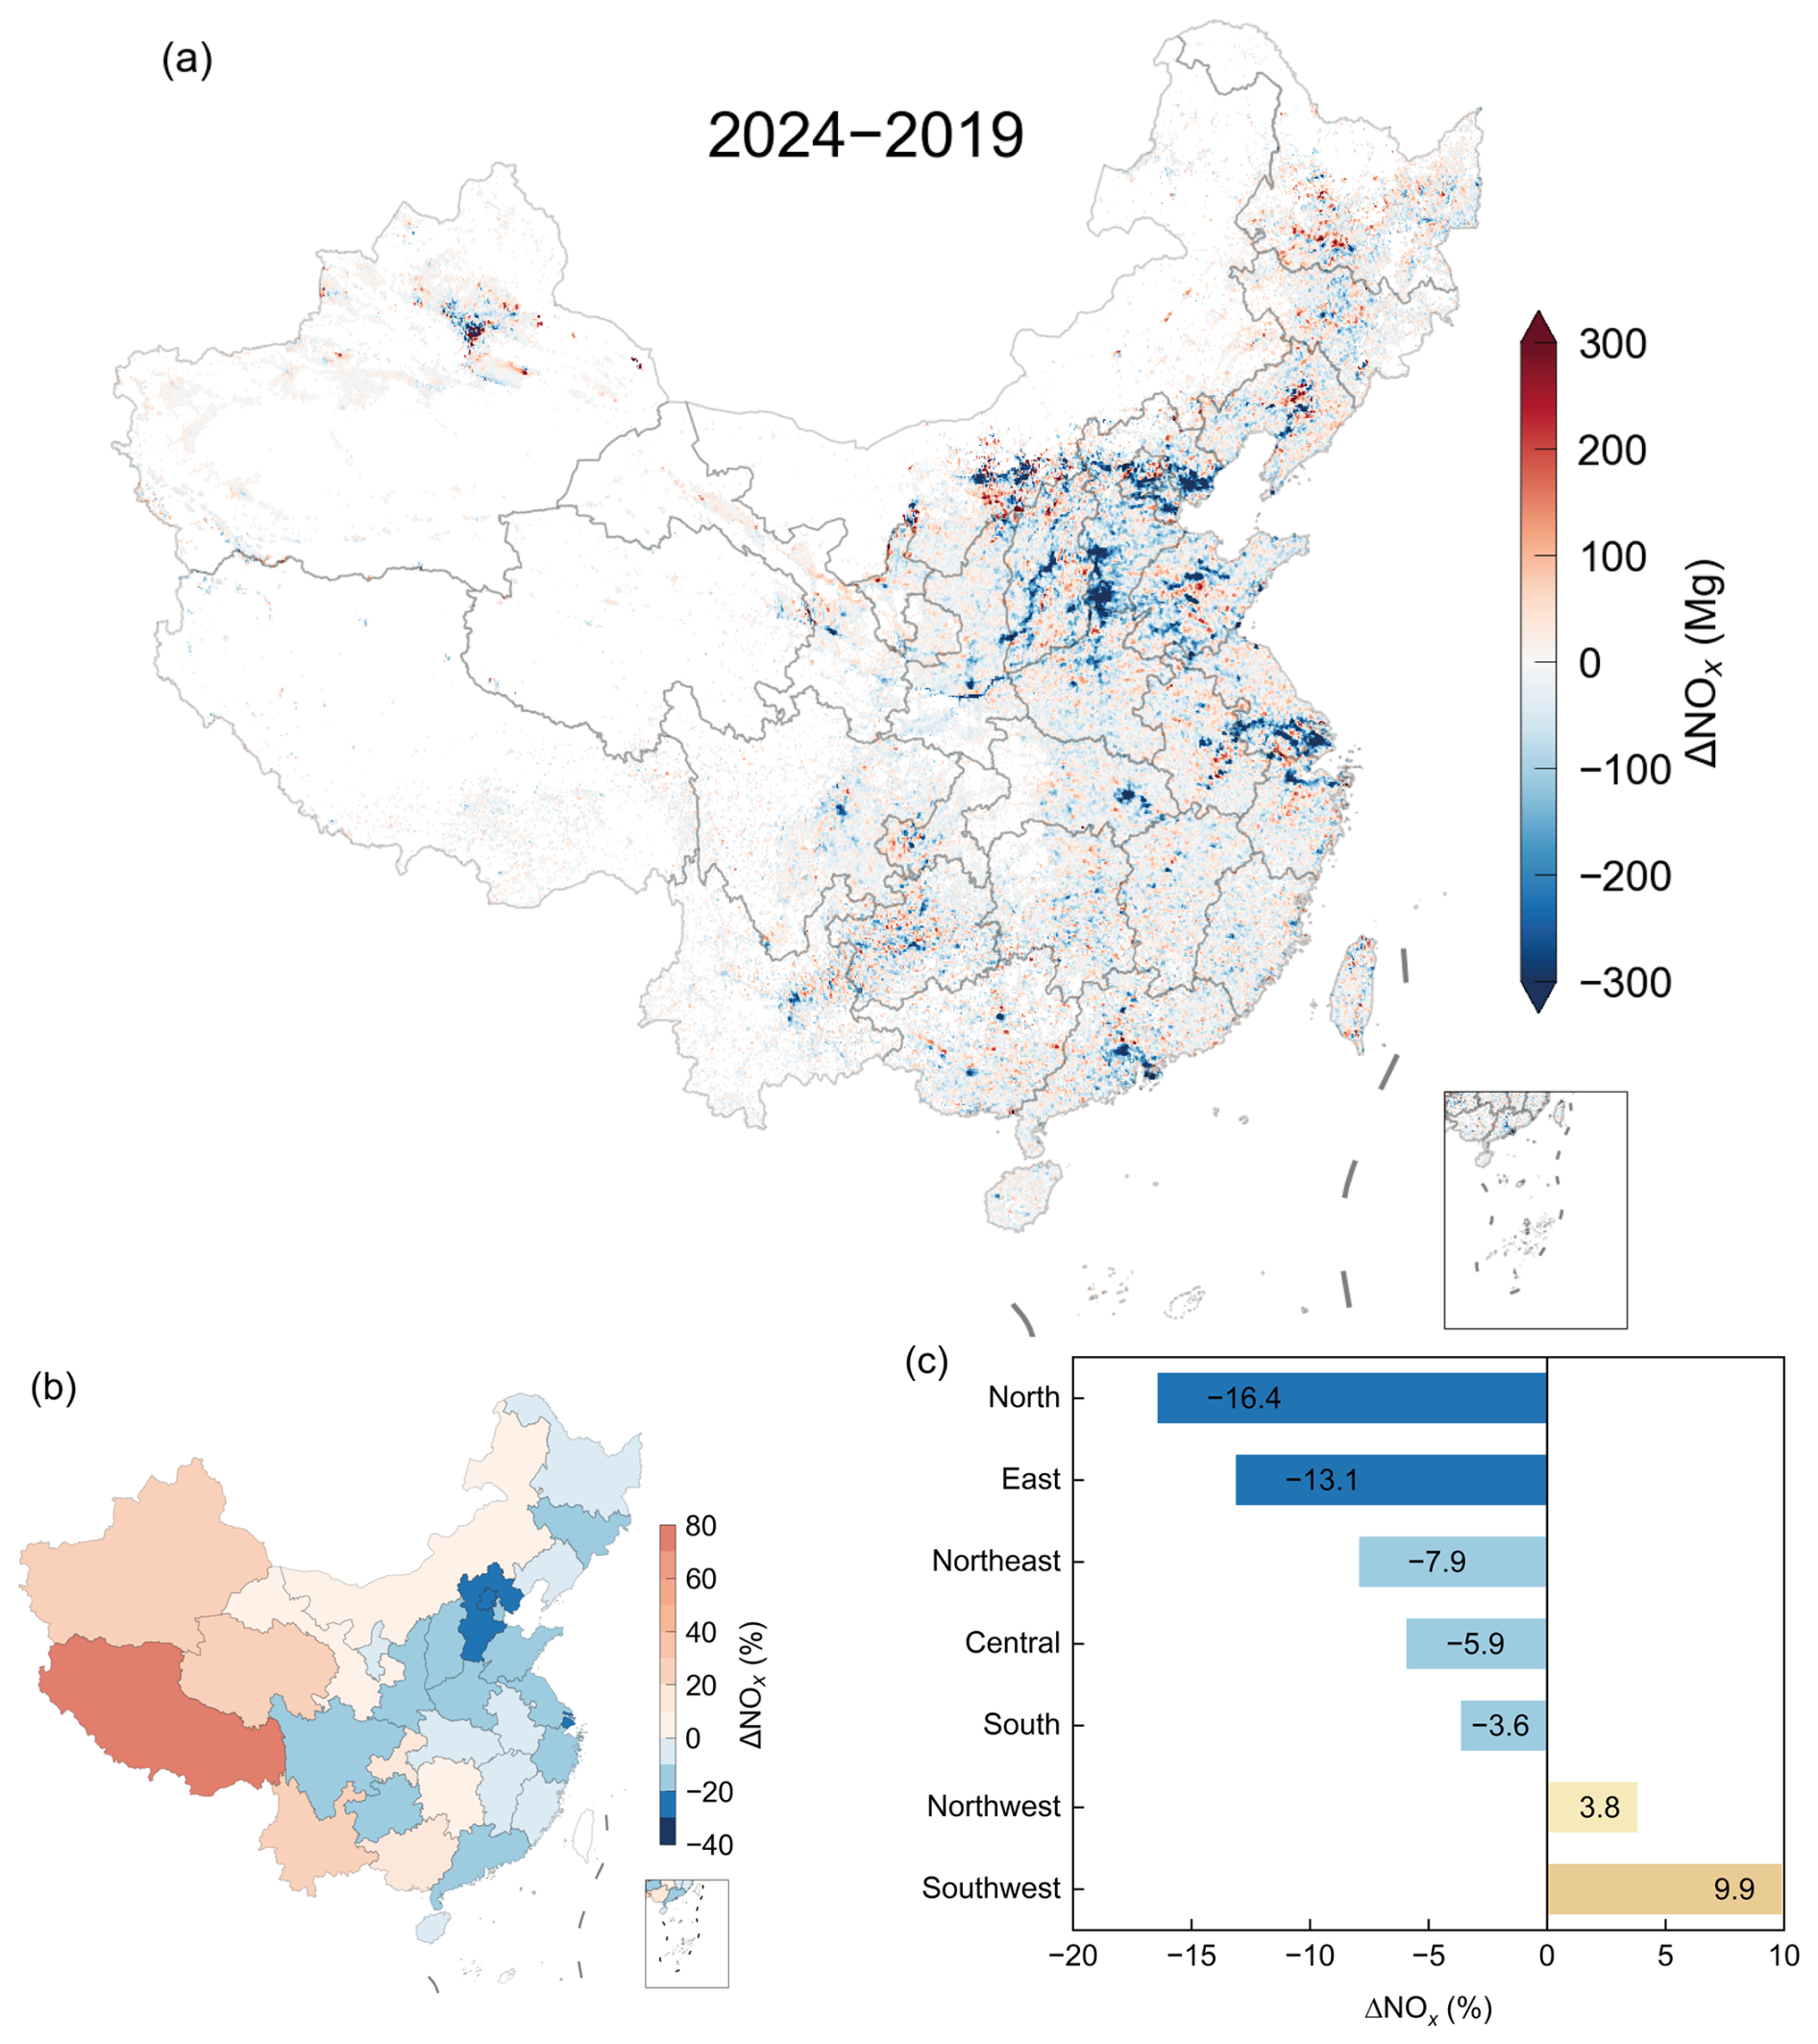
Figure 7Changes in anthropogenic NOx emissions from 2019 to 2024, (a) grid scale at 0.05° × 0.05°, (b) provincial scale, and (c) subnational scale.
Air pollutant emissions evolve in response to urbanization and macroeconomic development, which influence policy regulations and industrial restructuring, forming a feedback loop that further shapes economic growth at both national and city scales (Miyazaki and Bowman, 2023; Wang et al., 2019). Anthropogenic NOx emissions constrained by nighttime lights reflect the extent of human activity, and their share of total NOx emissions can serve as a useful indicator of regional urbanization (Wang et al., 2021). Figure 8 presents the relationships among provincial NOx emission changes, their contributions to total NOx and GRP. Provincial positive changes in anthropogenic NOx emissions often coincide with increases in their share of total NOx (Fig. 8a), particularly in economically less developed regions with relatively low GRP, where anthropogenic sources constitute a small to moderate portion of total NOx (Fig. 8b) and NO2 TVCDs are generally low (Fig. S8). In the early stages of economic development, a resource-intensive model driven by fuel consumption dominates, with GRP growth accompanied by rising NOx emissions at the expense of environmental quality. As the economy progresses, shifts in industry sectors and air quality mitigation measures contribute to a decline in NOx emissions, with regional economic levels potentially playing a key role in driving these changes (Miyazaki and Bowman, 2023; Wang et al., 2019). The disparities in industrial structure and economic development levels across regions may account for the current differentiated patterns in provincial NOx emissions.
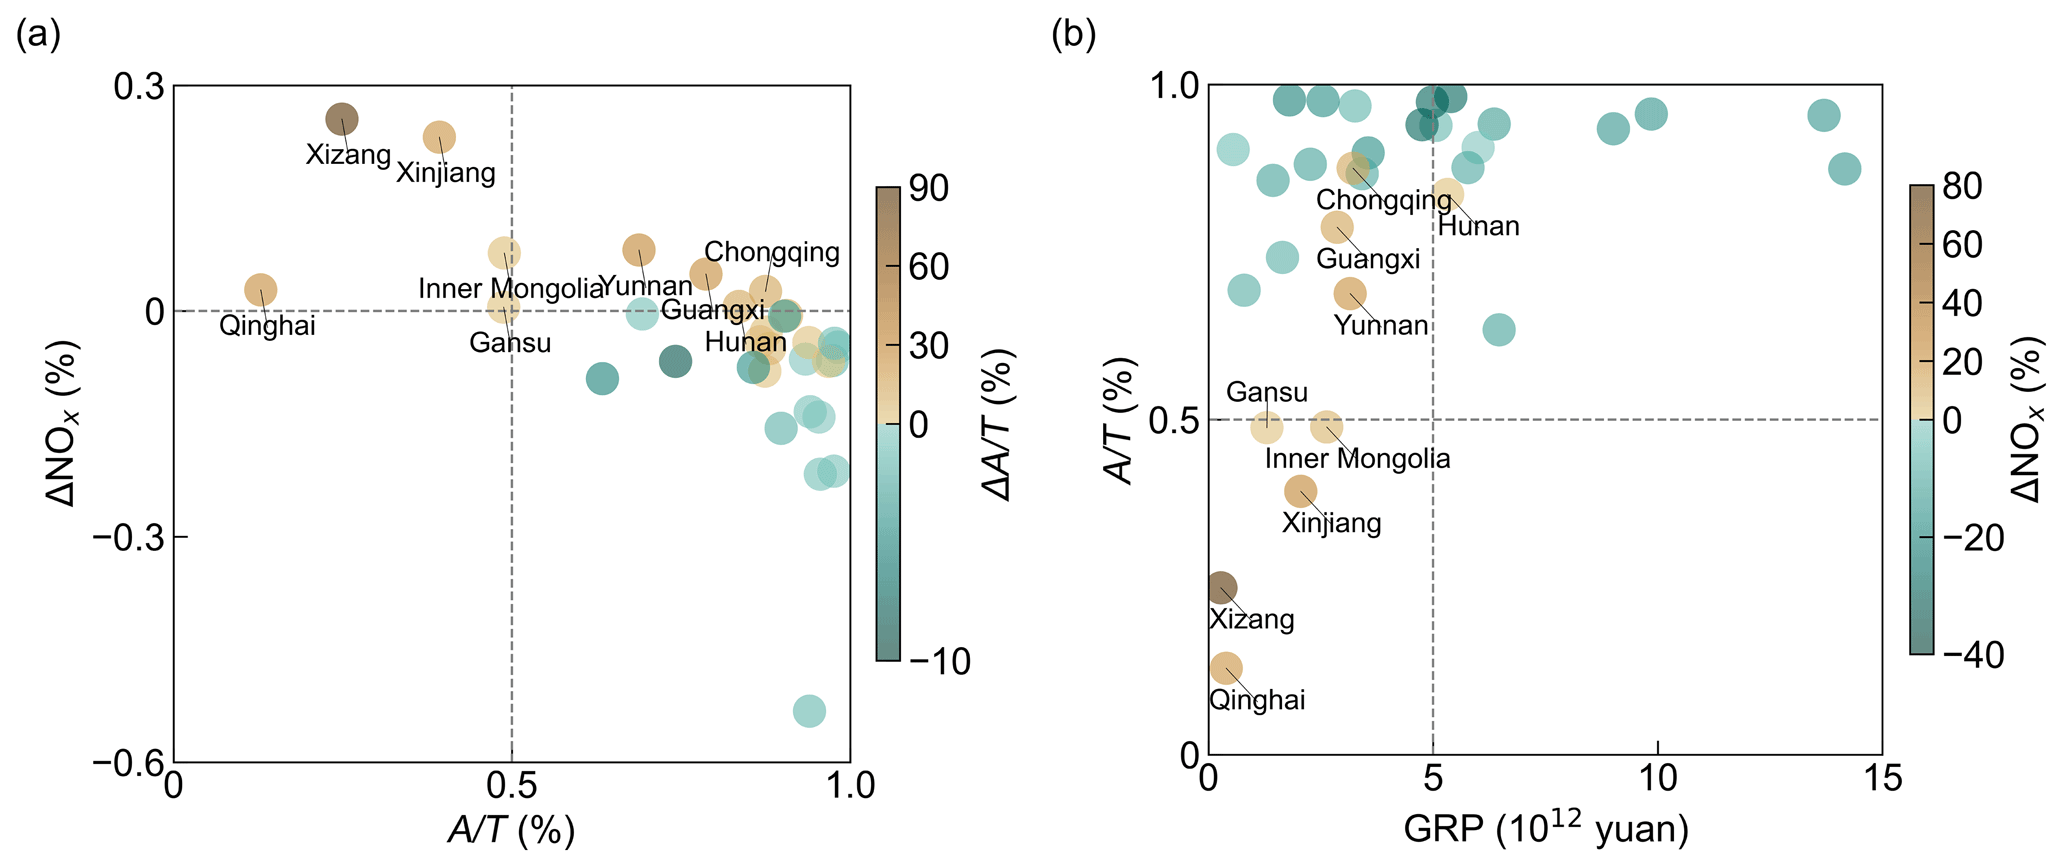
Figure 8(a) Provincial changes in anthropogenic NOx emissions from 2019 to 2024 (ΔNOx) and their contributions to total NOx in 2024 (), with bubble color indicating changes in the proportion (), provinces with positive ΔNOx are labeled; (b) Same as (a), but showing the relationship between and GRP in 2024, with bubble color indicating ΔNOx.
4.3.3 Consistent downward trend in NOx emissions across megacities
Six megacities of China with GDP rankings in the top ten and populations exceeding ten million are selected to present the time series of monthly NOx emissions and changes (Fig. 9). Values in the bottom right corner represent the percentage of months with negative relative changes. The results are in good agreement with the decreased NOx during the strict COVID-19 lockdowns (e.g., February–May 2020 in Wuhan, February–May 2022 in Shanghai) (Miyazaki et al., 2021; Cooper et al., 2022), and the increase during major holidays (e.g., Spring Festival in January–February, summer holiday in July–August, National Day holiday in October). Seasonal variability of NOx emissions in megacities is influenced by meteorological conditions. Heating demand leads to markedly higher emissions in autumn and winter than in spring and summer (Miyazaki et al., 2021), with more pronounced variability in northern cities such as Beijing. In contrast, emission fluctuations associated with rising electricity demand during hot seasons (Lange et al., 2022) are more pronounced in the five southern cities. Meanwhile, as China's clean air actions progress, megacities exhibit a consistent downward trend in NOx emissions, with the proportion of negative changes higher than positive. Shanghai and Beijing have relatively high emissions, but they show a greater share of months with declines from 2020–2024 compared to 2019, reflecting stronger efforts in emission reduction.
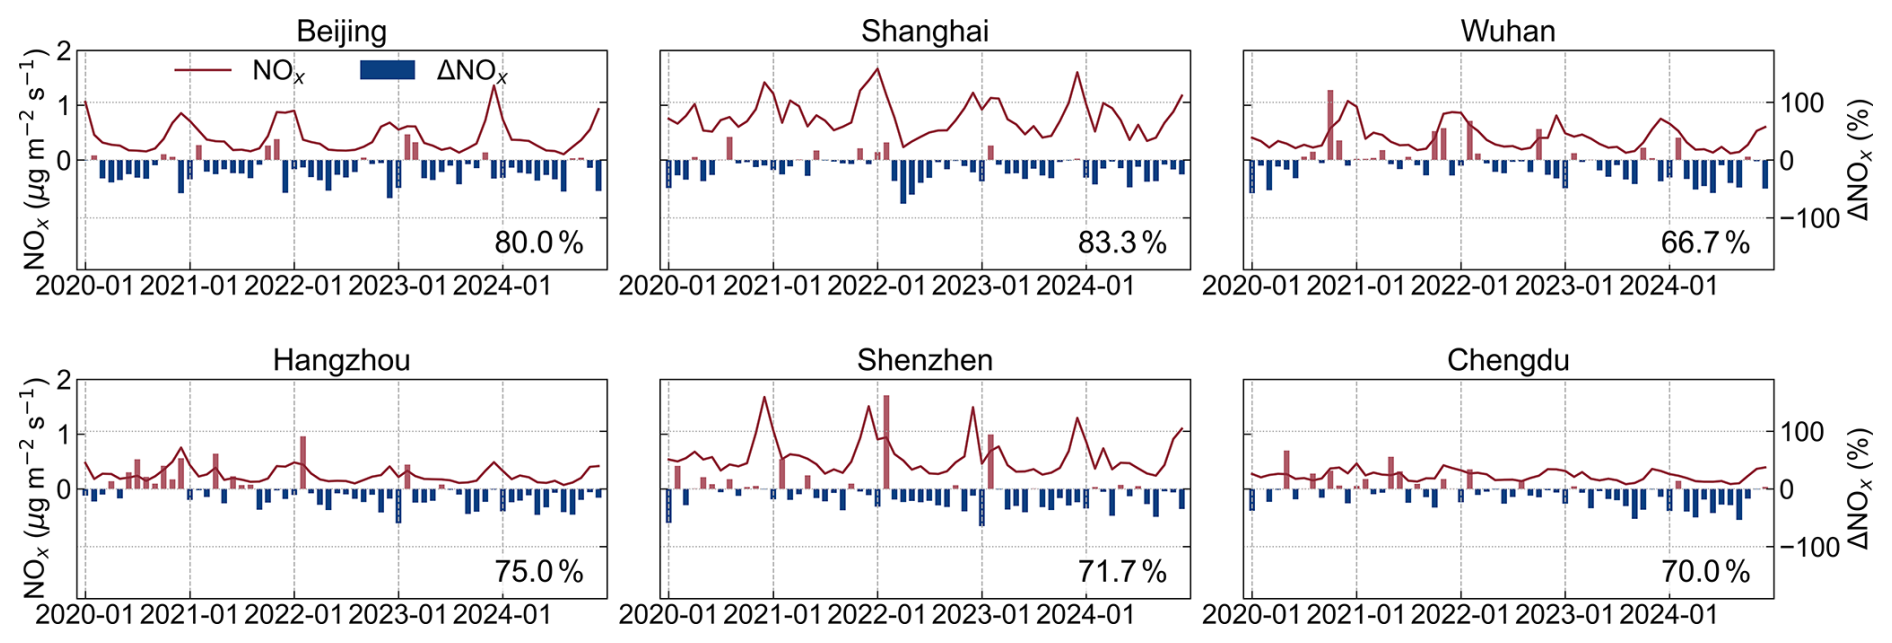
Figure 9Monthly NOx emissions for 2020–2024 and relative changes from 2019 in China's megacities, with Beijing, Shanghai, Wuhan, Hangzhou, Shenzhen and Chengdu as examples.
4.4 Point source emissions
Point source emissions in DDA (from power plants in this study) are quantified by integrating over a 15 km radius, following the approach and locations of 124 power plants reported by Beirle et al. (2023). Figure 10a presents the estimated NOx emissions from these plants in China for 2019. From 2019 to 2024, emissions from the 124 plants range from 0.02–2.13 kg s−1, with uncertainties between 4 %–78 %, averaging 16 %. Overall, the plants show an average emission decline of 23 % over this period.
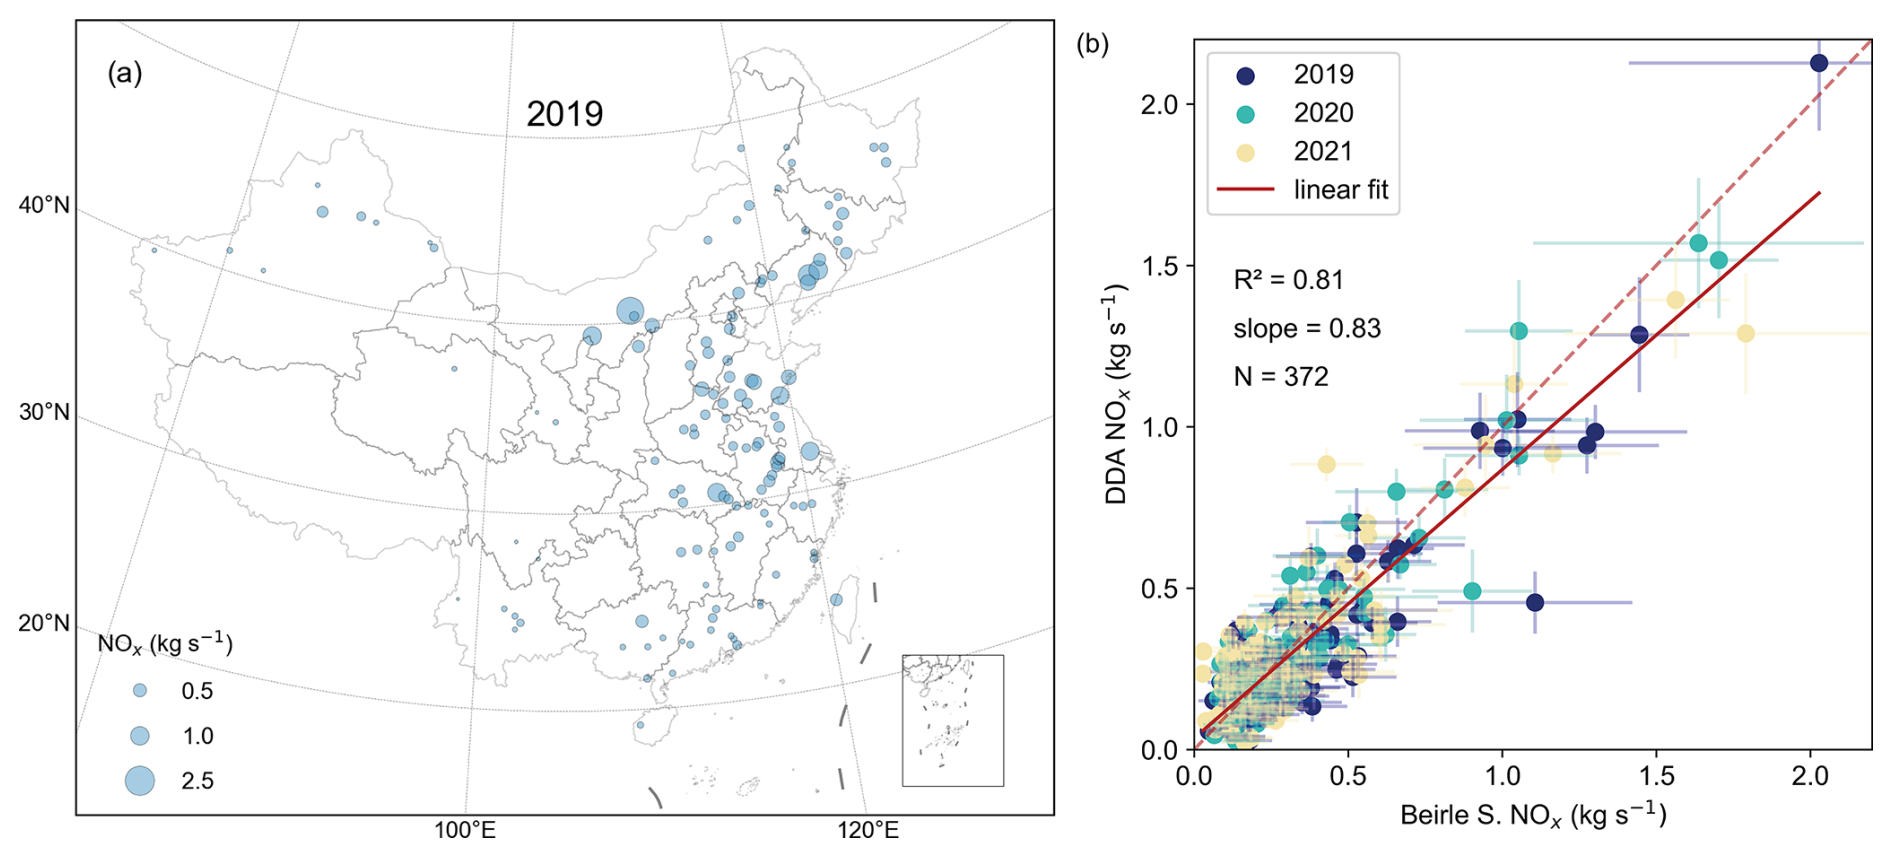
Figure 10Comparisons of NOx point source emissions between the DDA and Beirle et al. (2023) data.
The resulting estimates are validated against Beirle et al. (2023) for 2019–2021, as shown in Fig. 10b. The two datasets show good agreement, with an R2 of 0.81, both indicating a decline in NOx emissions from 2019 to 2021. Generally, NOx emissions from the DDA are slightly lower than those from Beirle et al. (2023), with a slope of 0.83. For comparison, results from DDA test without ratio correction and fitting scheme improvement (fixed_f and single_τ) are also shown in Fig. S9, further illustrating the improvement in point source quantification achieved in this study. It should be noted that point source emissions include all fossil fuel emission sources within the defined radius, leading to a positive bias (Beirle et al., 2023).
We estimate NOx emissions using the DDA by applying a variable NO ratio and deriving a more realistic nonlinear NOx lifetime through a piecewise fitting approach in each subregion. This scheme combines multiple linear fits based on NO2 TVCD levels, providing a simple and robust way to represent nonlinear NOx chemistry in the DDA framework.
Region partitioning mainly depends on NOx concentration, latitude, and terrain. By using HL as the east-west dividing line, the results implicitly consider variations in O3 and its precursors driven by human activities, differences in natural VOCs emissions from vegetation across different climates and geographies, and meteorological effects on transport and photochemistry. It is worth noting that HL is used as a boundary for partitioning because it provides a suitable division, where regional divisions improve fitting performance but have a limited impact compared to grading NOx concentration levels.
The random error of DDf in Eq. (2) described in Sect. 3.4 is used to characterize the uncertainties in DDA emission estimation. Annual anthropogenic emissions uncertainties range from 27 %–30 % at the national scale and 15 %–40 % at the subnational scale. At provincial scale, uncertainties vary more widely, from 8 %–59 %. The average uncertainty for point sources is 16 %. Note that the error does not include the fitting uncertainties related to the topographic correction and chemical loss terms in Eq. (2), indicating that the reported uncertainty is likely underestimated.
Additionally, the anthropogenic NOx emissions are derived by subtracting natural sources from total emissions, a step that may introduce unknown uncertainties. For point sources, spatial integration that includes all fossil fuel sources within the defined radius may lead to a positive bias.
The DDA adopts a data-driven fitting approach to derive parameters independently, eliminating the need for additional assumptions or external calculations. However, this method requires regions with sufficient terrain diversity (including both rough and flat areas) and an adequate number of observations that satisfy the fitting criteria. The fitted scale heights and chemical lifetimes represent effective subregional parameters derived from grid cells in clean regions, which may lead to overestimation of scale heights in heavily polluted areas and do not fully reflect the sensitivity of NOx lifetimes to environmental conditions, although the regional averages still capture nonlinear NOx chemistry. As these are fitting parameters, their physical interpretation should be treated cautiously to avoid over-interpretation (Lonsdale and Sun, 2023). Future observations with higher spatial resolution could improve the representation of scale height and chemical lifetime across heterogeneous regions, while future studies could focus on developing appropriate thresholds for automated global partitioning.
Since satellite-based inversion quantifies total NOx emissions, isolating natural sources is crucial for accurately estimating anthropogenic emissions. However, the current understanding of natural sources remains limited, with substantial discrepancies and uncertainties across previous studies (Jaeglé et al., 2005; Kong et al., 2023; Li and Zheng, 2024; Lin, 2012; Lin et al., 2024; Müller and Stavrakou, 2005; Song et al., 2021; Zhao and Wang, 2009). We attribute 28.1 %–35.6 % of China's total NOx emissions to natural sources, indicating that natural emissions in China have been underestimated, as noted by Song et al. (2021).
This work primarily aims to propose a practical and insightful perspective for addressing nonlinear NOx chemistry in satellite-based emission estimation, rather than focusing on improvements in data quality itself (e.g., air mass factor correction in satellite NO2 retrievals).
Code relevant to this paper can be found in Sun (2022) at https://doi.org/10.5281/zenodo.7987812 (Sun, 2023). The data can be found at https://doi.org/10.5281/zenodo.18923337 (Chen et al., 2026), Table S3 provides a description of the dataset.
We present an improved satellite-based framework for estimating NOx emissions across China, leveraging the directional derivative approach (DDA) alongside TROPOMI NO2 observations, ERA5 wind fields, and variable NO ratios derived from GEOS-CF. The DDA addresses several challenges in satellite-based emission quantification. It corrects divergence artifacts induced by terrain-driven flows, reduces biases from using single-level wind fields, and suppresses background signal contamination implicitly.
In this work, by incorporating a spatially variable NO ratio and implementing a data-driven, piecewise fitting strategy, we account for nonlinear NOx chemistry and improve the estimation of NOx lifetimes across diverse emission regimes. The NO ratio correction improves the accuracy of source divergence and emission estimates, with the major advancement being the piecewise fitting approach, which captures the nonlinear NOx chemistry. The fitting scheme clusters NO2 concentration levels within localized regions, reduces fitting errors, mitigates artifacts in mountainous and remote areas, and improves the overall reliability of the estimates. It enables the estimation of both point-source and regional NOx emissions across China, representing the first application of a lightweight, satellite-driven NOx emissions estimator in such a large and topographically complex region.
NOx lifetimes vary from 0.71–26.47 h with NOx concentrations, and average values across the four subregions range from 3.17–7.85 h, reflecting the nonlinear variability of lifetime as a function of NO2 TVCDs. Significant discrepancies in regional ambient conditions, such as O3 and VOCs concentrations, meteorological parameters, and differences in NOx emission sources, also contribute to this variability. Without ratio correction and fitting improvements, lifetimes across the four subregions are about 2 to 3 times those found in this study, reaching 1.7 times in ES, 2.8–2.9 times in EN and WN, and 3.3 times in WS, highlighting the critical need to consider variable NO ratios and nonlinear lifetimes, particularly in clean and heavily polluted regions.
Anthropogenic contributions are isolated by subtracting natural sources from satellite-derived total emissions, with natural NOx identified using a seasonal criterion and further constrained by NTL data. Estimated anthropogenic NOx emissions in China are 20.2, 18.5, 19.4, 18.9, 20.7 and 18.8 Tg from 2019 to 2024, with annual uncertainties of 27 %–30 %. The corresponding total emissions are 29.8, 28.8, 28.7, 28.2, 28.7 and 27.4 Tg, respectively, and natural sources account for 28.1 %–35.6 % of the totals in this study.
Spatial and temporal trends show consistent NOx reductions in megacities, while provincial-level patterns reflect regional differences in urbanization and economic development.
From 2019 to 2024, emissions from the 124 power plants range from 0.02–2.13 kg s−1, with uncertainties between 4 %–78 %, averaging 16 %. Overall, the plants show an average emission decline of 23 % over this period.
Validation against established inventories, including MEIC, EDGAR, and other top-down inversions, demonstrates strong agreement with national level discrepancies ranging from −11.8 % to 0.8 %. At the provincial scale, the DDA shows consistently lower emissions in economically advanced regions and higher in less developed Northeast and western areas. For point sources, our estimates closely match those from previous study, with an R2 of 0.81 and a slope of 0.83.
Looking forward, this framework holds promise for global-scale application and for separating natural and anthropogenic NOx sources. Its low-latency, data-driven nature offers critical value for air quality management, CO2 co-emission estimation, and international efforts such as the Global Stocktake.
The supplement related to this article is available online at https://doi.org/10.5194/essd-18-2749-2026-supplement.
ZNC, LC, and KS designed this study. KS constructed the algorithm codebase and LC executed optimizations. LC performed the analysis and wrote the paper with ZNC, KS and YL. MML and LYZ provided comments. YL supervised the study.
The contact author has declared that none of the authors has any competing interests.
Publisher's note: Copernicus Publications remains neutral with regard to jurisdictional claims made in the text, published maps, institutional affiliations, or any other geographical representation in this paper. The authors bear the ultimate responsibility for providing appropriate place names. Views expressed in the text are those of the authors and do not necessarily reflect the views of the publisher.
We thank ESA and NASA for the TROPOMI, GEOS-CF, and VNP46 datasets; ECMWF for providing the ERA5 and CAMS datasets; and Tsinghua University and the EDGAR team for MEIC and EDGAR bottom-up emissions inventories.
This research was supported by the National Key R&D Program of China (grant no. 2022YFB3904802), the Open Fund of State Key Laboratory of Infrared Physics, Shanghai Institute of Technical Physics, Chinese Academy of Sciences.
This paper was edited by Graciela Raga and reviewed by two anonymous referees.
Ayazpour, Z., Sun, K., Zhang, R., and Shen, H.: Evaluation of the Directional Derivative Approach for Timely and Accurate Satellite-Based Emission Estimation Using Chemical Transport Model Simulation of Nitrogen Oxides, J. Geophys. Res.-Atmos., 130, e2024JD042817, https://doi.org/10.1029/2024JD042817, 2025.
Beirle, S., Borger, C., Dörner, S., Li, A., Hu, Z., Liu, F., Wang, Y., and Wagner, T.: Pinpointing nitrogen oxide emissions from space, Sci. Adv., 5, eaax9800, https://doi.org/10.1126/sciadv.aax9800, 2019.
Beirle, S., Borger, C., Dörner, S., Eskes, H., Kumar, V., de Laat, A., and Wagner, T.: Catalog of NOx emissions from point sources as derived from the divergence of the NO2 flux for TROPOMI, Earth Syst. Sci. Data, 13, 2995–3012, https://doi.org/10.5194/essd-13-2995-2021, 2021.
Beirle, S., Borger, C., Jost, A., and Wagner, T.: Improved catalog of NOx point source emissions (version 2), Earth Syst. Sci. Data, 15, 3051–3073, https://doi.org/10.5194/essd-15-3051-2023, 2023.
Byers, L., Friedrich, J., Hennig, R., Kressig, A., Li, X., McCormick, C., and Malaguzzi Valeri, L.: Global Power Plant Database Datasets, Version 1.3.0, https://datasets.wri.org//datasets/global-power-plant-database (last access: 22 January 2025), 2019.
Cao, J., Situ, S., Hao, Y., Xie, S., and Li, L.: Enhanced summertime ozone and SOA from biogenic volatile organic compound (BVOC) emissions due to vegetation biomass variability during 1981–2018 in China, Atmos. Chem. Phys., 22, 2351–2364, https://doi.org/10.5194/acp-22-2351-2022, 2022.
Chen, L., Cai, Z., Sun, K., Liu, Y., Yang, D., Li, M., and Zhu, L.: Regional and point source nitrogen oxides emissions in China from TROPOMI, Zenodo [data set], https://doi.org/10.5281/zenodo.18923337, 2026.
Cifuentes, F., Eskes, H., Dammers, E., Bryan, C., and Boersma, F.: Accurate space-based NOx emission estimates with the flux divergence approach require fine-scale model information on local oxidation chemistry and profile shapes, Geosci. Model Dev., 18, 621–649, https://doi.org/10.5194/gmd-18-621-2025, 2025.
Cooper, M. J., Martin, R. V., Hammer, M. S., Levelt, P. F., Veefkind, P., Lamsal, L. N., Krotkov, N. A., Brook, J. R., and McLinden, C. A.: Global fine-scale changes in ambient NO2 during COVID-19 lockdowns, Nature, 601, 380–387, https://doi.org/10.1038/s41586-021-04229-0, 2022.
Crippa, M., Guizzardi, D., Pagani, F., Schiavina, M., Melchiorri, M., Pisoni, E., Graziosi, F., Muntean, M., Maes, J., Dijkstra, L., Van Damme, M., Clarisse, L., and Coheur, P.: Insights into the spatial distribution of global, national, and subnational greenhouse gas emissions in the Emissions Database for Global Atmospheric Research (EDGAR v8.0), Earth Syst. Sci. Data, 16, 2811–2830, https://doi.org/10.5194/essd-16-2811-2024, 2024.
De Foy, B. and Schauer, J. J.: An improved understanding of NOx emissions in South Asian megacities using TROPOMI NO2 retrievals, Environ. Res. Lett., 17, 024006, https://doi.org/10.1088/1748-9326/ac48b4, 2022.
Ding, J., van der A, R. J., Mijling, B., and Levelt, P. F.: Space-based NOx emission estimates over remote regions improved in DECSO, Atmos. Meas. Tech., 10, 925–938, https://doi.org/10.5194/amt-10-925-2017, 2017.
Duncan, B. N., Yoshida, Y., Olson, J. R., Sillman, S., Martin, R. V., Lamsal, L., Hu, Y., Pickering, K. E., Retscher, C., Allen, D. J., and Crawford, J. H.: Application of OMI observations to a space-based indicator of NOx and VOC controls on surface ozone formation, Atmos. Environ., 44, 2213–2223, https://doi.org/10.1016/j.atmosenv.2010.03.010, 2010.
Frankenberg, C., Thorpe, A. K., Thompson, D. R., Hulley, G., Kort, E. A., Vance, N., Borchardt, J., Krings, T., Gerilowski, K., Sweeney, C., Conley, S., Bue, B. D., Aubrey, A. D., Hook, S., and Green, R. O.: Airborne methane remote measurements reveal heavy-tail flux distribution in Four Corners region, P. Natl. Acad. Sci. USA, 113, 9734–9739, https://doi.org/10.1073/pnas.1605617113, 2016.
Galloway, J. N., Dentener, F. J., Capone, D. G., Boyer, E. W., Howarth, R. W., Seitzinger, S. P., Asner, G. P., Cleveland, C. C., Green, P. A., Holland, E. A., Karl, D. M., Michaels, A. F., Porter, J. H., Townsend, A. R., and Vöosmarty, C. J.: Nitrogen Cycles: Past, Present, and Future, Biogeochemistry, 70, 153–226, https://doi.org/10.1007/s10533-004-0370-0, 2004.
Geng, G., Liu, Y., Liu, Y., Liu, S., Cheng, J., Yan, L., Wu, N., Hu, H., Tong, D., Zheng, B., Yin, Z., He, K., and Zhang, Q.: Efficacy of China's clean air actions to tackle PM2.5 pollution between 2013 and 2020, Nat. Geosci., 17, 987–994, https://doi.org/10.1038/s41561-024-01540-z, 2024.
Guenther, A., Hewitt, C. N., Erickson, D., Fall, R., Geron, C., Graedel, T., Harley, P., Klinger, L., Lerdau, M., Mckay, W. A., Pierce, T., Scholes, B., Steinbrecher, R., Tallamraju, R., Taylor, J., and Zimmerman, P.: A global model of natural volatile organic compound emissions, J. Geophys. Res.-Atmos., 100, 8873–8892, https://doi.org/10.1029/94jd02950, 1995.
Hoesly, R. M., Smith, S. J., Feng, L., Klimont, Z., Janssens-Maenhout, G., Pitkanen, T., Seibert, J. J., Vu, L., Andres, R. J., Bolt, R. M., Bond, T. C., Dawidowski, L., Kholod, N., Kurokawa, J.-I., Li, M., Liu, L., Lu, Z., Moura, M. C. P., O'Rourke, P. R., and Zhang, Q.: Historical (1750–2014) anthropogenic emissions of reactive gases and aerosols from the Community Emissions Data System (CEDS), Geosci. Model Dev., 11, 369–408, https://doi.org/10.5194/gmd-11-369-2018, 2018.
Hu, H. Y.: The Distribution of Population in China, With Statistics and Maps, Acta Geographica Sinica, 2, 33–74, https://doi.org/10.11821/xb193502002, 1935.
Jaeglé, L., Steinberger, L., Martin, R. V., and Chance, K.: Global partitioning of NOx sources using satellite observations: Relative roles of fossil fuel combustion, biomass burning and soil emissions, Faraday Discuss., 130, 407–423, https://doi.org/10.1039/B502128F, 2005.
Jin, X., Fiore, A., Boersma, K. F., Smedt, I. D., and Valin, L.: Inferring Changes in Summertime Surface Ozone–NOx–VOC Chemistry over U.S. Urban Areas from Two Decades of Satellite and Ground-Based Observations, Environ. Sci. Technol., 54, 6518–6529, https://doi.org/10.1021/acs.est.9b07785, 2020.
Kaiser, J. W., Heil, A., Andreae, M. O., Benedetti, A., Chubarova, N., Jones, L., Morcrette, J.-J., Razinger, M., Schultz, M. G., Suttie, M., and van der Werf, G. R.: Biomass burning emissions estimated with a global fire assimilation system based on observed fire radiative power, Biogeosciences, 9, 527–554, https://doi.org/10.5194/bg-9-527-2012, 2012.
Keller, C. A., Knowland, K. E., Duncan, B. N., Liu, J., Anderson, D. C., Das, S., Lucchesi, R. A., Lundgren, E. W., Nicely, J. M., Nielsen, E., Ott, L. E., Saunders, E., Strode, S. A., Wales, P. A., Jacob, D. J., and Pawson, S.: Description of the NASA GEOS Composition Forecast Modeling System GEOS-CF v1.0, J. Adv. Model. Earth Sy., 13, e2020MS002413, https://doi.org/10.1029/2020MS002413, 2021.
Knowland, K. E., Keller, C. A., and Lucchesi, R.: File Specification for GEOS-CF Products, GMAO Office Note No. 17 (Version 1.3), https://gmao.gsfc.nasa.gov/publications/office_notes/ (last access: 16 April 2026), 2022.
Koene, E. F. M., Brunner, D., and Kuhlmann, G.: On the Theory of the Divergence Method for Quantifying Source Emissions From Satellite Observations, J. Geophys. Res.-Atmos., 129, e2023JD039904, https://doi.org/10.1029/2023JD039904, 2024.
Kong, H., Lin, J., Zhang, Y., Li, C., Xu, C., Shen, L., Liu, X., Yang, K., Su, H., and Xu, W.: High natural nitric oxide emissions from lakes on Tibetan Plateau under rapid warming, Nat. Geosci., 16, 474–477, https://doi.org/10.1038/s41561-023-01200-8, 2023.
Kong, L., Tang, X., Wang, Z., Zhu, J., Li, J., Wu, H., Wu, Q., Chen, H., Zhu, L., Wang, W., Liu, B., Wang, Q., Chen, D., Pan, Y., Li, J., Wu, L., and Carmichael, G. R.: Changes in air pollutant emissions in China during two clean-air action periods derived from the newly developed Inversed Emission Inventory for Chinese Air Quality (CAQIEI), Earth Syst. Sci. Data, 16, 4351–4387, https://doi.org/10.5194/essd-16-4351-2024, 2024.
Krings, T., Gerilowski, K., Buchwitz, M., Reuter, M., Tretner, A., Erzinger, J., Heinze, D., Pflüger, U., Burrows, J. P., and Bovensmann, H.: MAMAP – a new spectrometer system for column-averaged methane and carbon dioxide observations from aircraft: retrieval algorithm and first inversions for point source emission rates, Atmos. Meas. Tech., 4, 1735–1758, https://doi.org/10.5194/amt-4-1735-2011, 2011.
Krol, M., van Stratum, B., Anglou, I., and Boersma, K. F.: Evaluating NOx stack plume emissions using a high-resolution atmospheric chemistry model and satellite-derived NO2 columns, Atmos. Chem. Phys., 24, 8243–8262, https://doi.org/10.5194/acp-24-8243-2024, 2024.
Lange, K., Richter, A., and Burrows, J. P.: Variability of nitrogen oxide emission fluxes and lifetimes estimated from Sentinel-5P TROPOMI observations, Atmos. Chem. Phys., 22, 2745–2767, https://doi.org/10.5194/acp-22-2745-2022, 2022.
Laughner, J. L. and Cohen, R. C.: Direct observation of changing NOx lifetime in North American cities, Science, 366, 723–727, https://doi.org/10.1126/science.aax6832, 2019.
Li, H. and Zheng, B.: Toward monitoring daily anthropogenic CO2 emissions with air pollution sensors from space, One Earth, 7, 1846–1857, https://doi.org/10.1016/j.oneear.2024.08.019, 2024.
Li, K., Jacob, D. J., Shen, L., Lu, X., De Smedt, I., and Liao, H.: Increases in surface ozone pollution in China from 2013 to 2019: anthropogenic and meteorological influences, Atmos. Chem. Phys., 20, 11423–11433, https://doi.org/10.5194/acp-20-11423-2020, 2020.
Li, M., Liu, H., Geng, G., Hong, C., Liu, F., Song, Y., Tong, D., Zheng, B., Cui, H., Man, H., Zhang, Q., and He, K.: Anthropogenic emission inventories in China: a review, Natl. Sci. Rev., 4, 834–866, https://doi.org/10.1093/nsr/nwx150, 2017.
Li, Z., Sun, K., Guan, K., Wang, S., Peng, B., Clarisse, L., Van Damme, M., Coheur, P.-F., Cady-Pereira, K., Shephard, M. W., Zondlo, M., and Moore, D.: Ammonia emissions and depositions over the contiguous United States derived from IASI and CrIS using the directional derivative approach, Atmos. Chem. Phys., 26, 703–721, https://doi.org/10.5194/acp-26-703-2026, 2026.
Lin, J.-T.: Satellite constraint for emissions of nitrogen oxides from anthropogenic, lightning and soil sources over East China on a high-resolution grid, Atmos. Chem. Phys., 12, 2881–2898, https://doi.org/10.5194/acp-12-2881-2012, 2012.
Lin, X., van der A, R., de Laat, J., Huijnen, V., Mijling, B., Ding, J., Eskes, H., Douros, J., Liu, M., Zhang, X., and Liu, Z.: European Soil NOx Emissions Derived From Satellite NO2 Observations, J. Geophys. Res.-Atmos., 129, e2024JD041492, https://doi.org/10.1029/2024JD041492, 2024.
Liu, F., Beirle, S., Zhang, Q., Dörner, S., He, K., and Wagner, T.: NOx lifetimes and emissions of cities and power plants in polluted background estimated by satellite observations, Atmos. Chem. Phys., 16, 5283–5298, https://doi.org/10.5194/acp-16-5283-2016, 2016a.
Liu, F., Zhang, Q., van der A, R. J., Zheng, B., Tong, D., Yan, L., Zheng, Y., and He, K.: Recent reduction in NOx emissions over China: synthesis of satellite observations and emission inventories, Environ. Res. Lett., 11, 114002, https://doi.org/10.1088/1748-9326/11/11/114002, 2016b.
Liu, F., Beirle, S., Joiner, J., Choi, S., Tao, Z., Knowland, K. E., Smith, S. J., Tong, D. Q., Ma, S., Fasnacht, Z. T., and Wagner, T.: High-resolution mapping of nitrogen oxide emissions in large US cities from TROPOMI retrievals of tropospheric nitrogen dioxide columns, Atmos. Chem. Phys., 24, 3717–3728, https://doi.org/10.5194/acp-24-3717-2024, 2024.
Lonsdale, C. R. and Sun, K.: Nitrogen oxides emissions from selected cities in North America, Europe, and East Asia observed by the TROPOspheric Monitoring Instrument (TROPOMI) before and after the COVID-19 pandemic, Atmos. Chem. Phys., 23, 8727–8748, https://doi.org/10.5194/acp-23-8727-2023, 2023.
Martin, R. V., Fiore, A. M., and Van Donkelaar, A.: Space-based diagnosis of surface ozone sensitivity to anthropogenic emissions, Geophys. Res. Lett., 31, L06120, https://doi.org/10.1029/2004GL019416, 2004.
Meier, S., Koene, E. F. M., Krol, M., Brunner, D., Damm, A., and Kuhlmann, G.: A lightweight NO2-to-NOx conversion model for quantifying NOx emissions of point sources from NO2 satellite observations, Atmos. Chem. Phys., 24, 7667–7686, https://doi.org/10.5194/acp-24-7667-2024, 2024.
Miyazaki, K. and Bowman, K.: Predictability of fossil fuel CO2 from air quality emissions, Nat. Commun., 14, 1604, https://doi.org/10.1038/s41467-023-37264-8, 2023.
Miyazaki, K., Bowman, K., Sekiya, T., Takigawa, M., Neu, J. L., Sudo, K., Osterman, G., and Eskes, H.: Global tropospheric ozone responses to reduced NOx emissions linked to the COVID-19 worldwide lockdowns, Sci. Adv., 7, eabf7460, https://doi.org/10.1126/sciadv.abf7460, 2021.
Müller, J.-F. and Stavrakou, T.: Inversion of CO and NOx emissions using the adjoint of the IMAGES model, Atmos. Chem. Phys., 5, 1157–1186, https://doi.org/10.5194/acp-5-1157-2005, 2005.
Opacka, B., Stavrakou, T., Müller, J.-F., De Smedt, I., van Geffen, J., Marais, E. A., Horner, R. P., Millet, D. B., Wells, K. C., and Guenther, A. B.: Natural emissions of VOC and NOx over Africa constrained by TROPOMI HCHO and NO2 data using the MAGRITTEv1.1 model, Atmos. Chem. Phys., 25, 2863–2894, https://doi.org/10.5194/acp-25-2863-2025, 2025.
Palmer, P. I., Abbot, D. S., Fu, T., Jacob, D. J., Chance, K., Kurosu, T. P., Guenther, A., Wiedinmyer, C., Stanton, J. C., Pilling, M. J., Pressley, S. N., Lamb, B., and Sumner, A. L.: Quantifying the seasonal and interannual variability of North American isoprene emissions using satellite observations of the formaldehyde column, J. Geophys. Res.-Atmos., 111, https://doi.org/10.1029/2005jd006689, 2006.
Pusede, S. E., Steiner, A. L., and Cohen, R. C.: Temperature and Recent Trends in the Chemistry of Continental Surface Ozone, Chem. Rev., 115, 3898–3918, https://doi.org/10.1021/cr5006815, 2015.
Reuter, M., Buchwitz, M., Hilboll, A., Richter, A., Schneising, O., Hilker, M., Heymann, J., Bovensmann, H., and Burrows, J. P.: Decreasing emissions of NOx relative to CO2 in East Asia inferred from satellite observations, Nat. Geosci., 7, 792–795, https://doi.org/10.1038/ngeo2257, 2014.
Reuter, M., Buchwitz, M., Schneising, O., Krautwurst, S., O'Dell, C. W., Richter, A., Bovensmann, H., and Burrows, J. P.: Towards monitoring localized CO2 emissions from space: co-located regional CO2 and NO2 enhancements observed by the OCO-2 and S5P satellites, Atmos. Chem. Phys., 19, 9371–9383, https://doi.org/10.5194/acp-19-9371-2019, 2019.
Rey-Pommier, A., Chevallier, F., Ciais, P., Broquet, G., Christoudias, T., Kushta, J., Hauglustaine, D., and Sciare, J.: Quantifying NOx emissions in Egypt using TROPOMI observations, Atmos. Chem. Phys., 22, 11505–11527, https://doi.org/10.5194/acp-22-11505-2022, 2022.
Rey-Pommier, A., Chevallier, F., Ciais, P., Kushta, J., Christoudias, T., Bayram, I. S., and Sciare, J.: Detecting nitrogen oxide emissions in Qatar and quantifying emission factors of gas-fired power plants – a 4-year study, Atmos. Chem. Phys., 23, 13565–13583, https://doi.org/10.5194/acp-23-13565-2023, 2023.
Román, M. O., Wang, Z., Sun, Q., Kalb, V., Miller, S. D., Molthan, A., Schultz, L., Bell, J., Stokes, E. C., Pandey, B., Seto, K. C., Hall, D., Oda, T., Wolfe, R. E., Lin, G., Golpayegani, N., Devadiga, S., Davidson, C., Sarkar, S., Praderas, C., Schmaltz, J., Boller, R., Stevens, J., Ramos González, O. M., Padilla, E., Alonso, J., Detrés, Y., Armstrong, R., Miranda, I., Conte, Y., Marrero, N., MacManus, K., Esch, T., and Masuoka, E. J.: NASA's Black Marble nighttime lights product suite, Remote Sens. Environ., 210, 113–143, https://doi.org/10.1016/j.rse.2018.03.017, 2018.
Santaren, D., Hakkarainen, J., Kuhlmann, G., Koene, E., Chevallier, F., Ialongo, I., Lindqvist, H., Nurmela, J., Tamminen, J., Amorós, L., Brunner, D., and Broquet, G.: Benchmarking data-driven inversion methods for the estimation of local CO2 emissions from synthetic satellite images of XCO2 and NO2, Atmos. Meas. Tech., 18, 211–239, https://doi.org/10.5194/amt-18-211-2025, 2025.
Sillman, S., Logan, J. A., and Wofsy, S. C.: The sensitivity of ozone to nitrogen oxides and hydrocarbons in regional ozone episodes, J. Geophys. Res.-Atmos., 95, 1837–1851, https://doi.org/10.1029/JD095iD02p01837, 1990.
Simpson, D., Andersson, C., Christensen, J. H., Engardt, M., Geels, C., Nyiri, A., Posch, M., Soares, J., Sofiev, M., Wind, P., and Langner, J.: Impacts of climate and emission changes on nitrogen deposition in Europe: a multi-model study, Atmos. Chem. Phys., 14, 6995–7017, https://doi.org/10.5194/acp-14-6995-2014, 2014.
Solazzo, E., Crippa, M., Guizzardi, D., Muntean, M., Choulga, M., and Janssens-Maenhout, G.: Uncertainties in the Emissions Database for Global Atmospheric Research (EDGAR) emission inventory of greenhouse gases, Atmos. Chem. Phys., 21, 5655–5683, https://doi.org/10.5194/acp-21-5655-2021, 2021.
Song, W., Liu, X., Hu, C., Chen, G., Liu, X., Walters, W. W., Michalski, G., and Liu, C.: Important contributions of non-fossil fuel nitrogen oxides emissions, Nat. Commun., 12, 243, https://doi.org/10.1038/s41467-020-20356-0, 2021.
Souri, A. H., Johnson, M. S., Wolfe, G. M., Crawford, J. H., Fried, A., Wisthaler, A., Brune, W. H., Blake, D. R., Weinheimer, A. J., Verhoelst, T., Compernolle, S., Pinardi, G., Vigouroux, C., Langerock, B., Choi, S., Lamsal, L., Zhu, L., Sun, S., Cohen, R. C., Min, K.-E., Cho, C., Philip, S., Liu, X., and Chance, K.: Characterization of errors in satellite-based tropospheric column ratios with respect to chemistry, column-to-PBL translation, spatial representation, and retrieval uncertainties, Atmos. Chem. Phys., 23, 1963–1986, https://doi.org/10.5194/acp-23-1963-2023, 2023.
Sprengnether, M., Demerjian, K. L., Donahue, N. M., and Anderson, J. G.: Product analysis of the OH oxidation of isoprene and 1,3-butadiene in the presence of NO, J. Geophys. Res.-Atmos., 107, ACH 8-1–ACH 8-13, https://doi.org/10.1029/2001JD000716, 2002.
Sun, K.: Derivation of Emissions From Satellite-Observed Column Amounts and Its Application to TROPOMI NO2 and CO Observations, Geophys. Res. Lett., 49, e2022GL101102, https://doi.org/10.1029/2022GL101102, 2022.
Sun, K.: Kang-Sun-CfA/Oversampling_matlab: NOx city emission paper, Zenodo [code], https://doi.org/10.5281/zenodo.7987812, 2023.
Sun, K., Zhu, L., Cady-Pereira, K., Chan Miller, C., Chance, K., Clarisse, L., Coheur, P.-F., González Abad, G., Huang, G., Liu, X., Van Damme, M., Yang, K., and Zondlo, M.: A physics-based approach to oversample multi-satellite, multispecies observations to a common grid, Atmos. Meas. Tech., 11, 6679–6701, https://doi.org/10.5194/amt-11-6679-2018, 2018.
van der A, R. J., Peters, D. H. M. U., Eskes, H., Boersma, K. F., Van Roozendael, M., De Smedt, I., and Kelder, H. M.: Detection of the trend and seasonal variation in tropospheric NO2 over China, J. Geophys. Res.-Atmos., 111, https://doi.org/10.1029/2005JD006594, 2006.
van Geffen, J., Eskes, H., Compernolle, S., Pinardi, G., Verhoelst, T., Lambert, J.-C., Sneep, M., ter Linden, M., Ludewig, A., Boersma, K. F., and Veefkind, J. P.: Sentinel-5P TROPOMI NO2 retrieval: impact of version v2.2 improvements and comparisons with OMI and ground-based data, Atmos. Meas. Tech., 15, 2037–2060, https://doi.org/10.5194/amt-15-2037-2022, 2022.
van Geffen, J. H. G. M., Eskes, H. J., Boersma, K. F., and Veefkind, J. P.: TROPOMI ATBD of the total and tropospheric NO2 data products, issue 2.8.0, https://sentiwiki.copernicus.eu/web/s5p-products#S5PProducts-L2S5P-Products-L2 (last access: 20 May 2025), 2024.
Varon, D. J., Jacob, D. J., McKeever, J., Jervis, D., Durak, B. O. A., Xia, Y., and Huang, Y.: Quantifying methane point sources from fine-scale satellite observations of atmospheric methane plumes, Atmos. Meas. Tech., 11, 5673–5686, https://doi.org/10.5194/amt-11-5673-2018, 2018.
Veefkind, J. P., Aben, I., McMullan, K., Förster, H., De Vries, J., Otter, G., Claas, J., Eskes, H. J., De Haan, J. F., Kleipool, Q., van Weele, M., Hasekamp, O., Hoogeveen, R., Landgraf, J., Snel, R., Tol, P., Ingmann, P., Voors, R., Kruizinga, B., Vink, R., Visser, H., and Levelt, P. F.: TROPOMI on the ESA Sentinel-5 Precursor: A GMES mission for global observations of the atmospheric composition for climate, air quality and ozone layer applications, Remote Sens. Environ., 120, 70–83, https://doi.org/10.1016/j.rse.2011.09.027, 2012.
Veefkind, J. P., Serrano-Calvo, R., de Gouw, J., Dix, B., Schneising, O., Buchwitz, M., Barré, J., van der A, R. J., Liu, M., and Levelt, P. F.: Widespread Frequent Methane Emissions From the Oil and Gas Industry in the Permian Basin, J. Geophys. Res.-Atmos., 128, e2022JD037479, https://doi.org/10.1029/2022JD037479, 2023.
Verhoelst, T., Compernolle, S., Pinardi, G., Lambert, J.-C., Eskes, H. J., Eichmann, K.-U., Fjæraa, A. M., Granville, J., Niemeijer, S., Cede, A., Tiefengraber, M., Hendrick, F., Pazmiño, A., Bais, A., Bazureau, A., Boersma, K. F., Bognar, K., Dehn, A., Donner, S., Elokhov, A., Gebetsberger, M., Goutail, F., Grutter de la Mora, M., Gruzdev, A., Gratsea, M., Hansen, G. H., Irie, H., Jepsen, N., Kanaya, Y., Karagkiozidis, D., Kivi, R., Kreher, K., Levelt, P. F., Liu, C., Müller, M., Navarro Comas, M., Piters, A. J. M., Pommereau, J.-P., Portafaix, T., Prados-Roman, C., Puentedura, O., Querel, R., Remmers, J., Richter, A., Rimmer, J., Rivera Cárdenas, C., Saavedra de Miguel, L., Sinyakov, V. P., Stremme, W., Strong, K., Van Roozendael, M., Veefkind, J. P., Wagner, T., Wittrock, F., Yela González, M., and Zehner, C.: Ground-based validation of the Copernicus Sentinel-5P TROPOMI NO2 measurements with the NDACC ZSL-DOAS, MAX-DOAS and Pandonia global networks, Atmos. Meas. Tech., 14, 481–510, https://doi.org/10.5194/amt-14-481-2021, 2021.
Wang, H., Lu, X., Deng, Y., Sun, Y., Nielsen, C. P., Liu, Y., Zhu, G., Bu, M., Bi, J., and McElroy, M. B.: China's CO2 peak before 2030 implied from characteristics and growth of cities, Nat. Sustain., 2, 748–754, https://doi.org/10.1038/s41893-019-0339-6, 2019.
Wang, Z., Román, M. O., Kalb, V. L., Miller, S. D., Zhang, J., and Shrestha, R. M.: Quantifying uncertainties in nighttime light retrievals from Suomi-NPP and NOAA-20 VIIRS Day/Night Band data, Remote Sens. Environ., 263, 112557, https://doi.org/10.1016/j.rse.2021.112557, 2021.
Yienger, J. J. and Levy II, H.: Empirical model of global soil-biogenic NOx emissions, J. Geophys. Res.-Atmos., 100, 11447–11464, https://doi.org/10.1029/95JD00370, 1995.
Zhang, J., Huan, X., Lü, H., Wang, C., Shen, C., He, K., Lü, Y., and Wu, N.: Crossing of the Hu line by Neolithic population in response to seesaw precipitation changes in China, Sci. Bull., 67, 844–852, https://doi.org/10.1016/j.scib.2021.12.011, 2022.
Zhao, C. and Wang, Y.: Assimilated inversion of NOx emissions over east Asia using OMI NO2 column measurements, Geophys. Res. Lett., 36, https://doi.org/10.1029/2008GL037123, 2009.