the Creative Commons Attribution 4.0 License.
the Creative Commons Attribution 4.0 License.
 | 17 Apr 2026
A high-resolution tropopause folding dataset over China from 2014–2023
Yujia Yang
Le Cao
Liqiang Xu
Mengke Wang
Qingjian Yang
Yuqing Zhang
Tianqi Zhang
Xiuli Lei
Jiangpeng Miao
Tianliang Zhao
Tropopause folds are a primary mechanism for stratosphere-to-troposphere transport (STT), significantly influencing tropospheric ozone, air quality, and regional weather. However, a multi-year, high-resolution folding dataset for China has been lacking. To address this gap, we developed a comprehensive tropopause folding dataset for China and its surrounding regions using the ERA5 reanalysis data and a three-dimensional labeling method for the period 2014–2023. This dataset is distinguished by its 10-year long coverage (2014–2023) and an unprecedented combination of high spatial (0.25° × 0.25°) and temporal (hourly) resolutions, which collectively facilitate a detailed analysis of the spatiotemporal characteristics of folds in these regions. We validated the dataset's accuracy and its capability to capture the full evolution of folding events by comparing it with global datasets and multiple case studies of stratospheric intrusions. The high-resolution dataset not only aligns with large-scale climatology from previous studies but also resolves finer details that were previously smoothed out. Furthermore, this dataset reveals the distinct spatiotemporal distribution of tropopause folds over China. Folding events over China were found to occur predominantly in winter and spring, with significantly lower frequencies in summer and autumn. Spatially, shallow folds are concentrated along the subtropical jet stream, while medium folds peak over the Tibetan Plateau (TP) and Sichuan Basin (SCB) in winter. Deep folds, though less frequent, exert a notable impact on southwestern China, including the TP, where they can substantially affect surface ozone levels. This dataset is available at https://doi.org/10.5281/zenodo.17446871 (Cao et al., 2025), and provides a solid foundation for in-depth investigations into the mechanisms and climatological characteristics of STT, as well as the subsequent impacts of tropopause folds on near-surface atmospheric composition and extreme weather events, thereby serving as a valuable resource for the atmospheric science community.
- Article
(13534 KB) - Full-text XML
-
Supplement
(2255 KB) - BibTeX
- EndNote


“Tropopause fold” is a high-altitude atmospheric phenomenon in which the tropopause (the boundary between troposphere and overlying stratosphere) is perturbed to fold downward, enabling stratospheric air to intrude into the troposphere (Shapiro, 1980; Bartusek et al., 2023). This phenomenon emerges when a portion of the lowermost stratosphere is transported equatorward, forcing high-potential-temperature air masses to move along sloping isentropes (Cooper et al., 2004; Stohl et al., 2003; Holton et al., 1995), resulting in a penetration of dry, ozone-rich air across the tropopause (Zhang et al., 2025; Akritidis et al., 2016; Langford et al., 2015; Danielsen and Mohnen, 1977). Tropopause folds constitute the primary mechanism driving the stratosphere-to-troposphere transport (STT) (Stohl et al., 2003). STT is the general process of air mass transport from the stratosphere to the troposphere, playing a critical role in introducing ozone-rich stratospheric air into the troposphere (Hong et al., 2024; Stohl et al., 2003; Langford et al., 2015). When the folds occur, STT manifests as stratospheric intrusions (SIs), characterized by their episodic nature and rapid descent, significantly altering the total tropospheric ozone burden (Williams et al., 2019; Neu et al., 2014). Beyond ozone transport, recent studies also indicate that STT in the Arctic injects ozone-depleting precursors (such as bromine and iodine) and stratospheric aerosols into the free troposphere, influencing local tropospheric chemistry (Schill et al., 2025). Furthermore, when sufficiently deep, tropopause folds can even extend into the atmospheric boundary layer, directly altering near-surface concentrations of air constituents such as ozone and carbon monoxide (CO) (Zhang et al., 2025; Lin et al., 2015; Akritidis et al., 2016, 2010). Apart from chemical impacts, the tropopause folds, which are often linked to rapid cyclogenesis and convective storms (Wernli et al., 2002; Uccellini, 1990; Antonescu et al., 2013; Cooper et al., 2005), can strongly affect local weather conditions through a downward transport of air with high potential vorticity (Akritidis et al., 2021). For instance, extreme surface winds can be driven by the tropopause folds due to the downward transport of momentum (Raveh-Rubin and Wernli, 2016; Browning and Reynolds, 1994). Strong upward motions, generated in the downstream region of tropopause folds, can also promote precipitation (Li et al., 2023). Therefore, the tropopause fold usually acts as a bridge linking stratospheric anomalies to surface extreme events (Zhong et al., 2025).
Tropopause folds demonstrate clear temporal and spatial variations in their distribution. Temporally, tropopause folding events exhibit distinct seasonality, occurring more frequently in winter but less frequently in summer (Akritidis et al., 2021; Škerlak et al., 2015; Sprenger et al., 2003). Spatially, shallow folding events predominantly occur along the subtropical jet stream (STJ) in both hemispheres, particularly in regions characterized by strong wind speeds or intense Rossby wave breaking. Medium folding events, by contrast, reach peak frequency in polar regions and the subtropics, along mid-latitude storm tracks. With respect to deep folding events, they exhibit distinct hotspots over western Australia, coastal Antarctica, and the eastern coast of North America (Sprenger et al., 2003; Škerlak et al., 2015; Akritidis et al., 2021; Antonescu et al., 2013; Lin et al., 2024).
China and its surrounding regions, substantially influenced by the STJ (Archer and Caldeira, 2008), are high-frequency regions for shallow and medium tropopause folds. Meanwhile, regions such as the Tibetan Plateau (TP) in the southwestern China are prone to be affected by deep folding events, which can remarkably impact surface ozone levels in these regions (Yin et al., 2023; Luo et al., 2019; Liang et al., 2024). Therefore, investigating tropopause folds across China and its surroundings is essential for understanding their distribution characteristics and impacts on atmospheric composition and weather systems in these regions.
However, a multi-year folding dataset with high temporal and spatial resolutions for China is still lacking. Global folding datasets spanning long time periods, as provided in large-scale studies (Lin et al., 2024; Škerlak et al., 2015; Borhani et al., 2022), typically have a coarse horizontal resolution (> 100 km). For instance, the Atmospheric Dynamics group at ETH Zürich provides a global folding dataset (http://eraiclim.ethz.ch/prot/folds.html, last access: 21 September 2025) for years 1980–2014, calculated from the ERA-Interim reanalysis data. However, this dataset gives the folding data in a time scale of month, and the folding data possess a horizontal resolution of 1° (∼110 km). In contrast, a horizontal resolution of at least 50 km is necessary to resolve folding morphology and associated turbulent STT processes (Spreitzer et al., 2019; Knowland et al., 2017). On the other side, while folding datasets with high spatial and temporal resolutions have been utilized in case analyses (Zhang et al., 2024; Yin et al., 2023; Zhong et al., 2025; Liang et al., 2024), these studies have been limited to restricted spatial domains and short time periods. For instance, Zhong et al. (2025) investigated the influence of tropopause folds on an extreme low-temperature event in Eastern China in January 2021, by applying a 3-D labeling methodology on 0.25° × 0.25° ERA5 (ECMWF Reanalysis version 5) reanalysis data. They found that tropopause folds facilitated the intrusion of cold air from the lower Arctic stratosphere into the troposphere, contributing to the surface cooling across Eastern China. However, their findings are mainly specific to this particular event and time period. Liang et al. (2024) provided a detailed analysis of a tropopause fold event on 11 July 2020, confirming its role in transporting stratospheric ozone-rich air into the planetary boundary layer over the TP. Through a long-term assessment, they further established that tropopause folding events lead to a significant increase in surface ozone concentrations across the TP, averaging a 15.94 ppbv rise. However, their study was geographically confined to the TP region. In addition, the underlying folding datasets used in these case studies are usually not provided to the public.
To address this issue, we developed a multi-year high-resolution tropopause folding dataset for China and its surrounding regions. This dataset covers a time period of 10 years (2014–2023), and has a spatial coverage from 50 to 140° E and 0 to 70° N. Regarding the resolutions, the folding data provided by this dataset possess an hourly temporal resolution and a horizontal resolution of 0.25° × 0.25° (∼ 28 km). Compared to existing folding datasets, our folding dataset is distinguished by its combination of extensive temporal coverage and high spatiotemporal resolution over China and its surrounding regions. This dataset facilitates the detailed analysis of spatiotemporal variations in tropopause folds over China. Moreover, it establishes a foundation for investigating STT processes and the subsequent impacts on near-surface ozone concentrations and regional extreme weather events. Additionally, this dataset serves as a critical resource for climate research on STT.
This section provides a comprehensive description of the employed meteorological data and the methodology for identifying tropopause folds based on these meteorological data.
2.1 Meteorological Data
We utilized the ERA5 meteorological reanalysis dataset (Hersbach et al., 2020) to identify tropopause folds and quantify their occurrence frequency over China. ERA5 dataset, provided by the European Centre for Medium-Range Weather Forecasts (ECMWF), is the fifth-generation global atmospheric reanalysis product for climate. It offers high-resolution meteorological data spanning from 1940 to present. In this study, we adopted the ERA5 hourly dataset, from 1 January 2014 to 31 December 2023, with a 0.25° × 0.25° horizontal resolution, and 37 vertical pressure levels. Among various meteorological variables provided by the ERA5 dataset, we used potential vorticity (PV), potential temperature, specific humidity, and surface pressure to identify the folding events.
2.2 Identification of Tropopause Folds
Tropopause folds were identified using a three-dimensional labeling method proposed by Škerlak et al. (2015), developed based on the study of Sprenger et al. (2003). This method identifies the tropopause folds geometrically as multiple crossings of the dynamical tropopause within vertical atmospheric profiles. It first determines the altitude of the dynamical tropopause by selecting the lower boundary between the 2 PVU potential vorticity isosurface and the 380 K potential temperature isosurface (Holton et al., 1995; Sprenger et al., 2003; Stohl et al., 2003). Next, the method assigns various types of the air with five labels (see Fig. 1): 1 = troposphere, 2 = stratosphere, 3 = stratospheric cutoff or diabatically produced cyclonic PV anomaly, 4 = tropospheric cutoff, and 5 = surface-bound cyclonic PV anomaly. Label 1 denotes typical tropospheric air, characterized by low PV values (< 2 PVU). Label 2 represents stratospheric air, defined by high PV (>2 PVU), low specific humidity (≤ 0.1 g kg−1), and three-dimensional connectivity with the stratospheric reservoir. Label 3 corresponds to stratospheric cutoffs, which are isolated stratospheric air masses suspended in the troposphere, or high-PV tropospheric anomalies resulting from dissipative processes, characterized by high specific humidity (> 0.1 g kg−1). Label 4 indicates tropospheric cutoffs, defined as isolated tropospheric air masses with low PV surrounded by stratospheric air. Label 5 identifies surface-bound PV anomalies, distinguished by high PV values extending down to the surface. After constructing a three-dimensional field of air labels, a folding event is identified when a grid node exhibits either a 2 → 1 → 2 → 1 or 2 → 1 → 2 → 3 vertical transition from the top to the bottom of the model. Thus, in this folding dataset, at each grid node, the occurrence of folds is represented by a binary variable fold, with a value of 1 indicating the occurrence of a folding event and 0 indicating its absence. Furthermore, the upper, middle, and lower pressure levels at the tropopause crossings are denoted as pu, pm, and pl, respectively (see Fig. 1). Based on , the identified folding events were classified into three categories: shallow folds (sfold): hPa, medium folds (mfold): hPa, and deep folds (dfold): Δp≥350 hPa. In previous studies (e.g., Lin et al., 2024; Škerlak et al., 2015), folding events with Δp<50 hPa are usually ignored. However, to provide more information on very shallow folding events, we include these events in our dataset. The fold label encompasses all folding events, including those with Δp<50 hPa. Based on these labels, the folding frequencies for different types of folding events at each grid node are calculated as follows:
where represents the total hours with occurrence of different folding events, and Htotal denotes the total hours in the studied period.
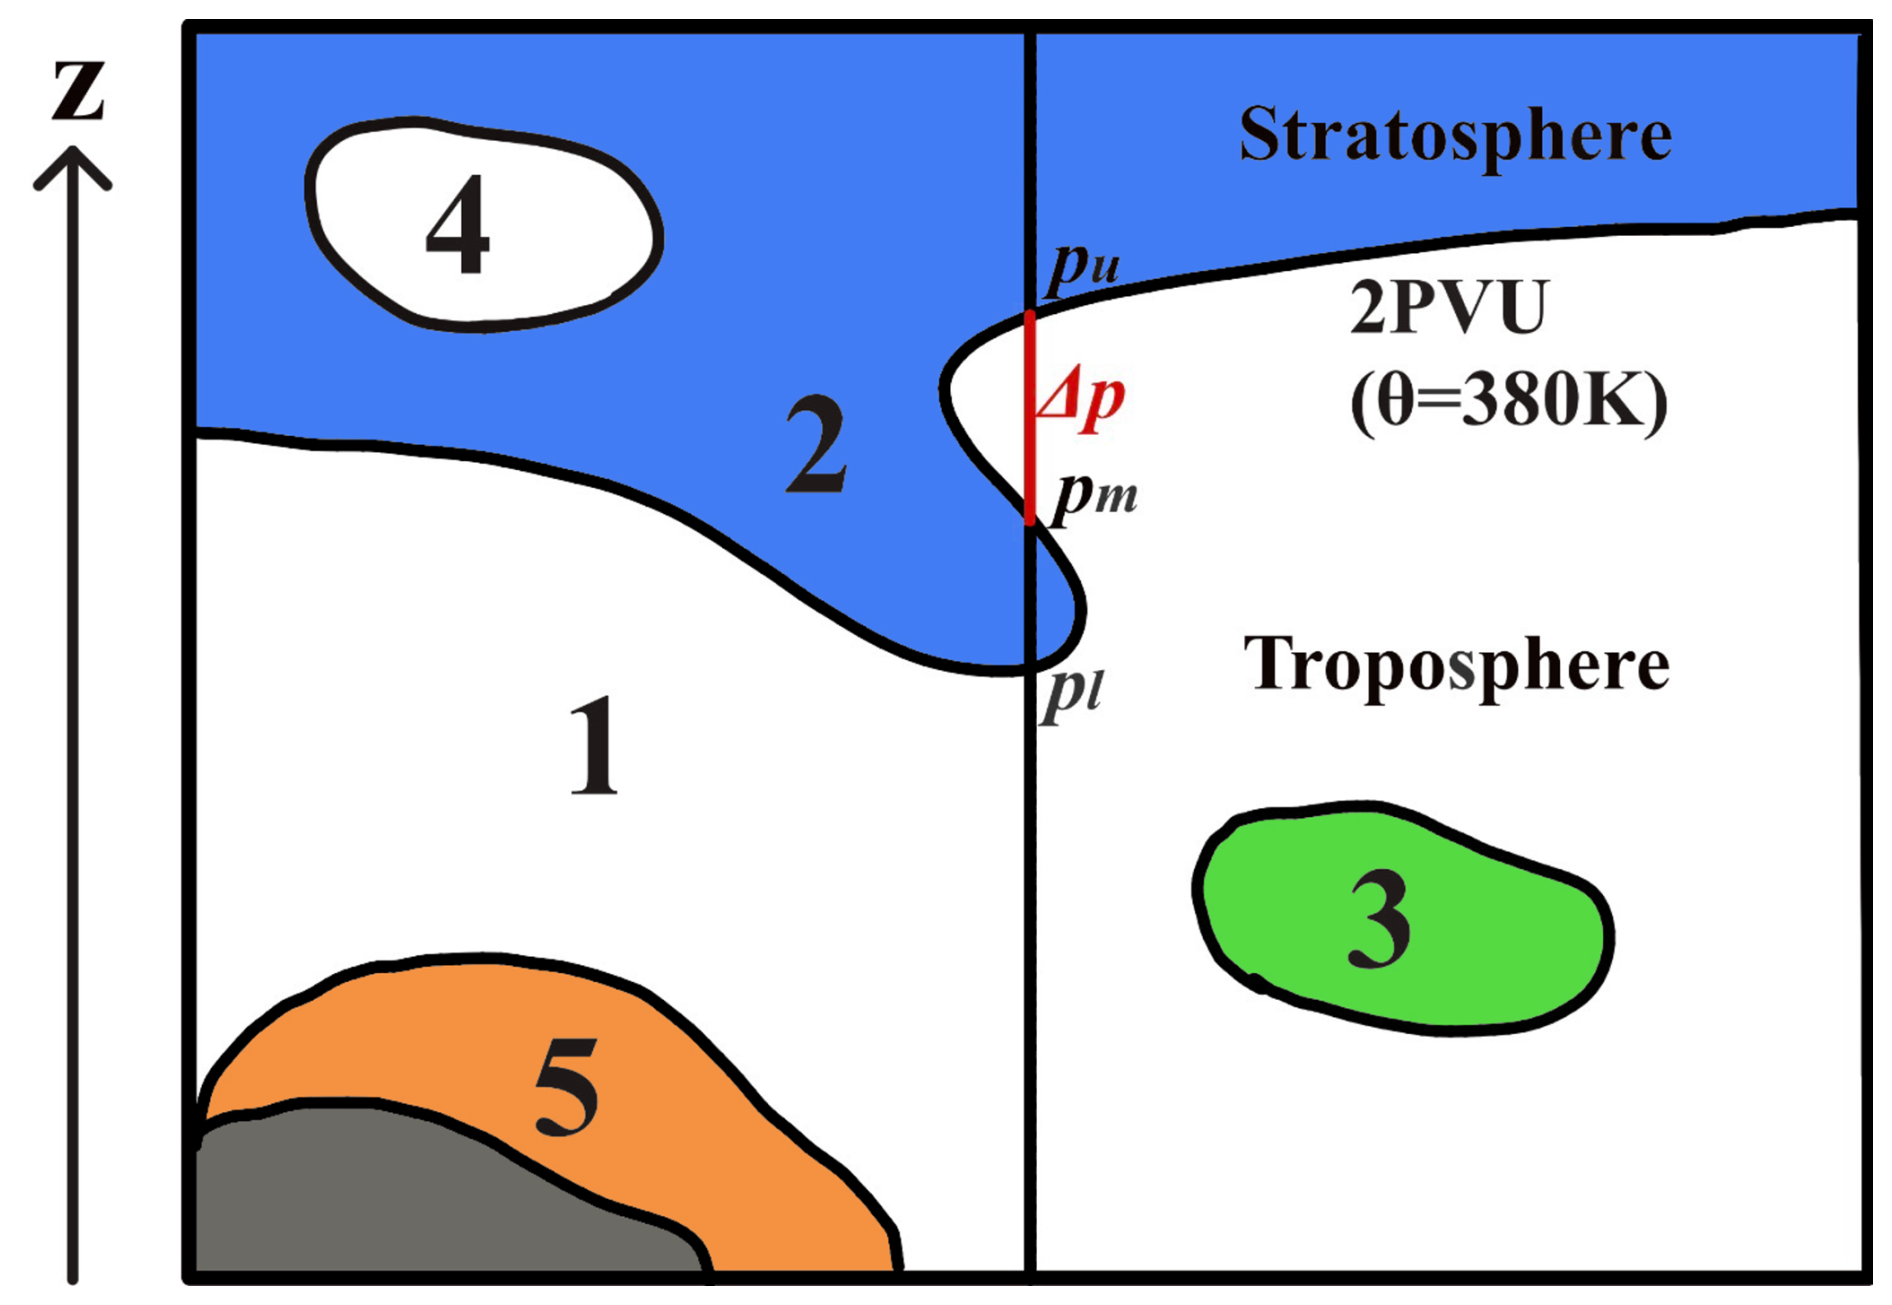
Figure 1Schematic diagram of tropopause fold identification. Labels: 1 = troposphere, 2 = stratosphere, 3 = stratospheric cutoff or diabatically produced cyclonic PV anomaly, 4 = tropospheric cutoff, 5 = surface-bound cyclonic PV anomaly. Gray shading indicates orography. The pressure levels at the tropopause crossings are denoted as pu, pm, and pl for the upper, middle, and lower levels, respectively.
In this section, we first validated our dataset by comparing the spatiotemporal distribution of tropopause folds with that reported in previous global studies. Following validation, we investigated the distributions of different fold types across China and its surrounding regions, analyzing their similarities and differences based on our dataset. Additionally, we adopted three prior case studies on tropopause folds to further verify the accuracy of our dataset in identifying short-term folding events. As demonstrated in following Sect. 3.2.1–3.2.3, our dataset can successfully capture the complete evolution of tropopause folds during stratospheric intrusion events. This capability allows for in-depth investigations of the links between these folds and their associated meteorological drivers, such as upper-level troughs and jet streams, as well as their subsequent impacts on atmospheric composition and near-surface weather conditions.
3.1 Spatiotemporal Distribution of Tropopause Folds over China
Figure 2 shows the seasonal distributions of folding frequencies over the 2014–2023 period, derived from our dataset. Here, the displayed folding frequency refers to the sum of shallow, medium, and deep folding events, to facilitate comparison with existing studies. It is seen that over China, folds occur predominantly during winter (DJF) and spring (MAM), but possess remarkably lower frequencies in summer (JJA) and the lowest frequency in autumn (SON). More specifically, during winter (see Fig. 2a), a folding belt spanning the entire China (20–35° N, 70–135° E) is observed, with the maximum frequency exceeding 18 %. In spring (Fig. 2b), the southern TP and northern India are identified as key folding regions, with frequencies peaking at approximately 18.7 %, the highest among all seasons. In summer (Fig. 2c), the folding frequency in China decreases, and the maximum frequency is found in Central Asia. The folding frequency reaches its seasonal minimum in autumn (Fig. 2d), reaching a maximum of ∼ 7.3 %. Generally, these seasonal spatiotemporal distributions of folds, provided by our dataset, are consistent with those from previous global studies (Lin et al., 2024; Borhani et al., 2022). However, we found the maximum values of folding frequency in our dataset higher than those obtained by Lin et al. (2024) using the 1°×1° ERA5 dataset for 1979–2020. The relative difference in folding frequency f between our dataset and that of Lin et al. (2024) is calculated as , and it is largest (∼ 87 %) in spring and smallest (∼ 59 %) in summer. These deviations may stem from differences in the horizontal resolution of meteorological data and the time periods under investigation. Another potential source of discrepancy might be the increase in folding frequency over recent decades (Lin et al., 2024; Meul et al., 2018). However, only a slight upward trend in tropopause folding events (< 1 % per decade) was reported, and this magnitude of increase remains insufficient to account for the observed differences between our results and previous findings. Therefore, the recent rise in folding frequency is unlikely to be the primary driver of these discrepancies.
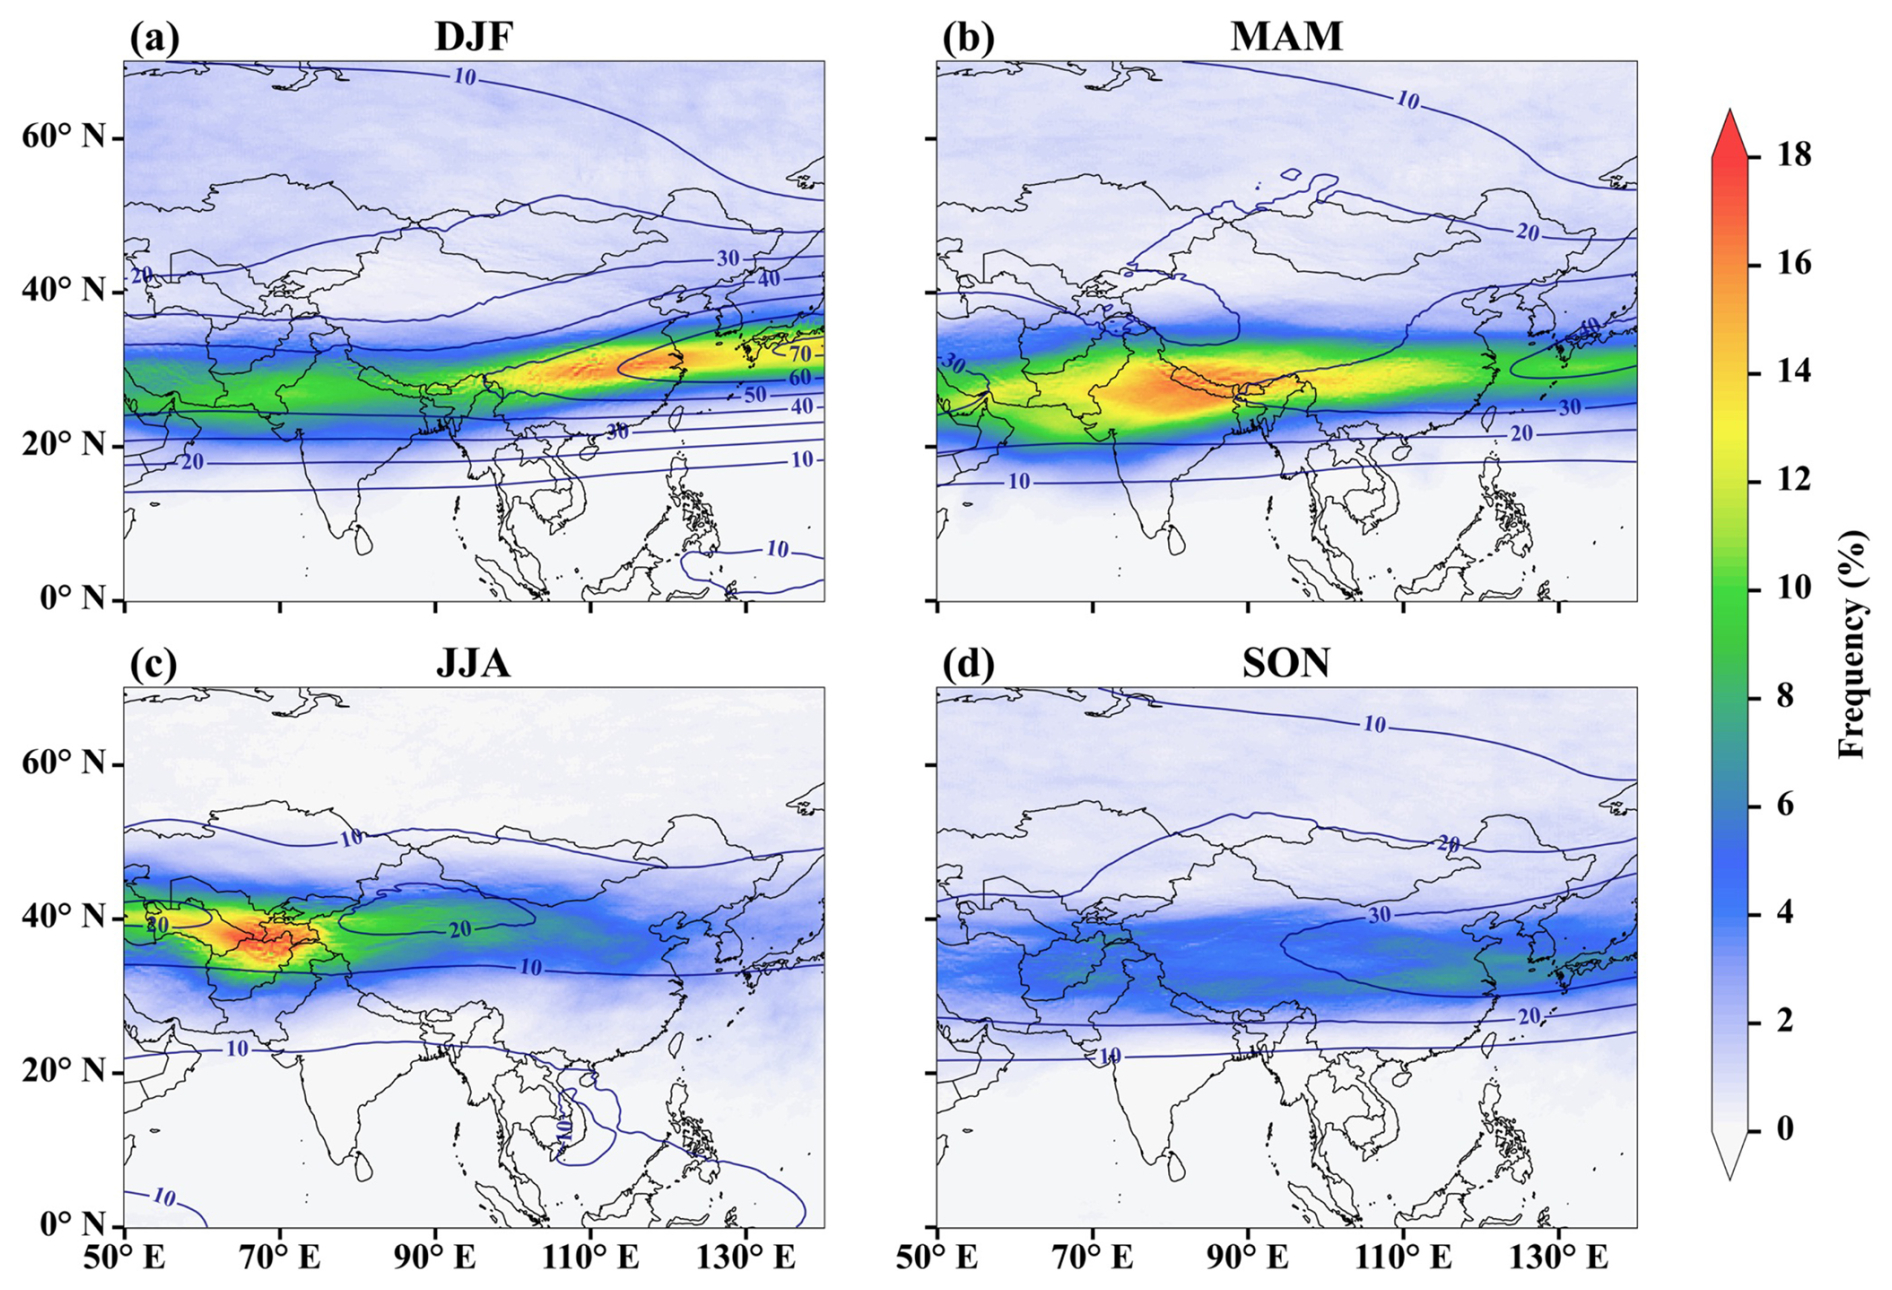
Figure 2Seasonal averaged tropopause folding frequencies (%, sum of shallow, medium, and deep events) from 2014 to 2023 for (a) winter, (b) spring, (c) summer, and (d) autumn. Contour lines show 250 hPa wind speed (m s−1) from the ERA5 dataset.
We also compared our dataset's results for different types of folds (i.e., sfold, mfold and dfold) with those reported in previous global studies (Akritidis et al., 2021; Škerlak et al., 2015; Sprenger et al., 2003). The spatial distributions of the three types of folds provided by our dataset in summer and winter are presented in Fig. 3. Results for spring and autumn can be found in Fig. S1 in the Supplement. In general, these results are in good agreement with those reported by Škerlak et al. (2015) using ERA-Interim data (1979–2012, 1° × 1°) and Akritidis et al. (2021) using MERRA-2 data (2003–2018, 0.5° × 0.625°). During spring (Fig. S1a), shallow folds predominantly occur between 20 and 30° N, with a peak frequency observed over northern India. In summer (Fig. 3a), the subtropical jet stream shifts northward, accompanied by a concurrent northward movement of high-frequency shallow fold regions. The maximum frequency center is situated over the Middle East, with values exceeding 16 %. During autumn (Fig. S1b) and winter (Fig. 3b), a southward shift of the subtropical jet stream coincides with a corresponding equatorward displacement in the spatial distribution of shallow folds. In winter, the primary sfold zone shifts back to the 20–30° N latitude band (Fig. 3b), where the highest frequency, approximately 17 %, is observed over eastern China. The correlation between the high-frequency sfold regions and the locations of the subtropical jet stream in all seasons indicates the role of the subtropical jet stream in forming the shallow folds (Akritidis et al., 2021; Archer and Caldeira, 2008; Stohl et al., 2003). Regarding medium folds (mfold), their occurrence over China is predominantly observed in summer and winter, while they are rare during spring and autumn. Specifically, in summer (Fig. 3c), the primary region of mfold is located in Central Asia, with the maximum frequency reaching 1.6 %. The highest occurrence frequency of mfold was found in winter (Fig. 3d), mainly in the TP and the Sichuan Basin (SCB), where the maximum frequency reaches 1.8 %. In contrast, spring (Fig. S1c) and autumn (Fig. S1d) exhibit markedly lower mfold frequencies compared to winter. In spring, the primary occurrence area is centered on the vicinity of the Himalayas (Lin et al., 2024; Luo et al., 2019). Notably, during winter, in high-wind-speed regions like 25–32° N, 110–140° E, the spatial distributions of mfold (Fig. 3d) closely resemble those of sfold (Fig. 3b), indicating that high wind speed might be a common driving factor for the formation of these two types of folds (Akritidis et al., 2021; Škerlak et al., 2015). With respect to deep folding events, compared with the other two types of folds, they possess the lowest frequency. Specifically, dfold occurs least frequently in summer (Fig. 3e), and most frequently in winter (Fig. 3f), with the maximum frequency reaching only 0.2 %. Due to the high spatial (0.25°) and temporal (hourly) resolutions of our dataset, we were able to capture the details of folding spatial distributions that were mostly smoothed out in previous studies using low-resolution data. For instance, the differences in sfold between eastern and western China can be more clearly distinguished in our dataset (see Fig. 3b). A clearer elucidation of the characteristics of mfold in the Himalayas (Fig. 3d) and dfold in northeastern China (Fig. 3f) was also given by our dataset.
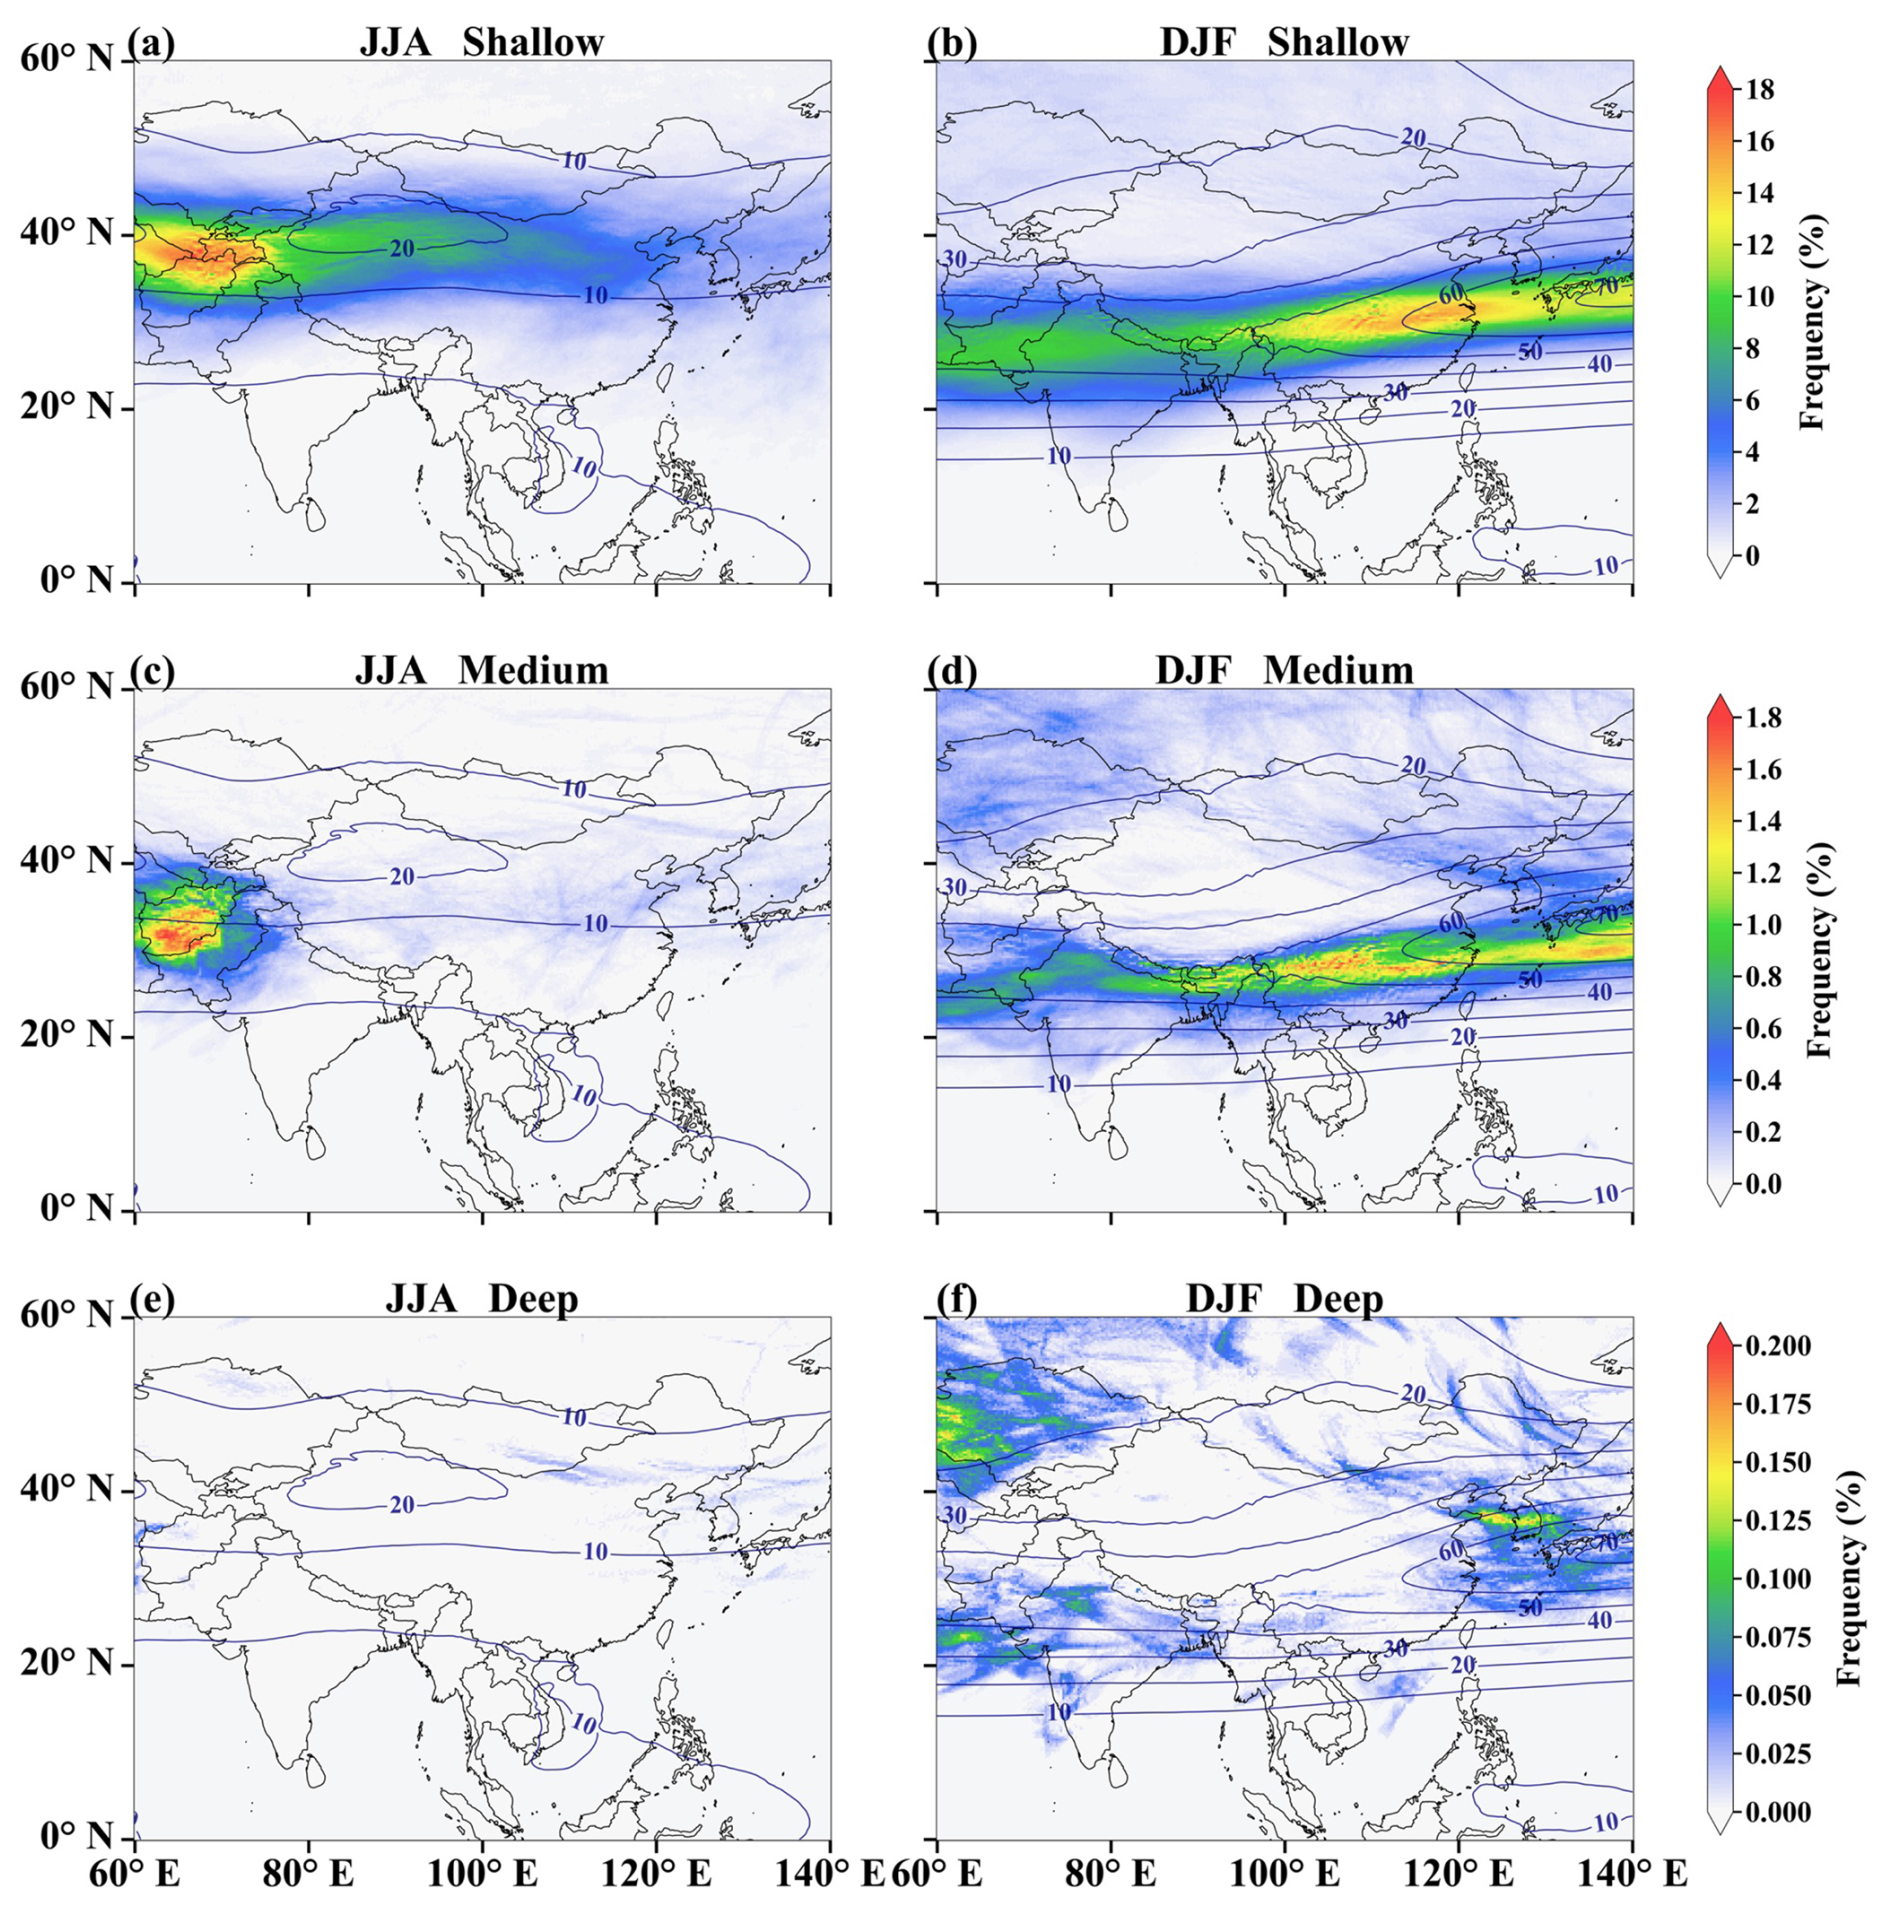
Figure 3Seasonal averaged frequencies (%) of (a, b) shallow, (c, d) medium, and (e, f) deep tropopause folds for summer (left) and winter (right) from 2014–2023. Contour lines show 250 hPa wind speed (m s−1) from the ERA5 dataset.
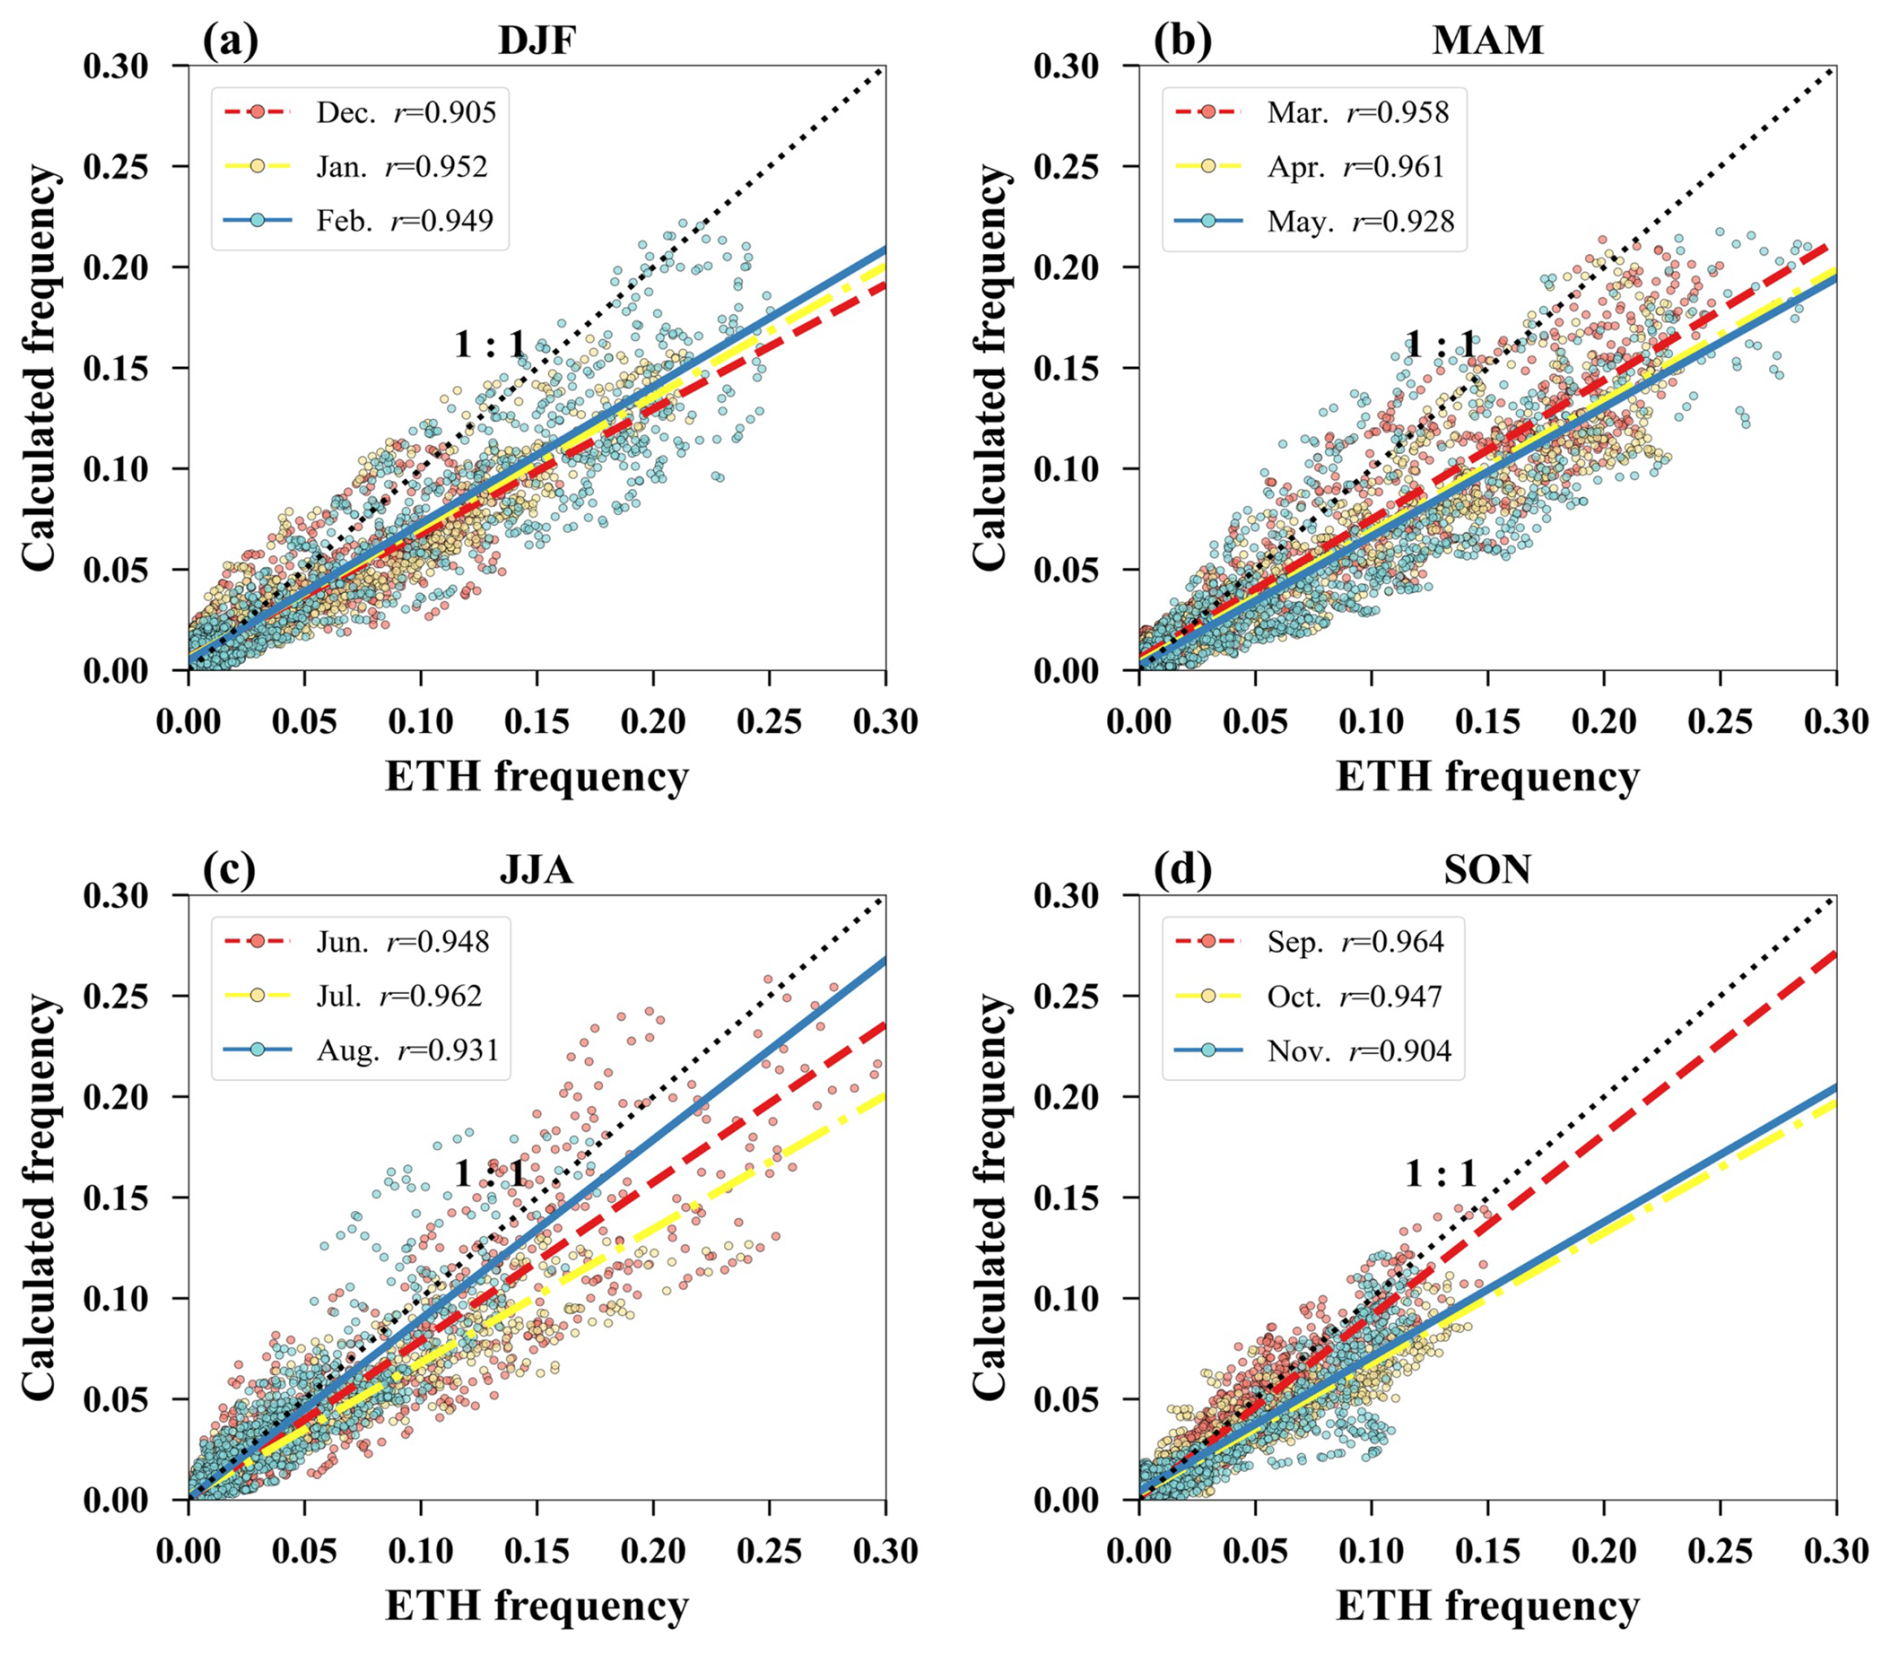
Figure 4Comparison of monthly averaged tropopause folding frequencies (sum of shallow, medium, and deep events) between our dataset (2014–2023, y axis) and the ETH Zürich dataset (1980–2014, x axis) for (a) winter, (b) spring, (c) summer, and (d) autumn. The black dashed line is the 1:1 line. A random 50 % subset of points is displayed for a better visualization.
We continued to utilize the monthly folding dataset from ETH Zürich (http://eraiclim.ethz.ch/prot/folds.html, last access: 21 September 2025) spanning 1980–2014 to quantitatively validate our dataset (Fig. 4). It can be seen that these two datasets exhibit a strong spatial correlation. A maximum correlation of 0.95 was observed in spring (Fig. 4b), the season with the highest folding frequency. The other seasons also showed strong correlations, with coefficients all exceeding 0.9, confirming the high spatial agreement between these two datasets. However, Fig. 4 also shows that most of the data points from our dataset lie below the 1:1 line, indicating our dataset consistently reports lower folding frequencies than the ETH dataset. Specifically, the fitted line for December had the minimum slope of 0.62, indicating that our dataset predicts substantially lower frequencies than the ETH dataset during that month. This result contrasts with our previous findings showing that our dataset detects more folds than that of Lin et al. (2024). This discrepancy is likely attributable to the different time periods and the different resolutions of the meteorological data used in these studies. The ETH dataset was derived from the 1° ERA-Interim reanalysis data with 60 model levels. The higher vertical resolution of the reanalysis data underlying the ETH dataset likely explains its higher folding frequencies compared to our results derived from data with 37 pressure levels. However, our dataset features higher temporal (1 h) and horizontal (0.25°) resolutions. In contrast, the dataset of Lin et al. (2024) uses the 1° ERA5 reanalysis data with 37 pressure levels. As a result, although the vertical resolution is the same, the folding frequency reported by Lin et al. (2024) is lower than ours, likely due to the coarser horizontal resolution of their reanalysis data.
3.2 Validation of the Dataset by Case Studies
Apart from comparing our dataset's results with those from global studies, we adopted three existing case studies on tropopause folding events at the monthly, daily, and hourly timescales to further verify the reliability of our dataset.
3.2.1 Monthly Changes in Tropopause Folds on the Tibetan Plateau in 2017
The Tibetan Plateau (TP), known as the “Roof of the World”, exerts a strong influence on the atmospheric circulation due to its distinctive topographic features (Yang et al., 2022; Ren et al., 2021). It is also a key region for deep STT (Sprenger et al., 2003; Škerlak et al., 2014, 2015). Yin et al. (2023) presented the monthly averaged frequency of total tropopause folds over the TP from April to July 2017. We thus used these results in the monthly scale to validate our dataset.
Figure 5 shows the folding frequency (sum of shallow, medium, and deep events) distributions from April to July 2017, derived from our dataset. They align closely with those reported by Yin et al. (2023). In April (Fig. 5a), folding events predominantly occurred between 25 and 30° N, adjacent to the westerly jet. The primary distribution regions were found to be the northwestern part of South Asia and the southern and central TP. In May (Fig. 5b), the folds shifted northward simultaneously with the westerly jet, concentrating near 30° N. This northward migration continued in June (Fig. 5c), as high-frequency folding regions moved to 32–38° N. In July (Fig. 5d), the primary folding zone shifted further north to 35–45° N. The movement of the high folding frequency zones matched the northward shift of the westerly jet during this period, suggesting that the tropopause folding displacement over the TP might be regulated by the movement of the westerly jet (Luo et al., 2019; Chen et al., 2011).
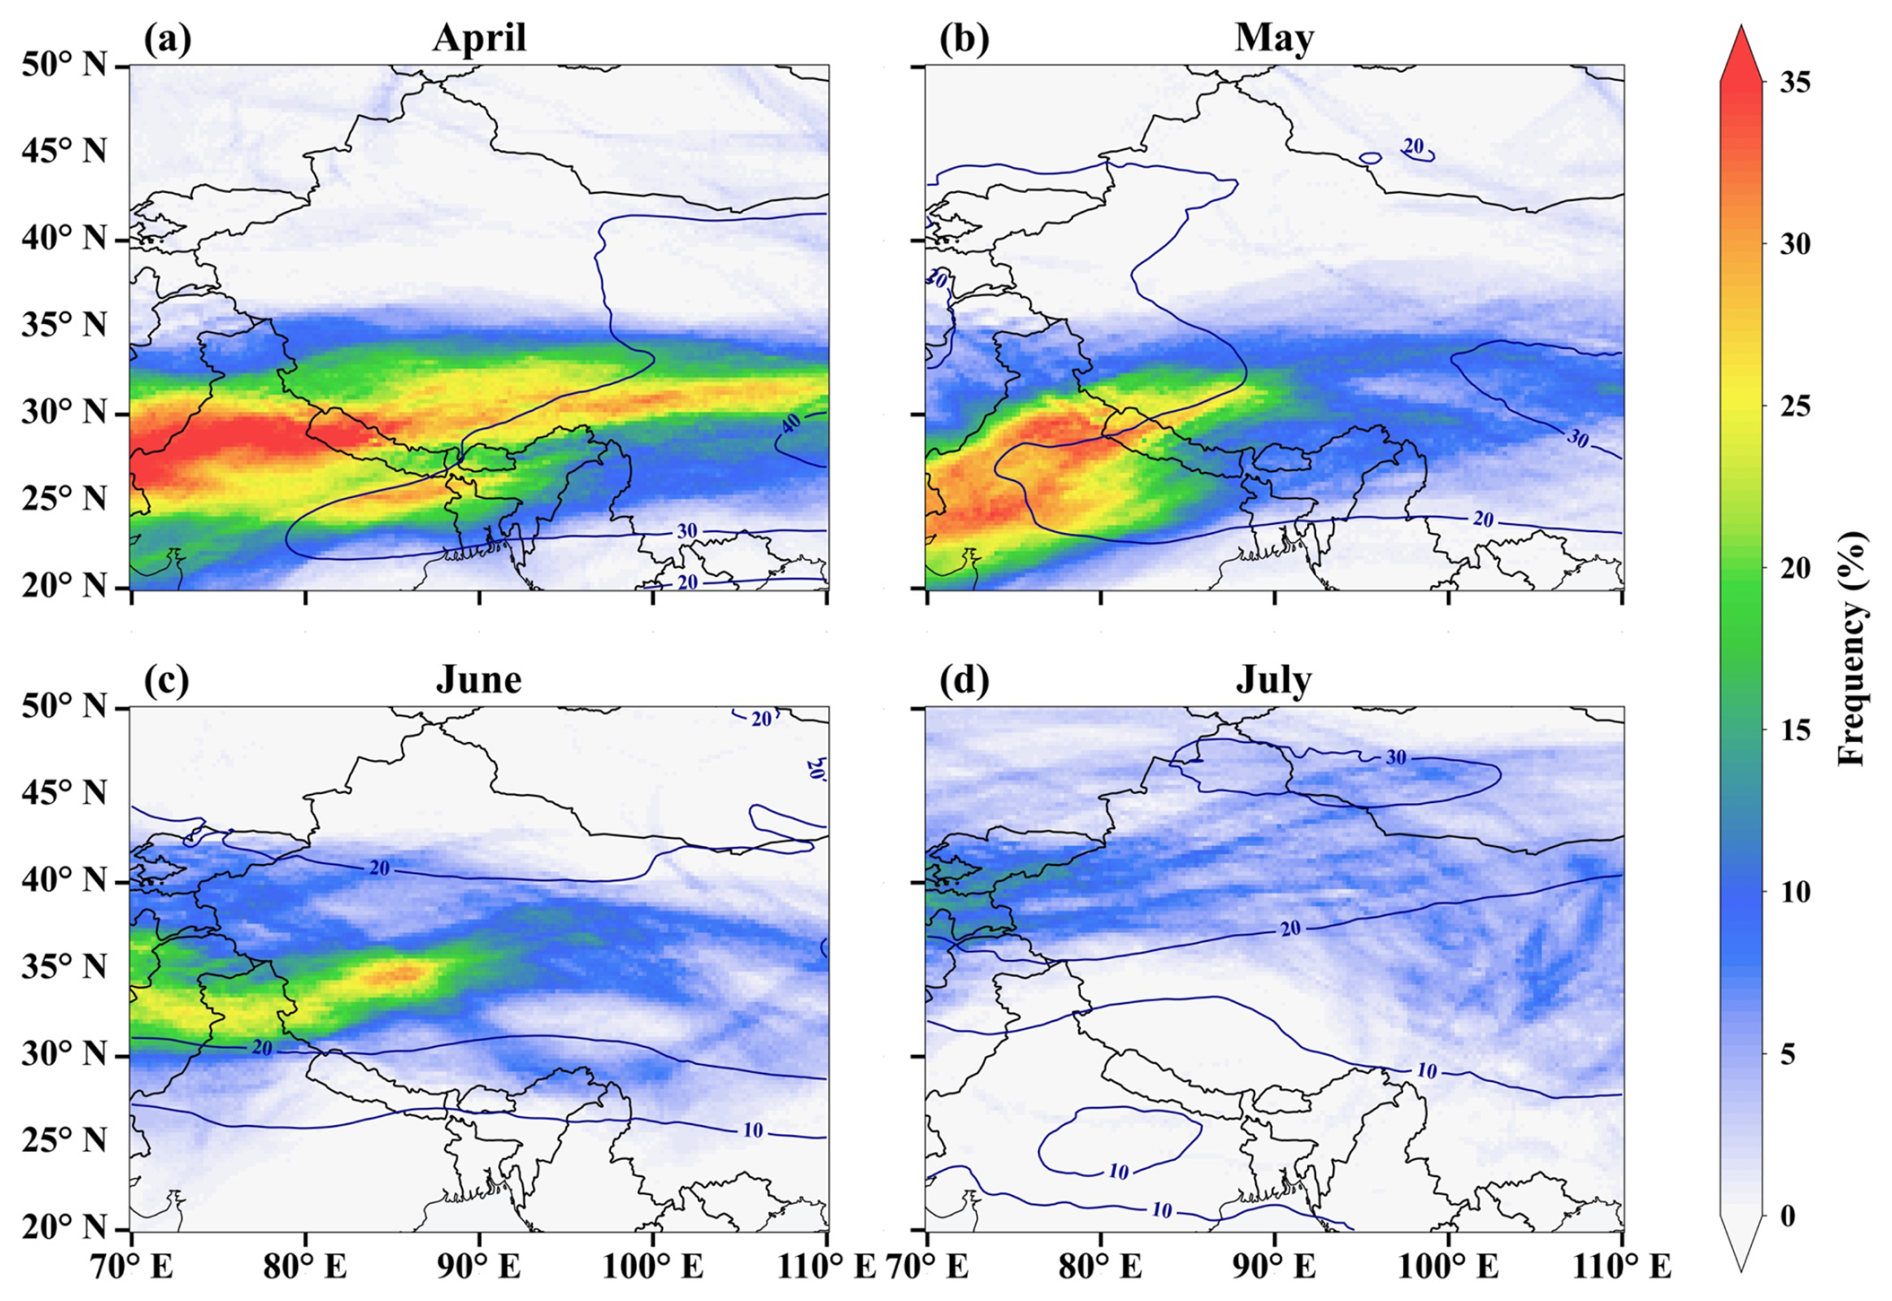
Figure 5Monthly averaged tropopause folding frequencies (%, sum of shallow, medium, and deep events) on the TP in 2017 for (a) April, (b) May, (c) June, and (d) July. Contour lines show 250 hPa wind speed (m s−1).
After the comparison, we continued to investigate the properties of total fold, sfold, mfold and dfold on the TP. Note that the total fold here encompasses all folding events, including shallow, medium, and deep folds, as well as very shallow folding events with Δp<50 hPa. Figure 6 shows the monthly variations of the folding frequencies for the year 2017 and the whole 10-year period (2014–2023), respectively. It is seen in Fig. 6a that the frequency of the total fold in 2017 reaches the highest in spring and the lowest in summer. Because the frequency of the total fold is primarily determined by sfold, which accounts for 48%, the monthly variation of sfold is similar to that of the total fold. In contrast, the monthly variations of mfold and dfold are significantly different from those of fold and sfold. In 2017, mfold peaks in January and October, and dfold occurs exclusively in time periods of January–March and December. In terms of the 10-year's average (Fig. 6b), the total fold and sfold still show high consistency, but their peaks were found in May rather than in April. With respect to mfold and dfold, mfold still peaks in January and reaches its minimum in April. The dfold was also found to occur more frequently in winter, peaking in January, and less frequently in summer and autumn. Compared to the data for 2017, the 10-year averaged results show less fluctuations in the monthly variations especially for the total fold and sfold, because the influence of short-term folding events is smoothed out. As a result, the long-term characteristics of folds on the TP can be displayed by our dataset, which are more representative. This is also why we proposed this multi-year high-resolution folding dataset in this study, to indicate the long-term characteristics of different types of folds over China and its surrounding regions.
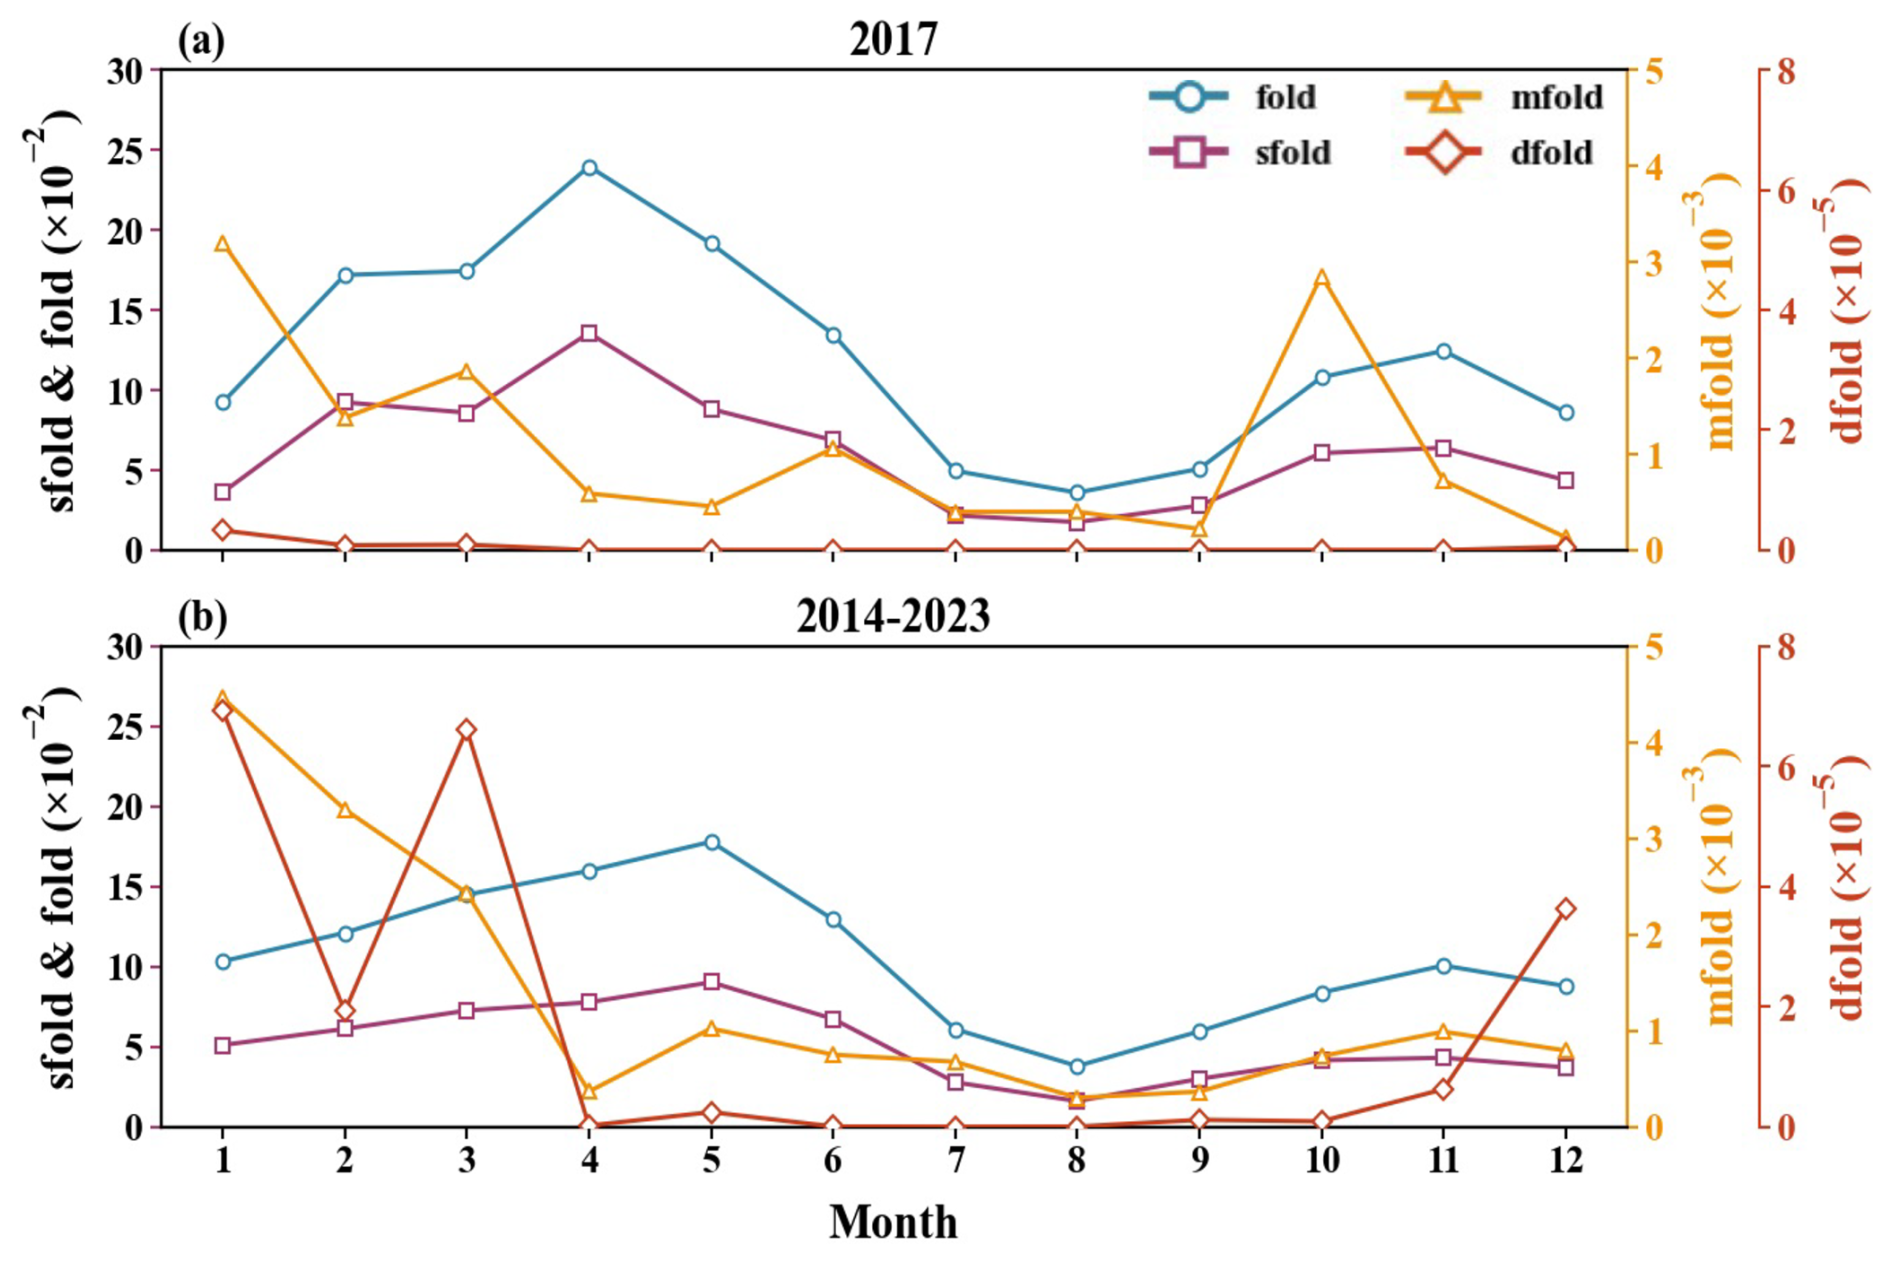
Figure 6Monthly variation in the occurrence frequency of different fold types over the TP. (a) The year 2017; (b) the 2014–2023 average. Frequencies were spatially averaged over the plateau for each month. Note that fold here includes very shallow folding events with Δp<50 hPa.
3.2.2 A Stratospheric Intrusion Event over the North China Plain in May 2019
We next examined the folding results during a stratospheric intrusion event, which is a transient manifestation of STT, over the North China Plain (NCP), as reported by Luo et al. (2024). This event occurred on 19–20 May 2019 (Beijing Time, BJT) and was suggested to be driven by the Northeast Cold Vortex (NECV), a typical cold low vortex system in East Asia (Xue et al., 2022; Lian et al., 2016). Because tropopause fold was suggested to be the major mechanism driving the stratospheric intrusion, we used this event to further demonstrate the reliability of our dataset and investigate the association between the tropopause folds and meteorological conditions.
In the study of Luo et al. (2024), a substantial downward folding of the tropopause over the NCP on 19–20 May 2019 was identified, reaching a depth of 500–600 hPa. It denotes the occurrence of deep folds during this stratospheric intrusion event. Therefore, we present the distributions of mfold and dfold frequencies over the NCP for these two days (Fig. 7). In general, we found notable medium and deep folding events occurring on the NCP during this intrusion period. The locations of high folding frequency regions shown by our dataset are in good consistency with the locations of the tropopause folds reported by Luo et al. (2024). On 19 May (Fig. 7a–b), medium and deep folds were concentrated primarily between 39–42° N and 110–120° E. Compared to mfold (Fig. 7a), dfold exhibited a distribution shifted further east and south (Fig. 7b), with its center located at 39° N. On 20 May (Fig. 7c–d), the spatial extent of the folds contracted, and the distributions of both types shifted southeastward, concentrating within 37–39° N and 116–120° E. The successful detection of both medium and deep folds during this stratospheric intrusion event demonstrates our dataset's capability to accurately capture these phenomena. This, in turn, enables in-depth analysis of the stratosphere-troposphere transport.
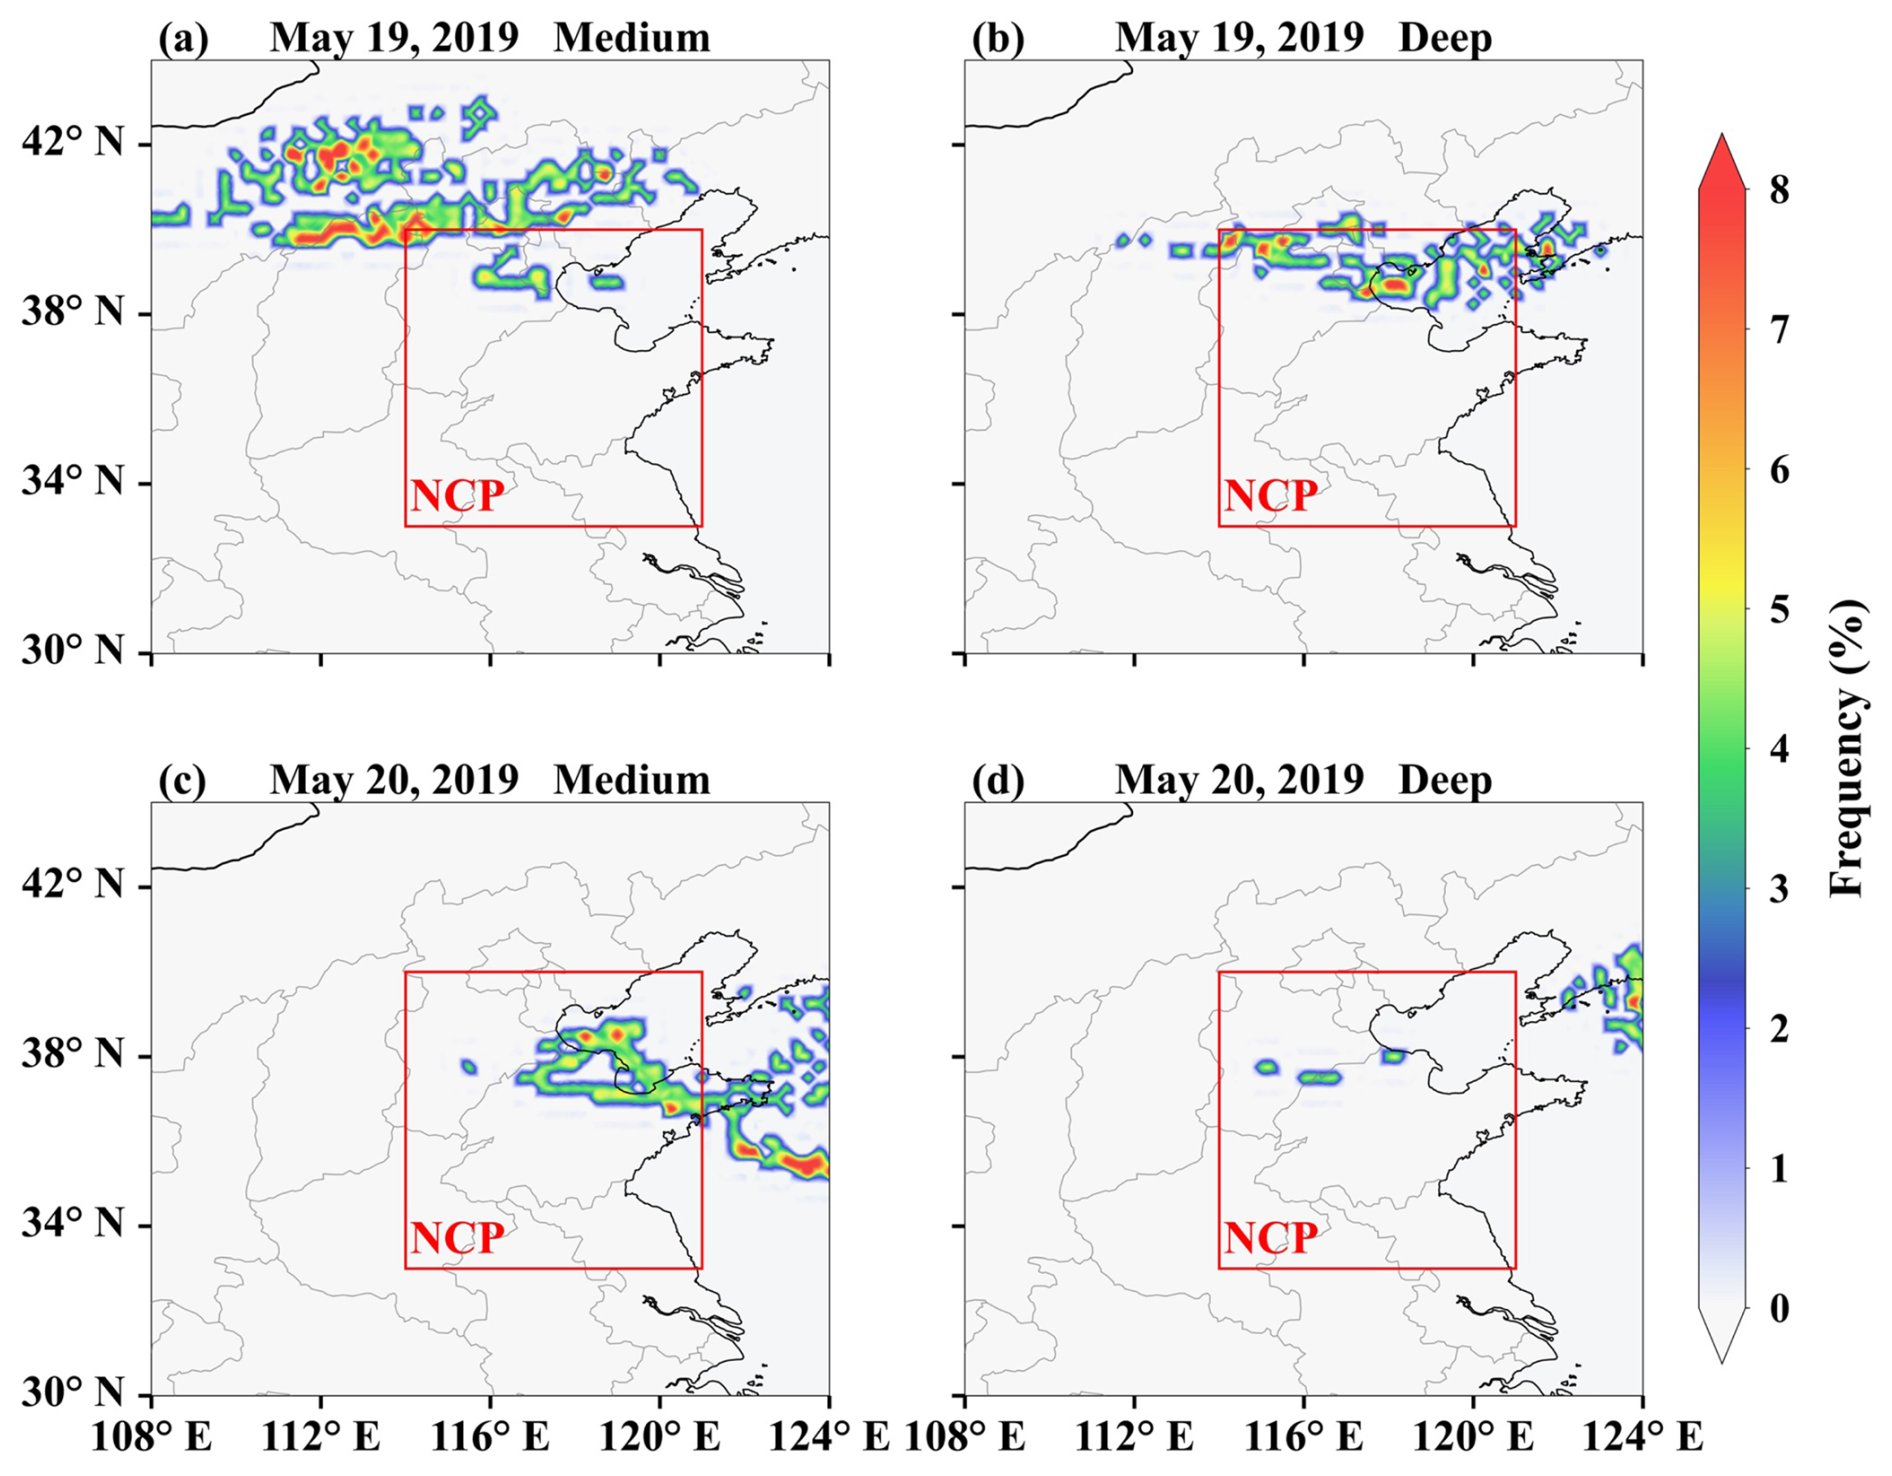
Figure 7Spatial distributions of (a, c) medium and (b, d) deep tropopause folds over the NCP on (a, b) 19 May and (c, d) 20 May 2019 (BJT). The red box outlines the NCP.
After comparing the distributions of tropopause folds, we next conducted a deeper analysis of this case based on our dataset. Figures S2 (02:00–12:00, 19 May) and 8 (14:00, 19 May–10:00, 20 May) show the distributions of mfold and dfold as well as the upper-level weather patterns (200 hPa) over the NCP. It was found in Fig. S2 that between 02:00 and 12:00 on 19 May, a trough gradually migrated eastward, and the folding region also shifted correspondingly from the western to the northern NCP. At 14:00 (Fig. 8a), the trough had moved to the northern NCP, where mfold were found. Afterward, the trough continued its eastward movement (Fig. 8b–c), and dfold were subsequently formed in the northern NCP accordingly. On 20 May (Fig. 8d–f), both the trough and the folding regions further moved eastward and gradually departed from the NCP. Based on the complete evolution of the event, we found that the vast majority of medium and deep folds initially formed on the western flank of the trough, and the folding region shifted eastward with the eastward movement of the trough. Thus, we identified the trough as the primary driving factor of medium and deep tropopause folds during this event. This mechanism is also consistent with the conclusion achieved by Luo et al. (2024) and is attributed to the strong downdrafts formed near the trough, which can enhance the fold formation (Luo et al., 2024; Zhao et al., 2021; Langford, 1999). Regarding the small portion of dfold on the eastern flank of the trough (e.g., Fig. 8d), we attribute this feature to the eastward advection of folds after their formation, driven by strong upper-level westerly winds. Due to the high temporal resolution and extensive temporal coverage of our dataset, the complete evolution of this event including its details can be successfully captured and analyzed.
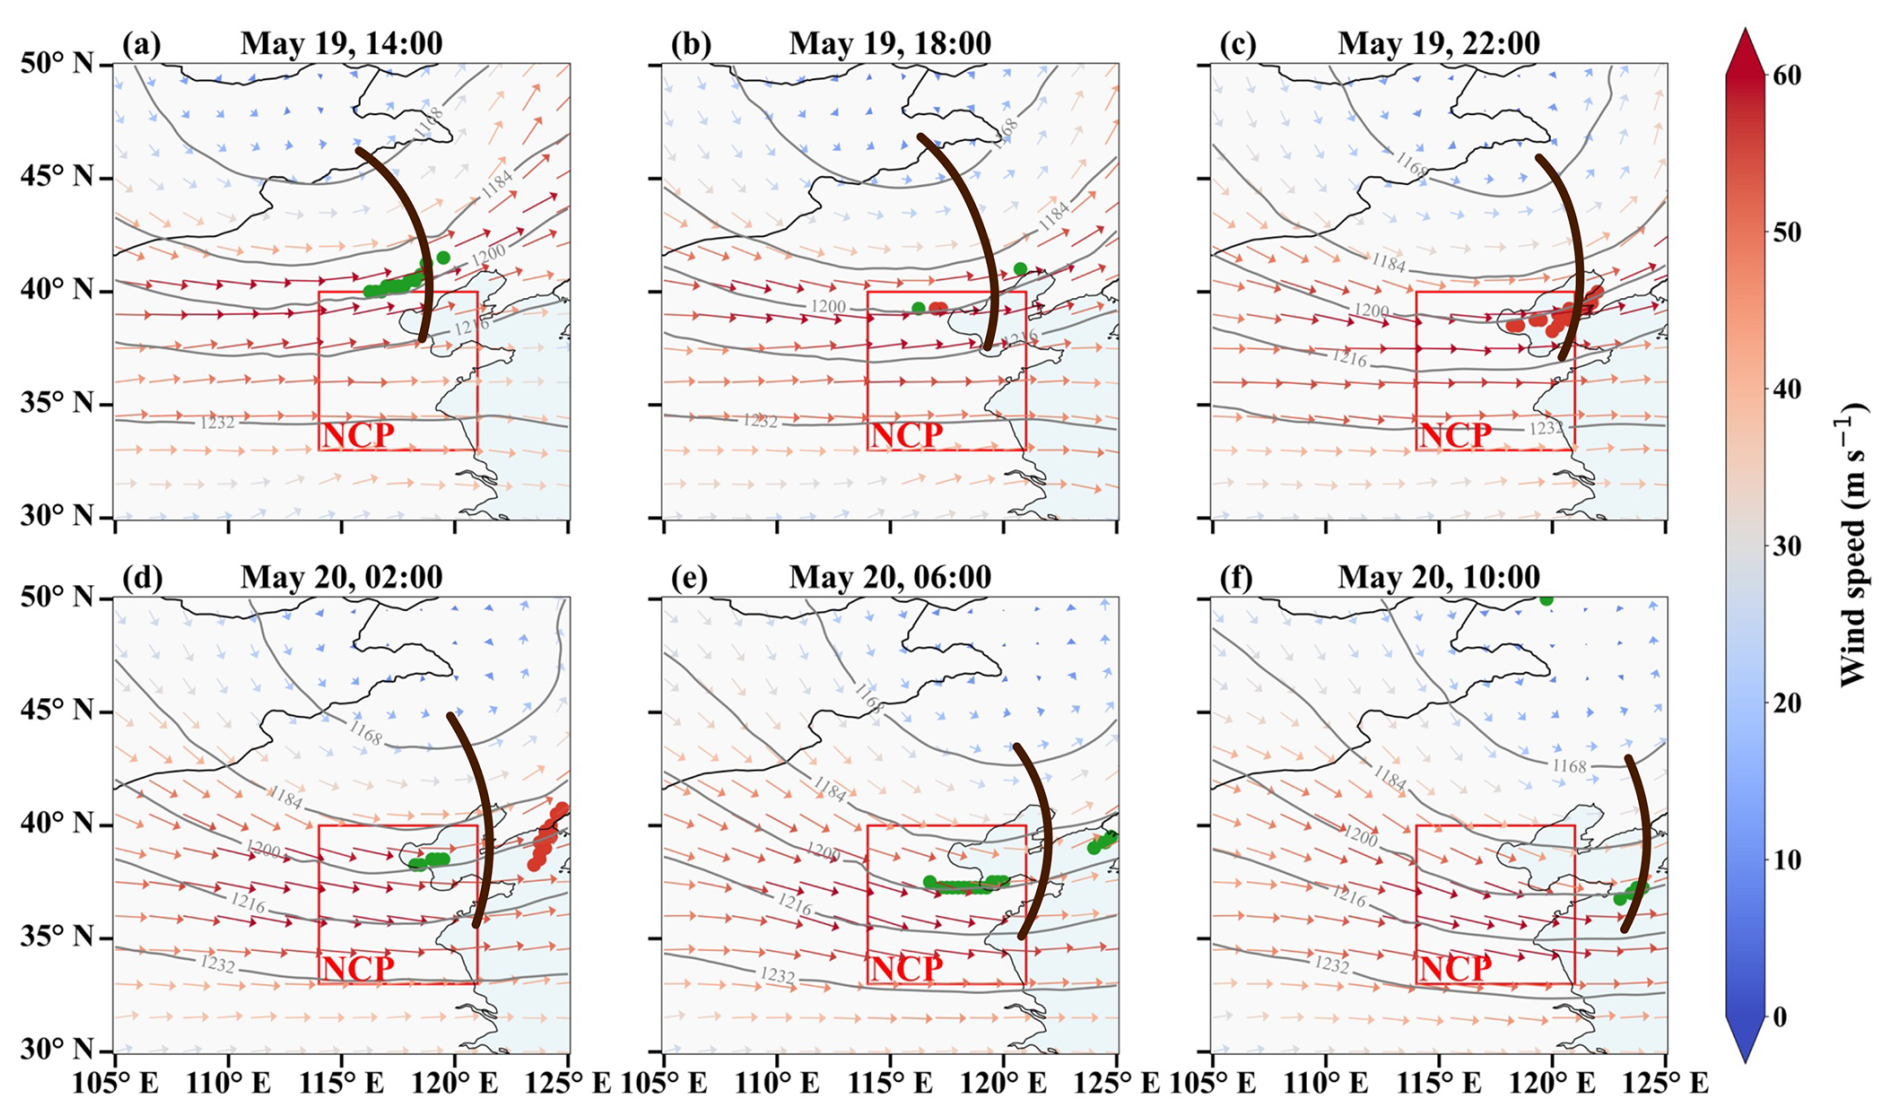
Figure 8Spatiotemporal evolution of medium and deep tropopause folds over the NCP on (a–c) 19 May 19 and (d–f) 20 May 2019 (BJT), shown at 4 h intervals. Colors indicate fold type (green: medium, red: deep). Wind vectors (arrows) show 200 hPa wind speed and direction, scaled by color and length. Brown lines represent the upper-level trough, and the red box delineates the NCP. Gray solid lines indicate contours of the 200 hPa geopotential height (unit: dagpm).
3.2.3 A Stratospheric Intrusion Event over the Tibetan Plateau and the Sichuan Basin in February 2016
Zhang et al. (2025) reported the occurrence of a stratospheric intrusion event on the TP and the Sichuan Basin (SCB) during 11–12 February 2016 (BJT) and they suggested it as the primary cause of the anomalous ozone surge in this region. This event serves as a critical case study for short-duration stratospheric intrusions, highlighting their capacity to rapidly and substantially impact surface air quality in southwestern China. Consequently, we investigated the distributions of tropopause folds during this period using our dataset.
In Zhang et al. (2025)'s study, they reported that between 11–12 February, within the region 90–100° E, 26–30° N, the tropopause underwent noticeable folding and descended to the top of the boundary layer. Thus, we present the distributions of three fold types over the TP and the SCB on 11 February (Fig. S3) and 12 February (Fig. 9) from our dataset. On 11 February (Fig. S3), widespread shallow folds occurred across the eastern TP and the SCB within 26–32° N. Simultaneously, medium folds were formed in the southeastern corner of the TP and along the southern flank of the SCB. On 12 February (Fig. 9), the spatial extent of the shallow folds had diminished, compared with that on 11 February. Between 14:00 (Fig. 9a) and 20:00 (Fig. 9d), shallow folds were primarily concentrated between 28 and 31° N. In contrast, the spatial extent of medium folds increased on 12 February (see regions shaded in green in Fig. 9) relative to its extent on 11 February. These two folds predominantly occurred across the southern flank of the SCB and adjacent areas. Scattered medium folds were also observed near 28° N along the eastern periphery of the TP. With respect to the deep folds, they were found to emerge mainly to the south of the SCB at 18:00 (see regions shaded in red in Fig. 9c). Subsequently, the deep folds propagated eastward along with the medium folds, and the center of the deep folds reached 108° E by 20:00 (see Fig. 9d). The distributions of these tropopause folds at different times revealed by our dataset are also in good agreement with the locations reported by Zhang et al. (2025). This correspondence further confirms that our dataset can successfully capture the folding events associated with the stratospheric intrusion.
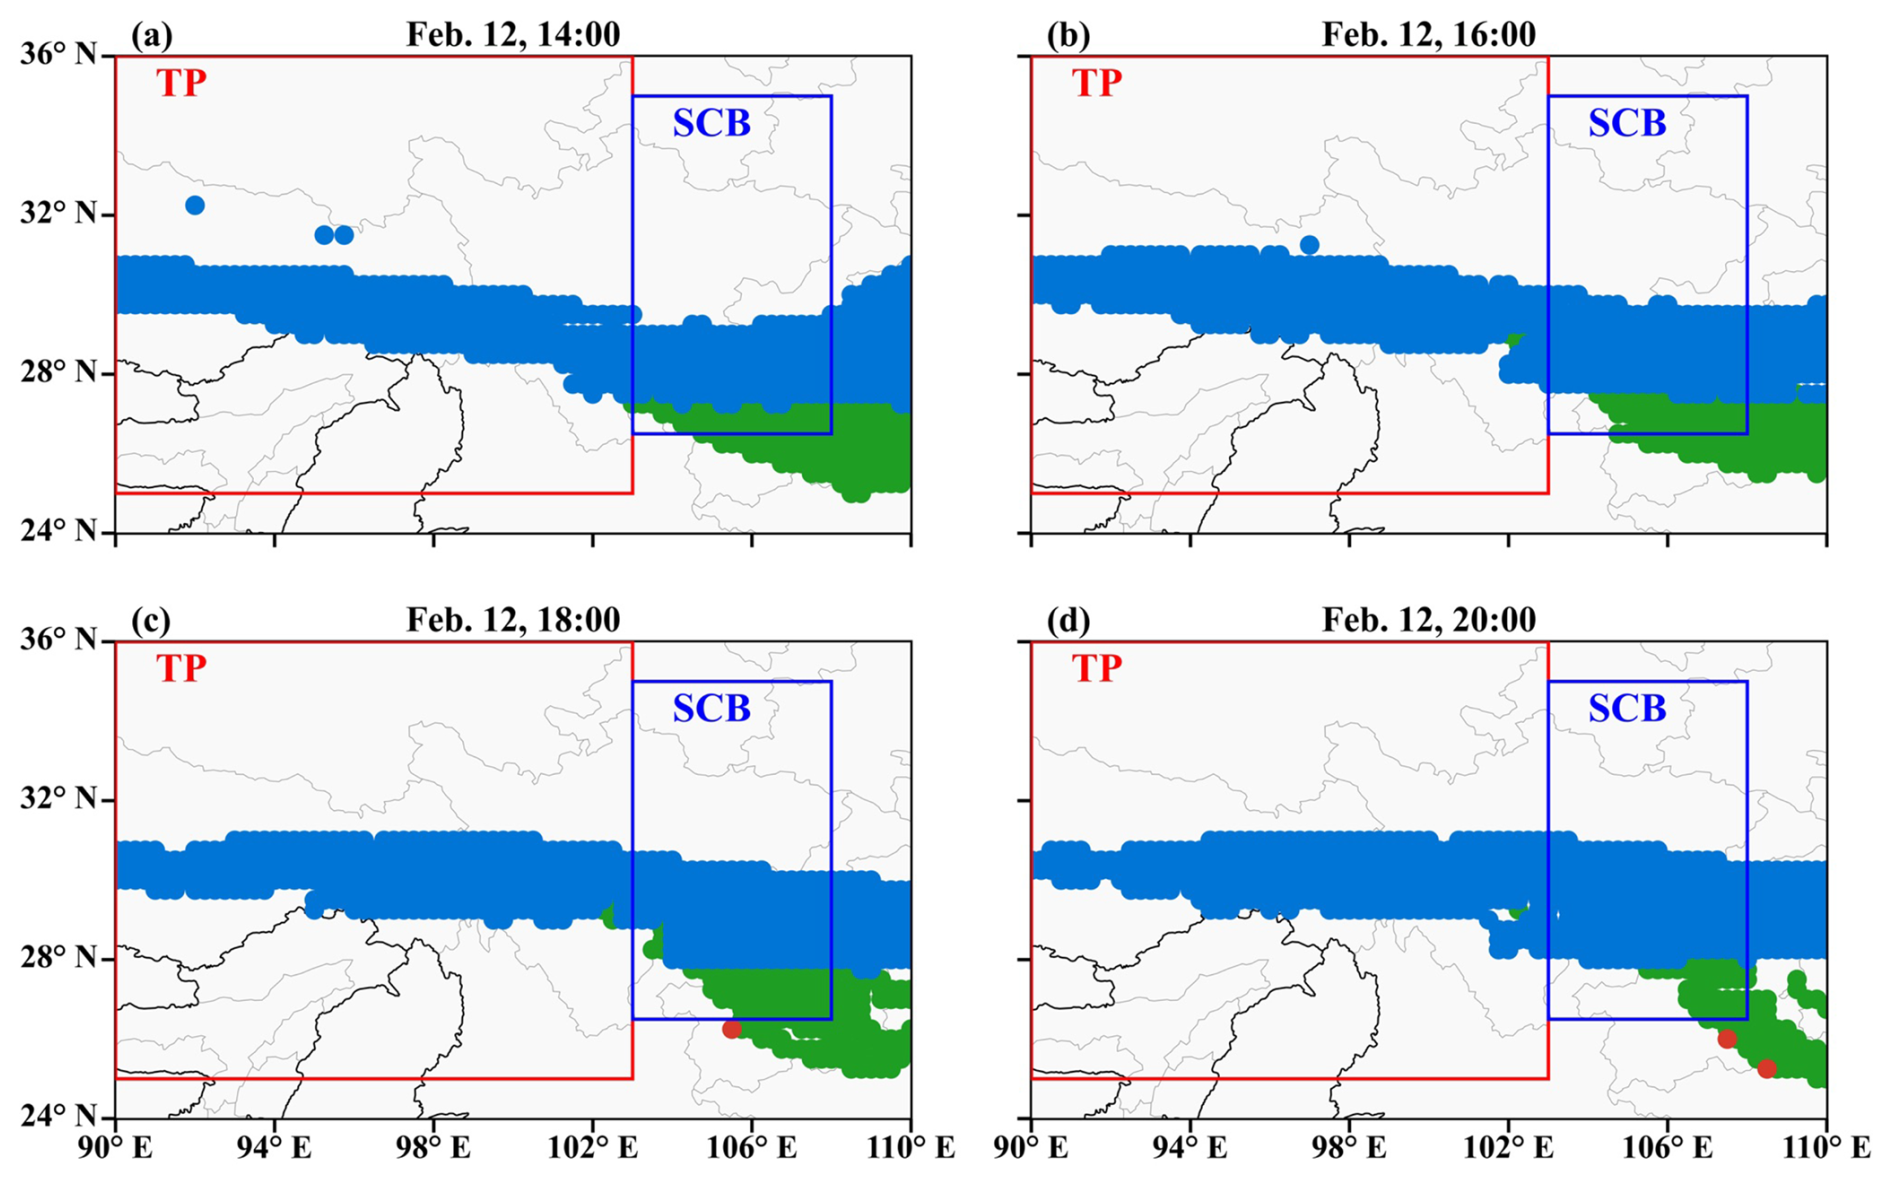
Figure 9Distribution of shallow (blue), medium (green), and deep (red) tropopause folds over the SCB and TP on 12 February, 2016. (a–d) 14:00, 16:00, 18:00, and 20:00 BJT. The SCB and TP are outlined by blue and red boxes, respectively.
The dataset of tropopause folds generated in this study is available in the Zenodo repository (https://doi.org/10.5281/zenodo.17446871, Cao et al., 2025).
In this study, we developed a high-resolution tropopause folding dataset for China and its surrounding regions using the ERA5 meteorological reanalysis data and a three-dimensional labeling method. The dataset spans a decade from 2014 to 2023, covering a spatial domain of 50–140° E and 0–70° N with a horizontal resolution of 0.25° and an hourly temporal resolution.
To validate the dataset's accuracy, we conducted a comprehensive assessment from two perspectives: overall climatological characteristics and individual case studies. In terms of overall characteristics, we compared the spatial distributions and occurrence frequencies of three fold types (shallow, medium, and deep) with those reported in previous global studies (Lin et al., 2024; Borhani et al., 2022; Akritidis et al., 2021; Škerlak et al., 2015; Sprenger et al., 2003). The results showed that the distribution patterns of folds in our dataset are highly consistent with those in previous studies. Furthermore, owing to its high resolution, our dataset can more clearly resolve the detailed features of fold distributions and identify regions with high folding frequencies. For the case studies, we analyzed three events spanning monthly, daily, and hourly timescales (Yin et al., 2023; Luo et al., 2024; Zhang et al., 2025), and all the results provided by our dataset demonstrated a high degree of consistency with the previous researches. These case studies also confirm that our dataset can reliably capture the detailed evolution of tropopause folds during the stratospheric intrusion events, providing a solid foundation for subsequent process studies of these events. Thus, the dataset proposed in this study exhibits high precision and reliability, so that it enables in-depth studies of tropopause folding events and facilitates a better understanding of the mechanisms underlying the stratospheric intrusion.
Aside from these advantages, the current dataset still has some limitations. Future work should focus on expanding the temporal and spatial coverage to encompass longer periods and broader regions. Additionally, we plan to integrate this dataset with data of atmospheric constituent concentrations and weather systems. This would enable a more comprehensive investigation of the impacts of tropopause folds on atmospheric composition, air quality, and regional weather systems, thereby further enhancing the scientific value of this resource.
The supplement related to this article is available online at https://doi.org/10.5194/essd-18-2689-2026-supplement.
LC conceptualized the study and supervised the entire research process. YY conducted the simulations and processed the data. LX, MW, QY and YZ contributed to the interpretation of the results. TZ, XL and JM assisted with the data analysis and manuscript preparation. TZ provided valuable insights into the model results. All authors discussed the results and contributed to the final manuscript.
The contact author has declared that none of the authors has any competing interests.
Publisher's note: Copernicus Publications remains neutral with regard to jurisdictional claims made in the text, published maps, institutional affiliations, or any other geographical representation in this paper. The authors bear the ultimate responsibility for providing appropriate place names. Views expressed in the text are those of the authors and do not necessarily reflect the views of the publisher.
The authors would like to thank the National Supercomputer Center in Tianjin and High Performance Computing Center at the Nanjing University of Information Science and Technology to provide the high-performance computing system for calculations.
This study is funded by the National Key Research and Development Program of China (grant no. 2022YFC3701204), the National Natural Science Foundation of China (grant no. 41705103), and the 2023 Outstanding Young Backbone Teacher of Jiangsu “Qinglan” Project (grant no. R2023Q02).
This paper was edited by Graciela Raga and reviewed by three anonymous referees.
Akritidis, D., Zanis, P., Pytharoulis, I., Mavrakis, A., and Karacostas, T.: A Deep Stratospheric Intrusion Event down to the Earth's Surface of the Megacity of Athens, Meteorol. Atmos. Phys., 109, 9–18, https://doi.org/10.1007/s00703-010-0096-6, 2010. a
Akritidis, D., Pozzer, A., Zanis, P., Tyrlis, E., Škerlak, B., Sprenger, M., and Lelieveld, J.: On the role of tropopause folds in summertime tropospheric ozone over the eastern Mediterranean and the Middle East, Atmos. Chem. Phys., 16, 14025–14039, https://doi.org/10.5194/acp-16-14025-2016, 2016. a, b
Akritidis, D., Pozzer, A., Flemming, J., Inness, A., and Zanis, P.: A Global Climatology of Tropopause Folds in CAMS and MERRA-2 Reanalyses, J. Geophys. Res.-Atmos., 126, e2020JD034115, https://doi.org/10.1029/2020JD034115, 2021. a, b, c, d, e, f, g, h
Antonescu, B., Vaughan, G., and Schultz, D. M.: A Five-Year Radar-Based Climatology of Tropopause Folds and Deep Convection over Wales, United Kingdom, Mon. Weather Rev., 141, 1693–1707, https://doi.org/10.1175/mwr-d-12-00246.1, 2013. a, b
Archer, C. L. and Caldeira, K.: Historical Trends in the Jet Streams, Geophys. Res. Lett., 35, 2008GL033614, https://doi.org/10.1029/2008GL033614, 2008. a, b
Bartusek, S., Wu, Y., Ting, M., Zheng, C., Fiore, A., Sprenger, M., and Flemming, J.: Higher-Resolution Tropopause Folding Accounts for More Stratospheric Ozone Intrusions, Geophys. Res. Lett., 50, e2022GL101690, https://doi.org/10.1029/2022GL101690, 2023. a
Borhani, R., Ahmadi-Givi, F., Ghader, S., and Mohebalhojeh, A. R.: A Climatological-Dynamical Analysis of Tropopause Folds over Southwest Asia in the Period of 1989–2018, Dynam. Atmos. Oceans, 98, 101300, https://doi.org/10.1016/j.dynatmoce.2022.101300, 2022. a, b, c
Browning, K. A. and Reynolds, R.: Diagnostic Study of a Narrow Cold-Frontal Rainband and Severe Winds Associated with a Stratospheric Intrusion, Q. J. Roy. Meteor. Soc., 120, 235–257, https://doi.org/10.1002/qj.49712051602, 1994. a
Cao, L., Yang, Y., Wang, M., Xu, L., Zhang, T., Lei, X., and Zhao, T.: A High-Resolution Tropopause Folding Dataset over China from 2014–2023, Zenodo [data set], https://doi.org/10.5281/zenodo.17446871, 2025. a, b
Chen, X. L., Ma, Y. M., Kelder, H., Su, Z., and Yang, K.: On the behaviour of the tropopause folding events over the Tibetan Plateau, Atmos. Chem. Phys., 11, 5113–5122, https://doi.org/10.5194/acp-11-5113-2011, 2011. a
Cooper, O., Forster, C., Parrish, D., Dunlea, E., Hübler, G., Fehsenfeld, F., Holloway, J., Oltmans, S., Johnson, B., Wimmers, A., and Horowitz, L.: On the Life Cycle of a Stratospheric Intrusion and Its Dispersion into Polluted Warm Conveyor Belts, J. Geophys. Res.-Atmos., 109, https://doi.org/10.1029/2003jd004006, 2004. a
Cooper, O. R., Stohl, A., Hübler, G., Hsie, E. Y., Parrish, D. D., Tuck, A. F., Kiladis, G. N., Oltmans, S. J., Johnson, B. J., Shapiro, M., Moody, J. L., and Lefohn, A. S.: Direct Transport of Midlatitude Stratospheric Ozone into the Lower Troposphere and Marine Boundary Layer of the Tropical Pacific Ocean, J. Geophys. Res.-Atmos., 110, 2005JD005783, https://doi.org/10.1029/2005JD005783, 2005. a
Danielsen, E. F. and Mohnen, V. A.: Project Dustorm Report: Ozone Transport, in Situ Measurements, and Meteorological Analyses of Tropopause Folding, J. Geophys. Res., 82, 5867–5877, https://doi.org/10.1029/jc082i037p05867, 1977. a
Hersbach, H., Bell, B., Berrisford, P., Hirahara, S., Horányi, A., Muñoz-Sabater, J., Nicolas, J., Peubey, C., Radu, R., Schepers, D., Simmons, A., Soci, C., Abdalla, S., Abellan, X., Balsamo, G., Bechtold, P., Biavati, G., Bidlot, J., Bonavita, M., De Chiara, G., Dahlgren, P., Dee, D., Diamantakis, M., Dragani, R., Flemming, J., Forbes, R., Fuentes, M., Geer, A., Haimberger, L., Healy, S., Hogan, R. J., Hólm, E., Janisková, M., Keeley, S., Laloyaux, P., Lopez, P., Lupu, C., Radnoti, G., de Rosnay, P., Rozum, I., Vamborg, F., Villaume, S., and Thépaut, J.-N.: The ERA5 Global Reanalysis, Q. J. Roy. Meteor. Soc., 146, 1999–2049, https://doi.org/10.1002/qj.3803, 2020. a
Holton, J. R., Haynes, P. H., McIntyre, M. E., Douglass, A. R., Rood, R. B., and Pfister, L.: Stratosphere-Troposphere Exchange, Rev. Geophys., 33, 403–439, https://doi.org/10.1029/95rg02097, 1995. a, b
Hong, J., Wang, H., Wang, W., Zhu, J., Deng, H., and Wang, H.: Impacts of Stratosphere-to-Troposphere Transport on Tropospheric Ozone in Southeastern China: Insights from Ozonesonde Observations, Environ. Res. Lett., 19, 064068, https://doi.org/10.1088/1748-9326/ad4ef9, 2024. a
Knowland, K. E., Ott, L. E., Duncan, B. N., and Wargan, K.: Stratospheric Intrusion-Influenced Ozone Air Quality Exceedances Investigated in the NASA MERRA-2 Reanalysis, Geophys. Res. Lett., 44, https://doi.org/10.1002/2017gl074532, 2017. a
Langford, A., Senff, C., Alvarez, R., Brioude, J., Cooper, O., Holloway, J., Lin, M., Marchbanks, R., Pierce, R., Sandberg, S., Weickmann, A., and Williams, E.: An Overview of the 2013 Las Vegas Ozone Study (LVOS): Impact of Stratospheric Intrusions and Long-Range Transport on Surface Air Quality, Atmos. Environ., 109, 305–322, https://doi.org/10.1016/j.atmosenv.2014.08.040, 2015. a, b
Langford, A. O.: Stratosphere-Troposphere Exchange at the Subtropical Jet: Contribution to the Tropospheric Ozone Budget at Midlatitudes, Geophys. Res. Lett., 26, 2449–2452, https://doi.org/10.1029/1999GL900556, 1999. a
Li, L., Tian, W., Zhang, J., Li, J., Luo, J., and Tian, H.: Characteristics of Summer Tropopause Folds over Southeastern Central Asia and Their Influences on Precipitation, Atmos. Res., 289, 106747, https://doi.org/10.1016/j.atmosres.2023.106747, 2023. a
Lian, Y., Shen, B., Li, S., Liu, G., and Yang, X.: Mechanisms for the Formation of Northeast China Cold Vortex and Its Activities and Impacts: An Overview, J. Meteorol. Res.-PRC, 30, 881–896, https://doi.org/10.1007/s13351-016-6003-4, 2016. a
Liang, T., Luo, J., Zhang, C., Tian, H., Bai, Z., Bian, J., Wang, Z., Luo, F., Zhu, F., Mao, L., He, X., Wang, S., Zhang, K., and Zhang, J.: The Impact of Tropopause Fold Event on Surface Ozone Concentration over Tibetan Plateau in July, Atmos. Res., 298, 107156, https://doi.org/10.1016/j.atmosres.2023.107156, 2024. a, b, c
Lin, M., Fiore, A. M., Horowitz, L. W., Langford, A. O., Oltmans, S. J., Tarasick, D., and Rieder, H. E.: Climate Variability Modulates Western US Ozone Air Quality in Spring via Deep Stratospheric Intrusions, Nat. Commun., 6, https://doi.org/10.1038/ncomms8105, 2015. a
Lin, Y., Tian, W., Xue, H., Luo, J., Zhang, J., Tian, H., and Liang, W.: Global Trends of Tropopause Folds in Recent Decades, Atmos. Ocean. Sc. Lett., 17, 100450, https://doi.org/10.1016/j.aosl.2023.100450, 2024. a, b, c, d, e, f, g, h, i, j, k, l
Luo, J., Liang, W., Xu, P., Xue, H., Zhang, M., Shang, L., and Tian, H.: Seasonal Features and a Case Study of Tropopause Folds over the Tibetan Plateau, Adv. Meteorol., 2019, 4375123, https://doi.org/10.1155/2019/4375123, 2019. a, b, c
Luo, Y., Zhao, T., Meng, K., Hu, J., Yang, Q., Bai, Y., Yang, K., Fu, W., Tan, C., Zhang, Y., Zhang, Y., and Li, Z.: A mechanism of stratospheric O3 intrusion into the atmospheric environment: a case study of the North China Plain, Atmos. Chem. Phys., 24, 7013–7026, https://doi.org/10.5194/acp-24-7013-2024, 2024. a, b, c, d, e, f
Meul, S., Langematz, U., Kröger, P., Oberländer-Hayn, S., and Jöckel, P.: Future changes in the stratosphere-to-troposphere ozone mass flux and the contribution from climate change and ozone recovery, Atmos. Chem. Phys., 18, 7721–7738, https://doi.org/10.5194/acp-18-7721-2018, 2018. a
Neu, J. L., Flury, T., Manney, G. L., Santee, M. L., Livesey, N. J., and Worden, J.: Tropospheric Ozone Variations Governed by Changes in Stratospheric Circulation, Nat. Geosci., 7, 340–344, https://doi.org/10.1038/ngeo2138, 2014. a
Raveh-Rubin, S. and Wernli, H.: Large-Scale Wind and Precipitation Extremes in the Mediterranean: Dynamical Aspects of Five Selected Cyclone Events, Q. J. Roy. Meteor. Soc., 142, 3097–3114, https://doi.org/10.1002/qj.2891, 2016. a
Ren, Q., Jiang, X., Zhang, Y., Li, Z., and Yang, S.: Effects of Suppressed Transient Eddies by the Tibetan Plateau on the East Asian Summer Monsoon, J. Climate, 34, 8481–8501, https://doi.org/10.1175/JCLI-D-20-0646.1, 2021. a
Schill, G. P., Froyd, K. D., Murphy, D. M., Williamson, C. J., Brock, C. A., Sherwen, T., Evans, M. J., Ray, E. A., Apel, E. C., Hornbrook, R. S., Hills, A. J., Peischl, J., Ryerson, T. B., Thompson, C. R., Bourgeois, I., Blake, D. R., DiGangi, J. P., and Diskin, G. S.: Widespread trace bromine and iodine in remote tropospheric non-sea-salt aerosols, Atmos. Chem. Phys., 25, 45–71, https://doi.org/10.5194/acp-25-45-2025, 2025. a
Shapiro, M. A.: Turbulent Mixing within Tropopause Folds as a Mechanism for the Exchange of Chemical Constituents between the Stratosphere and Troposphere, J. Atmos. Sci., 37, 994–1004, https://doi.org/10.1175/1520-0469(1980)037<0994:TMWTFA>2.0.CO;2, 1980. a
Škerlak, B., Sprenger, M., and Wernli, H.: A global climatology of stratosphere–troposphere exchange using the ERA-Interim data set from 1979 to 2011, Atmos. Chem. Phys., 14, 913–937, https://doi.org/10.5194/acp-14-913-2014, 2014. a
Škerlak, B., Sprenger, M., Pfahl, S., Tyrlis, E., and Wernli, H.: Tropopause Folds in ERA-Interim: Global Climatology and Relation to Extreme Weather Events, J. Geophys. Res.-Atmos., 120, 4860–4877, https://doi.org/10.1002/2014JD022787, 2015. a, b, c, d, e, f, g, h, i, j
Spreitzer, E., Attinger, R., Boettcher, M., Forbes, R., Wernli, H., and Joos, H.: Modification of Potential Vorticity near the Tropopause by Nonconservative Processes in the ECMWF Model, J. Atmos. Sci., 76, 1709–1726, https://doi.org/10.1175/jas-d-18-0295.1, 2019. a
Sprenger, M., Croci Maspoli, M., and Wernli, H.: Tropopause Folds and Cross-Tropopause Exchange: A Global Investigation Based upon ECMWF Analyses for the Time Period March 2000 to February 2001, J. Geophys. Res.-Atmos., 108, 2002JD002587, https://doi.org/10.1029/2002JD002587, 2003. a, b, c, d, e, f, g
Stohl, A., Bonasoni, P., Cristofanelli, P., Collins, W., Feichter, J., Frank, A., Forster, C., Gerasopoulos, E., Gäggeler, H., James, P., Kentarchos, T., Kromp-Kolb, H., Krüger, B., Land, C., Meloen, J., Papayannis, A., Priller, A., Seibert, P., Sprenger, M., Roelofs, G. J., Scheel, H. E., Schnabel, C., Siegmund, P., Tobler, L., Trickl, T., Wernli, H., Wirth, V., Zanis, P., and Zerefos, C.: Stratosphere-Troposphere Exchange: A Review, and What We Have Learned from STACCATO, J. Geophys. Res.-Atmos., 108, 2002JD002490, https://doi.org/10.1029/2002JD002490, 2003. a, b, c, d, e
Uccellini, L. W.: Processes Contributing to the Rapid Development of Extratropical Cyclones, in: Extratropical Cyclones, American Meteorological Society, Boston, MA, 81–105, ISBN 978-1-944970-33-8, https://doi.org/10.1007/978-1-944970-33-8_6, 1990. a
Wernli, H., Dirren, S., Liniger, M. A., and Zillig, M.: Dynamical Aspects of the Life Cycle of the Winter Storm “Lothar” (24–26 December 1999), Q. J. Roy. Meteor. Soc., 128, 405–429, https://doi.org/10.1256/003590002321042036, 2002. a
Williams, R. S., Hegglin, M. I., Kerridge, B. J., Jöckel, P., Latter, B. G., and Plummer, D. A.: Characterising the seasonal and geographical variability in tropospheric ozone, stratospheric influence and recent changes, Atmos. Chem. Phys., 19, 3589–3620, https://doi.org/10.5194/acp-19-3589-2019, 2019. a
Xue, D., Zhang, Y., Wang, P., Sun, F., and Yin, J.: Distinct Influences of Cold Vortex over Northeast China on Local Precipitation in Early Summer and Midsummer, Clim. Dynam., 59, 3701–3716, https://doi.org/10.1007/s00382-022-06291-4, 2022. a
Yang, M., Li, C., Luo, D., Yao, Y., Li, X., Chen, X., and Lu, Y.: Mechanical and Thermal Impacts of the Tibetan–Iranian Plateau on the North Pacific Storm Track: Numerical Experiments by FGOALS-f3-L, J. Geophys. Res.-Atmos., 127, e2021JD035659, https://doi.org/10.1029/2021JD035659, 2022. a
Yin, X., Rupakheti, D., Zhang, G., Luo, J., Kang, S., de Foy, B., Yang, J., Ji, Z., Cong, Z., Rupakheti, M., Li, P., Hu, Y., and Zhang, Q.: Surface ozone over the Tibetan Plateau controlled by stratospheric intrusion, Atmos. Chem. Phys., 23, 10137–10143, https://doi.org/10.5194/acp-23-10137-2023, 2023. a, b, c, d, e
Zhang, Y., Huang, Q., Guo, K., Wang, M., Liao, H., Chou, Y., and He, X.: Tropopause Folds over the Tibetan Plateau and Their Impact on Water Vapor in the Upper Troposphere-Lower Stratosphere, Clim. Dynam., 62, 1423–1437, https://doi.org/10.1007/s00382-023-06978-2, 2024. a
Zhang, Y., Zhao, T., Ning, G., Xu, X., Chen, Z., Jia, M., Sun, X., Shu, Z., Lu, Z., Liu, J., and Qie, X.: A Unique Mechanism of Ozone Surges Jointly Triggered by Deep Stratospheric Intrusions and the Tibetan Plateau Topographic Forcing, Geophys. Res. Lett., 52, e2024GL114207, https://doi.org/10.1029/2024GL114207, 2025. a, b, c, d, e, f
Zhao, K., Hu, C., Yuan, Z., Xu, D., Zhang, S., Luo, H., Wang, J., and Jiang, R.: A Modeling Study of the Impact of Stratospheric Intrusion on Ozone Enhancement in the Lower Troposphere over the Hong Kong Regions, China, Atmos. Res., 247, 105158, https://doi.org/10.1016/j.atmosres.2020.105158, 2021. a
Zhong, Y., Chen, Q., Zhou, X., Li, Y., Liao, Y., and Chen, Z.: Influence of Tropopause Folds on an Extreme Low Temperature Event in Eastern China in January 2021, Atmos. Res., 326, 108269, https://doi.org/10.1016/j.atmosres.2025.108269, 2025. a, b, c