the Creative Commons Attribution 4.0 License.
the Creative Commons Attribution 4.0 License.
 | 12 Jan 2026
The first road surface type dataset for 50 African countries and regions
Zixian Liu
Qi Zhou
Fayong Zhang
Prosper Basommi Laari
Road surface types not only influence the accessibility of road networks and socio-economic development but also serve as a critical data source for evaluating the United Nations Sustainable Development Goal (SDG) 9.1. Existing research indicates that Africa generally has a low road paved rate, which limits local socio-economic development. Although the International Road Federation (IRF) provides statistical data on paved road length and road paved rates for certain African countries, this data neither covers all African countries nor specifies the surface type of individual roads, making it challenging to support decision-making for improving Africa's road infrastructure. To address this gap, this study developed the first dataset for 50 African countries and regions, incorporating the surface type of every road. This was achieved using multi-source geospatial data and a tabular deep learning model. The core methodology involved designing 16 proxy indicators across three dimensions – derived from five open geospatial datasets (OpenStreetMap road data, GDP data, population distribution data, building height data, and land cover data) – to infer road surface types across Africa. Key findings include: the accuracy of the African road surface type dataset ranges from 77 % to 96 %, with F1 scores between 0.76 and 0.96. Total road length, paved road length, and road paved rates calculated from this dataset show high correlation (correlation coefficients: 0.69–0.94) with corresponding IRF statistics. Notably, the road paved rate also exhibits strong correlation with GNI per capita and the Human Development Index (HDI) (correlation coefficients: 0.80–0.83), validating the reliability of the dataset. Spatial analysis of African road paved rates at national, provincial, and county scales revealed an average paved rate of only 17.4 % across the 50 countries and regions. A distinct pattern emerged, with “higher paved rates in the north and south and lower rates in the central region”; the average paved rate north of the Sahara is approximately three times that of Sub-Saharan Africa (excluding South Africa). The African road surface type dataset developed in this study (https://doi.org/10.6084/m9.figshare.29424107, Liu and Zhou, 2025) not only provides data support for enhancing road infrastructure and evaluating progress toward SDG 9.1 in Africa but may also facilitate research on how road surface types impact road safety, energy consumption, ecological environments, and socio-economic development.
- Article
(12489 KB) - Full-text XML
- BibTeX
- EndNote


Road surface types, such as paved and unpaved roads, not only affect vehicle driving safety and energy consumption but also affect road accessibility and socio-economic development (Anyanwu and Erhijakpor, 2009; Shtayat et al., 2020; Sha, 2021; Styer et al., 2024; Chen et al., 2025). Generally, paved roads have a durable structure and are resistant to erosion, allowing them to remain passable year-round. In contrast, unpaved roads are often impacted by natural factors such as rain and snow, making them typically difficult to traverse throughout the year. The proportion of the rural population living within 2 km of an all-season road has been adopted by the World Bank as a key indicator for evaluating road infrastructure. This indicator was incorporated by the United Nations into Sustainable Development Goal (SDG) 9.1 in 2015. Data on road surface types are considered essential for assessing progress toward SDG 9.1.
Existing studies indicate that the road paved rate in African countries is highly positively correlated with national poverty rates, in some regions, the lack of all-season passable roads has significantly increased transportation costs (Anyanwu and Erhijakpor, 2009; Abdulkadr et al., 2022). Particularly in Sub-Saharan Africa, more than 70 % of roads remain unpaved (Greening and O’Neill, 2010); In Nigeria, for example, over 30 million rural residents have long been unable to access road transportation services. In these countries and regions, the lag in transportation infrastructure has become a major bottleneck restricting socio-economic development (Li et al., 2021). To address these challenges, the World Bank, the International Automobile Federation (FIA), and the International Transport Forum (ITF) signed a Memorandum of Understanding (MoU) in 2018, aiming to strengthen infrastructure construction in Africa over the next fifty years (World Bank, 2018). The Agenda 2063: The Africa We Want, endorsed by multiple African countries, also sets goals to improve residents' quality of life and enhance infrastructure across the continent (African Union Commission Agenda 2063, 2015). Therefore, high-quality road surface type data for Africa are of great significance for improving local transportation infrastructure and promoting socio-economic development.
However, the currently available global data on road surface types are primarily statistical, and most analyses of road surface types rely on such statistics. For example, the International Road Federation (IRF) provides statistical data related to road surface types, such as paved road length and road paved rate (Turner, 2008; Central Intelligence Agency, 2025). Greening and O'Neill (2010) found, based on IRF and other road statistics, that in Sub-Saharan Africa, the proportion of “all-season roads” (e.g., paved roads) does not exceed 30 %. Kresnanto (2019) used statistical data on paved road lengths from Badan Pusat Statistik Indonesia (BPS Indonesia) to analyze the relationship between road paved rates and vehicle ownership in Indonesia from 1957 to 2016. Patrick and Yves (2022) conducted a survey to estimate the road paved rate in rural areas of Sub-Saharan Africa. However, analyses of road surface types based on statistical data have many limitations. On the one hand, existing statistical data on road surface types do not cover all countries; for example, in 2020, IRF provided statistics on paved road lengths for only 19 African countries, and some countries still face issues with untimely data updates (Barrington-Leigh and Millard-Ball, 2017). On the other hand, these statistical data are collected indirectly by relevant statistical departments or road authorities through surveys and coordination of data from various sources (Turner, 2008; Central Intelligence Agency, 2025), making it impossible to accurately determine whether each road within a country or region is paved or unpaved.
In recent years, with the development of sensing devices, remote sensing, and big data technologies, many researchers have proposed methods to identify road surface types based on multiple data sources (Louhghalam et al., 2015; Sattar et al., 2018; Pérez-Fortes and Giudici, 2022). For example, some scholars have suggested methods using vehicle-mounted sensing devices to identify road surface types. Chen et al. (2016) designed a road surface type identification system that can be connected to distributed vehicles and was tested on 100 taxis in Shenzhen to assess the roughness of road surfaces. Harikrishnan and Gopi (2017) collected vehicle speed data using the XYZ three-axis accelerometer of smartphones and established road surface type identification models for four different vehicle speeds. Li and Goldberg (2018) developed a similar system using smartphones, collecting data from five different drivers over 15 d to classify road roughness into three categories: “good”, “moderate”, and “poor”. Other researchers have proposed methods using street view data to identify road surface types. Randhawa et al. (2025) used a deep learning model combining SWIN-Transformer and CLIP-based segmentation on Mapillary street-view images to classify road surfaces globally into paved and unpaved. Menegazzo and von Wangenheim (2020) collected street view data for some roads in Anita Garibaldi, Brazil, using vehicle-mounted cameras and identified paved and unpaved roads based on a CNN neural network model. Zhou et al. (2025a) recently utilized crowdsourced street view data from Mapillary to develop a dataset of road surface type annotations (paved and unpaved) for the African region. Additionally, some scholars have proposed methods using high-resolution remote sensing imagery to identify road surface types. Workman et al. (2023) developed a framework using high-resolution optical satellite imagery and machine learning to predict the condition of unpaved roads in Tanzania. Zhou et al. (2024) proposed a method that integrates OpenStreetMap (OSM) and high-resolution Google satellite imagery to identify road surface types and used this method to develop the road surface type dataset for Kenya. However, methods based on vehicle-mounted sensing devices require on-site data collection for each road, which inevitably demands significant manpower, materials, and financial resources, making them difficult to apply to large-scale study areas such as continents or countries. Data like Google street view are available only in a limited number of countries or specific regions within countries, making it challenging to identify the surface types of all roads nationwide. Therefore, although datasets developed based on street views covers a global range, it only has 36 % of the complete global roads, this proportion is even lower in Africa and Asia (Randhawa et al., 2025). Remote sensing methods may suffer from low accuracy in identifying road surface types due to dense vegetation or building shadows obscuring roads (Zhou et al., 2024). Therefore, Zhou et al. (2025b) recently proposed a new method based on multisource big data and deep learning models to infer road surface types, which has been validated in two African countries. Compared to remote sensing methods, this approach can address the low accuracy of road surface type identification in areas with poor remote sensing image quality; for example, the accuracy of remote sensing methods in Cameroon is only 67 %, whereas the multisource data method achieves accuracy exceeding 85 % in the same region.
Nevertheless, existing research still has limitations. (1) The method proposed by Zhou et al. (2025b) has only been validated in only a few (1–2) African countries, and it remains to be verified whether these methods can be applied to develop road surface type dataset for different African countries. (2) Existing road surface type data are still mainly statistical data at the national scale, with Zhou et al. (2024) provided a road surface type dataset only for Kenya, leaving a gap in data products covering other countries and regions across Africa.
Therefore, this study aims not only to evaluate the universal applicability of a method for developing road surface type dataset based on multisource big data and deep learning models but also to apply this method to create the first dataset of road surface types (paved and unpaved) for 50 countries and regions in Africa. The dataset developed in this study not only provides information on the surface type of each road in various countries or regions of Africa but also verifies the accuracy of the dataset: accuracy ranges from 77 % to 96 %, and the F1 score ranges from 0.76 to 0.96. Compared to IRF and other road statistical data, the dataset developed in this study can support detailed mapping of road surface types in various African countries or regions and provide data support for road infrastructure construction.
The remainder of this paper is organized as follows: Sect. 2 describes the study area and the source data used for developing and evaluating the road surface type data. Section 3 outlines the methods employed for data development and evaluation. Section 4 presents the evaluation results of the road surface type data. Section 5 discusses the implications and limitations of the study. The final two sections detail the data acquisition methods and provide the research conclusions.
2.1 Study area
This study takes 50 countries and regions in Africa, the second-largest continent on Earth, as the study area (Fig. 1), with a total road length of approximately 6 822 516 km. Africa was selected as the study area primarily because existing research indicates a high proportion of unpaved roads across the continent (Biber-Freudenberger et al., 2025). However, the IRF only provides statistics on paved road lengths and paving rates for some African countries. Due to the lack of a spatially detailed road surface type dataset, it is challenging to offer decision support for improving road infrastructure in Africa.
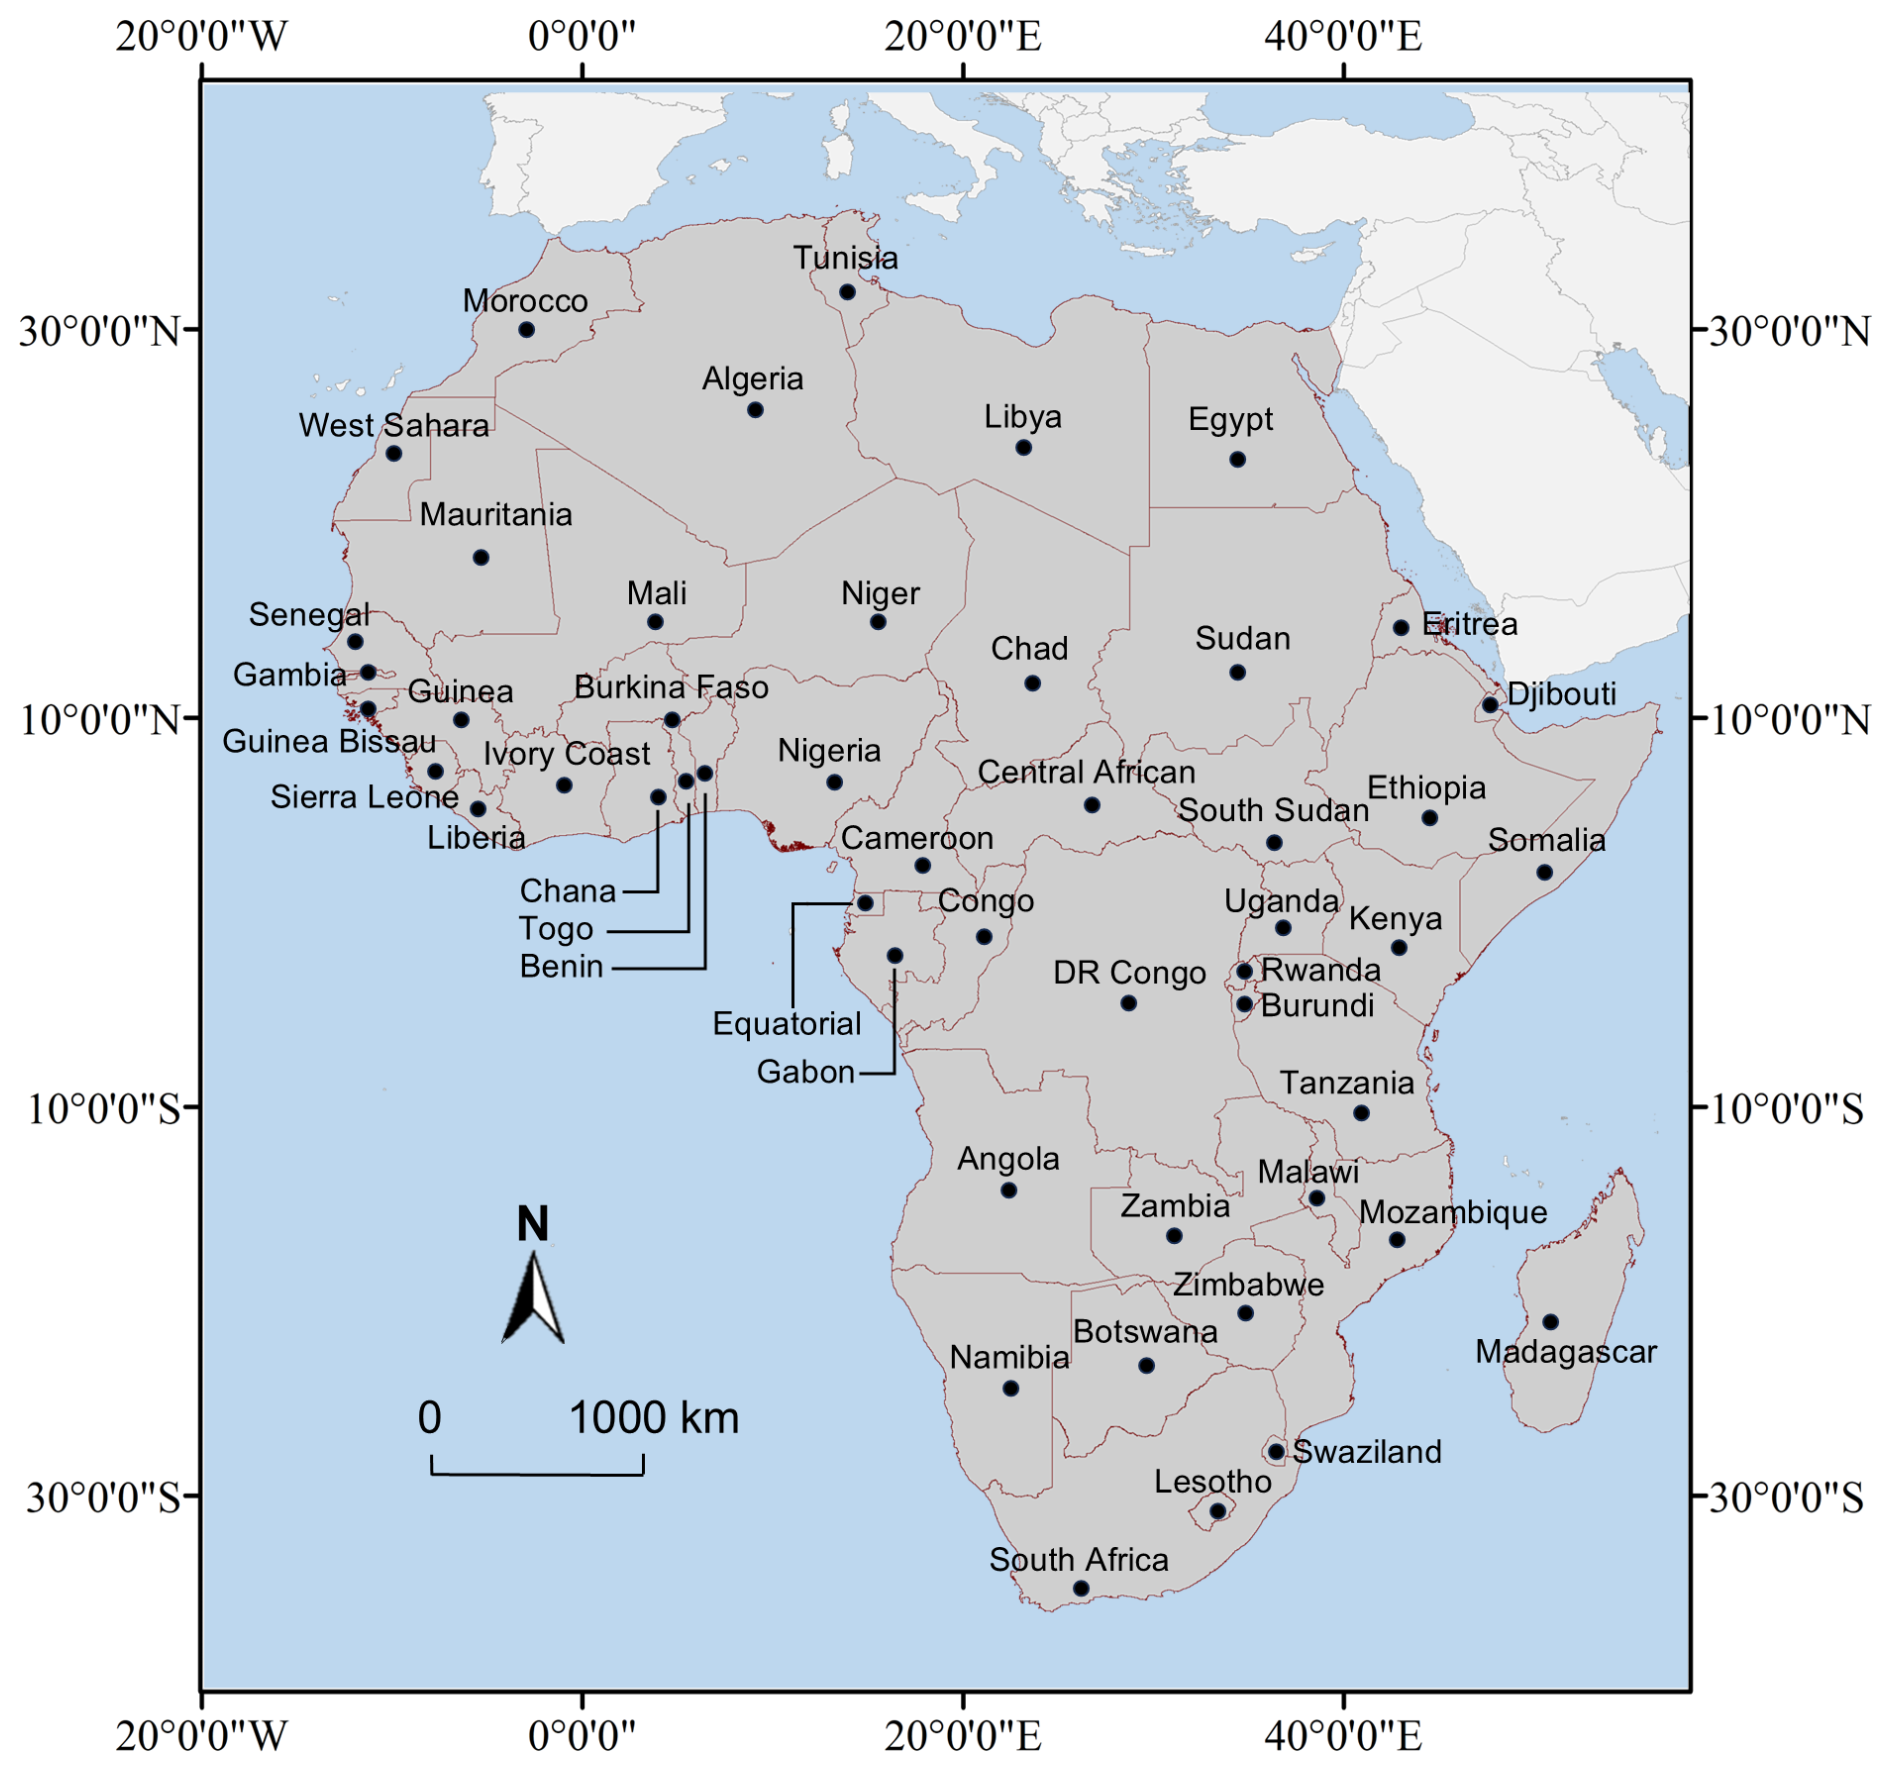
Figure 1Study Area.
2.2 Data
2.2.1 Geospatial data
-
OpenStreetMap road data. OpenStreetMap (OSM) is an open geospatial dataset contributed by global volunteers and made available online (Harikrishnan and Gopi, 2017). This dataset includes various geographic elements such as roads, buildings, and water bodies. Each geographic element not only contains geometric information but also describes its characteristics or attribute information through a series of tags. Specifically, the “surface” tag in OSM road data is designed to describe the road surface type of each road segment. The value of this tag typically refers to the surface material of the road, such as asphalt, concrete, or gravel. Although OSM data for different countries or regions in Africa include information on road surface types, incomplete statistics show that the length of OSM roads with surface type information in a single country usually accounts for less than 30 %, meaning that most OSM road data lack surface type information, highlighting an urgent need for supplementation and improvement. This study obtained road data for 50 countries and regions in Africa (in ESRI Shapefile format) from the Geofabrik platform (http://download.geofabrik.de/index.html, last access: 2 July 2025), which allows obtaining OSM road data by country.
-
GDP grid data. This dataset is a 1km spatial resolution GDP grid dataset developed by Southwestern University of Finance and Economics (Chen et al., 2022). The dataset was developed by integrating nighttime light remote sensing data (NPP-VIIRS), land use data, and regional economic statistics using spatial interpolation and machine learning algorithms. This dataset overcomes the limitations of traditional administrative unit statistics and accurately captures the spatial heterogeneity of economic activities. The dataset covers the period from 1992 to 2019; this study utilized data from the most recent year, 2019.
-
Population grid data. This dataset is the LandScan global population dataset developed by Oak Ridge National Laboratory (ORNL) in the United States, with a spatial resolution of 30 arcsec in latitude and longitude (approximately 1km at the equator) (Dobson et al., 2000). The dataset integrates census data, satellite imagery, and mobile communication data, using dynamic modeling methods to simulate 24 h population distribution. Existing research has found that compared to other population grid datasets (such as WorldPop and Global Human Settlement Population Grid), LandScan has higher accuracy (Jiang et al., 2021; Mohit and Slobodan, 2021; Yin et al., 2021). Therefore, this study obtained the 2020 LandScan population raster data for the African region (https://landscan.ornl.gov/, last access: 2 July 2025).
-
Building height data. This dataset provides building height information at a 100 m resolution and is released by the Global Human Settlement Layer (GHSL). The dataset is based on Sentinel-1/2 and Landsat imagery, using machine learning algorithms to extract the three-dimensional morphology of buildings (Pesaresi et al., 2021). The dataset includes raster data representing building heights. GHSL-BUILT is the world's first building height dataset, and this study obtained the 2018 building height data recommended by GHSL for analysis (https://human-settlement.emergency.copernicus.eu/ghs_buH2023.php, last access: 2 July 2025).
-
Land cover data. This dataset is a global land cover dataset with a 10 m spatial resolution released by ESRI. The dataset was developed based on Sentinel-2 imagery and deep learning methods, including nine different land cover categories (water, trees, flooded vegetation, crops, buildings, bare land, snow, clouds, and pasture) (Karra et al., 2021). Existing research indicates that ESRI land cover data exhibits higher accuracy compared to other similar datasets (such as ESA World Cover and Dynamic World) (Yan et al., 2023). This study obtained the 2020 Land Cover data for the African region (https://livingatlas.arcgis.com/landcover/, last access: 2 July 2025).
2.2.2 Statistical data
To verify the effectiveness of the data, this study also collected two types of statistical data, IRF road statistics and socio-economic statistics.
-
IRF Road Statistics. The International Road Federation (IRF) is a non-profit international organization dedicated to promoting development and cooperation in the global road transport sector (Turner, 2008). IRF provides free, comprehensive statistical data resources to users worldwide (https://www.irf.global/, last access: 2 July 2025). These data primarily come from authoritative reports and statistical agencies of various governments, covering multiple fields such as road networks and the transportation industry. This study utilized three statistical data provided by IRF for the African region in 2020: the length of paved roads, total road length, and road paved rate.
-
Socio-economic Statistics. Existing research has found that the road paved rate is strongly positively correlated with the level of socio-economic development (Anyanwu and Erhijakpor, 2009). Therefore, this study also introduced two indicators related to the level of socio-economic development, namely the Human Development Index (HDI) and Gross National Income per capita (GNI per capita, based on Purchasing Power Parity current international dollar). HDI, compiled and published by the United Nations Development Programme since 1990, is derived from a comprehensive evaluation of a country's life expectancy, average years of schooling, and gross national income, and is used to measure the socio-economic development level of various countries. GNI per capita is published by the World Bank, where GNI is the sum of the incomes of all residents in a country or region; GNI per capita is the average GNI of a country or region, which can measure the average economic income level of the nationals in a country or region. This study obtained 2020 HDI and GNI per capita data, covering 44 and 36 African countries and regions, respectively.
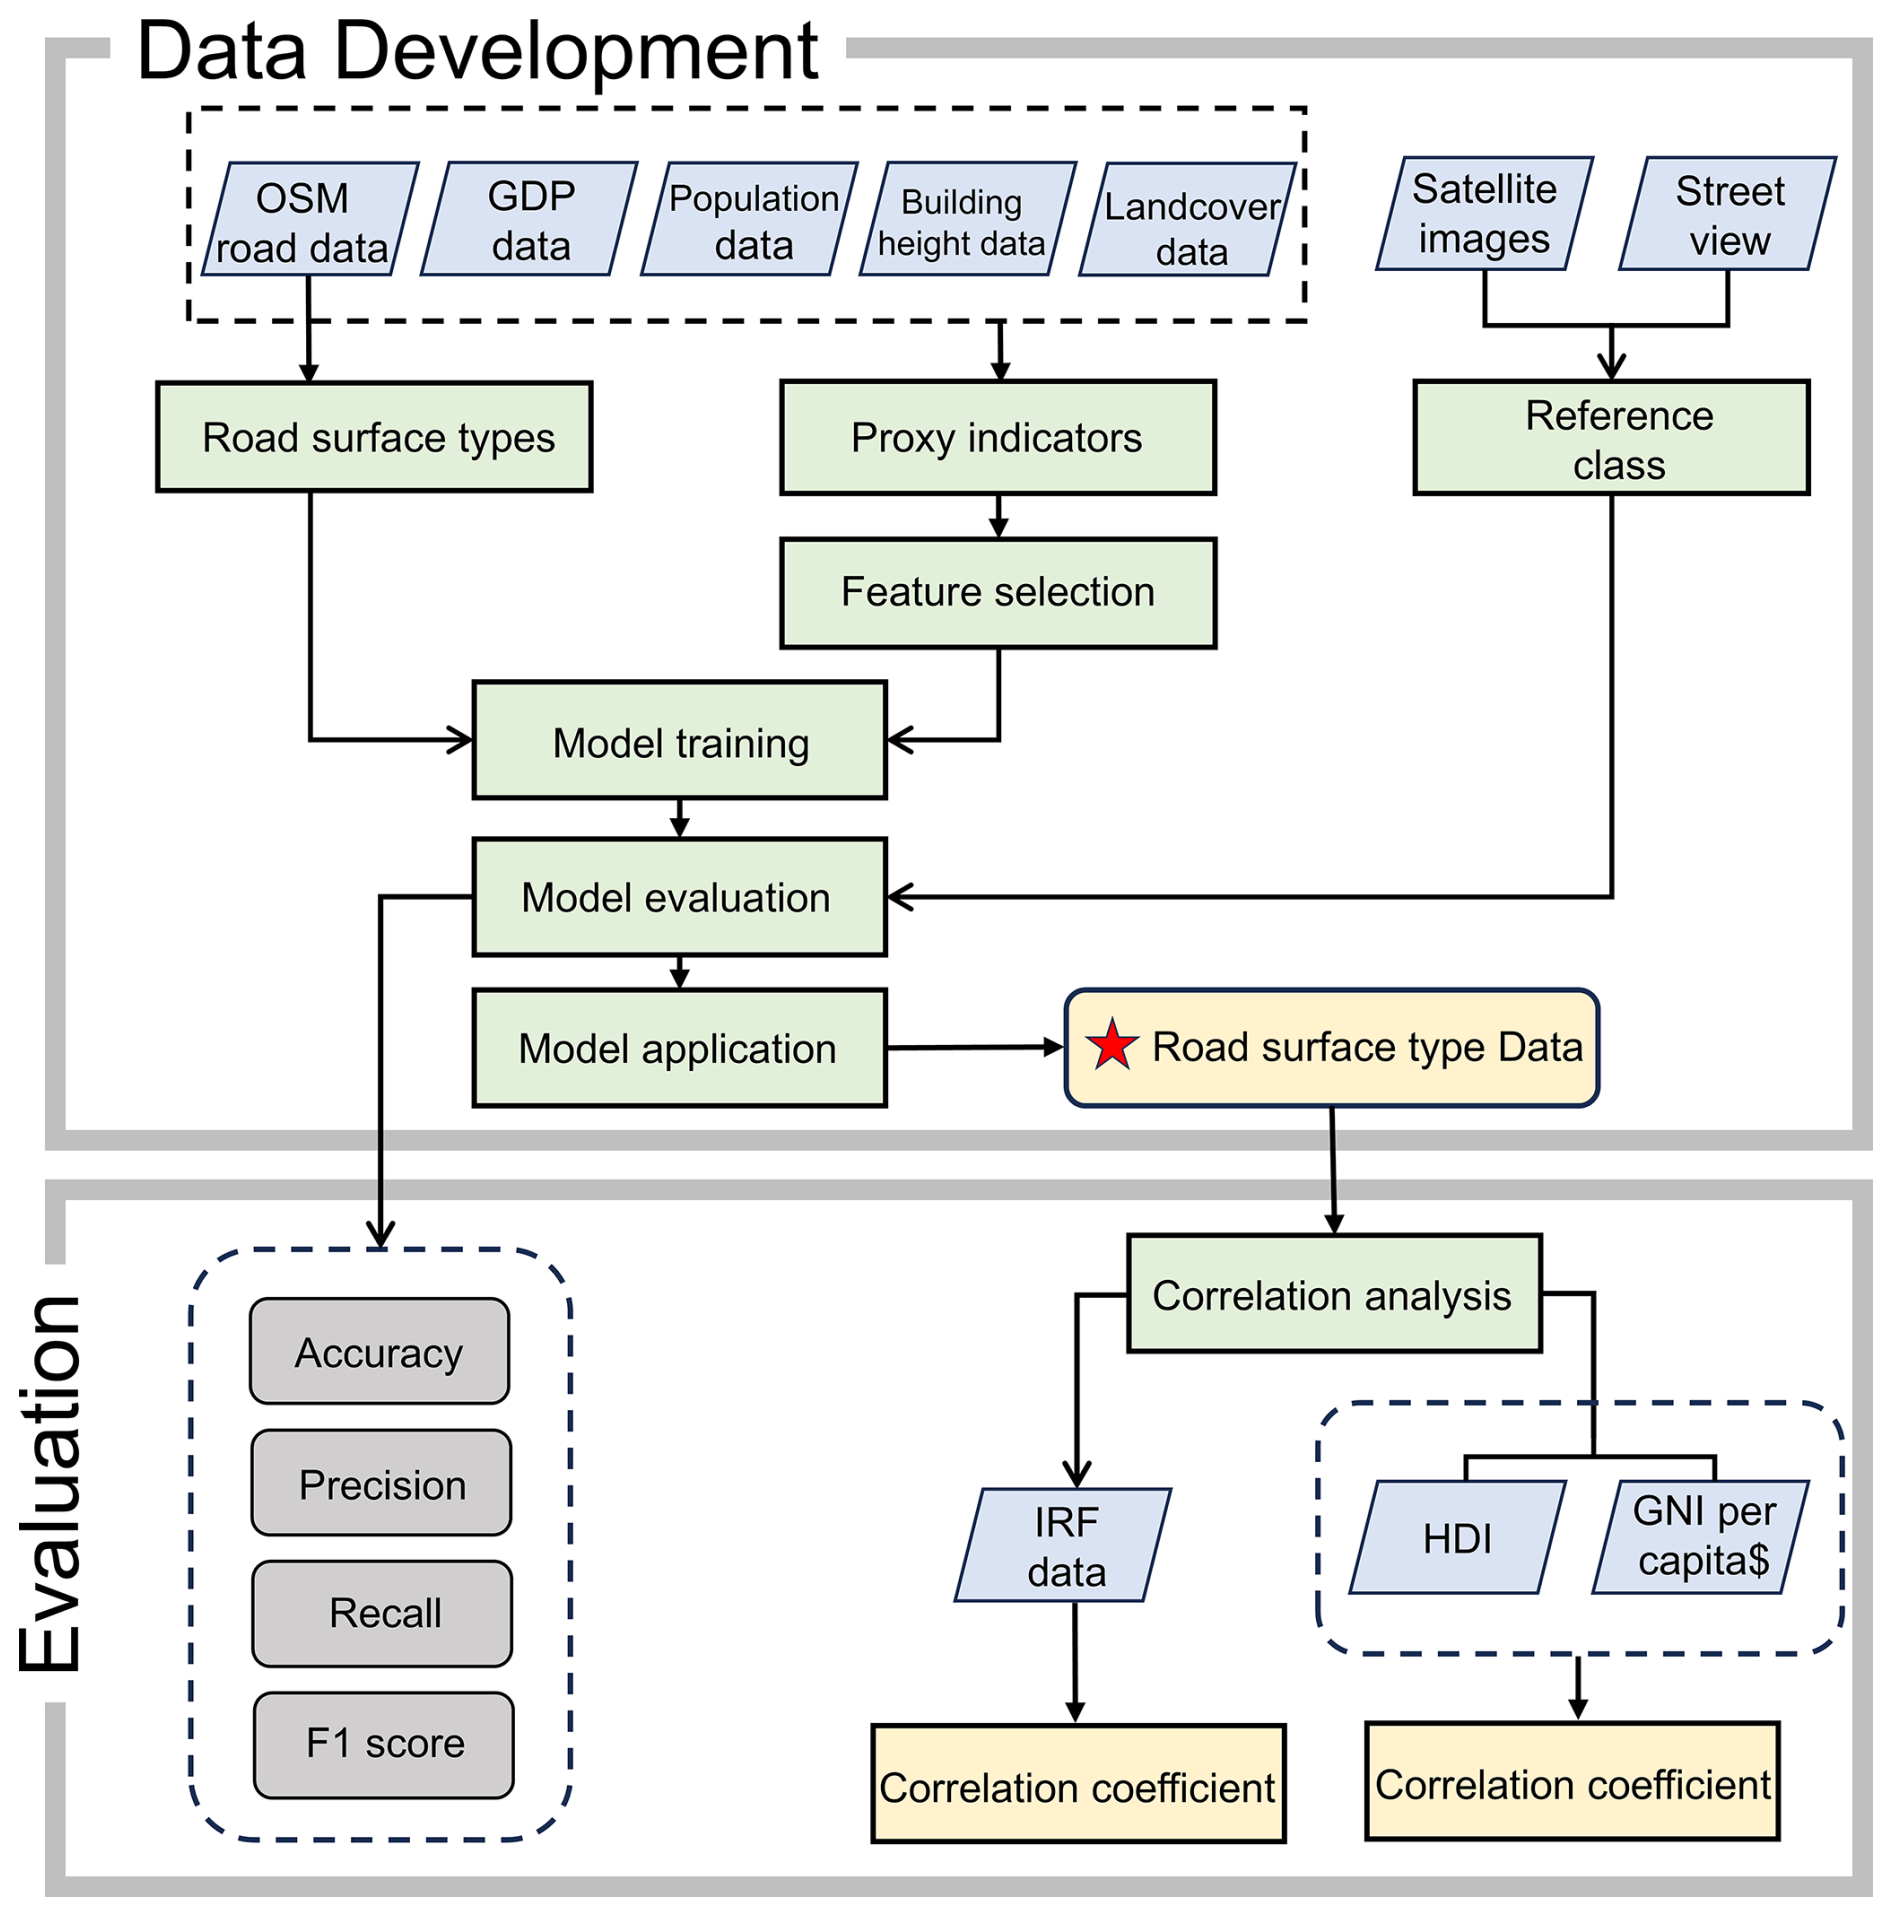
The technical roadmap of this study is shown in Fig. 2.
3.1 Developing of Road Surface Type Dataset of Africa
This study utilizes a method recently proposed by Zhou et al. (2025b), which leverages multi-source geospatial big data and deep learning models to develop the road surface type dataset for 50 African countries and regions. The main idea of this method involves the following steps: First, sampling points and their corresponding OpenStreetMap (OSM) road surface type labels are acquired based on OSM road data. Next, proxy indicators that characterize road surface types are calculated based on multi-source open geospatial big data. Third, a deep learning model is trained using these proxy indicators and road surface type labels of the sampling points. Finally, the trained model is applied to the road networks of various African countries and regions to identify the surface type of each road.
3.1.1 Road Sampling
According to the definition of OSM road level tags (highway =) outlined in the OSM wiki (https://wiki.openstreetmap.org/wiki/Key:highway, last access: 2 July 2025), roads passable by four-wheeled motor vehicles are selected. These specifically include: “highway = motorway, motorway_link, trunk, trunk_link, primary, primary_link, secondary, secondary_link, tertiary, tertiary_link, residential, living_street, service, track, road, unclassified”. Other roads primarily intended for bicycles or pedestrians (e.g., cycleway, footway) are excluded from the analysis.
Afterward, the selected OSM road data are sampled at 100 m intervals to generate sampling points. The 100 m interval is chosen because most roads are greater than or equal to 100 m in length, ensuring that most roads have at least one sampling point. For roads shorter than 100 m, the midpoint of the road is used as the sampling point.
3.1.2 Calculation and Selection of Proxy Indicators
-
Calculation of Proxy Indicators. It has been found by Zhou et al. (2025b) that road surface types are not only related to road classes but also to the socio-economic and geographical environment of the area where the road is located. Therefore, Zhou et al. (2025b) designed 16 proxy indicators across three feature dimensions – Road network features, Socio-economic features, and Geographical environment features – as shown in Table 1. These indicators serve as “proxies” to identify or infer road surface types.
- -
For a single road sampling point. Road network features: The road class is directly obtained from the OSM “highway=” tag. To calculate road length, degree centrality (Degree), closeness centrality (Closeness), and betweenness centrality (Betweenness), the road networks of each country or region are constructed into strokes based on the “every best fit” method (Zhou and Li, 2012). The core principle of this method is to connect continuous road segments into individual roads (called “strokes”), according to the deflection angle between adjacent road segments. These metrics (Road length, Degree, Closeness, Betweenness) are calculated for each stroke, by referring to Zhou and Li (2015); Zhou et al. (2025b). Finally, the values are assigned to the corresponding sampling points on the road.
- -
Socio-economic features. The sampling point is assigned the value of the grid cell it falls into for corresponding data (GDP, population, or building height).
- -
Geographical environment features. A 100 m × 100 m grid unit is established. The sampling point's grid unit is identified. The proportion of each land cover type within that grid unit is calculated.
- -
-
Feature Selection. Since proxy indicators may be highly correlated, this study employs correlation and contribution analyses to select appropriate proxy indicators for model training, aiming to reduce data dimensionality, simplify model complexity, and eliminate multicollinearity.
- -
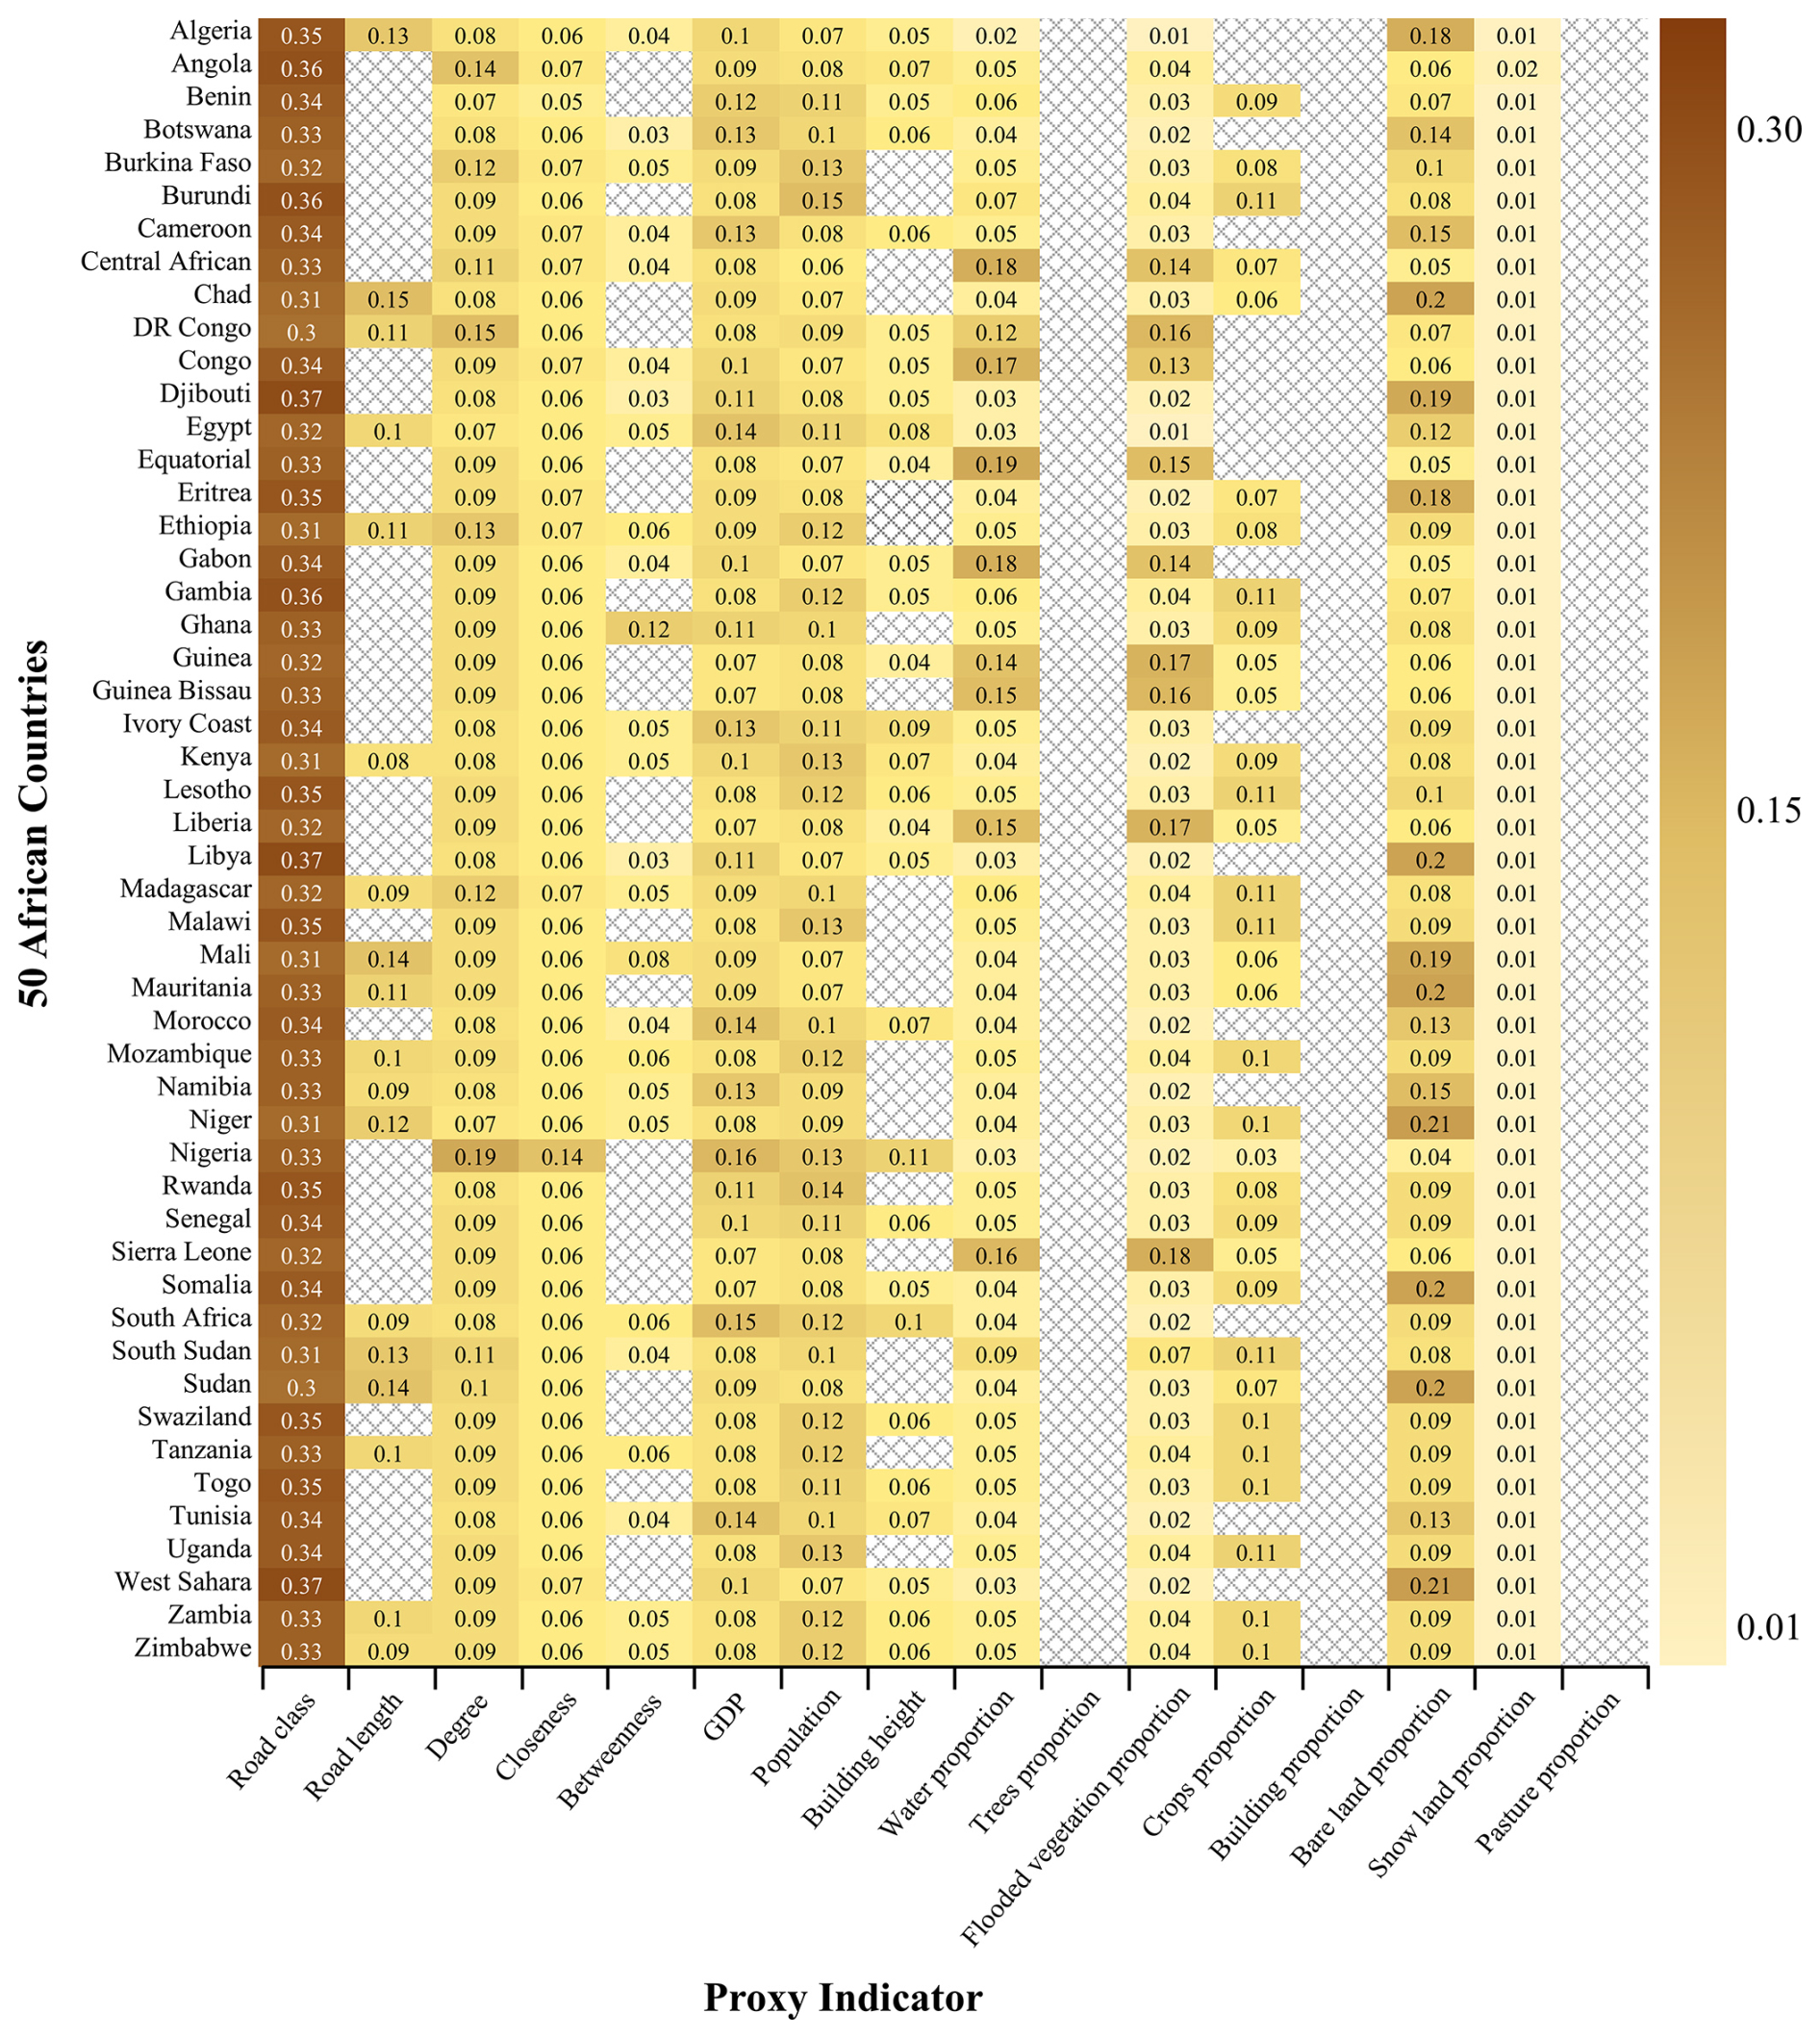
For a single country or region: First, the correlation between pairs of proxy indicators is calculated using Phi_k (Baak et al., 2020), chosen because it can measure the correlation coefficient between different types of variables. Second, Shapley Additive exPlanations (SHAP) are used to analyze the interpretability of each proxy indicator, quantifying its contribution to the model's predictions. Third, proxy indicators without multicollinearity are directly used as input features. If two proxy indicators exhibit multicollinearity, the one with the highest contribution (based on SHAP values) is retained as the input feature for that country or region. In this study, the selected proxy indicators for 50 African countries can be found in Appendix A.
- -
-
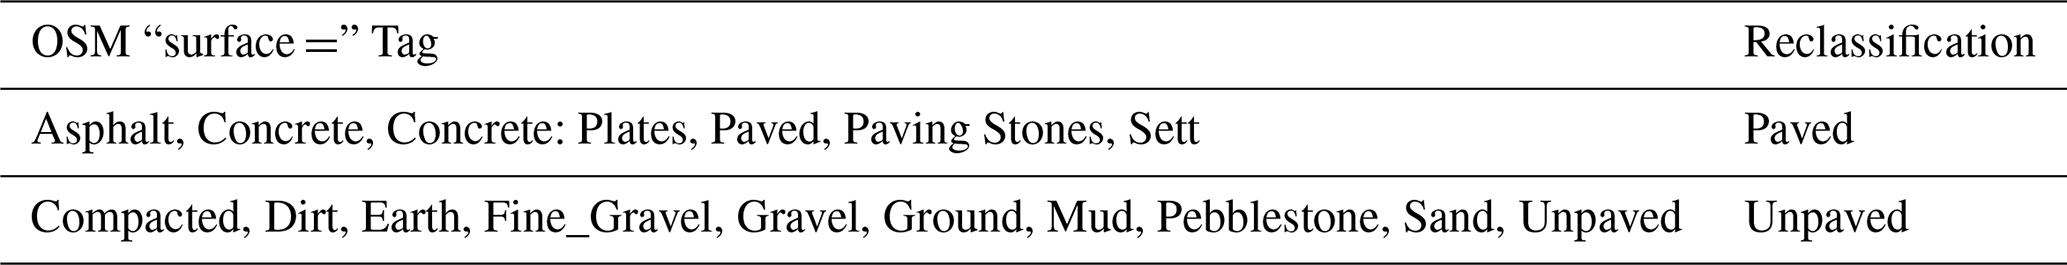
Road surface type classification. Road surface types from OSM data are treated as output variables and defined into two categories based on whether the road is paved. Paved roads: roads with a structured surface. Unpaved roads: roads without a structured surface.
Since the labels for training samples are automatically extracted from the OSM “surface =” tag, all OSM tags are reclassified into “paved” or “unpaved” roads, as shown in Table 2. The reclassification criteria follow the guidelines provided by OSM's wiki (https://wiki.openstreetmap.org/wiki/Surface, last access: 2 July 2025).
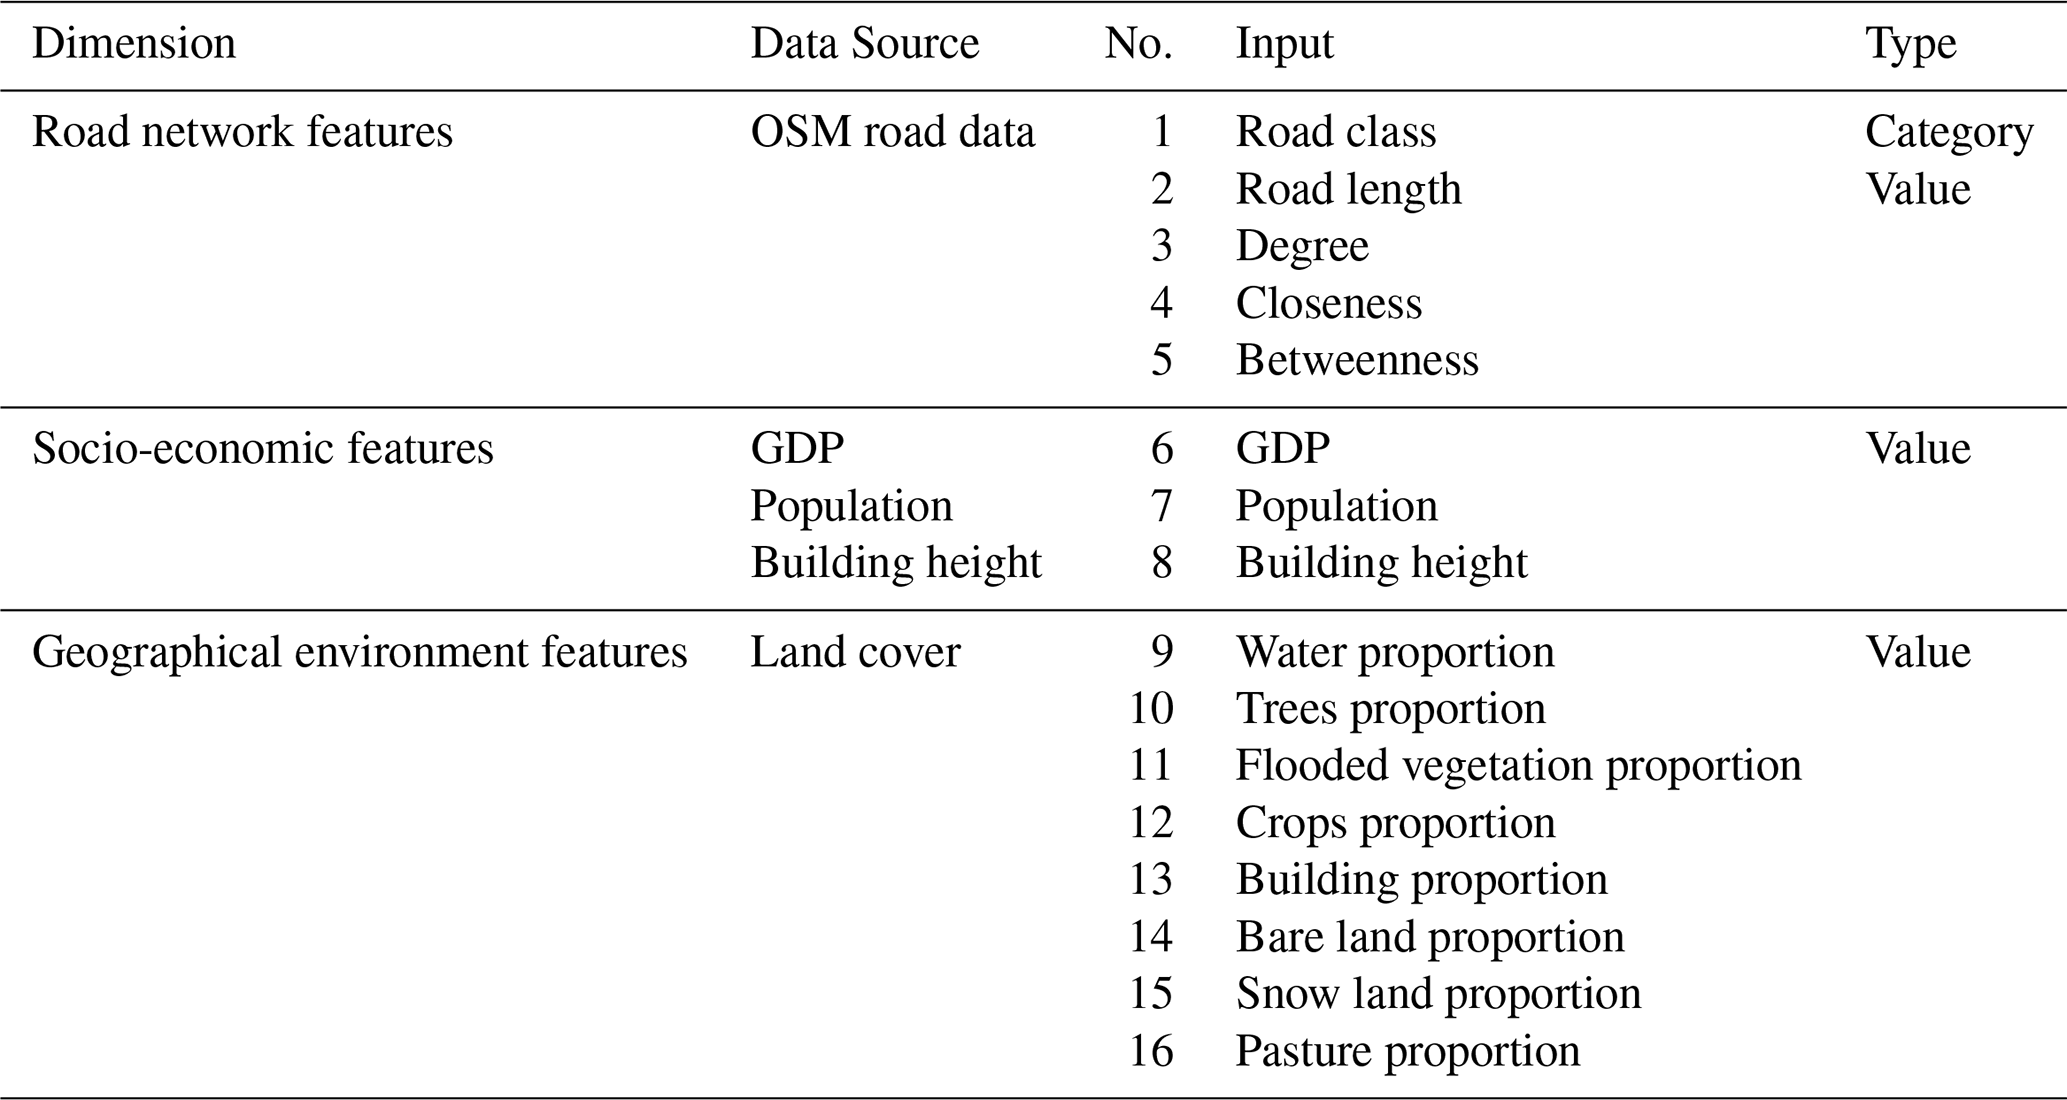
Table 2Reclassifying OSM “surface =” Tags into Paved and Unpaved Roads.
3.1.3 Model Training and Application
Zhou et al. (2025b) compared six machine learning and deep learning models for identifying road surface types and found that the TabNet model achieved the highest accuracy (approximately 86 %). Consequently, this study adopts TabNet to develop the road surface type dataset for 50 African countries and regions. TabNet, proposed by Arik and Pfister (2021), combines the end-to-end learning and representation learning characteristics of deep neural networks (DNNs) with the interpretability and sparse feature selection advantages of decision tree models.
For a single African country: From sampling points with “surface =” tags, 5000 paved and 5000 unpaved sampling points are randomly selected as training samples for two reasons: Firstly, the positive and negative samples are controlled at a 1:1 ratio to achieve equal weights, ensuring sufficient learning for both types. Secondly, we found that the model's accuracy improves as the number of sampling points increases, although it tends to stabilize once the sample size reaches approximately 3000 points. Despite of this, in some countries or regions where the number of paved sampling points is less than 5000 (e.g., a minimum of approximately 3000), all paved sampling points (e.g., 3000) and an equal number of unpaved sampling points (e.g., 3000) are used. For each training sample, the 16 proxy indicators from Table 1 are calculated. After feature selection, the selected proxy indicators serve as input features for model training. The OSM road surface type of the training sample is used as the model output. The TabNet model is trained, with parameters (e.g., learning rate, number of steps, training epoch) automatically determined using the Optuna framework, which searches for optimal parameters during training. The core principle of the Optuna framework is to explore various parameter combinations until it identifies the one that yields the highest accuracy. In this study, the search ranges for the parameters – learning rate, number of steps and training epochs – were set to 0.001–0.2, 3–10, and 10–100, respectively.
Each country trains a separate model. The trained model predicts the road surface type of each sampling point within that country. A correction strategy proposed by Zhou et al. (2025b) is applied to determine the final surface type of each road segment, where the surface type is determined by the majority surface type of its sampling points.
3.2 Result evaluation
This study evaluates the effectiveness of the developed road surface type dataset from three aspects.
3.2.1 Accuracy assessment
For each African country or region: From all sampling points (excluding training samples), 500 points predicted as “paved” and 500 predicted as “unpaved” are randomly selected, totaling 1000 validation points. Three different operators visually interpret the classification results for each validation point using high-resolution Google satellite imagery and Google street view, with the final reference surface type is determined by voting.
Finally, the model's predictions are compared with the reference road surface types, and its effectiveness is assessed by calculating accuracy, precision, recall, and F1 score.
3.2.2 Comparative evaluation with existing statistical data
Based on the developed road surface type dataset, the paved road length, total road length, and road paved rate for each country and region are calculated and compared with International Road Federation (IRF) statistical data. Specifically, correlation coefficients between the results calculated from this data product and IRF statistical values are explored.
Since IRF provided statistical values for only 19 African countries in 2020, only these 19 countries are included in the correlation analysis.
3.2.3 Correlation evaluation with socio-economic indicators
Existing research indicates that the road paved rate is strongly positively correlated with socio-economic development levels (Anyanwu and Erhijakpor, 2009). Therefore, this study explores the correlation between the road paved rate calculated from this data product and two indicators: Human Development Index (HDI), Gross National Income per capita (GNI per capita, based on Purchasing Power Parity current international dollar).
More precisely, the analysis includes 44 African countries with HDI data and 36 countries with GNI per capita statistical data to verify the effectiveness of the data product.
4.1 Description of the Africa Road Surface Type Dataset
This study has developed the road surface type dataset that records the roads and its surface type attribute information for 50 African countries and regions, as shown in Fig. 3.
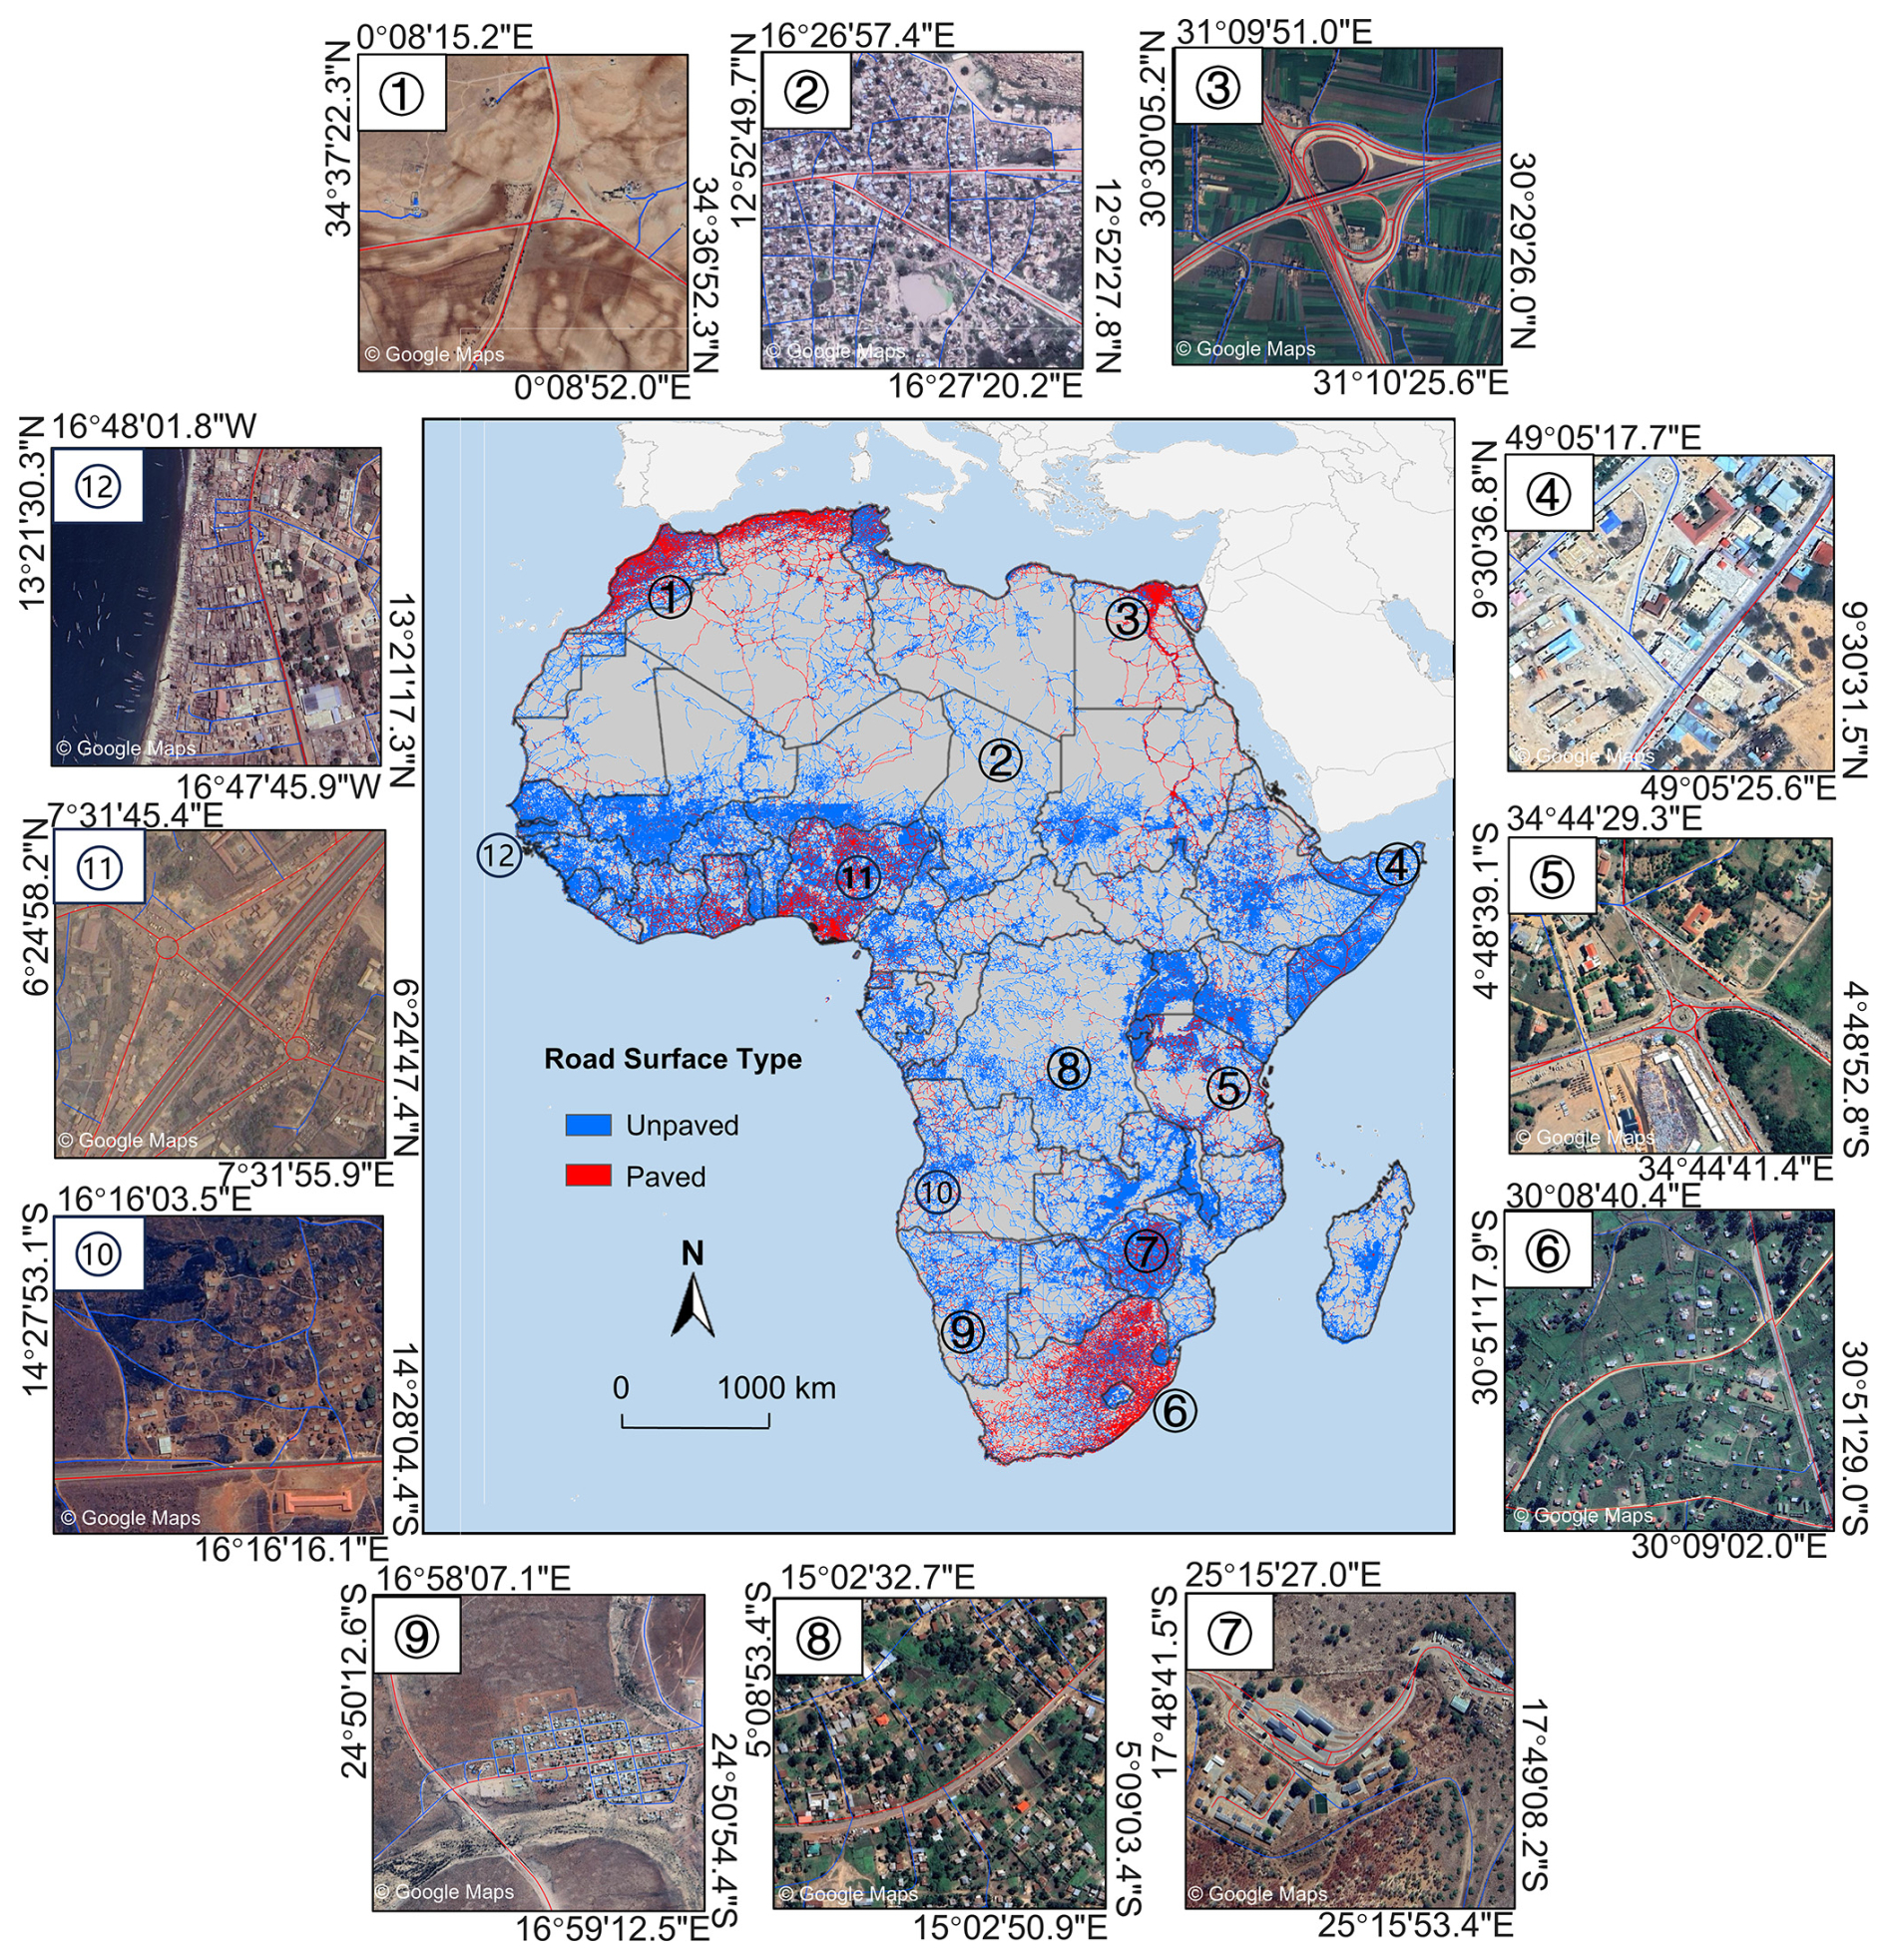
Figure 3Visualization of Road Surface Type Dataset For 50 African Countries and Regions (source: © Google Maps 2025, https://www.google.com/maps/, last access: 2 July 2025).
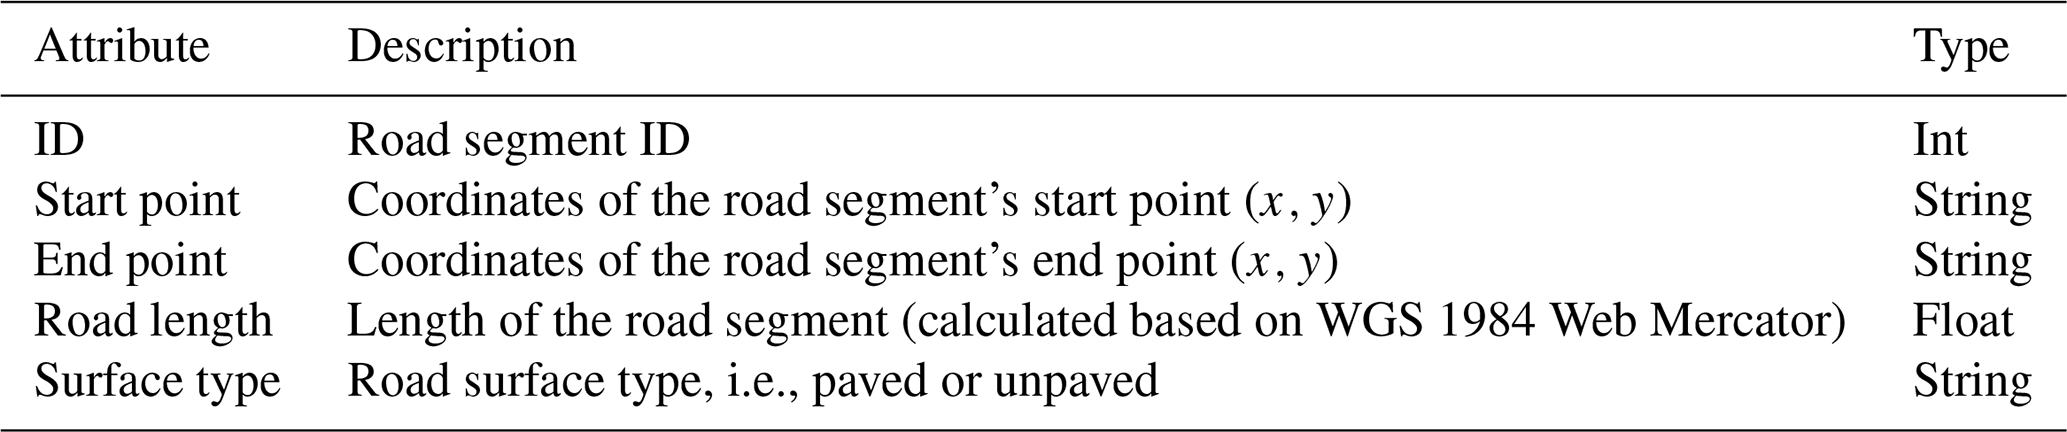
This dataset was developed based on OpenStreetMap (OSM) road data for Africa, with each country and region stored as a separate vector file in ESRI Shapefile format, using the WGS 1984 Web Mercator projection. The road data for each country and region include five attribute fields: road ID, coordinates of the start and end points (see Table 3), road length, and road surface type. The entire dataset comprises approximately 13 309 000 road segments, with a total length of about 6 822 516 km.
4.2 Accuracy Assessment of the Road Surface Type Identification Model
The accuracy assessment results for the road surface type dataset across 50 African countries and regions are presented in Fig. 4. As shown in the figure, the average accuracy across the 50 countries and regions is 86.8 %. Out of these, 44 countries and regions have an accuracy above 80 %, and 12 out of 50 have an accuracy exceeding 90 %. The country with the highest accuracy is Burundi, surpassing 96 %, while the lowest is Egypt, at approximately 77 %.
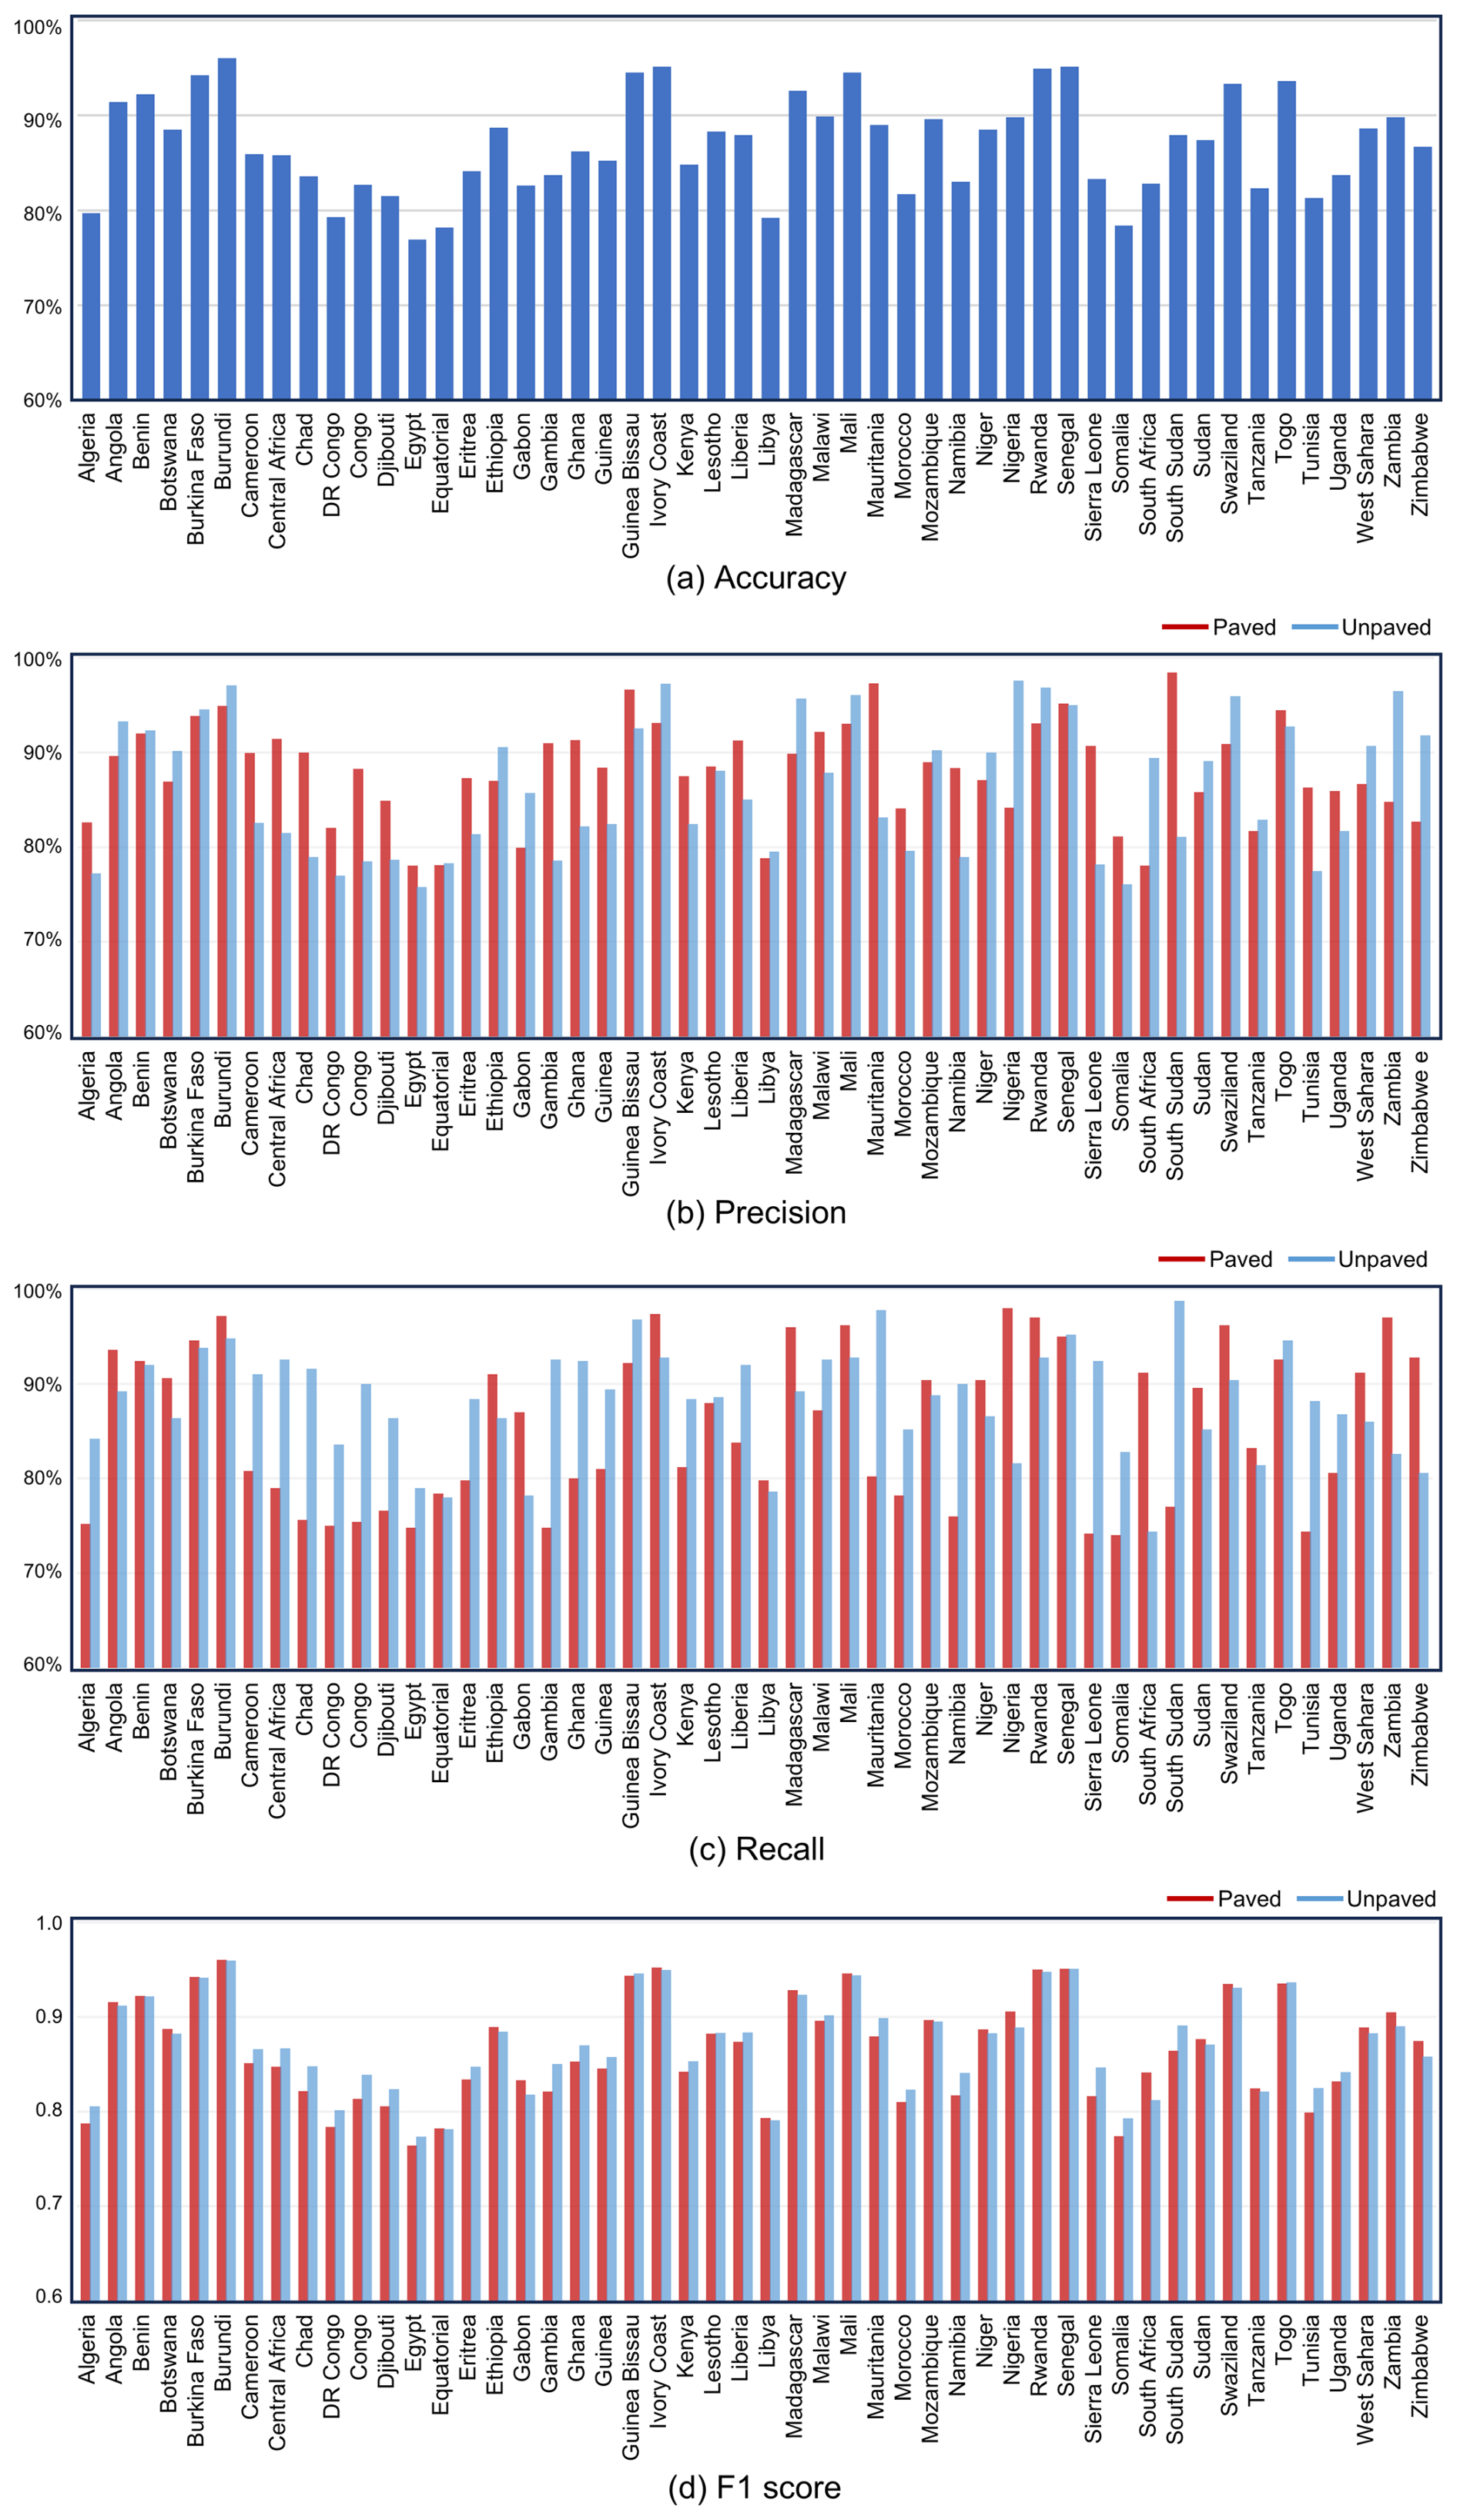
For paved roads, the average precision, recall, and F1 score across 50 countries and regions are 88.0 %, 85.0 %, and 0.86, respectively. Specifically, 45 countries and regions have a precision above 80 %, 32 have a recall above 80 %, and 43 have an F1 score above 0.80 for paved roads.
For unpaved roads, the average precision, recall, and F1 score are 86.3 %, 88.2 %, and 0.87, respectively. Among the 50 countries and regions, 36 have a precision above 80 %, 46 have a recall above 80 %, and 46 have an F1 score above 0.80 for unpaved roads.
These results demonstrate that the road surface type dataset developed in this study has relatively high accuracy, consistent with the accuracy reported in existing research (approximately 86 %) (Zhou et al., 2025b), indicating that the method using multi-source geospatial big data and deep learning models for identifying road surface types has a degree of generalizability.
4.3 Comparative Assessment with IRF Statistical Data
Figure 5 presents the correlation analysis results between the total road length, paved road length, and road paved rate calculated based on the road surface type dataset developed in this study, and the corresponding statistical data from the International Road Federation (IRF).
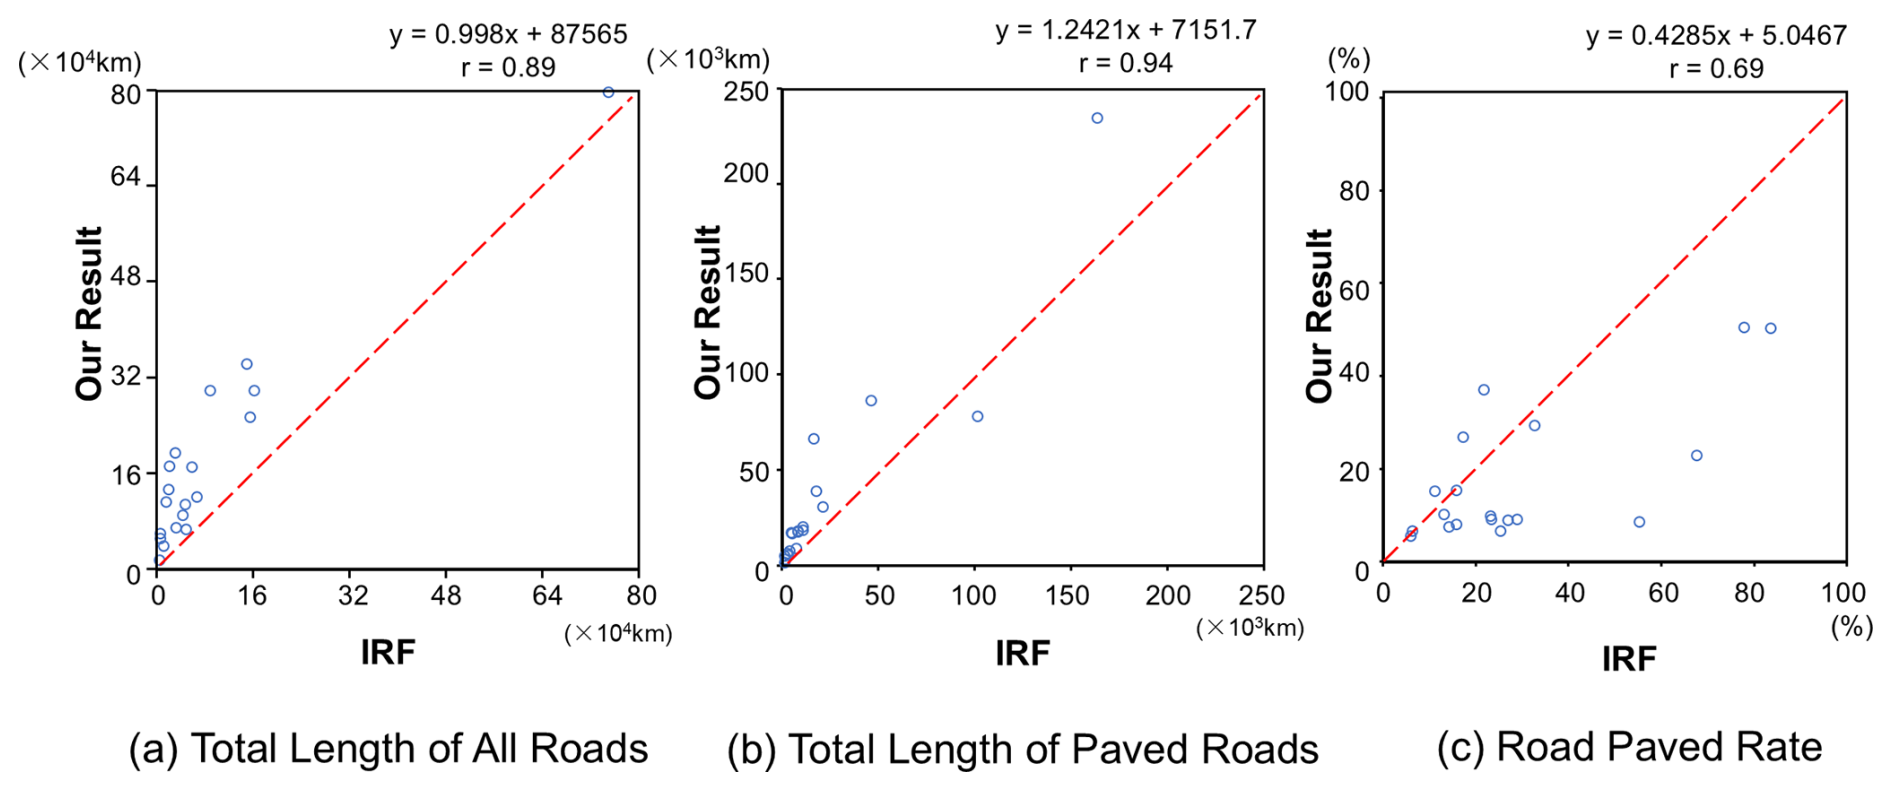
The correlation coefficients for total road length, paved road length, and road paved rate are 0.89, 0.94, and 0.69, respectively, all indicating strong correlations. This suggests that the calculations based on our data product are generally consistent with the IRF statistical data in terms of trends. For example, South Africa has the longest total and paved road lengths, while Gambia has the shortest; Tunisia and Morocco have the highest road paved rates. These results indicate the validity of the road surface type dataset.
However, as shown in the scatter plots (Fig. 5), discrepancies remain between the calculations based on our data product and the IRF statistical data. Specifically, the total road length calculated from our data product is consistently higher than that reported by IRF (as seen in Fig. 5a, where points are located to the left of the diagonal). Similarly, for 18 out of 19 countries, the paved road length is higher than the IRF statistics. Existing research has pointed out that IRF statistical data may underestimate total road length globally, with an average underestimation of 36 %, and for 94 countries, the underestimation exceeds 50 % (Barrington-Leigh and Millard-Ball, 2017). Therefore, IRF statistical data may underestimate both total and paved road lengths in African countries.
Additionally, in 15 out of 19 countries, the road paved rate is lower than that reported by IRF. This may be because IRF data underestimates the total road length in African countries, and the unaccounted roads are likely mostly unpaved, leading to an overestimation of the road paved rate in IRF statistics.
4.4 Correlation Assessment with Socio-economic Indicators
The correlation analysis results between the road paved rate calculated based on our data product for 50 African countries and regions and both the Gross National Income per capita (GNI per capita) and the Human Development Index (HDI) are shown in Fig. 6. As shown, the correlation coefficients between the road paved rate and GNI per capita and HDI are 0.80 and 0.83, respectively, indicating a strong positive correlation in both cases. This suggests that the road paved rate in African countries is highly positively associated with their level of socio-economic development, consistent with findings from existing research (Anyanwu and Erhijakpor, 2009), indirectly validating the effectiveness of our road surface type dataset.
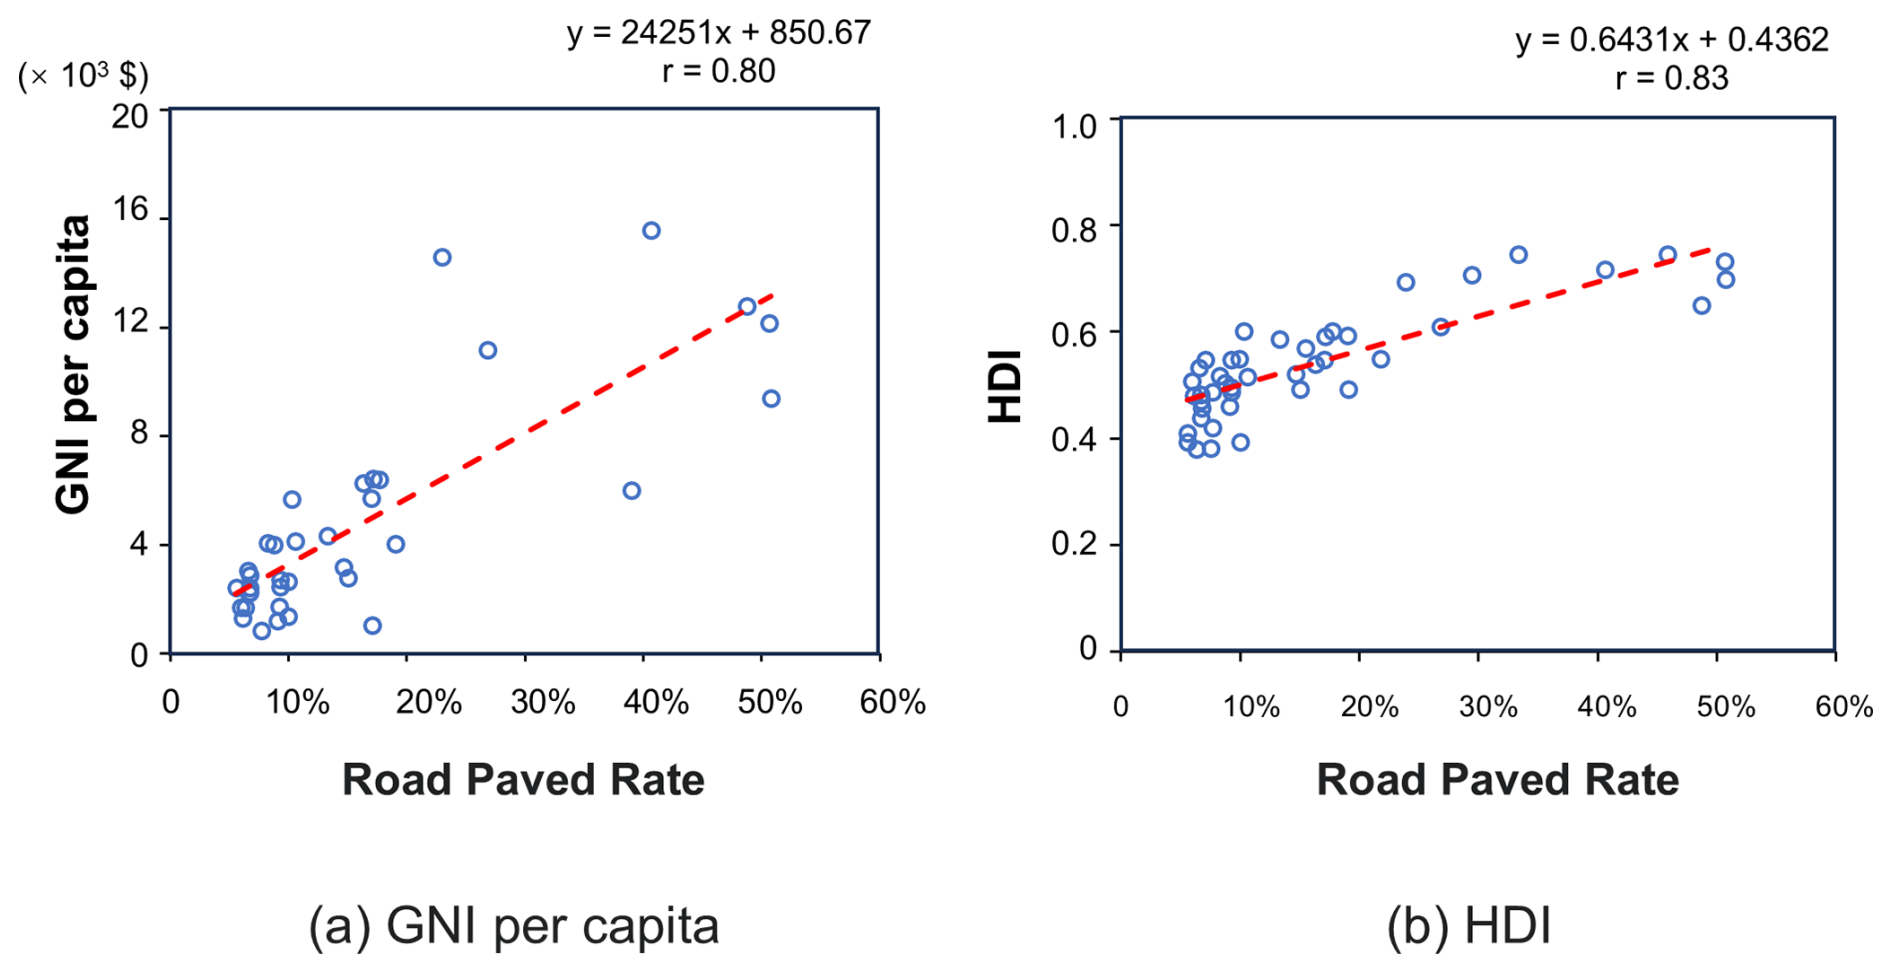
Figure 6The Correlation Analysis Results of Road Paved Rate Calculated Based on the African Road surface type dataset with Per Capita GNI (a) and HDI (b).
4.5 Spatial Pattern Analysis of Road Paved Rates in Africa
Based on the road surface type dataset, the spatial patterns of road paved rates in 50 African countries and regions were analyzed at the national, provincial, and county levels, as shown in Fig. 7. Compared to IRF, which only provides statistical data for 19 African countries (Gwilliam et al., 2008), our dataset not only allows for the analysis of road paved rates in all 50 African countries and regions but also enables detailed analysis at different administrative levels.
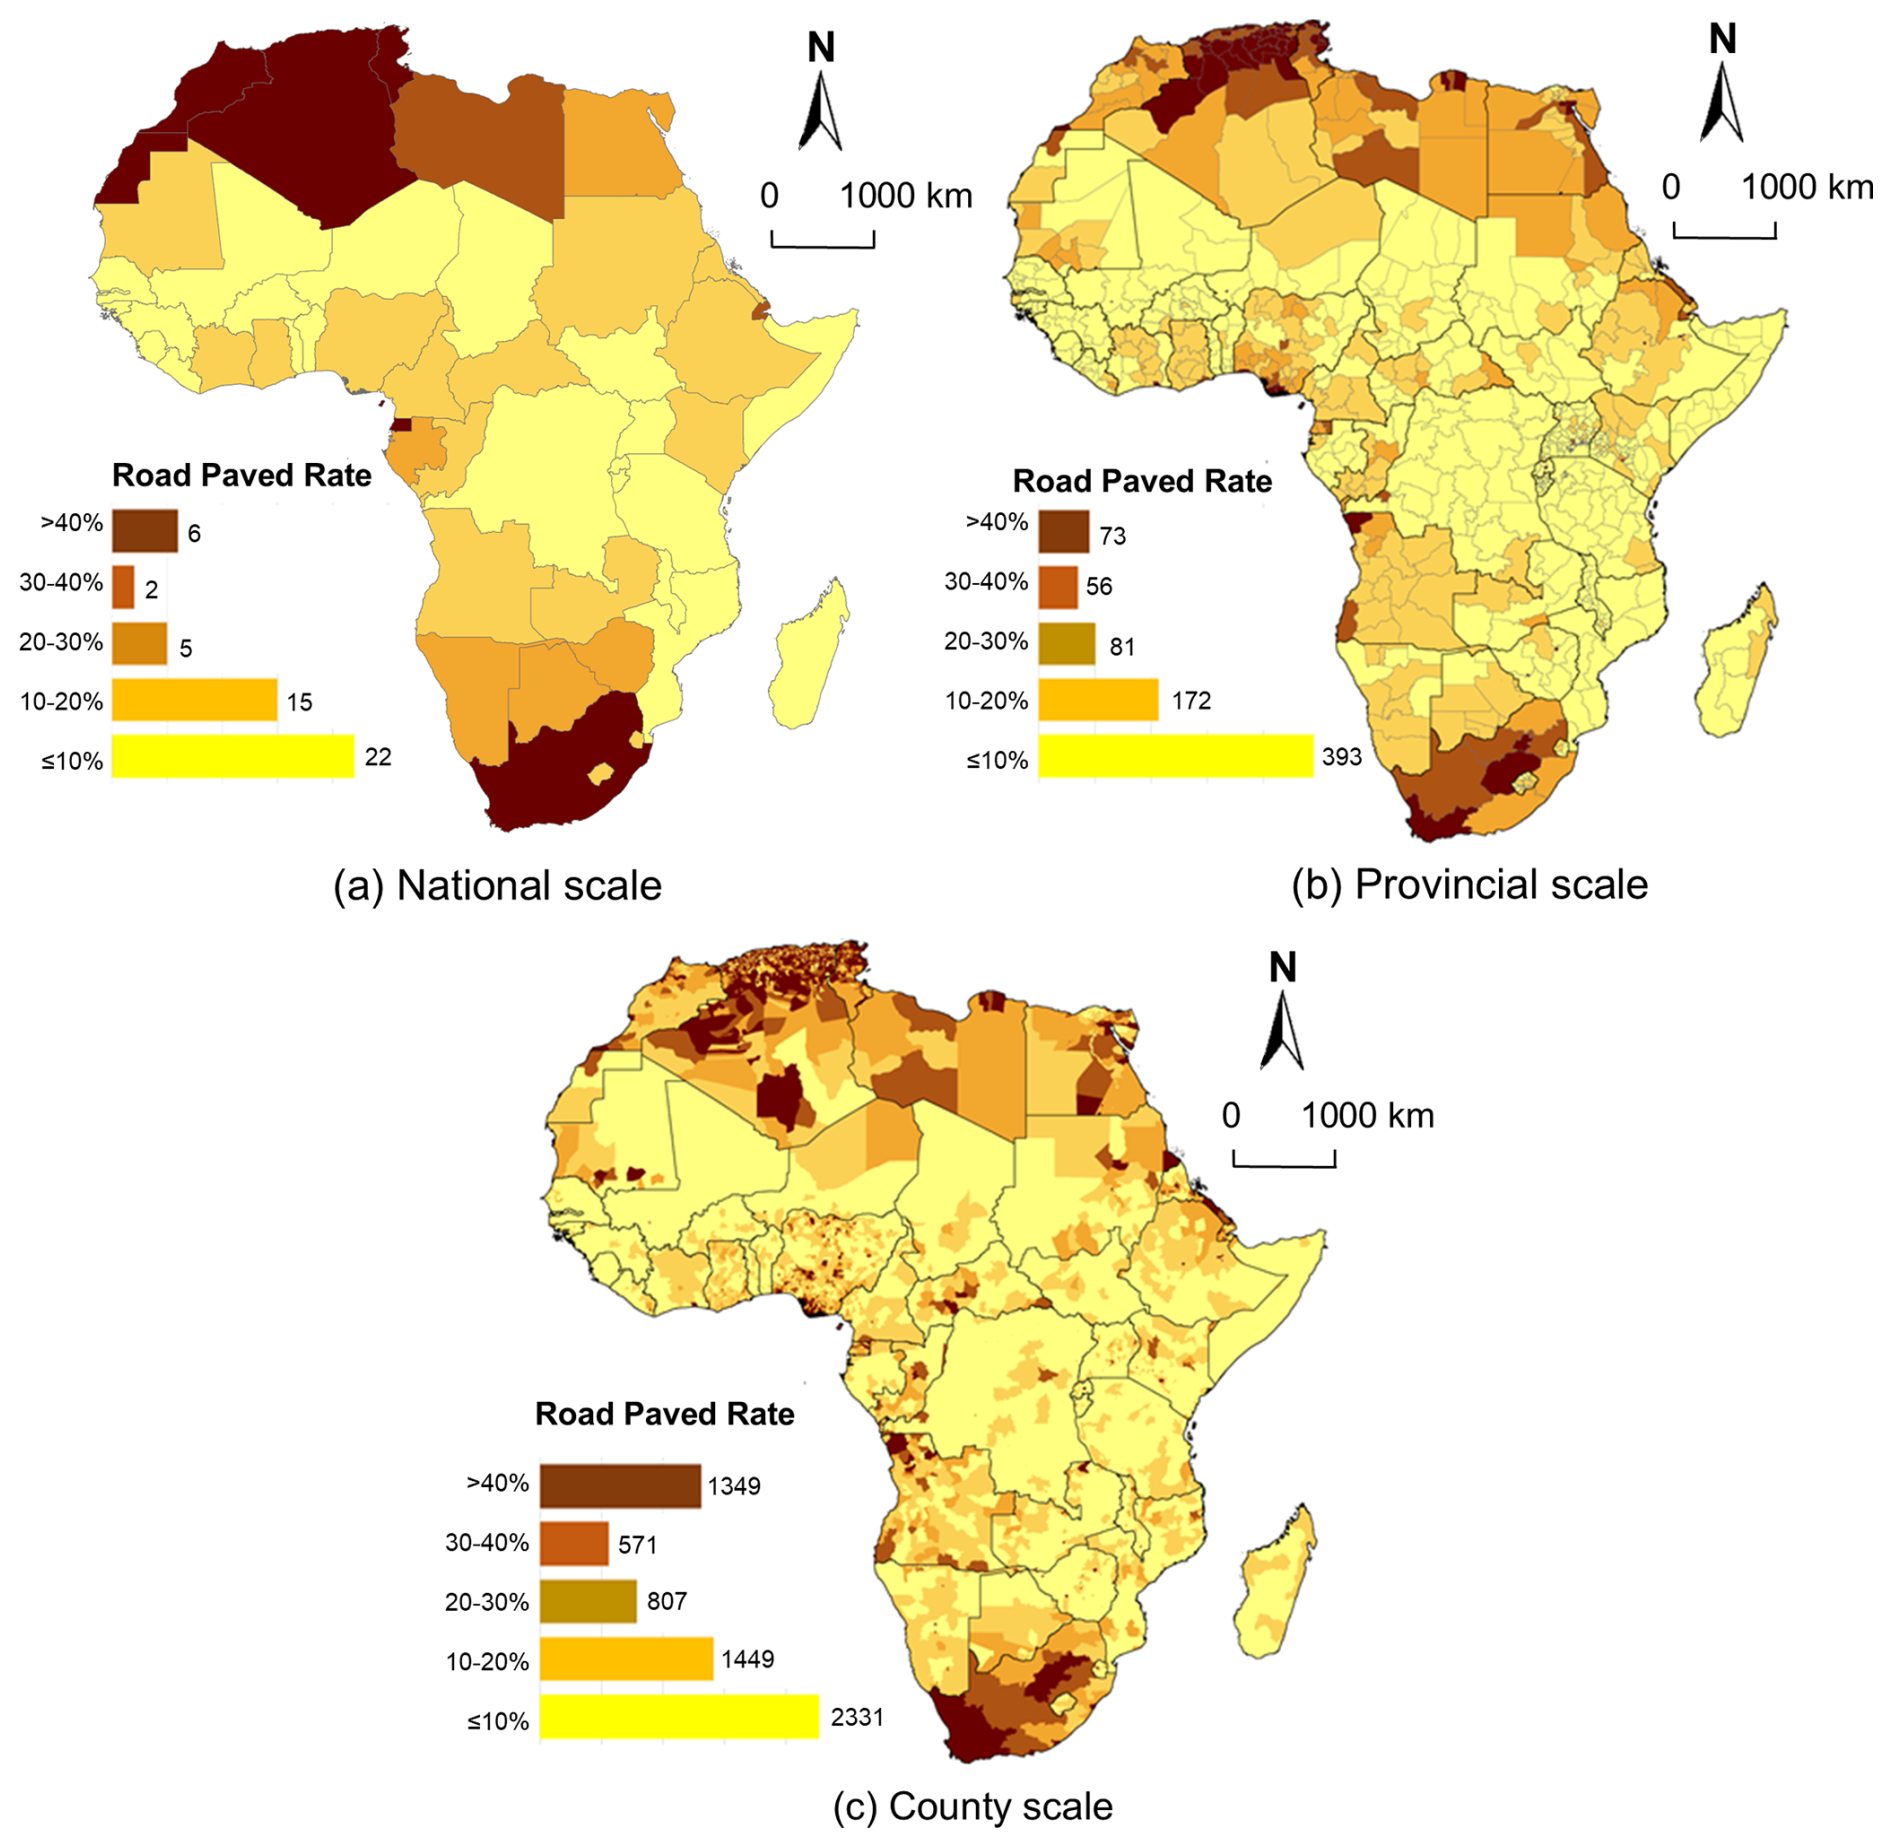
Figure 7Spatial Pattern Analysis at the National, Provincial, and County Levels.
At the national level, the average road paved rate across the 50 African countries and regions is only 17.4 %, ranging from a low of 5.54 % in Chad to a high of 50.77 % in Morocco. Only six African countries have a road paved rate above 40 %, while 37 countries and regions have rates below 20 %. The average road paved rate for 43 countries and regions in Sub-Saharan Africa (excluding South Africa) is merely 13.6 %. These results indicate that road paved rates in African countries and regions are generally low, with significant north-south disparities. At the provincial and county levels, only 9 % of provincial administrative divisions have a road paved rate above 40 %, mostly located in North Africa and South Africa. Similarly, only about 20 % of county administrative divisions have a road paved rate above 40 %, primarily in North Africa, South Africa, and some urban areas. Therefore, the overall spatial pattern of road paved rates in Africa shows a “higher in the north and south, lower in the central region” distribution, with higher rates in North Africa and South Africa, and lower rates in Sub-Saharan Africa excluding South Africa. The average road paved rate in the North Africa (40.7 %) is approximately three times that of Sub-Saharan Africa (excluding South Africa).
5.1 Data Quality
This study employed multi-source geospatial data and deep leaning model to develop road surface type dataset for 50 African countries and regions and verified its validity (accuracy ranging from 77 % to 96 %; F1 score ranging from 0.76 to 0.96). However, the quality of the dataset varies across different African countries and regions. For example, Burundi has an accuracy of 96 %, while Egypt's accuracy is only 77 %. This is likely because the proposed approach relies heavily on the proxy indicator “Road class” (Appendix A), and thus the proportions of various road classes may influence the quality of the developed dataset.
In order to verify this, Fig. 8 shows the classification accuracies for nine main road classes in the 50 African countries. For each country and each road class, 100 sampling points were randomly selected for analysis. As shown, most classification accuracies for these road classes are close to or exceed 80%, with some classes – specifically “Motorway”, “Trunk” and “Primary” – achieving accuracies above 95 %. These results demonstrate the effectiveness of the road surface type dataset, which is consistent with the finding in Fig. 4. However, the classification accuracies for the four road classes – “Residential”, “Service”, “Track” and “Unclassified” – are generally lower than those of other road classes. This is probably because high-class roads are predominantly paved and can be easily identified; in contrast, low-class roads may consist of a mix of paved and unpaved surfaces, making road surface classification more difficult. Moreover, Fig. 9 plots the relationship between the proportions of “Residential”, “Service”, “Track” and “Unclassified” roads in 50 African countries and the surface type classification accuracies for these countries. This figure shows that the proportions of both “Residential” and “Service” roads have a moderate negative correlation (i.e., −0.405 and −0.527, respectively) with the corresponding classification accuracy of each country. This finding confirms that the proportions of certain road classes (e.g., “Residential” and “Service”) may affect the quality of the road surface type dataset. For instance, the higher the proportion of “Residential” roads (e.g., 78 % for Egypt), the lower the corresponding classification accuracy (e.g., 77 % for Egypt).
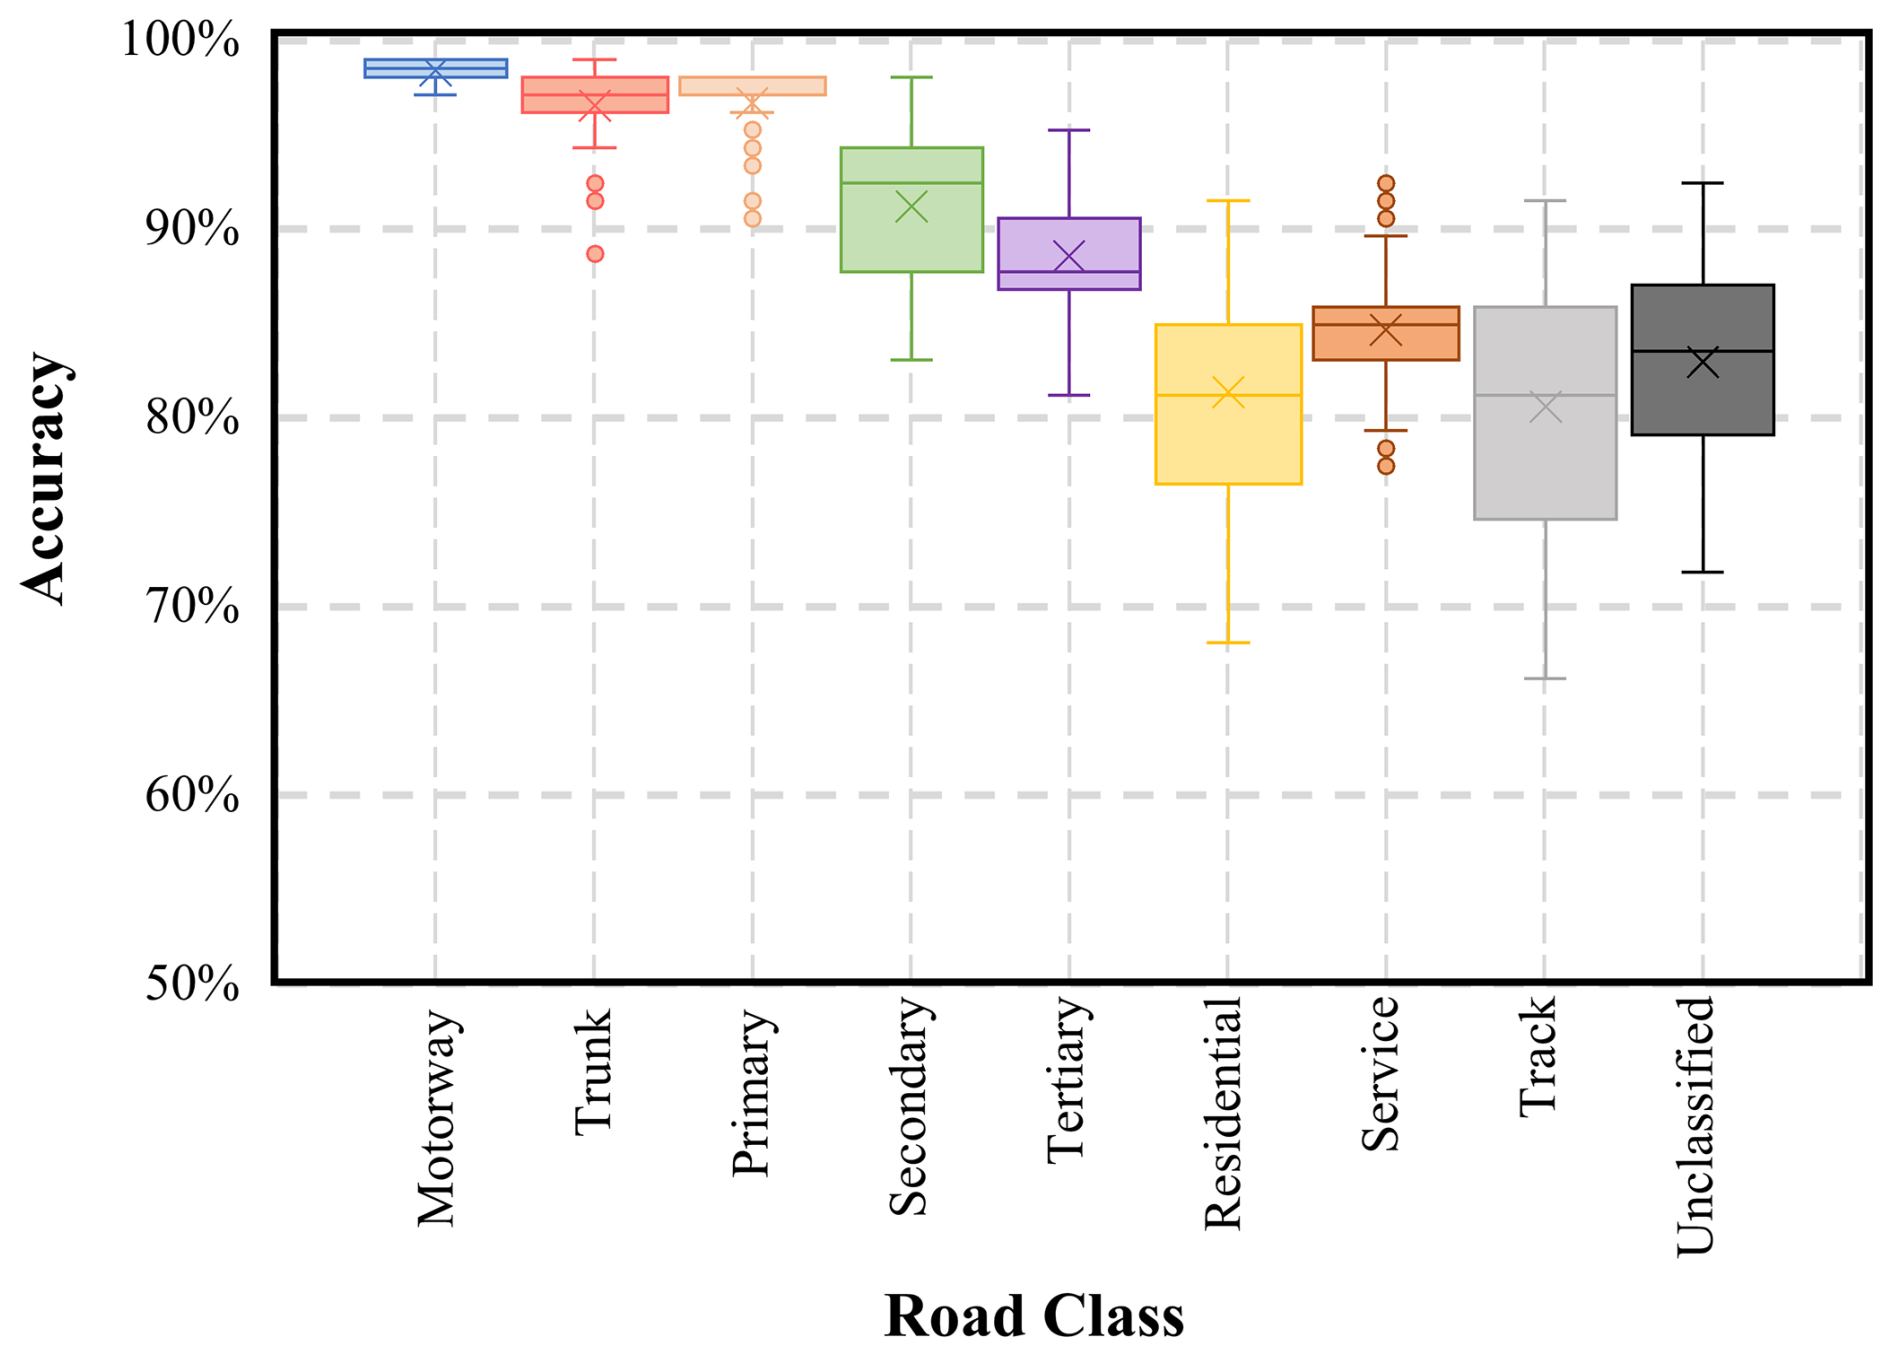
Figure 8The Box Plot to Show the Classification Accuracy for Each of Main Road Classes For 50 African Countries.
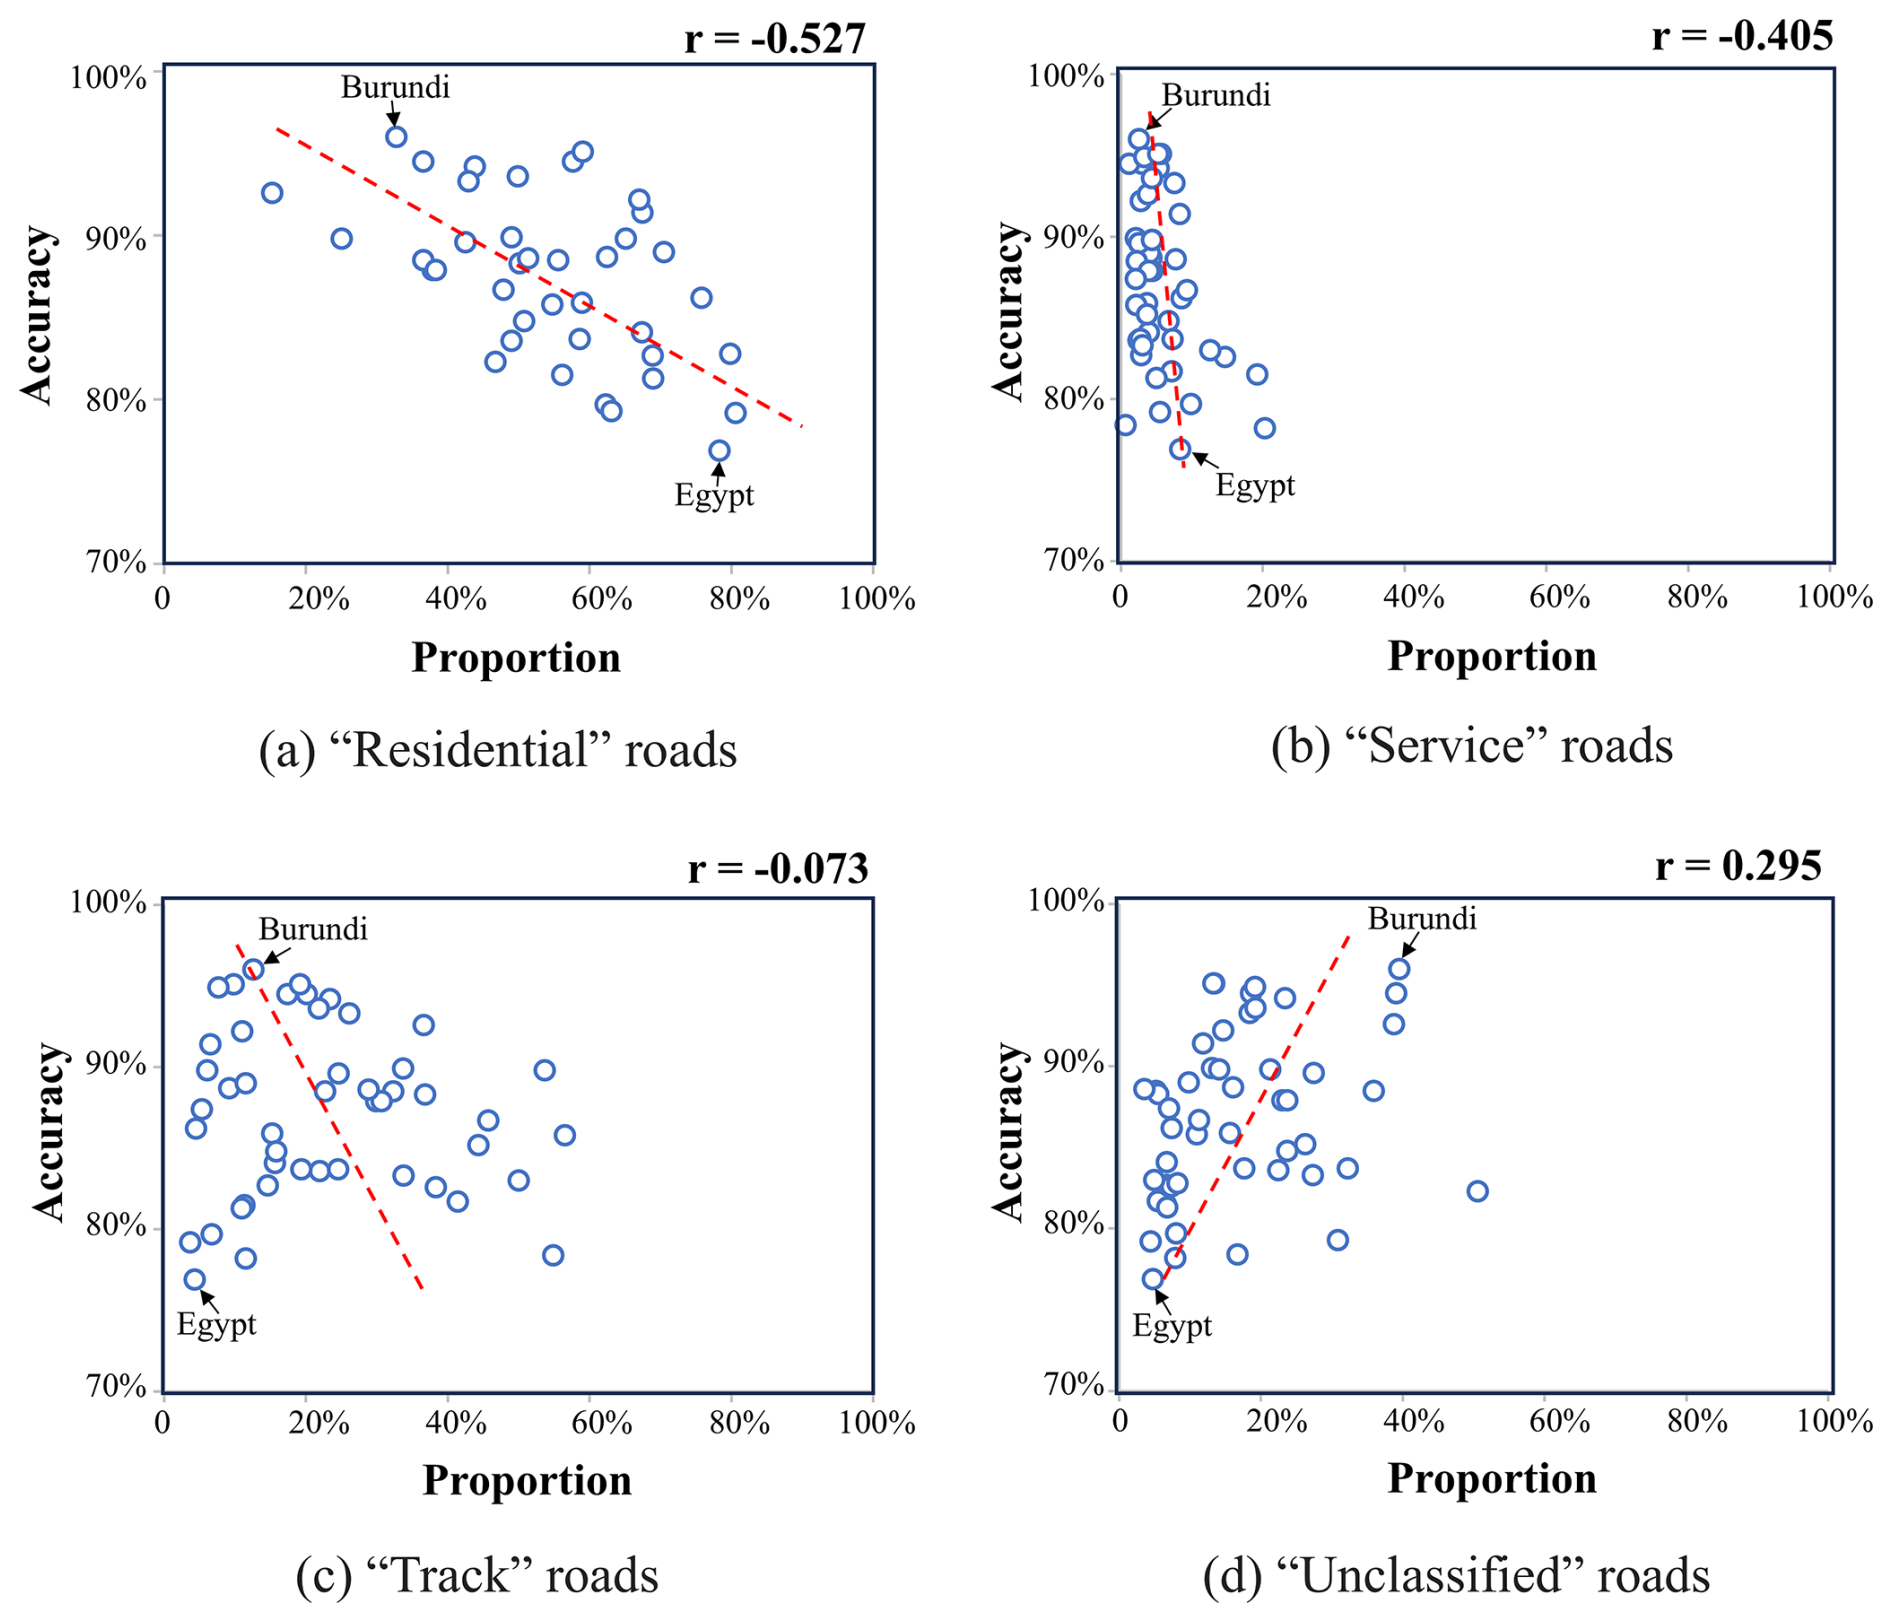
Figure 9The Correlation Between the Proportions of Four Road Classes (a) “Residential”, (b) “Service”, (c) “Track” and (d) “Unclassified” and Corresponding Classification Accuracies For 50 African Countries.
Further, taking a local area in Egypt as an example, combined with Google high-resolution remote sensing imagery and Google street view, it can be observed that the backbone of the road network in this region predominantly consists of paved roads (Fig. 10b), while non-backbone roads (especially in rural areas) are mostly unpaved (Fig. 10c); urban areas in Egypt are predominantly paved (Fig. 10d), although some roads remain unpaved (Fig. 10e). These results indicate that the road surface type classification in this study is reasonable.
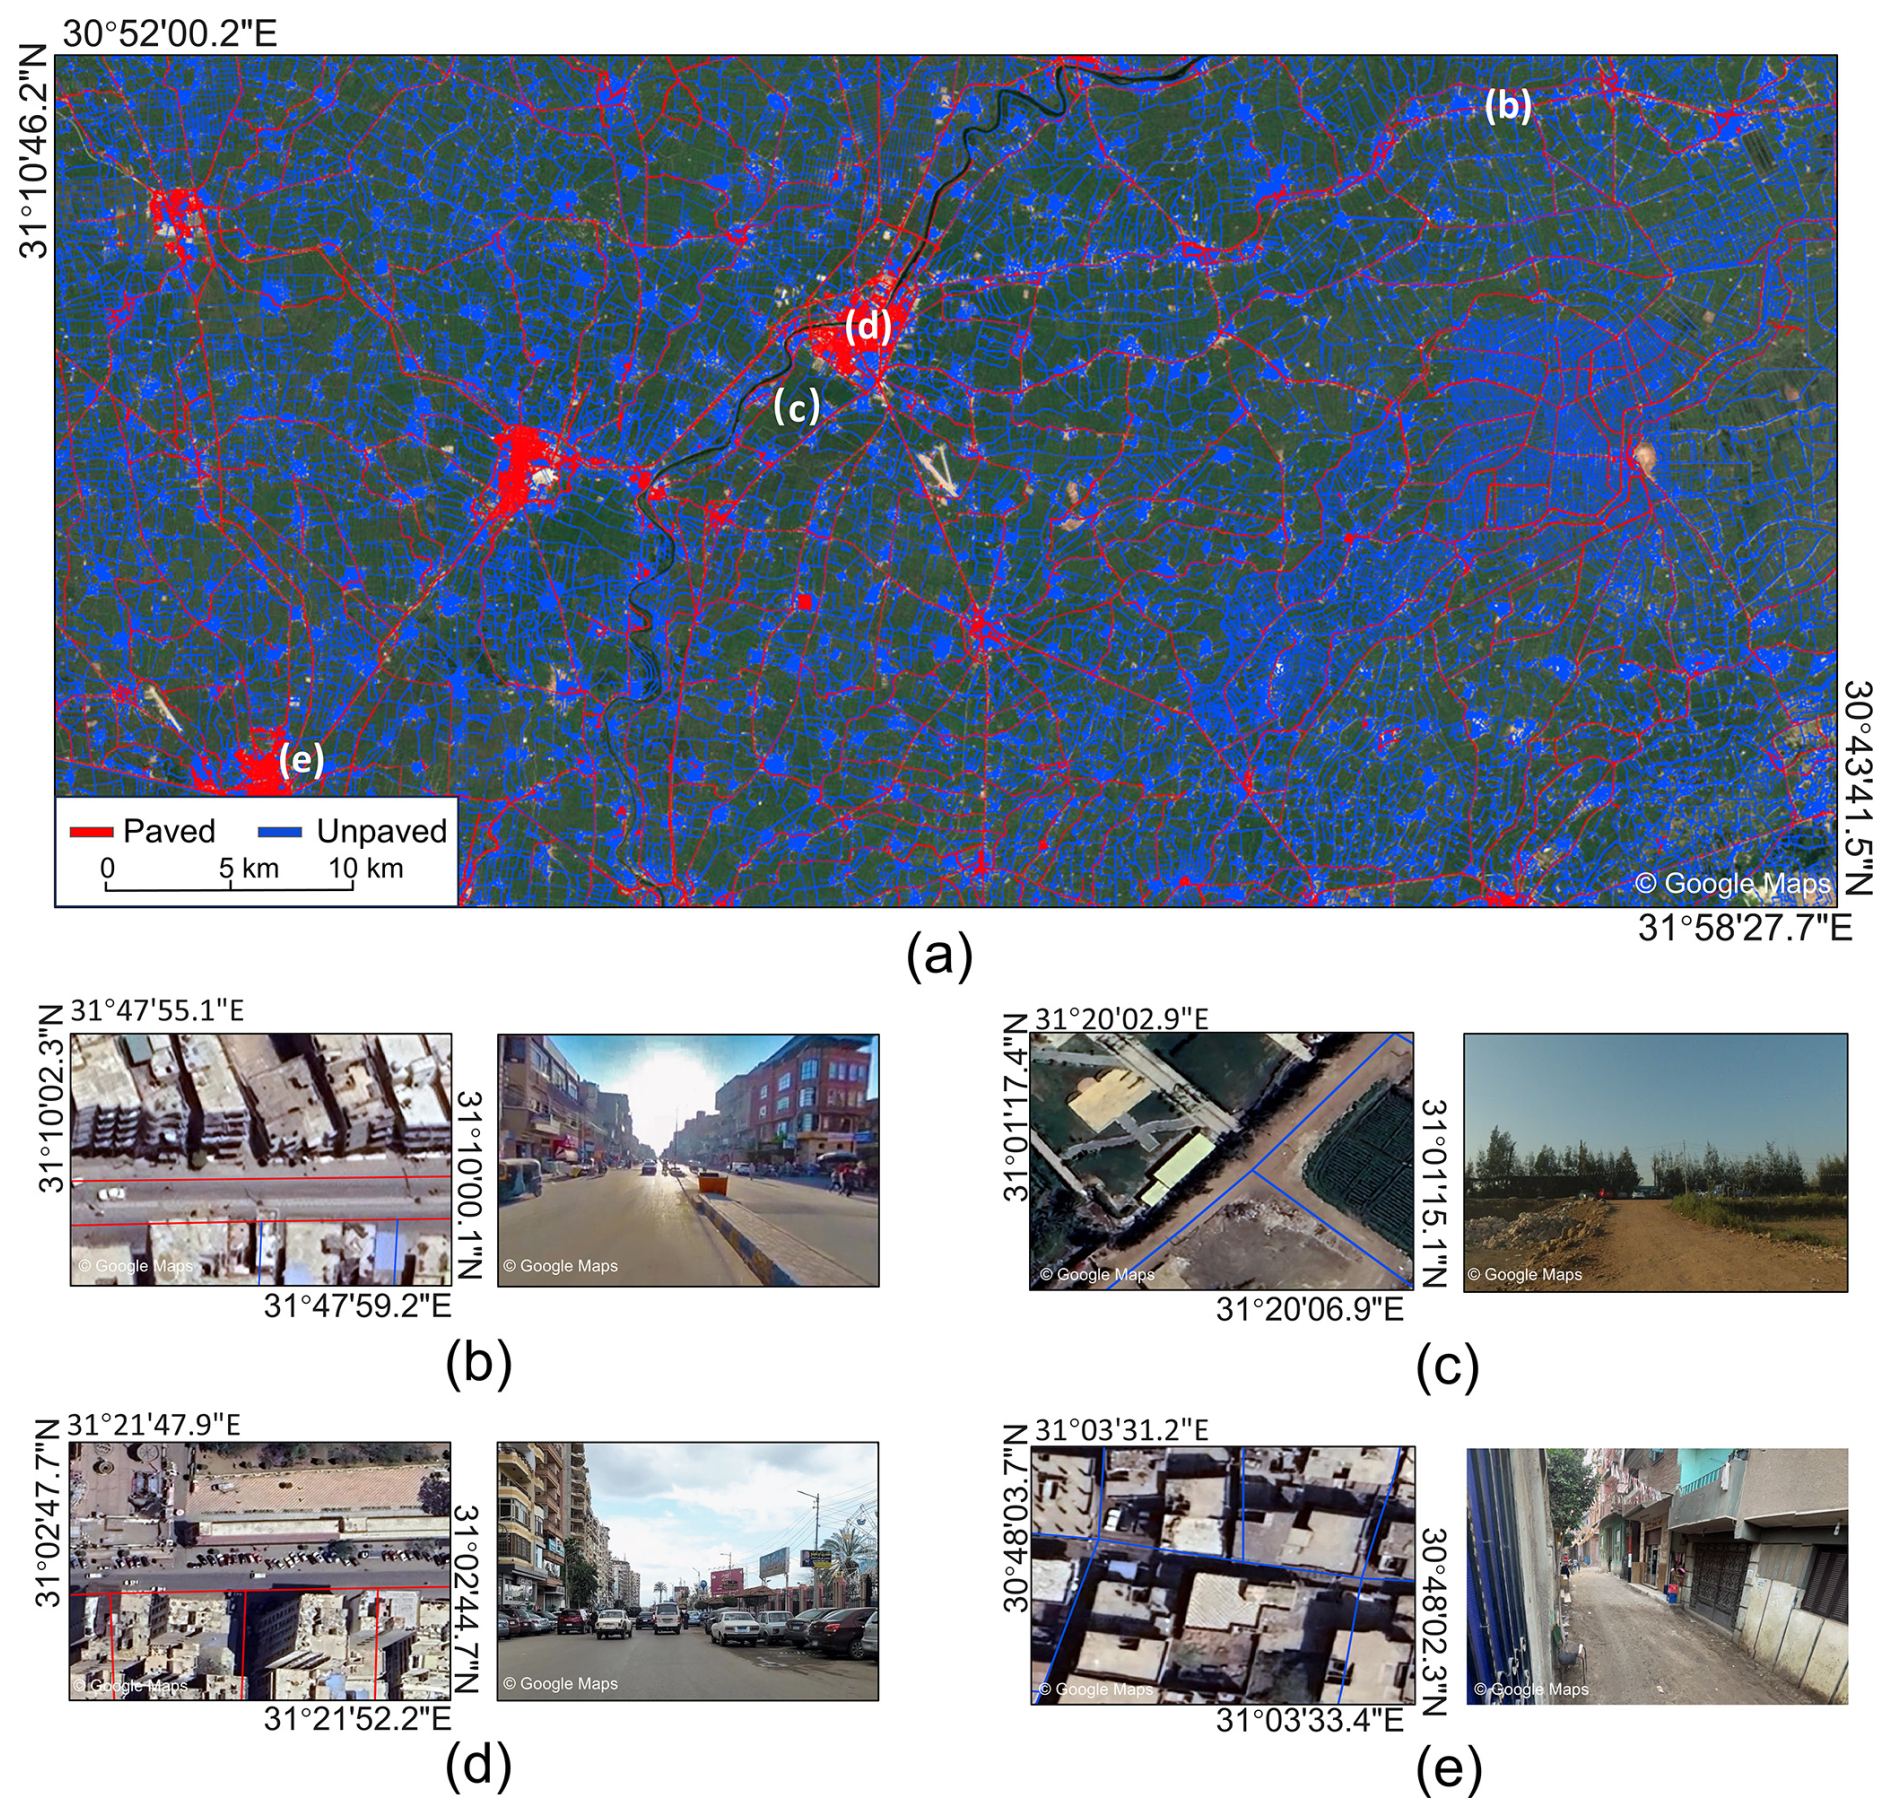
Figure 10An Example of Road Surface Type Dataset in Egypt (source: © Google Maps 2025, https://www.google.com/maps/, last access: 2 July 2025).
Despite this, misclassifications of road surface types are inevitable. Taking urban areas in Egypt as an example (Fig. 11a), Fig. 11b shows a 1 km × 1 km grid area in this region. Figure 11c displays two road classes within this grid area: “trunk” and “residential”. From Fig. 11b and c, it is evident that most “trunk” roads in this area are classified as paved, while most “residential” roads are classified as unpaved. However, street view imagery reveals that “residential” roads include both unpaved (Fig. 11d) and paved (Fig. 11e) types. Therefore, distinguishing road surface types in this area based solely on road class is difficult. Additionally, the spatial resolution of the GDP and population data we obtained (both 1 km) also makes it challenging to finely differentiate road surface types within this area.
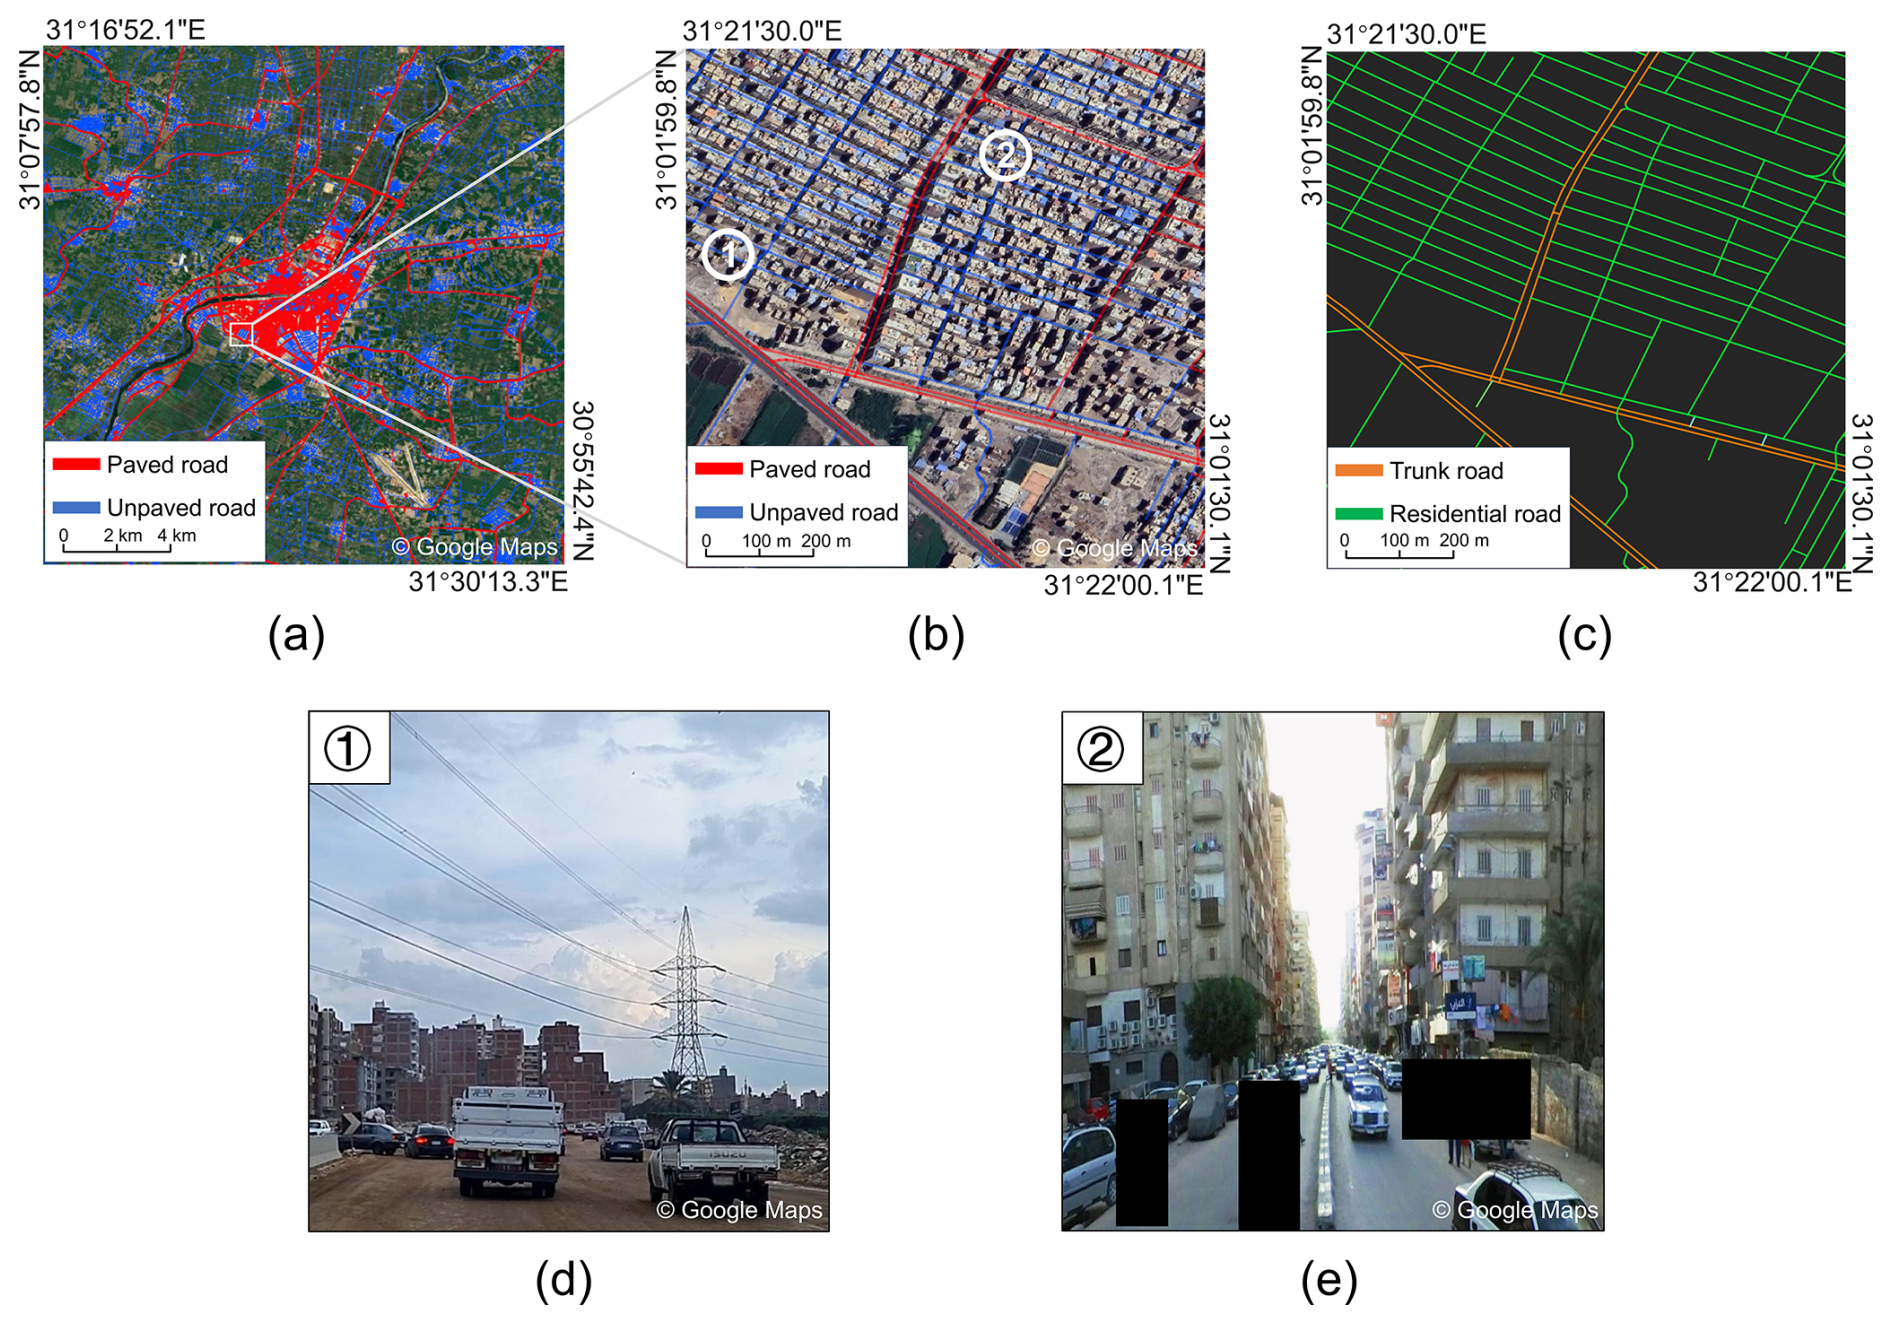
Figure 11An Example of Explaining the Data Quality of the African Road Surface Type Dataset (source: © Google Maps 2025, https://www.google.com/maps/, last access: 2 July 2025).
Additionally, open geospatial data inevitably have quality issues. For instance, although existing studies have found that the geometric positional accuracy and completeness of OSM road data in Africa are generally high, gaps in road data are unavoidable (Zhou et al., 2022); road surface types and road classes labeled by global volunteers in OSM may also contain errors (Zhou et al., 2022). The GHSL-BUILT building height data, derived from medium-resolution remote sensing imagery (Sentinel-2), also inevitably has estimation biases for building heights (Pesaresi et al., 2021). LandScan data may be underestimated in urban-rural transition zones and overestimated in sparsely populated areas (Calka et al., 2019). Nevertheless, OSM road data remain the only globally available open data source that includes road surface type labels; GHSL and LandScan data are also globally comprehensive, freely accessible geospatial data products with long time series, which is why this study selected these data for experimental analysis. However, in the future, other data sources (e.g., CORINE Land Cover, Pontius, 2017; World Settlement Footprint, Marconcini et al., 2020; and Global Human Settlement Population Grid, Yin et al., 2021) could be considered, and their impact on the quality of road surface type dataset could be analyzed.
5.2 Implications and Significance
Compared to traditional statistical data such as those from IRF, the first-ever road surface type dataset for 50 African countries and regions developed in this study not only enables the calculation of statistical indicators such as paved road length and road paved rate for each country and region but also facilitates detailed analyses of which roads are paved or unpaved. This provides valuable decision-making support for improving local transportation infrastructure (e.g., upgrading unpaved roads to paved ones). Additionally, road surface types serve as an important data source for assessing SDG 9.1. Therefore, this dataset can also be combined with population and urban built-up area data to analyze the proportion of rural populations within 2 km of paved or unpaved roads in various African countries (Li et al., 2021), to provide data support for evaluating Africa's sustainable development goals. Last but not least, this dataset can be combined with location data of traffic accidents to analyze the relationship between road surface types and traffic accidents (Patrick and Yves, 2022); with traffic carbon emission data to analyze the relationship between road surface types and environmental impacts (Ling et al., 2024); or with national income data to analyze the relationship between road surface types and socio-economic development (Anyanwu and Erhijakpor, 2009).
Moreover, this study utilized multisource geospatial big data and deep learning models to develop the African road surface type dataset. The primary advantage of this method is that its source data (including OSM, LandScan, GDP, GHSL-BUILT, and ESRI Land Cover) are not only openly accessible but also globally covered. Therefore, this method can be applied to identify road surface types in other countries and regions worldwide, providing methodological support for the development of a global road surface type dataset.
5.3 Limitations and future work
-
This study adopted the method proposed by Zhou et al. (2025b) to develop the African road surface type dataset. This method designs 16 proxy indicators across three dimensions (Road network, Socio-economic, and Geographical Environment) from five types of open geospatial data to infer road surface types. In the future, additional data sources, such as terrain data, could be incorporated, as unpaved roads are likely common in mountainous areas due to high construction costs. Thus, additional proxy indicators (e.g. elevation and slope) may be considered to determine whether they can enhance the classification accuracy of the data product.
-
Road surface types are not limited to just paved and unpaved roads; they can also be further subdivided into categories such as asphalt, concrete, and dirt roads. However, we found that most paved roads in Africa are asphalt, and most unpaved roads are dirt; therefore, this study only considered the “paved” and “unpaved” categories. Nevertheless, in the future, by supplementing field-measured data, it may be possible to explore whether this method can be used to develop dataset that include more detailed road surface type classifications.
-
The African road surface type dataset developed in this study is limited to a single year, approximately 2020. This is because the source data were all obtained from 2020 or nearby years (i.e., 2018 or 2019). Although existing studies have reported that GDP and building height data change little within a period of 1–2 years (African Development Bank Group, 2020; Ali et al., 2025), inconsistencies in the years may still affect the quality of our dataset. Therefore, it is worthwhile to investigate whether the quality of the road surface type dataset could be improved by using source data obtained from the same year.
-
Although most open geospatial big data (such as OSM, GDP, and population data) include information from different years, which could potentially be used to develop road surface type dataset for multiple years, validation data are difficult to obtain. Specifically, it is challenging to interpret roads and their surface types using open-source medium- to low-resolution satellite imagery (e.g., Landsat or Sentinel-2). Although Google satellite imagery offers higher resolution, the update years of Google imagery for different areas within a country may not be consistent, making it difficult to analyze changes in road surface types. Nonetheless, in the future, this method could be attempted to develop road surface type dataset for different years, and accuracy could be validated using long-time-series high-resolution remote sensing imagery; further, spatiotemporal changes in road surface types at a large scale could be analyzed.
The First Road Surface Dataset for 50 African countries and reigns is distributed under the CC BY 4.0 License. The data can be downloaded from the data repository Figshare at https://doi.org/10.6084/m9.figshare.29424107 (Liu and Zhou, 2025).
This study developed the first dataset containing road surface types for every road in 50 African countries and regions, based on multi-source geospatial data and deep learning model. The accuracy of this dataset was evaluated through visual interpretation using high-resolution Google satellite imagery and Google street view, while its effectiveness was indirectly analyzed by comparing it with IRF statistical data and socio-economic indicators such as HDI and GNI per capita. Finally, the spatial distribution patterns of road surface types across these 50 African countries and regions were analyzed using the developed dataset. The main findings are as follows:
-
The accuracy of the road surface type dataset for 50 African countries and regions ranges from 77 % to 96 %, with F1 scores between 0.76 and 0.96, validating the effectiveness of the developed dataset.
-
In terms of total road length, paved road length, and road paved rate, the correlation coefficients between calculations based on our dataset and the IRF statistical data demonstrate a strong correlation, ranging from 0.69 to 0.94. Regarding socio-economic indicators (GNI per capita and HDI), the calculations based on our dataset also exhibit high correlation with the relevant statistical data, ranging from 0.80 to 0.83, indirectly verifying the effectiveness of our dataset.
-
From a spatial perspective, the road paved rate in Africa is generally low. The average road paved rate across the 50 African countries and regions is only 17.4 %, exhibiting a spatial pattern of “higher in the north and south, lower in the central region”. Specifically, the average road paved rate in North Africa is approximately three times that of Sub-Saharan Africa (excluding South Africa).
The dataset developed in this study includes the surface type of every road in Africa, providing valuable support for decision-making aimed at improving the region's road infrastructure. Additionally, this dataset can be combined with data on population and urban built-up areas to assess Africa's Sustainable Development Goals (e.g., SDG 9.1). Furthermore, it can be integrated with other datasets – such as those on traffic accidents, carbon emissions, and national income – to analyze the impact of road surface types on road safety, energy consumption, ecological environment, and socio-economic development.
This figure shows the selected proxy indicators for 50 African countries. For each country, each value in the grid represents the mean SHAP of the corresponding proxy indicator (e.g., road class). Darker colors indicate higher contributions to the classification results. Empty values mean that the corresponding proxy indicator was not used for model training, because it has a high correlation (> 0.7) with at least one other proxy indicator but its mean SHAP is lower.
ZL developed the data and wrote the original manuscript. QZ proposed methods and designed experiments. FZ reviewed and improved the manuscript. LP checked and validated data quality. All authors discussed and improved the manuscript.
The contact author has declared that none of the authors has any competing interests.
Publisher's note: Copernicus Publications remains neutral with regard to jurisdictional claims made in the text, published maps, institutional affiliations, or any other geographical representation in this paper. The authors bear the ultimate responsibility for providing appropriate place names. Views expressed in the text are those of the authors and do not necessarily reflect the views of the publisher.
The project was supported by National Natural Science Foundation of China (grant no. 42471492).
This research has been supported by the National Natural Science Foundation of China (grant no. 42471492).
This paper was edited by Yuanzhi Yao and reviewed by three anonymous referees.
Abdulkadr, A. A., Juma, L. O., Gogo, A. F., and Neszmélyi, G. I.: East African Transport Infrastructure: The Cases of Ethiopia, Kenya and Tanzania. Reg. Econ. South Russ., 10, 89–102, 2022.
African Development Bank Group: African Economic Outlook 2020: Developing Africa's Workforce for the Future, African Development Bank, https://doi.org/10.15688/re.volsu.2022.4.8, 2020.
African Union Commission Agenda 2063: African Union Policy Doc., ISBN 978-92-95104-23-5, 2015.
Ali, S., Alireza, D., and Parviz, A.: Volumetric insights into urban growth analysis: Investigating vertical and horizontal patterns, Sustainable Cities and Society, 130, 106589, ISBN 978-9938-882-95-7, 2025.
Anyanwu, J. C. and Erhijakpor, A. E. O.: The Impact of Road Infrastructure on Poverty Reduction in Africa, in: Poverty in Africa, edited by: Beasley, T. W., 40 pp., https://doi.org/10.1016/j.scs.2025.106589, 2009.
Arik, S. Ö. and Pfister, T.: Tabnet: Attentive Interpretable Tabular Learning, Proc. AAAI Conf. Artif. Intell., 35, 6679–6687, https://doi.org/10.48550/arXiv.1908.07442, 2021.
Baak, M., Koopman, R., Snoek, H., and Klous, S.: A new correlation coefficient between categorical, ordinal and interval variables with Pearson characteristics. Comput. Stat. Data Anal., 152, 107043, https://doi.org/10.1016/j.csda.2020.107043, 2020.
Barrington-Leigh, C. and Millard-Ball, A.: The World's User-Generated Road Map Is More Than 80 % Complete, PLoS ONE, 12, e0180698, https://doi.org/10.1371/journal.pone.0180698, 2017.
Biber-Freudenberger, L., Bogner, C., Bareth, G., Bollig, M., Dannenberg, P., Revilla Diez, J., Greiner, C., Mtweve, P. J., Klagge, B., Kramm, T., Müller-Mahn, D., Moseti, V., Nyamari, N., Ochuodho, D. O., Kuntashula, E., Theodory, T., Thorn, J. P. R., and Börner, J.: Impacts of road development in sub-Saharan Africa: A call for holistic perspectives in research and policy, iScience, 28, 111913, https://doi.org/10.1016/j.isci.2025.111913, 2025.
Calka, B. and Bielecka, E.: Reliability Analysis of LandScan Gridded Population Data. The Case Study of Poland, ISPRS Int. J. Geo-Inf., 8, 222, https://doi.org/10.3390/ijgi8050222, 2019.
Central Intelligence Agency: The World Factbook, CIA Publ., https://www.cia.gov/the-world-factbook/, last access: 2 July 2025.
Chen, J., Gao, M., Cheng, S., Hou, W., Song, M., Liu, X., and Liu, Y.: Global 1 Km × 1 Km Gridded Revised Real Gross Domestic Product and Electricity Consumption During 1992–2019 Based on Calibrated Nighttime Light Data, Sci. Data, 9, 202, https://doi.org/10.1038/s41597-022-01322-5, 2022.
Chen, K., Tan, G., Lu, M., and Wu, J.: CRSM: A Practical Crowdsourcing-Based Road Surface Monitoring System, Wirel. Netw., 22, 765–779, https://doi.org/10.1007/s11276-015-0996-y, 2016.
Chen, Y., Li, C., Wang, W., Zhang, Y., Chen, X. M., and Gao, Z.: The Landscape, Trends, Challenges, and Opportunities of Sustainable Mobility and Transport, NPJ Sustain. Mobil. Transp., 2, https://doi.org/10.1038/s44333-025-00026-8, 2025.
Dobson, J. E., Bright, E. A., Coleman, P. R., Durfee, R. C., and Worley, B. A.: Landscan: A Global Population Database for Estimating Populations at Risk. Photogramm, Eng. Remote Sens., 66, 849–857, 2000.
Greening, T. and O'Neill, P.: Traffic Generated Dust from Unpaved Roads: An Overview of Impacts and Options for Control, Proc. 1st AFCAP Pract. Conf., 23–25 November 2010, https://www.research4cap.org/wp-content/uploads/ral/Greening-etal-Global-2010-Unpaved+Dust+Overview-AFCAP-v101211.pdf, (last access: 2 July 2025), 2010.
Gwilliam, K., Foster, V., Archondo-Callao, R., Briceño-Garmendia, C., Nogales, A., and Sethi, K.: The Burden of Maintenance: Roads in Sub-Saharan Africa, Africa Infrastruct., Ctry. Diagn., 14, https://roadsforwater.org/wp-content/uploads/2013/10/the-burden-of-maintenance_roads-in-SSA.pdf, (last access: 2 July 2025), 2008.
Harikrishnan, P. M. and Gopi, V. P.: Vehicle Vibration Signal Processing for Road Surface Monitoring, IEEE Sens. J., 17, 5192–5197, https://doi.org/10.1109/JSEN.2017.2719865, 2017.
Jiang, S., Zhang, Z., Ren, H., Wei, G., Xu, M., and Liu, B.: Spatiotemporal Characteristics of Urban Land Expansion and Population Growth in Africa from 2001 to 2019: Evidence from Population Density Data, ISPRS Int. J. Geo-Inf., 10, 584, https://doi.org/10.3390/ijgi10090584, 2021.
Karra, K., Kontgis, C., Statman-Weil, Z., Mazzariello, J., Mathis, M., and Brumby, S.: Global Land Use/Land Cover with Sentinel-2 and Deep Learning, Proc. IEEE IGARSS, 4704–4707, https://doi.org/10.1109/IGARSS47720.2021.9553499, 2021.
Kresnanto, N. C.: Model of Relationship Between Car Ownership Growth and Economic Growth in Java, IOP Conf. Ser. Mater. Sci. Eng., 650, 012047, https://doi.org/10.1088/1757-899X/650/1/012047, 2019.
Li, W., Zhou, Q., Zhang, Y., and Chen, Y.: Visualising Rural Access Index and Not Served Rural Population in Africa, Environ. Plan. A Econ. Space, 54, 215–218, https://doi.org/10.1177/0308518X211035786, 2021.
Li, X. and Goldberg, D. W.: Toward a Mobile Crowdsensing System for Road Surface Assessment, Comput. Environ. Urban Syst., 69, 51–62, https://doi.org/10.1016/j.compenvurbsys.2017.12.005, 2018.
Ling, C., Tang, J., Zhao, P., Xu, L., Lu, Q., Yang, L., Huang, F., Lyu, W., and Yang, J.: Unraveling the Relation Between Carbon Emission and Carbon Footprint: A Literature Review and Framework for Sustainable Transportation, NPJ Sustain. Mobil. Transp., 1, 13, https://doi.org/10.1038/s44333-024-00013-5, 2024.
Liu, Z. and Zhou, Q.: The First Road Surface Type Dataset for 50 African Countries and Regions, Figshare [data set], https://doi.org/10.6084/m9.figshare.29424107, 2025.
Louhghalam, A., Akbarian, M., and Ulm, F. J.: Roughness-Induced Pavement–Vehicle Interactions: Key Parameters and Impact on Vehicle Fuel Consumption, Transp. Res. Rec., 2525, 62–70, 2015.
Marconcini, M., Metz-Marconcini, A., Üreyen, S., Palacios-Lopez, D., Hanke, W., Bachofer, F., Zeidler, J., Esch, T., Gorelick, N., Kakarla, A., Paganini, M., and Strano, E.: Outlining where humans live, the World Settlement Footprint 2015, Sci. Data, 7, 242, https://doi.org/10.1038/s41597-020-00580-5, 2020.
Menegazzo, J. and von Wangenheim, A.: Multi-Contextual and Multi-Aspect Analysis for Road Surface Type Classification Through Inertial Sensors and Deep Learning, Proc. IEEE SBESC, 1–8, https://doi.org/10.1109/SBESC51047.2020.9277846, 2020.
Mohit, P. M. and Slobodan, P. S.: Understanding dynamics of population flood exposure in Canada with multiple high-resolution population datasets, Sci. Total Environ., 759, 143559, https://doi.org/10.1016/j.scitotenv.2020.143559, 2021.
Patrick, M. and Yves, A.: Access to Paved Roads, Gender, and Youth Unemployment in Rural Areas: Evidence from Sub-Saharan Africa, Afr. Dev. Rev., 35, 165–180, https://doi.org/10.1111/1467-8268.12701, 2022.
Pérez-Fortes, A. P. and Giudici, H.: A Recent Overview of the Effect of Road Surface Properties on Road Safety, Environment, and How to Monitor Them, Environ. Sci. Pollut. Res., 29, 65993–66009, https://doi.org/10.1007/s11356-022-21847-x, 2022.
Pesaresi, M., Corbane, C., Ren, C., and Edward, N.: Generalized Vertical Components of Built-Up Areas from Global Digital Elevation Models by Multi-Scale Linear Regression Modelling, PLoS ONE, 16, e0244478, https://doi.org/10.1371/journal.pone.0244478, 2021.
Pontius Jr., R. G.: European Landscape Dynamics: Corine Land Cover Data, Photogramm. Eng. Remote Sens., 83, 79, https://doi.org/10.1201/9781315372860, 2017.
Randhawa, S., Eren, A., Guntaj, R., Herfort, B., Lautenbach, S., and Zipf, A.: Paved or unpaved? A deep learning derived road surface global dataset from Mapillary Street-View Imagery, ISPRS J. Photogramm. Remote Sens., 223, 1–14, https://doi.org/10.1016/j.isprsjprs.2025.02.020, 2025.
Sattar, S., Li, S., and Chapman, M.: Road Surface Monitoring Using Smartphone Sensors: A Review, Sensors, 18, 3845, https://doi.org/10.3390/s18113845, 2018.
Sha, A.: Advances and Development Trends in Eco-friendly Pavements, J. Road Eng., 1, 1–42, https://doi.org/10.1016/j.jreng.2021.12.002, 2021.
Shtayat, A., Moridpour, S., and Best, B.: A Review of Monitoring Systems of Pavement Condition in Paved and Unpaved Roads, J. Traffic Transp. Eng., 7, 629–638, https://doi.org/10.1016/j.jtte.2020.03.004, 2020.
Styer, J., Tunstall, L., Landis, A. E., and Grenfell, J.: Innovations in Pavement Design and Engineering: A 2023 Sustainability Review, Heliyon, 10, e33481, https://doi.org/10.1016/j.heliyon.2024.e33602, 2024.
Turner, B. International Road Federation (IRF), Statesman's Yearb., 50 pp., https://doi.org/10.1007/978-1-349-74027-7_41, 2008
Workman, R., Wong, P., Wright, A., and Wang, Z.: Prediction of Unpaved Road Conditions Using High-Resolution Optical Satellite Imagery and Machine Learning, Remote Sens., 15, 3985, https://doi.org/10.3390/rs15163985, 2023.
World Bank: World Bank First African Observatory to Tackle the Continent's Road Safety Crisis, World Bank Press Release, 23 May 2018, https://www.worldbank.org/en/news/press-release/2018/05/23/first-african-observatory-to-tackle-the-continents-road-safety-crisis (last access: 2 July 2025), 2018.
Yan, M., Pang, Y., He, Y., and Meng, S.: Consistency Analysis and Accuracy Evaluation of Multi-Source Land Cover Products in Pu'er, For. Resour. Manag., 173–182, https://doi.org/10.13466/j.cnki.lyzygl.2023.01.020, 2023.
Yin, X., Li, P., Feng, Z., Yang, Y., You, Z., and Xiao, C.: Which Gridded Population Data Product Is Better? Evidences from Mainland Southeast Asia (MSEA), ISPRS Int. J. Geo-Inf., 10, 681, https://doi.org/10.3390/ijgi10100681, 2021.
Zhou, Q. and Li, Z.: A comparative study of various strategies to concatenate road segments into strokes for map generalization, Int. J. Geogr. Inf. Sci., 26, 691–715, https://doi.org/10.1080/13658816.2011.609990, 2012.
Zhou, Q. and Li, Z.: How many samples are needed? An investigation of binary logistic regression for selective omission in a road network, Cartography and Geographic Information Science, 1545-0465, 20 November, https://doi.org/10.1080/15230406.2015.1104265, 2015.
Zhou, Q., Wang, S., and Liu, Y.: Exploring the accuracy and completeness patterns of global land-cover/land-use data in OpenStreetMap, Appl. Geogr., 145, 102742, https://doi.org/10.1016/j.apgeog.2022.102742, 2022.
Zhou, Q., Liu, Z., and Huang, Z.: Mapping Road Surface Type of Kenya Using OpenStreetMap and High-resolution Google Satellite Imagery, Sci. Data, 11, 331, https://doi.org/10.1038/s41597-024-03158-7, 2024.
Zhou, Q., Duan, J., Qiao, J., Liu, Z., and Yang, H.: A Large Crowdsourced Street View Dataset for Mapping Road Surface Types in Africa, Sci. Data, 12, 1003, https://doi.org/10.1038/s41597-025-05153-y, 2025a.
Zhou, Q., Liu, Y., and Liu, Z.: Mapping National-Scale Road Surface Types Using Multisource Open Data and Deep Learning Model, Trans. GIS, 29, 123–141, https://doi.org/10.1111/tgis.13305, 2025b.