the Creative Commons Attribution 4.0 License.
the Creative Commons Attribution 4.0 License.
 | 13 Apr 2026
Ice front positions for Greenland glaciers (2002–2021): a spatially extensive seasonal record and benchmark dataset for algorithm validation
Xi Lu
Daan Li
Andrew J. Sole
Stephen J. Livingstone
Glacier terminus (ice-front) positions are key indicators of glacier dynamic variability and ice–ocean–atmosphere interactions and provide essential time-varying boundary conditions for ice-sheet modelling. High-precision, spatially extensive records are therefore critical for quantifying terminus recession, improving estimates of dynamic mass loss, and supporting the development and validation of automated front-detection algorithms. However, existing manually delineated datasets are largely restricted to marine-terminating glaciers and exhibit heterogeneous spatial coverage, temporal sampling, and delineation criteria, which limits ice-sheet-scale representativeness and propagates into consolidated and automated products that depend on them for training and evaluation. Here we present Greenland Terminus Position Dataset (GrTPD), an independent and internally consistent dataset of ice front positions in Greenland, providing spatially extensive, seasonally targeted coverage (at least twice per year) across marine-, land-, and lake-terminating glaciers. The dataset comprises 19 171 terminus delineations for 465 glaciers spanning 2002–2021, derived from multi-source satellite imagery (Landsat, Sentinel-1/2, MODIS, ENVISAT, ASTER, and ERS). Delineations were produced using standardized workflows implemented in Google Earth Engine (GEE), ENVI, ArcGIS and QGIS. Each record is accompanied by metadata describing acquisition date, satellite, method, glacier identifier, official name, glacier type by terminus and origin, vertex count, and ice front length. Positional accuracy was evaluated using average minimum distance (AMD) comparisons against the integrated manually delineated TermPicks dataset and the automated AutoTerm product for overlapping glaciers. Mean AMD of 86 m relative to TermPicks and 115 m relative to AutoTerm indicates high geometric fidelity and positional consistency. Across spatial aggregates and time series, GrTPD shows closer agreement with TermPicks than with AutoTerm, consistent with the greater sensitivity of automated delineations to image quality, low-contrast ice–ocean mélange conditions, and heterogeneous terminus geometries. By extending coverage beyond marine-terminating glaciers, GrTPD enables a more comprehensive assessment of Greenland glacier terminus variability and provides a high-quality benchmark for validating and intercomparing automated delineation products. The dataset is publicly available from Zenodo: https://doi.org/10.5281/zenodo.19181770 (Xi et al., 2026).
- Article
(12362 KB) - Full-text XML
-
Supplement
(663 KB) - BibTeX
- EndNote


Mass loss from the Greenland Ice Sheet (GrIS), averaged about 280 Gt yr−1 during 2010–2018 (Mouginot et al., 2019; Frederikse et al., 2020), and has increased in recent decades (Otosaka et al., 2023). Variations in glacier terminus positions, including calving fronts at marine-terminating glaciers and frontal retreat at land- and lake-terminating glaciers, play a key role in this process; not accounting for terminus recession has led to an underestimation of recent GrIS mass loss estimates by up to 20 % (Greene et al., 2024). At the same time, terminus variations provide critical insights into glacier dynamics, ice-ocean-atmosphere interactions, and act as essential time-varying boundary conditions for ice sheet modeling (Moon and Joughin, 2008; Catania et al., 2018; Nick et al., 2013; Choi et al., 2021; Otosaka et al., 2023). Spatially extensive and high-precision records of glacier terminus positions are required to assess frontal migration, constrain frontal mass fluxes, and improve the predictive capabilities of both process-based and machine learning models (Andersen et al., 2019; Fürst et al., 2015; KC et al., 2025; Fahrner et al., 2021; Fahrner et al., 2025).
Over the past two decades, several manually delineated datasets of glacier calving front positions derived from optical or radar satellite imagery have provided valuable insights into glacier retreat patterns and terminus variability for marine-terminating in Greenland (Table 1) (Murray et al., 2015a; Wood et al., 2021; Andersen et al., 2019). Most of these datasets were developed in the context of individual case studies or regional modelling efforts, and therefore cover only a subset of Greenland's marine-terminating glaciers, with annual or sporadic temporal sampling and varied delineation approaches (Cassotto et al., 2017; Kehrl et al., 2017; Carr et al., 2013; Fried et al., 2018; Howat and Eddy, 2017; Moon et al., 2015; Sakakibara and Sugiyama, 2019; Bevan et al., 2012). Such heterogeneity in spatial coverage, temporal resolution, and interpretation criteria limits the applicability of existing manually delineated datasets for ice-sheet-scale assessments and reduces their suitability for training and validating automated terminus detection algorithms. To improve spatial and temporal coverage, recent efforts have combined multiple manually derived sources into composite datasets (Greene et al., 2024; Goliber et al., 2022). For example, the TermPicks dataset (Goliber et al., 2022) integrates more than 39 000 manually delineated calving front traces contributed by multiple researchers, substantially enhancing data accessibility and enabling large-scale historical analyses. This extensive compilation demonstrates the value of large observational datasets for improving estimates of glacier mass loss and for studies of calving dynamics and glacier evolution (Greene et al., 2024; Bézu and Bartholomaus, 2024). With enhanced surface melt, a growing number of previously stable land-terminating glaciers are now experiencing notable variability in the near-terminus region (Fitzpatrick et al., 2013; Sundal et al., 2011; Tedstone et al., 2015), while lake-terminating glaciers show increasing spatial extent and temporal variability (Holt et al., 2024; Grimes et al., 2024). These glacier types are therefore becoming increasingly relevant for both glacier-dynamics research and ice-sheet-scale assessments (Grimes et al., 2024), highlighting the continued need to expand terminus position datasets to include a greater number of observations within existing categories and a broader range of glacier types, while providing standardized and internally consistent records that support fundamental research on glacier dynamics, supplement existing marine-terminating datasets for scientific analysis, and support the advancement of emerging front delineation techniques.
Table 1Summary of publicly available ice front datasets for the GrIS. Greene et al. (2024) provides mask-based products without glacier-specific delineations.
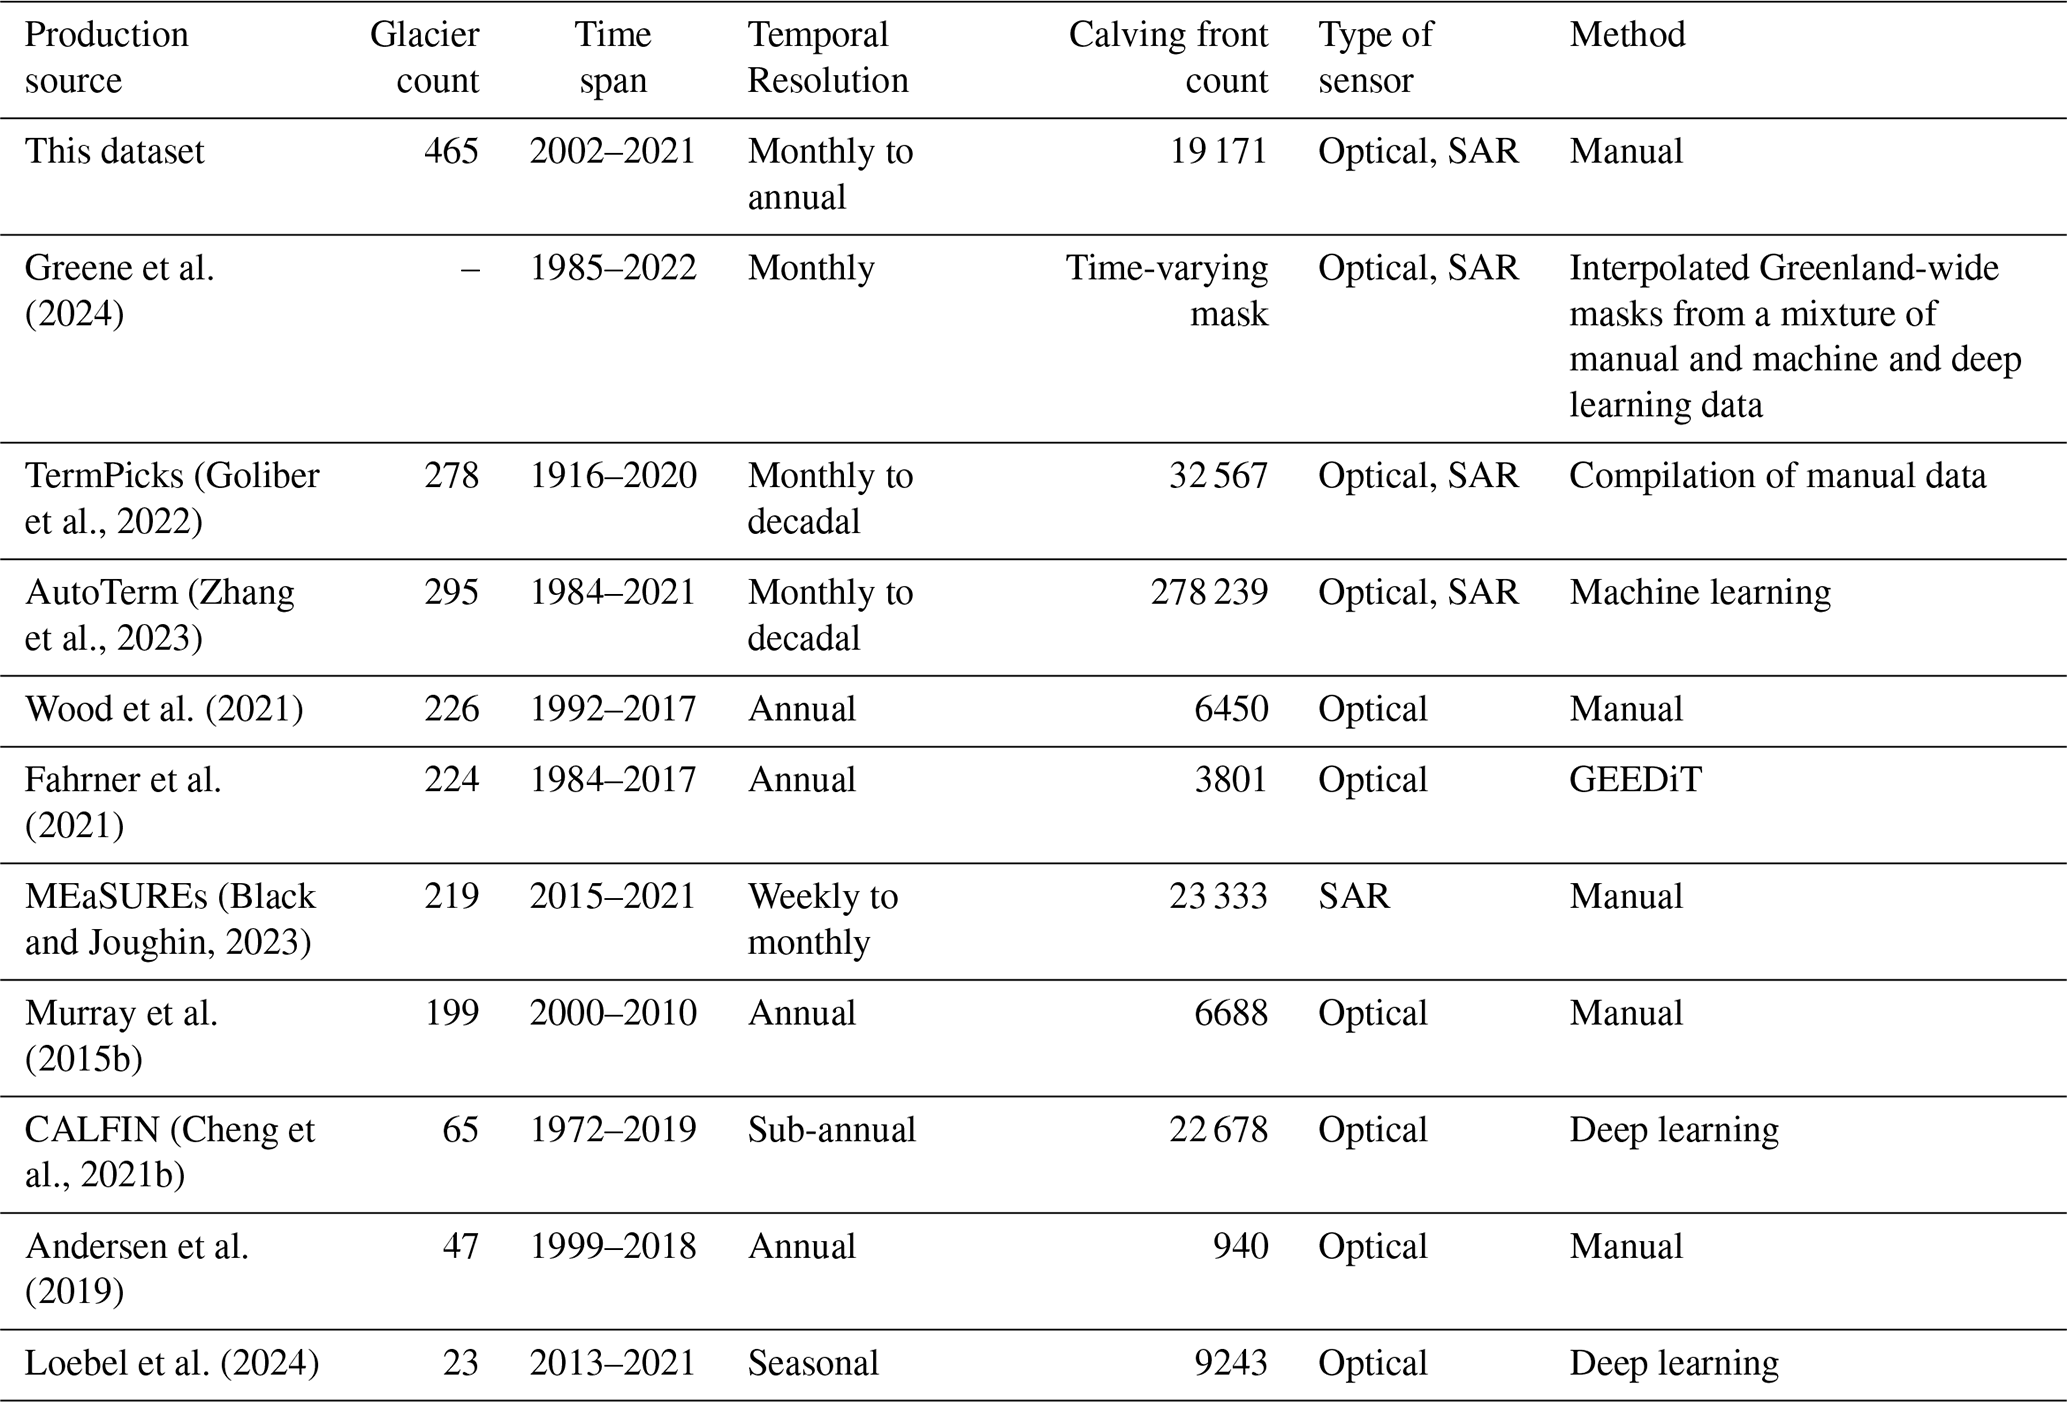
In recent years, the increasing availability of high-resolution satellite imagery, together with advances in computational capacity, has accelerated the development of automated calving front delineation methods. Machine learning and deep learning approaches have become powerful tools for extracting glacier termini from large remote sensing archives, enabling the generation of large-scale datasets and efficient monitoring of terminus variability at ice-sheet and multi-basin scales (Baumhoer et al., 2019; Cheng et al., 2021b; Zhang et al., 2023; Mohajerani et al., 2019; Loebel et al., 2024). These approaches are especially well suited to capturing nonlinear and asynchronous terminus changes that occur at the individual-glacier scale (Brough et al., 2023; Catania et al., 2020; Choi et al., 2021). Despite these advantages, the transferability of automated front detection approaches across regions and imaging conditions, as well as uncertainty characterization of automated approaches, remains heavily dependent on the availability of high-quality, manually delineated training and validation data (Zhang et al., 2023). Recent studies consistently show that automated algorithms benefit from larger and more diverse training datasets that span a wide range of glacier geometries, surface conditions, temporal sampling, and sensor types (Herrmann et al., 2023; Loebel et al., 2024). In addition, Cheng et al. (2021b) trained deep learning models using more than 1500 labelled calving fronts but extracted only ∼ 22 000 GrIS termini, representing a small fraction of the available satellite scenes. By incorporating the integrated TermPicks dataset for training, Zhang et al. (2023) increased this number to 278 239, and demonstrated that expanded and higher-quality training data substantially improve model generalization, while also highlighting the continued need for more extensive and diverse manual reference datasets (Moon et al., 2015; Baumhoer et al., 2019).
In response to these limitations, and requirements for validation of automated approaches, we present the Greenland Terminus Position Dataset (GrTPD), an independent and internally consistent dataset of glacier terminus positions for the GrIS. GrTPD provides spatially extensive and seasonally targeted sampling (at least twice per year) across marine-, land-, and lake-terminating glaciers, addressing key gaps in existing manually delineated products. Glaciers included in GrTPD were selected primarily based on surface-flow characteristics observable in remote sensing imagery. Specifically, selected glaciers exhibit coherent surface flow features that converge toward a well-defined terminus at the ice-sheet margin, allowing reliable identification of terminus position across time. For glaciers where surface-flow features or the terminus were less distinct, glacier selection was further guided by existing glacier inventories and terminus datasets, including TermPicks, AutoTerm, Bjørk et al. (2015), and the NunaGIS map, supporting glacier identification, naming consistency, and coverage completeness. The dataset comprises 19 171 terminus delineations for 465 glaciers spanning the period 2002–2021, derived from multi-source satellite imagery including Landsat, Sentinel-1/2, MODIS, ENVISAT, ASTER, and ERS. The glacier sample includes 363 marine-terminating glaciers (MT), 63 land-terminating glaciers (LT), and 39 lake-terminating glaciers (LaT) (Fig. 1). By extending terminus observations beyond marine-terminating glaciers, GrTPD captures a broader spectrum of terminus geometries and dynamic behaviours associated with enhanced surface melt, increasing retreat of land-terminating glaciers, and the growing prevalence of lake-terminating glaciers, thereby enabling comparisons of recession rates across different glacier types.
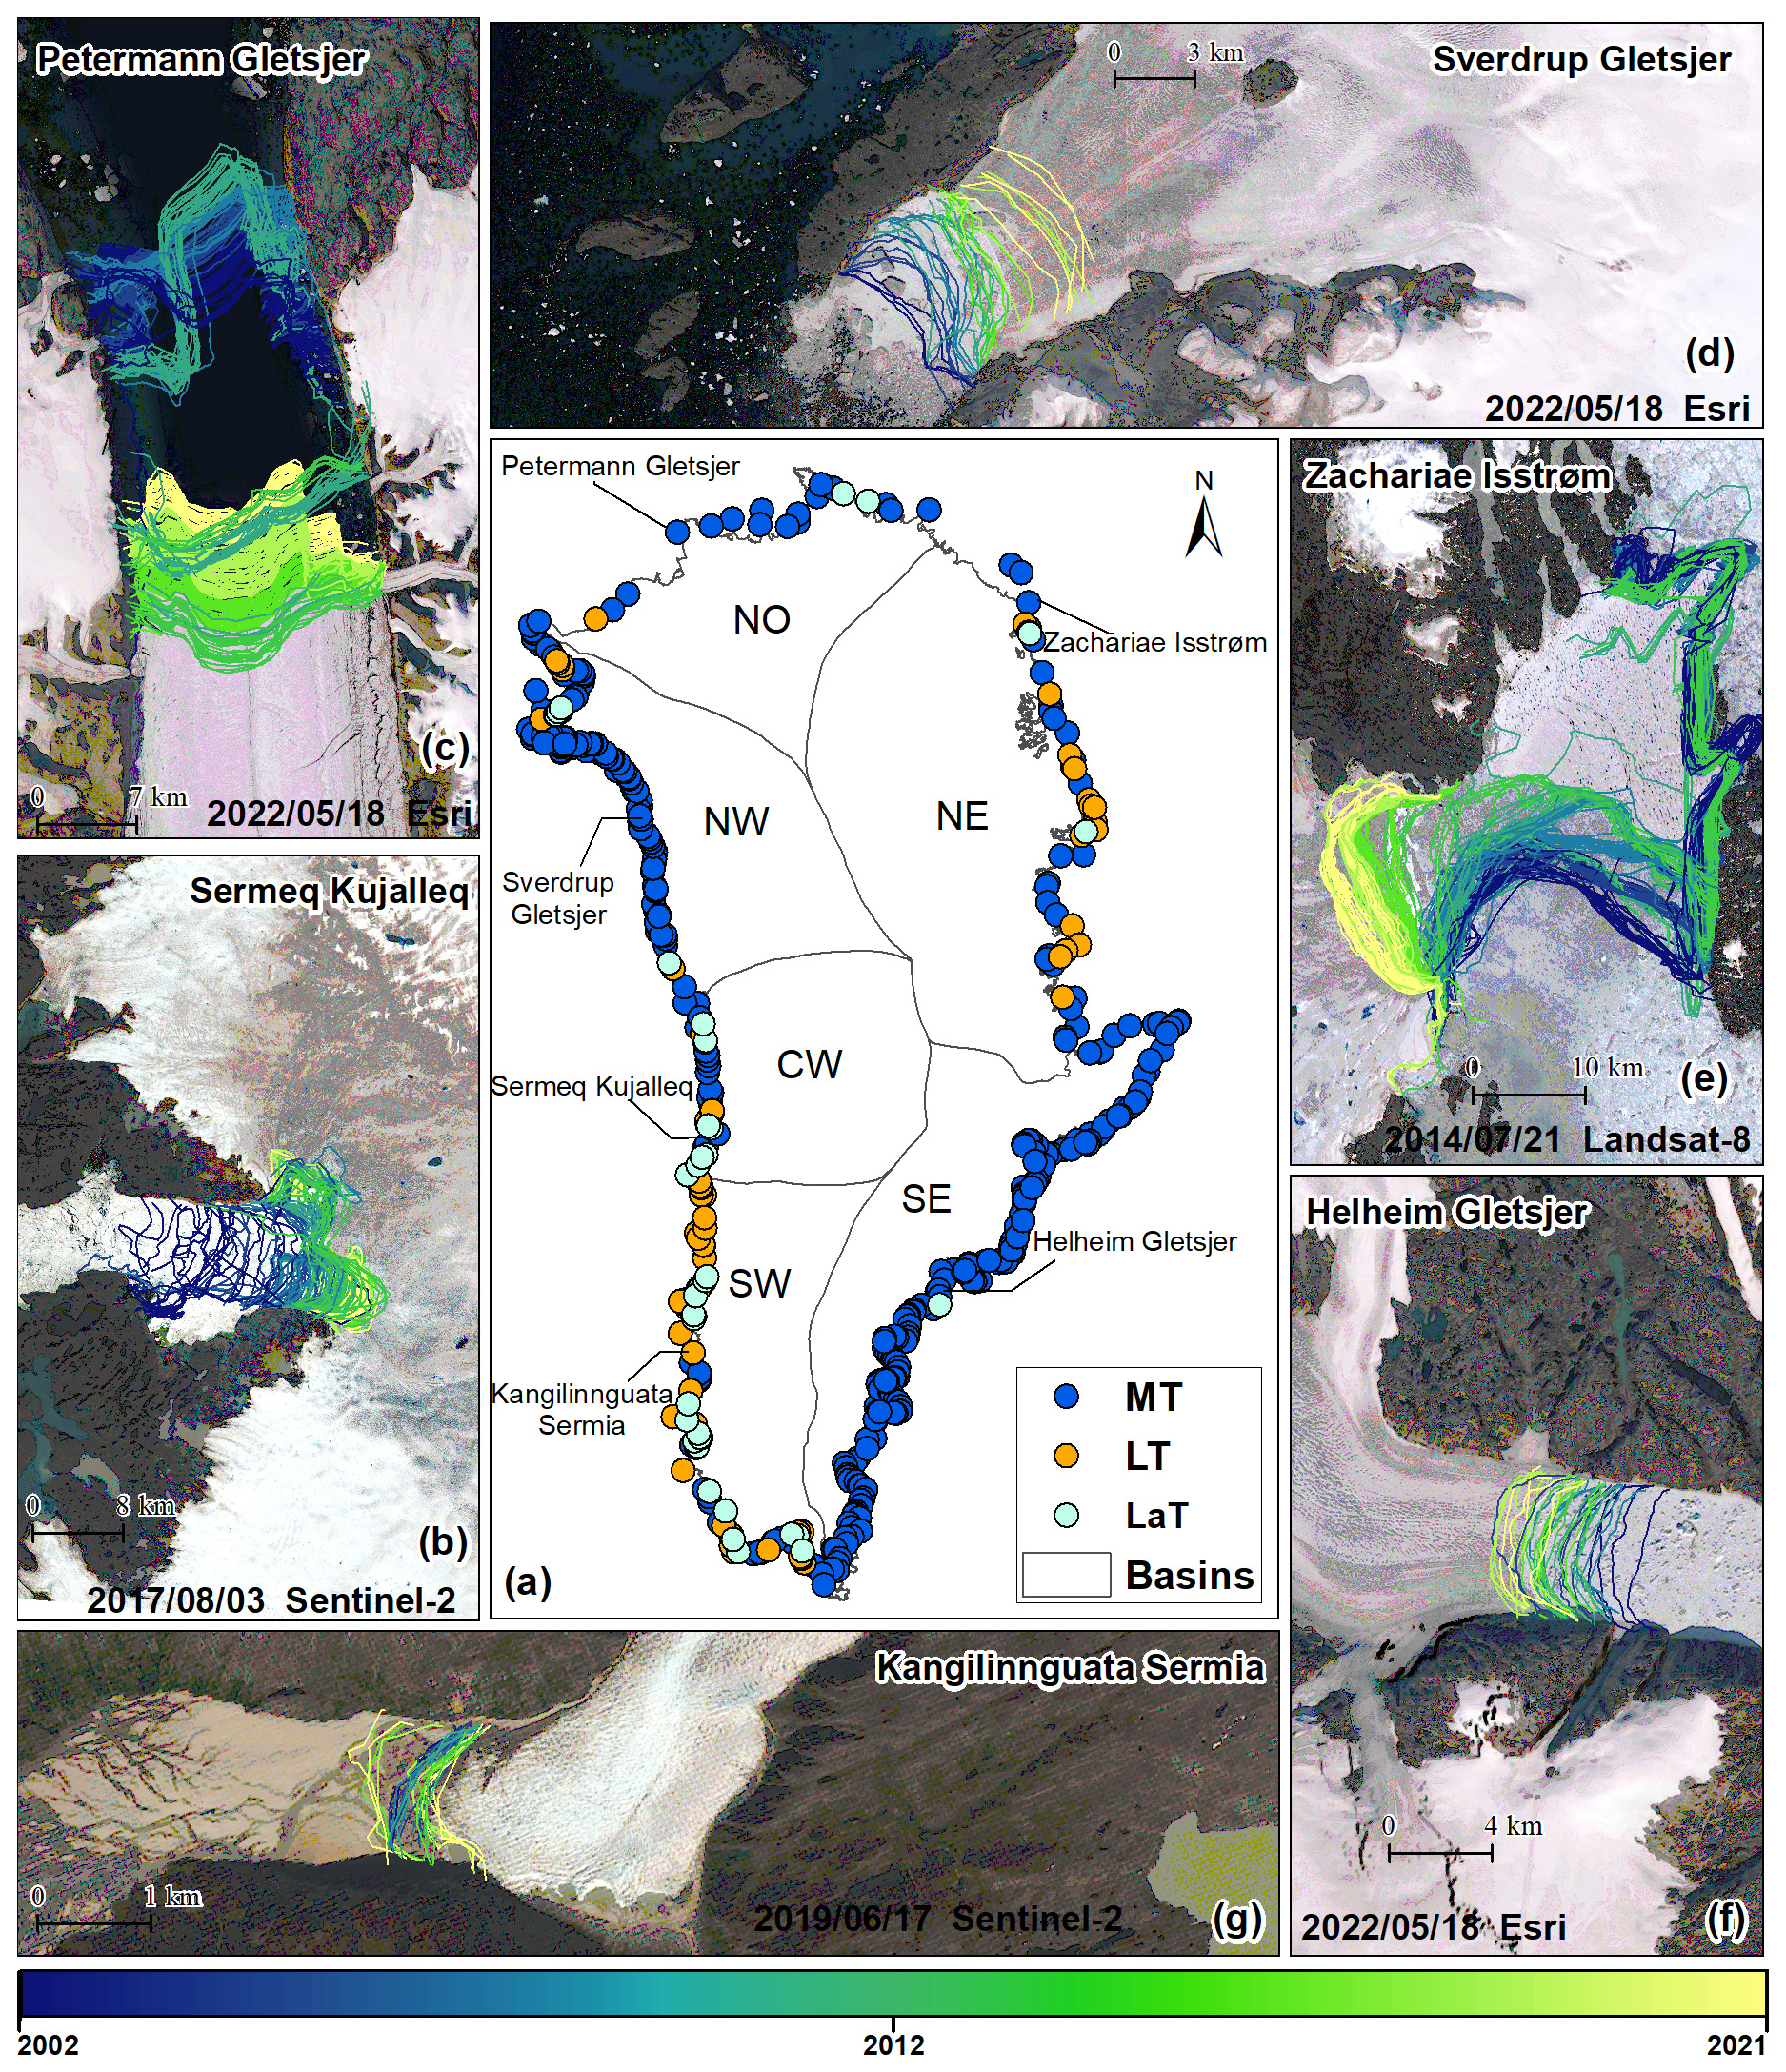
Figure 1Spatial overview of the glaciers included in this dataset. Central panel (a) shows glacier locations grouped by drainage basin (Rignot and Mouginot, 2012). Coloured points indicate the glaciers included in the dataset: marine-terminating glaciers (MT, blue), land-terminating glaciers (LT, orange), and lake-terminating glaciers (LaT, turquoise). Surrounding maps (b–g) illustrate six examples of temporally resolved ice front positions (colour-coded by year) derived from multi-source imagery. Basemap source (c, d, f): Esri; Sources: Esri, TomTom, FAO, USGS | Powered by Esri.
2.1 Ice front delineation procedure
The delineation of glacier termini was performed through a standardized workflow integrating tool-assisted digitization and manual interpretation (Fig. 2). The procedure comprises three primary components: (1) satellite image selection and preparation, (2) terminus delineation and geometric editing, and (3) quality control and post-processing.
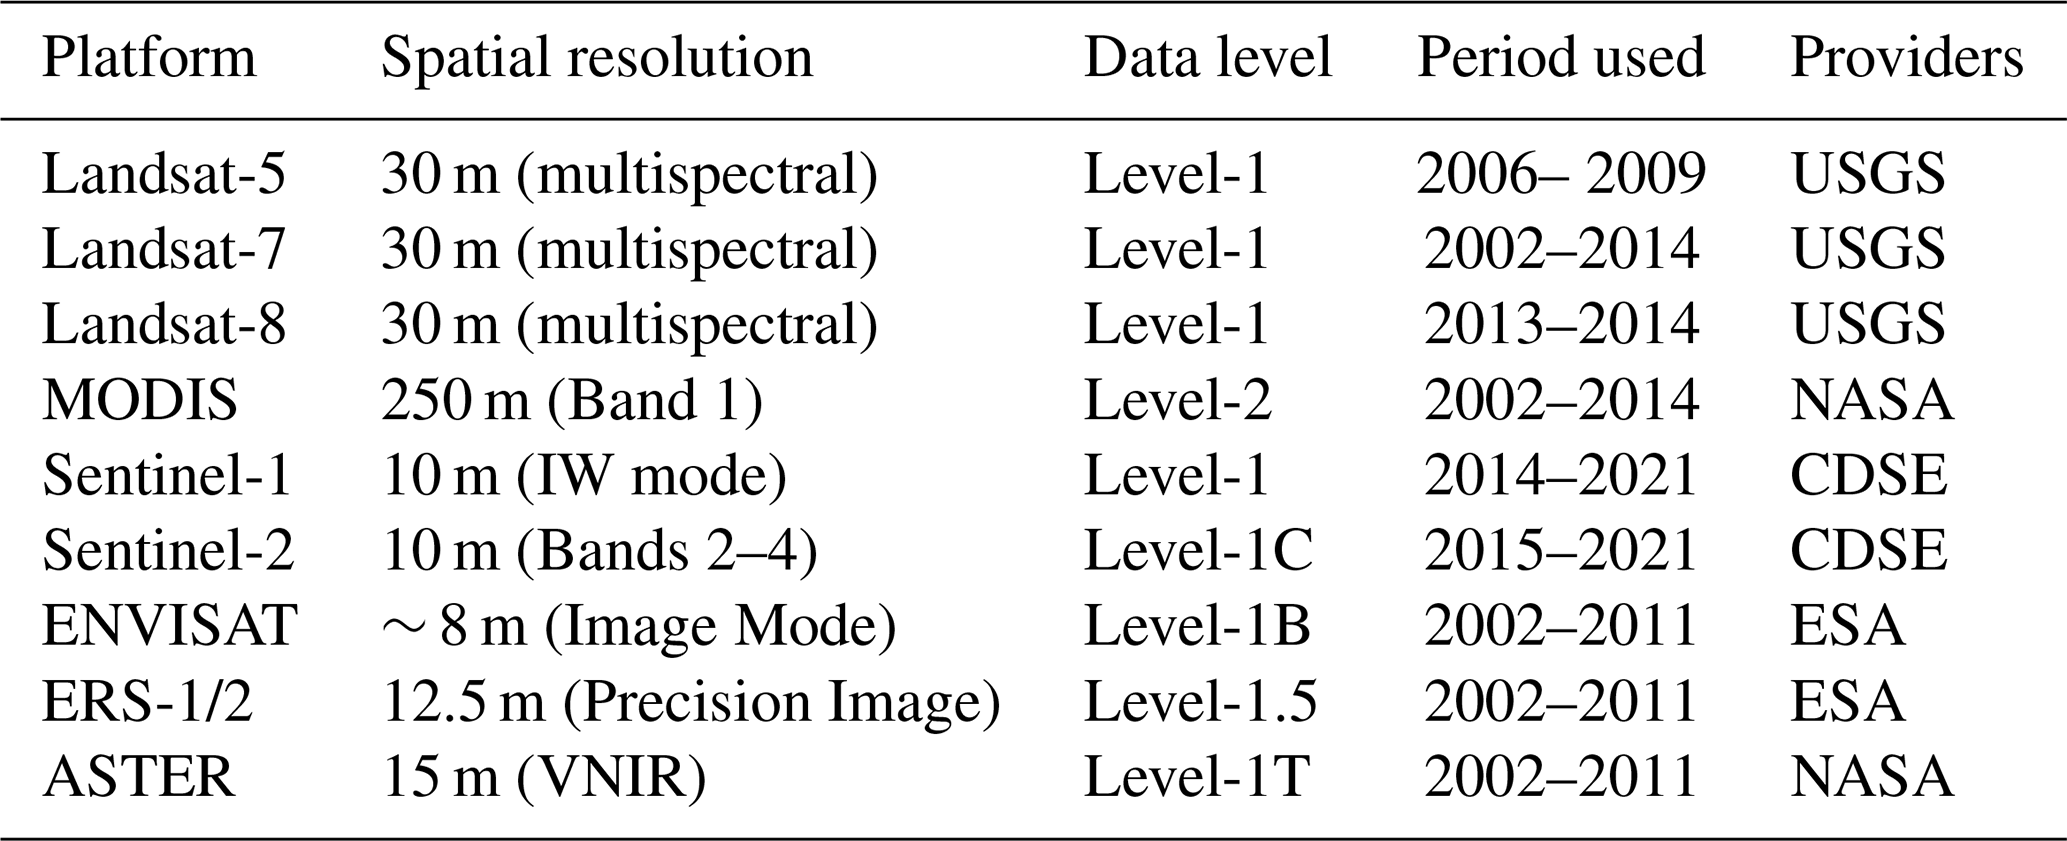
To construct a spatially extensive and seasonally targeted record of glacier terminus positions across the GrIS from 2002 to 2021, we delineated glacier termini using multi-source satellite imagery from both optical and synthetic aperture radar (SAR) sensors (Table 2). The primary data sources include optical imagery from Landsat-5, Landsat-7, Landsat-8, Sentinel-2 and Advanced Spaceborne Thermal Emission and Reflection Radiometer (ASTER), as well as SAR imagery from Sentinel-1. To improve temporal continuity and increase sampling density for selected large and dynamically important glaciers – Sermeq Kujalleq (Jakobshavn Isbræ), Petermann Gletsjer, and Zachariae Isstrøm – additional satellite imagery was incorporated outside the Google Earth Engine Digitisation Tool (GEEDiT) (Lea, 2018) framework. These supplementary datasets include Moderate Resolution Imaging Spectroradiometer (MODIS) (Hall et al., 2002), ENVIronmental monitoring SATellite (ENVISAT) Advanced Synthetic Aperture Radar (ASAR) (Image Mode, ∼ 8 m) (Rignot and Kanagaratnam, 2006), and European Remote Sensing satellite (ERS-1/2) SAR (Precision Image mode, ∼ 12.5 m) (Moon and Joughin, 2008) and were manually downloaded and processed. The supplementary data were particularly useful during extended cloud cover or in early years of the study period where availability of optical imagery was limited. A complete overview of all sensors, resolutions, and acquisition periods is provided in Table 2.
Table 2Summary of satellite remote sensing imagery used for ice front position delineation.
All primary satellite images were accessed, visualized, and digitized using the GEEDiT, following the standardized procedures described therein, without additional image preprocessing. To maximize data utilization and avoid unnecessary data exclusion, no fixed cloud-coverage threshold was imposed during image selection. Instead, image suitability for terminus delineation was assessed through visual inspection, based on whether the glacier terminus could be reliably identified. In ambiguous cases – such as scenes affected by dense ice mélange, shadowing, or low ice–water contrast – adjacent satellite acquisitions within a ±15 d temporal window were consulted to support cross-validation and ensure consistent interpretation of terminus position. This approach reduces the risk of misinterpretation associated with single-scene ambiguity while preserving the seasonally targeted sampling strategy.
The additional imagery was manually downloaded, georeferenced and digitized in ENVI, ArcGIS, and QGIS. MODIS daily imagery (Level-2 Gridded products) was used as an auxiliary dataset for three target glaciers to improve monthly temporal continuity during periods when high-resolution optical imagery was insufficient for regular terminus digitization. The surface reflectance was atmospherically corrected and georeferenced. To enhance interpretability, we computed Normalized Difference Water Index (NDWI) from red and near-infrared bands. Due to its relatively coarse spatial resolution, MODIS imagery was not used for precise terminus geometry delineation. Instead, it served as a qualitative reference to constrain the direction and magnitude of terminus change between successive high-resolution observations. Over monthly timescales, terminus migration at these glaciers is generally gradual and approximately linear (Black and Joughin, 2023), allowing MODIS-derived signals to provide supporting evidence for interpolating terminus positions between adjacent months with limited high-resolution coverage. For ENVISAT ASAR, radiometric calibration to sigma nought (dB) was applied, followed by terrain correction using the ArcticDEM digital elevation model (Porter et al., 2022), which provides high-resolution surface elevation coverage for the GrIS, and speckle filtering using Refined Lee filter to enhance interpretability. For ERS-1/2 precision image products, additional terrain correction and filtering were performed to ensure spatial consistency with ENVISAT. All SAR scenes were georeferenced and reprojected to a common geographic coordinate system (WGS84, EPSG:4326) for integration with optical imagery and to enable cross-sensor comparison.
All digitized ice front positions were subsequently reviewed and, where necessary, manually adjusted to ensure spatial continuity and temporal consistency within each glacier time series. A temporal plausibility check was applied to identify unrealistic frontal advances, abrupt reversals, or anomalous migration between temporally adjacent terminus positions. Following the approach adopted in Baumhoer et al. (2019) and Zhang et al. (2023), anomalously large positional changes between the two temporally closest termini – equivalent to outliers in a terminus-change time series – were flagged for further inspection. When the overall terminus geometry remained smooth and the temporal derivative of terminus change was physically plausible, the delineation was retained. In contrast, when an anomalous migration between adjacent termini suggested a potential delineation error, the corresponding satellite imagery from the preceding and subsequent acquisition dates was retrieved for verification. If the large positional change was confirmed to reflect a calving event or terminus disintegration, the delineation was accepted; otherwise,the affected terminus trace was re-digitized. After completion of all quality-control procedures and any necessary re-editing, the validated glacier-terminus layers were packaged and distributed in GeoPackage (GPKG) format.
2.2 Attributes and metadata generation
To ensure internal consistency, interoperability, and long-term reusability, a unified attribute harmonization workflow was applied to the GrTPD dataset prior to final release. This procedure standardizes attribute content, geometry-derived metrics, and glacier-type classification across all glacier-terminus layers. For each glacier layer, attribute tables were first cleaned by removing records with missing or empty acquisition dates, ensuring that all retained geometries are temporally referenced. Only a predefined set of core attributes was preserved, while non-essential or legacy fields were removed inherited from GEEDiT were removed. The retained attributes include glacier identification information, acquisition metadata, processing method, and geometric descriptors. All attribute fields were then reordered into a consistent schema to guarantee identical field structure across all glacier layers. Within each glacier layer, terminus polylines were sorted by acquisition date from earliest to latest to ensure chronological consistency of the time series.
Each glacier was assigned a unique identifier (ID) formatted as “GIDxxx”, aligned where possible with existing identifiers used in the TermPicks and AutoTerm datasets to facilitate cross-dataset comparison. Glaciers not covered by these reference datasets were assigned new IDs following the same numbering scheme. As a result, glacier IDs in GrTPD range from “GID001” to “GID468”. In three cases, AutoTerm subdivides three single glacier termini into two separate records; these were treated as a single glacier entity in GrTPD and assigned a single glacier ID. Glacier names (“GlacierNam”) were populated by matching glacier IDs to an external glacier-identification reference derived from Bjørk et al. (2015).
Geometric quality metrics were computed for all terminus features to ensure numerical consistency across the dataset. The number of vertices (“nvert”) was recalculated directly from the polyline geometry. Terminus length (“len_km”) was computed from vertex coordinates using projected distance calculations, depending on the coordinate reference system. Terminus length was defined as the cumulative piecewise length along each individual terminus trace, following the approach of Zhang et al. (2023). All recomputed values replaced any pre-existing or inconsistent entries.
Glacier terminus type can evolve over time, particularly for land- and lake-terminating glaciers that may undergo seasonal or interannual transitions. To ensure a consistent and unambiguous classification across the dataset, glacier types were defined with respect to terminus conditions at the end of the observation period, rather than varying terminus states at individual acquisition dates. This terminal-state classification was based on optical satellite imagery from 2021 (Joughin, 2021), representing the final year of the record. Glaciers whose termini were in direct contact with the ocean at this reference time were classified as marine-terminating (MT), while glaciers terminating against persistent proglacial lakes were classified as lake-terminating (LaT). Glaciers terminating on land without sustained contact with either ocean or lake water bodies were classified as land-terminating (LT). In addition, glacier types based on ice mass origin (GrIS: Greenland Ice Sheet outlet glaciers; LGIC: local glaciers and ice caps) were identified following the classification scheme of Bjørk et al. (2015), which distinguishes outlet glaciers dynamically connected to the GrIS from smaller, dynamically independent glacier systems.
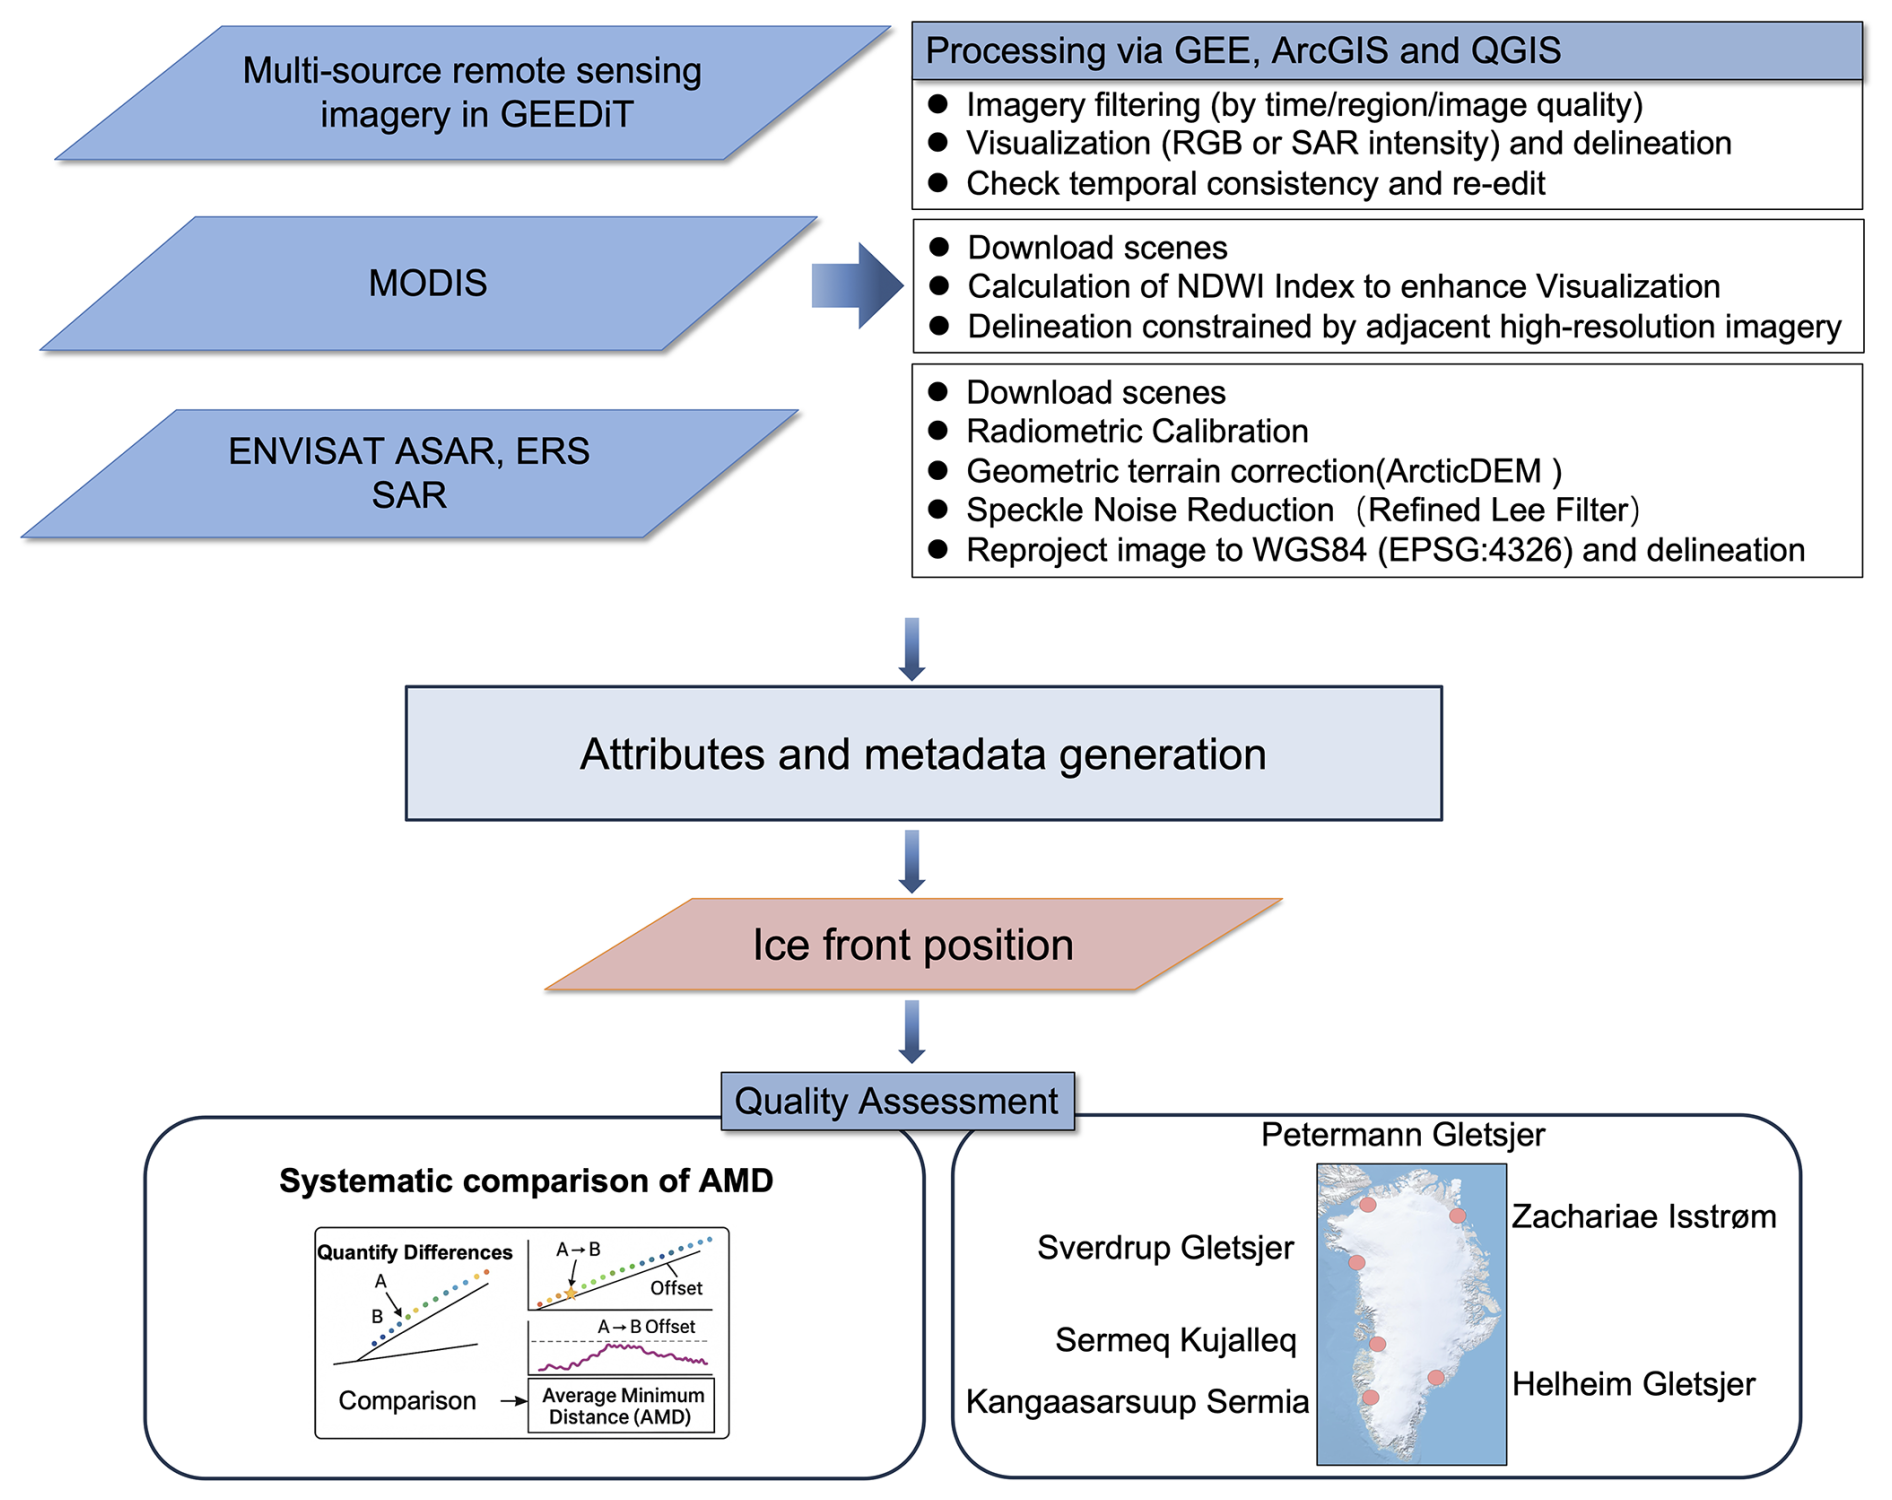
Figure 2Workflow of the glacier terminus delineation process. The system integrates multi-source satellite imagery, accessed either directly through GEE or through preprocessing in ENVI, ArcGIS and QGIS. Glacier termini were manually delineated from the imagery. The Quality Assessment stage consists of two components: (i) quantitative comparison with existing datasets using offset metrics AMD to evaluate overall differences and glacier-scale discrepancies at overlapping time steps, and (ii) temporal comparisons over the study period and spatial comparisons for representative glaciers from each basin. The corresponding validation results are presented in Sect. 2.3.
2.3 Validation
Uncertainty quantification for automated glacier-terminus products is commonly performed by measuring the positional differences between automatically delineated termini and independently manually delineated reference traces (Cheng et al., 2021b; Zhang et al., 2023). Because machine-learning-based approaches are trained using manually delineated data, automated products generally exhibit larger positional uncertainties than manual delineations. Consequently, independently manually delineated termini are typically regarded as a reference standard for scientific analysis, model boundary constraints, and validation of automated detection methods. However, manual delineation is also subject to uncertainties arising from scene-specific factors such as low contrast, shadows, mélange cover, and interpreter subjectivity (Moon et al., 2015). Several studies have evaluated the precision of manual delineation by comparing multiple independently drawn termini for the same glacier and acquisition date (Brough et al., 2019; Fahrner et al., 2021). These repeated-drawing experiments generally yield relatively small deviations – on the order of several tens of meters – reflecting the point-by-point visual interpretation process used in manual digitization. In contrast, accuracy assessments based on comparisons among different manually delineated datasets often reveal larger discrepancies. For example, the TermPicks dataset reports a median positional difference of 107 m, with a range of 58.6 to 7350 m, among duplicated manually traced termini, highlighting the influence of heterogeneous interpretation criteria and data sources.
To quantify the positional consistency of our glacier terminus dataset and to demonstrate its suitability as a benchmark for future algorithm development, we performed a systematic inter-product comparison against two widely used terminus products: TermPicks (manual delineations) and AutoTerm (automated extractions). The comparison was designed to be robust to differences in polyline length, vertex density, and local geometric complexity, enabling objective assessment across the full set of glaciers. All terminus polylines were first harmonized to a common geographic reference system to ensure distance calculations were spatially consistent. For each glacier, records were grouped by a unique glacier identifier (GID). Terminus observations from our dataset and the comparison dataset were then matched by acquisition date. Because timestamp formats differ among products (e.g., date-only strings versus full UTC timestamps), all acquisition times were normalized to daily resolution (YYYY–MM–DD). Only dates present in both datasets for a given GID were retained. Glaciers with no overlapping acquisition dates were excluded from the statistics (but were recorded separately to document the coverage mismatch between products). We used Average Minimum Distance (AMD) as the primary quantitative metric. For each same-date pair of terminus polylines, AMD was computed as the mean of the shortest distances from each resampled point on the GrTPD terminus to the corresponding reference polyline (Cheng et al., 2021b).
To summarize the positional consistency between the GrTPD and existing products at both local and glacier-wide scales, we derived a set of complementary AMD-based statistics based on detailed comparison results in the Supplement. As illustrated in Fig. 3, to characterize typical along-front behavior, individual AMD profiles were first interpolated onto a normalized along-front coordinate ( ∈ [0,1]). For each glacier, multiple profiles from different dates were then aggregated into a representative profile using the mean at each s location. These glacier-level representative profiles were subsequently pooled across all glaciers, and at each normalized position the 10th, 25th, 50th, 75th, and 90th percentiles were computed, forming the quantile envelopes shown in Fig. 3a and c. The solid median curve p50 therefore represents the typical magnitude of mismatch along the ice front, while its spread reflects spatial heterogeneity in agreement along the front. To provide a compact summary of overall agreement, we computed the mean of per-glacier median AMD across all glaciers, annotated in Fig. 3a and c. For each glacier, the median AMD across all matched dates was computed as a glacier-level summary and plotted in Fig. 3b and d.
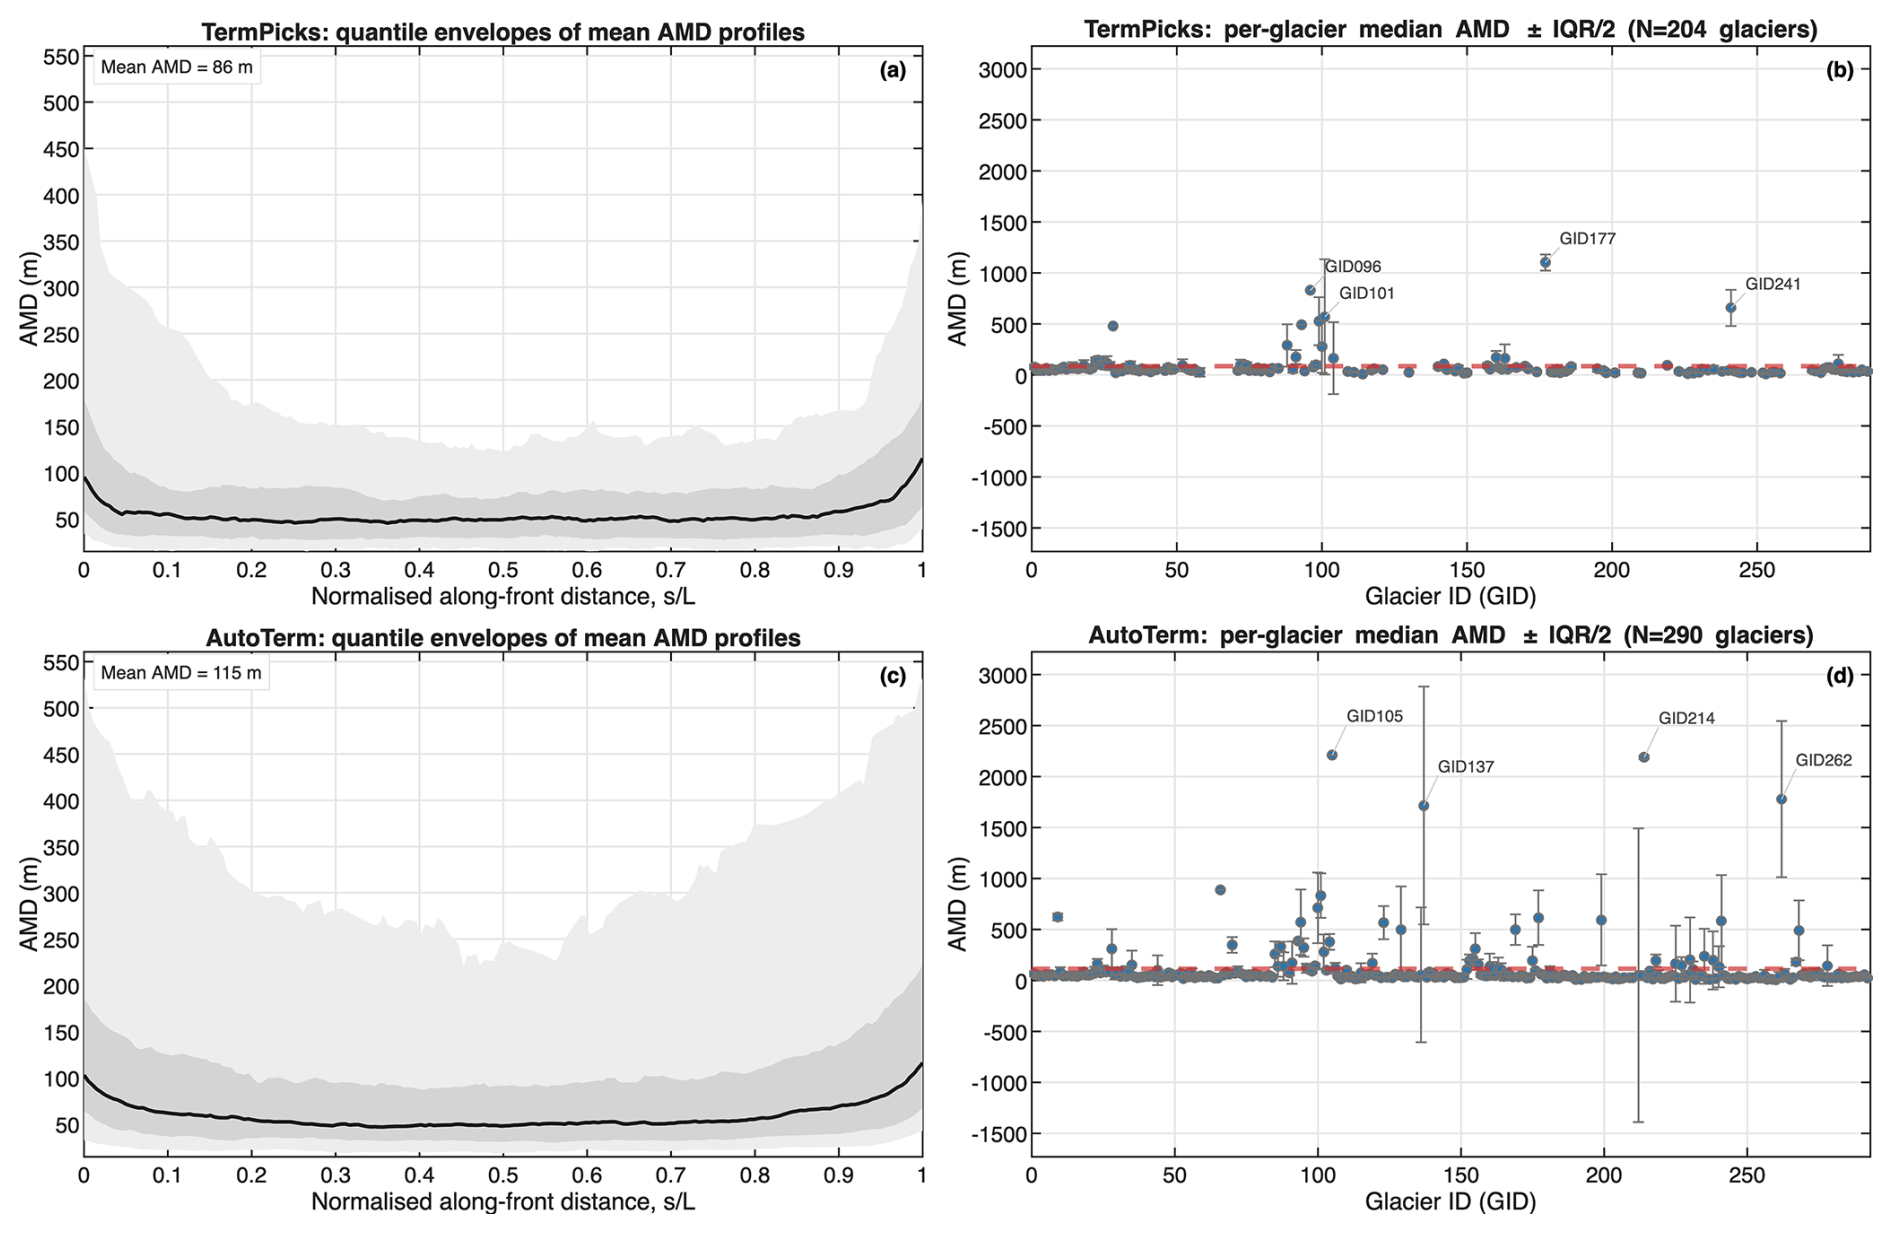
Figure 3Average minimum distance (AMD) statistics between GrTPD and TermPicks (a–b) and AutoTerm (c–d), using only same-date terminus pairs. (a, c) mean AMD profiles per glacier are evaluated along the normalised along-front coordinate () and summarized across all included glaciers, showing the median p50(s) (solid line), the interquartile range (IQR) p25–p75 (dark shading), and the 10 %–90 % range p10–p90 (light shading); the annotation reports the mean of glacier-level AMD across all glaciers. (b, d) Glacier-wise median AMD (points) with within-glacier variability (error bars) plotted against glacier ID (GID); error bars show IQR/2 of per-date mean AMD values for each glacier; the dashed red line indicates the mean of per-glacier AMD across all glaciers.
For the along-front comparison (Fig. 3a, c), the mean glacier-level AMD is 86 m for TermPicks, compared with 115 m for AutoTerm, indicating a consistently lower mismatch for TermPicks relative to AutoTerm across the glacier fronts. The median AMD curve, p50(s), further indicates closer overall agreement between TermPicks and the GrTPD. Across Greenland (Fig. 3b, d), the distribution of glacier-wide median AMD further confirms this pattern. TermPicks generally shows lower median offsets across glaciers, with reduced within-glacier variability, whereas AutoTerm displays a broader spread and higher typical mismatch values. The dashed horizontal lines in Fig. 3b and d, representing the mean of per-glacier median AMD across all glaciers, emphasise the overall consistency between the two products, demonstrating that both products exhibit values close to zero, indicating overall agreement across glaciers. Together, these results indicate that, within an overall high level of agreement, manual delineations from TermPicks provide a closer and more spatially coherent agreement with GrTPD, while automated extractions from AutoTerm exhibit larger and more variable deviations.
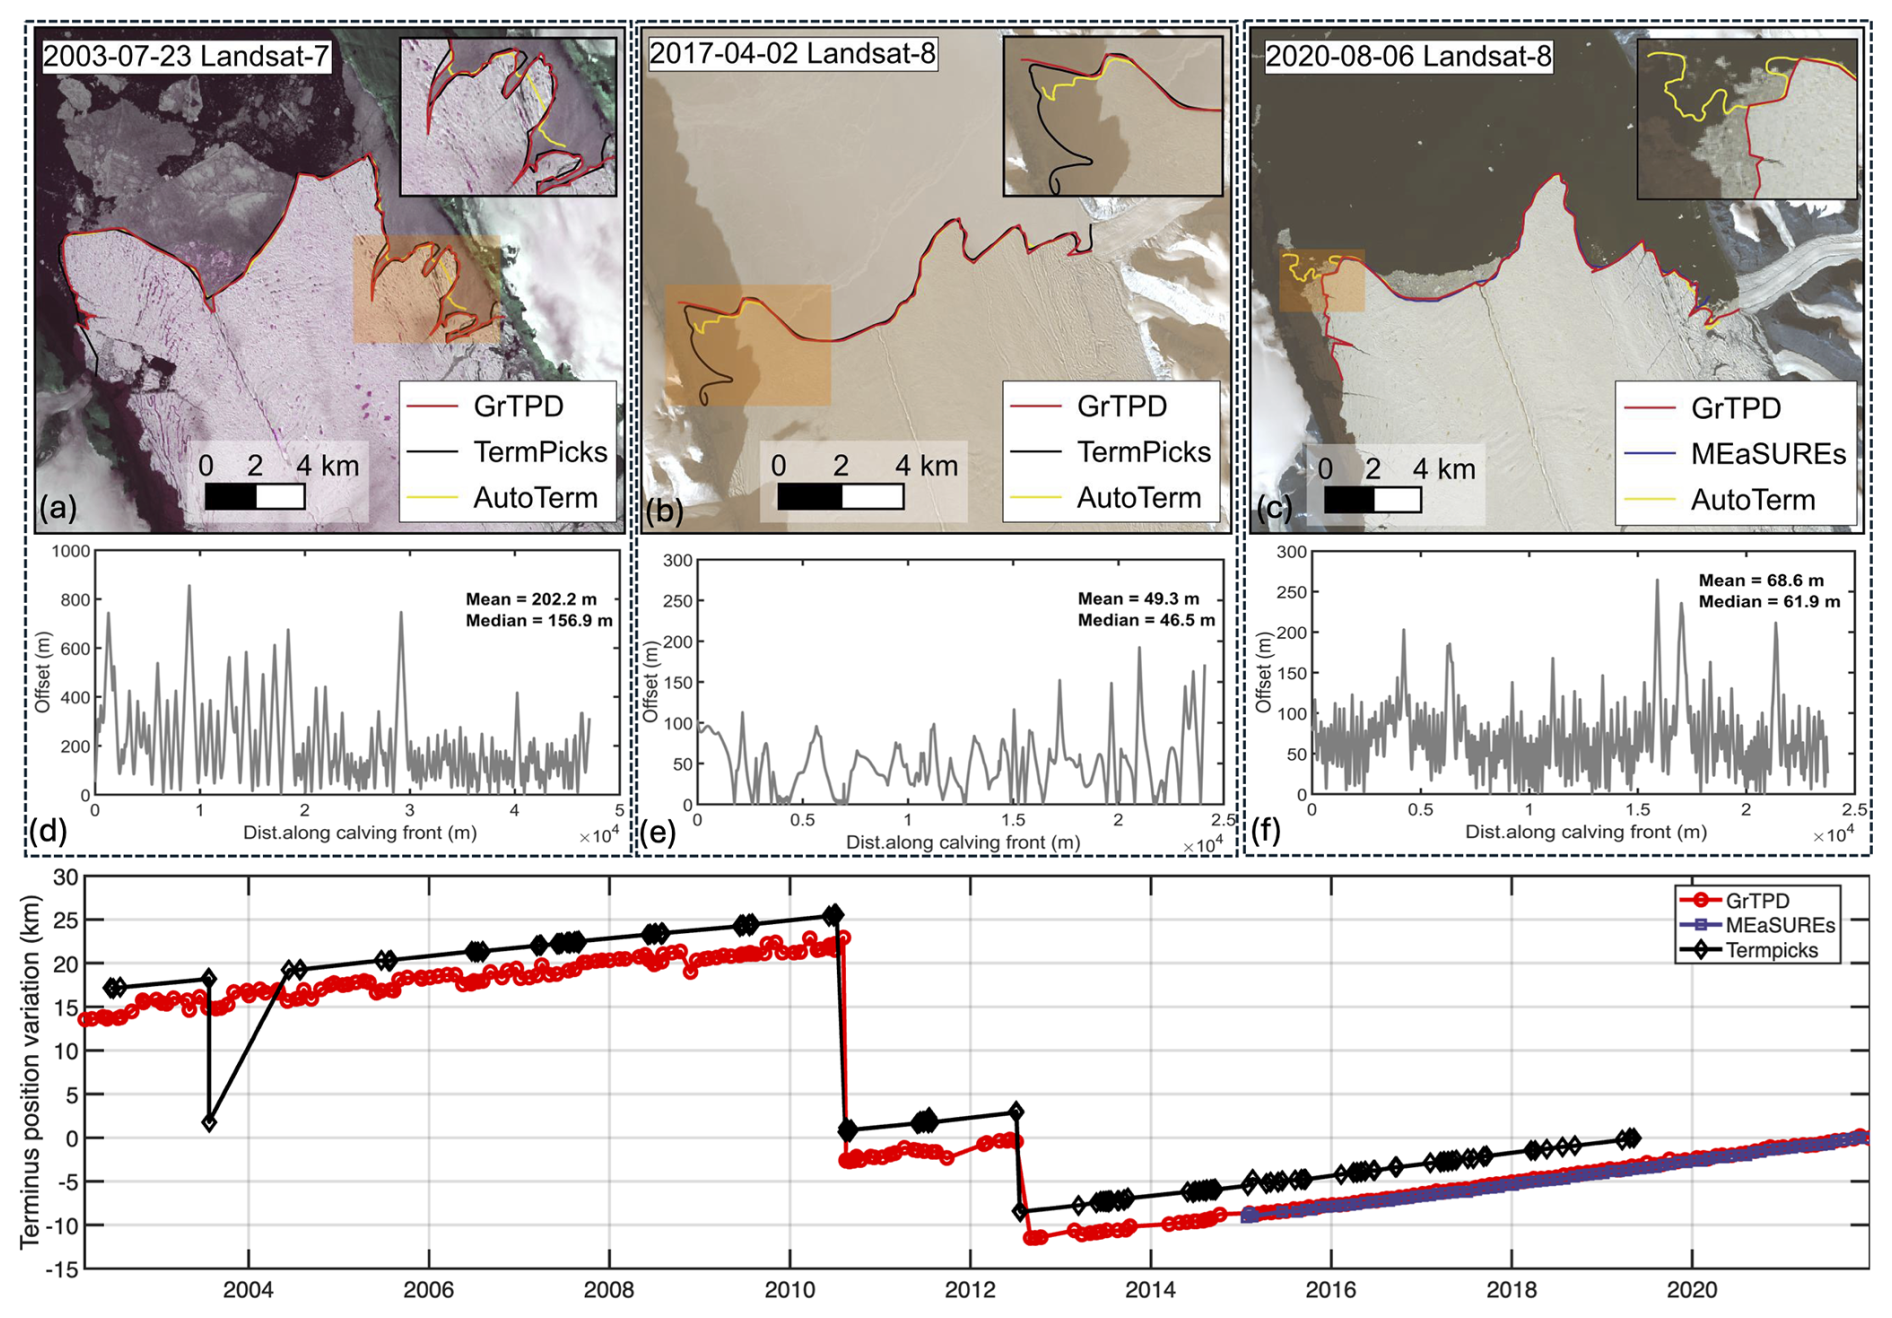
Figure 4Comparison of delineated calving fronts for Petermann Gletsjer on three dates (23 July 2003, 2 April 2017 and 6 August 2020). (a)–(c) overlay GrTPD (red) with TermPicks (black), AutoTerm (yellow) and MEaSUREs (blue) on Landsat scenes; insets zoom in on areas of complex mélange cover or irregular geometry. (d)–(f) show the along-front offset profiles (AMD) for each date. (d) and (e) show comparisons between this dataset and TermPicks, corresponding to (a) and (b), respectively. (f) compares this dataset with MEaSUREs, corresponding to (c). Each profile displays both the average and median offsets. (g) presents the time series of manually delineated ice front position variation (km) from 2002 through 2021.
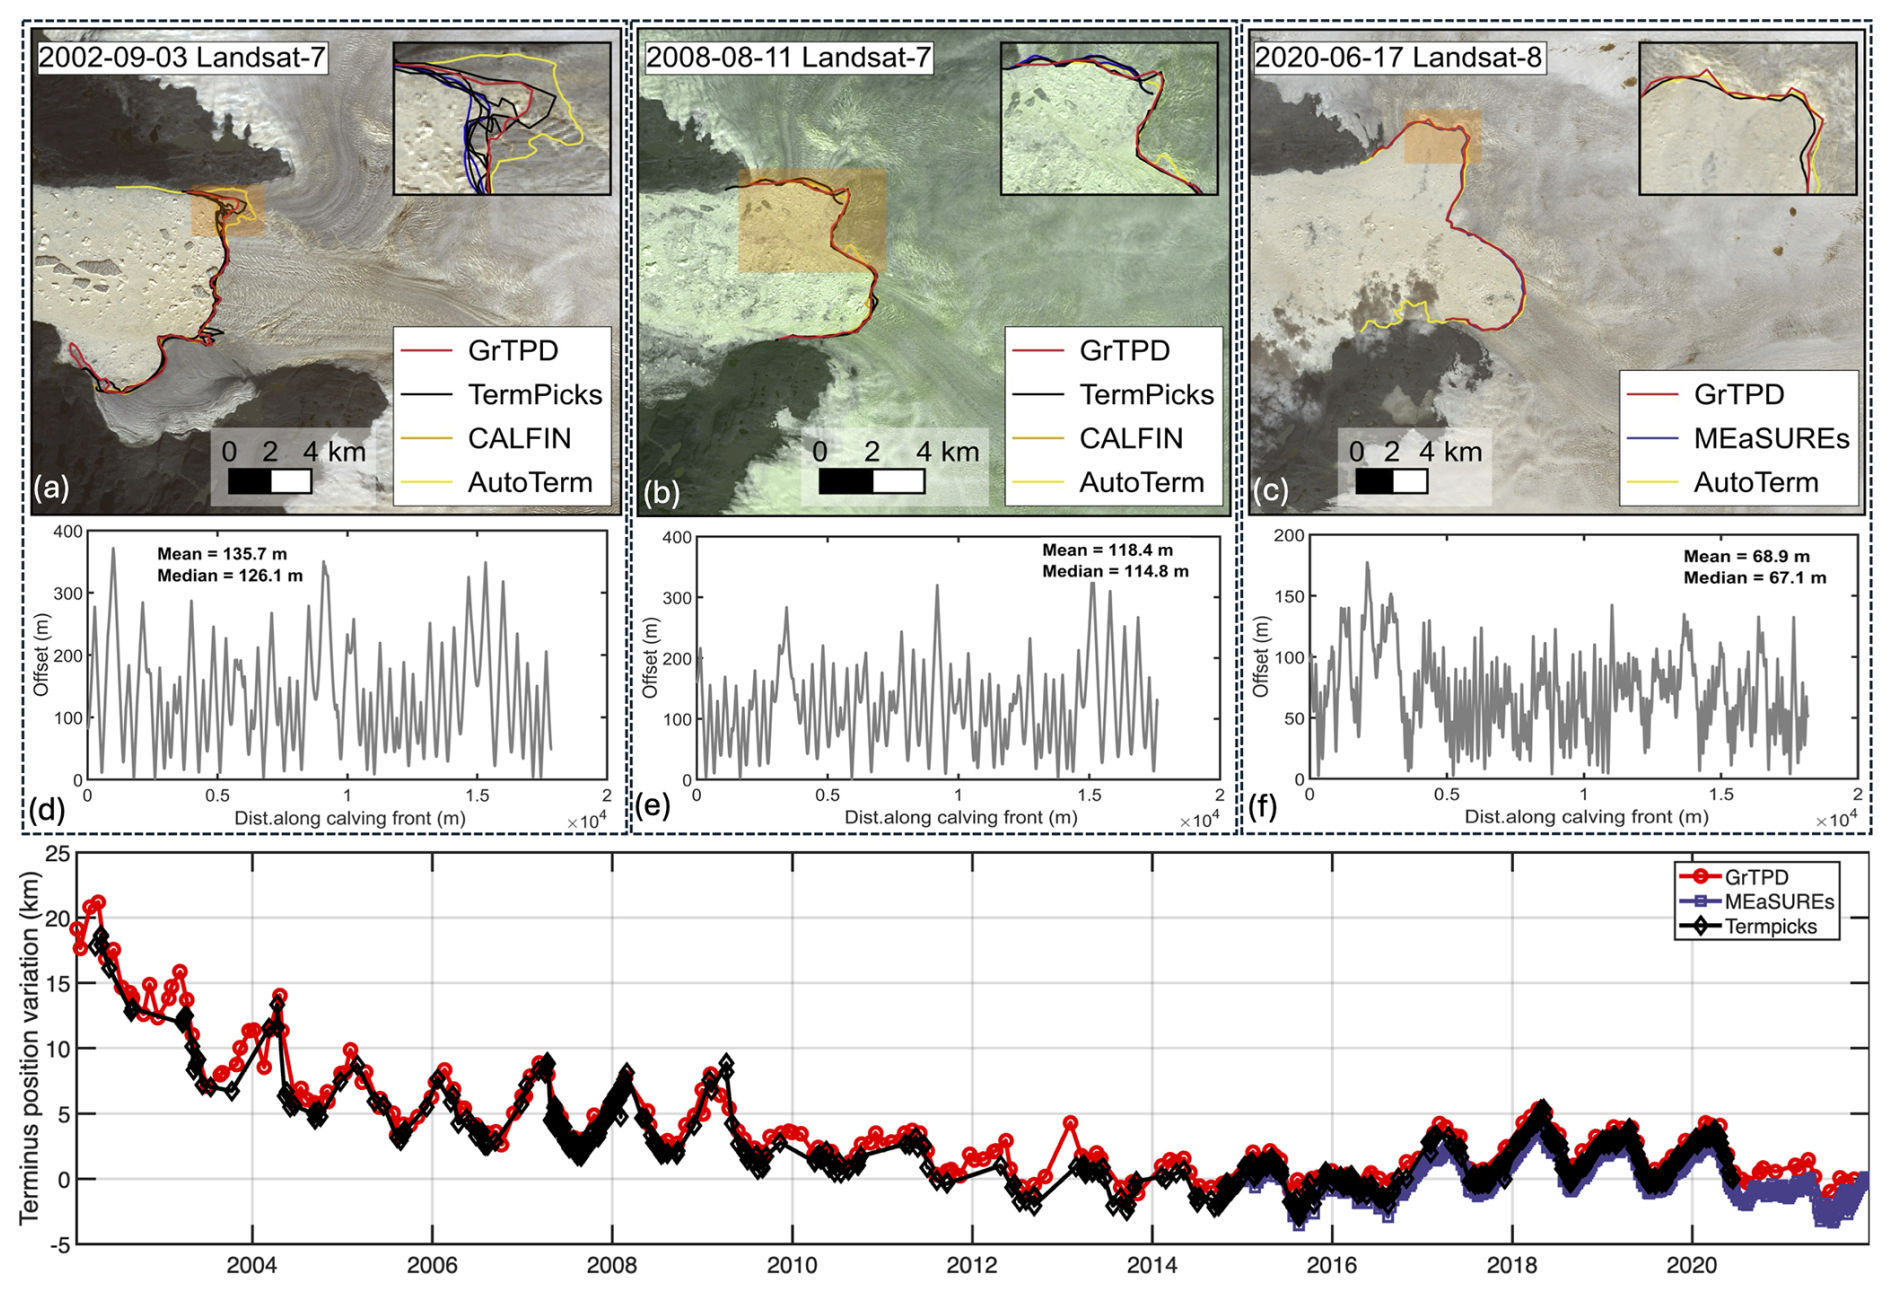
Figure 5Spatial and quantitative comparison of calving fronts for Jakobshavn Isbræ Glacier at three representative dates (3 September 2002, 11 August 2008, 17 June 2020). (a)–(c) show GrTPD (red) alongside TermPicks (black), CALFIN (orange), AutoTerm (yellow) and MEaSUREs (blue). Insets highlight zones of mélange or lateral embayment complexity. (d)–(f) plot the along-front offset distributions. (d) and (e) show comparisons between this dataset and TermPicks, corresponding to (a) and (b), respectively. (f) compares this dataset with MEaSUREs, corresponding to (c). Each profile displays both the average and median offsets. (g) presents the time series of manually delineated ice front position variation (km) from 2002 through 2021.
In addition to the comparison with existing datasets based on overlapping delineations, we examine the temporal consistency of glacier terminus positions at the scale of individual outlet glaciers. Specifically, we focus on the glaciers illustrated in Fig. 1 and present detailed spatial overlays and time-series comparisons of terminus positions to further evaluate the consistency of temporal variations among datasets. Kangaasarsuup Sermia glacier, which is not included in any of the existing datasets, was excluded from this comparison. Where overlapping scenes were available, we compared manually delineated fronts in this study with those from each dataset using both visual overlays and distance-based metrics, with the AMD used to quantify spatial offset.
We compared GrTPD presented in this study with several widely used, high-quality calving front products, including the time series compiled by TermPicks (Goliber et al., 2022), MEaSUREs (Black and Joughin, 2023), CALFIN (Cheng et al., 2021b), and AutoTerm (Zhang et al., 2023). Figures 4–8 illustrate case studies for Petermann Gletsjer, Jakobshavn Isbræ, Zachariae Isstrøm, Helheim Gletsjer and Sverdrup Gletsjer, respectively. For each glacier, we present visual overlays of multi-source ice front positions and corresponding AMD-based offset profiles for three representative dates, along with a long-term time series comparison. Across all sites, the results indicate that manually delineated ice fronts generally show closer agreement and greater positional consistency than automated methods, particularly in visually complex regions. These include mélange-filled fjords, near-terminus crevasse zones, shadowed margins, and lateral embayments, where automated algorithms often fail to preserve morphological detail or misplace the terminus. In earlier years or under challenging image conditions (e.g., mélange or cloud), AutoTerm and CALFIN exhibit large offset (> 1 km) and reduced morphological precision, often smoothing over frontal curvature or omitting finer-scale features. These deficiencies are especially pronounced in early Landsat scenes and low-contrast fjord settings. For example, at Petermann Gletsjer (Fig. 4a–c), irregular ice front morphology combined with extensive shadowing and mélange cover leads to substantial discrepancies, with automated outputs frequently misaligning with the true ice–ocean boundary. At Jakobshavn Isbræ (Fig. 5a), lateral mélange accumulation obscures the terminus, causing AutoTerm to deviate significantly from other datasets. A particularly notable error occurs in Fig. 5c, where shadowed side regions are misclassified as part of the calving front, resulting in the omission of a retreat signal during a known disintegration phase. For Zachariae Isstrøm (Fig. 6b–c), algorithmic misidentification of surface fractures at the calving front inflates the spatial offset, particularly in zones where the actual terminus is fragmented or poorly defined. For Helheim (Fig. 7b–c), low image contrast and poorly defined lateral margins lead to deviations exceeding 2 km in the automatically extracted fronts. In contrast, manual delineations capture subtle structures such as ice tongue protrusions and calving embayment concavities with greater fidelity, supporting their use as a reference for both model boundary conditions and algorithm training. These examples highlight common challenges in automated products when faced with ambiguous spectral signals or complex frontal configurations and reinforce the added interpretive value of high-quality manual delineations under challenging observational conditions. The delineations produced in this study remain consistent and structurally accurate even in these environments, highlighting the added value of expert interpretation.
In addition, GrTPD exhibits good consistency with other manually compiled ice front products in capturing both seasonal and interannual glacier dynamics. Time series comparisons with TermPicks (Goliber and Black, 2021) and MEaSUREs (Black and Joughin, 2023) reveal close alignment across multiple glaciers and observation periods (Figs. 4–8g). For example, at Petermann Gletsjer the long-term position change trends are highly consistent among the three datasets, confirming their shared capacity to resolve broad-scale frontal evolution (Fig. 4g). The time series in Figs. 6g and 8g further supports that close correspondence between our dataset and MEaSUREs across the observation period. Notably, the 2004–2005 calving event and the subsequent advance were also captured (Fig. 6g). GrTPD resolves seasonal fluctuations and short-term variability that are consistent with MEaSUREs during overlapping years, while also extending the record back to the early 2000s, providing enhanced temporal continuity for long-term monitoring of Zachariae Isstrøm and Sverdrup Gletsjer. Offset profiles computed using the AMD metric further substantiate this agreement. At Petermann Gletsjer, the AMD between our dataset and the TermPicks or MEaSUREs products is 202.2 m for 2003, 49.3 m for 2017, and 68.6 m for 2020 (Fig. 4d–f). The larger deviation in 2003 reflects the presence of mélange and complex frontal geometry, which challenge all methods. At Jakobshavn Isbræ (Fig. 5d–f), mean offsets range from 68.9 to 135.7 m, with the highest values again associated with earlier imagery and dynamic terminus changes. For Zachariae Isstrøm (Fig. 6d–f), AMD values range from 45.6 to 94.1 m across three dates, with strong spatial alignment observed in clearer scenes such as 2018 (Fig. 6e). For Sverdrup Gletsjer (Fig. 8d–f), the AMD values ranged from 73.8 to 110.7 m across the three observation dates, showing good overall agreement without significant deviations.
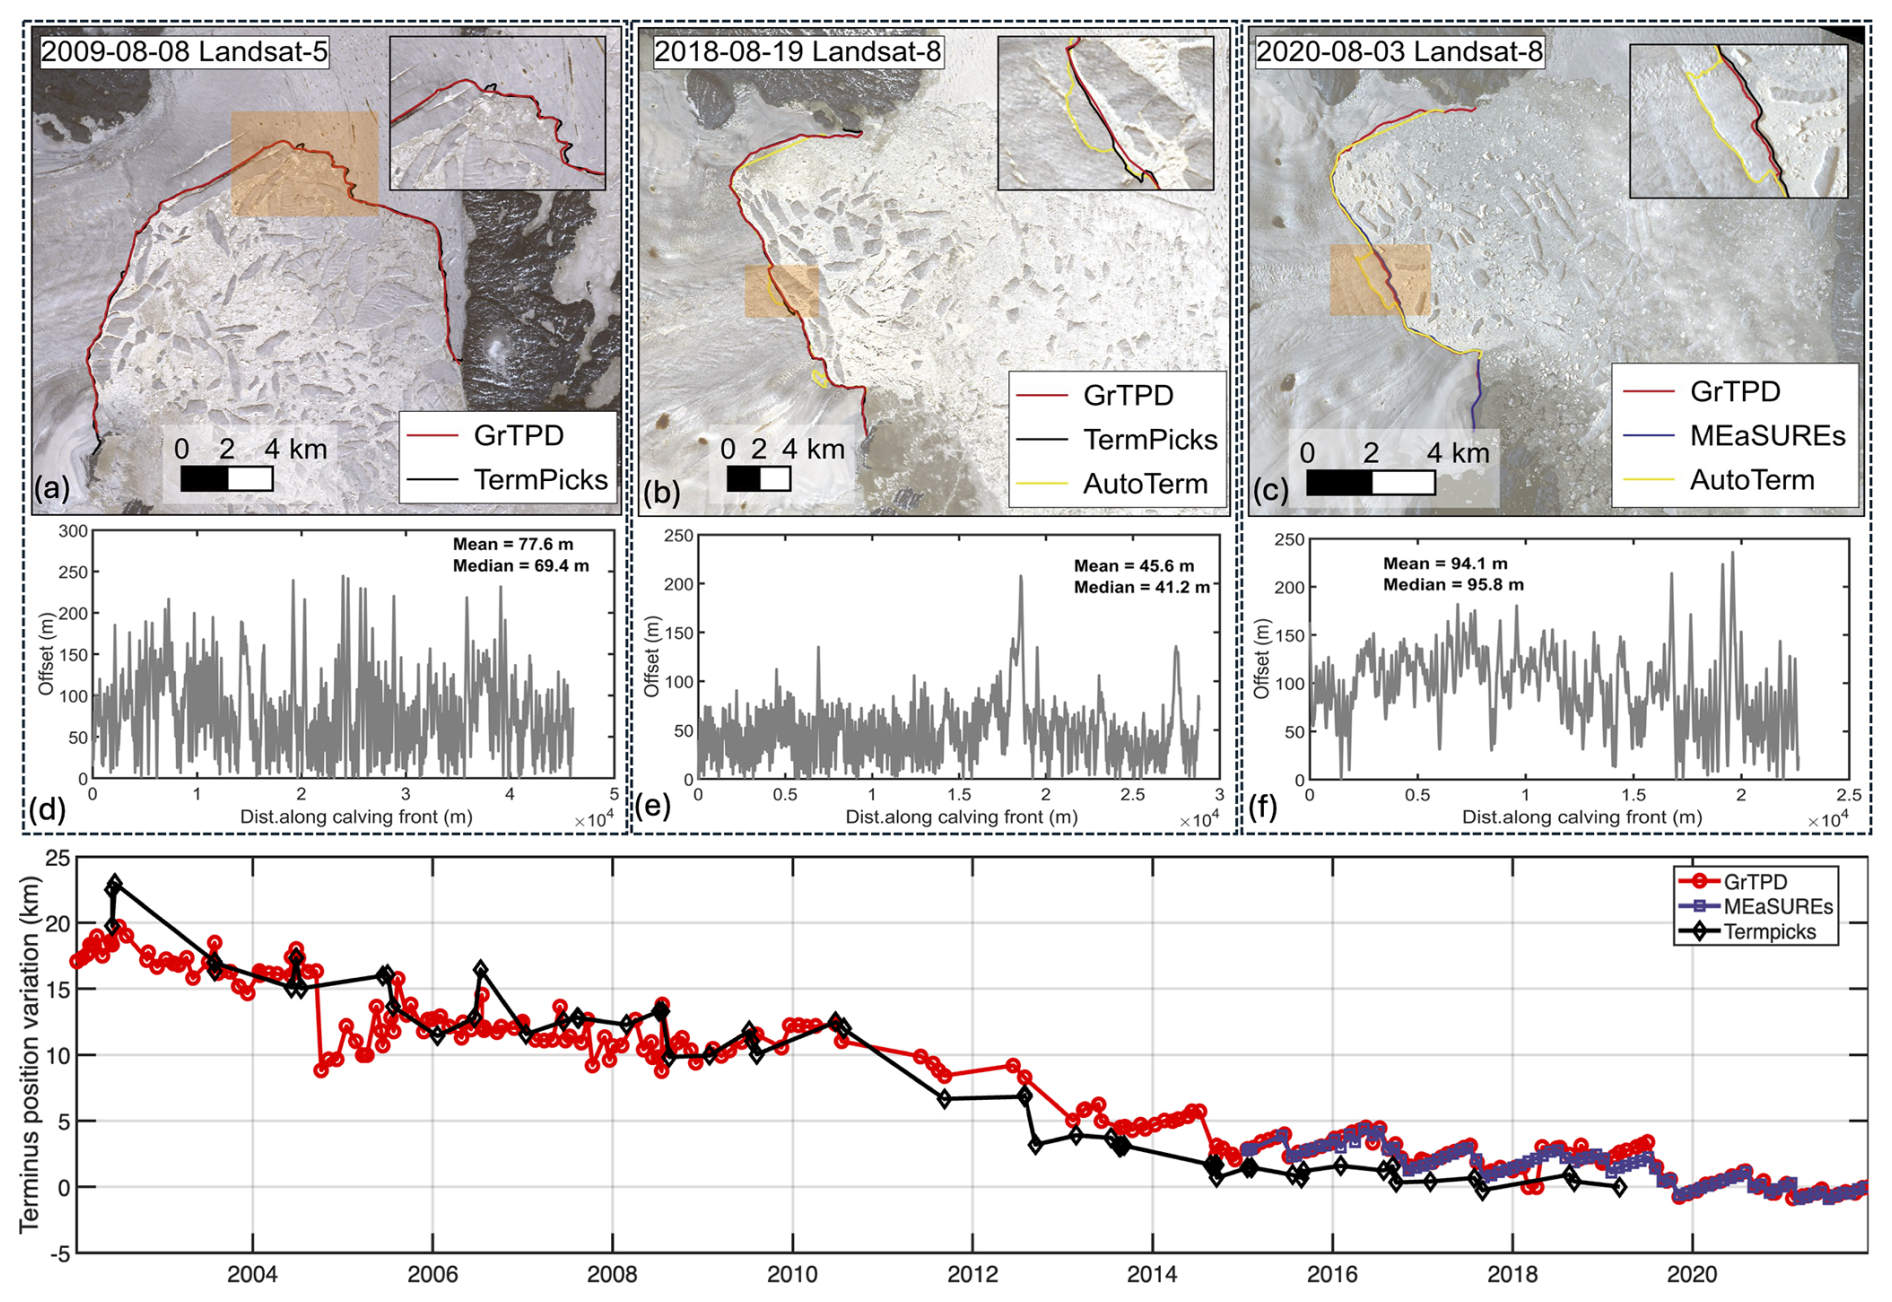
Figure 6Multi-temporal assessment of Zachariae Isstrøm calving front positions on 8 August 2009, 19 August 2018 and 3 August 2020. (a)–(c) overlay GrTPD (red) with TermPicks (black), AutoTerm (yellow) and MEaSUREs (blue) on Landsat images; zoomed insets show areas of high morphological complexity. Panels (d)–(f) illustrate along-front offset profiles for each date. (d) and (e) show comparisons between this dataset and TermPicks, corresponding to (a) and (b), respectively. (f) compares this dataset with MEaSUREs, corresponding to (c). Each profile displays both the average and median offsets. (g) presents the time series of manually delineated calving front position variation (km) from 2002 through 2021.
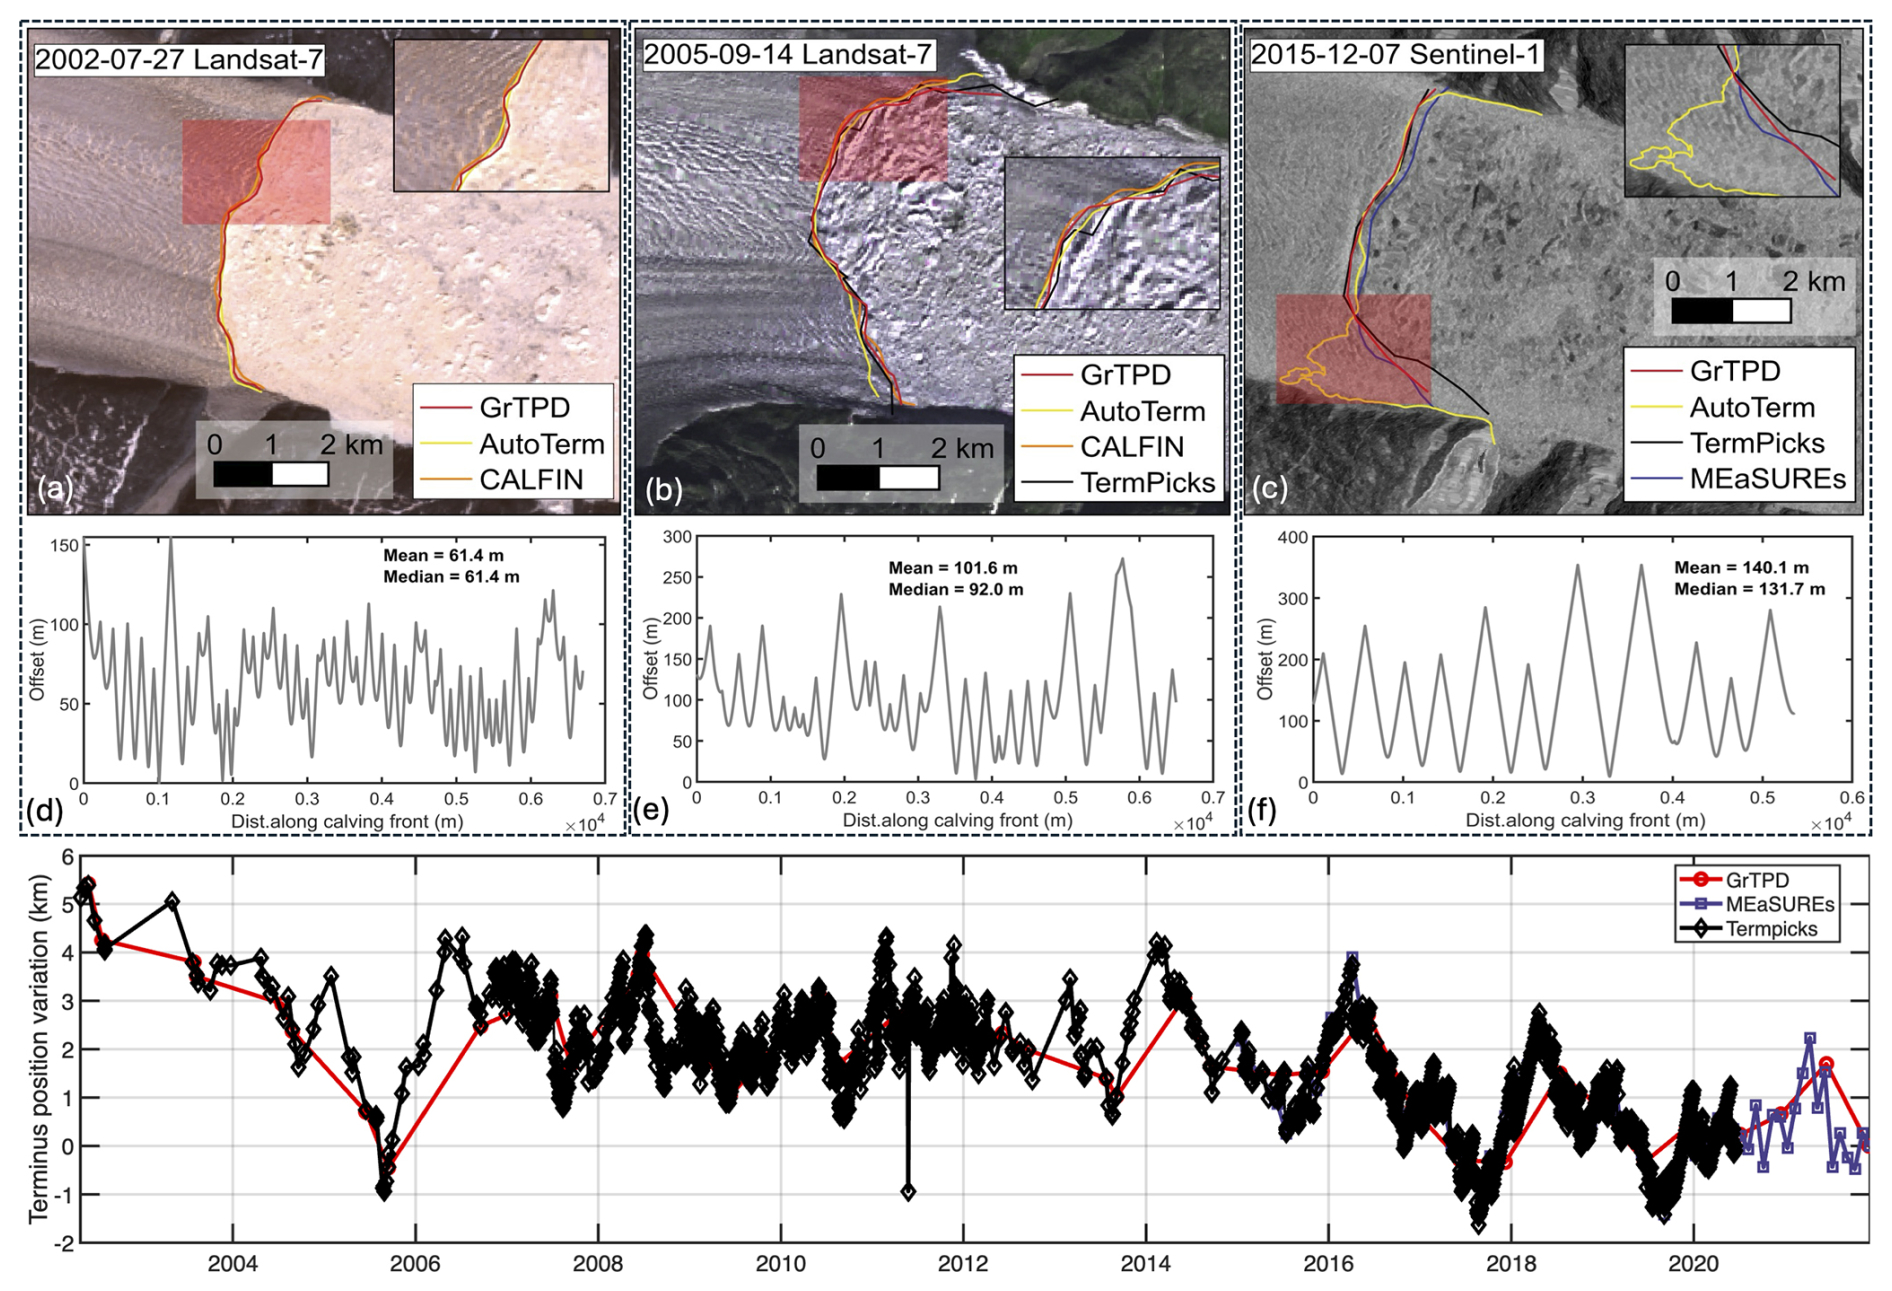
Figure 7Multi-temporal assessment of Helheim calving front positions on 27 July 2002, 14 September 2005 and 7 December 2015. (a)–(c) overlay GrTPD (red) with TermPicks (black), CALFIN (orange), AutoTerm (yellow) and MEaSUREs (blue) on Landsat and Sentinel-1 images; zoomed insets show areas of high morphological complexity. Panels (d)–(f) illustrate along-front offset profiles for each date. (d) show comparisons between this dataset and CALFIN, corresponding to (a). (e) and (f) compares this dataset with TermPicks, corresponding to (b) and (c), respectively. Each profile displays both the average and median offsets. (g) presents the time series of manually delineated calving front position variation (km) from 2002 through 2021.
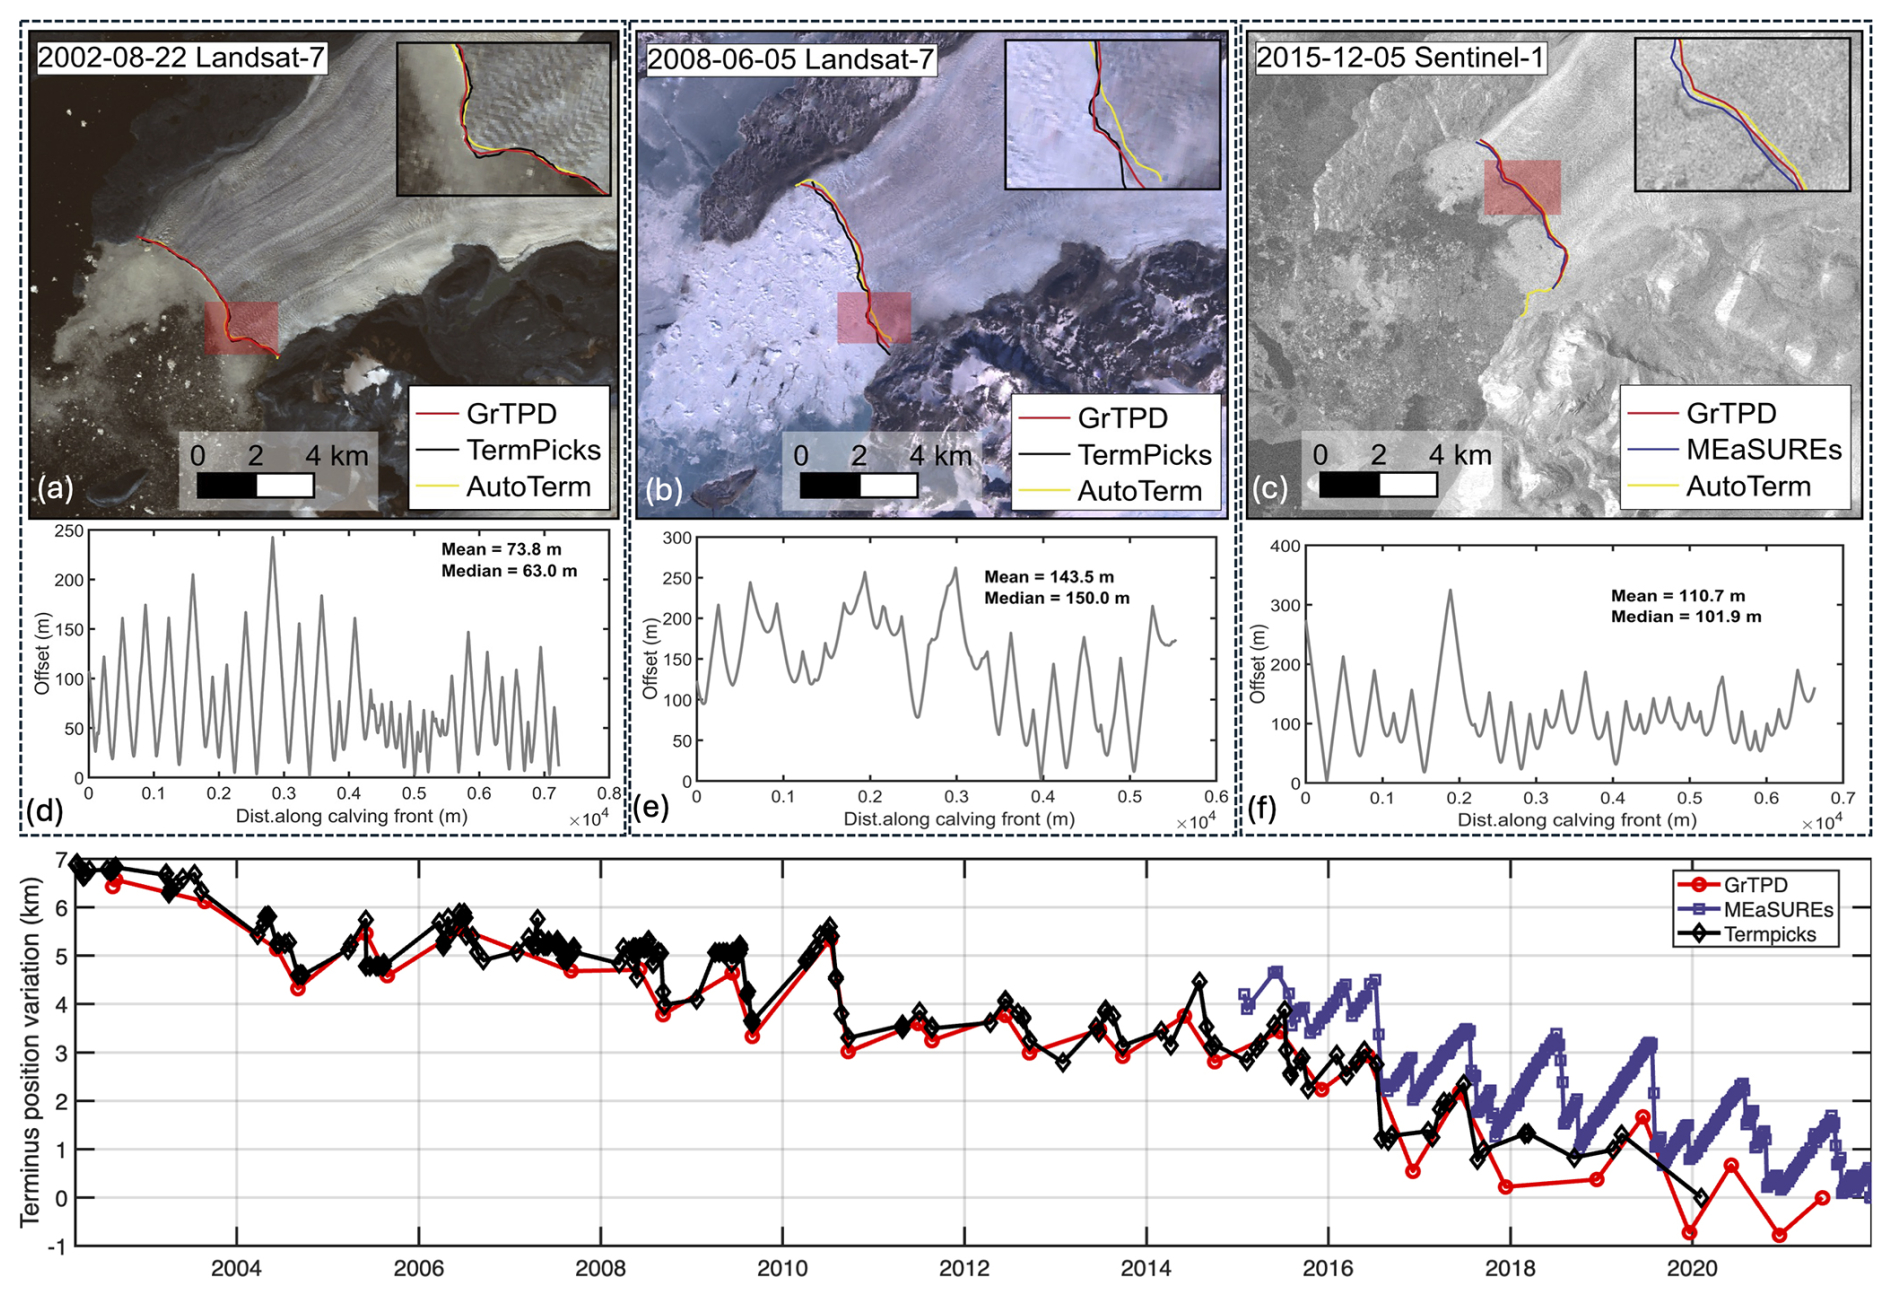
Figure 8Multi-temporal assessment of Sverdrup Gletsjer calving front positions on 22 August 2002, 5 June 2008 and 5 December 2015. (a)–(c) overlay our manual fronts (red) with TermPicks (black), AutoTerm (yellow) and MEaSUREs (blue) on Landsat and Sentinel-1 images; zoomed insets show areas of high morphological complexity. Panels (d)–(f) illustrate along-front offset profiles for each date. (d) and (e) show comparisons between this dataset and TermPicks, corresponding to (a) and (b), respectively. (f) compares this dataset with MEaSUREs, corresponding to (c). Each profile displays both the average and median offsets. (g) presents the time series of manually delineated calving front position variation (km) from 2002 through 2021.
Across all comparative analyses, GrTPD shows good agreement with existing reference products. In comparison with other manually curated datasets, such as TermPicks (Goliber et al., 2022) and MEaSUREs (Black and Joughin, 2023), GrTPD captures comparable seasonal and interannual patterns in glacier terminus variability. It should be noted, however, that the temporally dense sampling illustrated in the selected examples reflects glaciers with relatively high data availability. For these glaciers, the temporal resolution reaches approximately 7 terminus delineations per year, compared to an average of 2 delineations per year across all glaciers in the dataset. Seasonal or sub-seasonal coverage is achieved only for a subset of glaciers, depending on satellite data availability and image quality. For some small or less frequently imaged glaciers, temporal sampling is constrained by data gaps, and terminus positions are recorded whenever suitable imagery is available rather than at fixed seasonal intervals. These limitations reflect inherent constraints of satellite coverage and do not detract from the overall consistency and representativeness of the dataset at regional and ice-sheet scales.
The dataset described in this study provides manually delineated ice front positions for 465 glaciers across Greenland, spanning the period 2002 to 2021. It includes 19 171 individual terminus delineations, offering broad spatial coverage and seasonal to multi-year temporal resolution (Fig. 9). The full dataset is publicly available at https://doi.org/10.5281/zenodo.19181770 (Xi et al., 2026). For each glacier, the dataset includes a short centerline representing the local ice-flow direction at the terminus, enabling quantification of terminus-position variability and associated dynamic changes. Centerlines were constructed from a robust reference point defined as the median position of all terminus midpoints for a given glacier and were scaled adaptively according to glacier size. The construction followed gridded ice-flow velocity fields (Gardner et al., 2019) with an inertial constraint to suppress small-scale directional noise, while downstream segments lacking reliable velocity information were extended using the dominant upstream centerline orientation.
The dataset is organized in a GeoPackage (GPKG) structure by glacier ID, with all delineations for a given glacier stored within a single layer. Glacier ID follows the naming conventions of the TermPicks (Goliber et al., 2022) and AutoTerm (Zhang et al., 2023) datasets to facilitate cross-dataset comparison and integration. For glaciers not included in AutoTerm, identifiers were assigned sequentially following the same numbering scheme, ensuring internal consistency across the dataset. All spatial data are provided in the WGS 84 geographic coordinate system (EPSG:4326), ensuring compatibility with standard GIS and remote-sensing software. Each terminus is accompanied by structured metadata with the following attributes:
-
ID – unique glacier identifier (GIDxxx),
-
GlacierNam – official glacier name,
-
TermTyp – terminus type of the glacier, classified as marine-terminating (MT), land-terminating (LT), and lake-terminating glaciers (LaT),
-
Type – glacier classification based on ice origin (GrIS, LGIC),
-
Date – acquisition date in the format YYYY-MM-DD,
-
Satellite – platform name (e.g., Landsat-7, Sentinel-2),
-
ImagePath – source imagery used for digitization,
-
Method – digitization tool used (GEEDiT, ArcGIS and QGIS),
-
nvert – number of vertices composing the terminus polyline,
-
len_km – terminus length (km).
Metadata fields are formatted using a consistent schema across all glacier layers, enabling straightforward filtering, aggregation, and time-series analysis by date, satellite sensor, glacier type, and other attributes.
This dataset enables the analysis of glacier terminus variability across a wide range of temporal scales, from multi-year retreat trends to seasonal and sub-seasonal fluctuations. The time series from individual glaciers highlight a diverse range of calving front behaviors, including episodic calving events (Fig. 4), progressive multi-year retreat (Figs. 6, 8), and regular seasonal advance–retreat cycles (Figs. 5, 7). Owing to variability in satellite availability and cloud conditions, temporal sampling density varies among glaciers. For most glaciers, typical sampling intervals range from approximately three to five months (Fig. 9). Glaciers of scientific interest or exhibiting strong frontal variability – such as Jakobshavn Isbræ and Helheim Gletsjer – are represented at substantially higher temporal frequency, supporting detailed analyses of short-term terminus dynamic. Beyond its observational utility, the dataset has also been applied as a time-varying boundary condition in high-resolution transient ice flow modeling, enhancing model-data integration (Lu et al., 2025).
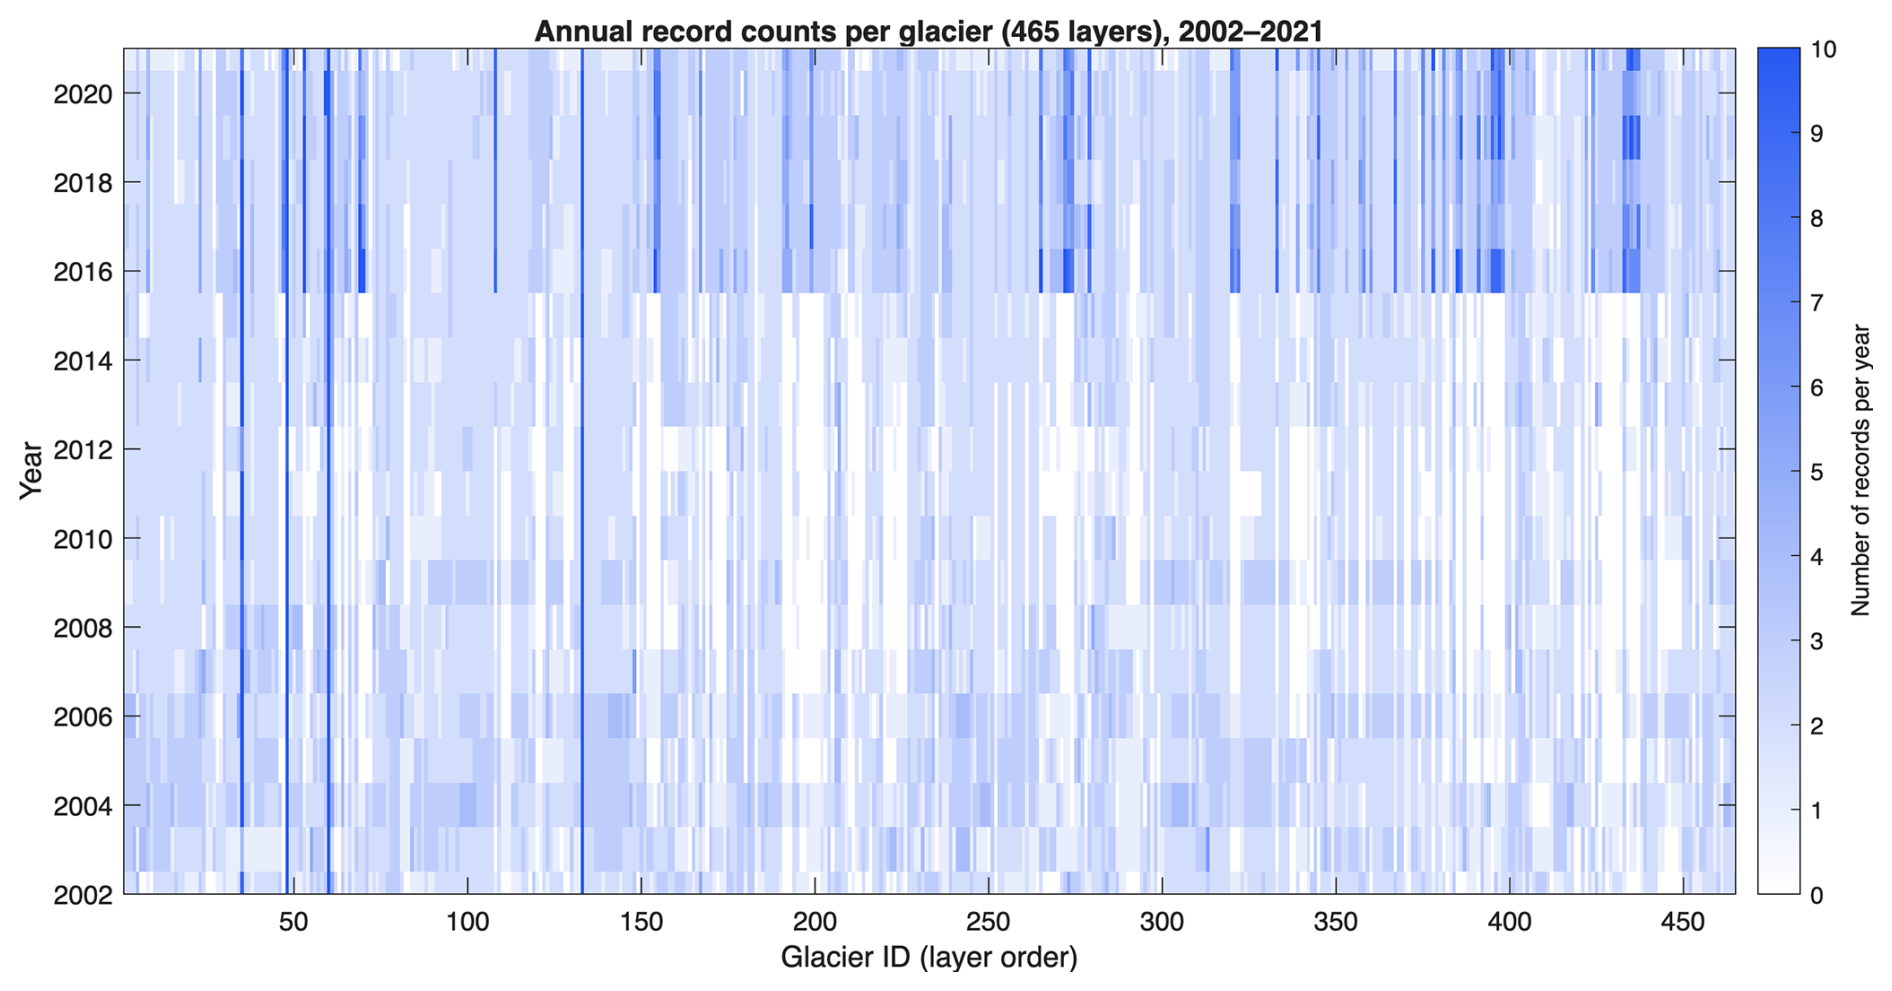
Figure 9Ice front positions delineation density (2002–2021) for 465 Greenland glaciers. Each column represents a glacier, each row a calendar year, and the colour scale indicates the number of manually digitized ice front positions per glacier per year.
Beyond marine-terminating glaciers, GrTPD extends systematic terminus observations to land-terminating and lake-terminating glaciers that have been largely absent from previous manually delineated datasets. For these glacier types, the combination of consistent terminus delineations and glacier-specific centerlines enables quantitative assessment of frontal migration along a physically meaningful, flow-oriented reference framework. Figure 10 presents example analyses for several lake-terminating glaciers, illustrating distinct retreat behaviors and temporal variability that are not captured by marine-focused datasets. For example, glacier GID449 exhibits a regular seasonal advance–retreat cycle throughout the observational period, superimposed on a cumulative net retreat of approximately 59.6 m yr−1 since 2002. In contrast, glacier GID397 shows relatively stable terminus positions prior to 2016, followed by rapid retreat in subsequent years. Such contrasting patterns highlight the diverse dynamical responses of lake-terminating glaciers and suggest an increasing sensitivity to surface melt processes and proglacial lake evolution in recent years. These examples underscore the added value of incorporating land- and lake-terminating glaciers into Greenland-wide terminus datasets, complementing existing products that primarily focus on marine-terminating systems.
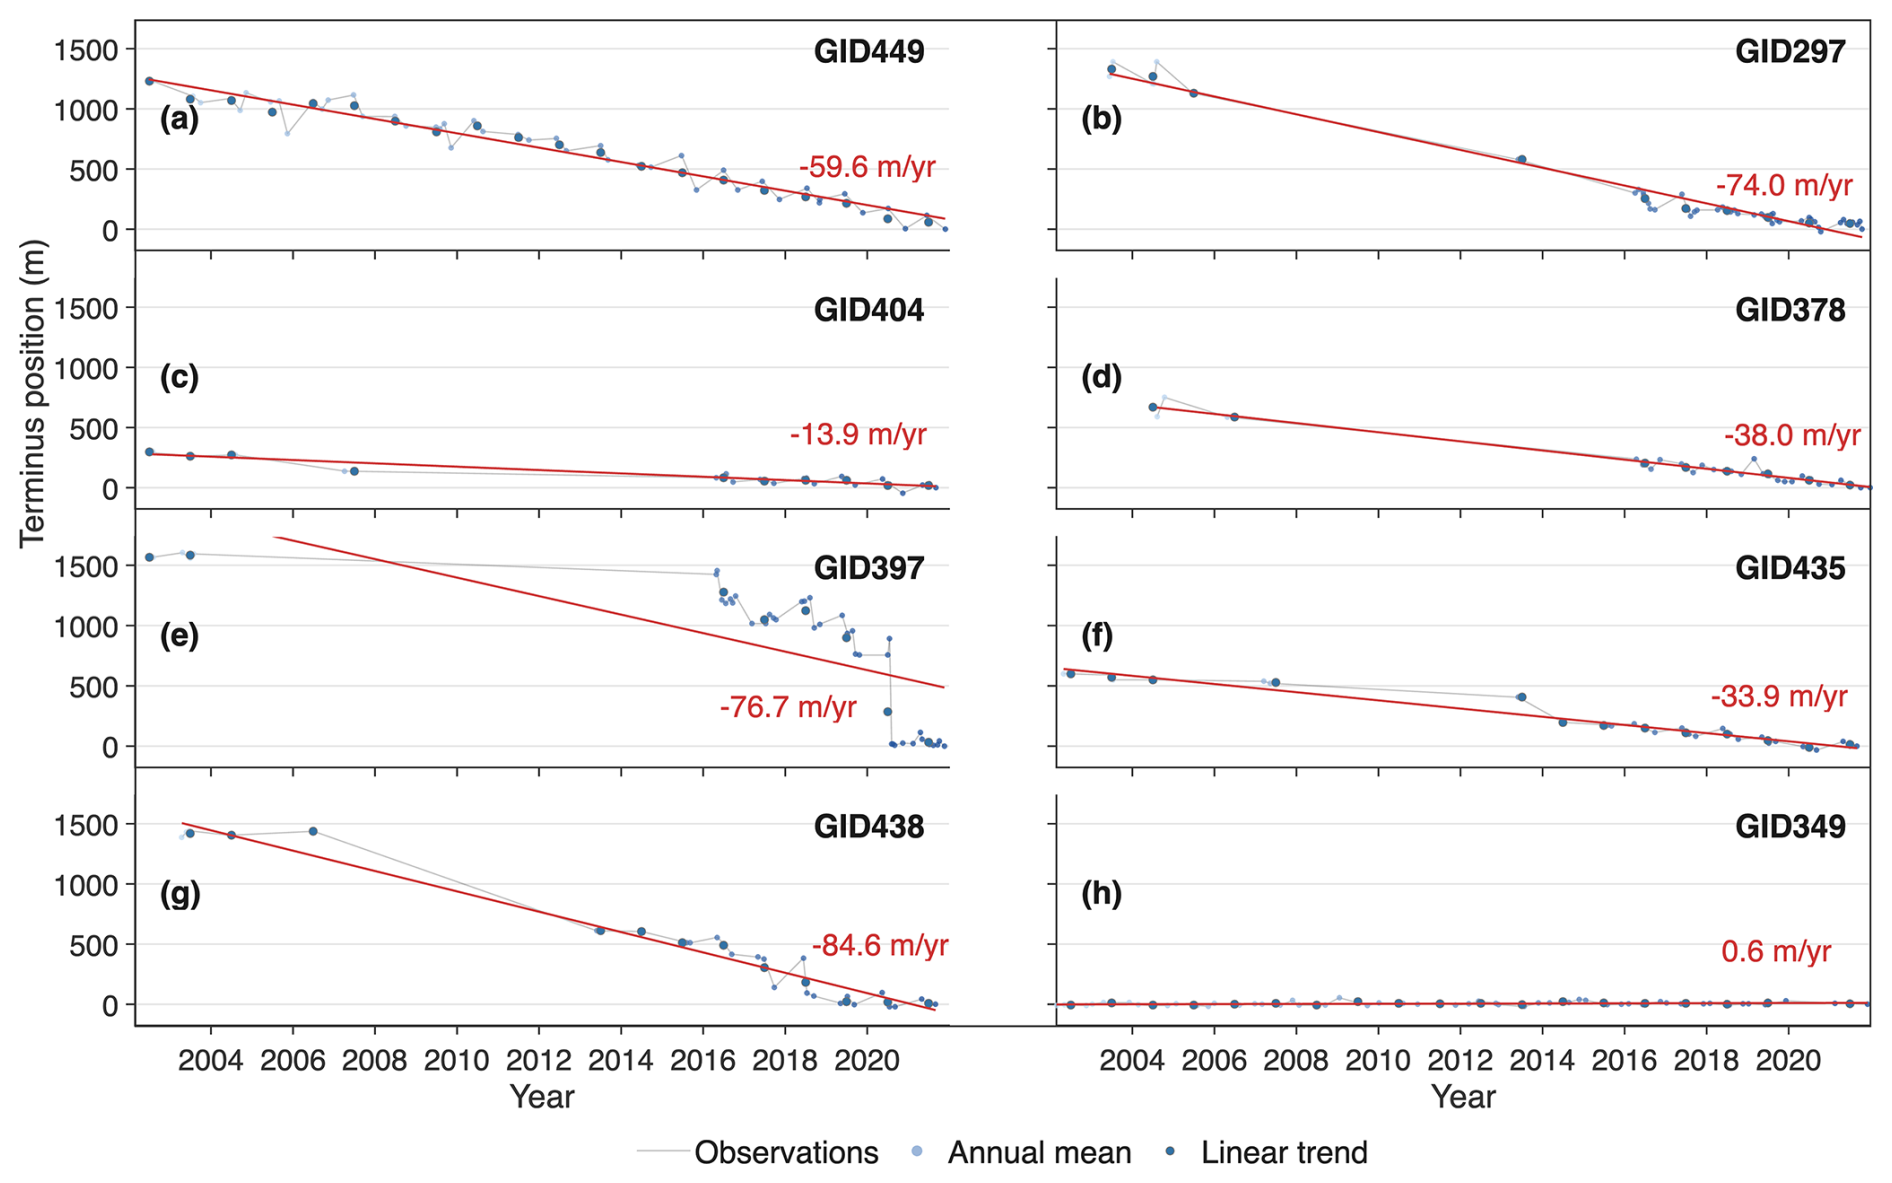
Figure 10Time series of terminus position change for several lake-terminating glaciers in Greenland derived from the GrTPD dataset. For each glacier, terminus positions are projected along the glacier-specific centerline to quantify frontal migration relative to a fixed upstream reference. Blue points indicate individual terminus observations with temporal sampling varying according to satellite availability. Annual mean positions are shown as filled circles, and red lines indicate linear trends with annotated rates (m yr−1).
In addition to its direct observational applications, the dataset provides a high-quality reference for the development, validation, and intercomparison of automated glacier terminus delineation algorithms. As shown in the Validation section, GrTPD can be used in conjunction with existing manually delineated products, such as TermPicks, as independent training and evaluation datasets for automated approaches. This enables robust assessment of algorithm performance, generalization, and uncertainty across a broad range of glacier types and environmental conditions that are not fully represented in existing marine-focused datasets.
The complete Greenland Terminus Position Dataset (GrTPD), covering 465 glaciers across Greenland from 2002 to 2021, is publicly available via Zenodo at https://doi.org/10.5281/zenodo.19181770 (Xi et al., 2026). All glacier terminus delineations are provided in GeoPackage (GPKG) format and are organized by glacier identifier, facilitating efficient access and glacier-specific analyses. Terminus delineation was carried out using the open-source Google Earth Engine Digitisation Tool (Lea, 2018), in combination with ENVI, ArcGIS, and QGIS for supplementary processing and quality control. All reference datasets used for validation and intercomparison are publicly available. These datasets, including TermPicks and AutoTerm, are accessible through their respective repositories (TermPicks: https://doi.org/10.5281/zenodo.6557981 (Goliber et al., 2021); AutoTerm: https://doi.org/10.5281/zenodo.7782039 (Zhang, 2022)). Additional reference datasets include MEaSUREs (https://doi.org/10.5067/DGBOSSIULSTD; Black and Joughin, 2022) and CALFIN (https://doi.org/10.5067/7FILV218JZA2; Cheng et al., 2021a), which are also publicly available through their respective data portals. Detailed validation results against TermPicks and AutoTerm are provided in the Supplement.
Accurate, spatially extensive records of glacier terminus positions are essential for understanding glacier dynamics, quantifying ice-sheet mass loss, and constraining time-varying boundary conditions in ice-flow models. In this study, we present GrTPD, a new manually delineated dataset of glacier terminus positions for the Greenland Ice Sheet, providing spatially extensive and seasonally targeted coverage (at least twice per year) across marine-, land-, and lake-terminating. The dataset comprises 19 171 terminus delineations for 465 glaciers spanning the period from 2002 to 2021, derived from multi-source optical and SAR satellite imagery using standardized and reproducible workflows. Systematic validation against existing manually delineated and automated products, including TermPicks and AutoTerm, demonstrates high geometric fidelity and positional consistency of the GrTPD dataset, with mean glacier-level AMD of 86 m relative to TermPicks and 115 m relative to AutoTerm. The comparison further highlights that manual delineations generally exhibit closer agreement and reduced positional variability in visually complex settings, such as regions affected by ice mélange, low contrast, or heterogeneous terminus geometry, where automated approaches remain more sensitive to image quality and surface conditions.
Beyond marine-terminating glaciers, GrTPD extends consistent terminus observations to land-terminating and lake-terminating glaciers that have been underrepresented in previous Greenland-wide manual datasets. The inclusion of glacier-specific centerlines enables flow-oriented analysis of frontal migration across diverse glacier types, revealing contrasting retreat behaviours and temporal variability that complement existing marine-focused records. In addition, the dataset has been applied as a time-varying boundary condition in high-resolution transient ice-flow modelling, demonstrating its utility for model–data integration.
Overall, GrTPD fills critical gaps in the spatial coverage, glacier-type representation, and temporal consistency of existing Greenland terminus datasets. As an independent, manually curated reference product, it provides a robust foundation for studies of glacier dynamics, mass loss, and ice–climate interactions, as well as for the development, validation, and intercomparison of automated glacier terminus delineation algorithms. The dataset is openly available and designed to support future observational, modelling, and machine-learning-based investigations across the Greenland Ice Sheet.
The supplement related to this article is available online at https://doi.org/10.5194/essd-18-2635-2026-supplement.
XL produced, managed, and analyzed the dataset and wrote the manuscript. LJ provided academic supervision and conceptual guidance throughout the study and contributed to the revision and refinement of the manuscript. DL and YL assisted with dataset generation and analysis and supported the data processing workflow. AJS and SJL contributed to scientific discussions, provided insights into glaciological processes and data interpretation, and offered critical feedback that improved the manuscript.
The contact author has declared that none of the authors has any competing interests.
Publisher's note: Copernicus Publications remains neutral with regard to jurisdictional claims made in the text, published maps, institutional affiliations, or any other geographical representation in this paper. The authors bear the ultimate responsibility for providing appropriate place names. Views expressed in the text are those of the authors and do not necessarily reflect the views of the publisher.
We thank members of the Research Group of Imaging Geodesy and Earth Surface Processes for valuable discussions. We also acknowledge the ESA-MOST Dragon Cooperation (Dragon 6) for providing the platform and support for this work, as well as the two reviewers for their helpful and constructive comments.
This work was funded by the National Key R&D Program of China (grant nos. 2018YFC1406102 and 2017YFA0603103), the National Natural Science Foundation of China (grant no. 42171443), the Strategic Priority Research Program of the Chinese Academy of Sciences (grant no. XDA19070104), and the State Key Laboratory of Precision Geodesy (grant no. L25S6102).
This paper was edited by Baptiste Vandecrux and reviewed by Erik Loebel and one anonymous referee.
Andersen, J. K., Fausto, R. S., Hansen, K., Box, J. E., Andersen, S. B., Ahlstrøm, A. P., As, D. v., Citterio, M., Colgan, W. T., Karlsson, N. B., Kjeldsen, K. K., Korsgaard, N. J., Larsen, S. H., Mankoff, K. D., Pedersen, A. Ø., Shields, C. L., Solgaard, A. M., and Vandecrux, B.: Update of annual calving front lines for 47 marine terminating outlet glaciers in Greenland (1999–2018), Geol. Surv. Den. Greenl., https://doi.org/10.34194/GEUSB-201943-02-02, 2019.
Baumhoer, C. A., Dietz, A. J., Kneisel, C., and Kuenzer, C.: Automated Extraction of Antarctic Glacier and Ice Shelf Fronts from Sentinel-1 Imagery Using Deep Learning, Remote Sens.-Basel, 11, 2529, https://doi.org/10.3390/rs11212529, 2019.
Bevan, S. L., Luckman, A. J., and Murray, T.: Glacier dynamics over the last quarter of a century at Helheim, Kangerdlugssuaq and 14 other major Greenland outlet glaciers, The Cryosphere, 6, 923–937, https://doi.org/10.5194/tc-6-923-2012, 2012.
Bézu, C. and Bartholomaus, T. C.: Greenland Ice Sheet's Distinct Calving Styles Are Identified in Terminus Change Timeseries, Geophys. Res. Lett., 51, e2024GL110224, https://doi.org/10.1029/2024GL110224, 2024.
Bjørk, A. A., Kruse, L. M., and Michaelsen, P. B.: Brief communication: Getting Greenland's glaciers right – a new data set of all official Greenlandic glacier names, The Cryosphere, 9, 2215–2218, https://doi.org/10.5194/tc-9-2215-2015, 2015.
Black, T. and Joughin, I.: MEaSUREs Weekly to Monthly Greenland Outlet Glacier Terminus Positions from Sentinel-1 Mosaics (NSIDC-0781, Version 1), NASA National Snow and Ice Data Center Distributed Active Archive Center [data set], https://doi.org/10.5067/DGBOSSIULSTD, 2022.
Black, T. E. and Joughin, I.: Weekly to monthly terminus variability of Greenland's marine-terminating outlet glaciers, The Cryosphere, 17, 1–13, https://doi.org/10.5194/tc-17-1-2023, 2023.
Brough, S., Carr, J. R., Ross, N., and Lea, J. M.: Exceptional Retreat of Kangerlussuaq Glacier, East Greenland, Between 2016 and 2018, Front. Earth Sci.-Switz., 7, https://doi.org/10.3389/feart.2019.00123, 2019.
Brough, S., Carr, J. R., Ross, N., and Lea, J. M.: Ocean-Forcing and Glacier-Specific Factors Drive Differing Glacier Response Across the 69° N Boundary, East Greenland, J. Geophys. Res.-Earth, 128, e2022JF006857, https://doi.org/10.1029/2022JF006857, 2023.
Carr, J. R., Vieli, A., and Stokes, C.: Influence of sea ice decline, atmospheric warming, and glacier width on marine-terminating outlet glacier behavior in northwest Greenland at seasonal to interannual timescales, J. Geophys. Res.-Earth, 118, 1210–1226, https://doi.org/10.1002/jgrf.20088, 2013.
Cassotto, R., Fahnestock, M., Amundson, J. M., Truffer, M., and Joughin, I.: Seasonal and interannual variations in ice melange and its impact on terminus stability, Jakobshavn Isbræ, Greenland, J. Glaciol., 61, 76–88, https://doi.org/10.3189/2015JoG13J235, 2017.
Catania, G. A., Stearns, L. A., Sutherland, D. A., Fried, M. J., Bartholomaus, T. C., Morlighem, M., Shroyer, E., and Nash, J.: Geometric Controls on Tidewater Glacier Retreat in Central Western Greenland, J. Geophys. Res.-Earth, 123, 2024–2038, https://doi.org/10.1029/2017JF004499, 2018.
Catania, G. A., Stearns, L. A., Moon, T. A., Enderlin, E. M., and Jackson, R. H.: Future Evolution of Greenland's Marine-Terminating Outlet Glaciers, J. Geophys. Res.-Earth, 125, e2018JF004873, https://doi.org/10.1029/2018JF004873, 2020.
Cheng, D. L., Hayes, W., and Larour, E.: CALFIN Subseasonal Greenland Glacial Terminus Positions (NSIDC-0764, Version 1), NASA National Snow and Ice Data Center Distributed Active Archive Center [data set], https://doi.org/10.5067/7FILV218JZA2, 2021a.
Cheng, D., Hayes, W., Larour, E., Mohajerani, Y., Wood, M., Velicogna, I., and Rignot, E.: Calving Front Machine (CALFIN): glacial termini dataset and automated deep learning extraction method for Greenland, 1972–2019, The Cryosphere, 15, 1663–1675, https://doi.org/10.5194/tc-15-1663-2021, 2021b.
Choi, Y., Morlighem, M., Rignot, E., and Wood, M.: Ice dynamics will remain a primary driver of Greenland ice sheet mass loss over the next century, Commun. Earth Environ., 2, 26, https://doi.org/10.1038/s43247-021-00092-z, 2021.
Fahrner, D., Lea, J. M., Brough, S., Mair, D. W. F., and Abermann, J.: Linear response of the Greenland ice sheet's tidewater glacier terminus positions to climate, J. Glaciol., 67, 193–203, https://doi.org/10.1017/jog.2021.13, 2021.
Fahrner, D., Slater, D. A., Kc, A., Cenedese, C., Sutherland, D. A., Enderlin, E., de Jong, M. F., Kjeldsen, K. K., Wood, M., Nienow, P., Nowicki, S., and Wagner, T. J. W.: A Frontal Ablation Dataset for 49 Tidewater Glaciers in Greenland, Sci. Data, 12, 601, https://doi.org/10.1038/s41597-025-04948-3, 2025.
Fitzpatrick, A. A. W., Hubbard, A., Joughin, I., Quincey, D. J., As, D. V., Mikkelsen, A. P. B., Doyle, S. H., Hasholt, B., and Jones, G. A.: Ice flow dynamics and surface meltwater flux at a land-terminating sector of the Greenland ice sheet, J. Glaciol., 59, 687–696, https://doi.org/10.3189/2013JoG12J143, 2013.
Frederikse, T., Landerer, F., Caron, L., Adhikari, S., Parkes, D., Humphrey, V. W., Dangendorf, S., Hogarth, P., Zanna, L., Cheng, L., and Wu, Y.-H.: The causes of sea-level rise since 1900, Nature, 584, 393–397, https://doi.org/10.1038/s41586-020-2591-3, 2020.
Fried, M. J., Catania, G. A., Stearns, L. A., Sutherland, D. A., Bartholomaus, T. C., Shroyer, E., and Nash, J.: Reconciling Drivers of Seasonal Terminus Advance and Retreat at 13 Central West Greenland Tidewater Glaciers, J. Geophys. Res.-Earth, 123, 1590–1607, https://doi.org/10.1029/2018jf004628, 2018.
Fürst, J. J., Goelzer, H., and Huybrechts, P.: Ice-dynamic projections of the Greenland ice sheet in response to atmospheric and oceanic warming, The Cryosphere, 9, 1039–1062, https://doi.org/10.5194/tc-9-1039-2015, 2015.
Gardner, A. S., Fahnestock, M. A., and Scambos, T. A.: MEaSUREs ITS_LIVE Landsat Image-Pair Glacier and Ice Sheet Surface Velocities (1), Jet Propulsion Laboratory, NASA [data set], https://doi.org/10.5067/IMR9D3PEI28U, 2019.
Goliber, S. and Black, T.: TermPicks: A century of Greenland glacier terminus data for use inmachine learning applications (Version 1), Zenodo [data set], https://doi.org/10.5281/zenodo.6557981, 2021.
Goliber, S., Black, T., Catania, G., Lea, J. M., Olsen, H., Cheng, D., Bevan, S., Bjørk, A., Bunce, C., Brough, S., Carr, J. R., Cowton, T., Gardner, A., Fahrner, D., Hill, E., Joughin, I., Korsgaard, N. J., Luckman, A., Moon, T., Murray, T., Sole, A., Wood, M., and Zhang, E.: TermPicks: a century of Greenland glacier terminus data for use in scientific and machine learning applications, The Cryosphere, 16, 3215–3233, https://doi.org/10.5194/tc-16-3215-2022, 2022.
Greene, C. A., Gardner, A. S., Wood, M., and Cuzzone, J. K.: Ubiquitous acceleration in Greenland Ice Sheet calving from 1985 to 2022, Nature, 625, 523–528, https://doi.org/10.1038/s41586-023-06863-2, 2024.
Grimes, M., Carrivick, J. L., and Smith, M. W.: Spatial heterogeneity, terminus environment effects and acceleration in mass loss of glaciers and ice caps across Greenland, Global Planet. Change, 239, 104505, https://doi.org/10.1016/j.gloplacha.2024.104505, 2024.
Hall, D. K., Riggs, G. A., Salomonson, V. V., DiGirolamo, N. E., and Bayr, K. J.: MODIS snow-cover products, Remote Sens. Environ., 83, 181–194, https://doi.org/10.1016/S0034-4257(02)00095-0, 2002.
Herrmann, O., Gourmelon, N., Seehaus, T., Maier, A., Fürst, J. J., Braun, M. H., and Christlein, V.: Out-of-the-box calving-front detection method using deep learning, The Cryosphere, 17, 4957–4977, https://doi.org/10.5194/tc-17-4957-2023, 2023.
Holt, E., Nienow, P., and Medina-Lopez, E.: Terminus thinning drives recent acceleration of a Greenlandic lake-terminating outlet glacier, J. Glaciol., 70, https://doi.org/10.1017/jog.2024.30, 2024.
Howat, I. M. and Eddy, A.: Multi-decadal retreat of Greenland's marine-terminating glaciers, J. Glaciol., 57, 389–396, https://doi.org/10.3189/002214311796905631, 2017.
Joughin, I.: MEaSUREs Greenland Image Mosaics from Sentinel-1A and -1B (4), NASA National Snow and Ice Data Center Distributed Active Archive Center [data set], https://doi.org/10.5067/WXQ366CP8YDE, 2021.
KC, A., Enderlin, E. M., Fahrner, D., Moon, T., and Carroll, D.: Seasonality in terminus ablation rates for the glaciers in Greenland (Kalaallit Nunaat), The Cryosphere, 19, 3089–3106, https://doi.org/10.5194/tc-19-3089-2025, 2025.
Kehrl, L. M., Joughin, I., Shean, D. E., Floricioiu, D., and Krieger, L.: Seasonal and interannual variabilities in terminus position, glacier velocity, and surface elevation at Helheim and Kangerlussuaq Glaciers from 2008 to 2016, J. Geophys. Res.-Earth, 122, 1635–1652, https://doi.org/10.1002/2016jf004133, 2017.
Lea, J. M.: The Google Earth Engine Digitisation Tool (GEEDiT) and the Margin change Quantification Tool (MaQiT) – simple tools for the rapid mapping and quantification of changing Earth surface margins, Earth Surf. Dynam., 6, 551–561, https://doi.org/10.5194/esurf-6-551-2018, 2018.
Loebel, E., Scheinert, M., Horwath, M., Humbert, A., Sohn, J., Heidler, K., Liebezeit, C., and Zhu, X. X.: Calving front monitoring at a subseasonal resolution: a deep learning application for Greenland glaciers, The Cryosphere, 18, 3315–3332, https://doi.org/10.5194/tc-18-3315-2024, 2024.
Lu, X., Sole, A., Livingstone, S. J., Cheng, G., Jiang, L., Chudley, T., Noël, B., and Li, D.: Ice Thickness-Induced Variations in Effective Pressure and Basal Conditions Influence Seasonal and Multi-Annual Ice Velocity at Sermeq Kujalleq (Jakobshavn Isbræ), Geophys. Res. Lett., 52, e2024GL111092, https://doi.org/10.1029/2024GL111092, 2025.
Mohajerani, Y., Wood, M., Velicogna, I., and Rignot, E.: Detection of Glacier Calving Margins with Convolutional Neural Networks: A Case Study, Remote Sens.-Basel, 11, 74, https://doi.org/10.3390/rs11010074, 2019.
Moon, T. and Joughin, I.: Changes in ice front position on Greenland's outlet glaciers from 1992 to 2007, J. Geophys. Res., 113, https://doi.org/10.1029/2007jf000927, 2008.
Moon, T., Joughin, I., and Smith, B.: Seasonal to multiyear variability of glacier surface velocity, terminus position, and sea ice/ice mélange in northwest Greenland, J. Geophys. Res.-Earth, 120, 818–833, https://doi.org/10.1002/2015jf003494, 2015.
Mouginot, J., Rignot, E., Bjork, A. A., van den Broeke, M., Millan, R., Morlighem, M., Noel, B., Scheuchl, B., and Wood, M.: Forty-six years of Greenland Ice Sheet mass balance from 1972 to 2018, P. Natl. Acad. Sci. USA, 116, 9239–9244, https://doi.org/10.1073/pnas.1904242116, 2019.
Murray, T., Selmes, N., James, T. D., Edwards, S., Martin, I., O'Farrell, T., Aspey, R., Rutt, I., Nettles, M., and Bauge, T.: Dynamics of glacier calving at the ungrounded margin of Helheim Glacier, southeast Greenland, J. Geophys. Res.-Earth, 120, 964–982, https://doi.org/10.1002/2015JF003531, 2015a.
Murray, T., Scharrer, K., Selmes, N., Booth, A. D., James, T. D., Bevan, S. L., Bradley, J., Cook, S., Llana, L. C., Drocourt, Y., Dyke, L. F. V., Goldsack, A., Hughes, A. L. H., Luckman, A. J., and McGovern, J.: Extensive Retreat of Greenland Tidewater Glaciers, 2000–2010, Arct. Antarct. Alp. Res., https://doi.org/10.1657/AAAR0014-049, 2015b.
Nick, F. M., Vieli, A., Andersen, M. L., Joughin, I., Payne, A., Edwards, T. L., Pattyn, F., and van de Wal, R. S. W.: Future sea-level rise from Greenland's main outlet glaciers in a warming climate, Nature, 497, 235–238, https://doi.org/10.1038/nature12068, 2013.
Otosaka, I. N., Shepherd, A., Ivins, E. R., Schlegel, N.-J., Amory, C., van den Broeke, M. R., Horwath, M., Joughin, I., King, M. D., Krinner, G., Nowicki, S., Payne, A. J., Rignot, E., Scambos, T., Simon, K. M., Smith, B. E., Sørensen, L. S., Velicogna, I., Whitehouse, P. L., A, G., Agosta, C., Ahlstrøm, A. P., Blazquez, A., Colgan, W., Engdahl, M. E., Fettweis, X., Forsberg, R., Gallée, H., Gardner, A., Gilbert, L., Gourmelen, N., Groh, A., Gunter, B. C., Harig, C., Helm, V., Khan, S. A., Kittel, C., Konrad, H., Langen, P. L., Lecavalier, B. S., Liang, C.-C., Loomis, B. D., McMillan, M., Melini, D., Mernild, S. H., Mottram, R., Mouginot, J., Nilsson, J., Noël, B., Pattle, M. E., Peltier, W. R., Pie, N., Roca, M., Sasgen, I., Save, H. V., Seo, K.-W., Scheuchl, B., Schrama, E. J. O., Schröder, L., Simonsen, S. B., Slater, T., Spada, G., Sutterley, T. C., Vishwakarma, B. D., van Wessem, J. M., Wiese, D., van der Wal, W., and Wouters, B.: Mass balance of the Greenland and Antarctic ice sheets from 1992 to 2020, Earth Syst. Sci. Data, 15, 1597–1616, https://doi.org/10.5194/essd-15-1597-2023, 2023.
Porter, C., Howat, I., Noh, M.-J., Husby, E., Khuvis, S., Danish, E., Tomko, K., Gardiner, J., Negrete, A., Yadav, B., Klassen, J., Kelleher, C., Cloutier, M., Bakker, J., Enos, J., Arnold, G., Bauer, G., and Morin, P.: ArcticDEM – Strips, Version 4.1, Harvard Dataverse [data set], https://doi.org/10.7910/DVN/C98DVS, 2022.
Rignot, E. and Kanagaratnam, P.: Changes in the Velocity Structure of the Greenland Ice Sheet, Science, 311, 986–990, https://doi.org/10.1126/science.1121381, 2006.
Rignot, E. and Mouginot, J.: Ice flow in Greenland for the International Polar Year 2008–2009, Geophys. Res. Lett., 39, https://doi.org/10.1029/2012GL051634, 2012.
Sakakibara, D. and Sugiyama, S.: Seasonal ice-speed variations in 10 marine-terminating outlet glaciers along the coast of Prudhoe Land, northwestern Greenland, J. Glaciol., 66, 25–34, https://doi.org/10.1017/jog.2019.81, 2019.
Sundal, A. V., Shepherd, A., Nienow, P., Hanna, E., Palmer, S., and Huybrechts, P.: Melt-induced speed-up of Greenland ice sheet offset by efficient subglacial drainage, Nature, 469, 521–524, https://doi.org/10.1038/nature09740, 2011.
Tedstone, A. J., Nienow, P. W., Gourmelen, N., Dehecq, A., Goldberg, D., and Hanna, E.: Decadal slowdown of a land-terminating sector of the Greenland Ice Sheet despite warming, Nature, 526, 692–695, https://doi.org/10.1038/nature15722, 2015.
Wood, M., Rignot, E., Fenty, I., An, L., Bjork, A., van den Broeke, M., Cai, C., Kane, E., Menemenlis, D., Millan, R., Morlighem, M., Mouginot, J., Noel, B., Scheuchl, B., Velicogna, I., Willis, J. K., and Zhang, H.: Ocean forcing drives glacier retreat in Greenland, Sci. Adv., 7, https://doi.org/10.1126/sciadv.aba7282, 2021.
Xi, L., Liming, J., Daan, L., Yi, L., Andrew, S., and Stephen J., L.: Ice front positions for Greenland glaciers (2002–2021): a spatially extensive seasonal record and benchmark dataset for algorithm validation (5.0), Zenodo [data set], https://doi.org/10.5281/zenodo.19181770, 2026.
Zhang, E.: AutoTerm: A “big data” repository of glacier termini delineated using deep learning (Version 4), Zenodo [data set], https://doi.org/10.5281/zenodo.7782039, 2022.
Zhang, E., Catania, G., and Trugman, D. T.: AutoTerm: an automated pipeline for glacier terminus extraction using machine learning and a “big data” repository of Greenland glacier termini, The Cryosphere, 17, 3485–3503, https://doi.org/10.5194/tc-17-3485-2023, 2023.