the Creative Commons Attribution 4.0 License.
the Creative Commons Attribution 4.0 License.
 | 13 Apr 2026
BuildingSense: a new multimodal building function classification dataset
Pengxiang Su
Runfei Chen
Heng Xu
Wei Huang
Xinling Deng
Songnian Li
Wanglin Yan
Hangbin Wu
Chun Liu
Building function is a description of building usage. The accessibility of its information is essential for urban research, including urban morphology, urban environment, and human activity patterns. Existing building function classification methodologies face two major bottlenecks: (1) poor model interpretability and (2) inadequate multimodal feature fusion. Although large models with strong interpretability and efficient multimodal data fusion capabilities offer promising potential for addressing the bottlenecks, they remain limited in processing multimodal spatial datasets. Their performance in building function classification is therefore also unknown. To the best of our knowledge, there is a lack of multimodal building function classification datasets, which results in the challenge of effectively performing their performance evaluation. Meanwhile, prevailing building function categorization schemes remain coarse, which hinders their ability to support finer-grained urban research in the future. To bridge the gap, we constructed a novel multimodal and fine-grained dataset – BuildingSense – for building function classification, comprising over 34 000 buildings, 60 000 annotated images, 71 654 POIs, and 3400 building description texts in 26 distinct categories. Based on BuildingSense, we evaluated the performance of four state-of-the-art large models from the perspective of classification outcomes and reasoning processes. The results demonstrate that large models can effectively comprehend multimodal spatial data, challenging the conventional concept. Based on that, three directions for future research can be key: (1) build a categorized inference example database, (2) develop cost-effective classification models, and (3) quantify the confidence of model outputs. Our findings not only provide insights into the development of subsequent large model-based classification methods but also contribute to the advancement of multimodal fusion-based classification methods. The dataset and code of this paper can be accessed through https://doi.org/10.6084/m9.figshare.30645776.v2 (Su et al., 2025a).
- Article
(15292 KB) - Full-text XML
-
Supplement
(6212 KB) - BibTeX
- EndNote


Buildings, as primary spatial carriers of urban functions, constitute a fundamental component of the urban system, substantially influencing the cultural, economic, and environmental development of cities (Arribas-Bel and Fleischmann, 2022; Marcus and Koch, 2016; Zhou et al., 2023). Building function, as a vital attribute of buildings, refers to the purpose of building usage, presenting a high-level summary of the possible human activities within a building (The construction wiki contributors, 2021). It provides crucial information for research on urban planning, urban heat island effects, and human mobility (Shen et al., 2021; Choi and Yoon, 2023). Traditionally, the acquisition of building function data primarily relied on field surveys, which are resource-intensive, resulting in long update cycles (Griffiths and Boehm, 2019; Xu et al., 2022).
The development of remote sensing technology, information and communication technology (ICT), and the availability of geo-tagged images have resulted in multimodal data presenting building attributes (Yu and Fang, 2023). For example, building footprints provide high spatial resolution boundary of buildings, the widely covered street views and very-high-resolution (VHR) remote sensing imagery captures detailed surface textures of buildings, and point of interest (POI) data offers finer-grained semantic information about human activities within building spaces (Deng et al., 2022; Hoffmann et al., 2023; Li et al., 2025; Ren et al., 2024). These advancements have shifted the paradigm of building function data acquisition from survey-based to data-driven, significantly reducing the costs and accelerating the data update cycles (Zheng et al., 2024).
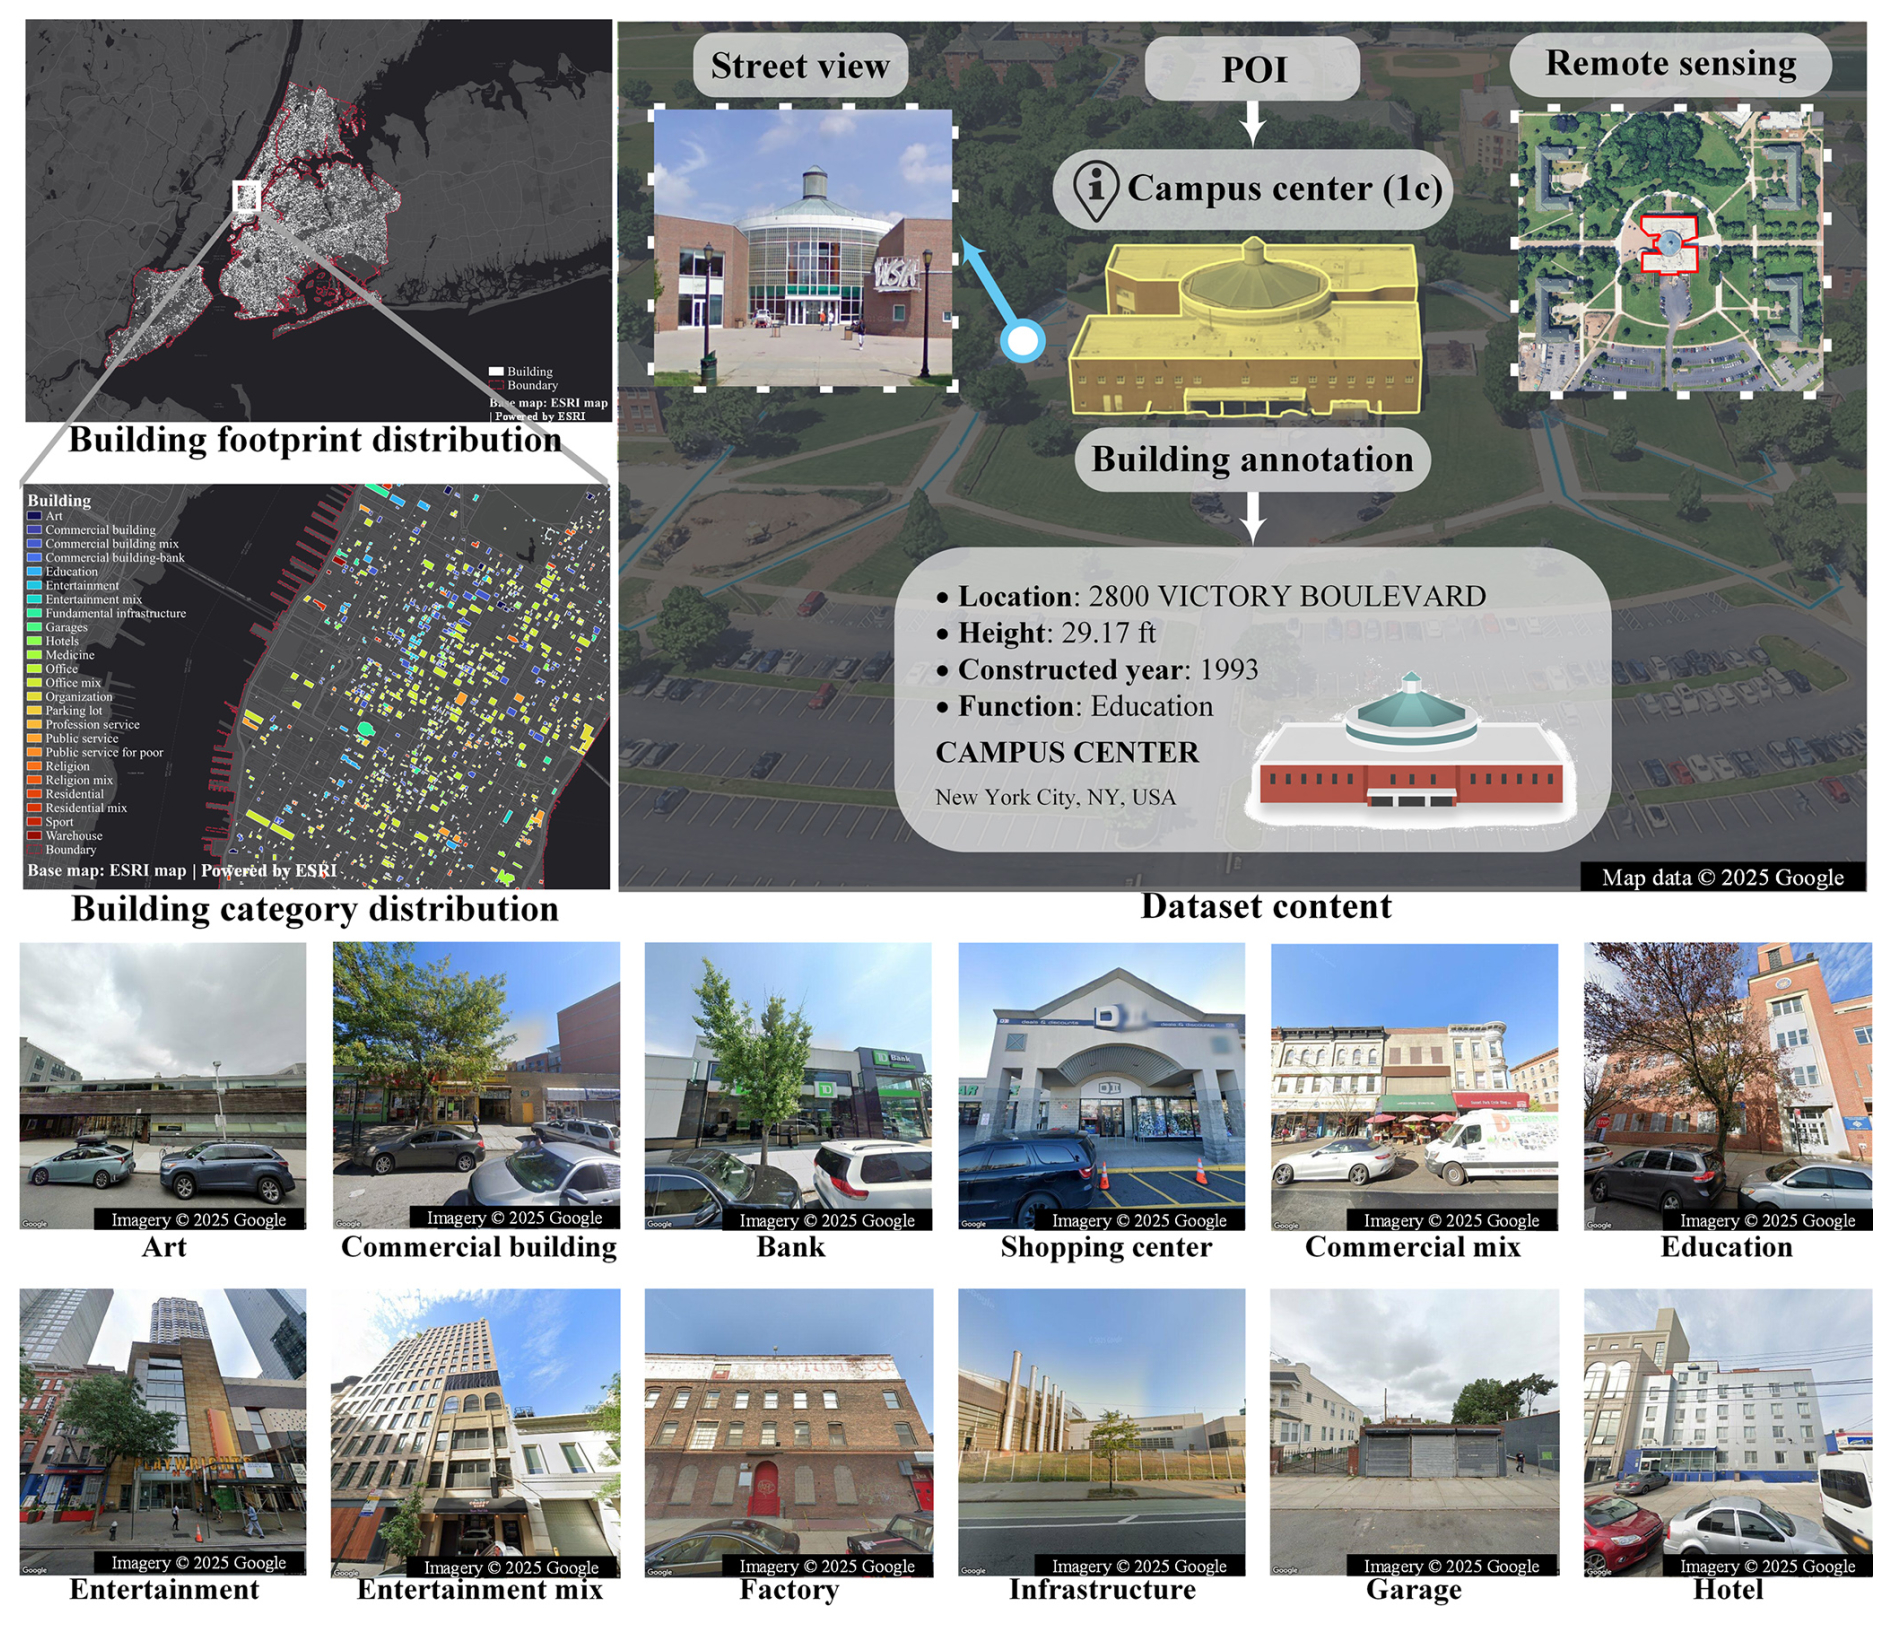
Figure 1The overview of BuildingSense. The other building function category examples are shown in Fig. S1 in the Supplement.
Existing data-driven methods for acquiring building function information mostly focus on traditional machine learning and deep learning methods (Li et al., 2025; Wang et al., 2024). These methods respectively employ feature engineering and convolutional operations to construct the embedding feature vectors, subsequently constructing complex mapping relationships between these vectors and building functions, and ultimately classifying the building functions. Although breakthroughs have been made in improving the classification accuracy, they inevitably introduce new challenges, such as interpretability of the models and the comprehensive fusion of multimodal features. These limitations result in poor performance of a trained model when it is transferred to another study area. Notably, large models, as large-scale Artificial Intelligence (AI) models pretrained on vast amounts of multimodal data, contain extensive knowledge of human society and possess robust capabilities in multimodal information extraction and understanding (Bommasani et al., 2022; Brown et al., 2020). Recently, with advancements in the technology of large models, they have evolved human-like reasoning abilities, enabling them to perform logical inferences based on extracted multimodal information and explicitly output their reasoning processes (Sun et al., 2023). These characteristics highlight the models' outstanding interpretability and efficient multimodal data processing capabilities, shedding light on overcoming these bottlenecks.
However, previous studies have revealed that large models exhibit limited performance when processing spatial datasets, such as POI-based urban function classification, street view image–based urban noise intensity classification, and remote sensing image scene classification (Mai et al., 2024; Kun et al., 2024). This limitation indeed raises an uncertainty regarding whether they can effectively extract building function-related multimodal information and logically infer the building function. Therefore, it is urgent to systematically evaluate the performance of large models on a multimodal building function classification dataset, providing a benchmark for future research on building function classification methods using large models.
To the best of our knowledge, there is a lack of multimodal datasets that are explicitly created for building function classification. Instead, most existing studies employ coarse-grained function classification schemes, directly using standard land-use classifications or reclassifying them (Zhang et al., 2023; Kong et al., 2024; Ren et al., 2024). Such approaches cover up the finer-grained human activity information inherently embedded in buildings, leading to information missing for exploring urban issues from a more detailed perspective. The availability of this dataset can be beneficial for benchmarking the capabilities of large models under increased classification complexity. Therefore, it is imperative to construct a multimodal building function dataset with finer-grained function classification.
To overcome the dataset limitation, we developed BuildingSense – a novel multimodal dataset for building functions classification, comprising over 60 000 annotated images, 71 654 POIs, and 3400 building description texts in 26 distinct categories (Detailed definition is shown in Table S1 in the Supplement). It was collected based on 34 000 building footprints in New York City (NYC) (Fig. 1). To the best of our knowledge, BuildingSense is the first multimodal dataset dedicated to building function classification, offering detailed function categories. We subsequently selected four commonly used large models, including Gemini-2.5-flash (Thinking), Claude-sonnet-4, QVQ-plus, and Deepseek-chat, as baselines to evaluate the performance of large models on building function classification. Drawing from this evaluation, we discuss potential future avenues for enhancing the ability of large models to classify building function. Our main contributions are summarized as follows:
-
We develop BuildingSense dataset, which is the first multimodal dataset focused on building function classification, featuring a substantial collection of well-aligned VHR images, street view images, and POIs, along with detailed categories for building functions.
-
We present a systematic evaluation of the large models' classification decision and inference process. Based on this, we found that the best-performing model (Gemini-2.5-flash (Thinking)) can logically infer the building function based on multimodal spatial data, which challenges the current perspective that large models cannot handle multimodal spatial data.
-
We discuss three potential ways for improving the performance of large models in building function classification tasks: (1) constructing an external information database related to building functions, (2) creating small parameter models that maintain exceptional inference capabilities, and (3) measuring the confidence levels of the model's outputs.
2.1 Building function classification
Cities are hierarchically nested systems, presenting a hierarchical structure. Such a complicated structure is conceived as a hierarchical soup, containing different “stuffs” such as buildings, roads, etc. These “stuffs” are obvious to see but need to be organized into something more coherent (Johnson, 2012). In human activity studies, land use, building function, and POIs can be analogized as a hierarchical semantic soup. The relationships can be imagined as an inverted pyramid, with land use at the top and POI at the bottom. At the same time, the building function occupies an intermediate position in the hierarchical structure, providing more granular semantic information than land use while simultaneously synthesizing and contextualizing the semantic information of POIs within the building. Thus, building function data is essential for hierarchically understanding urban systems.
However, our previous review has revealed that building function classification studies are relatively limited compared to the land use ones (Keywords for paper collection are shown in Fig. S2) (Su et al., 2025b). The contradictions between the relatively scarce research and the importance of the building function data indicate a current neglect of building functions within the academic community. It is noteworthy that the significant quantitative change observed in studies on building function classification (2020–2025) (Keywords for paper collection are shown in Fig. S3) shows that 11 papers have been published in less than two years (2023–2025), exceeding the total number of articles from the previous three years (2020–2023) (Table 1). This striking contrast highlights a growing interest among researchers in the topic of building function classification. Accordingly, we review these studies from three dimensions to conclude the main limitation: (1) classification method and data, (2) building function categories, and (3) data accessibility.
Li et al. (2025)He et al. (2025)He et al. (2024)Zheng et al. (2024)Ren et al. (2024)Memduhoglu et al. (2024)Kong et al. (2024)Du et al. (2024)Chen et al. (2024)Zhang et al. (2023)Hoffmann et al. (2023)Xu et al. (2022)Xiao et al. (2022)Deng et al. (2022)Zhang et al. (2021b)Zhang et al. (2021a)Table 1Research on building function classification between 2020 and 2025. Method refers to classification method; POI refers to point of interest; RSI refers to remote sensing image; SVI refers to street view image; HMD refers to human mobility data; RN refers to road network; BT refers to building topology; CN refers to category number of building function; DA refers to data accessibility.
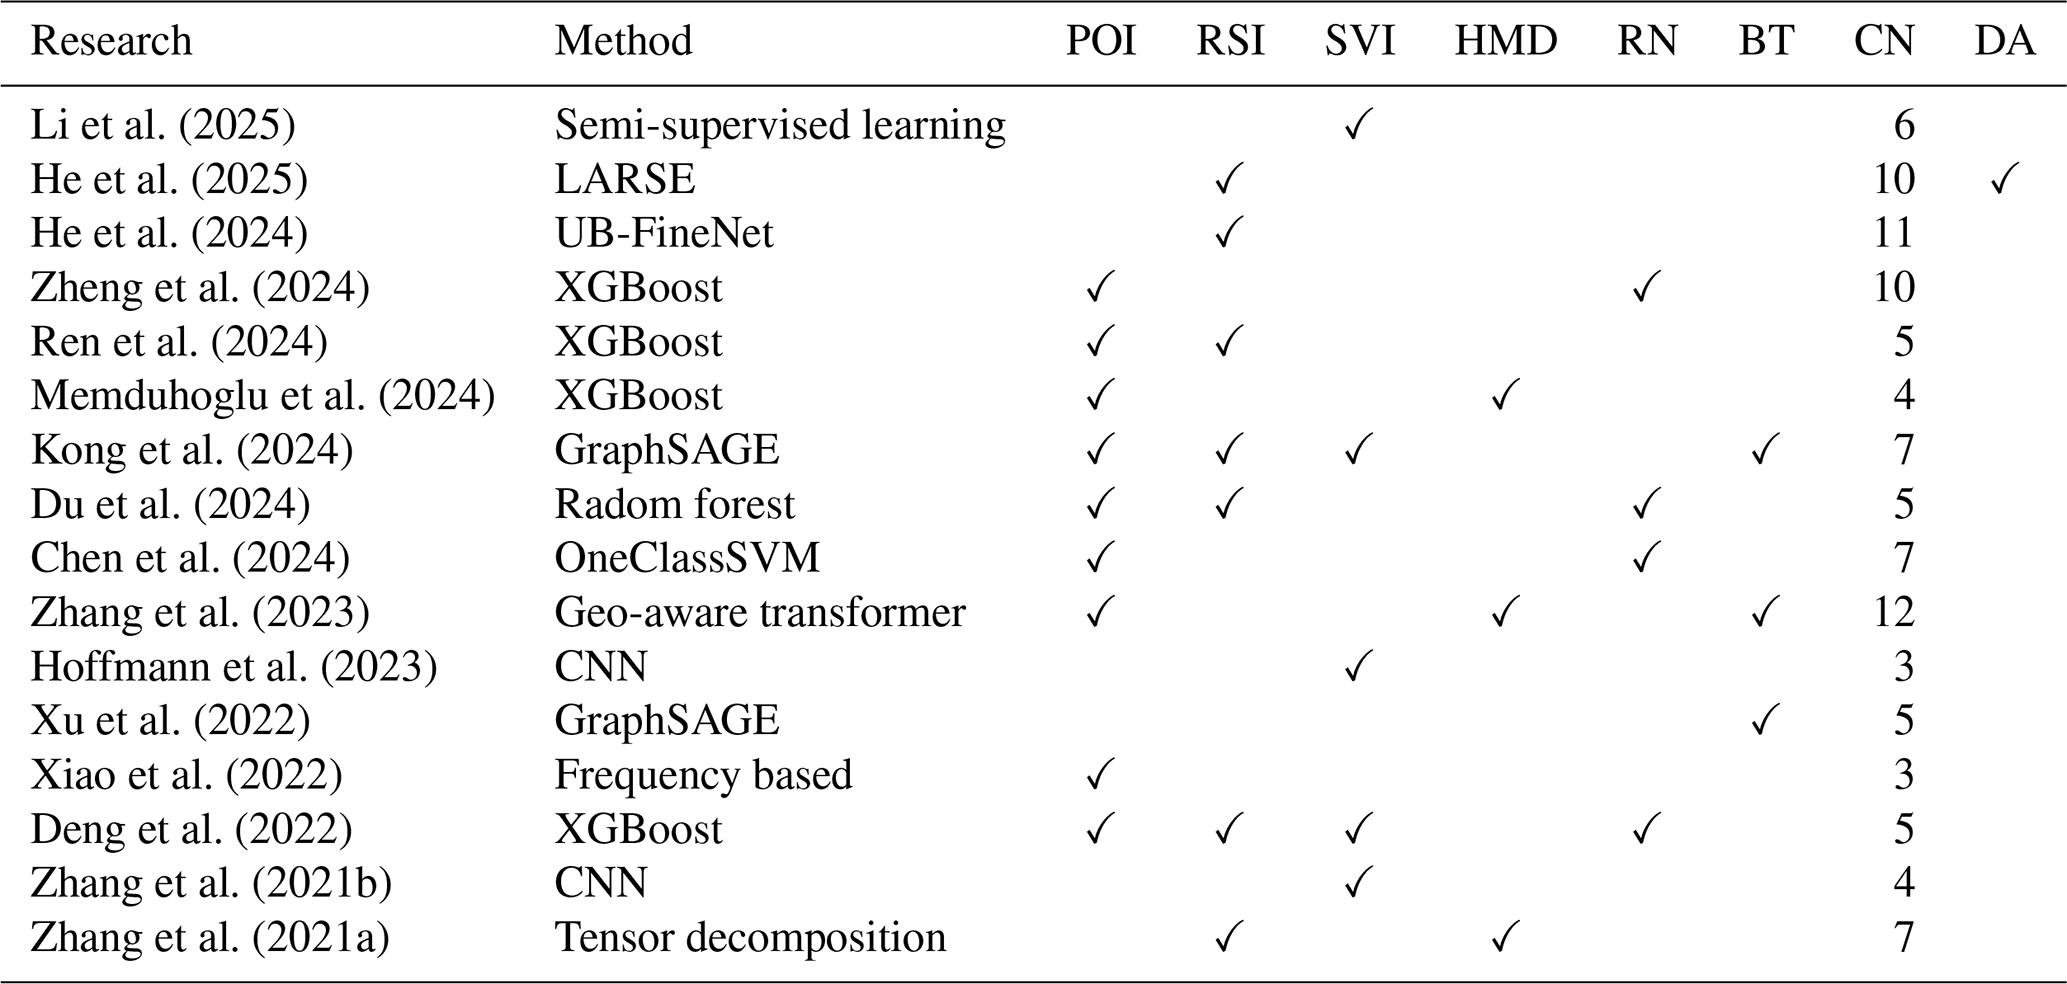
First, from the perspective of classification method and data, we reveal that the majority of studies utilize multimodal data and their methods are dominated by deep learning and traditional machine learning algorithms (Table 1). While the multimodal data are adopted to classify building functions, demonstrating the advantage of data fusion, they heavily rely on manual feature engineering, which is unable to guarantee that task-relevant features are fully extracted from each data instance during the feature construction process, resulting in partial information loss and limited classification performance (Zheng et al., 2024; Ren et al., 2024; Memduhoglu et al., 2024; Kong et al., 2024; Du et al., 2024; Chen et al., 2024; Zhang et al., 2023; Xu et al., 2022; Deng et al., 2022). Recent studies have shown that deep learning methods, which extract deeper data features through convolutional operations, ensure more comprehensive utilization of information and significantly improve the classification accuracy (Li et al., 2025; He et al., 2024, 2025; Hoffmann et al., 2023; Zhang et al., 2021b). It should be noticed that their black-box characteristic substantially limits the interpretability of the models. Additionally, the predominant usage of single-modal data in these studies indicates that the application of multimodal approaches in building function classification remains an in-depth exploration, under the condition that the multimodal fusion methods have demonstrated superior performance.
Current building function classification algorithms suffer from two major limitations: (1) the lack of interpretability in models, and (2) the absence of deep feature fusion from multimodal data. These limitations lead to poor model transferability and excessive reliance on training data. Notably, current technological advances present promising solutions to address these limitations. Reasoning-based large models (e.g., GPT-4o, Gemini) offer a competitive approach in deep learning interpretability and multimodal fusion. However, their multimodal synthesis analysis and reasoning ability remain substantially evaluated in the context of building function classification (Mai et al., 2024; Kun et al., 2024). Such conditions highlight an imperative demand for multimodal building function classification datasets.
Second, from the perspective of building function categories, the current building function classification framework employed in the Table 1's research remains coarse-grained, indicating these studies merely mirror the land use category or straightforwardly reclassify based on the land use category (Zhang et al., 2023). Although this division can facilitate bottom-top land use classification, it fundamentally overlooks the intrinsic connection between building function and fine-grained human activity. Referring to the POI type taxonomy, it employs multi-level taxonomies with detailed terminal categories that precisely describe the specific human activity. In analogy, land use, situated at the top of the classification hierarchy, offers a coarse-grained generalization of human activities at the parcel level. POIs, located at the bottom of the hierarchy, provide fine-grained descriptions of human activities. Building function, serving as a critical intermediate layer, should ideally provide deeper semantic information than land use and generalize the semantic information of diverse POIs within the building.
Zhang et al. (2023)Kong et al. (2024)Ren et al. (2024)Hoffmann et al. (2023)Table 2Example of typical building function categories. Building function categories 12, 7, 5, and 3 were selected from Table 1 to illustrate the current mainstream classification of building functions.
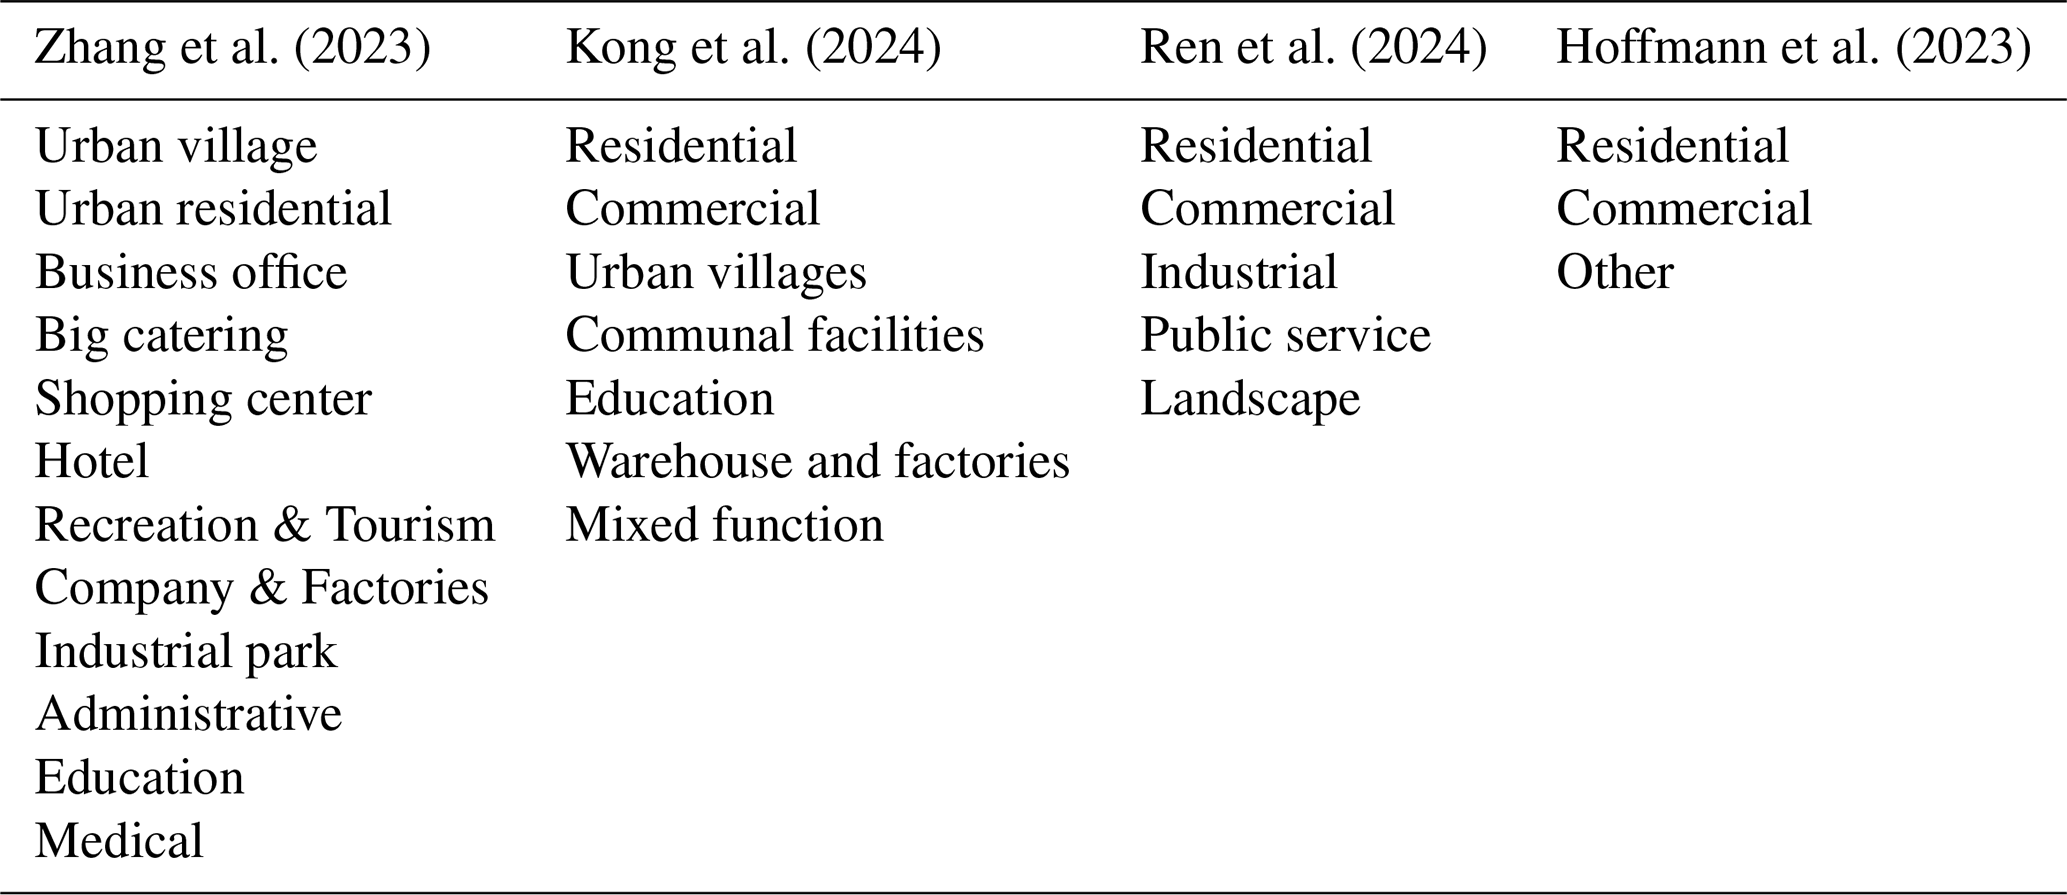
However, the current mainstream building function classification (Table 2) fails to fulfill its intermediary role in bridging land use and POIs. This limitation represents a fundamental conceptual gap in the existing building function classification framework, where the unique position of buildings as spatial containers for diverse human activities remains underexploited. This drawback highlights the need for more refined building function categories.
Third, from the perspective of building function data accessibility, only one paper shares its building function raw data (He et al., 2025). This situation leads to a biased comparison of building function classification methodology, restricting the development of the method. This issue is compounded by the conflict between the shared dataset and the current demand for multimodal methodology development. Thus, an open-source and multimodal building function classification dataset is in pressing need.
In conclusion, building function classification is an emerging research direction. Although the studies of building function classification are becoming more and more prevalent, there are three limitations: (1) the advantage of multimodal fusion and the powerful reasoning ability of multimodal large models remains underexplored; (2) the current division of building function categories is coarse; (3) an open-source and high-quality building function dataset is in urgent need. Thus, instead of developing state-of-the-art methods for building function classification, conducting foundational work – building a multimodal and fine-grained building function classification dataset – is practically indispensable for future building function classification.
2.2 Existing building-related dataset
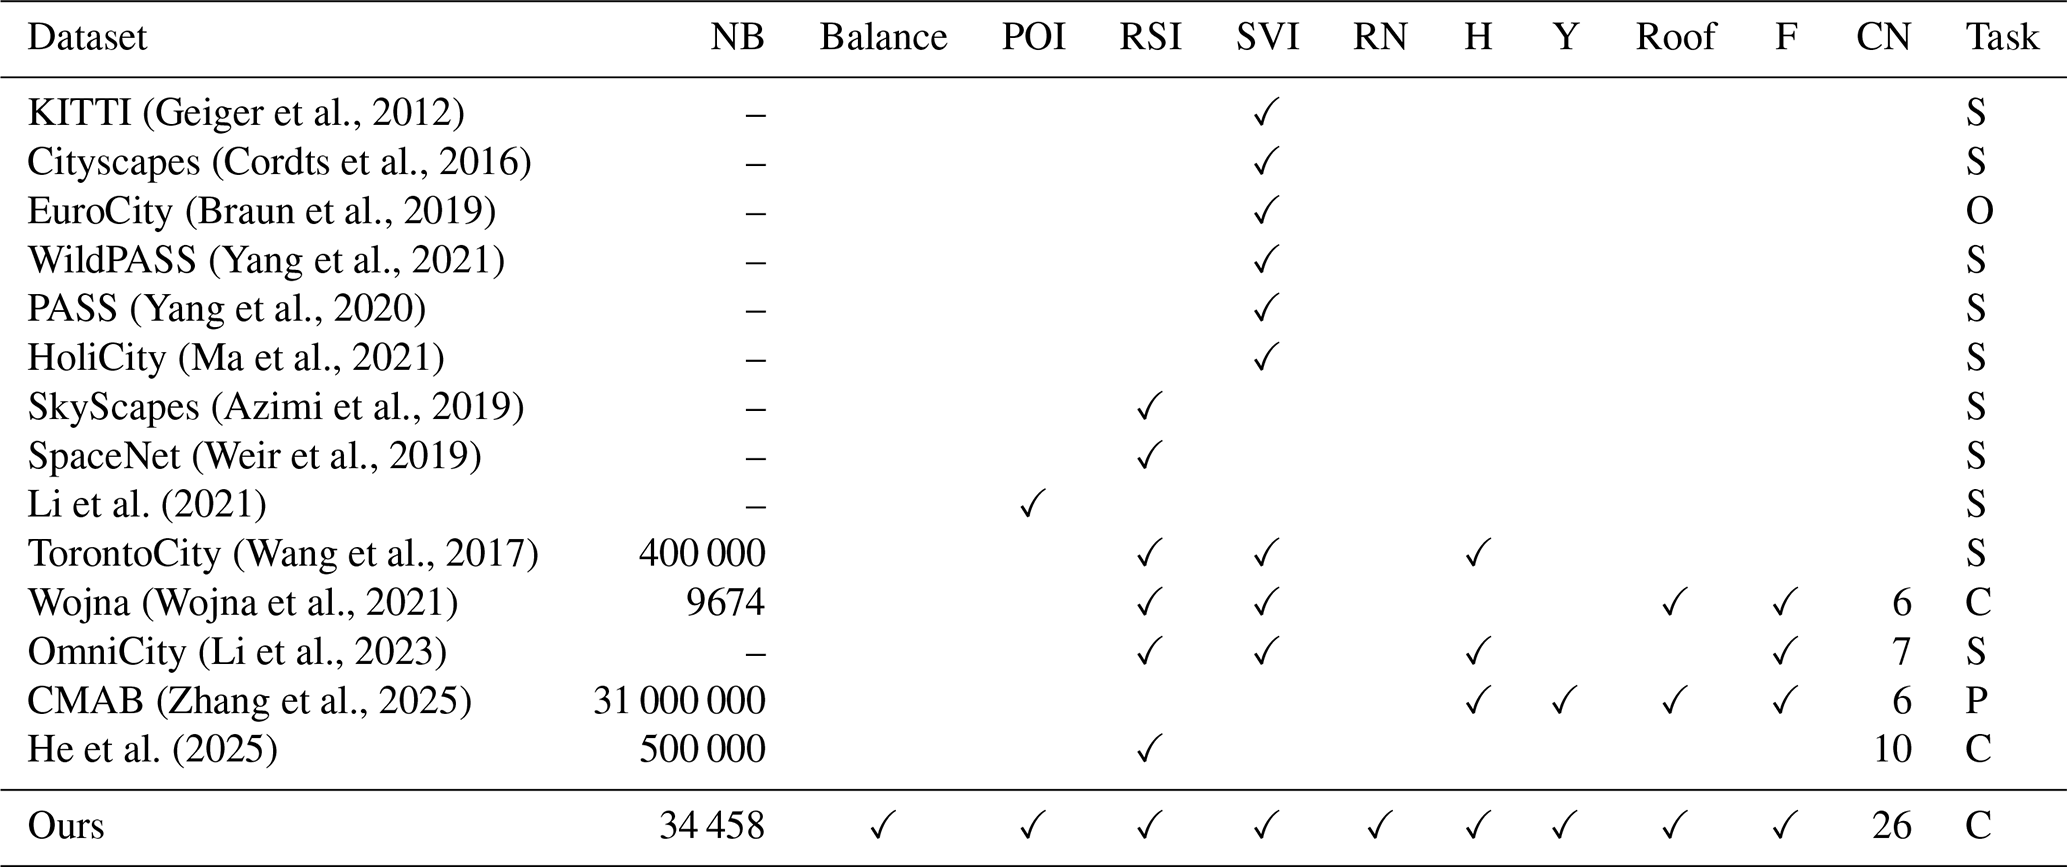
To further illustrate the necessity of building a multimodal and fine-grained building function classification dataset, we conducted a comprehensive review of existing building-related datasets (Table 3). We divided the task into three categories, including image segmentation (represented by S), object detection (represented by O), and building classification (represented by C). Additionally, CMAB (A Multi-Attribute Building Dataset of China) is only a product instead of a training dataset (Zhang et al., 2025). Our analysis reveals two critical limitations in current datasets: (1) the majority of datasets (Cityscapes, SkyScapes, etc) exclusively contain single-view imagery (either street view image or remote sensing image), which are primarily designed for segmentation or object detection; (2) while some multiview (the dataset with street view and remote sensing image in Table 3) datasets (TorontoCity, Wojna, etc) have incorporated basic building information annotations, they remain limited in modal diversity and semantic depth. Therefore, it can be concluded that existing datasets universally lack multimodal information and employ coarse building function classifications. An ideal building function classification dataset should incorporate multimodal data related to buildings along with fine-grained functional annotations, thereby supporting the development of both unimodal and multimodal building function classification methods. Finally, the classified fine-grained building function data can be utilized for advanced urban research that requires granular spatial-semantic analysis.
Thus, we constructed BuildingSense to provide fundamental advances in building function classification. The dataset comprises over 34 000 accurately aligned building footprints with multimodal, multiview, and fine-grained functions. Although the dataset is moderate in size, we applied stratified sampling to ensure a highly representative and less biased sample, enhancing its analytical value over larger but potentially skewed alternatives (Table 3). To our knowledge, this is the first multimodal building-centric dataset to offer fine-grained functional annotations.
Geiger et al., 2012Cordts et al., 2016Braun et al., 2019Yang et al., 2021Yang et al., 2020Ma et al., 2021Azimi et al., 2019Weir et al., 2019Li et al. (2021)Wang et al., 2017Wojna et al., 2021Li et al., 2023Zhang et al., 2025He et al. (2025)Table 3Building-related dataset. NB refers to the number of buildings; Balance refers to whether the dataset considers each category sample of the dataset is balanced or not; POI refers to point of interest; RSI refers to remote sensing image; SVI refers to street view image; RN refers to road network; H refers to building height; Y refers to building year; roof refers to building roof; F refers to building function; CN refers to the number of function category.
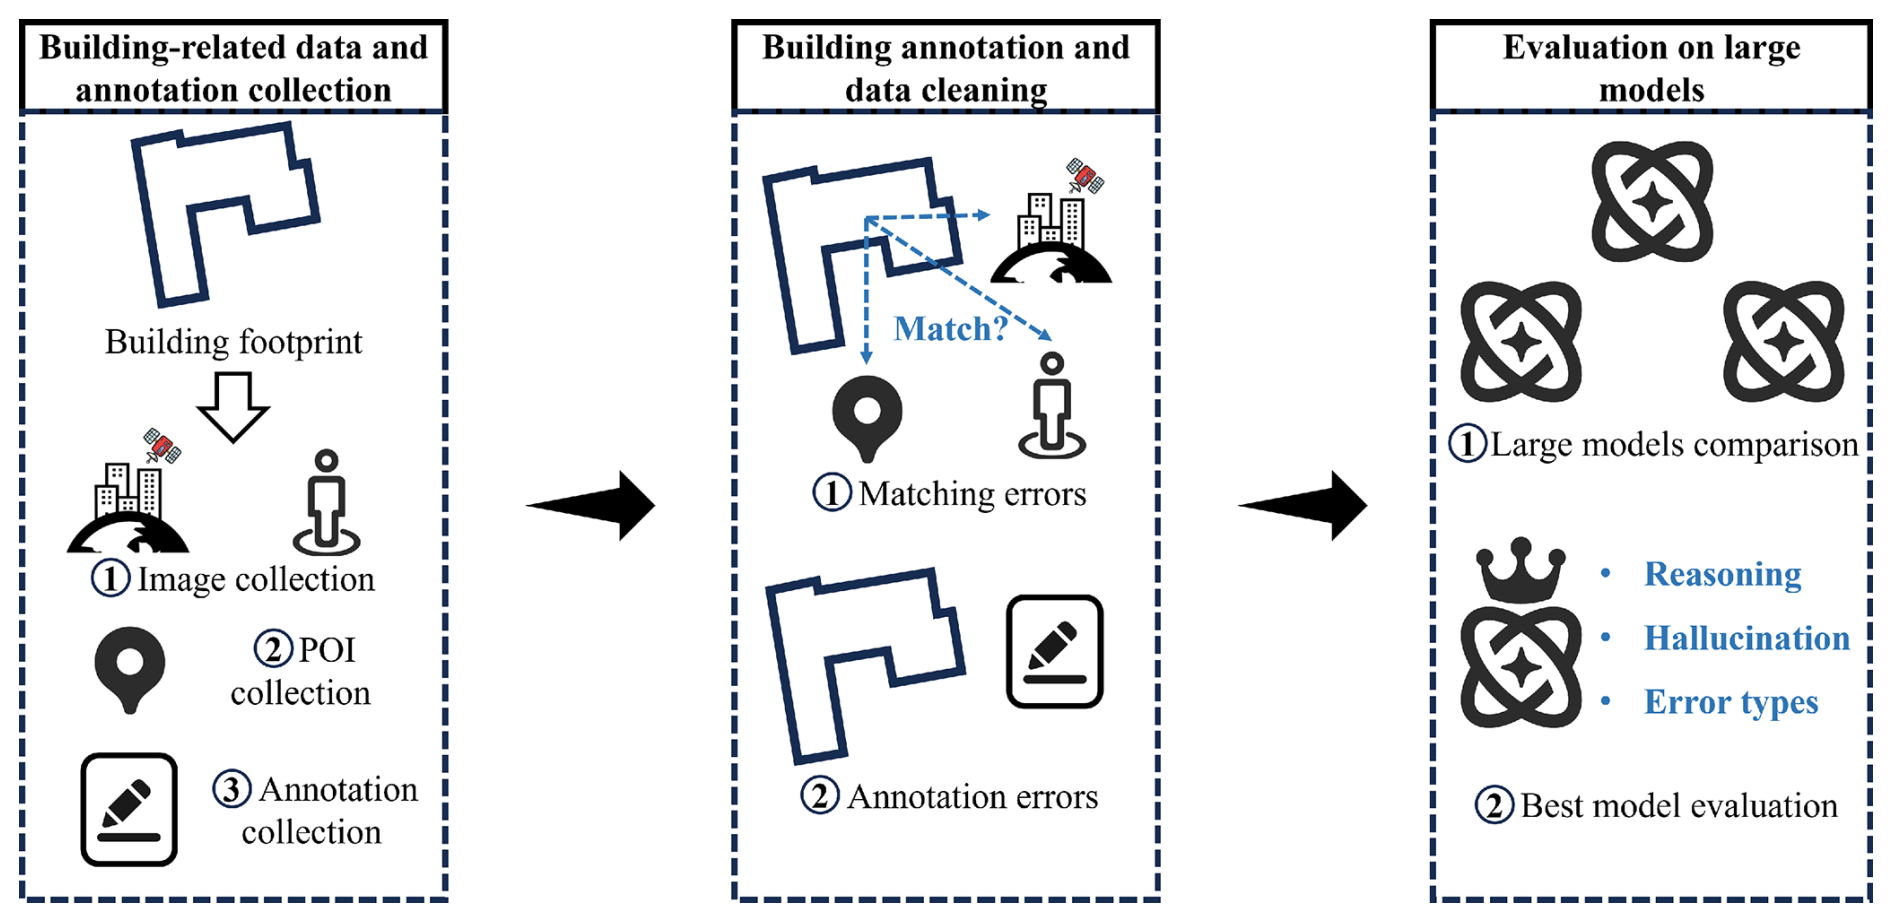
As illustrated in the Fig. 2, the methodological workflow of our dataset consists of three components: (1) building-related data and annotation collection, (2) building annotation and data cleaning, and (3) evaluation on large models. The first component describes how building footprints were sampled and how the relevant data and annotations were collected based on these footprints (Sect. 3.1). The second component details the cleaning process for the collected data and annotations, ultimately yielding a high-quality multimodal dataset (Sect. 3.2). The third component outlines the setup for baseline comparisons to evaluate the performance of different large models and the evaluation method for the optimal model (Sect. 3.3).
3.1 Building-related annotation and multimodal data collection
As shown in Fig. 3, we collect remote sensing images, street view images, and POIs based on each building footprint in Fig. 3. The data sources are summarized in Table 4. They are either from the government or a licensed commercial company, except for the road network. The sources of these data ensure the reliability of BuildingSense. The following section details the annotation and multimodal data collection (Sect. 3.1.1, 3.1.2, and 3.1.3, 3.1.4).
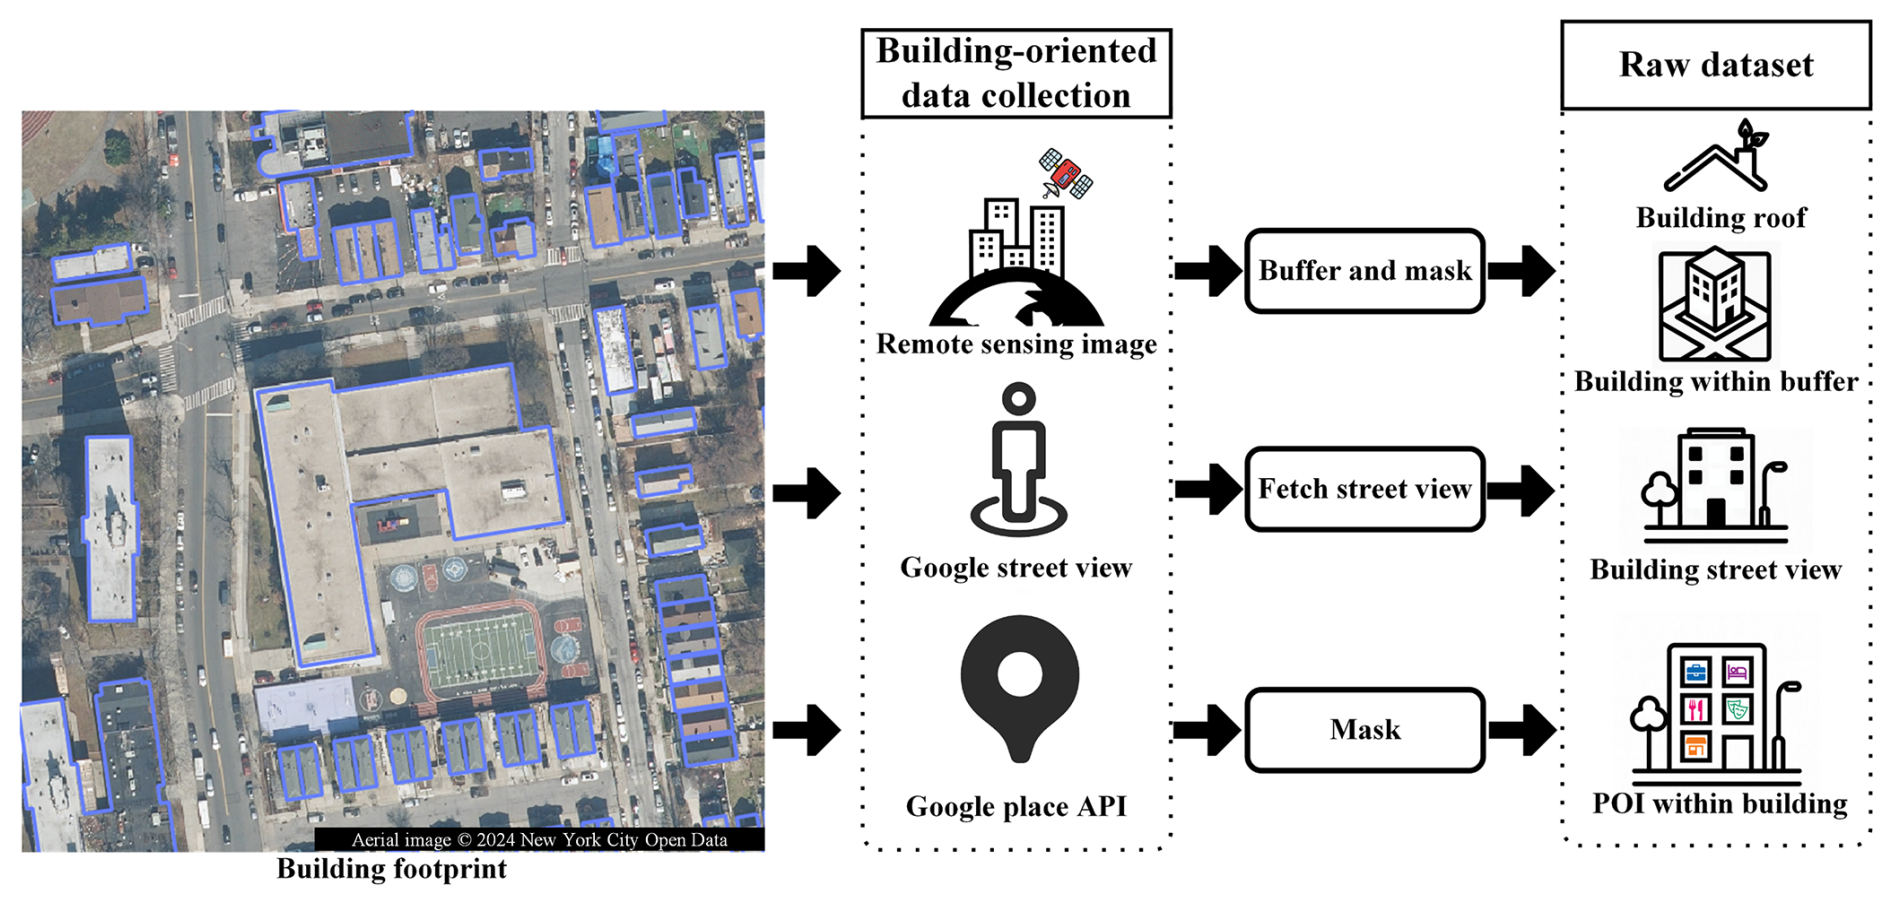
Figure 3Building-related remote sensing image, street view image, and POI data collection. An example of the raw dataset is shown in Fig. S4.
3.1.1 Building annotation and footprint
The building footprints collected in BuildingSense are sampled from the official building footprint data published by NYC Open Data. To avoid the geographical bias and imbalance in the categories of samples, the sampling process adhered strictly to two principles: (1) the sampled buildings should be spatially evenly distributed, and (2) the distribution of building functional categories after sampling should be uniform. Based on principle (1), we utilize NYC taxi zones (spatial distribution shown in Fig. S5) as the spatial sampling units and assign each building to a corresponding zone number via spatial computations. Regarding principle (2), we reclassify NYC's building functional categories (details on category mappings and definitions are provided in Table S1 in the Supplement). Considering their inherent long-tail distribution characteristics (as illustrated in Fig. S6), we set a target of 1000 samples per category. For categories containing fewer than 1000 buildings, all available buildings are sampled to maintain balance in the distribution of building functions within each category. Additionally, to explicitly represent the intrinsic long-tail nature of building function distributions, we introduce an extra 16 000 residential buildings, which form the dataset that adheres to realistic distributional properties.
The building footprint dataset from NYC contains officially annotated information, including building height, constructed year, function, and location. The functional annotations of BuildingSense originate from the official NYC building classifications. In BuildingSense, we specifically extract building height, constructed year, location, and function as annotation attributes for the sampled building footprints.
3.1.2 Street view image
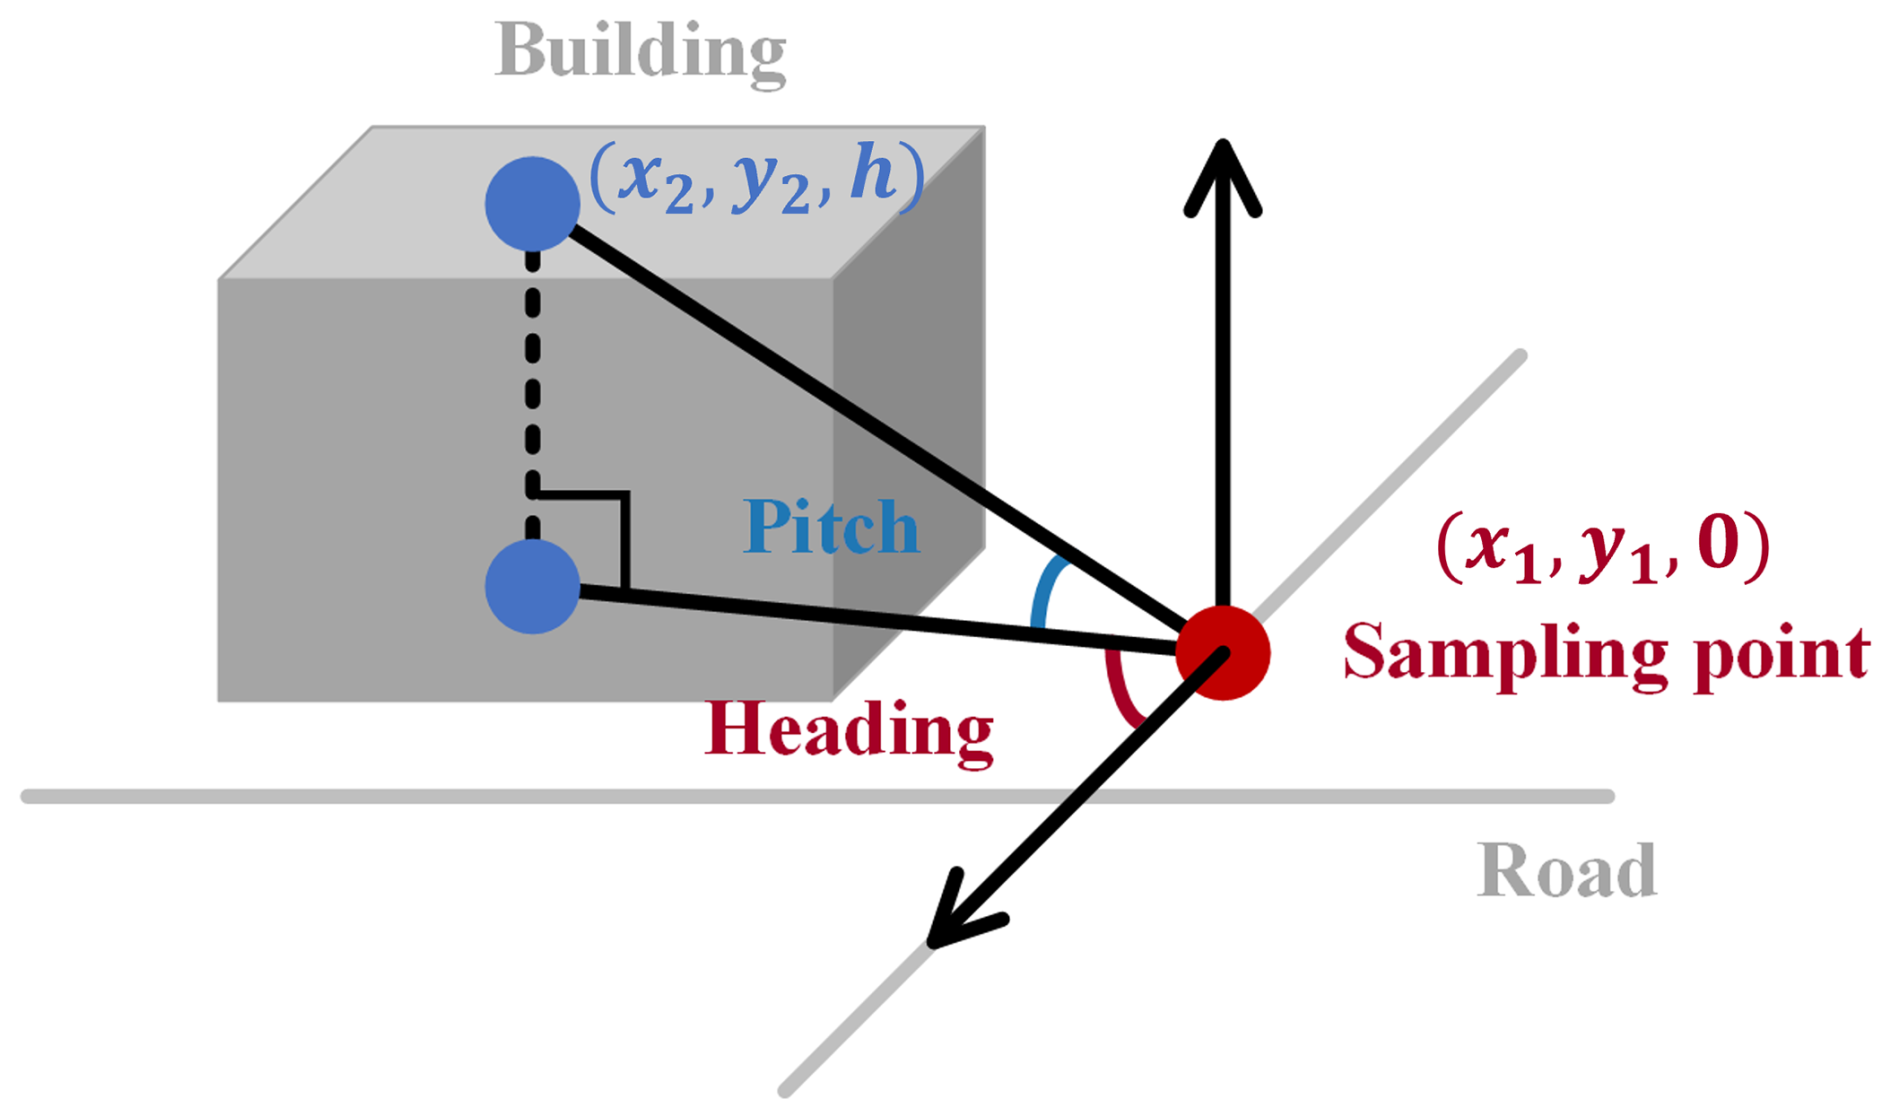
The street view images of buildings are collected using the method proposed by Kong et al. (2024), which requires road network data. Therefore, OSM road network data for NYC was collected, and sidewalks and bicycle lanes were removed through attribute-based filtering to reduce the proportion of indoor images and distorted viewpoints within the collected street view images. The schematic diagram of this method is illustrated in Fig. 4. First, the nearest projection point of each building's centroid onto the road network is computed as the sampling point. Next, based on the building height and the corresponding projection point, parameters required for crawling street view images, namely Pitch (Eq. 1) and Heading (Eq. 2), are calculated. Finally, street view images corresponding to these parameters are retrieved through Google Place API requests.
where (x1,y1) refers to the longitude and latitude position of the street view sampling point, (x2,y2) refers to the longitude and latitude position of the building center point, and h refers to the height of the building.
3.1.3 Remote sensing image
The remote sensing imagery is derived from orthophotos published by the NYC government in 2018. Despite the temporal discrepancy between the orthophotos and building footprints, we deem them compatible due to the relatively limited changes in NYC's building infrastructure during the intervening period, which is subsequently confirmed during the data cleaning process (Sect. 3.2). Based on the orthophotos and building footprints, we extract top-down images of building rooftops and their surrounding 60.96 m buffer zones using the masking technique. These images represent rooftop characteristics and environmental contexts, respectively. Moreover, rooftop images could potentially be re-annotated to facilitate tasks such as rooftop material classification.
3.1.4 POI
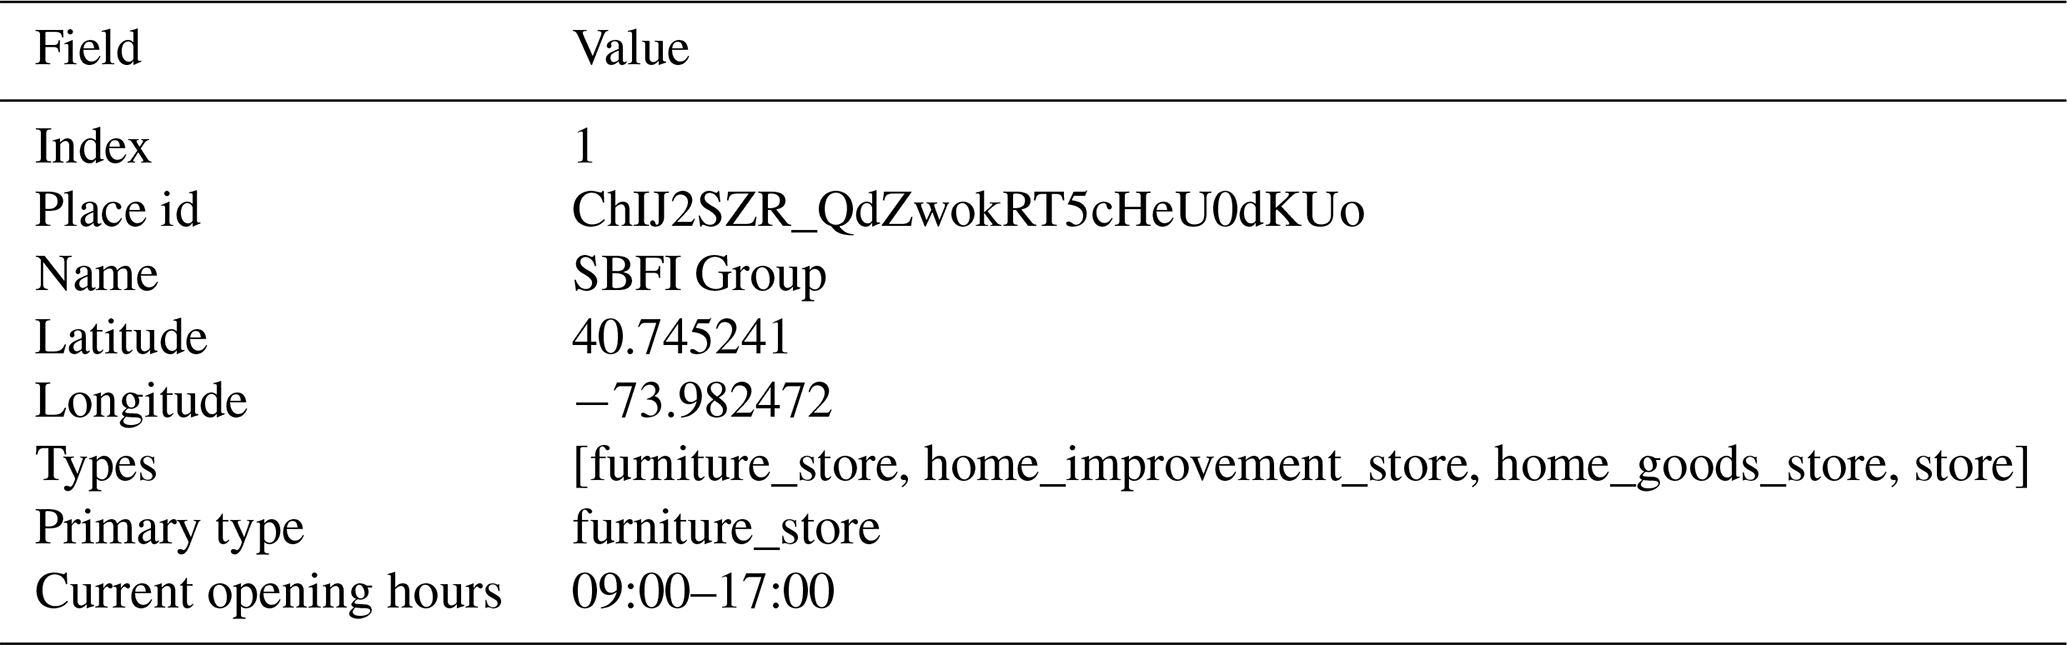
The POI data of buildings in BuildingSense are collected from Google Maps. Given the constraints imposed by API return limits, we employed a comprehensive deep-search approach to extract POI information within the boundary of the building footprint. The detailed procedure for this algorithm is shown in the Algorithm S1 in the Supplement. The collected POI data comprises several attributes: place id, name, latitude, longitude, types, primary type, and current opening hours (Table 5). Specifically, “types” and “primary type” represent the diverse and primary functions of the POIs, respectively, and “current opening hours” facilitates the future studies of dynamic building functions classification.
3.2 Building annotation and matching errors cleaning
To further verify the data quality, we manually audit the quality of each collected data instance and the results of data matching. The process is presented in Fig. 5. We visualize the integrated data, including building footprints, a top-down buffer image of the building footprint, street view image, POI, and the collection process of the street view image. Based on the visualization, data obtained from the aforementioned processes were manually reviewed and cleaned to identify and rectify two types of errors: (1) matching errors and (2) labeling errors. Matching errors encompassed mismatches between street view images and building footprints, between buildings and remote sensing images, and between buildings and POI data. Labeling errors specifically refer to the origin labeling errors. To ensure annotation quality, annotators are instructed only to modify clearly erroneous category labels while preserving original official annotations in cases of uncertainty. Different strategies are employed to address these errors: labeling errors are resolved through manual re-annotation; street view mismatches are rectified by manually selecting alternative sampling points; and remote sensing image mismatches are removed from the dataset.
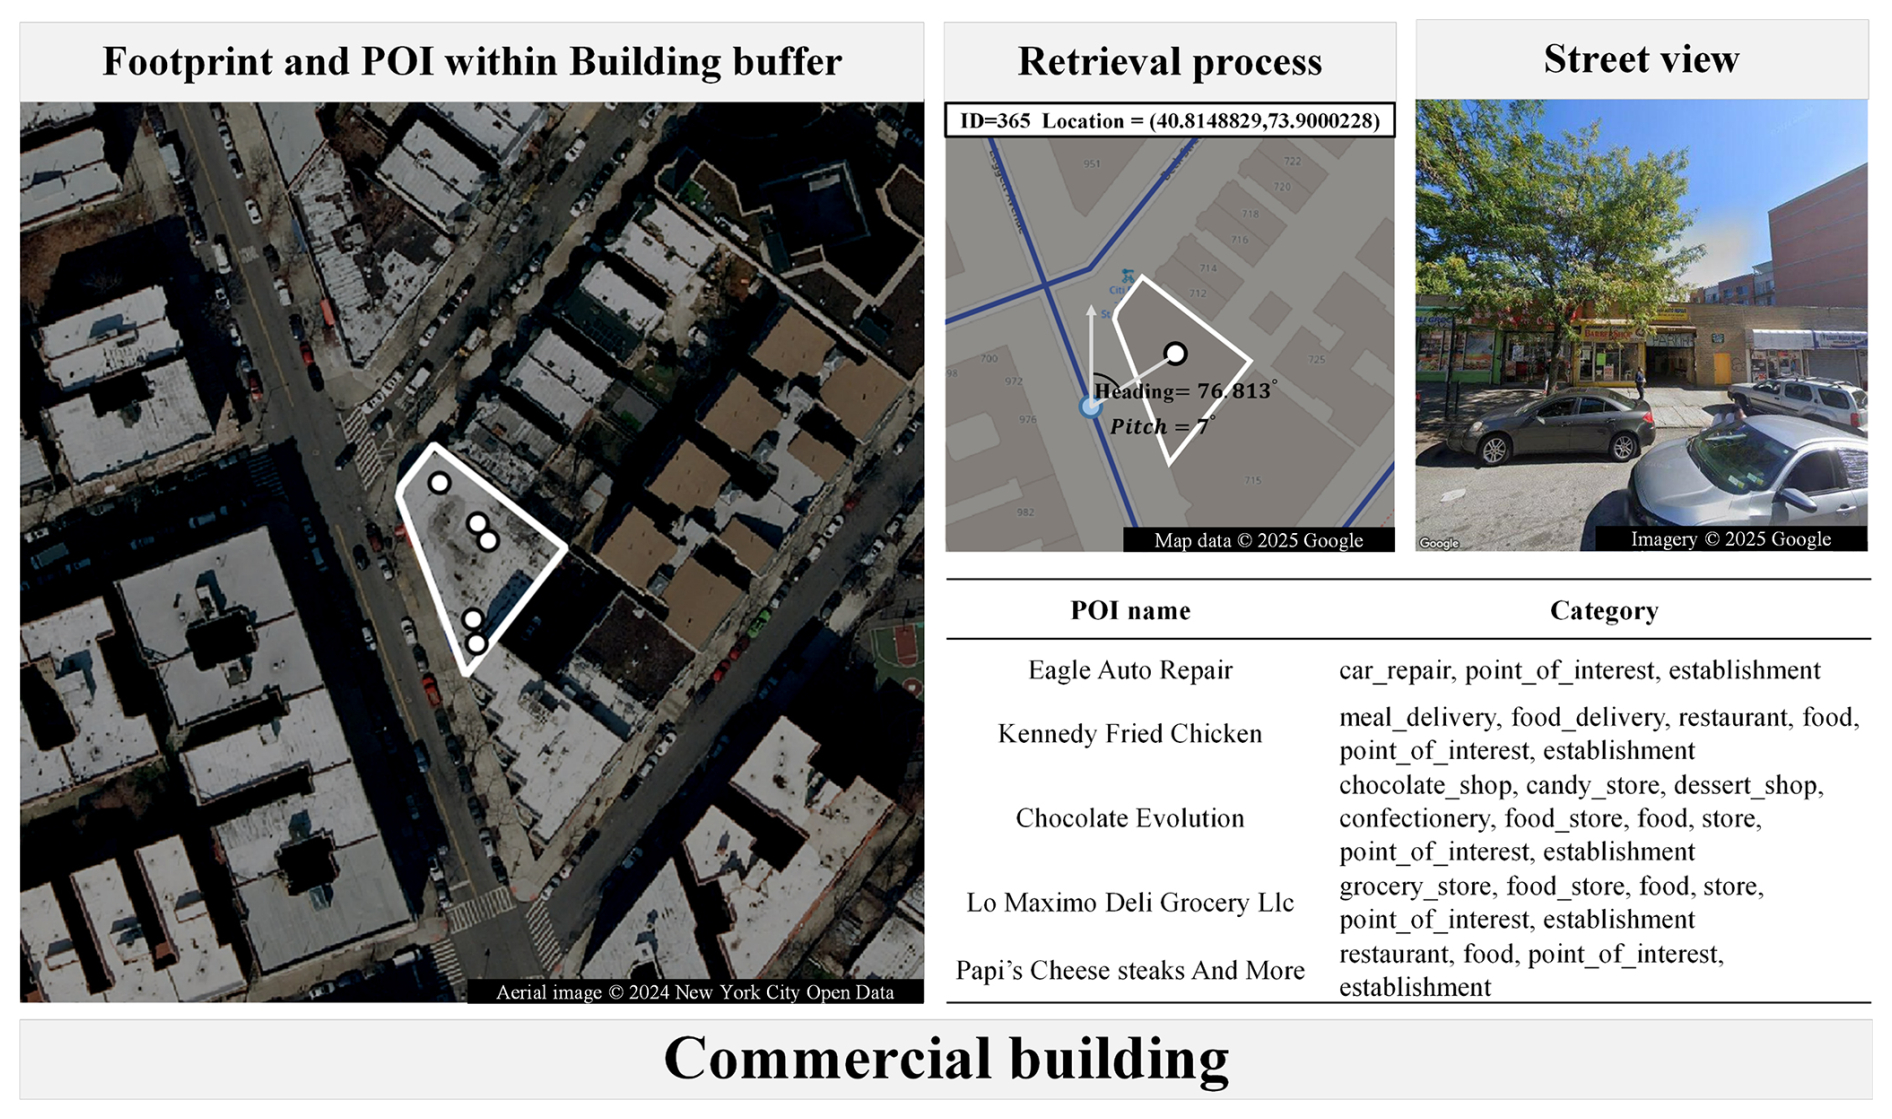
Figure 5Illustration of data cleaning. Examples of errors are shown in Fig. S7.
3.3 Experimental setting for evaluating large model on BuildingSense
The characteristics of large models are highly aligned with the requirements for building function classification tasks, which can be concluded in three aspects: (1) powerful multimodal data processing capabilities enable the extraction of deep-level information from multimodal data, (2) extensive knowledge of human society allows for accurately interpret the extracted multimodal information, and (3) reasoning abilities facilitate logical inference based on both societal knowledge and multimodal data to classify building functions. Additionally, compared to other multimodal deep learning methods, the output of large models' reasoning process offers three distinct advantages: (1) the explicit output of the reasoning process enhances methodological transparency, (2) the inference chains can be manually verified and rectified to generate improved training datasets, and (3) corrected outputs enable further model refinement. Therefore, we systematically evaluate the performance of large models on BuildingSense to verify whether large models can understand multimodal spatial data.
3.3.1 Baselines
We benchmark four state-of-the-art large models, Gemini-2.5-flash (Thinking), Claude-sonnet-4, QVQ-plus, and Deepseek-chat on the balanced BuildingSense (18 458 buildings), to comprehensively evaluate the large model. Based on the collected data, we designed seven data combination configurations (detailed in Table S2): single-modality (text/imagery), dual-modality (e.g., text + street view imagery), multi-view (street view imagery + remote sensing imagery), and dual-modality and multi-view combinations (text + street view imagery + remote sensing imagery). For each data combination, we design a typical prompt to guide the analysis process of large models (detailed in Table S2). Due to computational constraints, single-modality tests were limited to Deepseek-chat and QVQ-plus, with a primary focus on the performance of multimodal/multiview. Notably, we precluded multiview evaluations on QVQ-plus from our benchmark evaluation due to the image input restriction of QVQ-plus.
The exclusion of traditional deep learning and machine learning methods from the baselines is motivated by two points: (1) two specific bottlenecks identified in the existing literature on building function classification (Sect. 2.1) and (2) the fundamental differences in their evaluation paradigms and spatial scalability compared to large models.
First, two specific bottlenecks are as follows: (1) insufficient feature extraction and fusion (Zheng et al., 2024; Ren et al., 2024; Memduhoglu et al., 2024; Du et al., 2024; Chen et al., 2024; Deng et al., 2022; Li et al., 2025; He et al., 2024, 2025; Hoffmann et al., 2023; Zhang et al., 2021b) and (2) poor interpretability of model outputs (Li et al., 2025; He et al., 2024, 2025; Hoffmann et al., 2023; Zhang et al., 2021b). Second, the differences in their evaluation paradigms and spatial scalability are as follows: (1) from the perspective of evaluation paradigms, we assess the out-of-the-box zero/few-shot reasoning capabilities of large models on the full dataset. In contrast, evaluating traditional machine learning/deep learning methods requires partitioning the majority of the data into a training set. Such an approach allows the models to learn data characteristics in advance, leading to better-fitting results. Therefore, it is unfair to directly compare large models with deep learning models trained for building function classification. (2) From the perspective of spatial scalability, traditional deep learning models inherently overfit on the training dataset, leading to performance decreasing when transferred to another region or when the data format changes. Such a limitation renders them unscalable for large-scale urban applications.
Given these limitations, large models have emerged as a promising approach. Its extensive world knowledge and human-like reasoning abilities (spatial scalability) enable it to jointly interpret visual and textual cues (sufficient feature extraction and fusion), thereby explicitly articulating its inference processes (interpretability) (Brown et al., 2020; Sun et al., 2023). These characteristics directly target the limitations mentioned above, which remain underexplored. Therefore, we select four state-of-the-art large models to test the hypothesis that large models can overcome traditional limitations in multimodal building-function classification.
3.3.2 Evaluation metric
We assessed model performance based on the category-balanced dataset, using four established classification metrics:
where TP = true positives, TN = true negatives, FP = false positives, and FN = false negatives. Equation (3) represents Accuracy (Acc). Equation (4) represents Precision (Pre). Equation (5) represents the Recall rate. Equation (6) represents the F1-score (F1).
3.3.3 Manual evaluation method for the best model
As illustrated in Fig. 6, our structured prompt template requires models to generate three components, including the analysis of the picture modal, the analysis of the text modal, and the final results. The analysis of picture modal includes the interpretation of the rooftop characteristics and the building's surrounding context, as well as the building's ground-level facade and the surrounding environment analysis. Analysis of text modal contains location geocoding, building height and year understanding, semantic analysis of POIs' names, and integrated visual-textual reasoning. The final results include the reason for the decision, building function, and additional notes. The additional notes are designed to evaluate the model's dialectical reasoning capacity. Based on the model output, we defined six criteria to assess model performance and detect hallucinations in positive samples: (1) Are remote sensing descriptions accurate? (2) Are street view descriptions accurate? (3) Are text descriptions accurate? (4) Is the combination analysis logic? (5) Are there conflicts between results and analysis? (6) Is additional information helpful? (detailed definition is listed in the Sect. S3 in the Supplement). To evaluate the best model (Gemini-flash-2.5 (Thinking)), five professionals with expertise in geographic information systems are employed to assess the positive sets based on six criteria, and one large model (Deepseek-chat) is employed to assess criteria 4 to ensure the discrimination is consistent (detailed prompt designs are provided in Sect. S2). Samples are created by selecting 20 % from each category of both negative and positive classification outcomes.
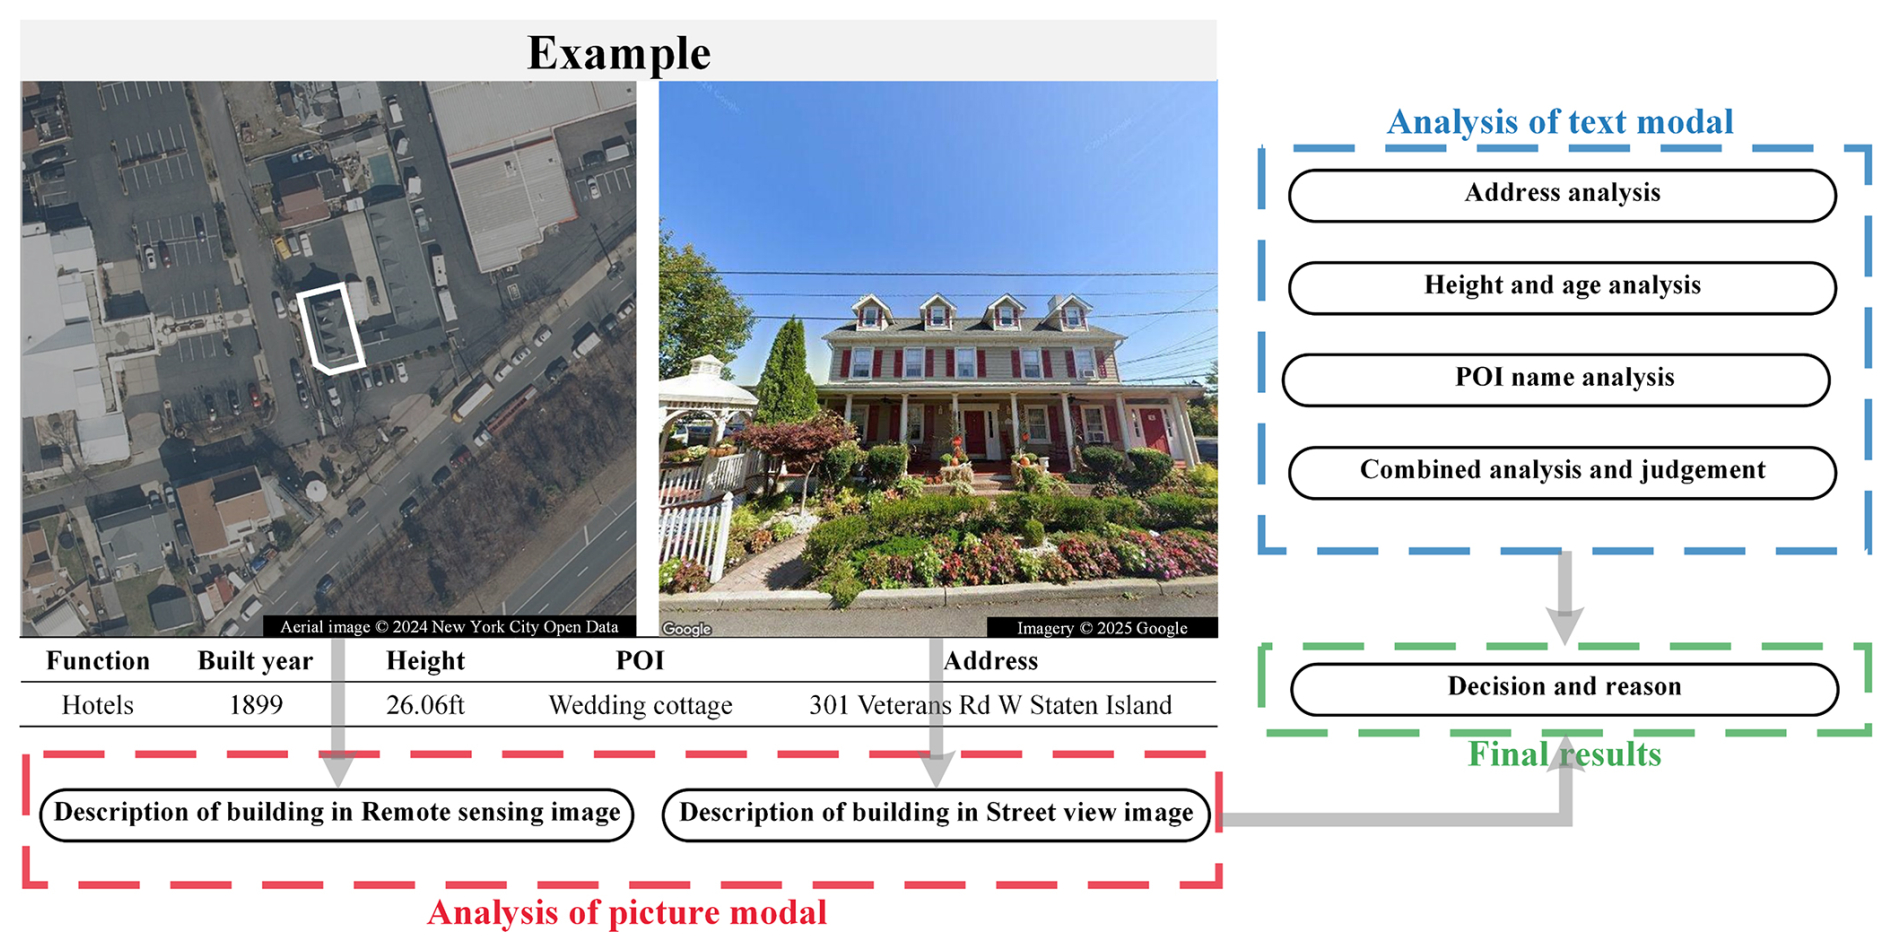
Figure 6Reasoning output of large model under the remote sensing image, street view image, and description text input. Detailed reasoning output is shown in Fig. S9.
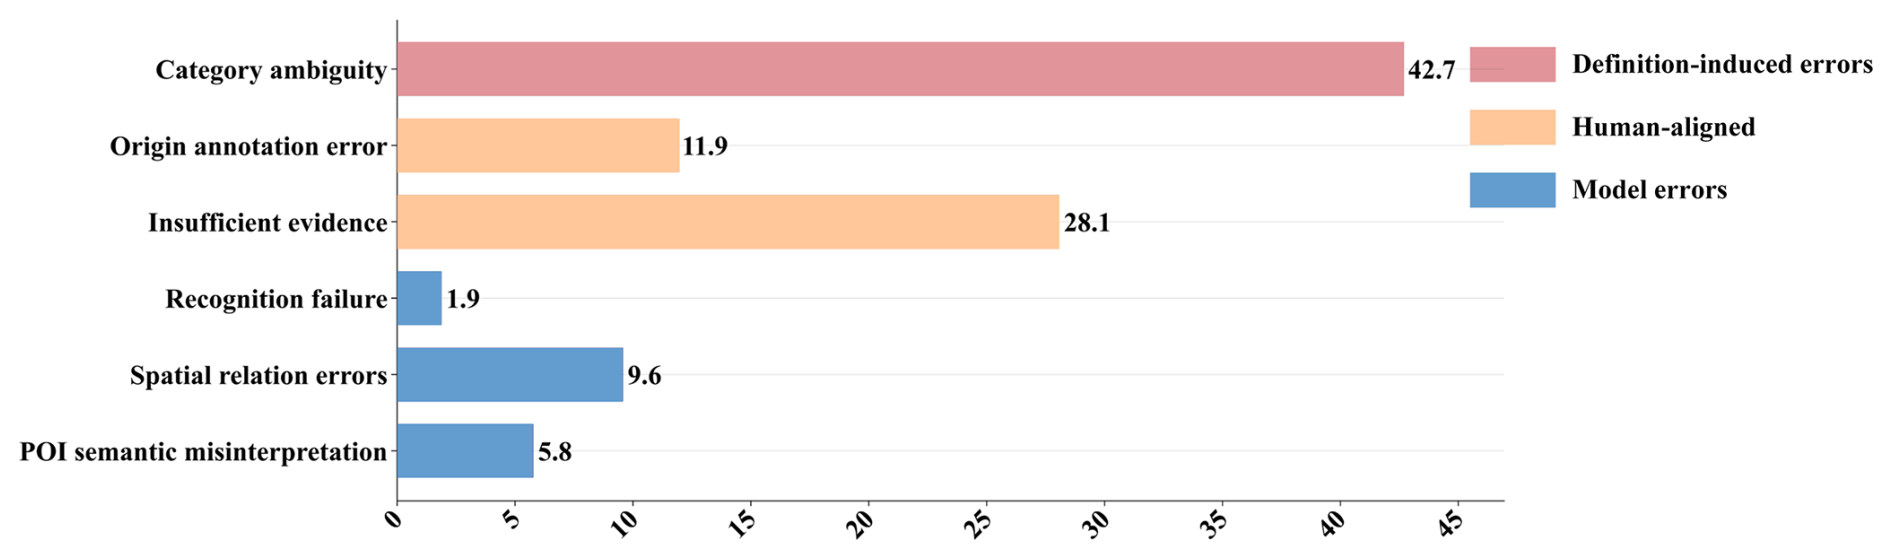
For the negative sample set, we hierarchically categorize the error sources to elucidate further large model failure modes, including three primary errors and six detailed errors. The three primary errors include (1) definition-induced errors, (2) human-aligned errors, and (3) model errors. The six detailed errors include (1) category ambiguity, (2) origin annotation error, (3) insufficient evidence, (4) recognition failure, (5) spatial relation errors, and (6) POI semantic misinterpretation (definition detailed in Sect. S3). The relationship between the primary errors and detailed errors is shown in Fig. 10. By analyzing the frequency of error causes, we aim to reveal potential directions for improving current large models and provide insight for future related research.
Ultimately, based on our data collection and cleaning methods, we construct a multimodal and fine-grained building function classification dataset containing 34 458 building samples. In BuildingSense, each sample contains a corresponding ID, a footprint polygon, a street view imagery, a rooftop remote sensing imagery, a 60.96 m buffer zone remote sensing imagery, POIs, and annotation (including building height, constructed year, location, and function) (Fig. 7). As a training dataset, BuildingSense ensures data quality through three aspects: (1) consideration of sample categories and spatial distribution, (2) multimodal data matching and annotation verification, and (3) data completeness of individual building samples.
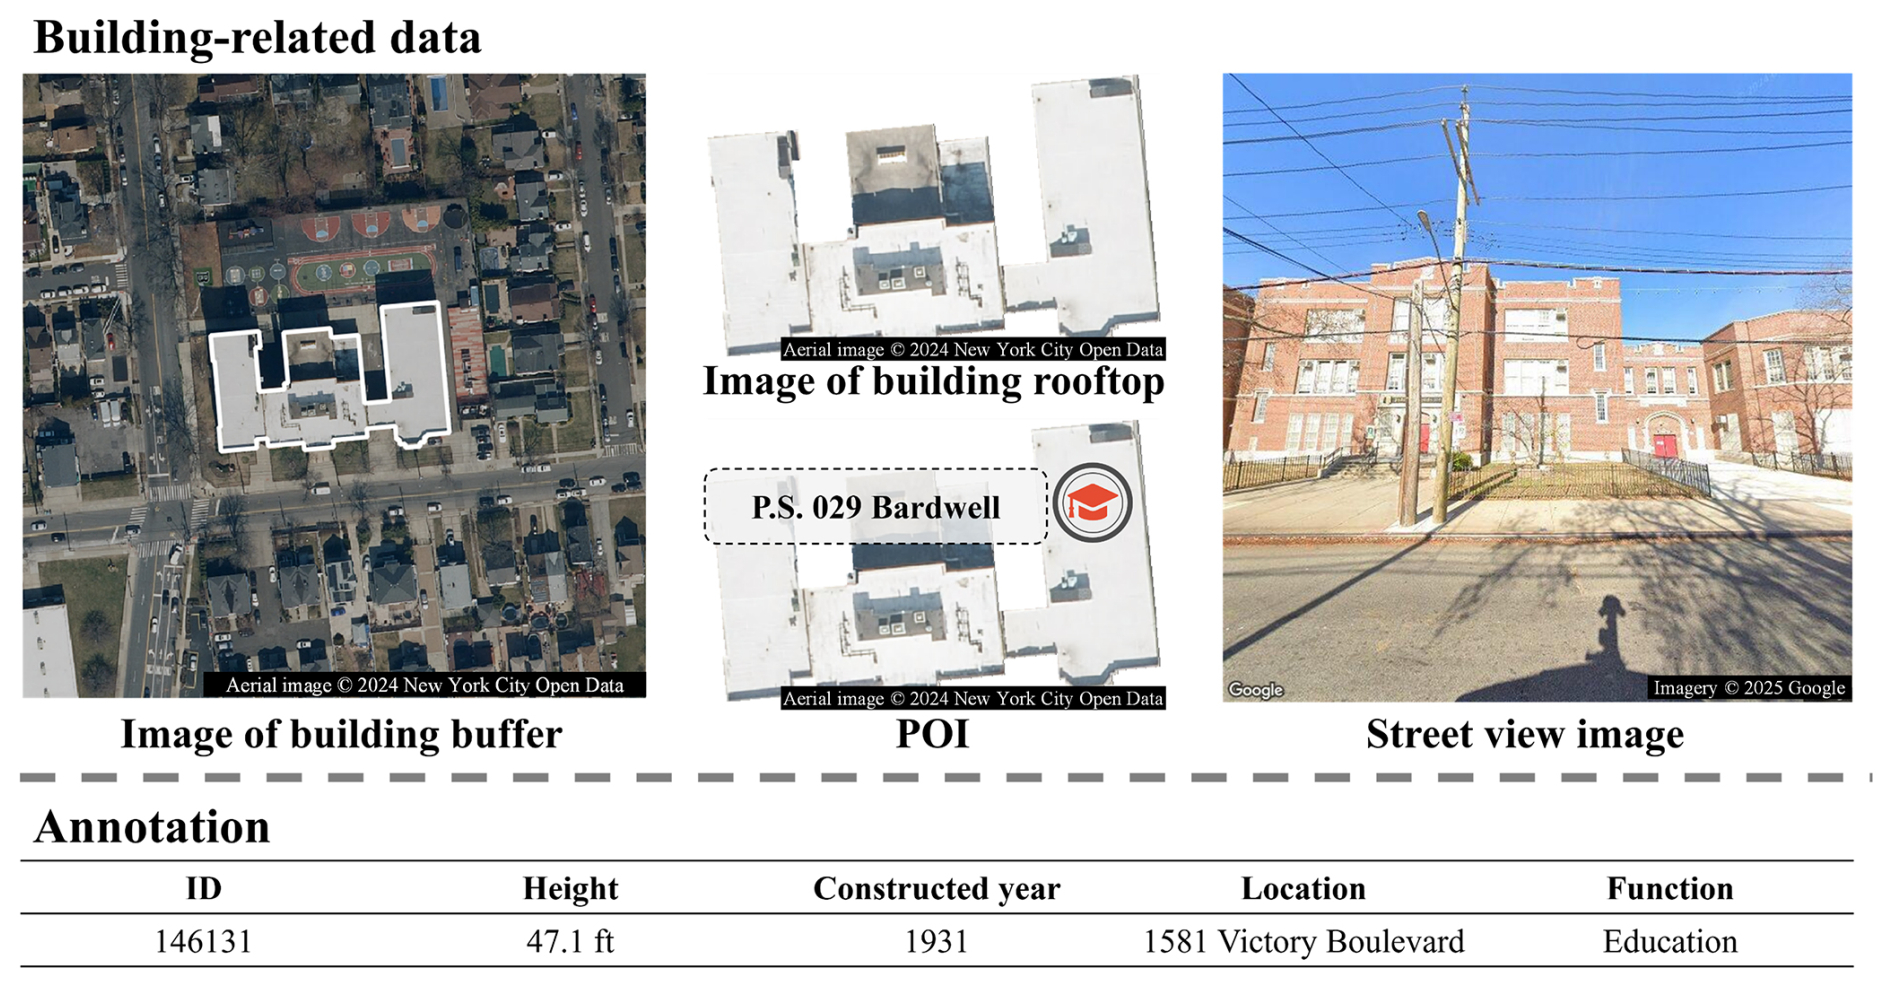
Figure 7Building-related data and annotation example in BuildingSense.
First, the building function annotations in BuildingSense are derived from government annotations, ensuring the reliability of annotations. Based on this reliability, it can be guaranteed that the sampling results obtained through our spatially and categorically balanced sampling method are statistically sound, establishing the fundamental quality of our dataset. As illustrated in Fig. 8, the sampled buildings are spatially distributed across NYC, adhering to the principle (1). The categories distribution is shown in Fig. 9. Although the sample distribution is not perfectly uniform, it primarily results from the condition that the number of certain categories in NYC is lower than the threshold we set based on the overall category distribution. To some extent, the outcome already approximates principle (2) as closely as possible under the given city.
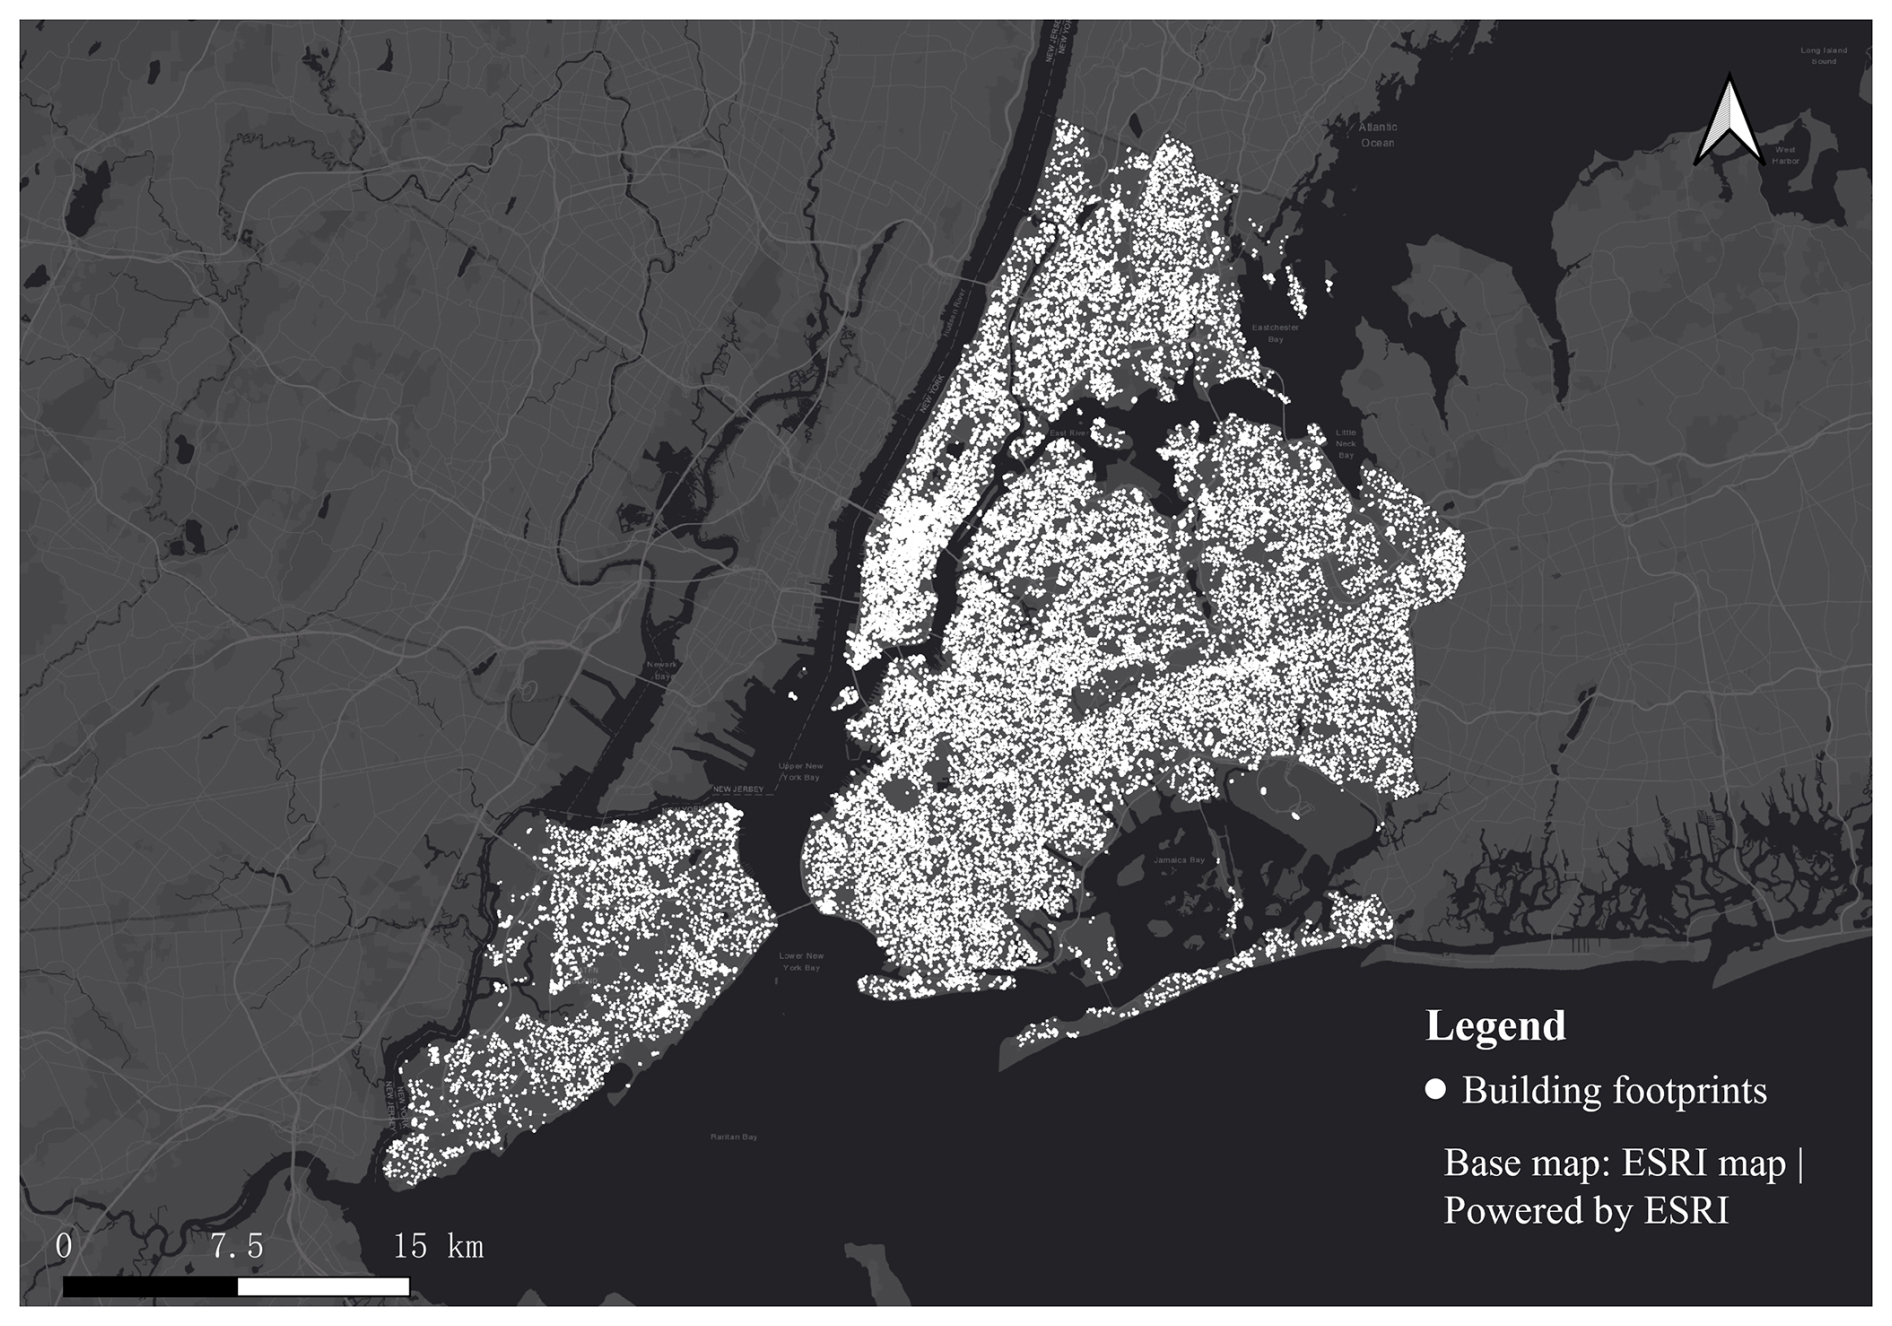
Figure 8Distribution of building footprints in NYC.
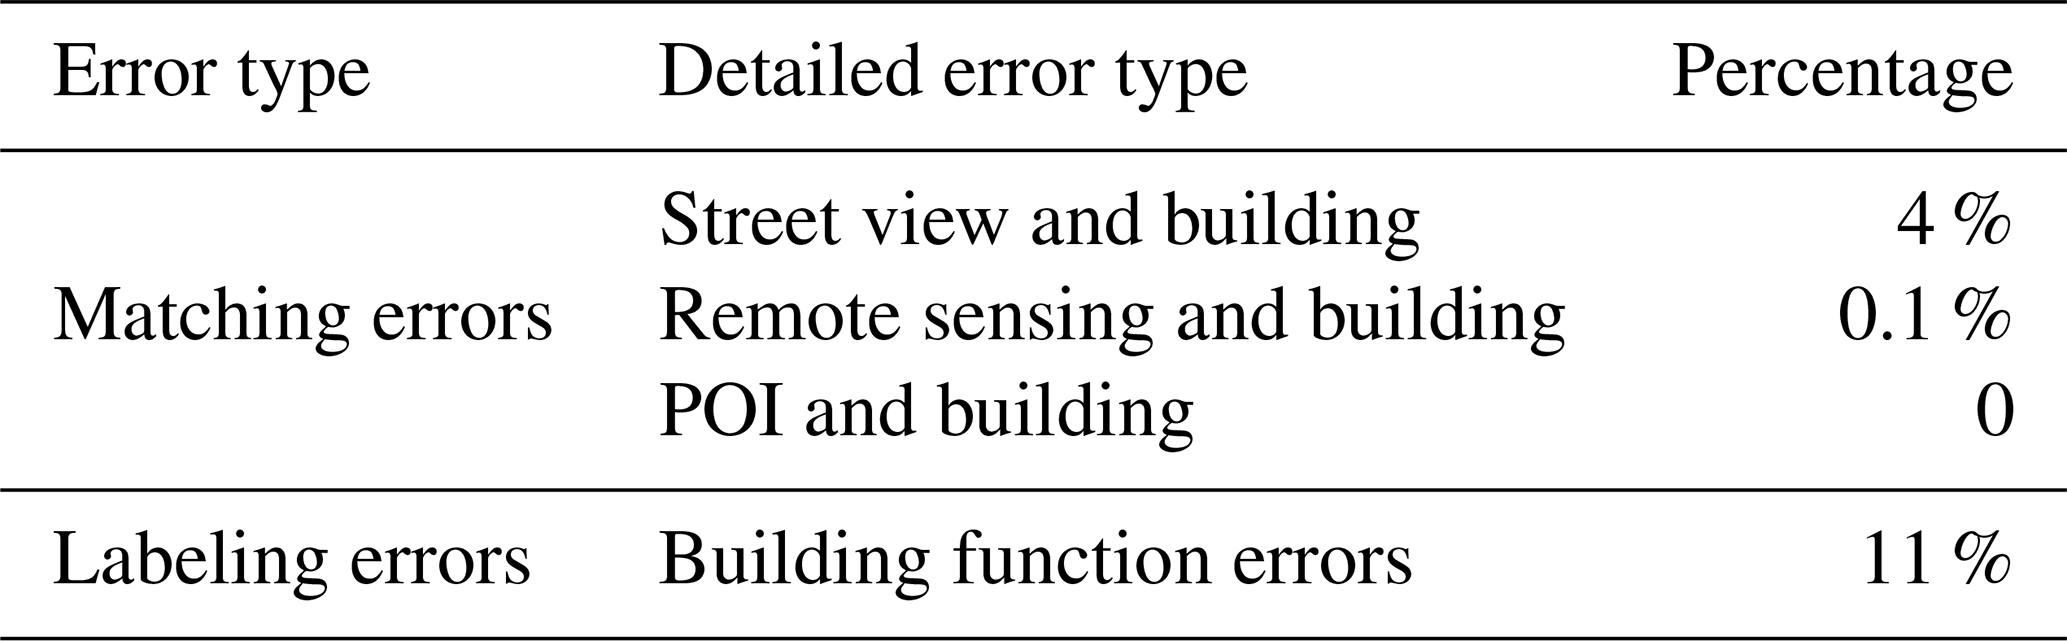
Second, to further ensure the data quality, we have cleaned the errors in BuildingSense. The results of data cleaning are presented in Table 6. The fewer matching errors in the table indicate that the raw data we collected required less manual adjustment, thereby reducing human-induced errors and ensuring the quality of the dataset. Annotation errors primarily originated from insufficiently detailed labeling of interior structures in specific open-area categories, such as parks, which have been manually corrected.
Third, Fig. 9 presents a data completeness analysis of BuildingSense. It can be seen that most of the buildings include remote sensing imagery, street views, and attribute annotations (Fig. 9). However, three functional categories, Entertainment, Public service, and Fundamental infrastructure, exhibit relatively poorer data completeness, primarily due to missing street view imagery. This phenomenon stems from the inaccessible areas of these buildings located beyond the street view vehicles (e.g., secured facilities or locations far from roads).
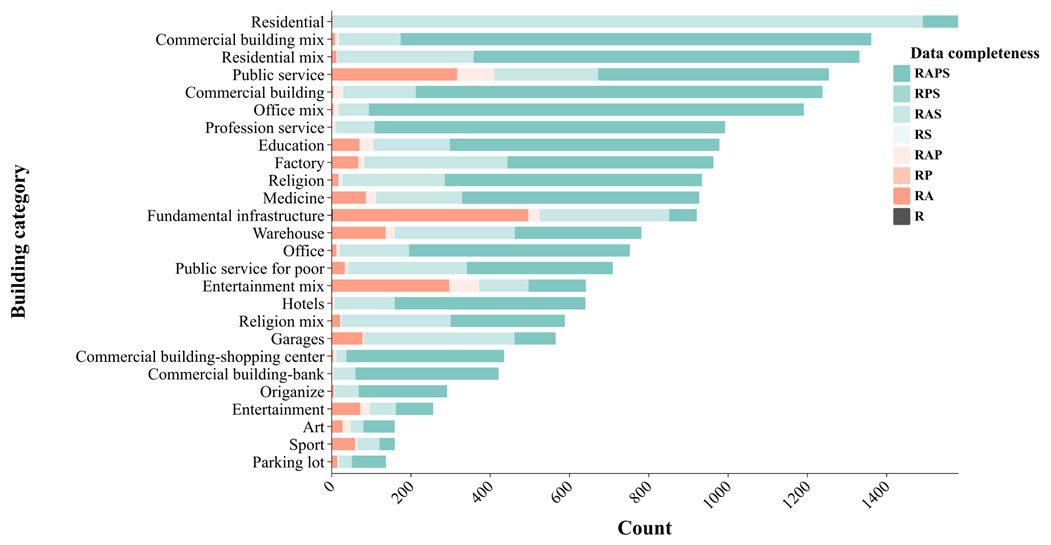
Figure 9Data completeness of each category. R refers to remote sensing imagery, A refers to annotated building attributes (building height, location, and constructed year), S refers to street view imagery, and P refers to POI data. Residential category statistics scaled by a factor of 10.
Overall, BuildingSense demonstrates competitive data quality through its well-integrated multimodal data and granular building function category taxonomy, while maintaining substantial data completeness across most building function categories.
5.1 Baselines comparison
We conducted a comprehensive quantitative evaluation of four state-of-the-art large models across various input modals, as presented in Table 7. Moreover, we further investigate the performance across two classification schemata – Fine-grained category (26 categories) and coarse category (14 categories) (Definitions detailed in Tables S1 and S3). The evaluation framework examines three critical dimensions of the large models' results, including (1) effects of granularity of the categories, (2) efficacy of the combination of modality, and (3) model capability profiling. The three dimensions are designed to reveal (1) the discrepancy performance of the large model in land use type and fine-grained building function classification, (2) the effect of each input modal on the performance of the large model, and (3) the advancement of the chosen large models.
Table 7Performance Comparison of large models. R refers to a remote sensing image, S refers to a street view image, and T refers to a building text description (Detailed examples are listed in Table S4). For instance, RT refers to the combination of remote sensing image and building text description. Bold values indicate the best performance in each category.
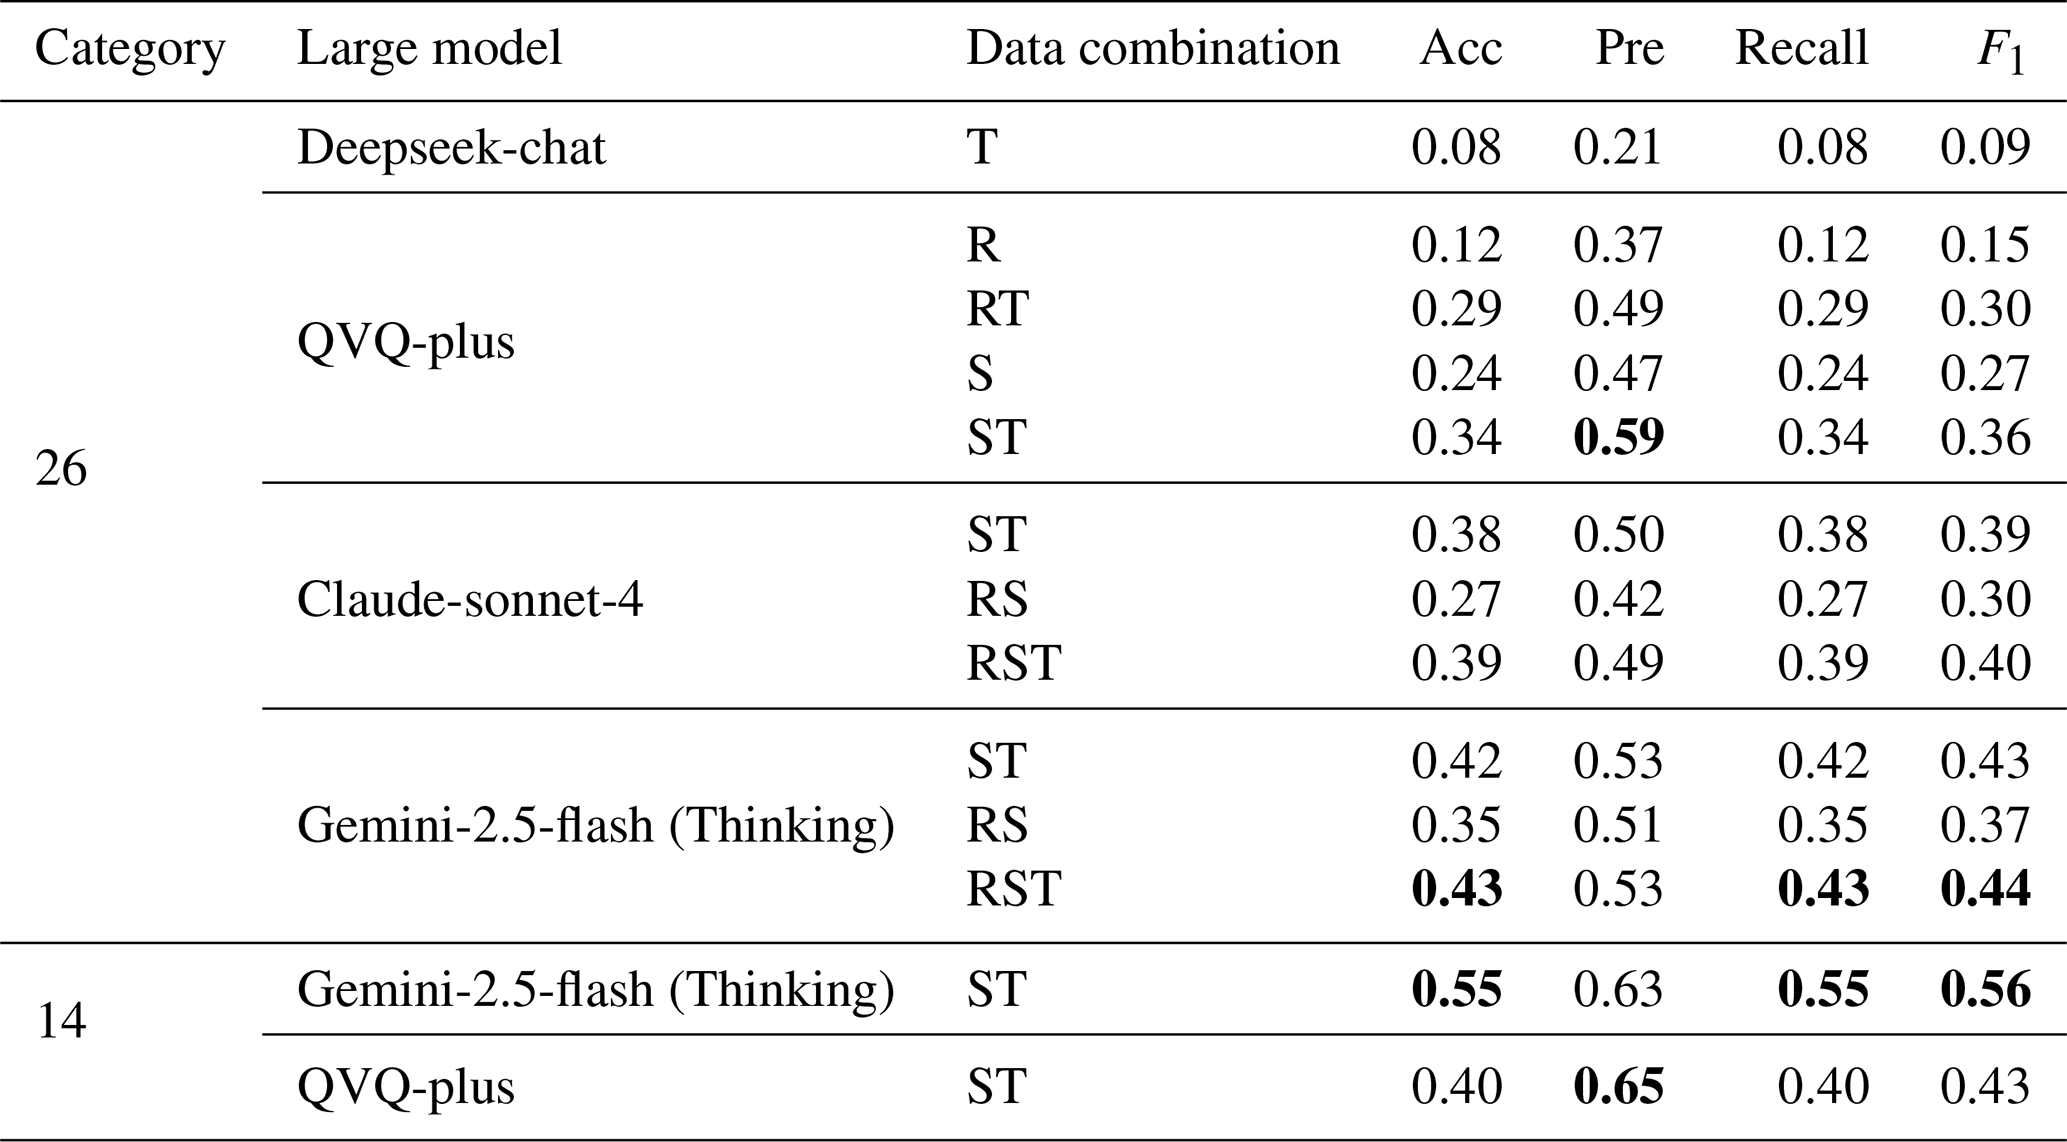
First, we evaluated performance across different categories of granularity under the ST data combination (Gemini-2.5-flash (Thinking) and QVQ-plus). The two models are chosen for their superior performance in terms of accuracy and precision. As demonstrated in Table 7, the model's accuracy improved significantly in land use classification, achieving a maximum accuracy of 0.55. Notably, this result is attained solely through prompt engineering and dual-modal data fusion (without fine-tuning or external knowledge injection). This performance is striking compared to the 0.6 accuracy reported in remote sensing-only studies (albeit with different modalities) (He et al., 2024), underscoring that the large model can comprehend the multimodal data and make logical inference. The advantage challenges that the large models remain limited in performance when they encounter multimodal spatial data.
Second, two key findings emerge from the analysis of data combination, including (1) multimodal fusion (image and text) substantially improved model performance (+0.10 accuracy vs. unimodal baselines, Table 7) and (2) multiview fusion (remote detection + street view imagery) showed a marginal improvement (+0.01 accuracy for RST vs. ST and the worse performance for RS vs. ST). Among unimodal inputs, street-view images yielded the highest accuracy (S), followed by remote sensing (R) and text (T), suggesting that street-level imagery provides richer semantic cues for building function inference. However, combining remote sensing and street-view data failed to deliver synergistic gains, indicating a limited cross-perspective reasoning capability in current models.
Third, while Gemini-2.5-flash (Thinking) achieved overall superior performance across data combinations, QVQ-plus exhibited exceptional precision (0.59 in ST mode vs. Gemini's 0.53 in RST mode). This reliability, coupled with cost-effectiveness and open-source availability of its series product, positions the qwen-series as a viable large model for developing affordable, high-performance building function classification models. More importantly, techniques such as retrieval-augmented generation (RAG) and low-rank adaptation (LoRA) will enable substantial reductions in development costs for enhancing large model performance.
Overall, our findings remarkably indicate that large models can transform conventional building function classification paradigms through (1) extensive human society knowledge, (2) transparent, interpretable reasoning processes, (3) robust multimodal processing capacity, and (4) efficient, lightweight model development.
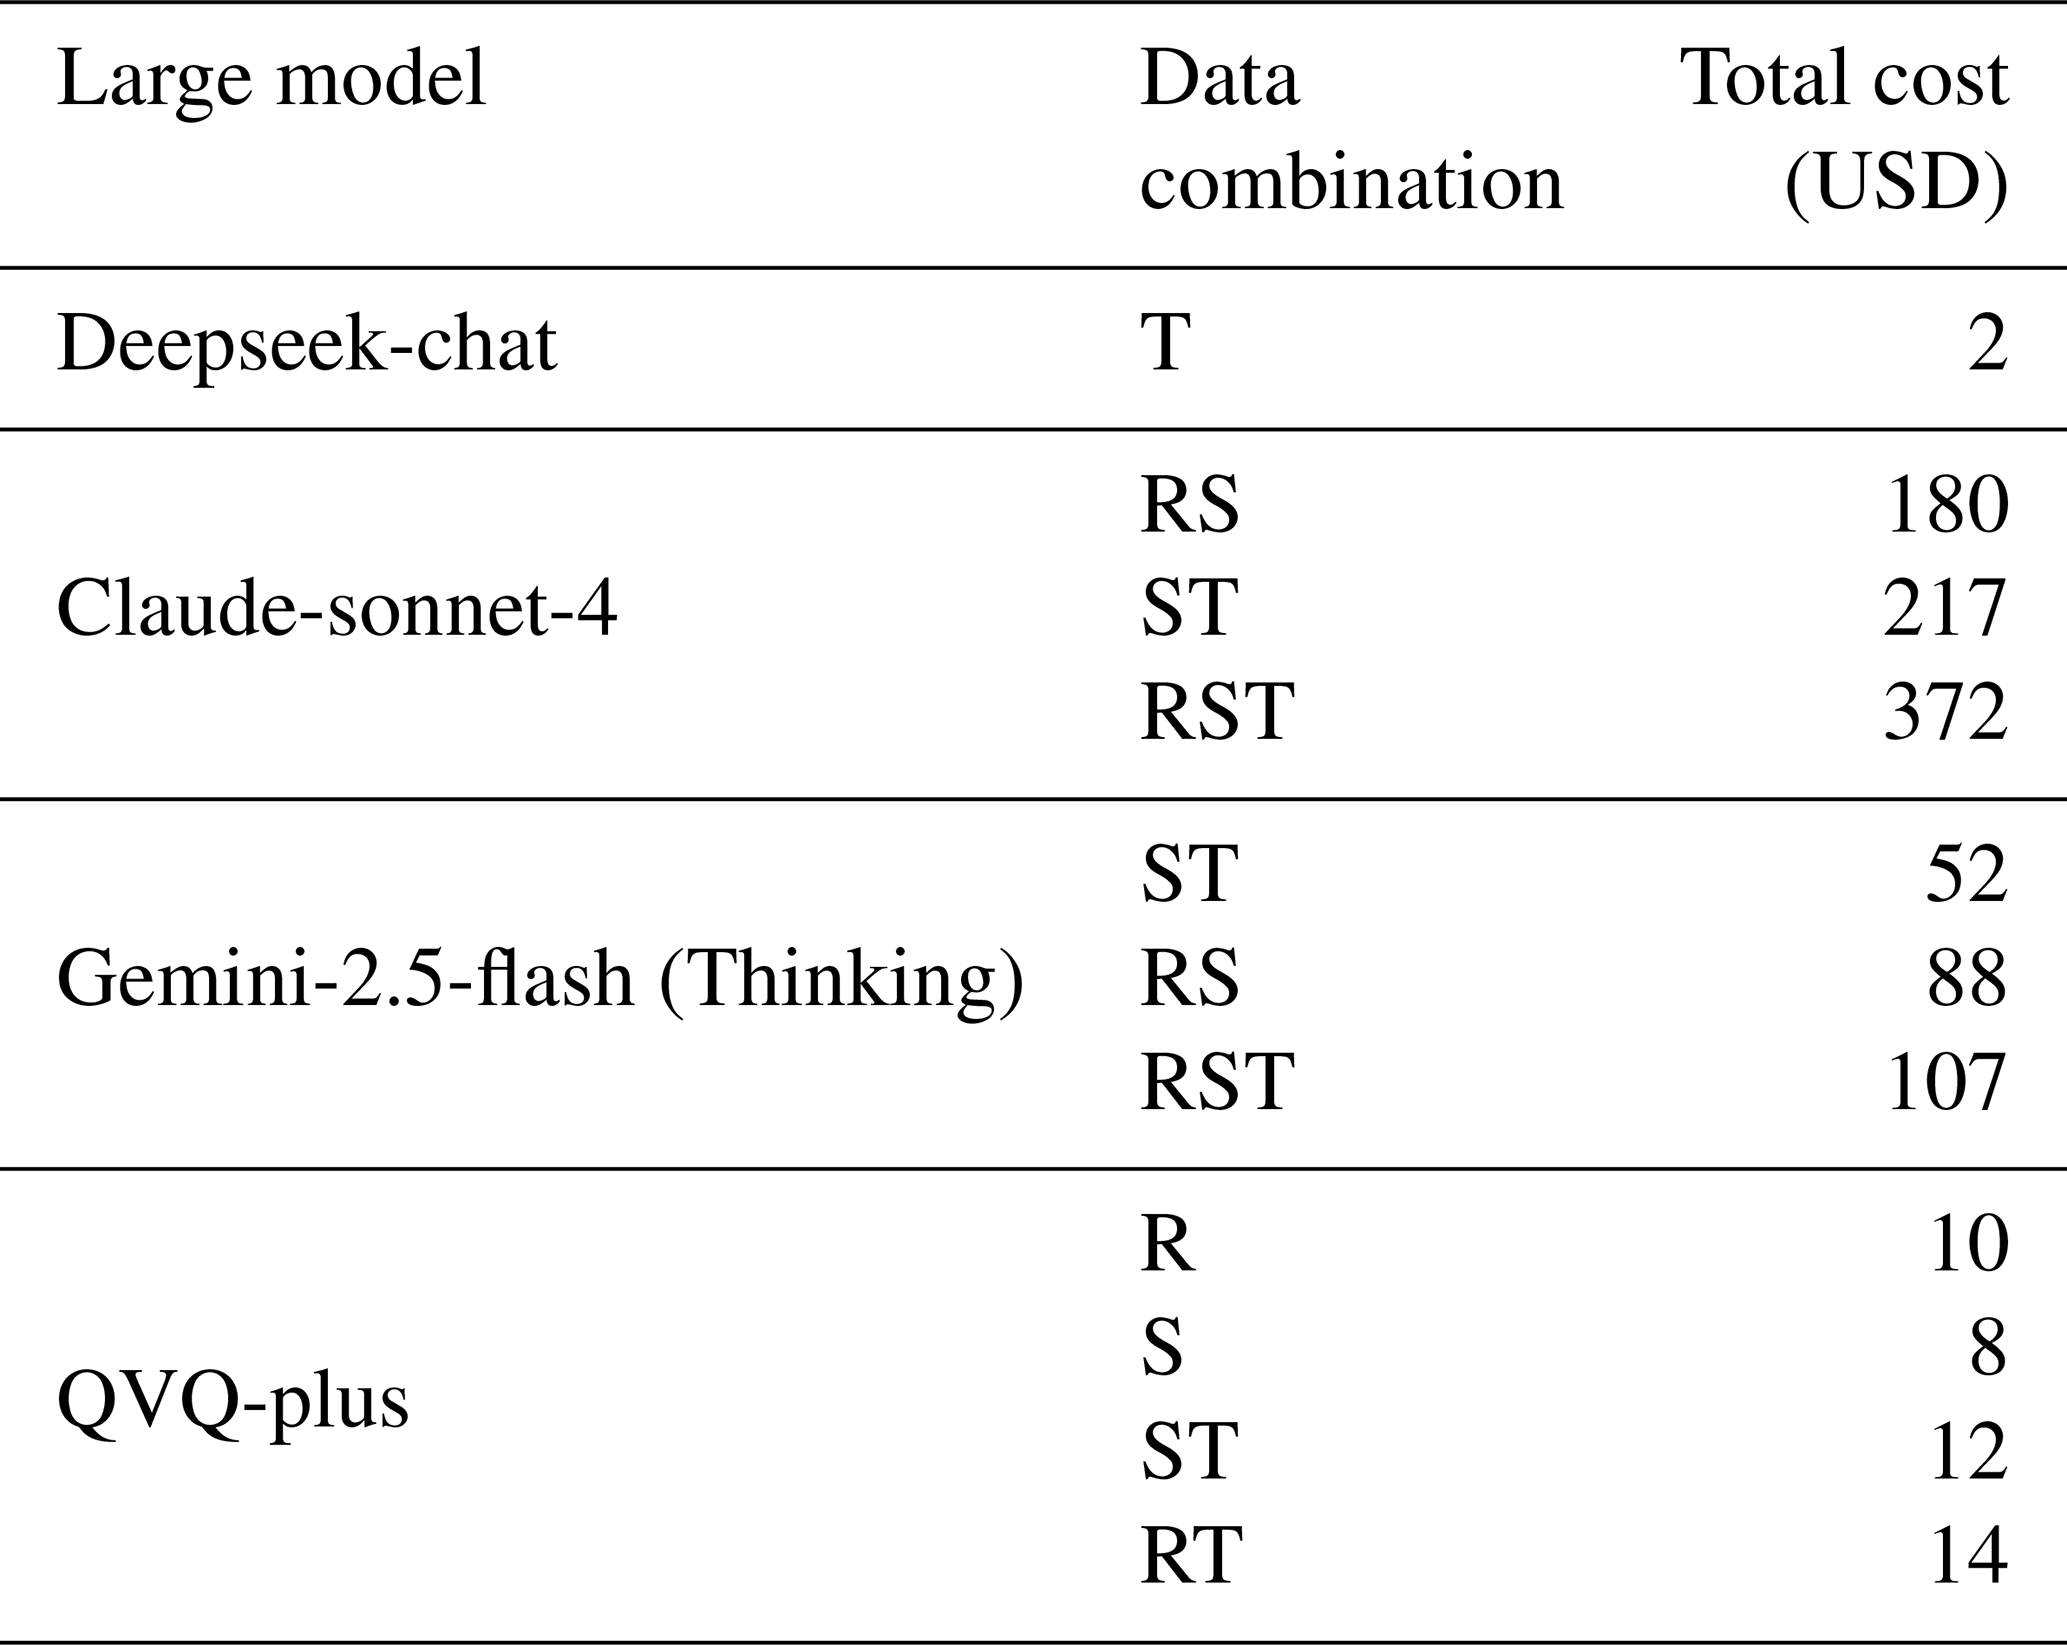
5.2 Cost analysis
To compare the cost-effectiveness of large models, we calculated the experimental expenses under different data combinations in this study (official token costs for each model are provided in Table S5), as shown in Table 8. A price comparison revealed that Gemini-2.5-flash (Thinking), as the optimal model, does not incur the highest cost – under identical data combination inputs, its expense is only one-third that of Claude-Sonnet-4. Notably, the most affordable multimodal reasoning model is the QVQ-plus model, whose cost under the same data conditions is merely one-tenth that of Gemini-2.5-flash (Thinking). Furthermore, its excellent prediction precision ensures the correctness of model outputs, making it the most cost-effective model.
5.3 Results of manual evaluation
Large models often encounter the hallucination challenge. We evaluated the Gemini-2.5-flash (Thinking) model manually to check for hallucinations and understand misjudgments. Key findings include: (1) it shows minimal hallucination in building function inference, with most judgments (positive samples) having traceable logic; (2) it has limitations in capturing semantic information from remote sensing, synthesizing multiview data for analyzing complex spatial relationships in functional building classifications, and understanding POI names; (3) it can be a detailed auxiliary tool for building function labeling.
5.3.1 Reasoning abilities and hallucination
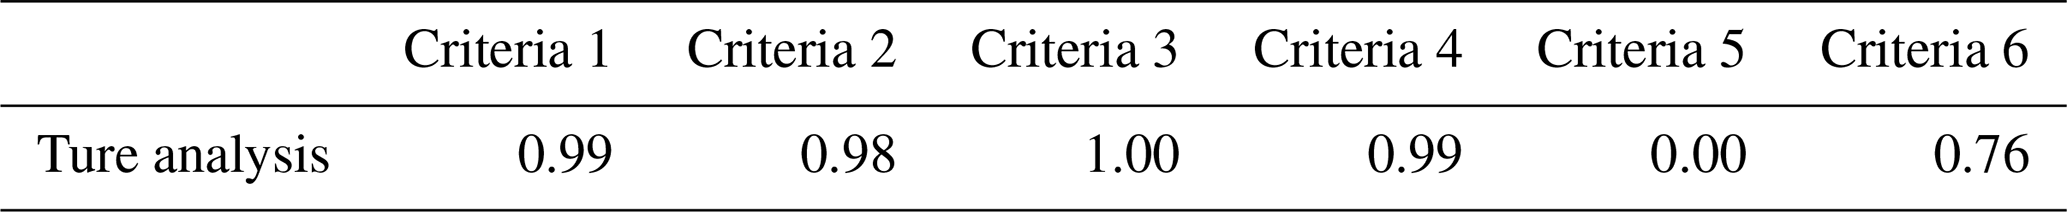
The percentage of Criteria 4 in Table 9 reveals that Gemini-2.5-flash (Thinking) demonstrates logically consistent information synthesis, with strong agreement to the large model assessment (Cohen's Kappa =0.86, p<0.001). All discrimination results align with their combinatorial analyses, and over half of the positive samples include valuable supplementary reasoning. Given the results, it can be concluded that the model exhibits negligible hallucination, strong multimodal processing, effective data integration, and reliable reasoning, highlighting its potential for fine-grained auxiliary annotation of building functions.
5.3.2 Error sources of the best-performance model
To analyze Gemini-2.5-flash (Thinking) errors, we categorized them statistically and visualized the results in Fig. 10. Model-induced errors account for only a small share, with spatial relation errors and POI semantic misinterpretation being the most common. Representative cases are shown in Fig. 11, with causes highlighted in blue.
The highlighted characters in the spatial relation errors picture (Fig. 11) demonstrate that the model is unable to infer that the building is part of a railway trunk line based on the synthesis of the remote sensing image and the street view image. The inference process is dominated by the semantic information derived from the street view image. Meanwhile, the model is unable to locate the building in the street view image accurately. This phenomenon highlights the model's limitation in synthesizing multiview information. Additionally, the POI semantic misinterpretation cases (highlighted in blue) reveal the model's limitations in understanding the semantic meaning of POI names (Fig. 11). It can be found that the model interprets the POI as a resident function. However, based on a search in Chat-GPT, it appears that the “Woodruff Family” is an organization that assists vulnerable groups and primarily provides non-profit accommodation environments, which is aligned with the annotated building function (Public service for poor). Such mistakes reflect that the semantic understanding ability of large models for some irregular POI names is vital for building function classification.
To our surprise, the primary source of errors in the model stems from category ambiguity. Our prompt template failed to provide detailed definitions for each category, leading to the misclassification examples shown in Fig. 11. The composite analysis part of category ambiguity error presented in Fig. 11 effectively characterizes both the building's spatial configuration and the associated POI semantic attributes. However, in the building classification of NYC, the building is categorized as Q3 (outdoor pool). According to the predefined mapping relationship, it should properly be classified under the “Sports” category. In contrast, Gemini-2.5-flash (Thinking) assigned it to the “Entertainment” instead. From the perspective of semantic representation, this classification result cannot be considered entirely incorrect; rather, it reflects a systematic discrepancy between the classification rules understood by the large model and those we have formally established.
More surprisingly, a considerable proportion of “Human-aligned errors” were identified in the negative samples. These refer to cases where, given the same building information, human evaluators and the model produced highly consistent judgments despite both being technically incorrect according to our ground truth (see Fig. 11 for concrete examples). The model demonstrates robust and comprehensive analysis capabilities, with its outputs representing optimal conclusions that can be achieved given the available information. This error distribution pattern strongly suggests that Gemini-2.5-flash (Thinking) has attained competent performance in comprehending multimodal spatial data.
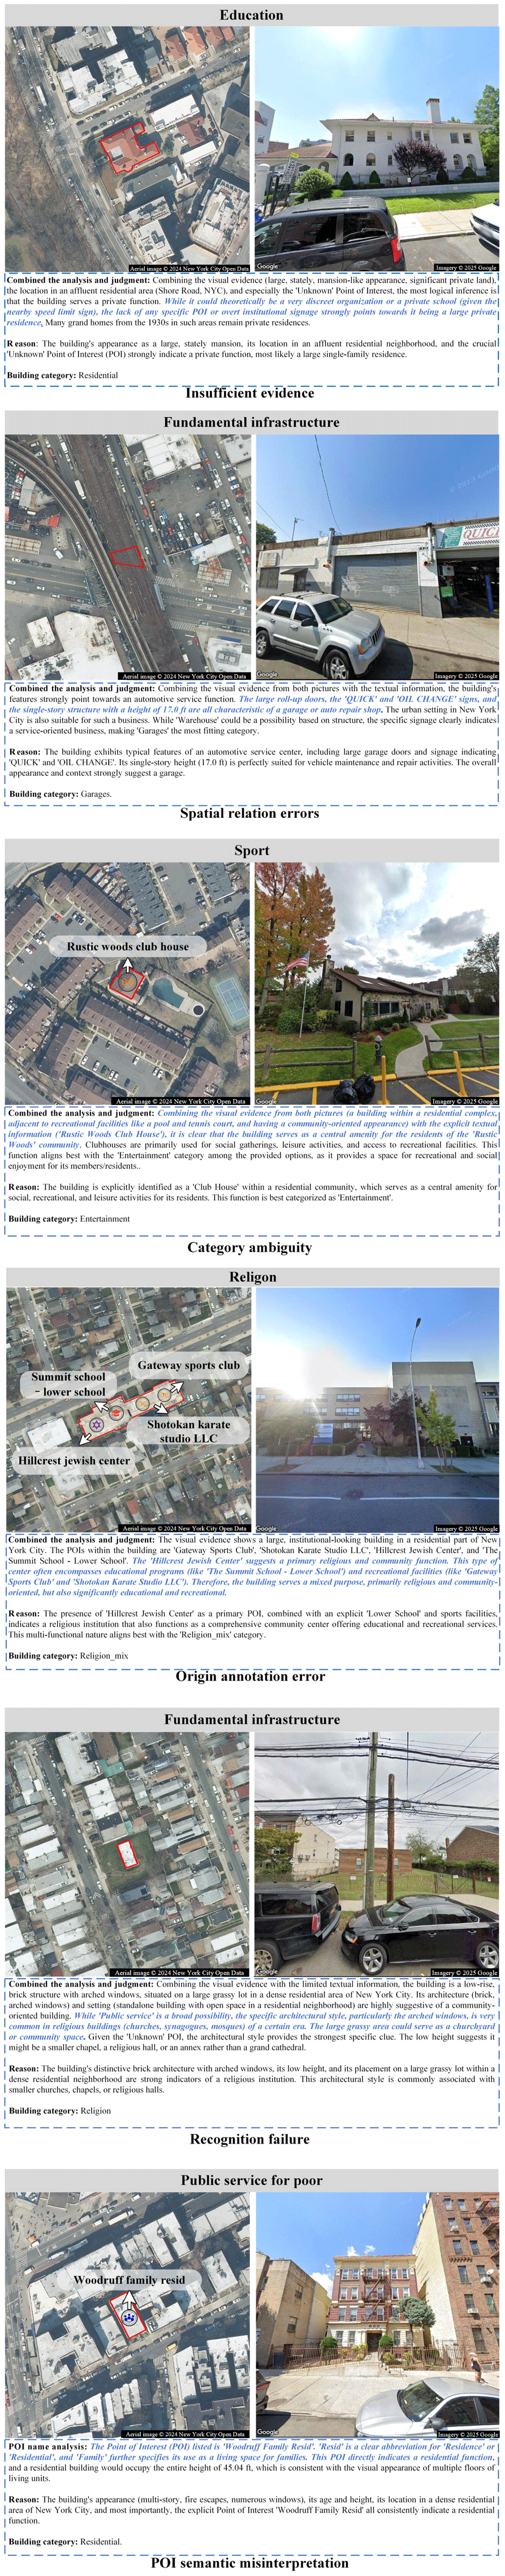
Figure 11Example of each error.
5.3.3 Ablation study of category definition
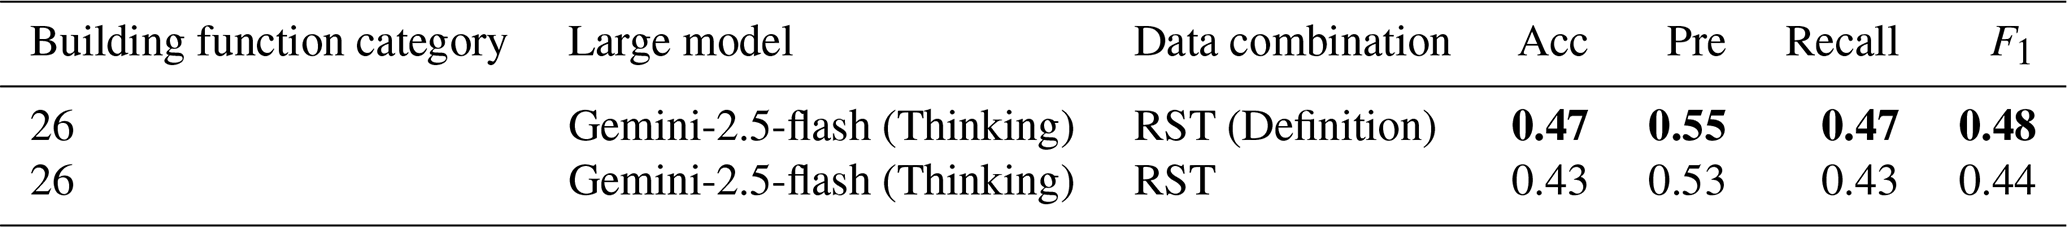
Considering the systematic discrepancy between the classification rules understood by the large model and our predefined classification framework, we conducted an ablation experiment. By incorporating simplified definitions of our classification categories through prompt engineering, we compared the modified model with the original version. The results demonstrate that introducing functional definitions comprehensively improved the model's prediction performance, although the enhancement remains limited. Quantitative analysis reveals that while this approach cannot completely resolve all errors caused by definition ambiguity, its effectiveness surpasses that of supplementing remote sensing image information alone (as evidenced by comparative results in Tables 7 and 10).
Table 10Comparison between the original prompt and the definition given prompt. Bold values indicate the best performance.
To better analyze errors from definitional discrepancies, we constructed a confusion matrix (Fig. 12), which shows that refined definitions improve the model's performance for most categories, as seen by the prevalence of blue cells along the diagonal. However, specific categories, such as office mix and office/medicine, warehouse and factory/garage, and sport and entertainment/entertainment mix, still show ambiguity. This suggests that even with enhanced definitions, the model's classification logic diverges from our classification framework, as human evaluators apply their own rules to these ambiguous cases. Instead of refining definitions, creating a reasoning-example database would help the model learn latent classification rules, better aligning it with the predefined classification framework.
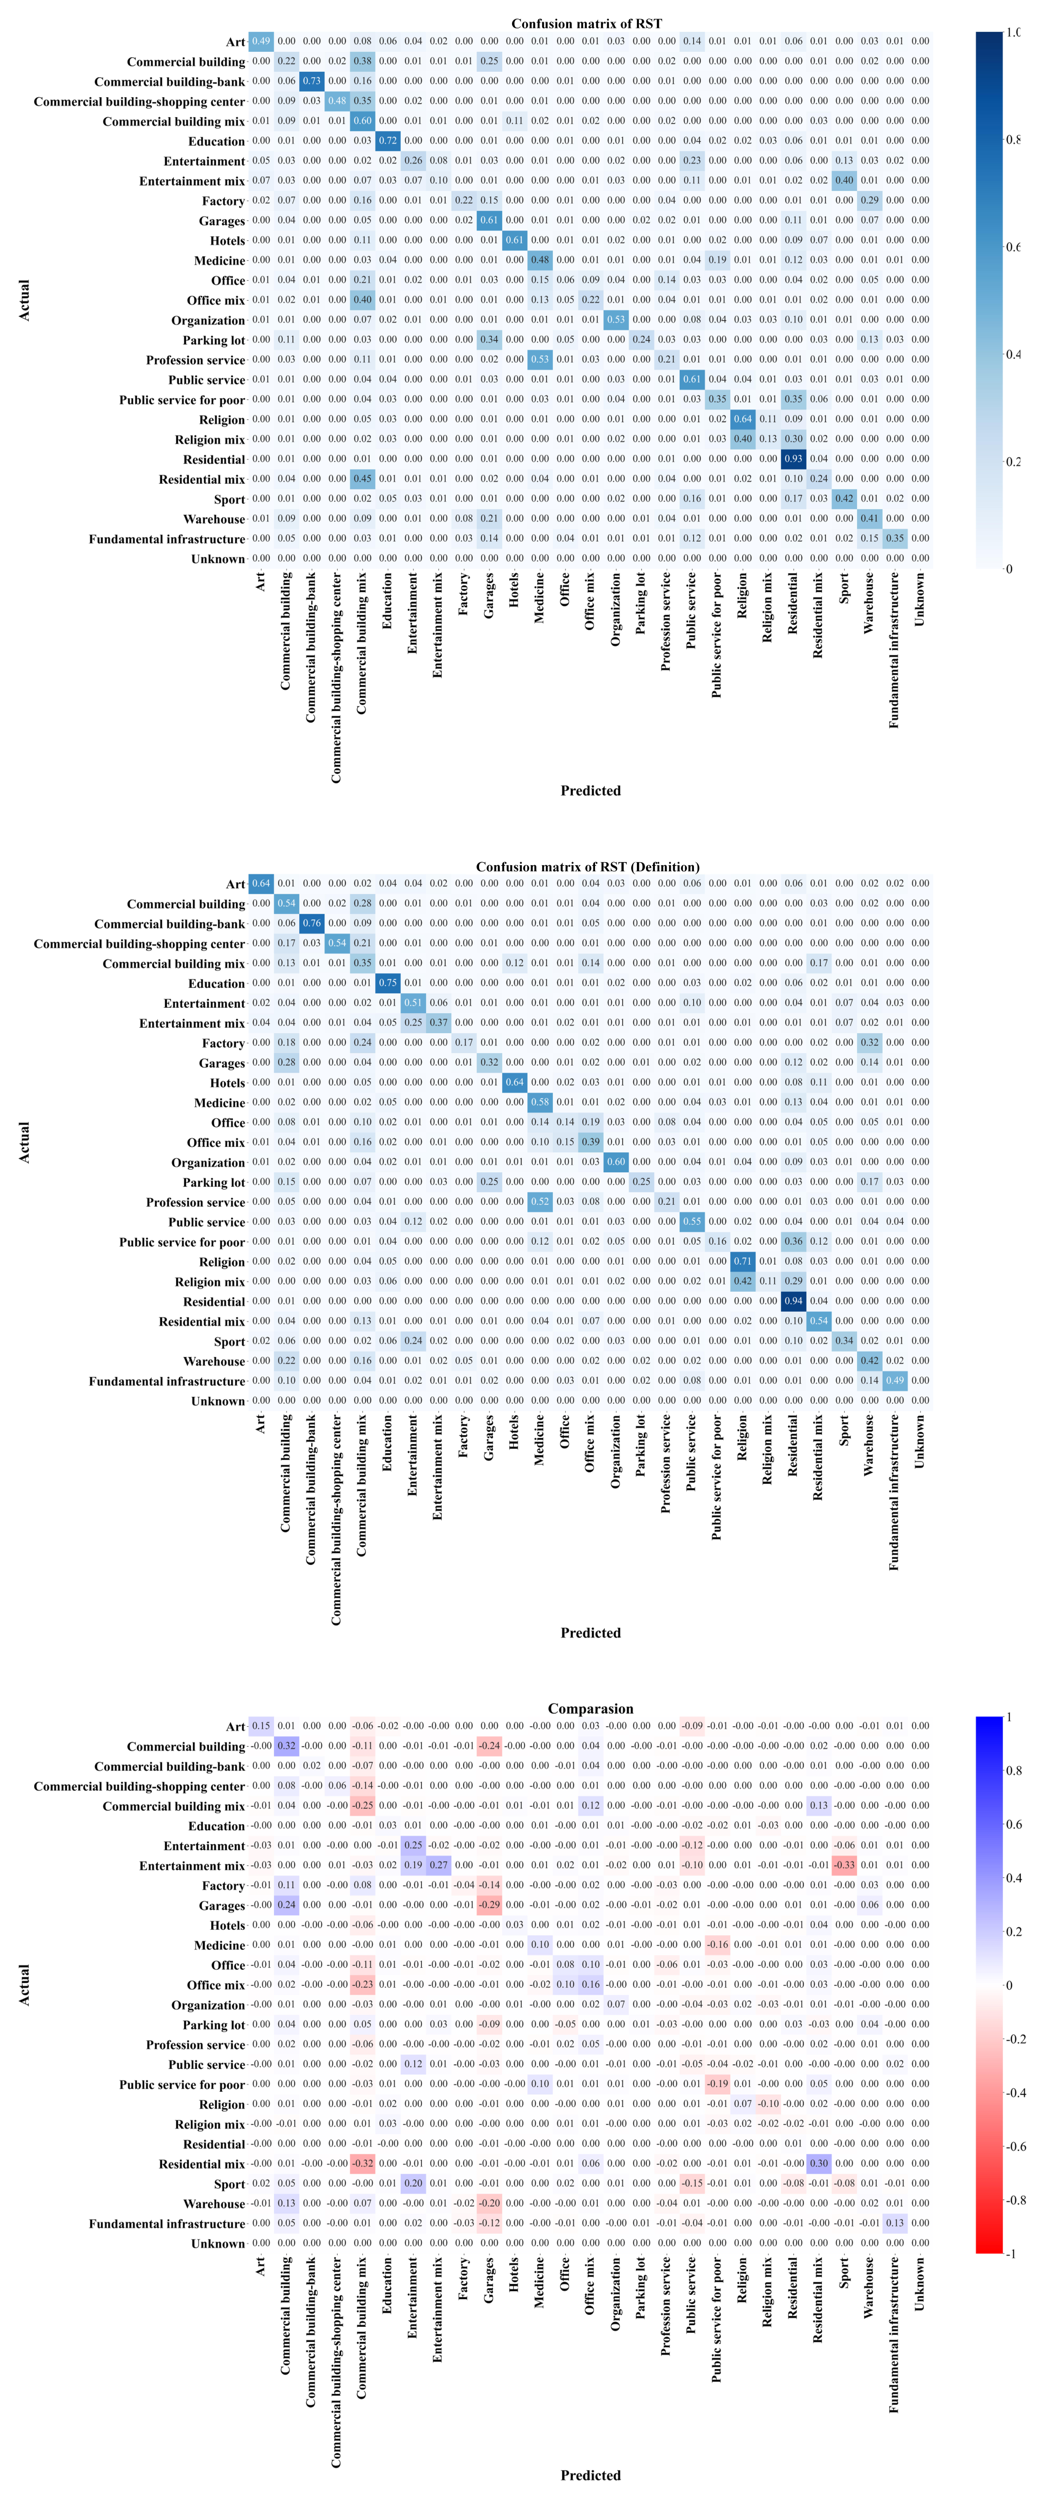
Figure 12Confusion matrix of the original results, the definition given results, and their comparison.
6.1 Future directions for large model developments in building function classification
Based on the experimental results in this study, we found that, under zero-shot conditions, even though the overall quantitative metrics are not satisfactory, the current state-of-the-art large models are capable of effectively utilizing multimodal data to classify the building functions. The results challenge the conventional belief that large models struggle to comprehend multimodal spatial data. Although our conclusions may be subject to urban bias (the variations in model performance and error distributions across data from different cities), the evaluation based on NYC has already demonstrated the feasibility of using large models for building function classification. We argue that, in the future research, three directions can be explored to comprehensively improve model performance and reduce inference costs, ultimately achieving low-cost auxiliary or automated annotation for building function, including (1) constructing an external information database for building function classification, (2) developing small parameter models with excellent inference performance, and (3) quantifying the confidence of model outputs.
First, based on the experimental results in this study, the main errors in the large model's building function classification result from category ambiguity, which can be attributed to the system diversity between the classification rules of the large model and the predefined definition. Despite providing relatively detailed classification definitions, we did not achieve a breakthrough in model performance. Therefore, rather than offering a complete definition, it may be more effective to construct a database of inference examples for different building function categories. Using RAG technology, the model can match the most similar inference examples to each input, allowing it to learn similar reasoning processes. Additionally, POI and location knowledge bases should be developed to provide sufficient semantic information for the model's building function inference. The first direction will not only enhance the model's inference capabilities but can also be combined with the second direction to reduce inference costs significantly.
Second, based on the experimental costs in this study, the optimal model, Gemini-2.5-flash (Thinking), has an inference cost of USD 107 for 16 043 buildings in RST combinations. Such costs are prohibitively expensive for a city-level building function inference project – approximately USD 6000 for NYC. In contrast, QVQ-plus only costs around USD 12.9 for the same number of buildings. Although its inference accuracy under zero-shot conditions is relatively low, we can still see its potential in building function classification. In the future, the performance of the large models can be improved by fine-tuning the open-source multimodal models such as qwen-VL, and using RAG technology to retrieve semantic information from the building function inference knowledge base proposed in the first direction. Ultimately, it will lead to the development of a cost-effective building function classification model for data production and auxiliary annotation.
Third, quantifying the confidence of model outputs facilitates a quick assessment of the quality of classification results. Results with low confidence can be flagged for human correction, thereby assisting with the annotation process. However, there are limited methods for quantifying the confidence of building function classification results, especially for large models. Consequently, developing a confidence quantification method is important for constructing a low-cost building function classification model.
6.2 Applications of BuildingSense
Except for evaluating large model performance and providing insights for large model-based classification methods development, BuildingSense, as the first multimodal and fine-grained building function dataset, offers advantages for supporting algorithm development in two aspects: its multimodal and fine-grained characteristics facilitate advancements in multimodal fusion-based classification algorithms. At the same time, its rich building-related annotations make it applicable for algorithm development of building height and constructed year inversion.
First, from the perspective of multimodal-based function classification methods development, there are two critical issues: (1) how to extract deep semantic features from POI and building-related descriptive texts, and (2) how to align multiview and multimodal data features.
Our evaluation of large models reveals that they can effectively extract the background semantic information about human activity solely from the POI name. This capability results from its extensive knowledge of human society. Similarly, the model shows the same ability in understanding the deep semantics of building-related descriptive texts. In contrast, multimodal-based methods lack such advantages. Typically, the embedding feature vectors of POIs rely on predefined POI categories, resulting in an inadequate capture of the spatial and semantic relationships among POIs within buildings. Thus, extracting deep semantic features from POIs and building-related texts remains a significant bottleneck.
Large models exhibit limited performance in comprehensively interpreting the semantics of remote sensing and street view imagery, indicating that the multi-view features of remote sensing and street view imagery are poorly aligned. Although significant progress has been made in image-text alignment methods, methods for aligning multi-view images with texts remain underexplored (Li and Tang, 2024).
Second, from the perspective of BuildingSense‘s task diversity, building height and constructed year, as two critical building attributes, are widely used in urban research (Zhao et al., 2023; Wang et al., 2024). Consequently, the inversion of these parameters has become two important research directions. Existing studies have demonstrated that street-view imagery can be utilized for inferring building height and constructed year (Wang et al., 2024; Xu et al., 2023), while remote sensing imagery can be employed for building height estimation (Zhao et al., 2023). Notably, both the data and relevant annotations for these tasks are included in BuildingSense. Therefore, BuildingSense extends far beyond building function classification and can also support research on height and constructed year inversion.
In summary, in addition to supporting research on building function classification methods, BuildingSense can also be applied to estimate other building parameters, providing a foundational platform for the development of current building parameter estimation methods.
6.3 Limitations of BuildingSense
6.3.1 City sample bias
NYC, as an international metropolis, has a diverse ethnic composition and high population density, which contribute to its varied architectural styles, including row houses, modern commercial buildings, grand public structures, and towering skyscrapers. Thus, the building function dataset we constructed from NYC samples exhibits a certain degree of representativeness for the North American context. However, the architectural styles that differ considerably from those in North America, such as East Asia and Europe, may lead to two potential outcomes: (1) the evaluation of the optimal large model based on the baseline results may be overestimated, and (2) the performance of models trained on this dataset may degrade when transferred to regions with substantially different architectural styles.
First, our evaluation of the optimal large model (Gemini-2.5-flash (Thinking)) indicates that it can effectively integrate multimodal spatial data and perform logical building function inference, even though it was not specifically designed for this task. During this process, it demonstrates strong capabilities in image understanding, text processing, and spatial reasoning. As a flagship product of Google, we hypothesize that its training data likely includes extensive Google spatial data (e.g., street view imagery, POI reviews, and remote sensing data), which may account for its superior performance compared to other models. However, in regions such as China, the distribution of information across data modalities (visual, textual, spatial) differs significantly from that in NYC. For instance, Chinese urban villages present a unique challenge: densely built, low-rise residential areas contain informal commercial activities on the ground floor. Visually, a building may appear entirely residential (with laundry hanging from windows, narrow alleyways, and residential-style architecture), while POI data might indicate numerous small businesses (e.g., convenience stores, hair salons, street food vendors) operating within. Such a condition may lead to brittle reasoning chains and performance decline of baselines in four primary aspects: (1) an inability to analyze architectural styles from street view images; (2) a failure to semantically interpret POI names within buildings due to linguistic differences; (3) an incapacity to assess the built environment and architectural styles from remote sensing imagery; and (4) incorrect spatial reasoning resulting from any of the aforementioned errors. This implies that our evaluation of the optimal large model may be overestimated.
Second, despite these limitations, Gemini's strong performance on BuildingSense within its training distribution still offers valuable insights: the technical approach of inferring building functions using large models is feasible, and fine-tuning such models with relevant data could significantly enhance their performance on building function classification tasks. Consequently, subsequent large models fine-tuned on BuildingSense may only achieve performance improvements within the North American context, with relatively limited gains when applied to other regions. Furthermore, for traditional deep learning models, limited generalizability beyond the training distribution has always been a primary drawback. Models trained on BuildingSense may therefore not be suitable for application outside North America. Nevertheless, BuildingSense remains an important dataset for validating model performance.
To address this limitation, our future work will focus on three directions: (1) extending BuildingSense to include multiple cities representing diverse urban typologies (e.g., a European compact city, an Asian high-density city, and a Latin American spontaneous city); (2) developing domain adaptation techniques to transfer knowledge from NYC to data-scarce regions; and (3) conducting systematic cross-city evaluations to quantify the generalizability of both traditional and large models.
6.3.2 Lack of annotation in street view images
In BuildingSense, the street view images are not annotated with the target building. It was designed to assess whether large models can infer the target building's location within a street-view image from other provided information (e.g., remote-sensing imagery, building height). In our prompting templates, we only indicate to the model that the target building is located directly ahead. Strikingly, we found that the model attempts to match and integrate across the different viewpoints and is capable of self-correction when it detects logical inconsistencies, ultimately producing a revised – and correct – label. An illustrative example is provided in Fig. 13.
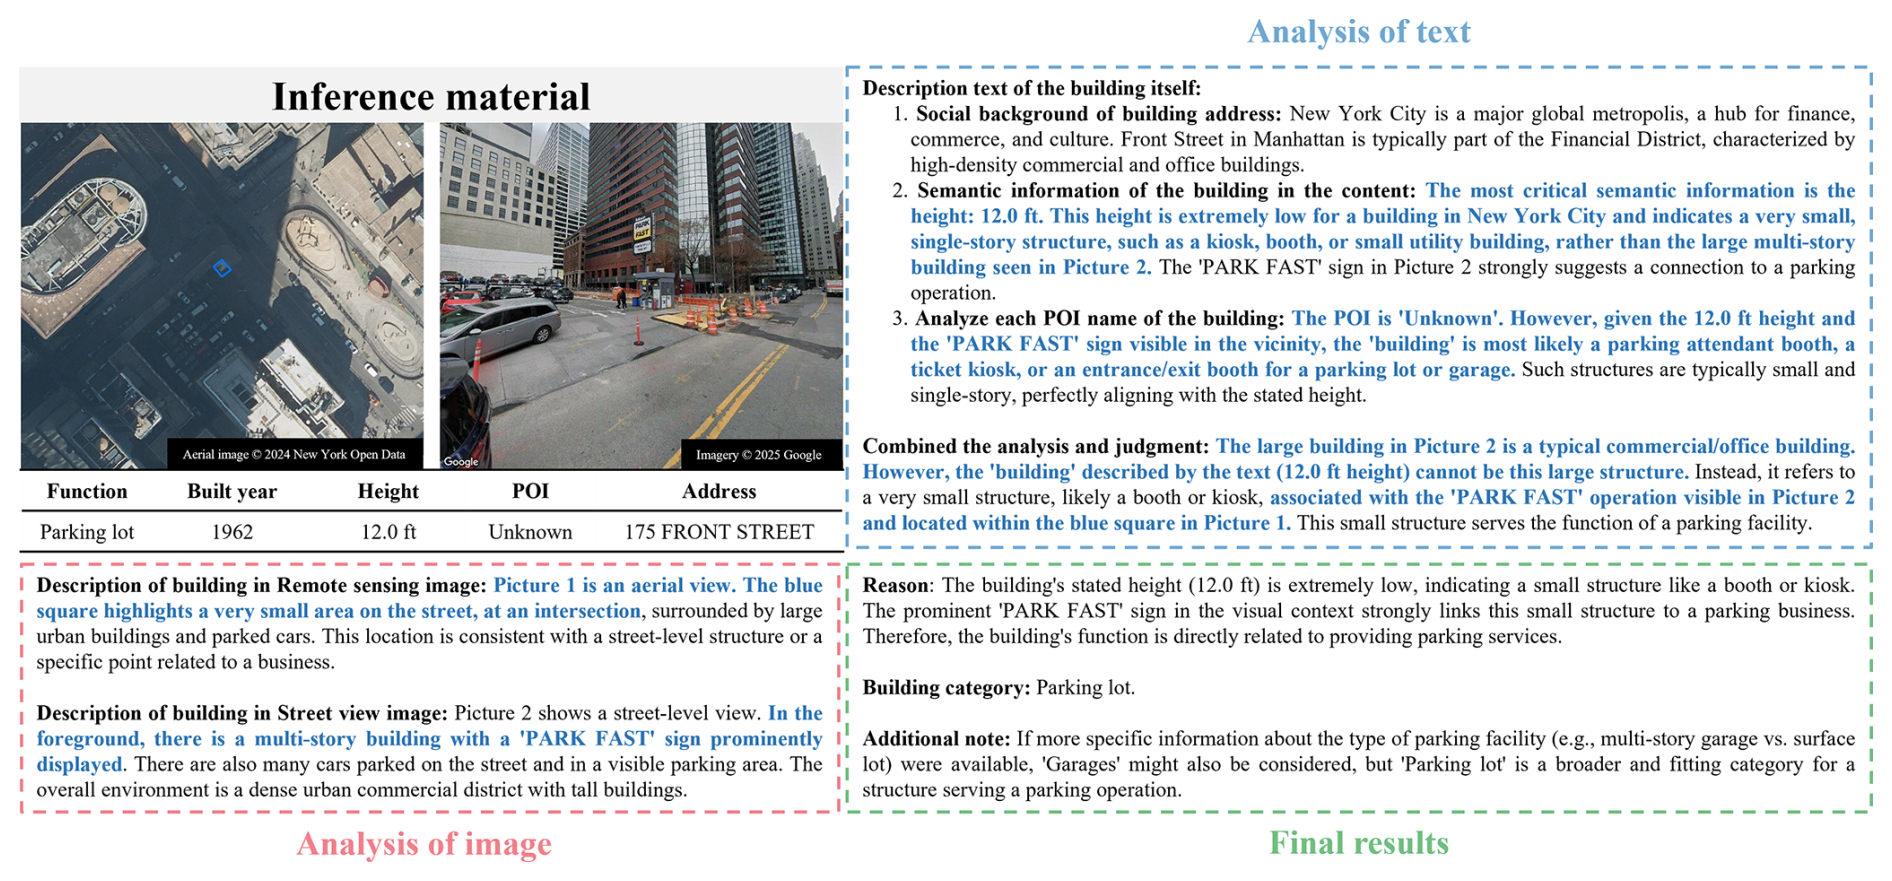
Figure 13Example of the Gemini-flash 2.5 (Thinking)'s output.
It can be observed that the model's textual description of the street view image did not match the actual characteristics of the target building: the model mistakenly took a taller background tower as the target structure (see the blue text in Fig. 13, “Description of building in Street view image”). Despite the condition arising from the unannotated target building in the street view image, this setup enables testing whether the model can align the building's location across the remote sensing and street view modalities using the provided information. In a subsequent inference, the section “Semantic information of the building in the content” in Fig. 13 mentions that given the building height that we supplied, it recognized a recognition error in the street view with textual cues present in the street image and revised its street view judgment. The later stages of the inference retained this revised decision consistently (see the blue text in Fig. 13, “Analyze each POI name of the building” and “Combined the analysis and judgment”).
This annotation gap was intentionally designed to test whether large models could integrate multimodal spatial data and perform coherent reasoning – a finding that ultimately proves our assumptions. However, this approach inevitably increases annotation costs in practical applications, as target buildings in streetview images must be labeled to support specific tasks. Therefore, we plan to include target building annotations in future updates of the dataset.
The data can be accessed through https://doi.org/10.6084/m9.figshare.30645776.v2 (Su et al., 2025a).
The code can be accessed through https://doi.org/10.6084/m9.figshare.30645776.v2 (Su et al., 2025a).
Building function classification, as a primary method for obtaining building functions, remains two major challenges: (1) interpretability of models and (2) comprehensive fusion of multimodal features. The limitations have led to unreliable classification results and suboptimal classification accuracy. Large models, benefiting from extensive knowledge of human society, powerful multimodal data fusion capabilities, and advanced reasoning ability, provide a promising approach to address the issues. However, their current limited performance in handling multimodal spatial data raises a need for a systematic evaluation of their capabilities in building function classification task. Yet, the absence of a multimodal building function dataset, coupled with the coarse-grained classifications in most existing studies, obscures the deep semantic information that building functions convey about human activities. Therefore, we aim to construct a multimodal fine-grained building function classification dataset and benchmark the performance of large models on it to provide insights for future large model-based algorithms.
The main contributions of this study are twofold: (1) the creation of the first multimodal fine-grained building function classification dataset, and (2) a systematic evaluation of both the outcomes and reasoning processes of existing large models. Quantitative analysis of model classification results reveals that: (1) multimodal fusion improves classification accuracy, (2) multi-view fusion (street-view and remote sensing) has limitations in semantic understanding, and (3) building function classification models based on open-source large models require further investigation. Meanwhile, a manual evaluation of the reasoning processes shows that: (1) large models perform well when category distinctions are clear but struggle with insufficient or ambiguous data, with errors stemming from a lack of domain knowledge rather than modality misunderstanding – the Gemini-2.5-flash (Thinking) model demonstrates potential as an assistant in building function annotation; (2) improvements are needed in multi-view understanding for spatially complex buildings; and (3) utilizing RAG technology in the future could enhance performance, but quantifying model confidence deserves further exploration.
Overall, this study not only provides a multimodal fine-grained dataset for building function classification training but also demonstrates that current large models can handle multimodal spatial data, challenging the prevailing concept about their limitations in handling multimodal spatial data. In future work, we will update the dataset, incorporate multimodal inference chains, and expand the regional coverage of BuildingSense.
The supplement related to this article is available online at https://doi.org/10.5194/essd-18-2609-2026-supplement.
P.S.: Conceptualization, Investigation, Methodology, Software, Data Curation, Writing – Original Draft, and Visualization. R.C.: Conceptualization, Methodology, Data Curation, and Writing – Original Draft. H.X.: Data Curation and Writing – Original Draft. W.H.: Conceptualization, Resources, Writing – Review & Editing, Supervision, Funding acquisition, and Project administration. X.D.: Data Curation and Writing – Original Draft. S.L.: Writing – Review & Editing. W.Y.: Writing – Review & Editing. H.W.: Writing – Review & Editing. C.L.: Writing – Review & Editing.
The contact author has declared that none of the authors has any competing interests.
Publisher's note: Copernicus Publications remains neutral with regard to jurisdictional claims made in the text, published maps, institutional affiliations, or any other geographical representation in this paper. The authors bear the ultimate responsibility for providing appropriate place names. Views expressed in the text are those of the authors and do not necessarily reflect the views of the publisher.
This work was supported by the General Program of the National Natural Science Foundation of China (grant no. 42171452). Besides, we extend our sincere gratitude to Weihua Huan and Yan Tang for their professional advice on the language, structure, and logic of the paper.
This research has been supported by the National Natural Science Foundation of China (grant no. 42171452).
This paper was edited by Yuyu Zhou and reviewed by two anonymous referees.
Arribas-Bel, D. and Fleischmann, M.: Spatial signatures – Understanding (urban) spaces through form and function, Habitat Int., 128, 102641, https://doi.org/10.1016/j.habitatint.2022.102641, 2022. a
Azimi, S. M., Henry, C., Sommer, L. W., Schumann, A., and Vig, E.: SkyScapes – Fine-grained semantic understanding of aerial scenes, 2019 IEEE/CVF Int. Conf. Comput. Vis. (ICCV), 7392–7402, https://api.semanticscholar.org/CorpusID:207998372 (last access: 20 February 2026), 2019. a
Bommasani, R., Hudson, D. A., and Ehsan Adeli, E. A.: On the opportunities and risks of foundation models, arXiv [preprint] https://doi.org/10.48550/arXiv.2108.07258, 2022. a
Braun, M., Krebs, S., Flohr, F., and Gavrila, D. M.: EuroCity persons: A novel benchmark for person detection in traffic scenes, IEEE T. Pattern Anal. Mach. Intell., 41, 1844–1861, https://doi.org/10.1109/TPAMI.2019.2897684, 2019. a
Brown, T. B., Mann, B., Ryder, N., Subbiah, M., Kaplan, J., Dhariwal, P., Neelakantan, A., Shyam, P., Sastry, G., Askell, A., Agarwal, S., Herbert-Voss, A., Krueger, G., Henighan, T., Child, R., Ramesh, A., Ziegler, D. M., Wu, J., Winter, C., Hesse, C., Chen, M., Sigler, E., Litwin, M., Gray, S., Chess, B., Clark, J., Berner, C., McCandlish, S., Radford, A., Sutskever, I., and Amodei, D.: Language models are few-shot learners, in: Proceedings of the 34th International Conference on Neural Information Processing Systems, NIPS '20, Curran Associates Inc., Red Hook, NY, USA, ISBN 9781713829546, 2020. a, b
Chen, W., Zhou, Y., Stokes, E. C., and Zhang, X.: Large-scale urban building function mapping by integrating multi-source web-based geospatial data, Geo-Spat. Inf. Sci., 27, 1785–1799, https://doi.org/10.1080/10095020.2023.2264342, 2024. a, b, c
Choi, S. and Yoon, S.: Energy signature-based clustering using open data for urban building energy analysis toward carbon neutrality: A case study on electricity change under COVID-19, Sust. Cities Soc., 92, 104471, https://doi.org/10.1016/j.scs.2023.104471, 2023. a
Cordts, M., Omran, M., Ramos, S., Rehfeld, T., Enzweiler, M., Benenson, R., Franke, U., Roth, S., and Schiele, B.: The cityscapes dataset for semantic urban scene understanding, in: 2016 IEEE Conf. Comput. Vis. Pattern. Recognit. (CVPR), 3213–3223, https://doi.org/10.1109/CVPR.2016.350, 2016. a
Deng, Y., Chen, R., Yang, J., Li, Y., Jiang, H., Liao, W., and Sun, M.: Identify urban building functions with multisource data: A case study in Guangzhou, China, Int. J. Geogr. Inf. Sci., 36, 2060–2085, https://doi.org/10.1080/13658816.2022.2046756, 2022. a, b, c, d
Du, S., Zheng, M., Guo, L., Wu, Y., Li, Z., and Liu, P.: Urban building function classification based on multisource geospatial data: A two-stage method combining unsupervised and supervised algorithms, Earth Sci. Inform., 17, 1179–1201, https://doi.org/10.1007/s12145-024-01250-5, 2024. a, b, c
Geiger, A., Lenz, P., and Urtasun, R.: Are we ready for autonomous driving? The KITTI vision benchmark suite, in: 2012 IEEE Conf. on Comput. Vis. Pattern Recognit.(CVPR), 3354–3361, https://doi.org/10.1109/CVPR.2012.6248074, 2012. a
Griffiths, D. and Boehm, J.: Improving public data for building segmentation from Convolutional Neural Networks (CNNs) for fused airborne lidar and image data using active contours, ISPRS-J. Photogramm. Remote Sens., 154, 70–83, https://doi.org/10.1016/j.isprsjprs.2019.05.013, 2019. a
He, D., Liu, X., Shi, Q., and Zheng, Y.: Visual-language reasoning segmentation (LARSE) of function-level building footprint across Yangtze River Economic Belt of China, Sust. Cities Soc., 127, 106439, https://doi.org/10.1016/j.scs.2025.106439, 2025. a, b, c, d, e, f
He, Z., Yao, W., Shao, J., and Wang, P.: UB-FineNet: Urban building fine-grained classification network for open-access satellite images, ISPRS-J. Photogramm. Remote Sens., 217, 76–90, https://doi.org/10.1016/j.isprsjprs.2024.08.008, 2024. a, b, c, d, e
Hoffmann, E. J., Abdulahhad, K., and Zhu, X. X.: Using social media images for building function classification, Cities, 133, 104107, https://doi.org/10.1016/j.cities.2022.104107, 2023. a, b, c, d, e, f
Johnson, J.: Cities: systems of systems of systems, in: Complexity theories of cities have come of age: An overview with implications to urban planning and design, edited by: Portugali, J., Meyer, H., Stolk, E., and Tan, E., chap. 153–172, Springer Berlin Heidelberg, Berlin, Heidelberg, ISBN 978-3-642-24544-2, https://doi.org/10.1007/978-3-642-24544-2_9, 2012. a
Kong, B., Ai, T., Zou, X., Yan, X., and Yang, M.: A graph-based neural network approach to integrate multi-source data for urban building function classification, Comput. Environ. Urban Syst., 110, 102094, https://doi.org/10.1016/j.compenvurbsys.2024.102094, 2024. a, b, c, d, e
Kun, F., Wanxuan, L., Xiaoyu, L., Chubo, D., Hongfeng, Y., and Xian, S.: A comprehensive survey and assumption of remote sensing foundation modal, National Remote Sensing Bulletin, 28, 1667–1680, https://doi.org/10.11834/jrs.20233313, 2024. a, b
Li, S. and Tang, H.: Multimodal alignment and fusion: A survey, arXiv [preprint], https://doi.org/10.48550/arXiv.2411.17040, 2024. a
Li, W., Meng, L., Wang, J., He, C., Xia, G. S., and Lin, D.: 3D building reconstruction from monocular remote sensing images, in: 2021 IEEE/CVF Int. Conf. Comput. Vis. (ICCV), 12528–12537, https://doi.org/10.1109/ICCV48922.2021.01232, 2021. a
Li, W., Lai, Y., Xu, L., Xiangli, Y., Yu, J., He, C., Xia, G. S., and Lin, D.: OmniCity: Omnipotent city understanding with multi-Level and multi-View images, in: 2023 IEEE/CVF Conf. Comput. Vis. Pattern Recognit. (CVPR), pp. 17397–17407, https://doi.org/10.1109/CVPR52729.2023.01669, 2023. a
Li, W., Yu, J., Chen, D., Lin, Y., Dong, R., Zhang, X., He, C., and Fu, H.: Fine-grained building function recognition with street-view images and GIS map data via geometry-aware semi-supervised learning, Int. J. Appl. Earth Obs. Geoinf., 137, 104386, https://doi.org/10.1016/j.jag.2025.104386, 2025. a, b, c, d, e, f
Ma, Y. Z., Huang, J., Dai, X., Liu, S., Luo, L., Chen, Z., and Yi: HoliCity: A city-scale data platform for learning holistic 3D structures, arXiv [preprint], https://doi.org/10.48550/arXiv.2008.03286 2021. a
Mai, G., Huang, W., Sun, J., Song, S., Mishra, D., Liu, N., Gao, S., Liu, T., Cong, G., Hu, Y., Cundy, C., Li, Z., Zhu, R., and Lao, N.: On the opportunities and challenges of foundation models for GeoAI (Vision Paper), ACM Trans. Spatial Algorithms Syst., 10, 46, https://doi.org/10.1145/3653070, 2024. a, b
Marcus, L. and Koch, D.: Cities as implements or facilities – The need for a spatial morphology in smart city systems, Env. Plan. B-Urban Anal. City Sci., 44, 204–226, https://doi.org/10.1177/0265813516685565, https://doi.org/10.1177/0265813516685565, 2016. a
Memduhoglu, A., Fulman, N., and Zipf, A.: Enriching building function classification using Large Language Model embeddings of OpenStreetMap Tags, Earth Sci. Inform., 17, 5403–5418, https://doi.org/10.1007/s12145-024-01463-8, 2024. a, b, c
Ren, D., Qiu, X., and An, Z.: A multi-source data-driven analysis of building functional classification and its relationship with population distribution, Remote Sens., 16, https://doi.org/10.3390/rs16234492, 2024. a, b, c, d, e, f
Shen, P., Liu, J., and Wang, M.: Fast generation of microclimate weather data for building simulation under heat island using map capturing and clustering technique, Sust. Cities Soc, 71, 102954, https://doi.org/10.1016/j.scs.2021.102954, 2021. a
Su, P., Chen, R., Xu, H., Huang, W., Deng, X., Yan, W., Wu, Hangbin, and Liu C.: BuildingSense-A multimodal building function classification dataset, https://doi.org/10.6084/m9.figshare.30645776.v2, 2025a. a, b, c
Su, P., Yan, Y., Li, H., Wu, H., Liu, C., and Huang, W.: Images and deep learning in human and urban infrastructure interactions pertinent to sustainable urban studies: Review and perspective, Int. J. Appl. Earth Obs. Geoinf., 136, 104352, https://doi.org/10.1016/j.jag.2024.104352, 2025b. a
Sun, J., Zheng, C., Xie, E., Liu, Z., Chu, R., Qiu, J., Xu, J., Ding, M., Li, H., Geng, M., Wu, Y., Wang, W., Chen, J., Yin, Z., Ren, X., Fu, J., He, J., Yuan, W., Liu, Q., Liu, X., Li, Y., Dong, H., Cheng, Y., Zhang, M., Heng, P.-A., Dai, J., Luo, P., Wang, J., Wen, J.-R., Qiu, X., Guo, Y.-C., Xiong, H., Liu, Q., and Li, Z.: A survey of reasoning with foundation models, arXiv [preprint], https://doi.org/10.48550/arXiv.2312.11562, 2023. a, b
The construction wiki contributors: Function, https://www.designingbuildings.co.uk/wiki/Function (last access: 12 September 2025), 2021. a
Wang, S., Bai, M., Mattyus, G., Chu, H., Luo, W., Yang, B., Liang, J., Cheverie, J., Fidler, S., and Urtasun, R.: TorontoCity: Seeing the world with a million eyes, in: 2017 IEEE Int. Conf. Comput. Vis. (ICCV), 3028–3036, https://doi.org/10.1109/ICCV.2017.327, 2017. a
Wang, Y., Zhang, Y., Dong, Q., Guo, H., Tao, Y., and Zhang, F.: A multi-view graph neural network for building age prediction, ISPRS-J. Photogramm. Remote Sens., 218, 294–311, https://doi.org/10.1016/j.isprsjprs.2024.10.011, 2024. a, b, c
Weir, N., Lindenbaum, D., Bastidas, A., Etten, A., Kumar, V., Mcpherson, S., Shermeyer, J., and Tang, H.: SpaceNet MVOI: A multi-view overhead imagery dataset, in: 2019 IEEE/CVF Int. Conf. Comput. Vis. (ICCV), 992–1001, ISBN 2380-7504, https://doi.org/10.1109/ICCV.2019.00108, 2019. a
Wojna, Z., Maziarz, K., Jocz, L., Paluba, R., Kozikowski, R., and Kokkinos, I.: Holistic multi-view building analysis in the wild with projection pooling, Proceedings of the AAAI Conference on Artificial Intelligence, 2870–2878, https://doi.org/10.1609/aaai.v35i4.16393, 2021. a
Xiao, B., Jia, X., Yang, D., Sun, L., Shi, F., Wang, Q., and Jia, Y.: Research on classification method of building function oriented to urban building stock management, Sustainability, 14, 5871, https://doi.org/10.3390/su14105871, 2022. a
Xu, Y., He, Z., Xie, X., Xie, Z., Luo, J., and Xie, H.: Building function classification in Nanjing, China, using deep learning, Trans. GIS, 26, 2145–2165, https://doi.org/10.1111/tgis.12934, 2022. a, b, c
Xu, Z., Zhang, F., Wu, Y., Yang, Y., and Wu, Y.: Building height calculation for an urban area based on street view images and deep learning, Comput.-Aided Civil Infrastruct. Eng., 38, 892–906, https://doi.org/10.1111/mice.12930, 2023. a
Yang, K., Hu, X., Bergasa, L. M., Romera, E., and Wang, K.: PASS: Panoramic annular semantic segmentation, IEEE Trans. Intell. Transp. Syst., 21, 4171–4185, https://doi.org/10.1109/TITS.2019.2938965, 2020. a
Yang, K., Hu, X., and Stiefelhagen, R.: Is context-aware CNN ready for the surroundings? panoramic semantic segmentation in the wild, IEEE Trans. Image Process., 30, 1866–1881, https://doi.org/10.1109/TIP.2020.3048682, 2021. a
Yu, D. and Fang, C.: Urban remote sensing with spatial big data: A review and renewed perspective of urban studies in recent decades, Remote Sens., 15, 1307, https://doi.org/10.3390/rs15051307, 2023. a
Zhang, C., Shi, Q., Zhuo, L., Wang, F., and Tao, H.: Inferring mixed use of buildings with multisource data based on tensor decomposition, ISPRS Int. J. Geo-Inf., 10, 185, https://doi.org/10.3390/ijgi10030185, 2021a. a
Zhang, J., Fukuda, T., and Yabuki, N.: Development of a city-scale approach for facade color measurement with building functional classification using deep learning and street view images, ISPRS Int. J. Geo-Inf., 10, 551, https://doi.org/10.3390/ijgi10080551, 2021b. a, b, c, d
Zhang, X., Liu, X., Chen, K., Guan, F., Luo, M., and Huang, H.: Inferring building function: A novel geo-aware neural network supporting building-level function classification, Sust. Cities Soc., 89, 104349, https://doi.org/10.1016/j.scs.2022.104349, 2023. a, b, c, d, e
Zhang, Y., Zhao, H., and Long, Y.: CMAB: A Multi-Attribute Building Dataset of China, Sci. Data, 12, 430, https://doi.org/10.1038/s41597-025-04730-5, 2025. a, b
Zhao, Y., Wu, B., Li, Q., Yang, L., Fan, H., Wu, J., and Yu, B.: Combining ICESat-2 photons and Google Earth Satellite images for building height extraction, Int. J. Appl. Earth Obs. Geoinf., 117, 103213, https://doi.org/10.1016/j.jag.2023.103213, 2023. a, b
Zheng, Y., Zhang, X., Ou, J., and Liu, X.: Identifying building function using multisource data: A case study of China's three major urban agglomerations, Sust. Cities Soc., 108, 105498, https://doi.org/10.1016/j.scs.2024.105498, 2024. a, b, c, d
Zhou, W., Persello, C., Li, M., and Stein, A.: Building use and mixed-use classification with a transformer-based network fusing satellite images and geospatial textual information, Remote Sens. Environ., 297, 113767, https://doi.org/10.1016/j.rse.2023.113767, 2023. a