the Creative Commons Attribution 4.0 License.
the Creative Commons Attribution 4.0 License.
 | 08 Jan 2026
Austrian NIR soil spectral library for soil health assessments
Julia Fohrafellner
Maximilian Lippl
Armin Bajraktarevic
Andreas Baumgarten
Heide Spiegel
Robert Körner
Taru Sandén
The rise in demand for soil data and information calls for quick and cost-effective methodologies to quantify soil properties. This is particularly important in the realm of restoring soil health in Europe. Near-infrared (NIR) spectroscopy has demonstrated the ability to predict specific soil properties with high accuracy whilst being less costly and time-consuming than traditional methods. To fill gaps in national spectroscopic soil data, we compiled the first Austrian NIR soil spectral library (680–2500 nm) based on legacy samples (n=2129), covering all environmental zones of Austria. We then employed partial least square regression (PLSR) modelling to test the usability of the dataset for soil health assessments at its current stage. Our analysis revealed that the application of the PLSR is not suitable for accurately estimating soil health indicators compared to routine laboratory analysis. Nevertheless, among the 14 soil properties tested, total nitrogen, CaCO3, soil organic carbon and clay exhibited moderate predictive accuracy (R2>0.7). Most importantly, the dataset containing sample meta-data (e.g., land use type, environmental zone or zip code), laboratory reference values and NIR spectra with 1 nm resolution can be used as a foundation for further spectral analysis and modelling. We make this work openly accessible to actively contribute to closing soil data gaps and promote the expansion of soil spectral libraries as a basis for soil health assessments (https://doi.org/10.5281/zenodo.15772618, Fohrafellner et al., 2025).
- Article
(6262 KB) - Full-text XML
- BibTeX
- EndNote


In 2021, the European Commission published the renewed Soil Strategy (European Commission, 2021), in which the vision for healthy soil ecosystems by 2030 was presented. Soil health, defined as “the continued capacity of soils to provide ecological functions for all forms of life, in line with the Sustainable Development Goals and the Green Deal” (European Commission et al., 2020), is still an evolving term and concept. It received heightened attention since the implementation of the EU Mission: A Soil Deal for Europe (European Commission et al., 2020) and particularly the discussed Soil Monitoring Law (European Commission, 2023). Narrowing down the definition of soil health and, most importantly, quantifying it has therefore become a key issue for soil scientists. Characterizing soil health in the form of multiple indicators and creating a “soil health index” (Lehmann et al., 2020) suitable to measure and monitor soil health in the EU (European Commission, 2023; Matson et al., 2024) are pivotal in achieving healthy soils until 2030. Efforts to define such an index are multi-fold (Matson et al., 2024; Wade et al., 2022; Rinot et al., 2019), but generally they agree on including chemical, physical and biological indicators that go beyond crop production to encompass soil ecosystem services (Shen and Teng, 2023). Properties such as soil organic carbon (SOC), soil nutrients, pH or cation-exchange capacity (CEC) are frequently included in soil health assessments (Lehmann et al., 2020). These properties are routinely analyzed in laboratories with traditional methods but are often time-consuming and require resources such as expensive equipment and chemicals. The increasing requirements for soil health assessments and monitoring posed by the Soil Monitoring Law are creating a demand for less cost-intensive alternative methods (Safanelli et al., 2025).
The application of soil visible (vis) and near infrared (NIR) spectroscopy to predict soil properties, particularly chemical ones, using statistical and machine learning methods has increased rapidly in recent decades (Viscarra Rossel et al., 2011; Gholizadeh et al., 2013; Stenberg et al., 2010). Spectroscopy was shown to generate fairly to very accurate estimates of e.g., total carbon (Ma et al., 2023), SOC (Guerrero et al., 2016) and its fractions (Jaconi et al., 2019b), as well as soil texture, specifically clay (Jaconi et al., 2019a), and carbonates (Tavakoli et al., 2023). This approach also bears great potential for soil fertility assessments of total nitrogen (Park et al., 2024) along with total and critical available phosphorus (Recena et al., 2019). Compared to traditional laboratory analyses, spectroscopy has many advantages because it is fast, simple, cost-effective, reproducible, repeatable, non-destructive and environmentally friendly (Viscarra Rossel et al., 2006; Nocita et al., 2015; Soriano-Disla et al., 2013). To improve predictions and fill data gaps, large reference training data sets, so-called soil spectral libraries (SSL), are being built and often made freely available. These extend from local, regional to national and even global scale (FAO, 2022), thereby helping to describe soils and their health whilst improving soil data availability (Cornu et al., 2023). Nevertheless, large areas without available data in the global coverage of NIR SSL remain, calling for active participation to fill these gaps (Viscarra Rossel et al., 2016; Safanelli et al., 2025). This is necessary because the predictive capacity of models relies on the number and diversity of soil samples and conditions represented in the spectra. Concurrently, new methods for coordinating existing SSL are being developed, enabling interoperability between labs, data harmonization, engagement of communities and model development (Safanelli et al., 2025; Peng et al., 2025).
The application of NIR spectroscopy for Austrian soils is limited so far. Beyond sample analysis within the LUCAS inventory (Fernandez Ugalde et al., 2022), Ludwig et al. (2023) tested the suitability of vis-NIR and MIR (mid infrared) spectroscopy for forest soils whilst comparing different modelling approaches. Moreover, the suitability of vis-NIR for measuring soil carbon contents and the effects of agricultural management methods was analyzed by Bieber (2023) on a regional scale. To date, no national SSL for Austria is openly available. By using available legacy soil samples, including their results from chemical and physical analysis, we wanted to fill this gap and analyzed them via NIR spectroscopy. Therefore, the objectives of this study were (i) to provide a first dataset on Austrian NIR soil spectra and reference laboratory analysis for several soil health properties, covering all Austrian environmental zones and (ii) to apply partial least square regression (PLSR) for model calibration and validation and test the model's applicability for national soil health assessments.
The selection of soil samples for the Austrian NIR soil spectral library was based on a wide distribution of soils with different properties to strengthen the dataset usability and predictive power of applied models. The dataset includes legacy soil samples (analyzed and stored in the AGES archive) from several long-term field experiments, different project campaigns and from farmers' land. Moreover, samples from the so-called AGES “soil box” (AGES soil box, 2025), which are sent in by private persons, were included. The soil box allows individuals to have their soils analyzed for common properties such as pH, SOC and phosphorus. These samples are special because they stem from a wide range of land uses including grassland, arable land, forests, orchards, hedges or lawn, but also compost or garden soils. This particularly promotes the diversity of included soils and enhances the geographical distribution and coverage throughout Austria. All included samples were collected between 2016 and 2023 and soil sampling depth ranged between 0 cm down to a maximum of 110 cm (mean: 24.5 cm). This yielded a total of 2129 samples which were considered for the soil spectral library. Most samples represent the Pannonian zone (n=1059), followed by the Continental (n=778), Alpine South (n=286) and Mediterranean Mountains (n=5) zones (Fig. 1). For one sample, the location and environmental zone are unknown (Sample_number 743), hence it is not included in Fig. 1.
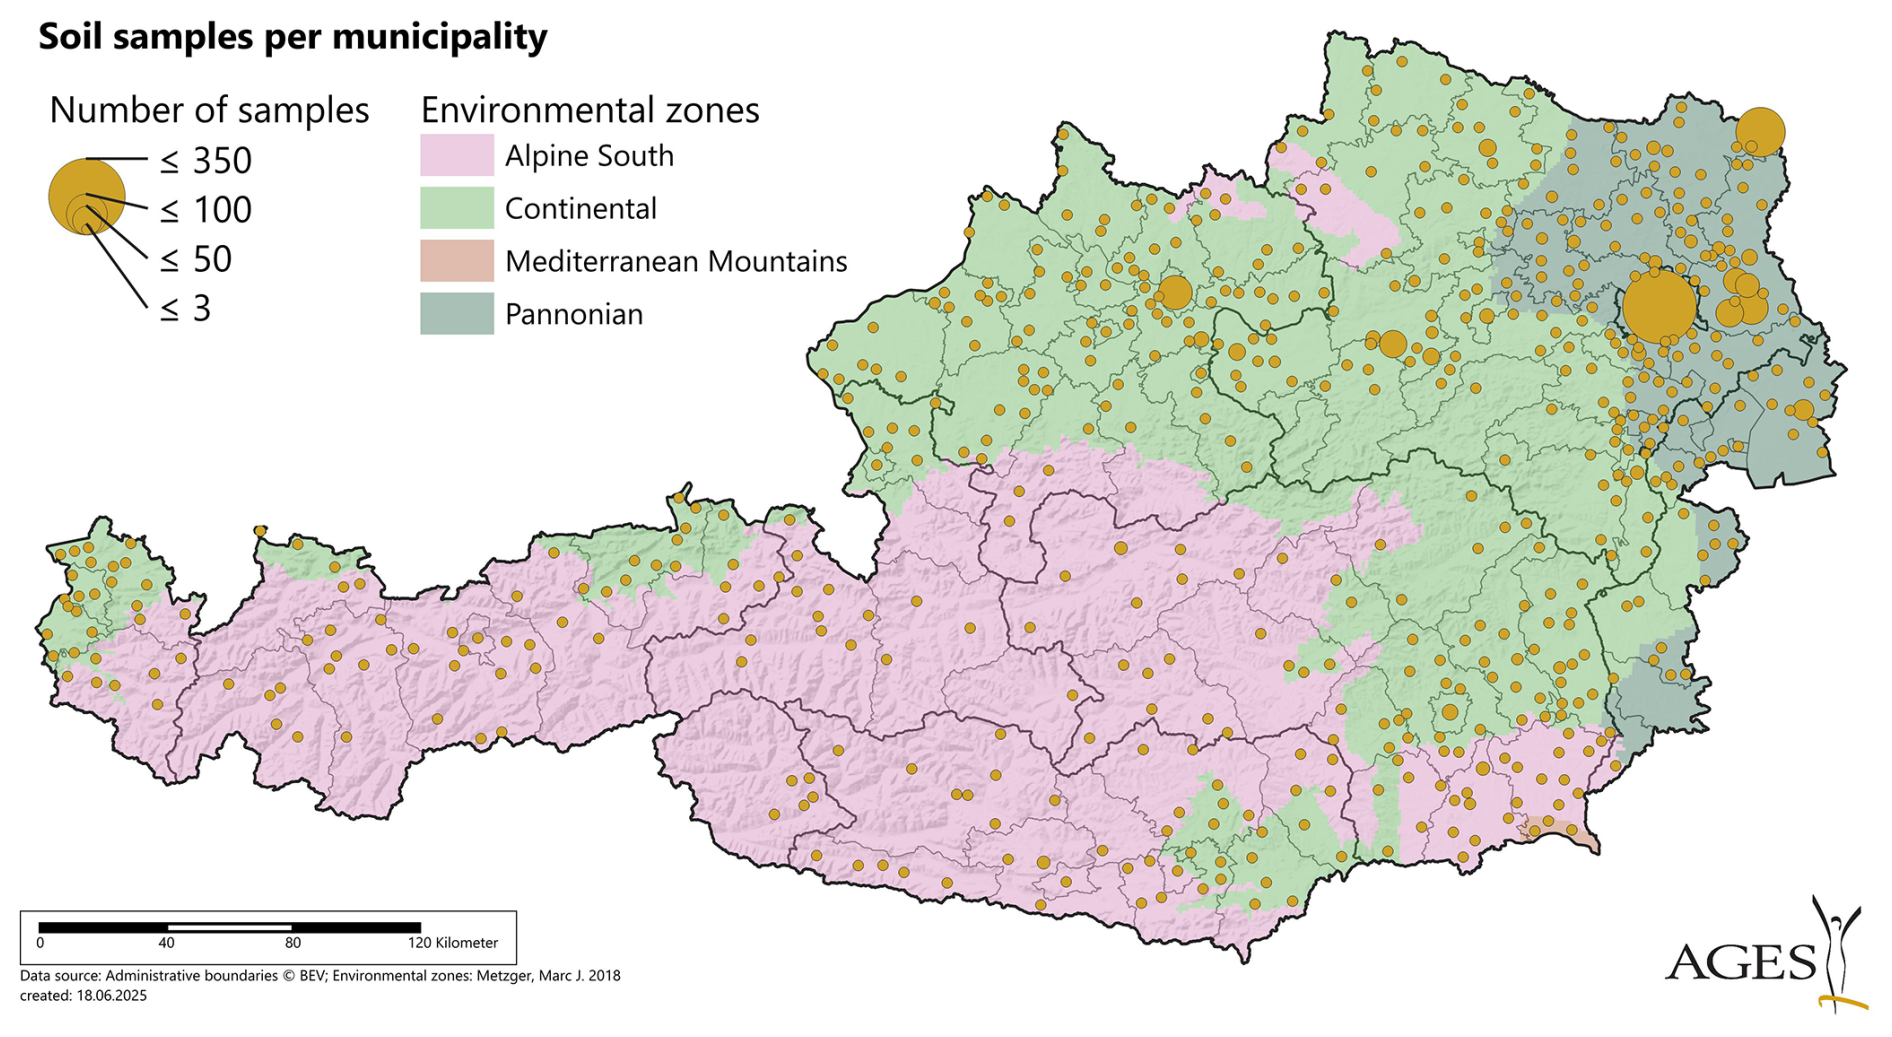
Figure 1The environmental zones in Austria according to Metzger et al. (2018, 2005) with sampling locations of the NIR spectral library (n=2128) sampled between 2016 and 2023. Circle size indicates the number of soil samples per municipality.
Information about the soil samples included in the dataset was extracted from the AGES internal database “LISA”. Missing data regarding zip codes and land-use type was gathered by contacting responsible persons within and outside of AGES. MS Excel© (version 2410) and the statistical programming language R within the RStudio interface (version 2024.04.0) were used for data processing. The dataset contains 1846 columns, of which columns 1 to 11 provide information on the soil sample, columns 12 to 25 contain chemical and physical reference analysis results, and columns 26 to 1846 contain the measured absorbance from 680 to 2500 nm for every nm. Column “Sample_number” assigns each sample a number, starting from one, and column “Sampling_year” shows the year of soil sampling. In column “Experiment_number” the samples were grouped into experiments which indicate that samples were collected on the same site. When several samples were sent in together but originated from different sites (e.g., many sites sampled within one research project), this was indicated by an underscore (e.g., 9_1, 9_2). Column “Sample_source” provides information on the source of the soil sample, e.g. whether it was taken from a long-term experiment (LTE), part of a research project sampling campaign, or submitted by a private person or advisor for analysis. The columns “Zip_code” and “Municipality_code” indicate the location of the sampling site, which in some cases needed to be approximated due to limited location information. For the majority of samples, coordinates were not available, as they were either sent by private individuals and farming advisers, or were taken by other research facilities than AGES. Therefore, only zip and municipality codes are provided in our dataset. The environmental zone (Metzger et al., 2005; Metzger, 2018) of the sampling location is shown in column “Environmental_zone”. Sampling depths (sampling_depth_from and sampling_depth_to) are reported in columns 8 and 9, respectively, and land use types in column 10. Most samples were taken from arable land (n=1485), followed by vegetable plots (n=202) and lawn (n=174). Other land use types (orchards, forests, grassland, hedges, ornamental plants and vineyards) were sampled less than 100 times. For 73 samples the land use type was unknown. Lastly, column 11 indicates whether samples were sent in for analysis with a “soil box”. As these samples are taken and submitted by private individuals, the land use type defined by those individuals might not always be accurate. Finally, such samples may contain artificial substrate, high amounts of compost or fertilizers. Regarding the chemical and physical reference analysis and NIR spectroscopy, the methodologies and results are described in detail in the following sections. The dataset is available at https://zenodo.org/ (last access: 19 December 2025) in the form of an excel file, which is accompanied by document metadata and a legend (Fohrafellner et al., 2025).
4.1 Chemical and physical reference analysis
Chemical and physical soil properties were analyzed in the AGES soil laboratory for all soil samples (Table 1). The samples were air-dried at maximum 40 °C for at least 2 d and sieved through a 2 mm stainless steel sieve (ÖNORM L 1053:2012-04-15). Soil organic carbon (SOC) and total carbon (TC) were analyzed by dry combustion in a LECO TruMac CN (LECO Corp., St. Joseph, MI, United States) at 650 and 1250 °C, respectively (ÖNORM L 1080:2013-03-15). The labile carbon was determined according to Tatzber et al. (2015). The carbonate content (CaCO3) was measured gas-volumetrically according to the “Scheibler method” (CO2 evolution; ÖNORM L 1084:2016-07-01). Total N (TN) was determined via elemental analysis using a LECO Trumac CN at 1250 °C (ÖNORM EN 16168:2012-10-01). Plant available phosphorus (hereafter referred to as “Phosphorus”) was determined by calcium-acetate-lactate (CAL) extraction (ÖNORM L 1087:2012-12-01). Soil pH was measured electrochemically (pH/mV Pocket Meter pH 340i, WTW, Weilheim, Germany) in 0.01 M CaCl2 at a soil-to-solution ratio of 1:5 (ÖNORM EN 15933:2012-10-01) and in calcium acetate (VDLUFA, 1991) to compare the suitability of NIRS to predict the results of these methods. The cation exchange capacity (CEC) was determined by extracting the effective exchangeable cations , K+, , Na+ and , , and H+ in barium chloride solution (ÖNORM L 1086-1:2014-03-15). Texture was determined according to ÖNORM L 1061-2:2002-02-01, and clay was further analyzed by density in soil suspension (ÖNORM EN ISO 17892-4).
Table 1Summary statistics of the measured soil properties of the Austrian NIR soil spectral library for all samples and for the subset of samples with SOC below 7 %. SOC is soil organic carbon, TC is total carbon, TN is total nitrogen, and CEC is the cation exchange capacity.
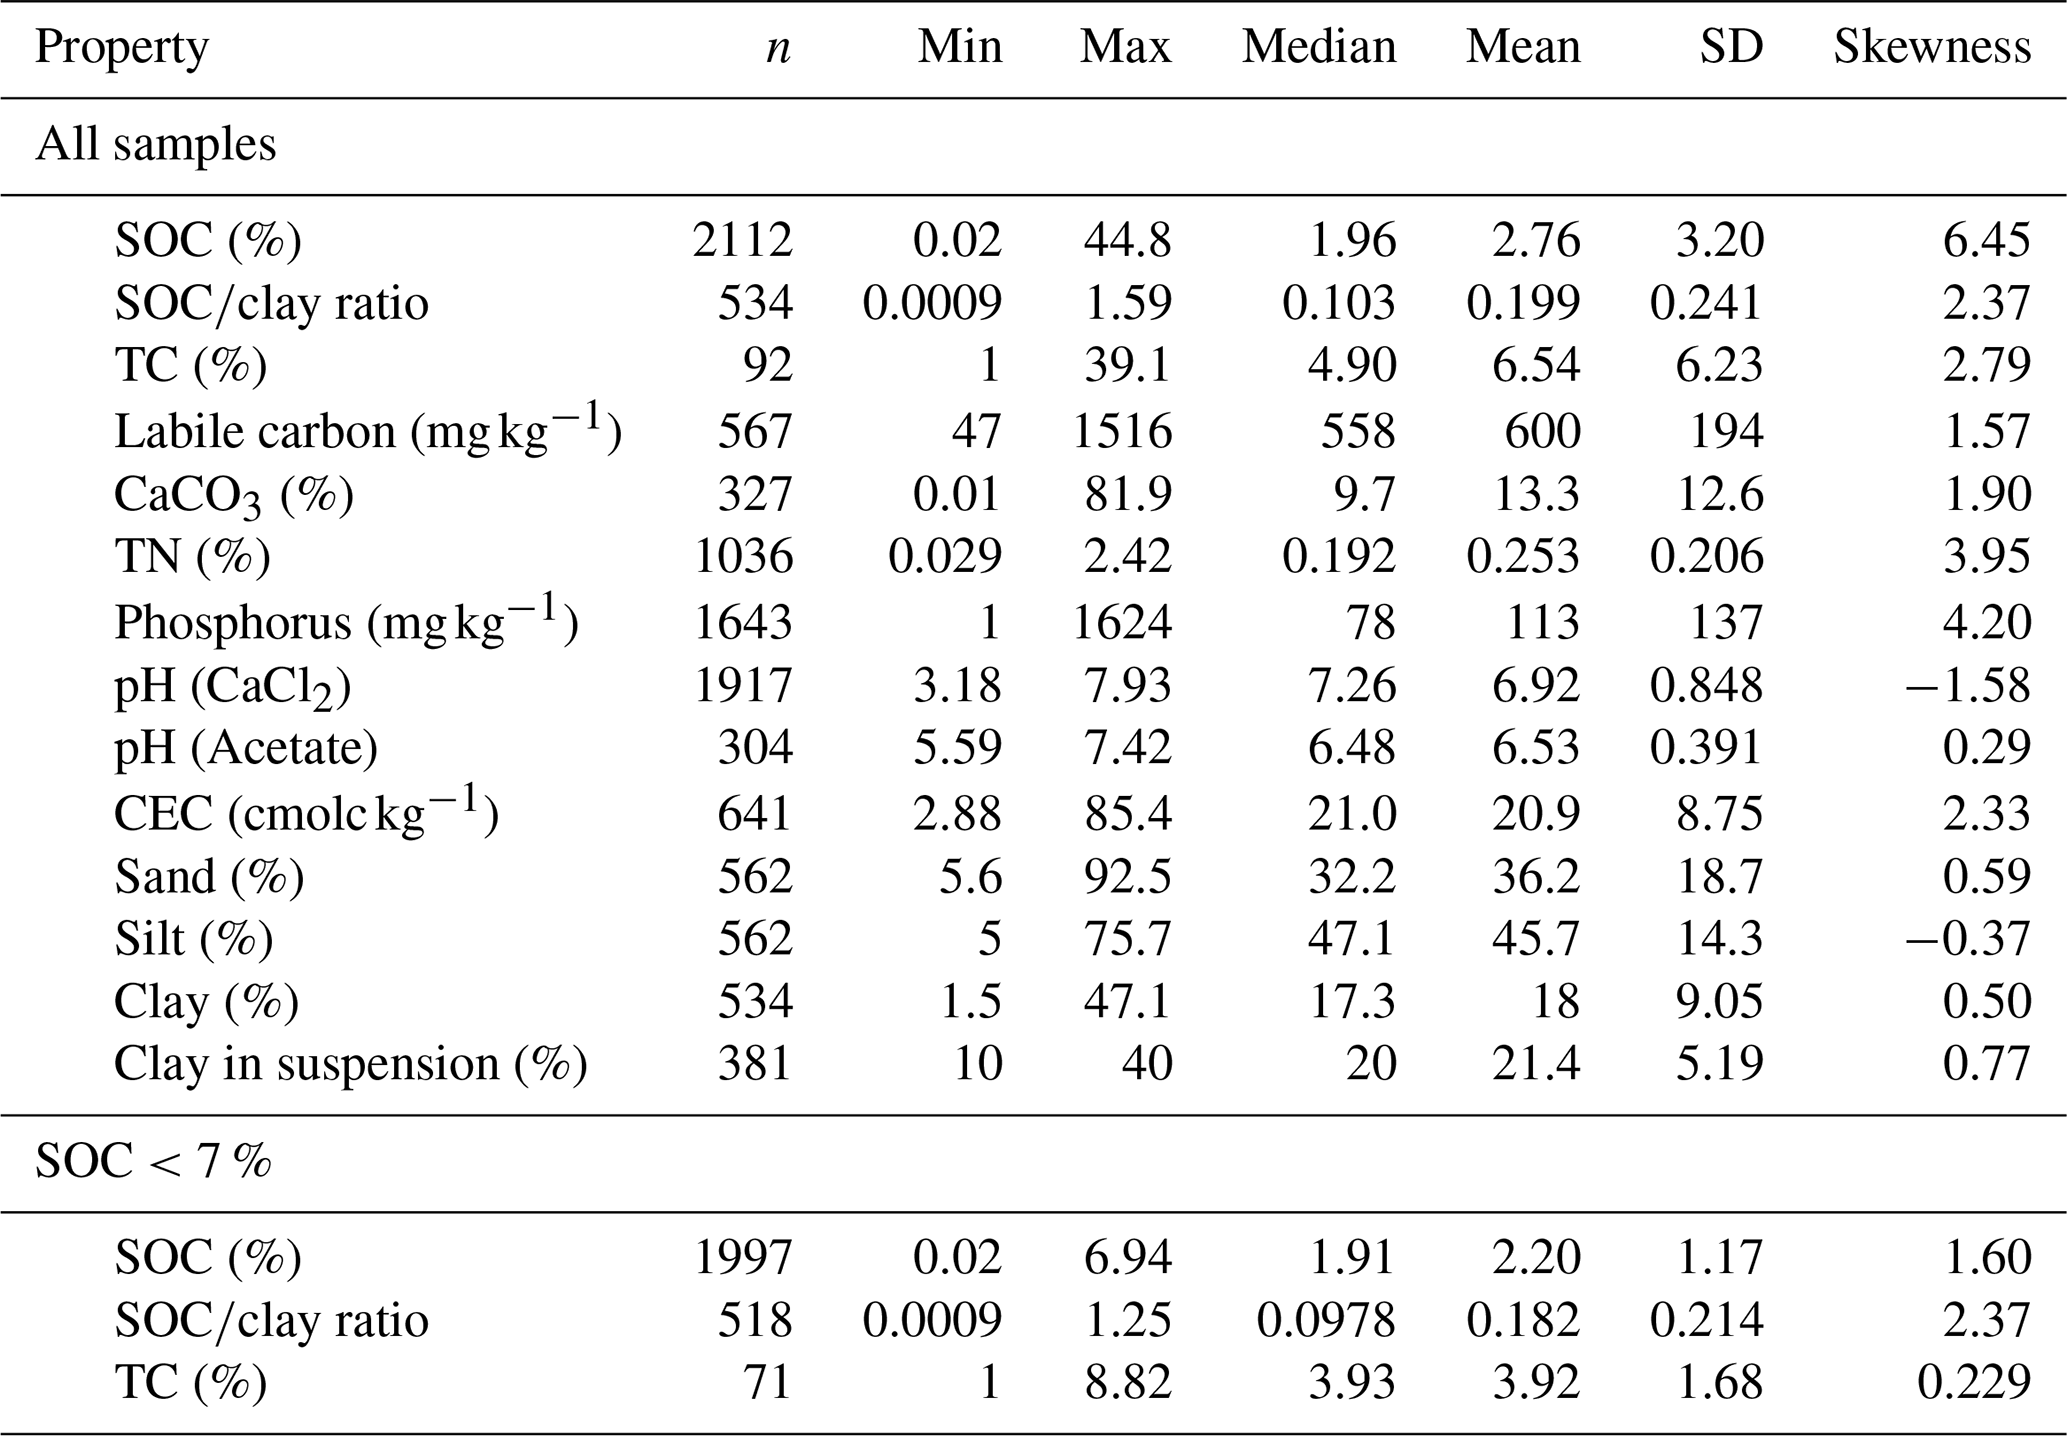
The models for calibration and validation (Sect. 5 “Spectroscopic modelling”) for each soil property were tested with the full range of SOC values, but also with subsets containing only samples with SOC values below 7 %, as this is the upper limit for most agricultural mineral soils in Austria. The modelling results revealed that using only the latter subsets generated better estimates the properties SOC, SOCclay ratio and TC. We therefore provide the summary statistics for these properties using all samples or only samples with less than 7 % SOC (Table 1).
4.2 Spectral measurement and preprocessing
The legacy soil samples from the AGES soil archive were prepared as for previous reference analysis and measured with the SpectraStar™ XL near-infrared spectrometer from Unity Scientific (Brookfield, CT, USA) (Fig. 2) between the range 680 to 2500 nm. This instrument was equipped with 2 detectors and provided a spectral resolution of 1.0 nm, with the sensor switch being between 1340 and 1341 nm. A matte-surface gold-plated metal reflector was used as an internal reference. The sample cup (8.5 cm diameter) was filled up to about one third with a soil sample and covered with the reflective lid, which was pressed slightly onto the sample. Each sample was scanned 24 times, and a mean was calculated. The same soil sample was then transferred to a new sample cup and the scanning was repeated. A mean was calculated from these two repetitions. The standard used was White Sand (Lucky Bay, Australia), which enables harmonizing results from different near-infrared spectrometers used within the ProbeField project.

Figure 2SpectraStar™ XL near-infrared spectrometer from Unity Scientific loaded with a soil sample.
The accompanying UCal™ Chemometric Software (Unity Scientific, Brookfield, CT, USA) was used to pre-process the spectra. The reflectance (R) spectra were converted to absorbance (A) spectra by (Fig. 3). Scatter correction was achieved by standard normal variate (SNV) transformation and detrending (Barnes et al., 1989). The first forward derivative was applied to remove baseline shifts and to increase the resolution of superposed peaks (Duckworth, 2004).

Figure 3Raw near-infrared soil spectra excluding standards (n=2129) with mean spectrum (dark line).
The Kennard–Stone algorithm (Kennard and Stone, 1969) of the “prospectr” package (version 0.2.7) (Stevens and Ramirez-Lopez, 2024) in R Studio (version 2024.04.0) was used for calibration and validation set sampling, as it allows to create sets that have a flat distribution over the spectral space (Stevens and Ramirez-Lopez, 2025). The dataset was split into 80 % calibration and 20 % validation samples. To avoid pseudo-independence of spectra, grouped samples from the same sites were either assigned to the calibration or validation set via the algorithm. Simultaneously, a uniform distribution of samples was ensured by applying the Mahalanobis distance, which first performs a PCA on the input data and computes the Euclidean distance (Stevens and Ramirez-Lopez, 2024). As these settings generated a very small validation set for clay in suspension (n=7), a separate split using only samples with data of this soil property was conducted. Here, the Euclidean distance, which selects points which are the farthest apart from its closest neighbor (Stevens and Ramirez-Lopez, 2024), was used because the Mahalanobis distance requires more samples than individual spectra for point distance computation. The UCal™ Chemometric Software (Unity Scientific, Brookfield, CT, USA) was then used to apply the partial least square regression (PLSR) for model calibration and validation. A maximum of 15 factors were set, and outlier detection and removal were performed by calculating the Mahalanobis distance, which was set to a maximum global distance of 13 and 3 for the calibration and validation sets, respectively. The spectra were trimmed to the range of 780–2400 nm and sensor switches between 1330–1350 nm were removed. After model calibration, predictions were generated based on the validation set for each soil property. Models were tested for all samples or for subsets, i.e., SOC values below 7 %, as described in Sect. 4.1. This was done as the modelling results revealed that using subsets with SOC<7 % generated better estimates of the properties SOC, SOCclay ratio and TC, as it is the upper limit for most agricultural mineral soils in Austria. Statistical measures used to determine the performance of the model were the standard error of prediction (SEP) and the coefficient of determination (R2) from linear regression as well as the ratio of performance to inter-quartile distance (RPIQ) (Bellon-Maurel et al., 2010).
NIR estimates of the 14 soil health indicators (Table 2 and Fig. 4) revealed that PLSR explained total nitrogen contents (TN) best (R2=0.9, SEP=0.05), followed by CaCO3 (R2=0.89, SEP=3.95), soil organic carbon (SOC) (R2=0.82, SEP=0.45) and clay (R2=0.74, SEP=4.35). Nonetheless, the standard error of prediction was large for these properties. This is a common issue in larger-scale spectral libraries because they can comprise a wide range of soils with high mineralogical variability (Nocita et al., 2015; Stenberg et al., 2010), as it is the case for Austria. Regarding SOC, the regression shows that up to concentrations of 4 %, the model predicted SOC well, but with increasing concentrations it underestimated NIR predictions due to the limited number of samples. Such limited numbers of samples for “extreme” values impacted the predictive quality of several other soil parameters, particularly phosphorus or sand content. Although SOC and clay results were sufficient, the SOC-to-clay ratio was not well estimated by the model (R2=0.49, SEP=0.08); only narrow ratios showed good prediction by NIR spectroscopy. For total carbon (TC), only a small sample size for validation (n=30) was available, which nevertheless revealed potential for accurate prediction by NIR (R2=0.68, SEP=1.02). Labile C had few low and high reference values, which impacted the prediction on NIR negatively (R2=0.54, SEP=83.79). When comparing the results for soil pH, pH in acetate achieved better estimates than pH in CaCl2 (R2=0.67, SEP=0.2 and R2=0.61, SEP=0.61, respectively). Phosphorus values above 200 mg kg−1 were underestimated by NIR, yielding overall poor model results (R2=0.2, SEP=82.84). Clay analyzed in suspension had a moderate coefficient of determination (R2=0.58, SEP=2.71). Other soil properties, i.e., cation exchange capacity (CEC), sand and silt, achieved R2 below 0.5.
We also calculated ratio of performance to inter-quartile distance (RPIQ) for all 14 soil health indicators. The proposed threshold for satisfactory model performance of a RPIQ of >1.89 (Ludwig et al., 2019) was used. Based on this metric, CaCO3 (RPIQ=5.06) performed best, followed by TC (RPIQ=3.33), clay (RPIQ=2.52), clay in suspension (RPIQ=2.21), pH in CaCl2 (RPIQ=2.20), SOC (RPIQ=2.09) and TN (RPIQ=1.95). The other properties achieved RPIQs below 1.89. As previously described by Ludwig et al. (2019), it should be acknowledged that the threshold of 1.89 is predicated on the work by Chang et al. (2001), whose values were not based on theory or experiment, and that model performance must be evaluated according to the specific context. When assessing the suitability of NIR as a substitute for routine laboratory measurements, particular attention should be given to the SEP, since even high R2 or RPIQ values cannot compensate for a large SEP that indicates limited precision. Accordingly, we concentrated our assessment on R2 and SEP as key indicators of model performance.
Table 2Validated NIR estimates (780–2400 nm) of 14 soil properties derived from PLSR. SOC is soil organic carbon, TC is total carbon, TN is total nitrogen, CEC is the cation exchange capacity, SEP is the standard error of prediction and GD is the global distance.
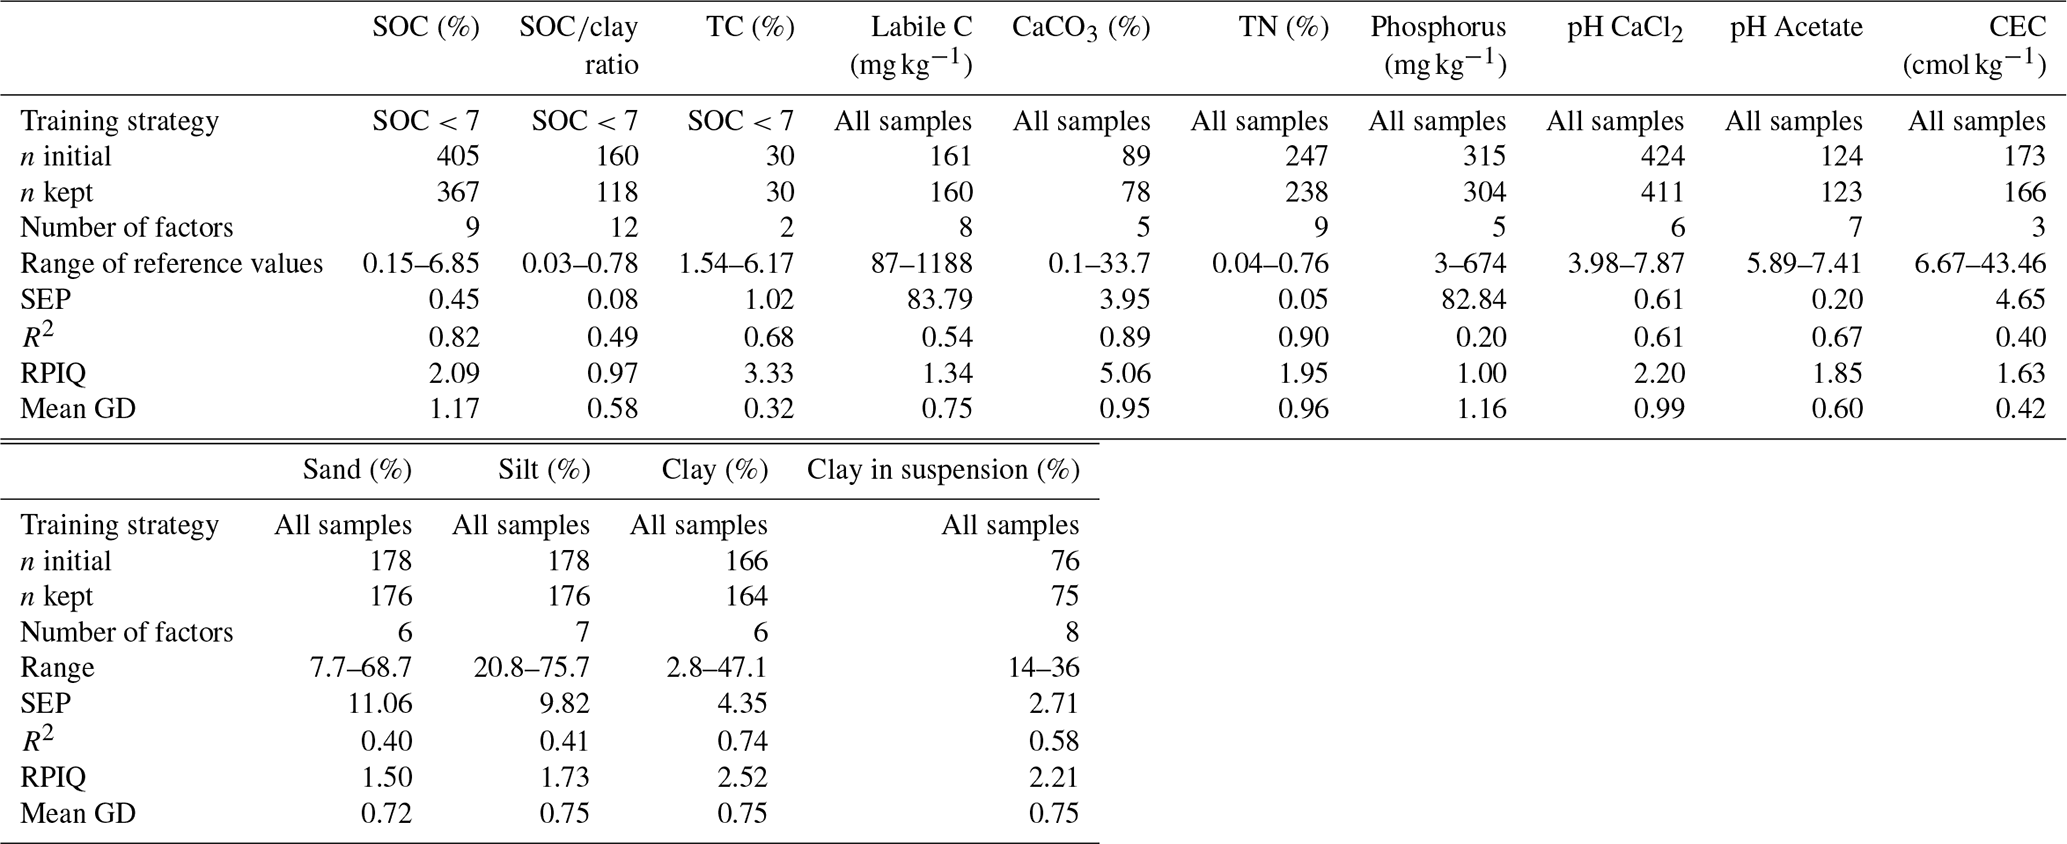
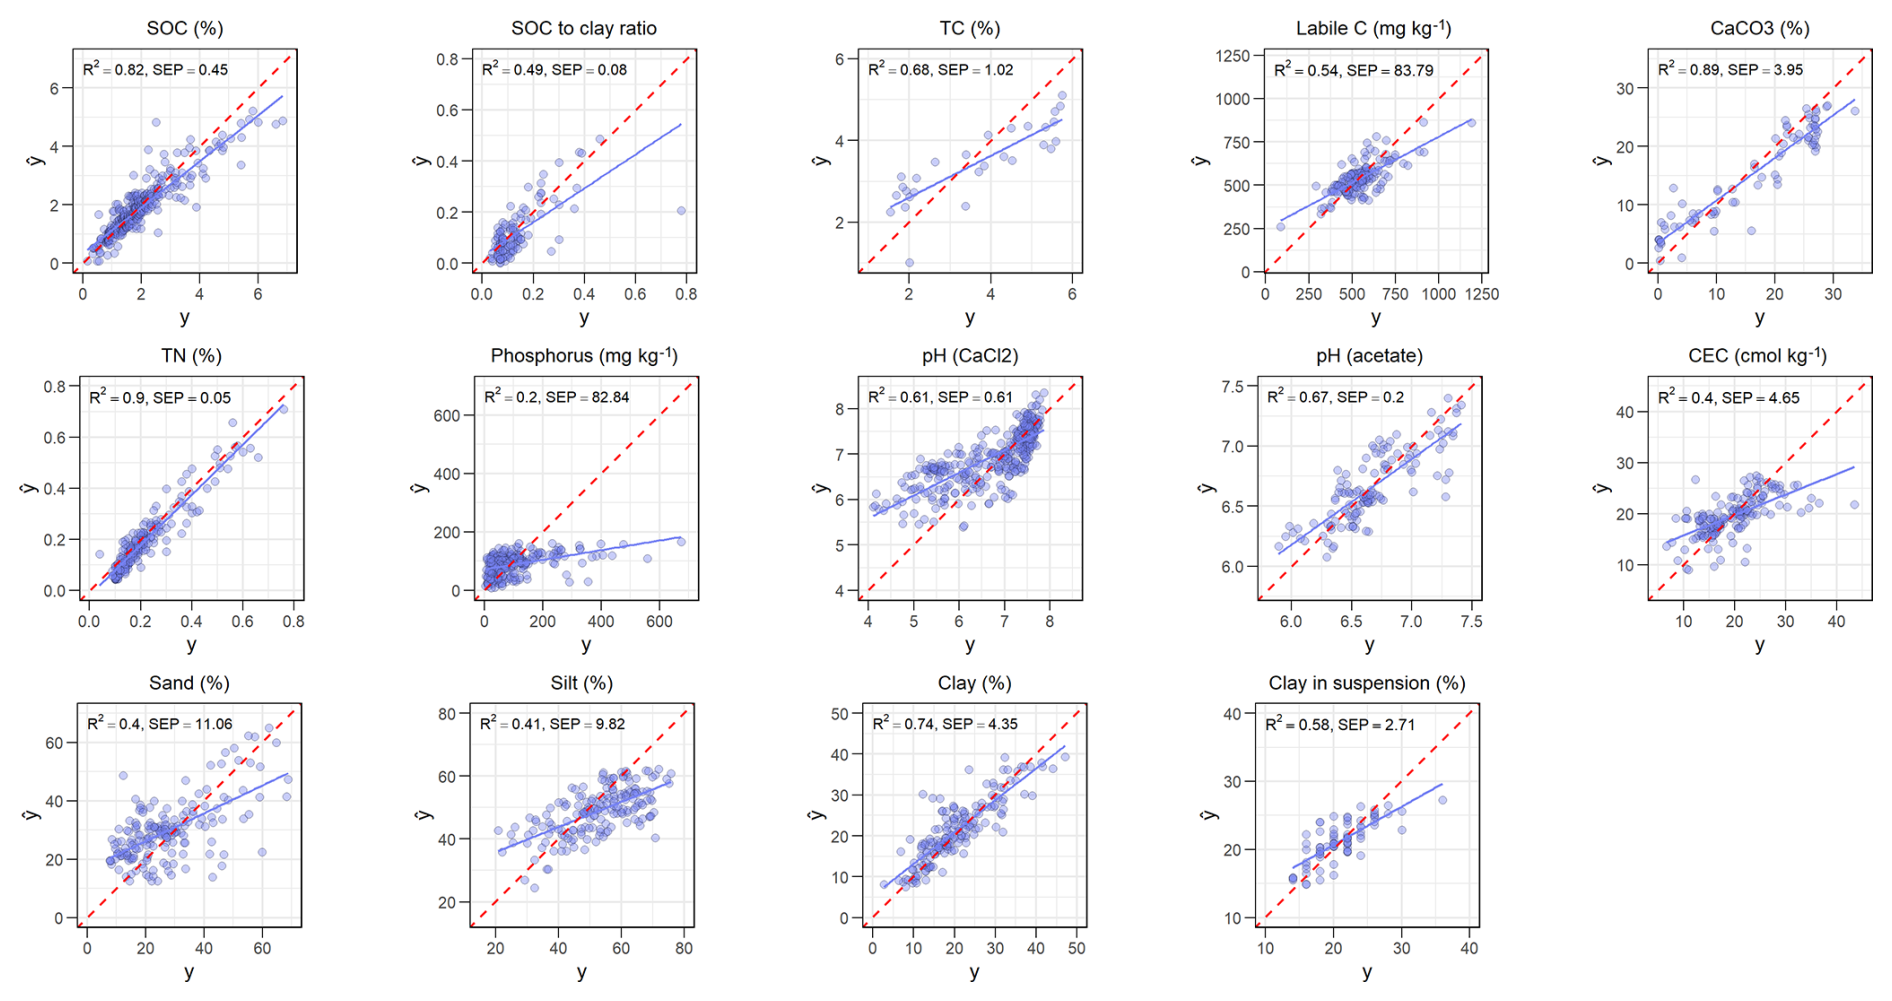
Figure 4Validation of the observed (y) versus predicted () soil properties of the soil spectral library. SOC is soil organic carbon, TC is total carbon, TN is total nitrogen, CEC is the cation exchange capacity and SEP is the standard error of prediction. Blue line is the fitted line, while the red dashed line shows a regression of 1.
The results of data validation show that applying partial least square regression to the Austrian NIR soil spectral library yields estimates of TN, CaCO3, SOC and clay contents with moderate, and other properties with low accuracy. Although several properties were predicted with an R2>0.7, standard errors of prediction were generally high. Considering the applicability for routine soil health analyses and monitoring, the predictive quality is currently insufficient compared to standard laboratory analyses. Nevertheless, in cases where funding is limited or rough estimates are sufficient, the tested models could be of benefit. Other user-cases might include the validation of citizen science data or the estimation of soil texture, as laboratory analysis is a tedious process. Increasing the sample number, particularly in the Alpine South, and including samples with “extreme” values, could improve the predictions and reduce standard errors. Grouping by environmental zones or according to the parent material are further options to assess for model improvement. Testing the performance of other models, particularly more advanced machine learning algorithms such as random forest, cubist, artificial neural networks or support vector regression (Viscarra Rossel et al., 2016; Minasny et al., 2024; Minasny and McBratney, 2008), could further enhance the useability of the Austrian NIR soil spectral library. Lastly, we encourage merging with other SSLs, for example by using transfer functions (e.g., calibration transfer, Feudale et al., 2002, harmonization functions, Francos et al., 2023) or spiking for adaptation of models to the characteristics of the target sites (Guerrero et al., 2016) and using them for developing localized calibration sets for specified contexts and pedologic domains (Viscarra Rossel et al., 2022). A weakness of our dataset is the missing coordinates, which, due to inclusion of soil samples taken by private individuals, farming advisors, and external research organizations, were not available.
The dataset described in this manuscript can be accessed at https://doi.org/10.5281/zenodo.15772618 (Fohrafellner et al., 2025).
We present a first Austrian near-infrared (NIR) soil spectral library with over 2100 legacy samples and test the performance of the partial least square regression (PLSR) to predict 14 chemical and physical soil health indicators. Several properties, i.e., total nitrogen, soil organic carbon, CaCO3 and clay were estimated with moderate accuracy, whereas the potential for predicting other indicators varied. We conclude that applying the PLSR to the Austrian NIR soil spectral library is currently not suitable for precisely estimating soil properties compared to routine laboratory analysis, but that the library presents a valuable foundation for future soil health assessments. Enlarging the spectral library would no doubt improve the predictions, specifically by including extreme values outside of common ranges and by including data from the Alpine South. Moreover, testing novel models using machine learning algorithms to train and validate the spectral library, for example, could improve predictions of soil health indicators. We therefore encourage the use of this open dataset and of merging the spectra with other existing or forthcoming libraries. This effort is an important step forward in supporting the expansion of soil spectral libraries globally, facilitating the amplification of NIR analysis as a fast and simple method to assess, monitor and map soil health.
JF and TS conceptualized and developed the methodology of this paper. JF and AB curated the data. JF conducted formal analysis, developed the model code and visualizations and wrote the original draft. ML conducted formal analysis and validation. RK investigated reference samples. TS acquired funding and administered the project. All authors contributed to writing, reviewing and editing the manuscript.
The contact author has declared that none of the authors has any competing interests.
Publisher's note: Copernicus Publications remains neutral with regard to jurisdictional claims made in the text, published maps, institutional affiliations, or any other geographical representation in this paper. The authors bear the ultimate responsibility for providing appropriate place names. Views expressed in the text are those of the authors and do not necessarily reflect the views of the publisher.
We would like to thank Georg Dersch for planning the sample selection, Michael Schwarz for creating the Austrian map and assisting in data extraction, as well as Günther Aust, Hans-Peter Haslmayr, Florian Forcher and Monika Tulipan for providing meta-data on the soil samples. Moreover, we want to thank Bo Stenberg and Fabio Castaldi for providing advice on this manuscript. Michael Stachowitsch helped with language editing.
This research was conducted within the ProbeField project, which was part of the European Joint Program for SOIL “Towards climate-smart sustainable management of agri-cultural soils” (EJP SOIL) funded by the European Union Horizon 2020 research and innovation programme (grant Agreement no. 862695).
This paper was edited by Sander Veraverbeke and reviewed by José Lucas Safanelli and one anonymous referee.
AGES soil box: https://www.ages.at/en/environment/soil/soil-survey#c6108, last access: 18 July 2025.
Barnes, R. J., Dhanoa, M. S., and Lister, S. J.: Standard Normal Variate Transformation and De-Trending of Near-Infrared Diffuse Reflectance Spectra, Appl. Spectrosc., 43, 772–777, https://doi.org/10.1366/0003702894202201, 1989.
Bellon-Maurel, V., Fernandez-Ahumada, E., Palagos, B., Roger, J.-M., and McBratney, A.: Critical review of chemometric indicators commonly used for assessing the quality of the prediction of soil attributes by NIR spectroscopy, TrAC Trends in Analytical Chemistry, 29, 1073–1081, https://doi.org/10.1016/j.trac.2010.05.006, 2010.
Bieber, M.: VisNIR spectroscopy of agricultural soils for assessing carbon fractions and management practices, Master Thesis, BOKU University, Vienna, https://resolver.obvsg.at/urn:nbn:at:at-ubbw:1-26536 (last access: 19 December 2025), 2023.
Chang, C.-W., Laird, D. A., Mausbach, M. J., and Hurburgh, C. R.: Near-Infrared Reflectance Spectroscopy–Principal Components Regression Analyses of Soil Properties, Soil Science Society of America Journal, 65, 480–490, https://doi.org/10.2136/sssaj2001.652480x, 2001.
Cornu, S., Keesstra, S., Bispo, A., Fantappie, M., van Egmond, F., Smreczak, B., Wawer, R., Pavlů, L., Sobocká, J., Bakacsi, Z., Farkas-Iványi, K., Molnár, S., Møller, A. B., Madenoglu, S., Feiziene, D., Oorts, K., Schneider, F., da Conceição Gonçalves, M., Mano, R., Garland, G., Skalský, R., O'Sullivan, L., Kasparinskis, R., and Chenu, C.: National soil data in EU countries, where do we stand?, Eur. J. Soil Sci., 74, https://doi.org/10.1111/ejss.13398, 2023.
Duckworth, J.: Mathematical data preprocessing, in: Near-Infrared Spectroscopy in Agriculture, edited by: Roberts, C., Workman, J., and Reeves, J., ASA-CSSA-SSSA, Madison, WI., 115–132, https://doi.org/10.2134/agronmonogr44, 2004.
European Commission: EU Soil Strategy for 2030 – Reaping the benefits of healthy soils for people, food, nature and climate, COM/2021/699 final, https://eur-lex.europa.eu/legal-content/EN/ALL/?uri=COM:2021:699:FIN (last access: 19 December 2025), 2021.
European Commission: Proposal for a directive of the European parliament and of the council on soil monitoring and resilience (Soil Monitoring Law), COM/2023/416 final, https://eur-lex.europa.eu/legal-content/EN/TXT/?uri=CELEX:52023PC0416 (last access: 19 December 2025), 2023.
European Commission, Directorate General for Research Innovation, Veerman, C., Pinto Correia, T., Bastioli, C., Biro, B., Bouma, J., Cienciala, E., Emmett, B., Frison, E., Grand, A., Hristov, L., Kriaučiūnienė, Z., Pogrzeba, M., Soussana, J., Vela, C., and Wittkowski, R.: Caring for soil is caring for life – Ensure 75 % of soils are healthy by 2030 for healthy food, people, nature and climate – Interim report of the mission board for soil health and food, Publications Office, https://doi.org/10.2777/918775, 2020.
FAO: A primer on soil analysis using visible and near-infrared (vis-NIR) and mid-infrared (MIR) spectroscopy, Rome, https://doi.org/10.4060/cb9005en, 2022.
Fernandez Ugalde, O., Scarpa, S., Orgiazzi, A., Panagos, P., Van Liedekerke, M., Marechal, A., and Jones, A.: LUCAS 2018 Soil Module. Presentation of dataset and results, Luxembourg, https://doi.org/10.2760/215013, 2022.
Feudale, R. N., Woody, N. A., Tan, H., Myles, A. J., Brown, S. D., and Ferré, J.: Transfer of multivariate calibration models: a review, Chemometr. Intell. Lab., 64, 181–192, https://doi.org/10.1016/S0169-7439(02)00085-0, 2002.
Fohrafellner, J., Lippl, M., Bajraktarevic, A., Baumgarten, A., Spiegel, H., Körner, R., and Sandén, T.: Dataset to: Austrian NIR Soil Spectral Library for Soil Health Assessments (Version 4), Zenodo [data set], https://doi.org/10.5281/zenodo.15772618, 2025.
Francos, N., Heller-Pearlshtien, D., Demattê, J. A. M., Van Wesemael, B., Milewski, R., Chabrillat, S., Tziolas, N., Sanz Diaz, A., Yagüe Ballester, M. J., Gholizadeh, A., Ben-Dor, E., and Lisetskii, F.: A Spectral Transfer Function to Harmonize Existing Soil Spectral Libraries Generated by Different Protocols, Appl. Environ. Soil Sci., 2023, 1–17, https://doi.org/10.1155/2023/4155390, 2023.
Gholizadeh, A., Boruvka, L., Saberioon, M., and Vasat, R.: Visible, near-infrared, and mid-infrared spectroscopy applications for soil assessment with emphasis on soil organic matter content and quality: state-of-the-art and key issues, Appl. Spectrosc., 67, 1349–1362, https://doi.org/10.1366/13-07288, 2013.
Guerrero, C., Wetterlind, J., Stenberg, B., Mouazen, A. M., Gabarrón-Galeote, M. A., Ruiz-Sinoga, J. D., Zornoza, R., and Viscarra Rossel, R. A.: Do we really need large spectral libraries for local scale SOC assessment with NIR spectroscopy?, Soil Till. Res., 155, 501–509, https://doi.org/10.1016/j.still.2015.07.008, 2016.
Jaconi, A., Vos, C., and Don, A.: Near infrared spectroscopy as an easy and precise method to estimate soil texture, Geoderma, 337, 906–913, https://doi.org/10.1016/j.geoderma.2018.10.038, 2019a.
Jaconi, A., Poeplau, C., Ramirez-Lopez, L., Van Wesemael, B., and Don, A.: Log-ratio transformation is the key to determining soil organic carbon fractions with near-infrared spectroscopy, Eur. J. Soil Sci., 70, 127–139, https://doi.org/10.1111/ejss.12761, 2019b.
Kennard, R. W. and Stone, L. A.: Computer Aided Design of Experiments, Technometrics, 11, 137–148, https://doi.org/10.1080/00401706.1969.10490666, 1969.
Lehmann, J., Bossio, D. A., Kogel-Knabner, I., and Rillig, M. C.: The concept and future prospects of soil health, Nat. Rev. Earth Environ., 1, 544–553, https://doi.org/10.1038/s43017-020-0080-8, 2020.
Ludwig, B., Murugan, R., Parama, V. R. R., and Vohland, M.: Accuracy of Estimating Soil Properties with Mid-Infrared Spectroscopy: Implications of Different Chemometric Approaches and Software Packages Related to Calibration Sample Size, Soil Science Society of America Journal, 83, 1542–1552, https://doi.org/10.2136/sssaj2018.11.0413, 2019.
Ludwig, B., Greenberg, I., Vohland, M., and Michel, K.: Optimised use of data fusion and memory-based learning with an Austrian soil library for predictions with infrared data, Eur. J. Soil Sci., 74, https://doi.org/10.1111/ejss.13394, 2023.
Ma, Y., Roudier, P., Kumar, K., Palmada, T., Grealish, G., Carrick, S., Lilburne, L., and Triantafilis, J.: A soil spectral library of New Zealand, Geoderma Reg., 35, https://doi.org/10.1016/j.geodrs.2023.e00726, 2023.
Matson, A., Fantappie, M., Campbell, G. A., Miranda-Velez, J. F., Faber, J. H., Gomes, L. C., Hessel, R., Lana, M., Mocali, S., Smith, P., Robinson, D. A., Bispo, A., van Egmond, F., Keesstra, S., Saby, N. P. A., Smreczak, B., Froger, C., Suleymanov, A., and Chenu, C.: Four approaches to setting soil health targets and thresholds in agricultural soils, J. Environ. Manage., 371, 123141, https://doi.org/10.1016/j.jenvman.2024.123141, 2024.
Metzger, M. J.: The Environmental Stratification of Europe, Datashare [data set], https://doi.org/10.7488/ds/2356, 2018.
Metzger, M. J., Bunce, R. G. H., Jongman, R. H. G., Mücher, C. A., and Watkins, J. W.: A climatic stratification of the environment of Europe, Global Ecol. Biogeogr., 14, 549–563, https://doi.org/10.1111/j.1466-822X.2005.00190.x, 2005.
Minasny, B. and McBratney, A. B.: Regression rules as a tool for predicting soil properties from infrared reflectance spectroscopy, Chemometr. Intell. Lab., 94, 72–79, https://doi.org/10.1016/j.chemolab.2008.06.003, 2008.
Minasny, B., Bandai, T., Ghezzehei, T. A., Huang, Y.-C., Ma, Y., McBratney, A. B., Ng, W., Norouzi, S., Padarian, J., Rudiyanto, Sharififar, A., Styc, Q., and Widyastuti, M.: Soil Science-Informed Machine Learning, Geoderma, 452, https://doi.org/10.1016/j.geoderma.2024.117094, 2024.
Nocita, M., Stevens, A., van Wesemael, B., Aitkenhead, M., Bachmann, M., Barthès, B., Ben Dor, E., Brown, D. J., Clairotte, M., Csorba, A., Dardenne, P., Demattê, J. A. M., Genot, V., Guerrero, C., Knadel, M., Montanarella, L., Noon, C., Ramirez-Lopez, L., Robertson, J., Sakai, H., Soriano-Disla, J. M., Shepherd, K. D., Stenberg, B., Towett, E. K., Vargas, R., and Wetterlind, J.: Soil Spectroscopy: An Alternative to Wet Chemistry for Soil Monitoring, Adv. Agron., 139–159, https://doi.org/10.1016/bs.agron.2015.02.002, 2015.
Park, S., Jeon, S., Kwon, N.-H., Kwon, M., Shin, J.-H., Kim, W.-C., and Lee, J. G.: Application of near-infrared spectroscopy to predict chemical properties in clay rich soil: A review, Eur. J. Agron., 159, https://doi.org/10.1016/j.eja.2024.127228, 2024.
Peng, Y., Ben-Dor, E., Biswas, A., Chabrillat, S., Demattê, J. A. M., Ge, Y., Gholizadeh, A., Gomez, C., Guerrero, C., Herrick, J., Maynard, J. J., Mouazen, A. M., Ma, Y., McBratney, A. B., Minasny, B., Ramirez-Lopez, L., Robertson, A. H. J., Viscarra Rossel, R. A., Shi, Z., Stenberg, B., Wadoux, A. M. J. C., Winowiecki, L. A., and Zhang, G.: Spectroscopic solutions for generating new global soil information, Innov., 6, 100839, https://doi.org/10.1016/j.xinn.2025.100839, 2025.
Recena, R., Fernández-Cabanás, V. M., and Delgado, A.: Soil fertility assessment by Vis-NIR spectroscopy: Predicting soil functioning rather than availability indices, Geoderma, 337, 368–374, https://doi.org/10.1016/j.geoderma.2018.09.049, 2019.
Rinot, O., Levy, G. J., Steinberger, Y., Svoray, T., and Eshel, G.: Soil health assessment: A critical review of current methodologies and a proposed new approach, Sci. Total Environ., 648, 1484–1491, https://doi.org/10.1016/j.scitotenv.2018.08.259, 2019.
Safanelli, J. L., Hengl, T., Parente, L. L., Minarik, R., Bloom, D. E., Todd-Brown, K., Gholizadeh, A., Mendes, W. S., and Sanderman, J.: Open Soil Spectral Library (OSSL): Building reproducible soil calibration models through open development and community engagement, PLoS One, 20, e0296545, https://doi.org/10.1371/journal.pone.0296545, 2025.
Shen, R. F. and Teng, Y.: The frontier of soil science: Soil health, Pedosphere, 33, 6–7, https://doi.org/10.1016/j.pedsph.2022.06.007, 2023.
Soriano-Disla, J. M., Janik, L. J., Viscarra Rossel, R. A., Macdonald, L. M., and McLaughlin, M. J.: The Performance of Visible, Near-, and Mid-Infrared Reflectance Spectroscopy for Prediction of Soil Physical, Chemical, and Biological Properties, Appl. Spectrosc. Rev., 49, 139–186, https://doi.org/10.1080/05704928.2013.811081, 2013.
Stenberg, B., Viscarra Rossel, R. A., Mouazen, A. M., and Wetterlind, J.: Visible and Near Infrared Spectroscopy in Soil Science, Adv. Agron., 163–215, https://doi.org/10.1016/s0065-2113(10)07005-7, 2010.
Stevens, A. and Ramirez Lopez, L.: An introduction to the prospectr package. Documentation for package “prospectr” version 0.2.7, https://search.r-project.org/CRAN/refmans/prospectr/html/00Index.html (last access: 19 December 2025), 2024.
Stevens, A. and Ramirez-Lopez, L.: An introduction to the prospectr package. R package Vignette, R package version 0.2.8., https://cran.r-project.org/web/packages/prospectr/vignettes/prospectr.html (last access: 19 December 2025), 2025.
Tatzber, M., Schlatter, N., Baumgarten, A., Dersch, G., Körner, R., Lehtinen, T., Unger, G., Mifek, E., and Spiegel, H.: KMnO4 determination of active carbon for laboratory routines: three long-term field experiments in Austria, Soil Res., 53, https://doi.org/10.1071/sr14200, 2015.
Tavakoli, H., Correa, J., Sabetizade, M., and Vogel, S.: Predicting key soil properties from Vis-NIR spectra by applying dual-wavelength indices transformations and stacking machine learning approaches, Soil Till. Res., 229, 105684, https://doi.org/10.1016/j.still.2023.105684, 2023.
VDLUFA: Methodenbuch Band 1: Die Untersuchung von Böden, ISBN: 3922712592, 1991.
Viscarra Rossel, R. A., Walvoort, D. J. J., McBratney, A. B., Janik, L. J., and Skjemstad, J. O.: Visible, near infrared, mid infrared or combined diffuse reflectance spectroscopy for simultaneous assessment of various soil properties, Geoderma, 131, 59–75, https://doi.org/10.1016/j.geoderma.2005.03.007, 2006.
Viscarra Rossel, R. A., Chappell, A., De Caritat, P., and McKenzie, N. J.: On the soil information content of visible–near infrared reflectance spectra, Eur. J. Soil Sci., 62, 442–453, https://doi.org/10.1111/j.1365-2389.2011.01372.x, 2011.
Viscarra Rossel, R. A., Behrens, T., Ben-Dor, E., Brown, D. J., Demattê, J. A. M., Shepherd, K. D., Shi, Z., Stenberg, B., Stevens, A., Adamchuk, V., Aïchi, H., Barthès, B. G., Bartholomeus, H. M., Bayer, A. D., Bernoux, M., Böttcher, K., Brodský, L., Du, C. W., Chappell, A., Fouad, Y., Genot, V., Gomez, C., Grunwald, S., Gubler, A., Guerrero, C., Hedley, C. B., Knadel, M., Morrás, H. J. M., Nocita, M., Ramirez-Lopez, L., Roudier, P., Campos, E. M. R., Sanborn, P., Sellitto, V. M., Sudduth, K. A., Rawlins, B. G., Walter, C., Winowiecki, L. A., Hong, S. Y., and Ji, W.: A global spectral library to characterize the world's soil, Earth-Sci. Rev., 155, 198–230, https://doi.org/10.1016/j.earscirev.2016.01.012, 2016.
Viscarra Rossel, R. A., Behrens, T., Ben-Dor, E., Chabrillat, S., Demattê, J. A. M., Ge, Y., Gomez, C., Guerrero, C., Peng, Y., Ramirez-Lopez, L., Shi, Z., Stenberg, B., Webster, R., Winowiecki, L., and Shen, Z.: Diffuse reflectance spectroscopy for estimating soil properties: A technology for the 21st century, Eur. J. Soil Sci., 73, e13271, https://doi.org/10.1111/ejss.13271, 2022.
Wade, J., Culman, S. W., Gasch, C. K., Lazcano, C., Maltais-Landry, G., Margenot, A. J., Martin, T. K., Potter, T. S., Roper, W. R., Ruark, M. D., Sprunger, C. D., and Wallenstein, M. D.: Rigorous, empirical, and quantitative: a proposed pipeline for soil health assessments, Soil Biol. Biochem., 170, https://doi.org/10.1016/j.soilbio.2022.108710, 2022.
- Abstract
- Introduction
- Soil sample selection
- Dataset creation and description
- Analysis of soil
- Spectroscopic modelling
- Model performance
- Usability of the Austrian NIR soil spectral library and recommendations
- Data availability
- Conclusions
- Author contributions
- Competing interests
- Disclaimer
- Acknowledgements
- Financial support
- Review statement
- References