the Creative Commons Attribution 4.0 License.
the Creative Commons Attribution 4.0 License.
 | 23 Mar 2026
Airborne laser scanning transects over Canada's northern forests: lidar plots for science and application
Christopher W. Bater
Joanne C. White
Hao Chen
Piotr Tompalski
Txomin Hermosilla
Michael A. Wulder
Mapping vegetation is required for monitoring the condition of forest resources. Satellite data provide information on land cover and change; however, forest structural attributes are difficult to model without additional measurements from ground plots or airborne laser scanning (ALS, also known as airborne light detection and ranging or lidar) instruments. Over large and inaccessible areas, such as Canada's northern and predominantly unmanaged forests, ground plots are expensive, difficult to install, and unlikely to form a statistically valid probability sample. An alternative means to obtain information regarding forest structure in these situations is samples of ALS (hereafter lidar plots). Transect-based samples of ALS data can be used to provide structural information for the calibration and validation of spatially explicit predictive modelling for wide-area mapping of forest attributes. Here we describe and share data from the recent acquisition and processing of ALS transects across Canada's northern forests. Approximately 55 000 km of ALS transects have been acquired in 2023, 2024, and 2025. Acquisition specifications included minimum swath widths of 500 m (year 2023) or 800 m (2024 and 2025), with a minimum pulse density of 12 pulses m−2. Acquisition flight lines were designed to sample a range of northern forest conditions and to correspond with a concurrent ground plot sampling campaign. Airborne laser scanning data were processed into height-normalized point clouds and reprojected to a custom Lambert conformal conic projection to align with existing national satellite information products. More than 15 million 900 m2 lidar plots were generated from the 2023 transect dataset with point cloud metrics (i.e., area-based statistical summaries of the ALS point cloud) calculated for each 30 m by 30 m cell. Presently, the 2023 lidar plots and their associated point cloud metrics are stored in openly available SQLite GeoPackages, with additional annual transect collections to be added as available. To accommodate a wide range of users and applications, both comprehensive and abridged versions of the metric databases, with 369 metrics and 40 metrics, respectively, are shared. The framework underlying this dataset is fully transferable to other regions with comparable information needs. The flexible data structure used allows seamless integration of additional open-access ALS transect data as new acquisitions and processing become available. By providing detailed, scalable measurements that bridge the gap between ground observations and wall-to-wall satellite information products, this open-access resource empowers both the scientific and operational forestry communities. These data will drive the development of enhanced wildfire fuels maps, comprehensive forest inventories, and robust carbon products, supporting informed decision making and advancing sustainable forest management. The 2023 lidar plots and point cloud metrics described here are available at https://doi.org/10.5281/zenodo.16782860 on Zenodo (Bater et al., 2025).
- Article
(5324 KB) - Full-text XML
-
Supplement
(775 KB) - BibTeX
- EndNote


Vegetation structure underpins a range of ecological, social, and economic forest values, including timber harvesting, carbon sequestration, biodiversity, water quality, and wildfire fuels (Haslem et al., 2011; Keith et al., 2009; Tews et al., 2004). Medium resolution satellite remote sensing (i.e., pixels sided 10–100 m) has proven effective for the wall-to-wall mapping of land cover (Hermosilla et al., 2022; Vogelmann et al., 2001), monitoring disturbance and recovery (Hansen et al., 2014; White et al., 2017b), and more recently modelling attributes such as species (Hermosilla et al., 2024). The characterization of vegetation structure, however, can be modeled using pixel-based, optical remotely sensed data (Coops et al., 2021), but not with the accuracies possible using light detection and ranging (lidar) technologies, particularly airborne laser scanning (ALS). It is not entirely fair to compare optical satellite remote sensing and ALS due to their differences in data costs to the end user, the level of detail captured, and the intensity and repeatability of collection (Fassnacht et al., 2024). However, ALS provides access to simultaneous measurements of the vertical distribution of vegetation and the underlying terrain morphology (Lefsky et al., 2002), providing critical information on forest complexity and condition that cannot be obtained through other remote sensing methods.
Investigations related to ALS and forest measurement have been ongoing since the 1980s (Aldred and Bonnor, 1985; Nelson, 2013), and by the early 2000s the technology was recognized as a robust tool for estimating inventory attributes related to vegetation structure (Næsset, 2004; Reutebuch et al., 2005; Wulder et al., 2008). Given the high cost and limited access to airborne lidar instruments in the early years, many initial investigations adopted probability sampling approaches to efficiently obtain representative data (Wulder et al., 2012b). In contrast, today many Canadian jurisdictions are actively collecting wall-to-wall ALS data to support the development of enhanced forest inventories; however, data acquisitions are typically focused on managed forests in the south, leaving remote, northern forests underrepresented (White et al., 2025). Stinson et al. (2019) define forest management status in Canada using ownership, protection status, and tenure as these three characteristics are “… related to forest management interests, governance and objectives in a generalized way across all Canadian jurisdictions” (p. 103). Definitions of managed forest are different for carbon accounting purposes wherein unmanaged forests are excluded from reporting requirements (Ogle et al., 2018). Although they are not actively managed, northern forests are critical to the aforementioned forest values. The federal government reports on all forests, both managed and unmanaged, as implemented through the National Forest Inventory program and communicated via the annual State of the Forests report (Natural Resources Canada, 2023). As Canada's mean annual temperature has increased at more than twice the global rate (Bourdeau-Goulet and Hassanzadeh, 2021), northern forests are particularly vulnerable to increased wildfire risk (Burton, 2023; Parisien et al., 2023), further underscoring the need to improve available information for these forests.
Although typically flown in a wall-to-wall configuration, ALS data may be collected as sampled linear transects to extend structural information over remote areas where continuous, wall-to-wall coverage is impractical. Wulder et al. (2012b) described lidar sampling as a cost-effective alternative to wall-to-wall lidar acquisition for large-area forest monitoring. The authors demonstrated that statistically sound sampling and inference methods can enable robust characterizations of forest structure, and that integration of lidar samples with field and satellite data can enhance scalability and precision of estimates. For example, Andersen et al. (2011) presented a methodology for estimating forest biomass over a large area of interior Alaska. The authors used a combination of ground plots and sampled ALS transects to achieve reasonable precision, underscoring the cost-efficiency of integrating partial airborne lidar coverage. Also working in Alaska, Babcock et al. (2018) demonstrated that sparse lidar transects, when fused with field plots and Landsat tree cover in a Bayesian geostatistical framework, can yield wall-to-wall biomass maps with quantified uncertainty. Nelson et al. (2012) used an airborne profiling lidar to estimate forest biomass in Norway and found that the results were similar to those obtained through ground surveys. Building on this logic, Margolis et al. (2015) employed a three-phase sampling design combining ground plots, airborne profiling lidar, and ICESat-GLAS satellite lidar data to estimate biomass across the North American boreal forest.
Wulder et al. (2012a) proposed the concept of lidar plots, wherein lidar transect data, augmented by ground plot information, provide sample-based characterizations of forest structure. Lidar plot locations are established within sampled lidar transect swaths at a spatial resolution matching the typical size (area) of tall tree ground plots or the pixel size of medium spatial resolution remotely sensed data (e.g., pixels sized 400–900 m2). The ALS data are processed to generate a suite of summary statistics or metrics that characterize the point cloud within each lidar plot (e.g., mean height, maximum height, percentiles of height). Using an area-based approach (ABA) (Næsset, 2002; White et al., 2013), a sample of co-located ground plot measurements are then used with the point cloud metrics to generate predictions of inventory attributes of interest such as height, basal area, volume, or biomass, among others. These lidar plots, with associated metrics and attributes, may then be linked to other remotely sensed data (e.g., optical time series) via imputation, enabling the generation of spatially exhaustive and spatially explicit models of forest structure ultimately resulting in maps representing large areas (Coops et al., 2021; Wulder et al., 2012a).
In a proof-of-concept study, Zald et al. (2016) demonstrated how lidar plots could be used as a surrogate for ground plots to map a suite of point cloud height (mean, standard deviation, coefficient of variation, 95th percentile) and cover metrics (percentage of first returns > 2 m, percentage of first returns >mean height), as well as select forest inventory attributes (Lorey's tree height, basal area, gross stem volume, and total aboveground biomass) for a ∼ 38 million ha forest region in Saskatchewan, Canada for the year 2010 (corresponding to the year of ALS acquisition). Zald et al. (2016) availed upon 1560 km of lidar transects and a set of 4340 lidar plots to impute point cloud metrics directly, with the ABA forest attributes carried as ancillary variables in the plot-matching process. Expanding on this approach, Matasci et al. (2018a) employed > 25 000 km of lidar transects and 80 687 lidar plots with Landsat surface reflectance composites to produce boreal-wide maps (∼ 552 million ha) of the same point cloud metrics and forest structural attributes as Zald et al. (2016) for the year 2010. Matasci et al. (2018b) further extended this approach in both space and time, mapping forest structure annually for the entirety of Canada's forested ecosystems (∼ 650 million ha) for each year from 1984 to 2016. Matasci et al. (2018b) availed upon seven different lidar acquisitions and associated lidar plots (n = 84 482) to achieve national, annual maps of forest structure, thereby enabling characterization of structural dynamics in both disturbed and undisturbed forests over the three-decade period considered. Matasci et al. (2018b) also used a completely independent set of lidar plots, derived from separate lidar acquisitions to validate the imputed attributes, both spatially and temporally. Collectively, these studies demonstrate the utility of ALS sampling and lidar plots in generating spatially and temporally rich forest structural information at landscape to continental scales.
1.1 Motivation
Canada's boreal forests and the communities therein are increasingly exposed to wildfire risks (Parisien et al., 2020), yet many northern and remote regions lack detailed vegetation inventories essential for fire behavior modeling (Crowley et al., 2023; Parisien et al., 2020; Stinson et al., 2019). In these areas outside of the managed forest zone, accurate information on forest structure and fuel properties is limited, constraining the capacity to assess risk or plan mitigation strategies (Crowley et al., 2023). Further, the ongoing development of the next generation Canadian Forest Fire Danger Rating System (CFFDRS-2025) will incorporate new data sources and requires that a new suite of vegetation and soil attributes be modelled (Canadian Forest Service Fire Danger Group, 2021). Addressing this data gap requires spatially explicit maps of key forest structural attributes such as canopy bulk density and canopy base height which may be estimated using ALS (Andersen et al., 2005; Martin-Ducup et al., 2025; Moran et al., 2020; Riaño et al., 2004), but cannot be reliably derived from satellite imagery alone (Mutlu et al., 2008; Riaño et al., 2003) and which are equally difficult to estimate in the field (Keane et al., 2005).
To support this need, the Government of Canada via the Canadian Forest Service launched the Northern Forest Mapping program (NorthForM). Between 2023 and 2025, this initiative is acquiring ALS transects and coincident ground plot data (Boucher et al., 2024), with the goal of modeling fuel-related forest structure attributes for wall-to-wall mapping using satellite imagery (Coops et al., 2021). These methods build upon earlier work by the National Terrestrial Ecosystem Monitoring System (NTEMS), which was developed to monitor Canada's forested ecosystems on an annual basis using consistent, nationally available datasets (White et al., 2014; Wulder et al., 2024). The NTEMS relies primarily on medium spatial resolution satellite data (initially solely Landsat, now augmented with Sentinel 2) time series, integrated with ALS transects and ground plots, to generate national information products characterizing disturbance, land cover, and forest structure (Hermosilla et al., 2016). The first national lidar transect dataset was collected in 2010 to support NTEMS product development (Hopkinson et al., 2011; Wulder et al., 2012a), and subsequent work has shown that combining these data sources enables spatially comprehensive estimates of both forest structure and derived attributes (Matasci et al., 2018a, b; Zald et al., 2016)
1.2 Objectives
Herein, we describe the acquisition and processing of ALS transect data for Canada's northern forests, and the subsequent generation of 30 m lidar plots and ABA point cloud metrics. These data are being shared in an open repository to support the development of models needed for generating wall-to-wall predictions of attributes relevant for characterizing forest structure and informing forest fuels mapping.
2.1 Canada's northern forests
Canada's unmanaged northern forests represent some of the largest natural treed ecosystems on Earth. Spanning northern Quebec, Ontario, Manitoba, Saskatchewan, Alberta, and significant portions of the Yukon and Northwest Territories, they are mostly free of large-scale industrial land uses such as forestry. Unlike managed forests to the south, these ecosystems are shaped primarily by natural disturbances such as wildfires and insect outbreaks, although the anthropogenic footprint is expanding in some areas (Wells et al., 2020). Tree species are cold-tolerant, primarily within the genera Abies, Larix, Picea, and Pinus, but also include Populus and Betula. Northern forests and treed areas are part of a larger mosaic which includes lakes, rivers, and wetlands, treeless alpine areas, maritime heathlands, and occasional grasslands (Brandt, 2009).
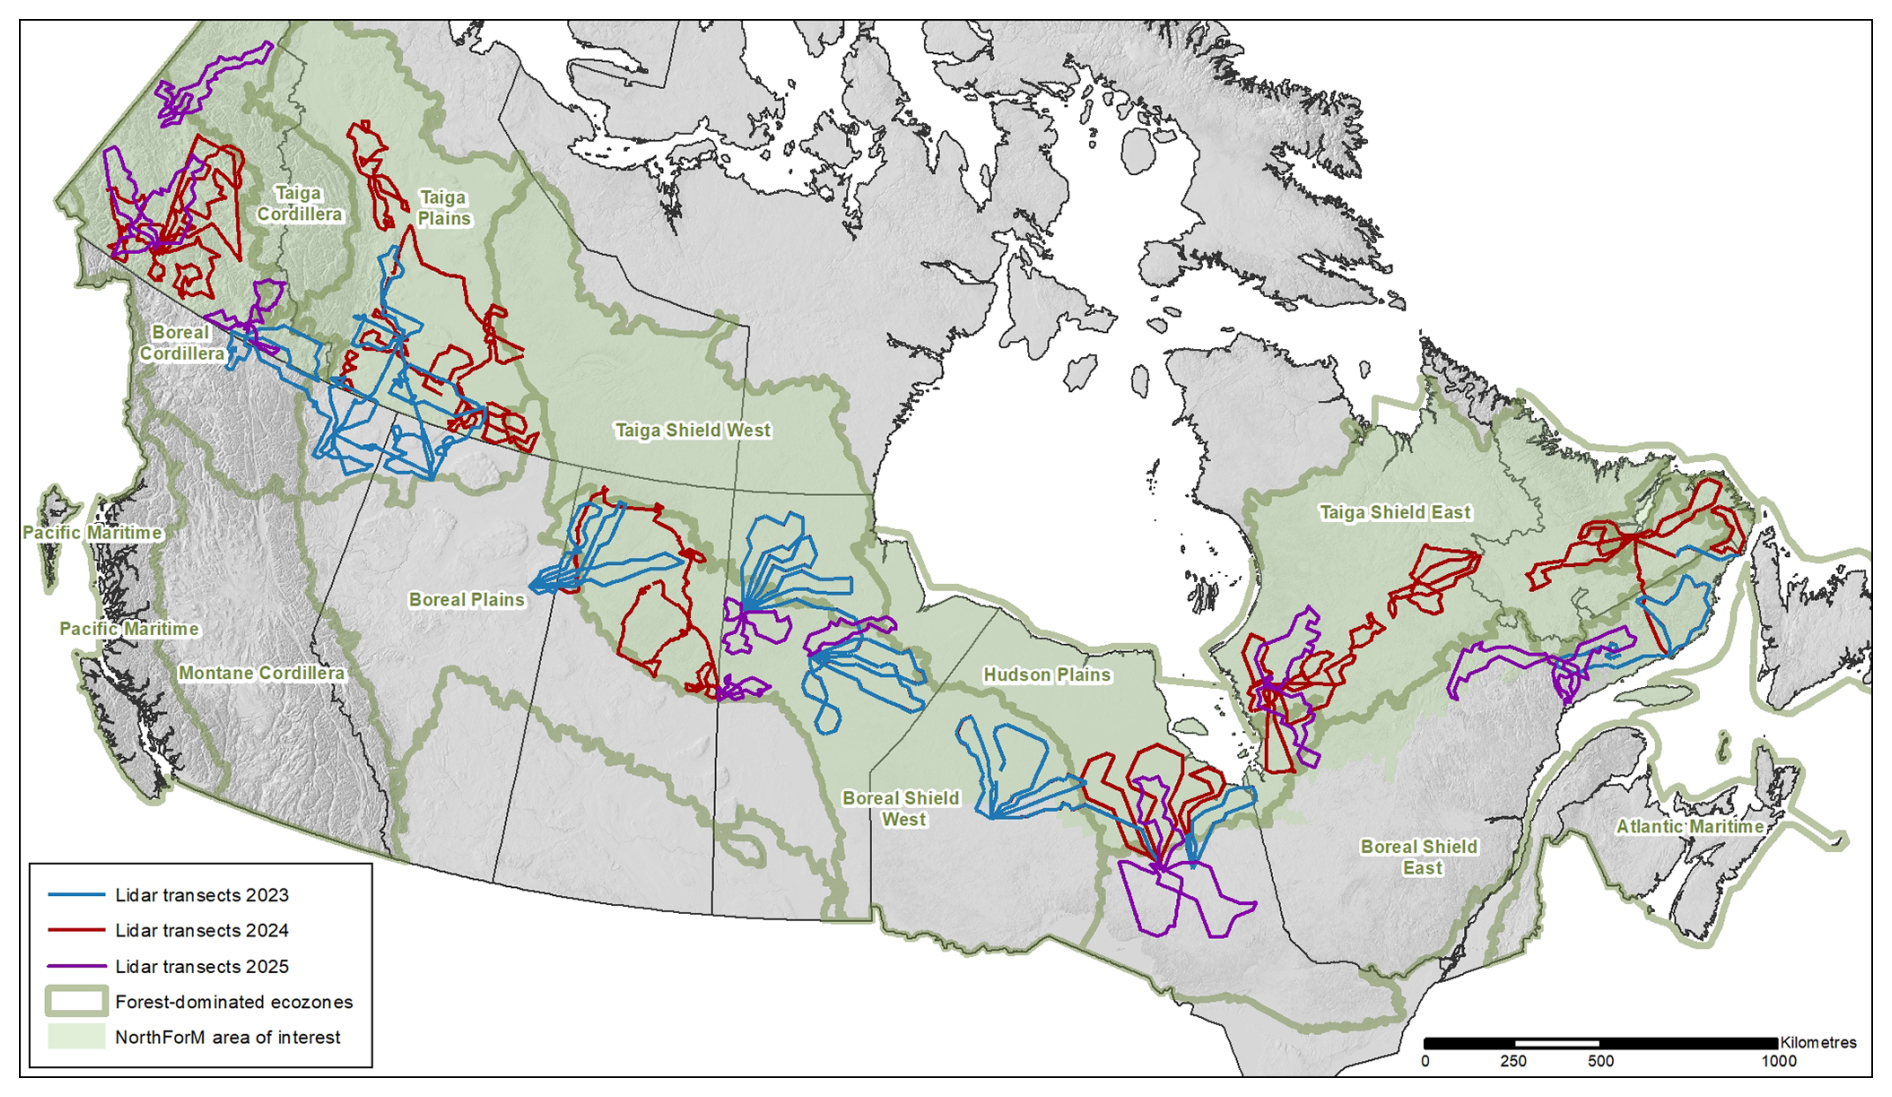
Figure 1Airborne laser scanning (ALS) transects flown in 2023 (∼ 20 000 km), 2024 (∼ 23 000 km), and 2025 (∼ 12 000 km). The Northern Forest Mapping (NorthForM) acquisitions were largely focused on northern ecozones to improve mapping in unmanaged forests.
Table 1Summary of ALS acquisition specifications for the 2023–2025 acquisition program.
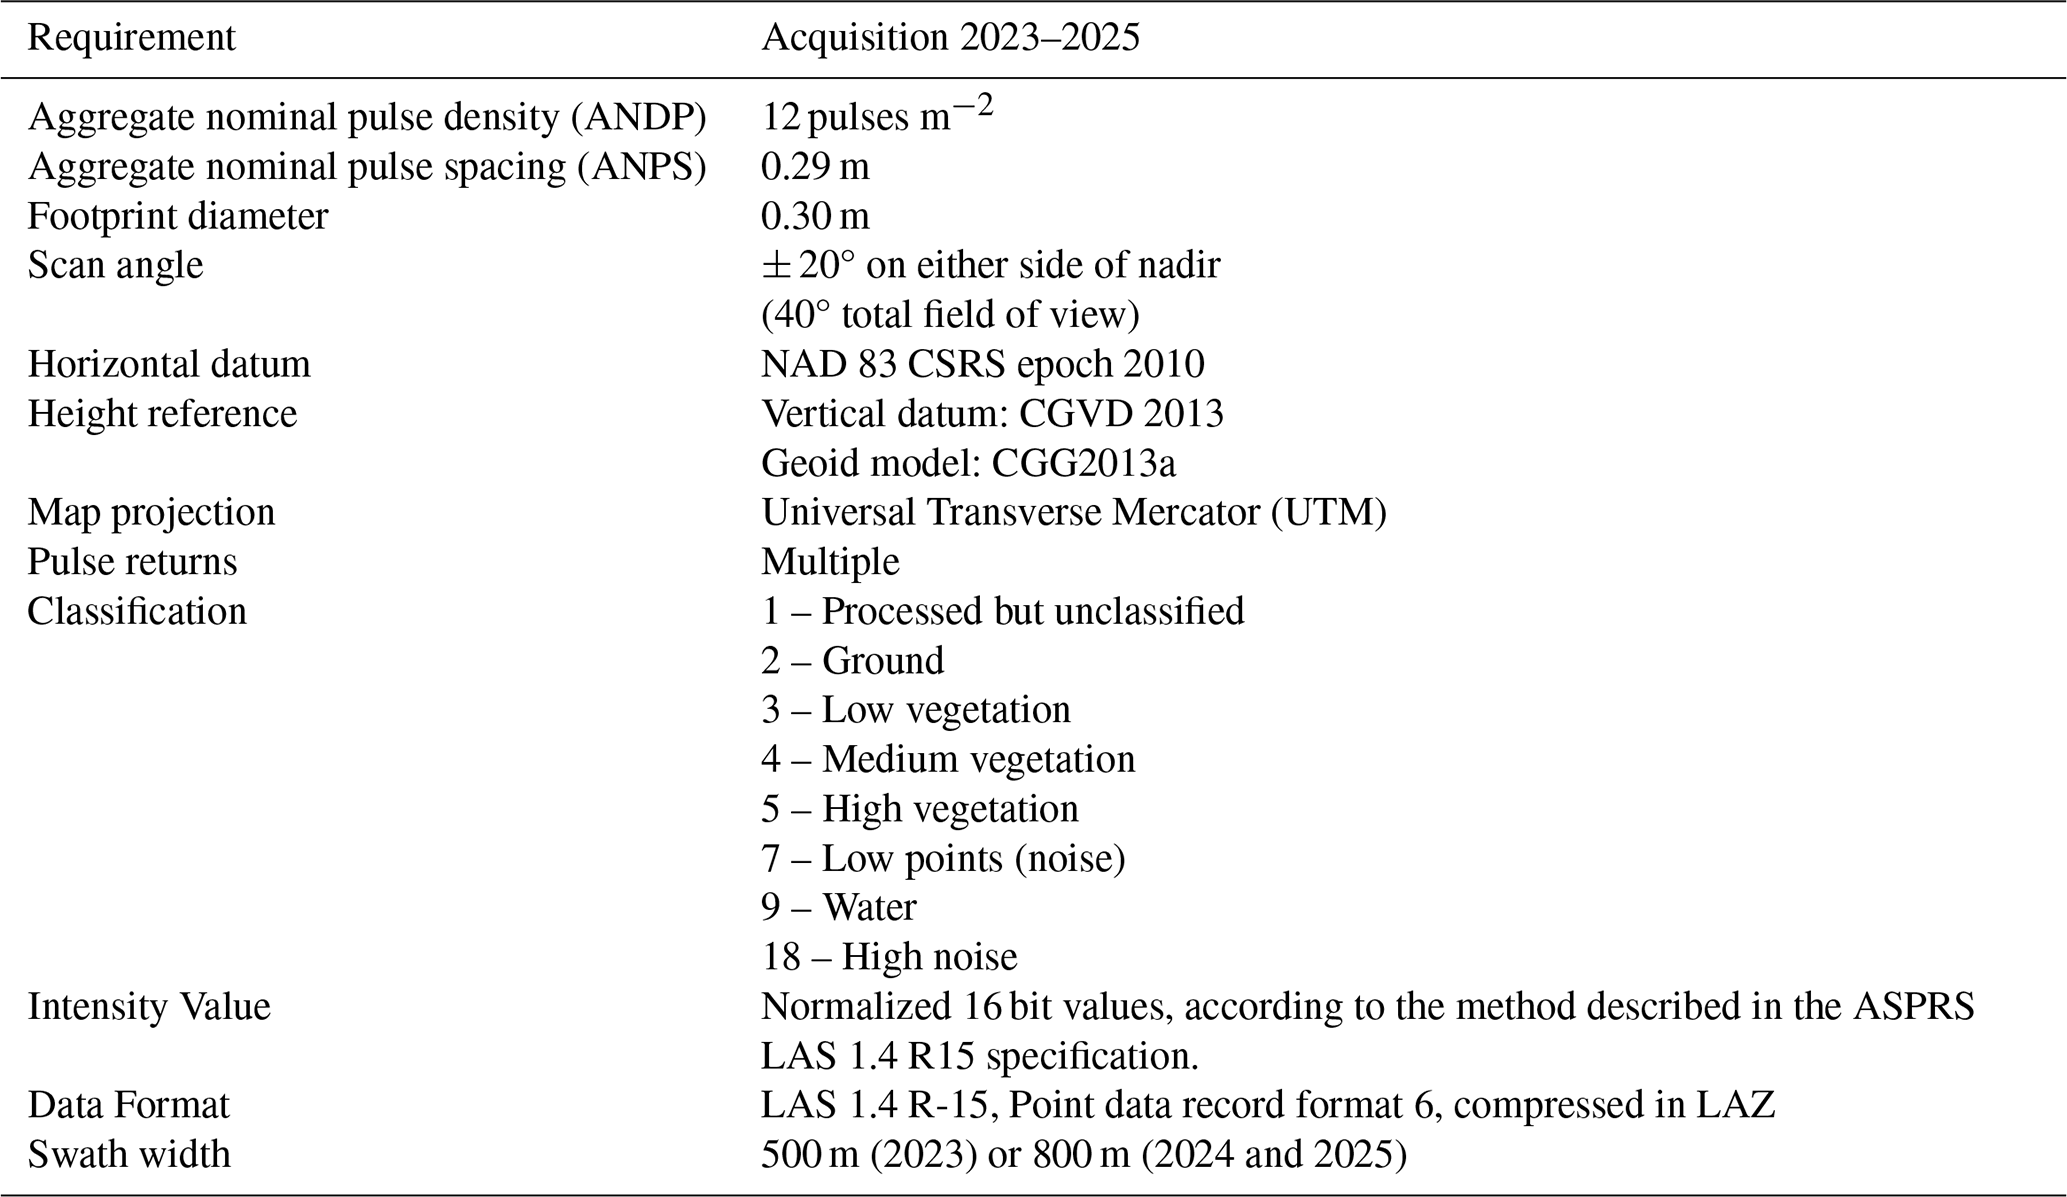
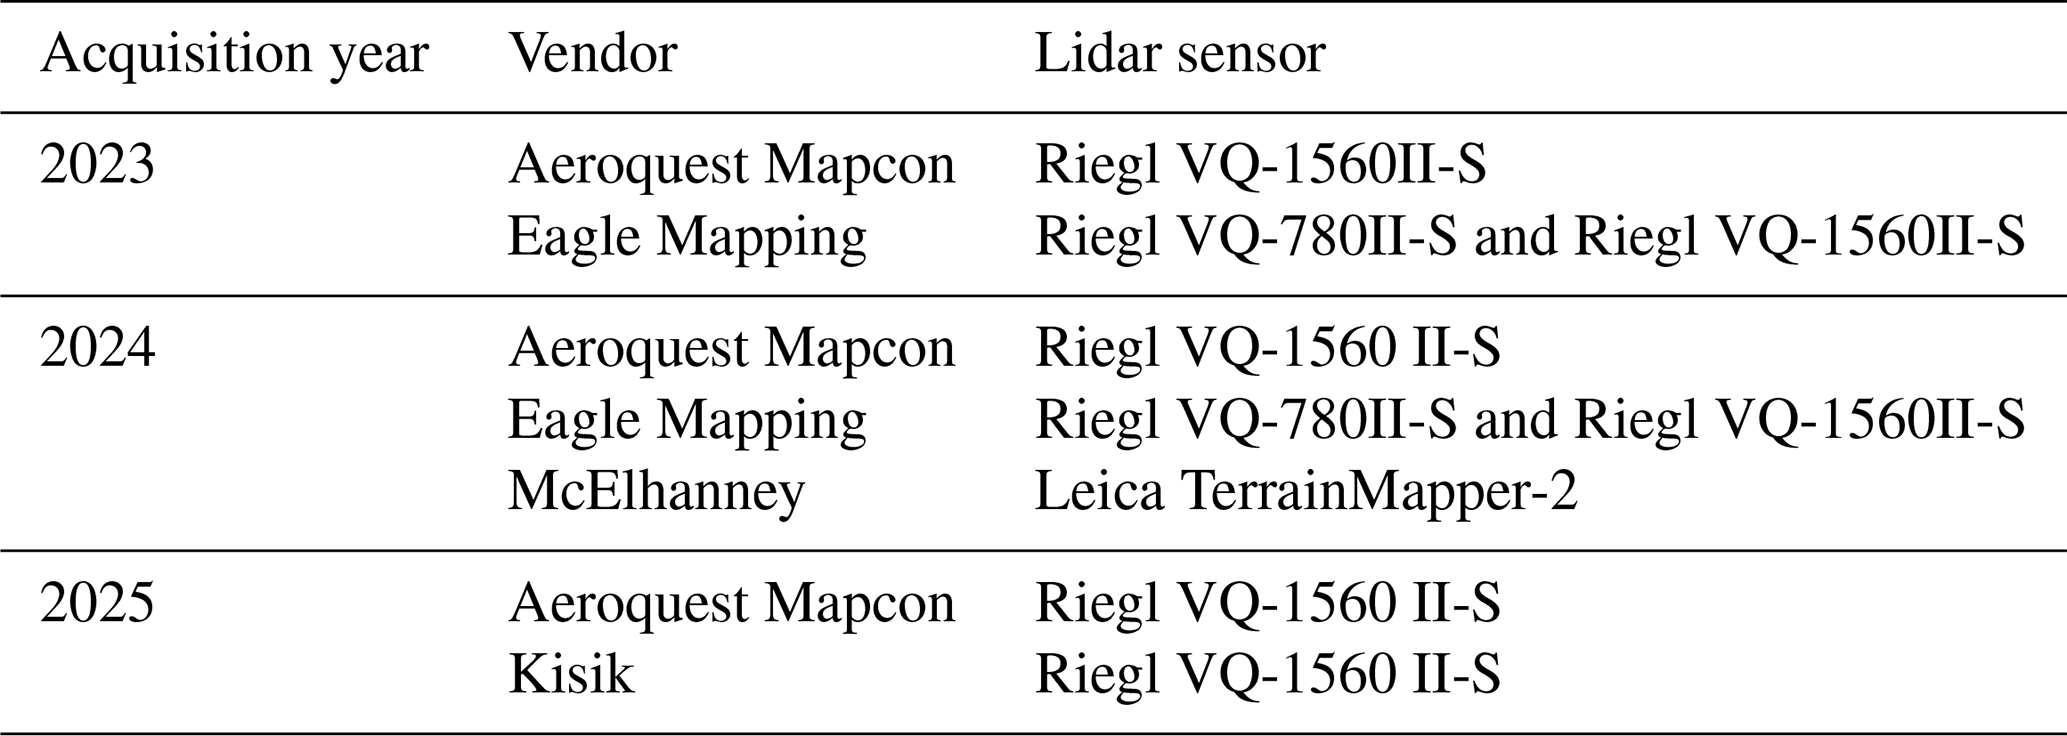
Table 2Airborne lidar vendors for acquisition years 2023, 2024, and 2025. Each lidar plot (described in Sect. 2.4) is linked to acquisition information in a relational database.
2.2 Airborne laser scanning data acquisitions
Planning for the 2023–2025 lidar acquisition considered previous experience with national ALS transects (Hopkinson et al., 2011), as well as recommendations from the Canadian airborne lidar acquisition guidelines (CSA Group, 2025). Acquisition specifications are summarized in Table 1. Due to the remoteness of the area of interest (Fig. 1), the lack of permanent global navigation satellite system (GNSS) base station infrastructure, and the impracticality of setting up ad hoc base stations, precise point positioning (PPP) services were employed to correct ALS return coordinates. The target window for data acquisition was between 15 June and 15 September of each year, and linear mode lidar systems were required. The ALS data were collected by private sector vendors who were awarded contracts through the Government of Canada's competitive procurement process (Table 2). Each vendor used their own aircraft, sensors, and systems to collect data according to the specifications outlined in Table 1.
Canada's National Forest Inventory (NFI) employs a systematic sampling strategy based upon 2 km × 2 km photo plots established on a 20 km × 20 km grid, with the intent to sample 1 % of Canada's landmass. The 20 km × 20 km sample grid is in turn nested within a 4 km × 4 km system (Gillis et al., 2005). Candidate NorthForM ground plot locations were selected using a stratified sampling strategy employing sampling units that combined ecozone (Fig. 1), and satellite-derived percent conifer and canopy closure obtained from the Spatialized Canadian National Forest Inventory (Guindon et al., 2024). Ground plot locations were then selected using the NFI's 4 km × 4 km sampling framework. Together, the NFI photo plot and NorthForM ground plot networks were used to guide ALS transect design, with plot centres used as targets between which lidar data were acquired. Additional ALS transects were established in an effort to obtain a balanced sample across northern forest-dominated ecozones where access was possible (Fig. 1).
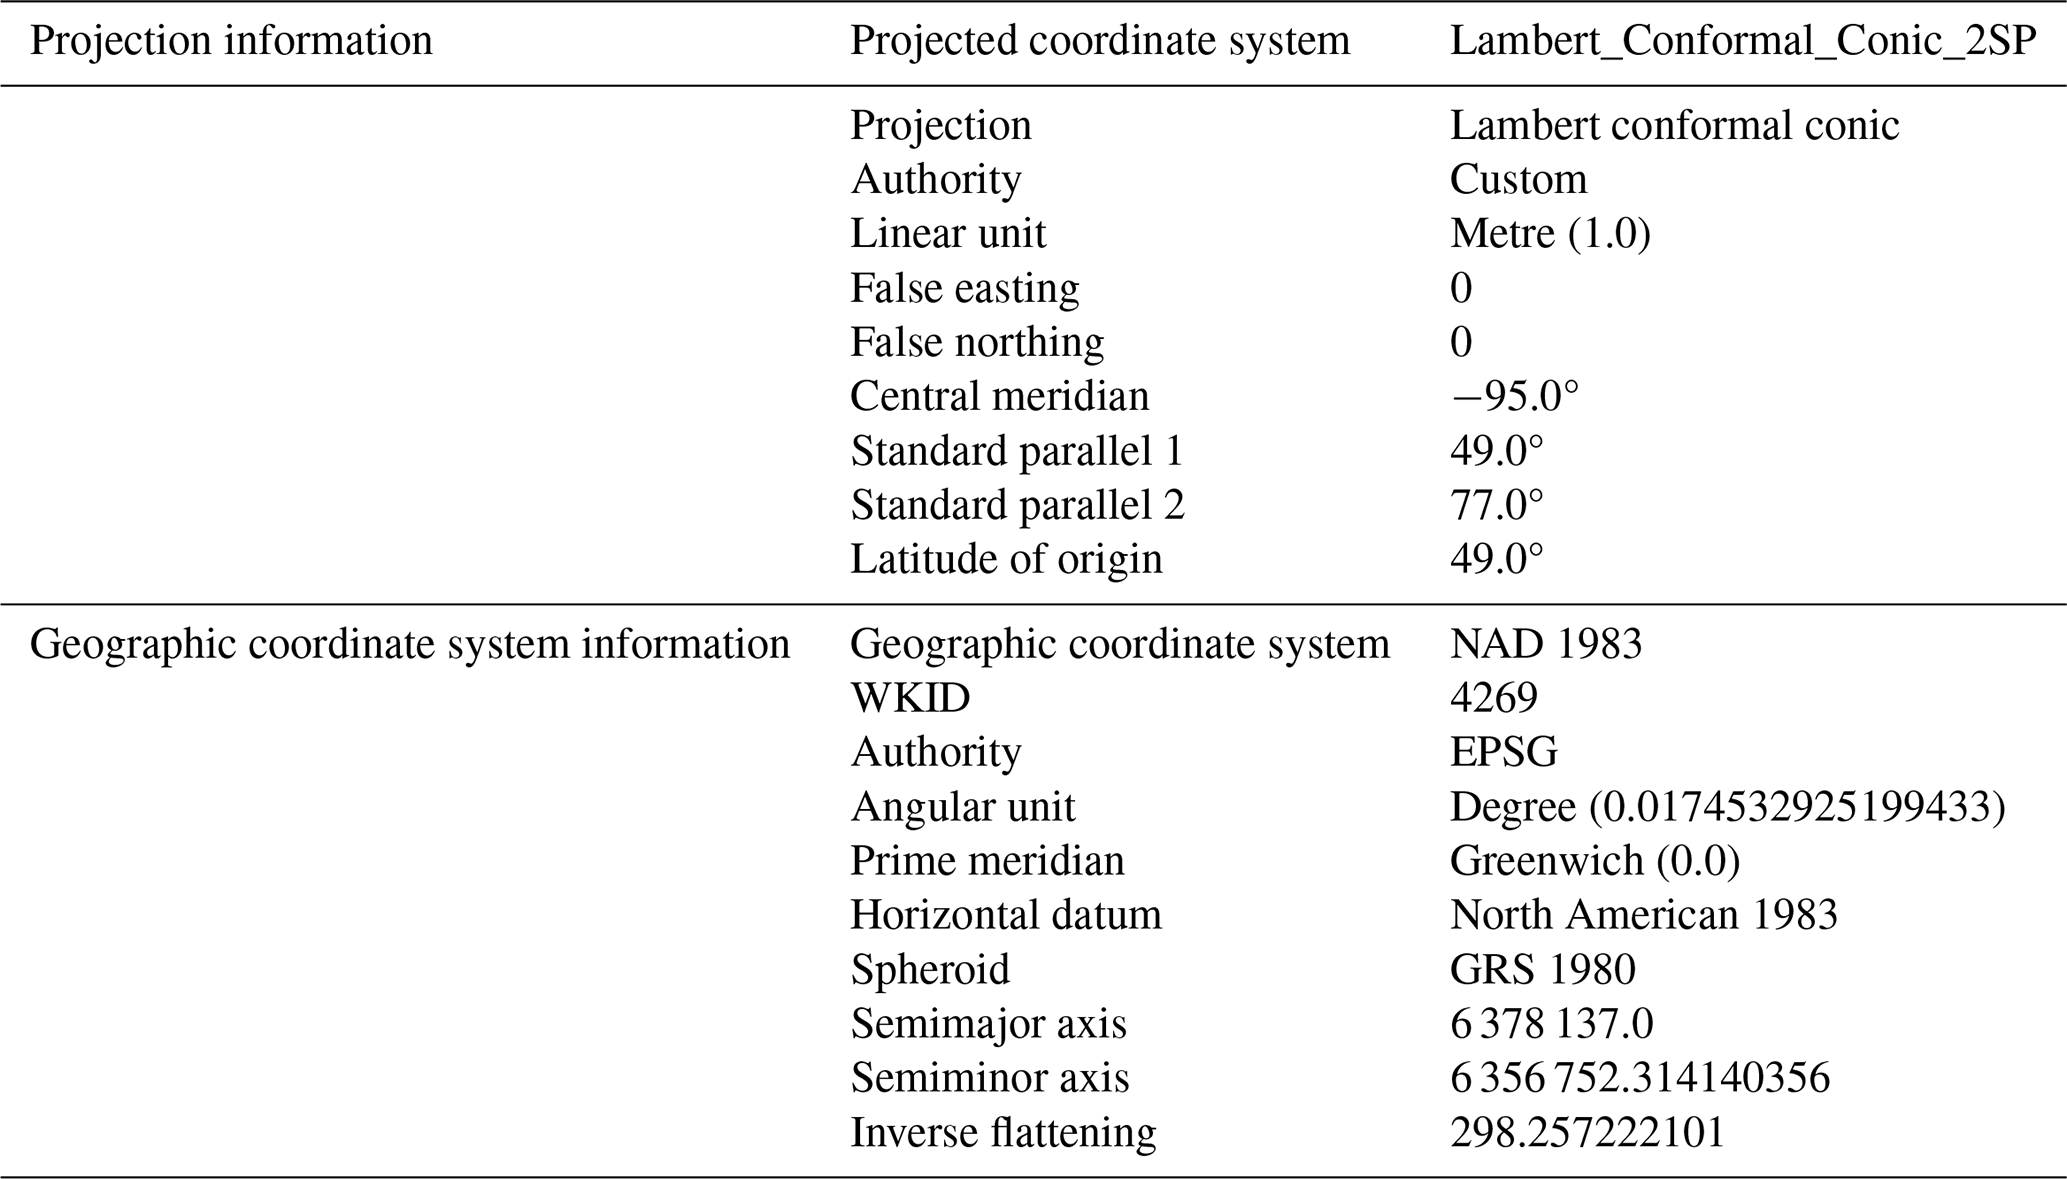
Table 3Projection information for National Terrestrial Ecosystem Monitoring System (NTEMS) spatial data: a custom Lambert conformal conic projection with two standard parallels using the NAD83 horizontal datum. Lidar plots were generated using this projection.
2.3 Data processing
2.3.1 Point cloud processing
Following their delivery by the ALS vendors, subsequent processing of the point cloud data was performed using LAStools (version 2.0.4; rapidlasso Gmbh). Footprint polygons were first created for each point cloud tile; the footprints followed the exterior edges of ALS returns and captured large internal voids. Classified lidar point clouds were then normalized to obtain heights above ground, with returns less than 0 m and greater than 100 m being removed. Returns with scan angles exceeding 20° or classified as high noise (class 18) were dropped from the point clouds (Table 1). The point clouds were then reprojected from their universal transverse Mercator (UTM) projections (Table 1) to a common national Lambert conformal conic projection employed by the NTEMS program (Table 3). The normalized and reprojected point clouds were then used to calculate point cloud metrics.
2.3.2 Lidar plots and point cloud metrics
Lidar plots and the databases in which they are stored were created using Python and ESRI's ArcPy package. Lidar plots were generated as point feature classes falling within the lidar transect swaths. Using the point cloud footprints, lidar plots were located away from the edges of swaths and large interior voids to avoid areas of missing data. The lidar plot centre coordinates aligned with the pixel centres of 30 m spatial resolution NTEMS raster products, which use the NTEMS Lambert conformal conic projection (Table 3). Plots that fell within the NTEMS land cover product's water class (Hermosilla et al., 2022) were removed. For each lidar plot, an individual 30 m × 30 m point cloud was then clipped from which area-based metrics would be calculated in subsequent steps.
Table 4Types of point cloud metrics calculated from non-ground returns from ALS transects. In total, 369 metrics were generated. Metrics were calculated for four groups of returns using: (1) all returns above 0 m, (2) first returns above 0 m, (3) all returns above 2 m, and (4) first returns above 2 m. For a full list of metrics see Supplement file S1, and for detailed descriptions see Tompalski (2024).
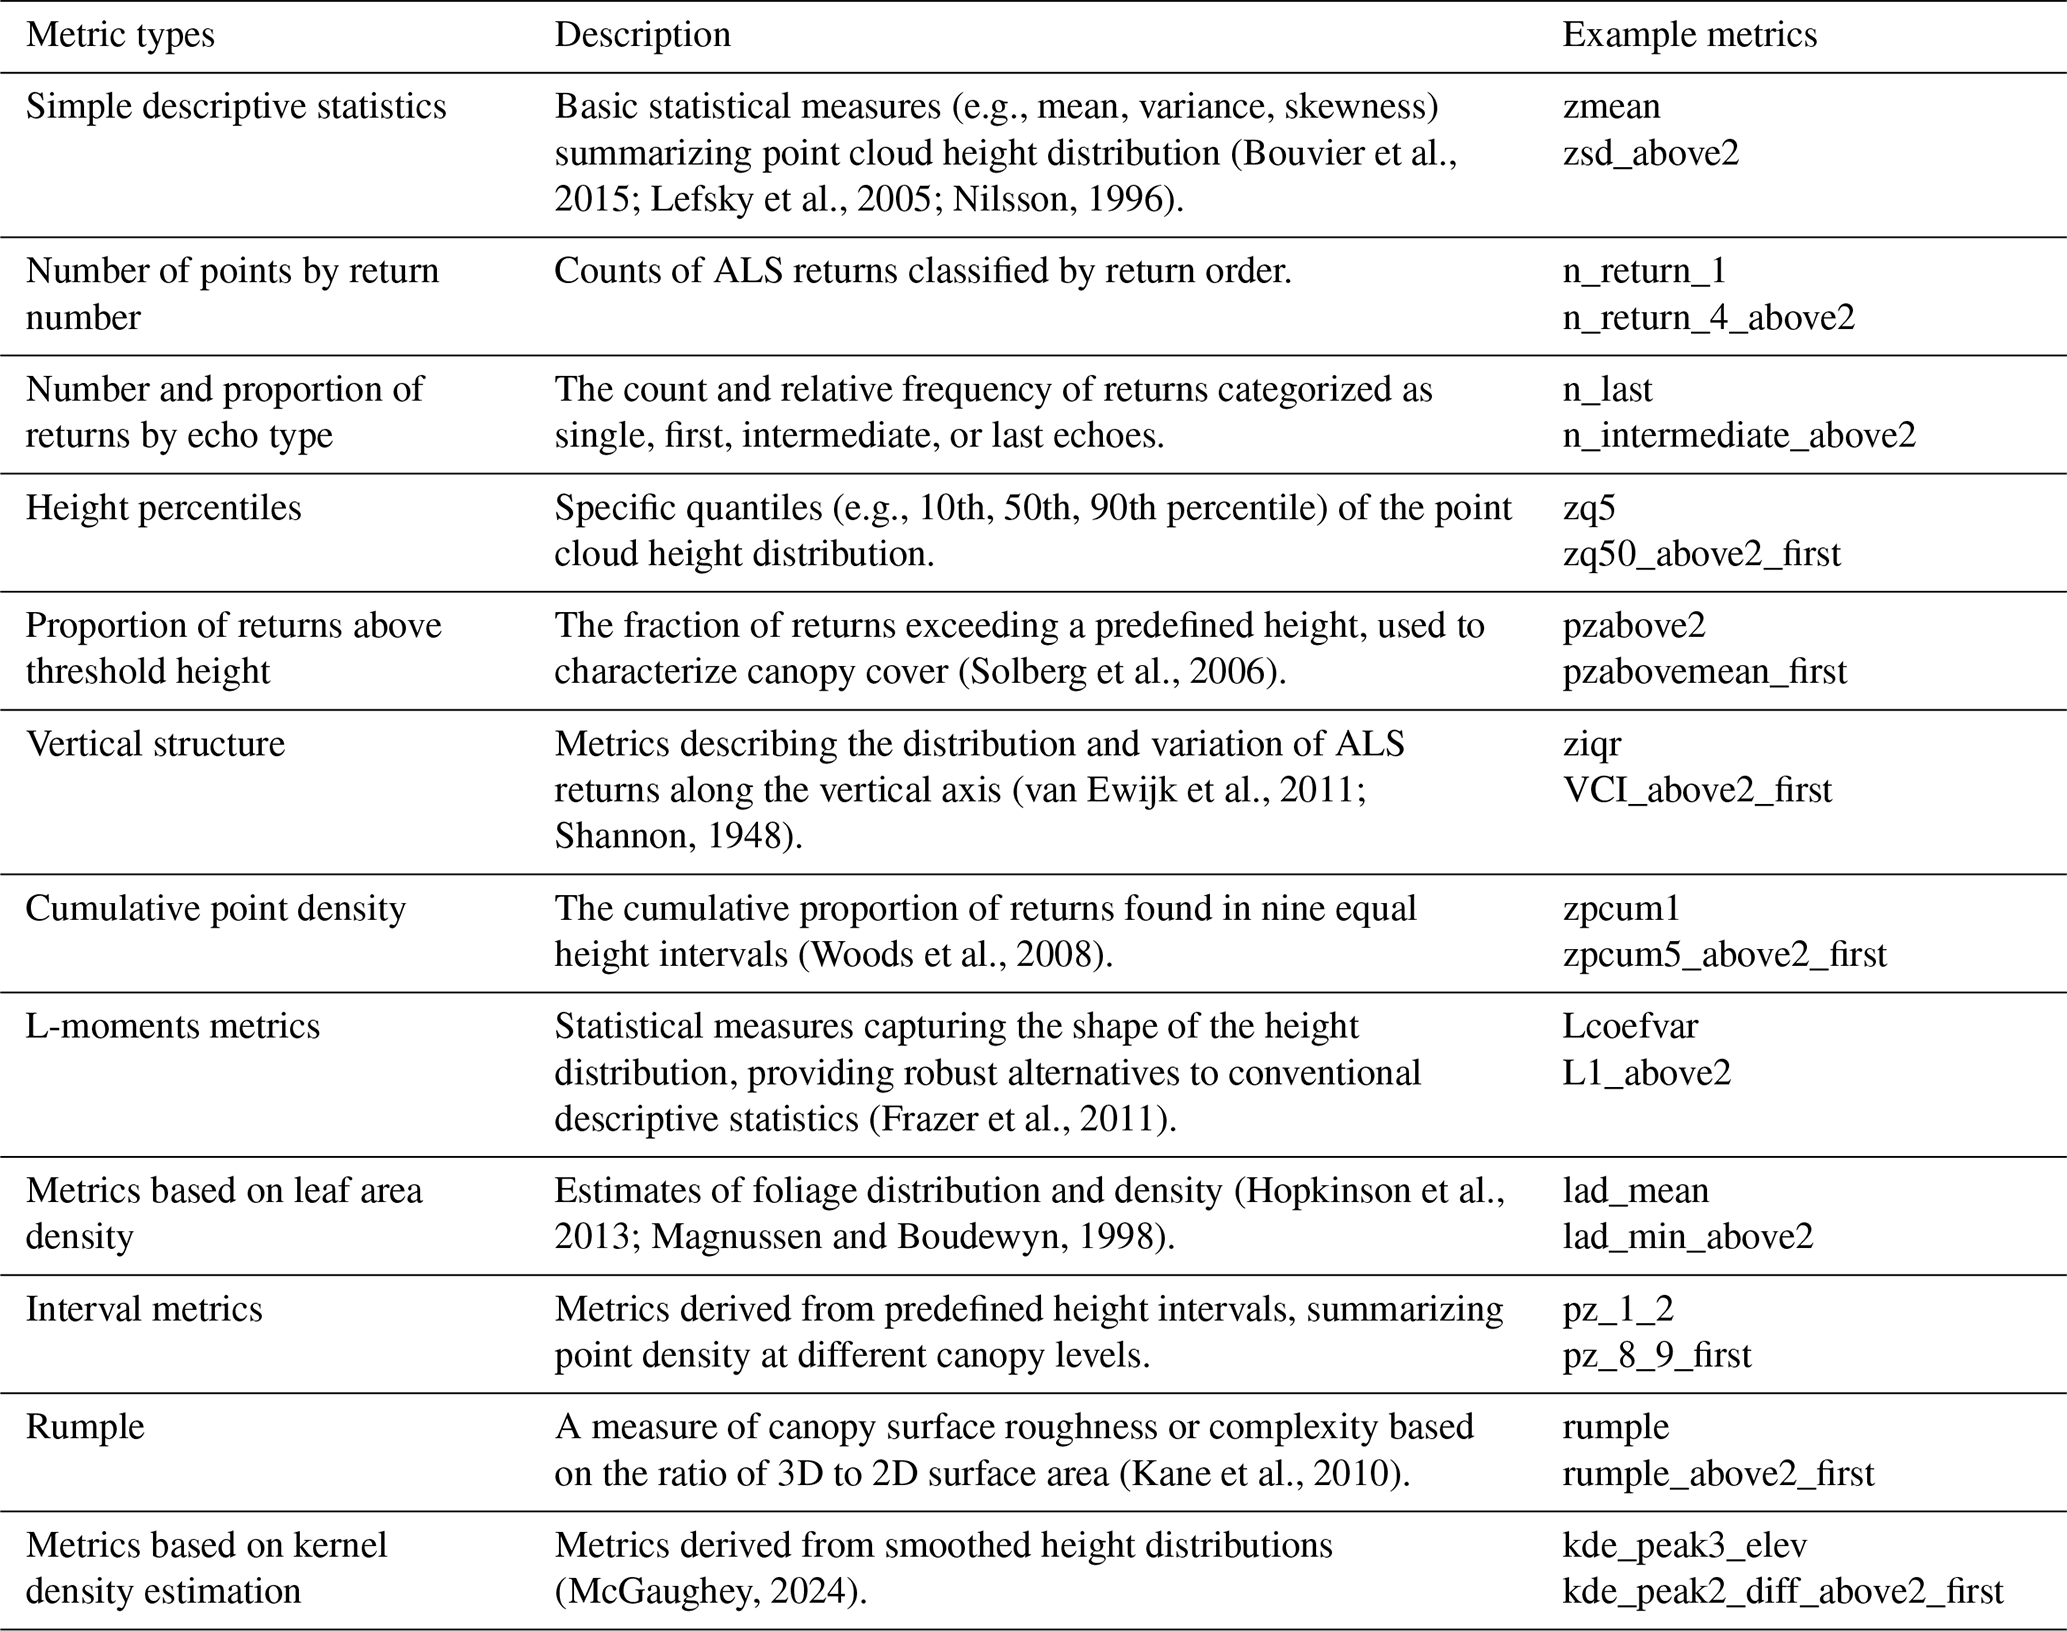
Lidar point cloud metrics were calculated for each 30 m × 30 m lidar plot using the R packages lidR (Roussel et al., 2020; Roussel and Auty, 2023) and lidRmetrics (Tompalski, 2024). As the final products are intended to inform a variety of applications, including forest inventory, regeneration assessment, and wildfire fuels, the metrics were generated in four groups using: (1) all returns above 0 m, (2) first returns above 0 m, (3) all returns above 2 m, and (4) first returns above 2 m. Two height thresholds were used so that models could be created that either consider all vegetation from the ground surface upwards (i.e., ≥ 0 m), or with a focus on overstory structure (> 2 m). Metrics were calculated using only first returns as they have been shown to be more consistent than metrics based on all returns (Bater et al., 2011); however, metrics considering all returns provide a more comprehensive characterization of vertical forest structure and may be preferred for applications that consider more than just the upper canopy (Singh et al., 2016). Each group included the same set of metrics, but values varied based on the combination of height threshold (0 or 2 m) and return type (all returns or first returns only). In total, 369 point cloud metrics were generated; Table 4 categorizes these metrics by type (for a full list of metrics included in the database, see Supplement file S1 in the Supplement).
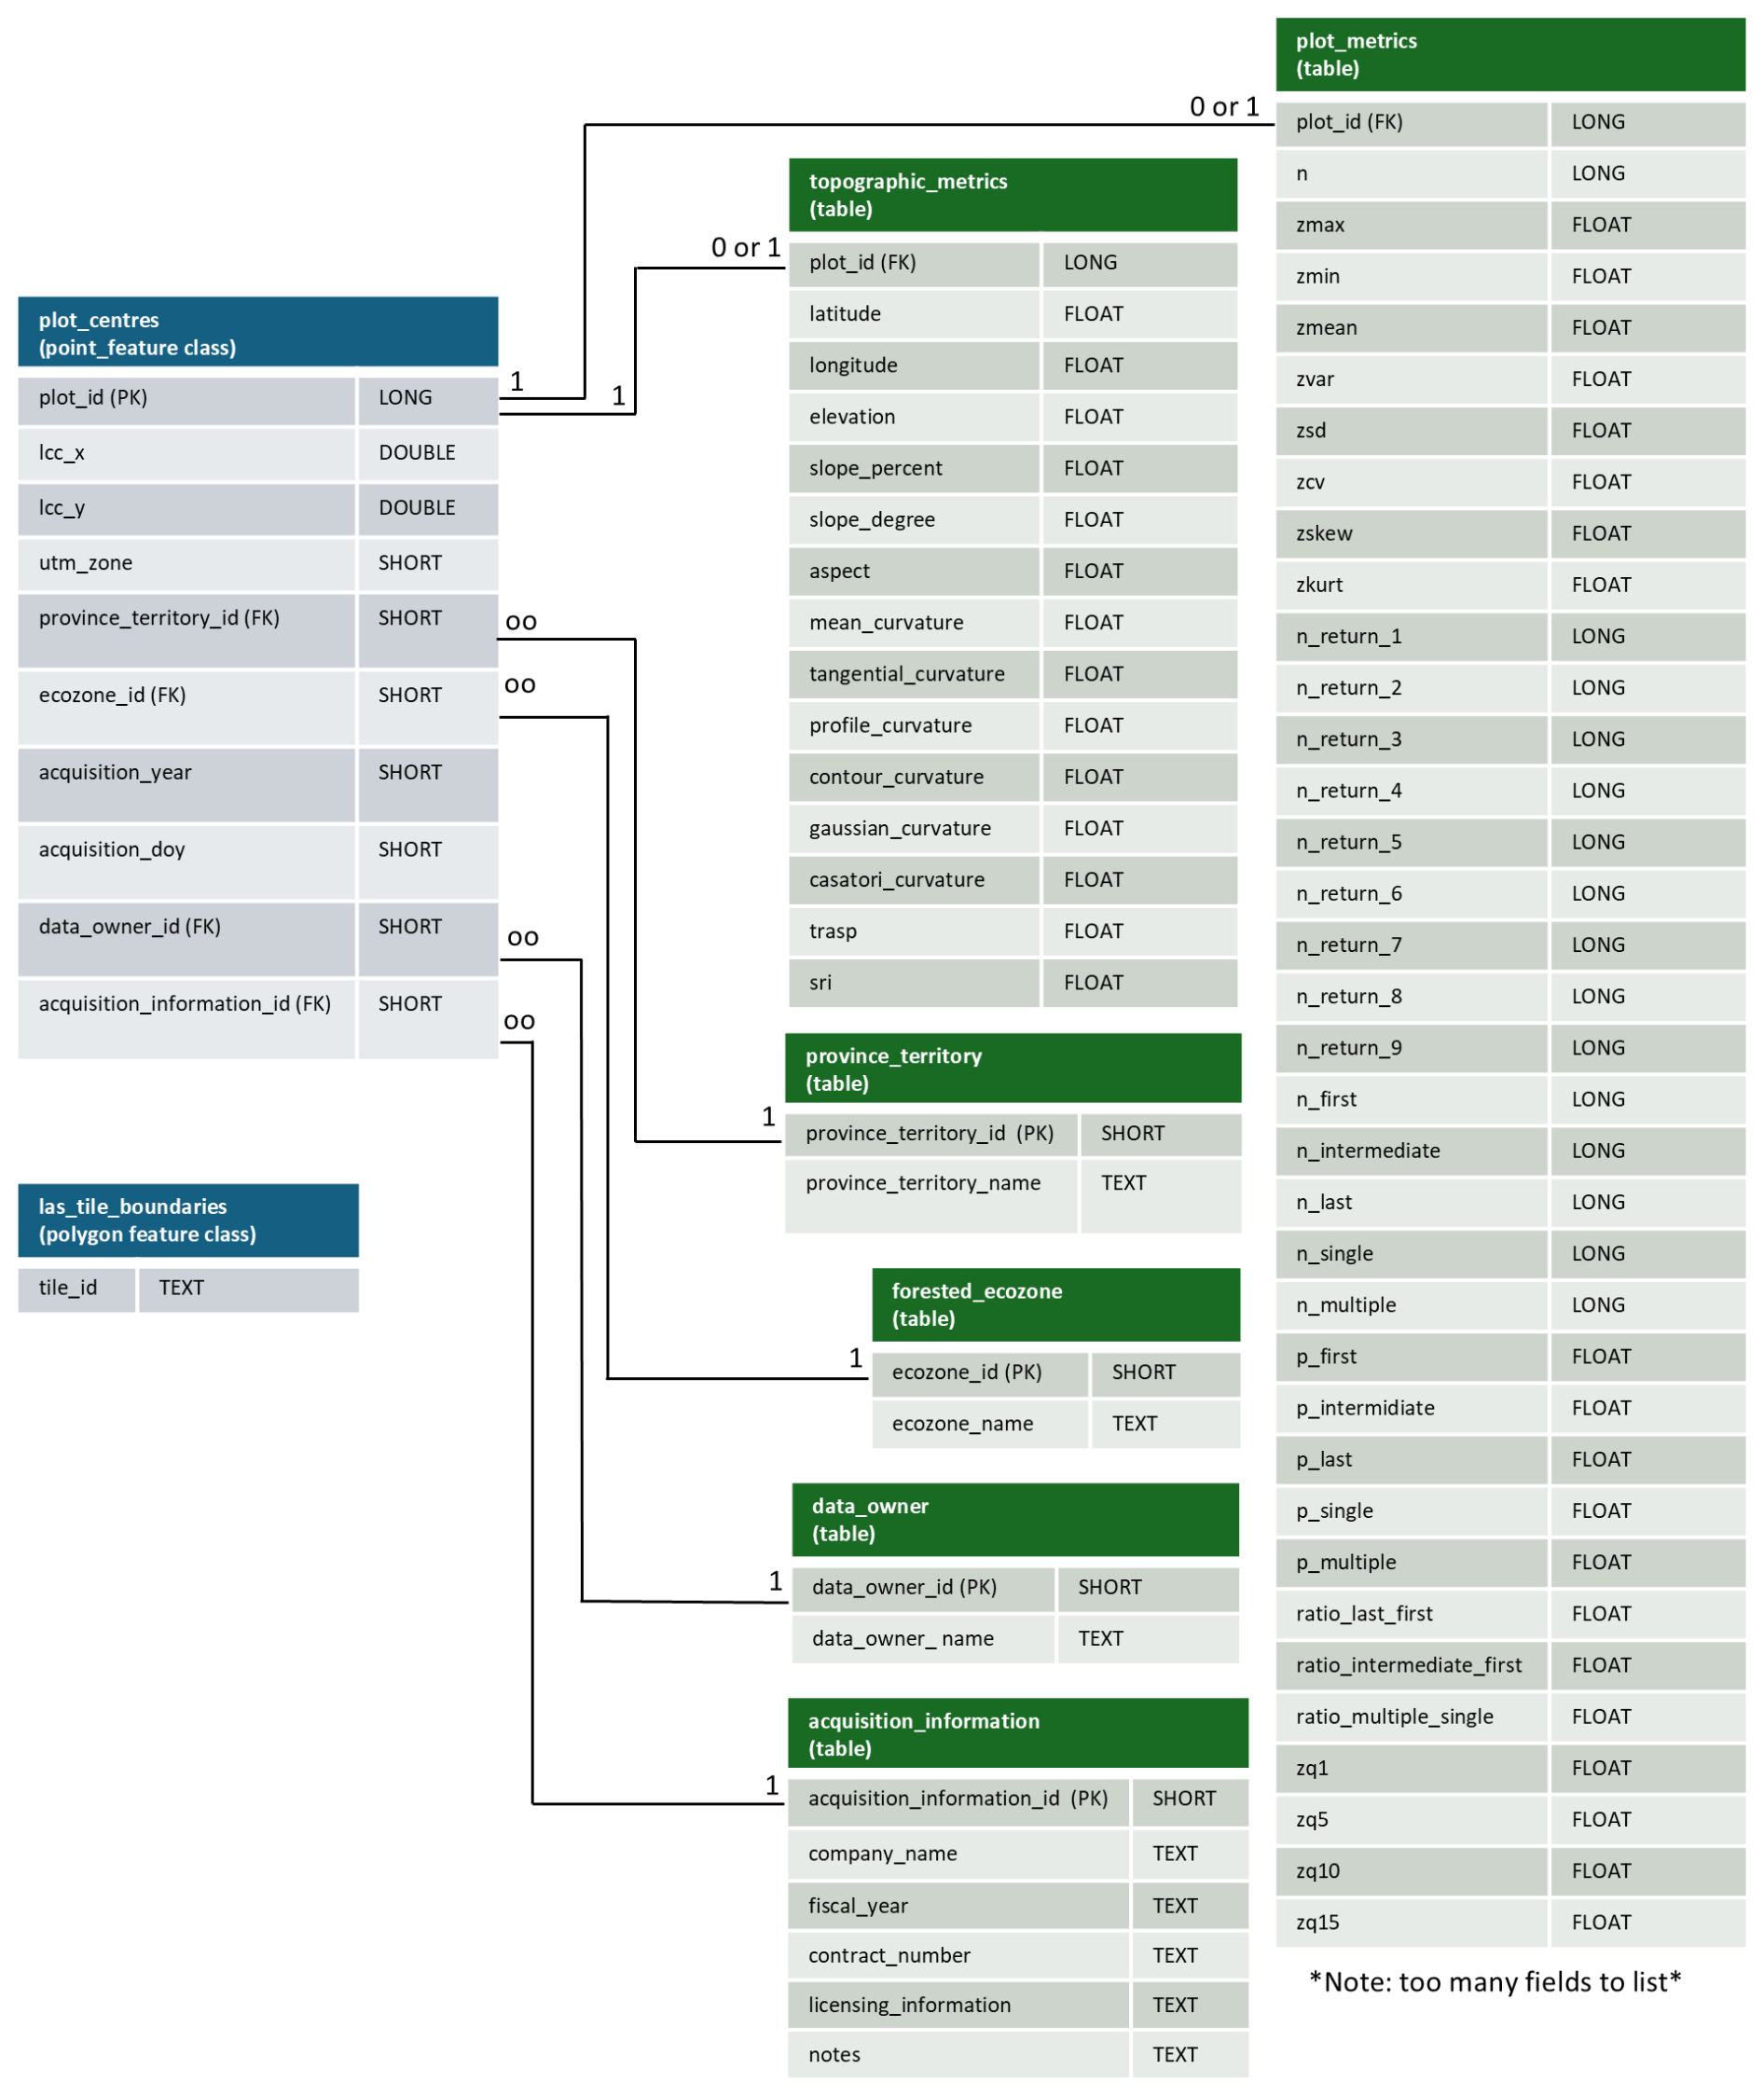
Figure 2Entity relationship diagram describing the structure of the lidar plots database. In total, the plot metrics table includes 369 point cloud metrics for each lidar plot, with an abridged version of the database available including a subset of 40 metrics.
2.3.3 Lidar plots database
Lidar plots and associated point cloud metrics are distributed as SQLite GeoPackages (https://www.geopackage.org/, last access: 6 March 2026), which are an open and non-proprietary format. Each acquisition year (i.e., 2023, 2024, and 2025) will be stored in a separate database. Each GeoPackage contains a point feature class storing lidar plots on the NTEMS 30 m grid, a feature class delineating point cloud footprints, as well as a series of data tables storing point cloud metrics, province or territory, UTM zone, ecozone, and information related to individual acquisitions (Fig. 2). Given the large number of metrics in the full database (Supplement file S1), for each year an abridged version of the dataset is also being shared that contains a subset of commonly used metrics for forest inventory (White et al., 2013, 2017a; Supplement file S2).
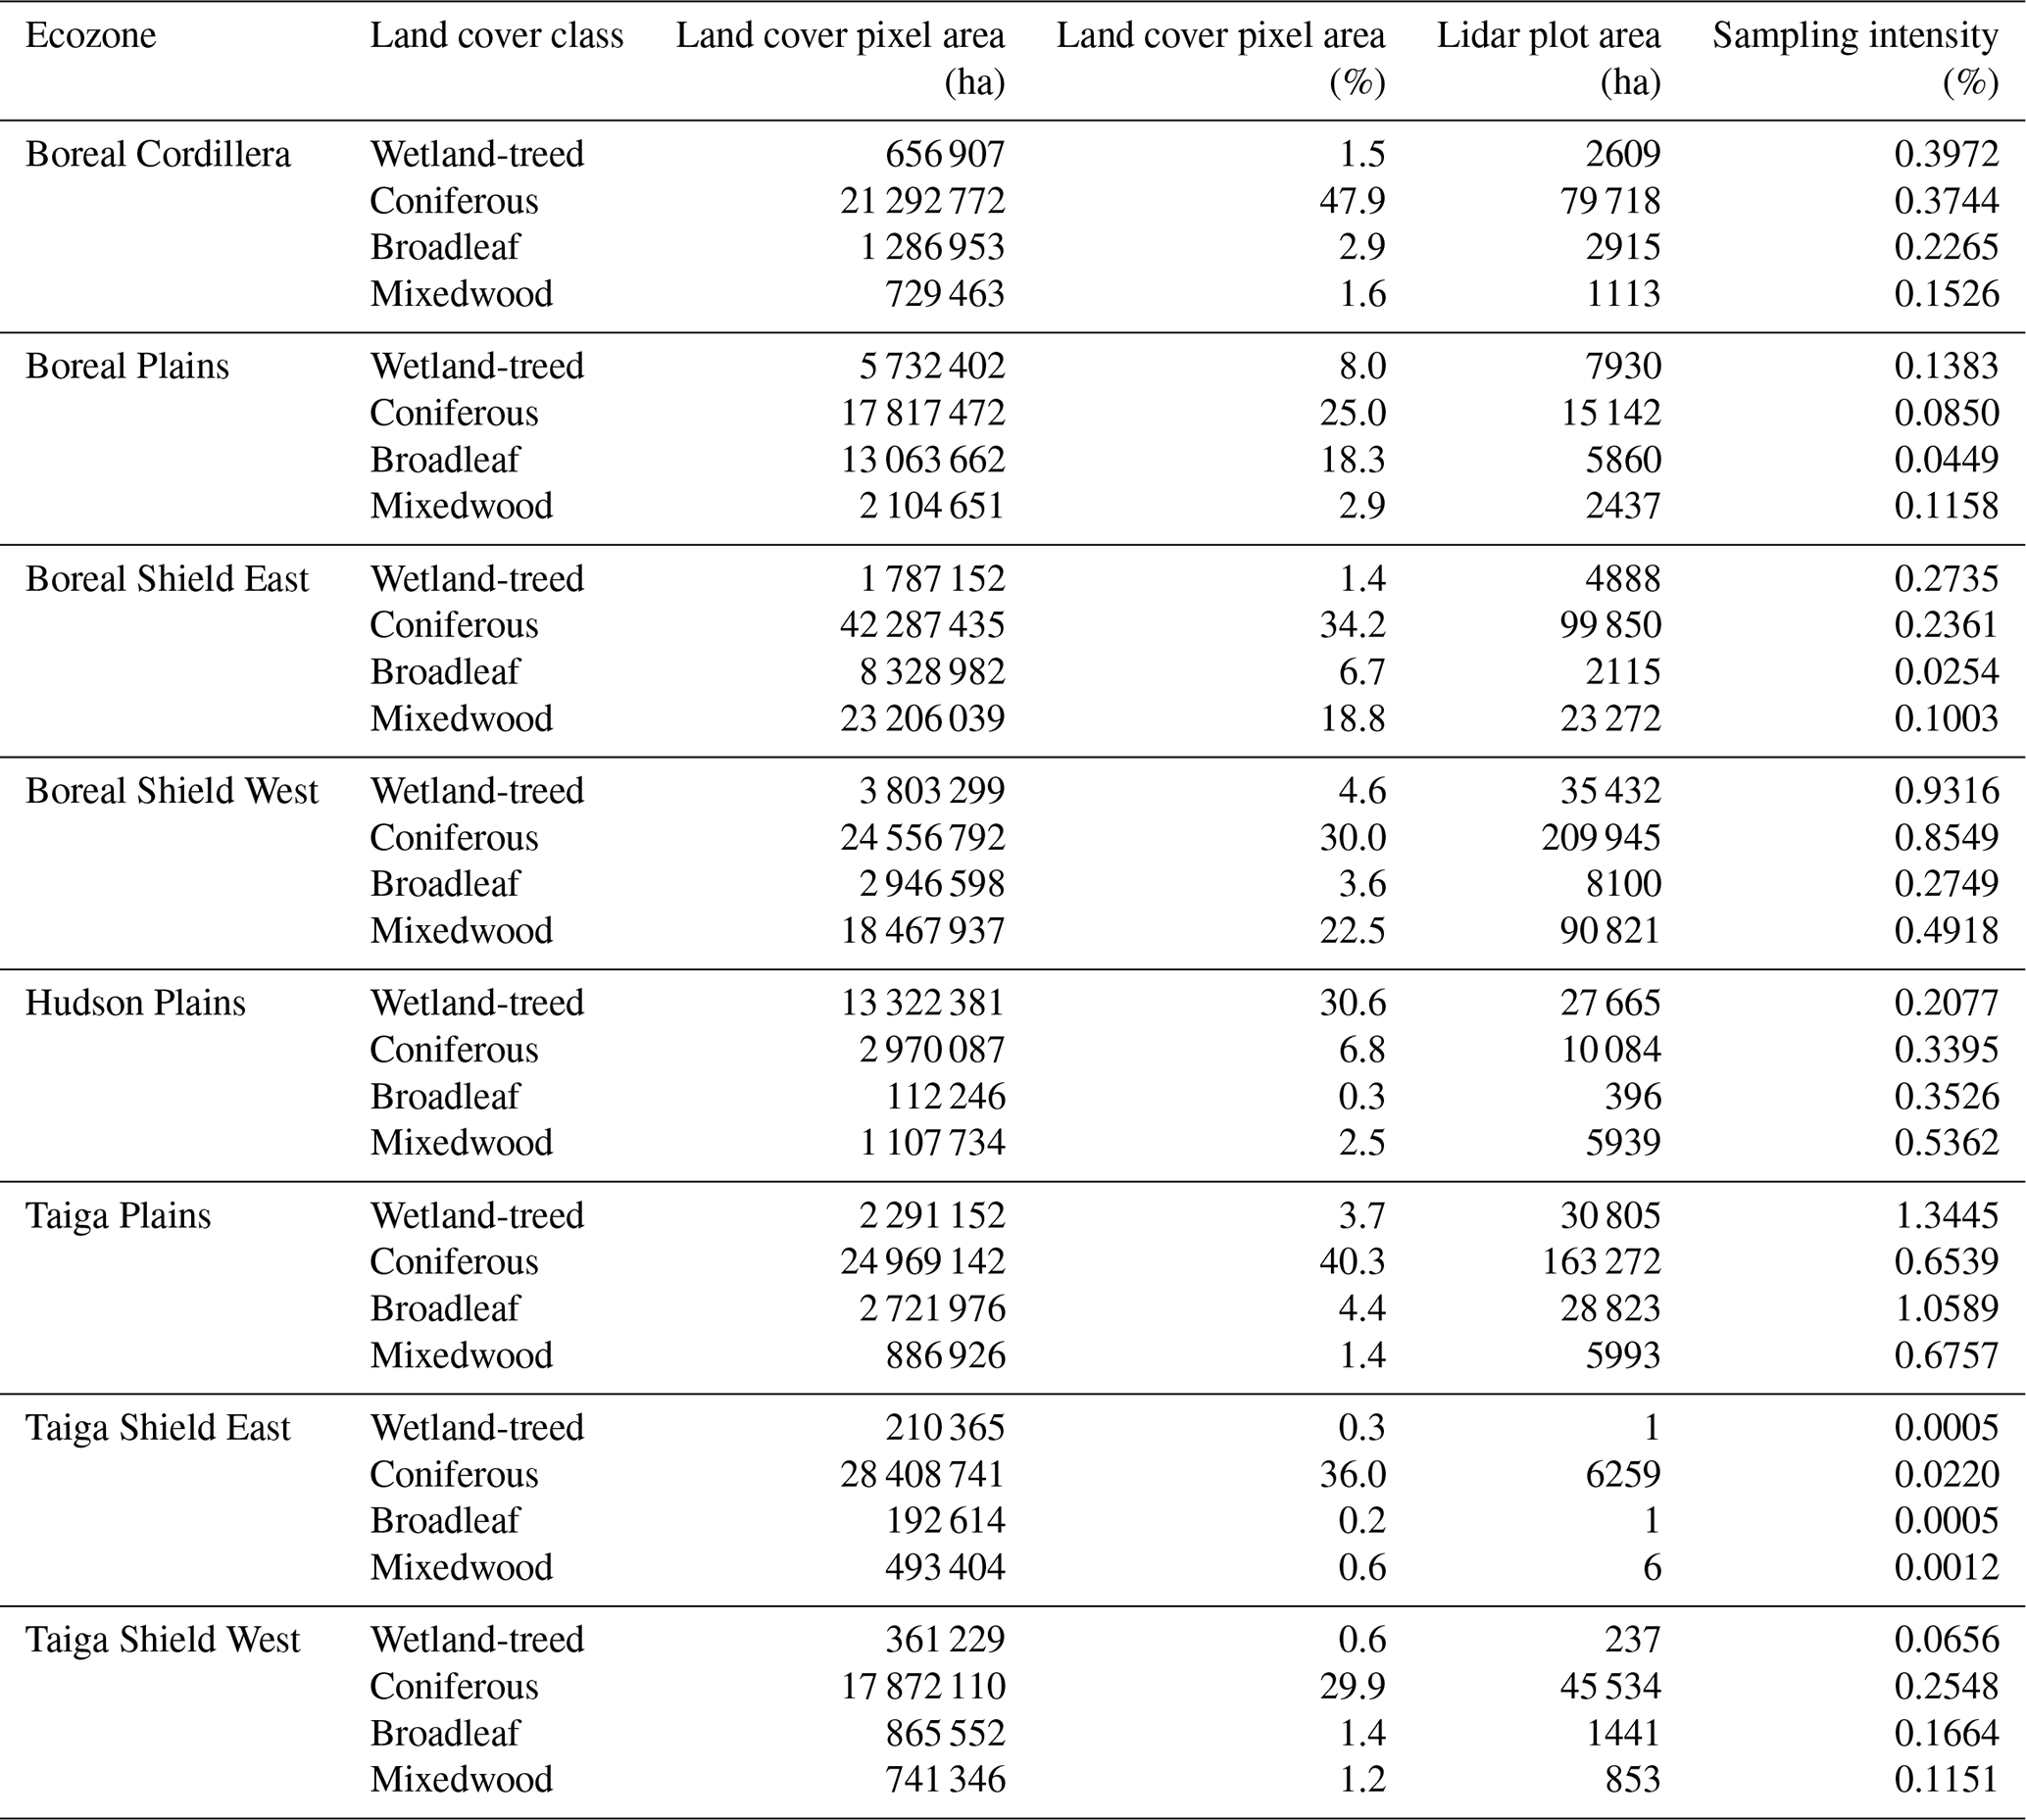
Table 5Sampling intensity within treed land cover classes by ecozone for 2023. “Land cover pixel area (ha)” represents the area classified as a given land cover type within the ecozone (Fig. 1). “Land cover pixel area (%)“ is the percent coverage of a given land cover type in an ecozone. “Lidar plot area (ha)” represents the area of lidar plots within the ecozone that falls within a given land cover type. “Sampling intensity (%)” is calculated as lidar plot area divided by pixel area and multiplied by 100.
3.1 ALS transects acquisitions
A total of ∼ 20 000, ∼ 23 000, and ∼ 12 000 km of ALS transect data were acquired in 2023, 2024, and 2025, respectively (Fig. 1). The 2023 acquisition focused on collecting data over forest-dominated ecozones that are currently lacking ALS coverage (White et al., 2025). The 2023 ALS acquisitions were significantly impacted by smoke caused by unprecedented wildfire activity in Canada (Jain et al., 2024), and as a result, 5000 km of planned acquisitions were postponed for capture in 2024. The 2024 and 2025 transects focused on acquiring data over NorthForM ground plots (Boucher et al., 2024). In 2025, wildfire activity and inclement weather resulted in only 64 % of planned data acquired. During the 2023, 2024, and 2025 field seasons over 900 ground plots were measured. Table 5 summarizes sampling intensity within NTEMS treed land cover classes for the 2023 acquisition (Hermosilla et al., 2022) by ecozone (Fig. 1).
3.1.1 Quality assurance results
Overall, the ALS acquisition specifications (Table 1) were met and often exceeded. A rare exception, however, were periodic changes in footprint sizes, swath widths, and point densities in areas with complex topography. These deviations are not unexpected and occur mostly in the mountainous areas of western Canada above the tree line, and impact less than one percent of the transect data.
The ALS vendors (Table 2) corrected GNSS coordinates using PPP, with all reporting sub-metre horizontal and vertical accuracies. Point cloud classifications were validated following guidance in Sect. 8.6 of the Canadian lidar acquisition standards (CSA Group, 2025), which indicate that point classifications should be consistent across the entire project with minimal variations in the classification quality between tiles or swaths. For each acquisition year, twenty 1 km × 1 km point cloud tiles distributed across the acquisition areas (Fig. 1) were selected for analysis. Within each tile, 20 randomly selected 400 m2 areas were then clipped and three-dimensional visual checks of the point cloud classifications were performed using FUSION's pdq viewer (McGaughey, 2024). All point clouds were rasterized based on return class (Table 1) and hillshades were generated from the DTMs. Raster surfaces were then visually inspected to ensure specifications were met (e.g., all points were classified (unless withheld), water was properly classified, no areas with few or no ground returns, noise was classified correctly, DTMs were representative of the bare-Earth surface). Similarly, return counts and scan angles were rasterized to ensure transects fell within the specifications for point densities and swath widths (Table 1). All raster products were generated using LAStools (version 2.0.4). Any issues found were reported to the ALS data vendors who then made corrections.
3.2 Lidar plots databases
For the 2023 ALS transects, 15 353 866 lidar plots were generated within the lidar swaths. The full database including 369 point cloud metrics is 60.2 GB in size, and the abridged version of the database containing a subset of 40 metrics is 7.2 GB. Both versions are shared as SQLite GeoPackages.
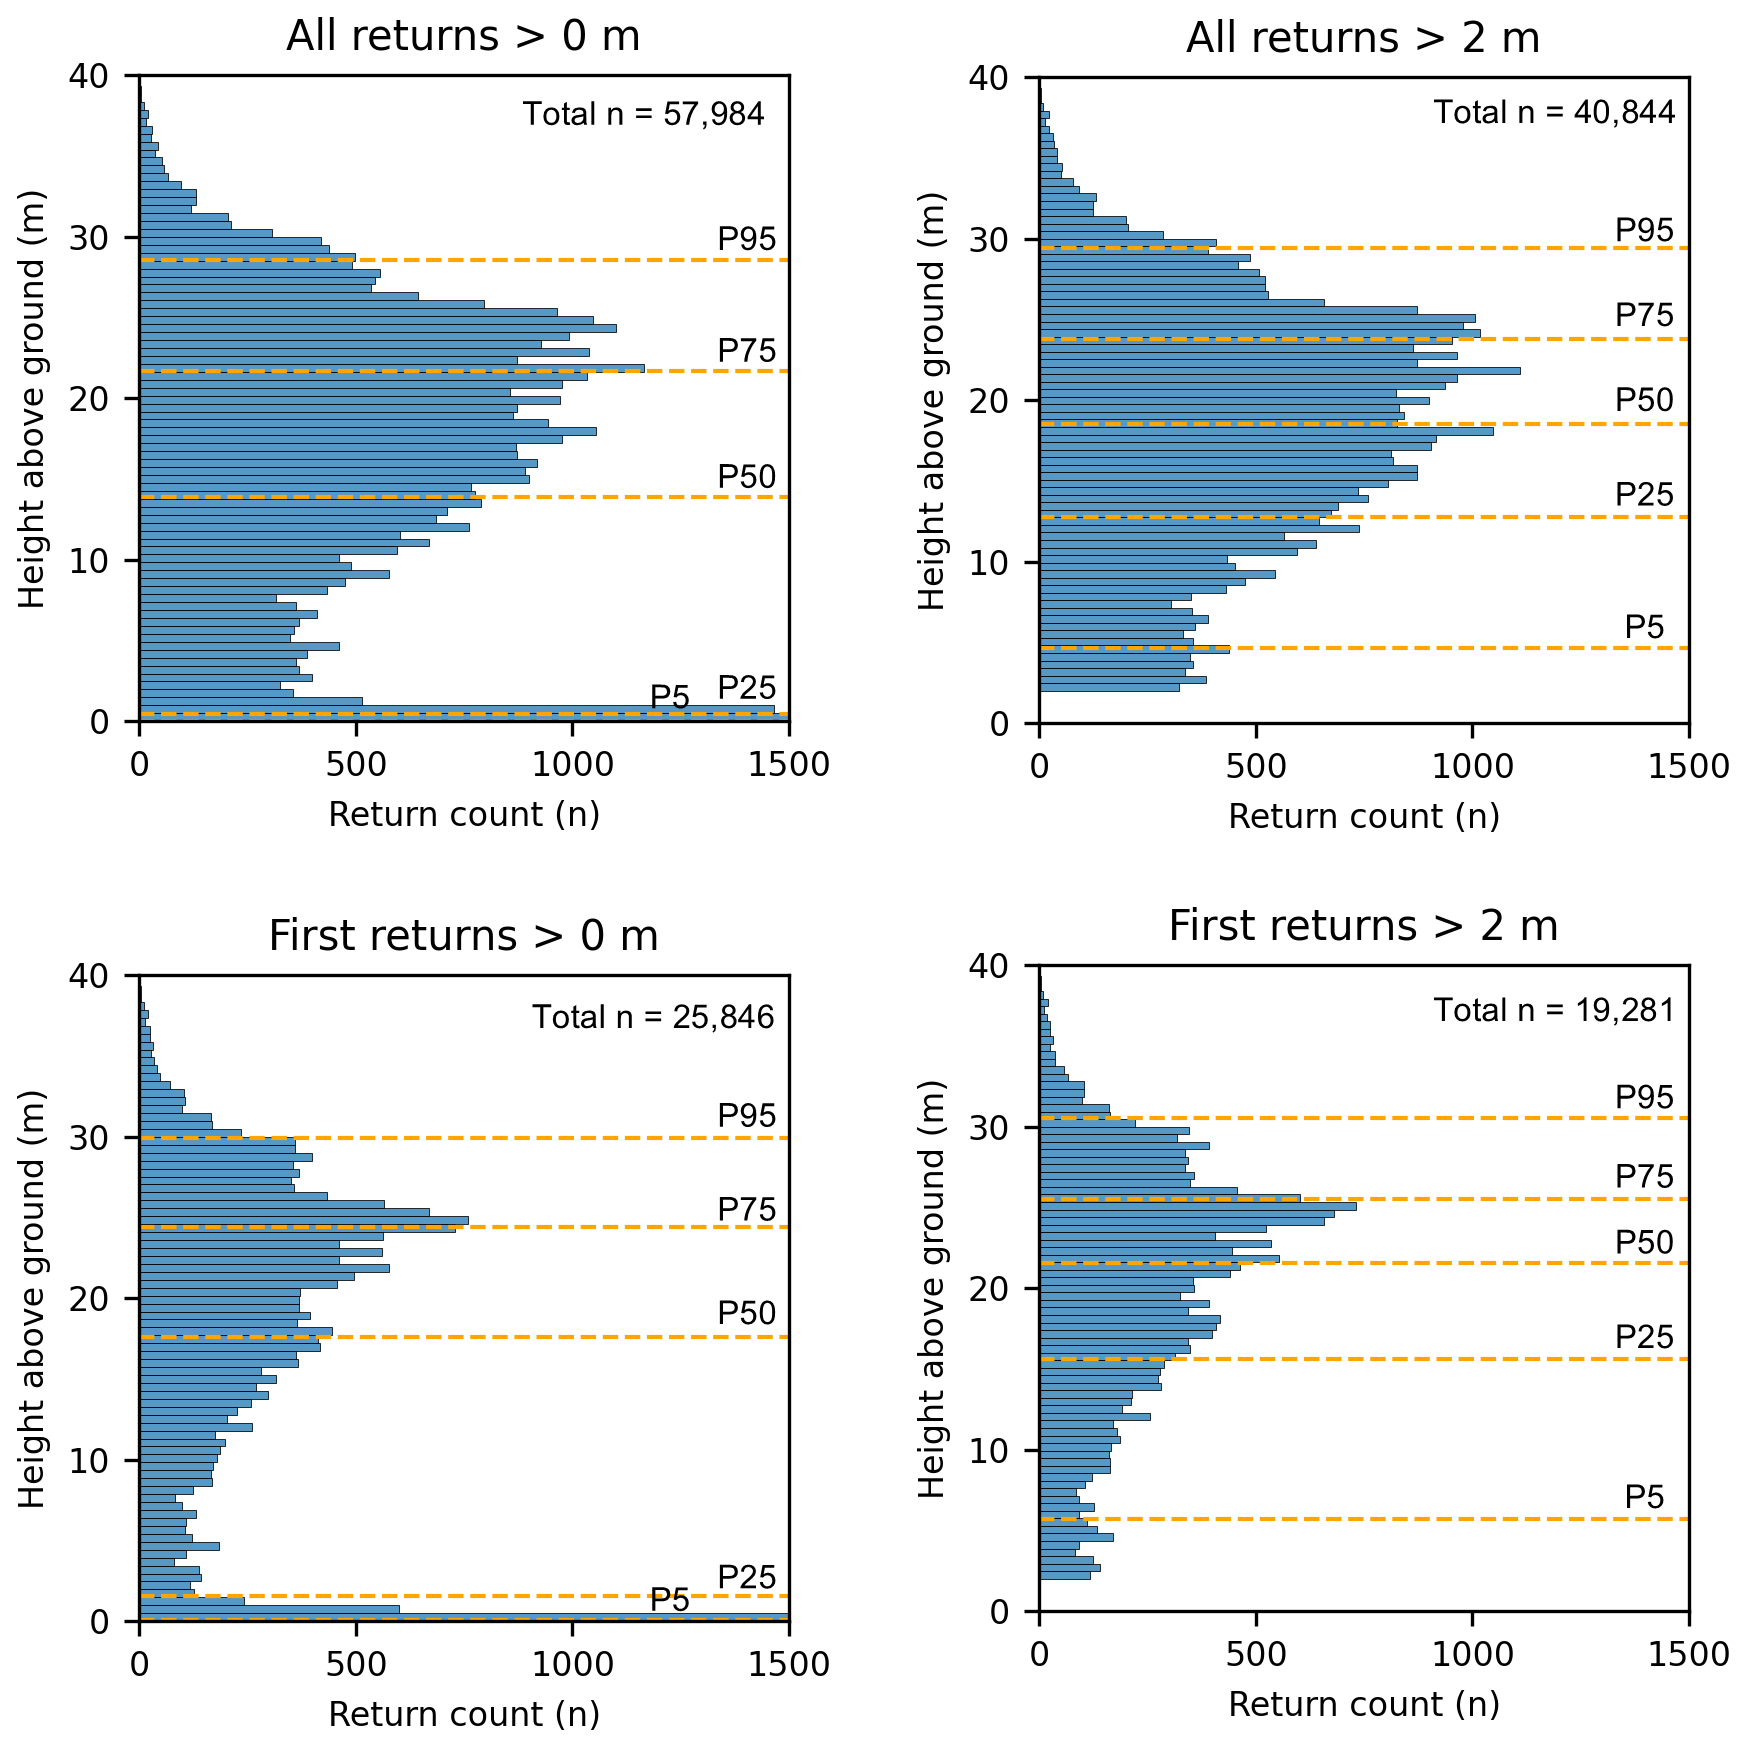
Figure 3Comparison of vertical distributions of returns from four different processing groups for the same lidar plot: all returns above 0 m, all returns above 2 m, first returns above 0 m, and first returns above 2 m. P95 = 95th height percentile, P75 = 75th height percentile, and so on. The plot is located along the Prophet River in northern British Columbia (58°17′19′′ N, 122°52′30′′ W).
3.3 Point cloud metrics
Point cloud metrics were processed in four groups using: (1) all returns above 0 m, (2) first returns above 0 m, (3) all returns above 2 m, and (4) first returns above 2 m. Figure 3 shows an example of the four processing groups from the same lidar plot. The number of returns range from 19 281 (first returns > 2 m) to 57 984 (all returns > 0 m), while the height percentiles change by varying degrees between each group. The lower height percentiles are most sensitive to changes in height threshold, with the first return P5 changing from 0.06 m (0 m threshold) to 5.71 m (2 m threshold), while P95 changes from 29.91 m (0 m threshold) to 30.55 m (2 m threshold).
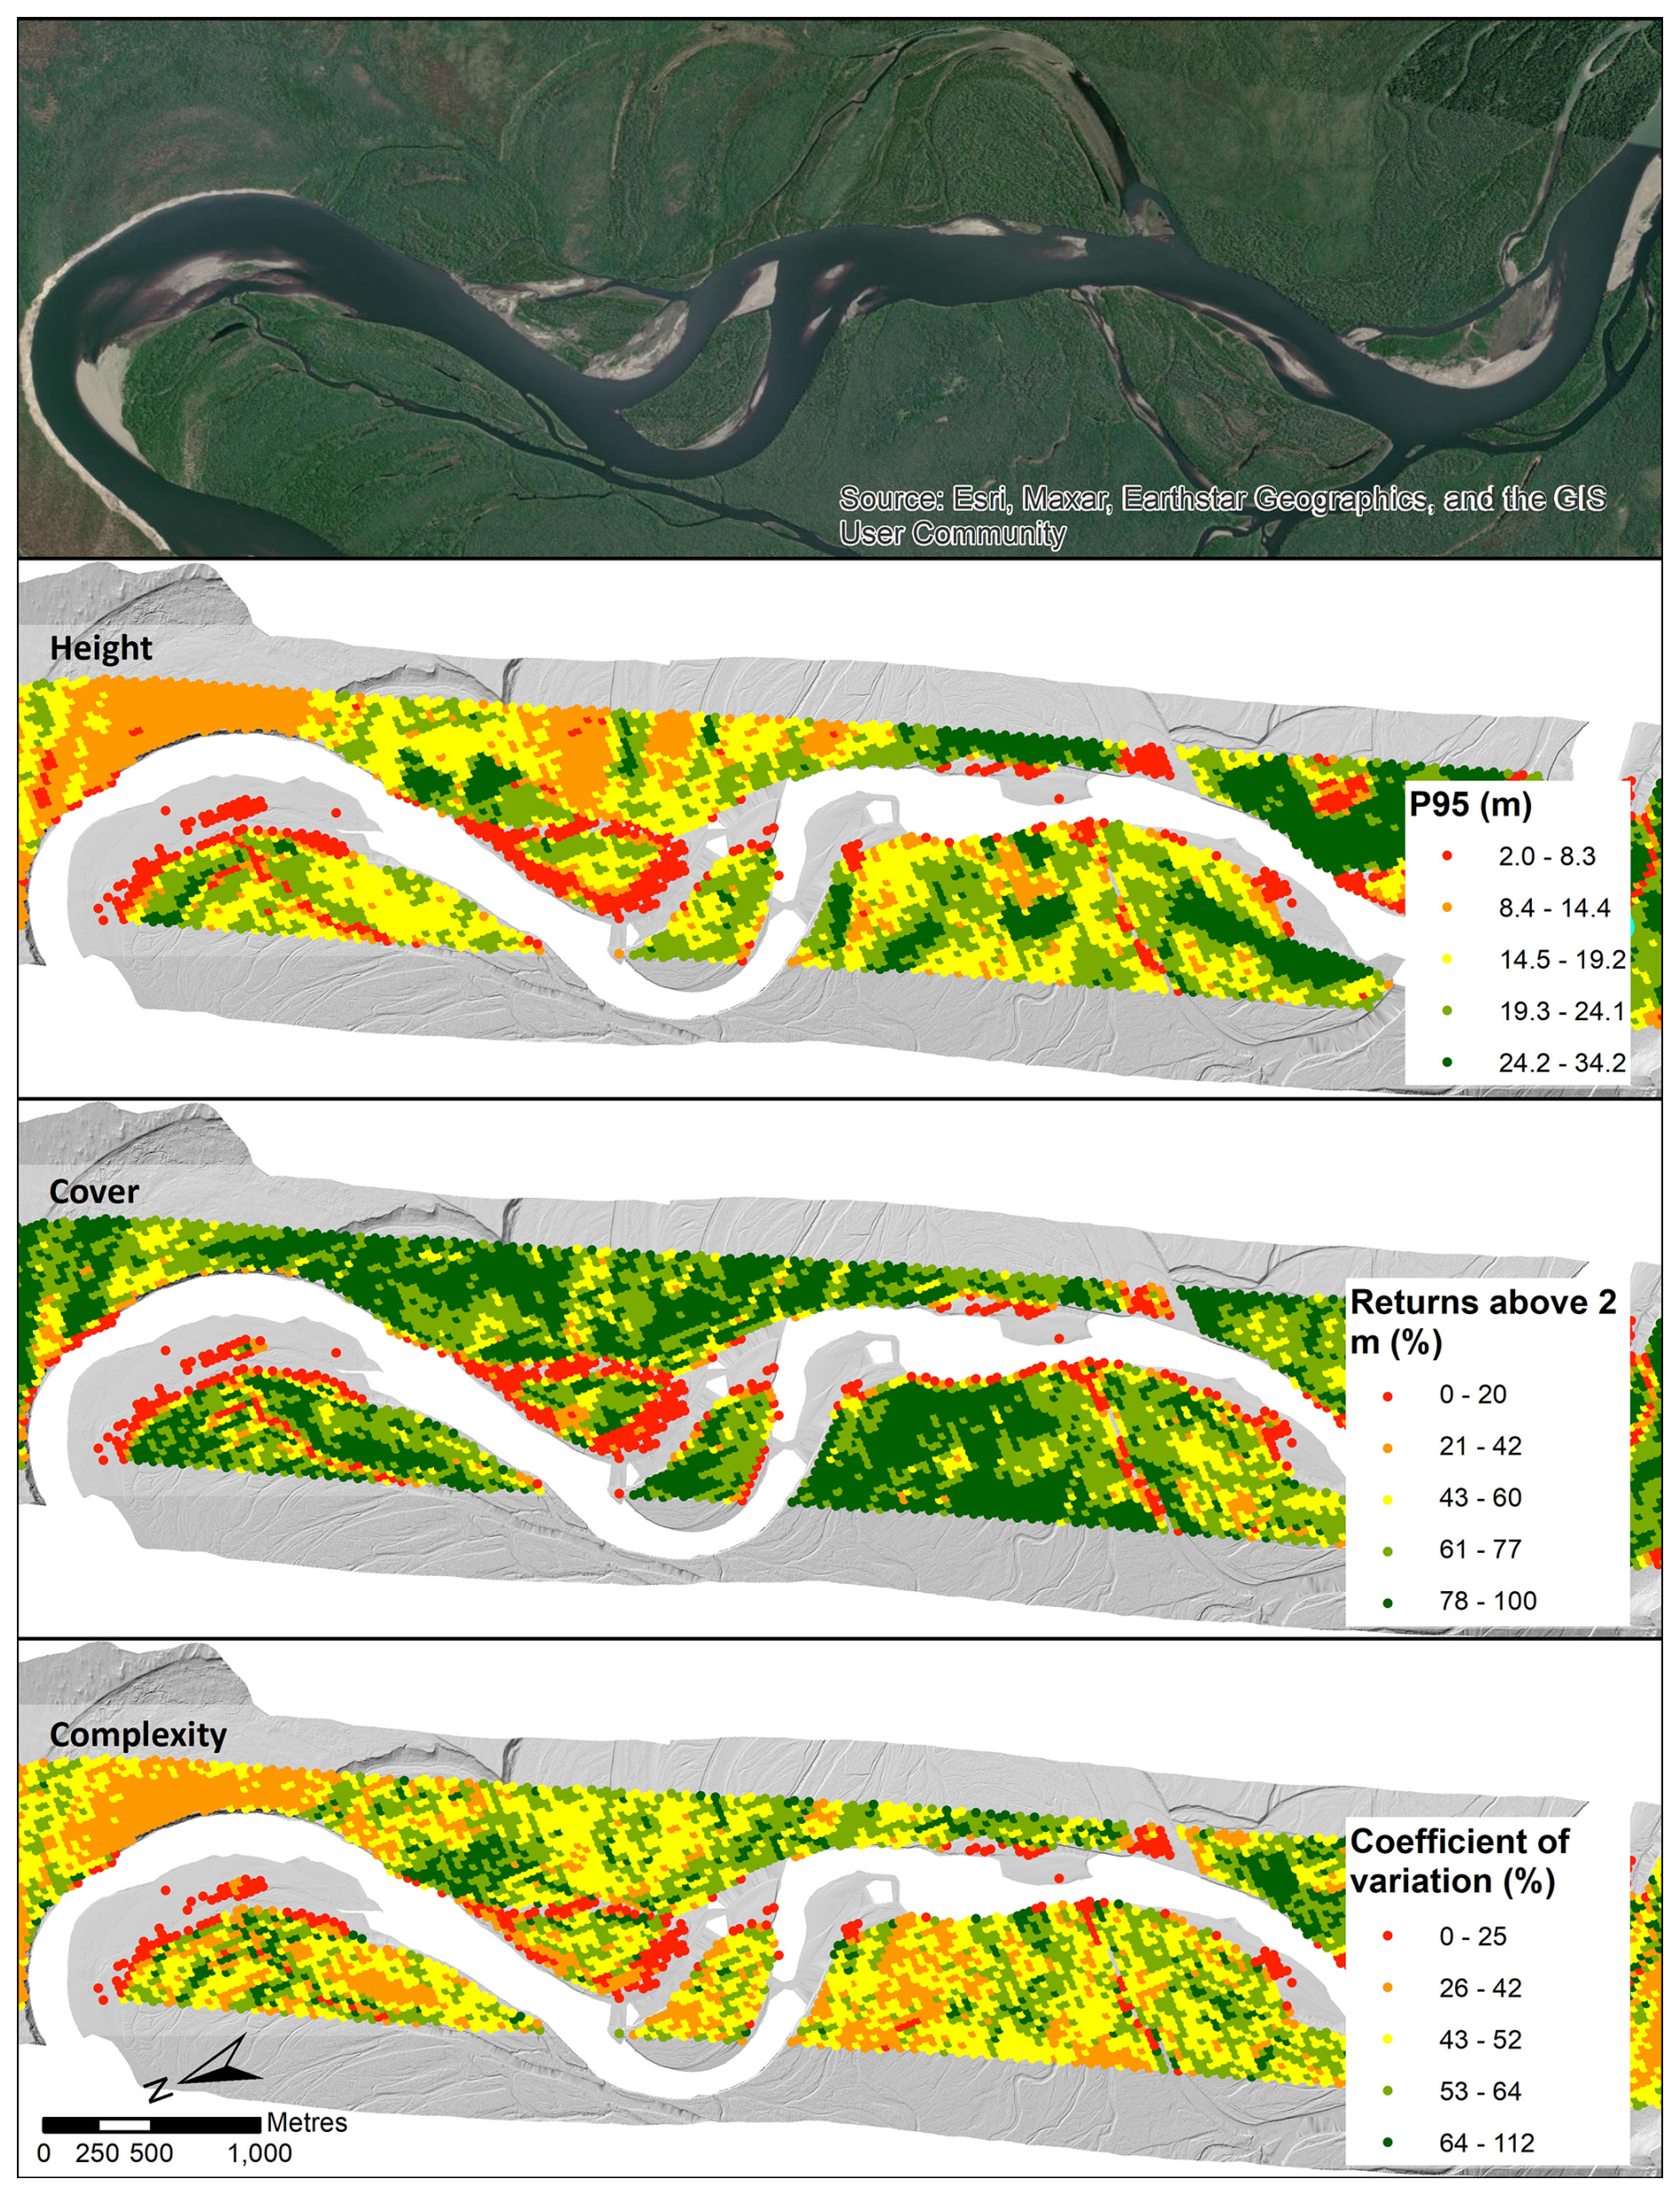
Figure 4Examples of lidar plot metrics, including: canopy height based on the 95th height percentile of first returns greater than 2 m; canopy cover based on the proportion of first returns greater than 2 m; and canopy complexity based on the coefficient of variation of first returns heights greater than 2 m. The image in the top panel extends beyond the ALS swath for added landscape context. The digital terrain model hillshade was derived from ALS returns with scan angles in excess of 20°, while lidar plots are limited to returns with scan angles less than or equal to 20° (Table 1). Data are located along the Liard River in northern British Columbia (59°53′22′′ N, 128°19′3′′ W).
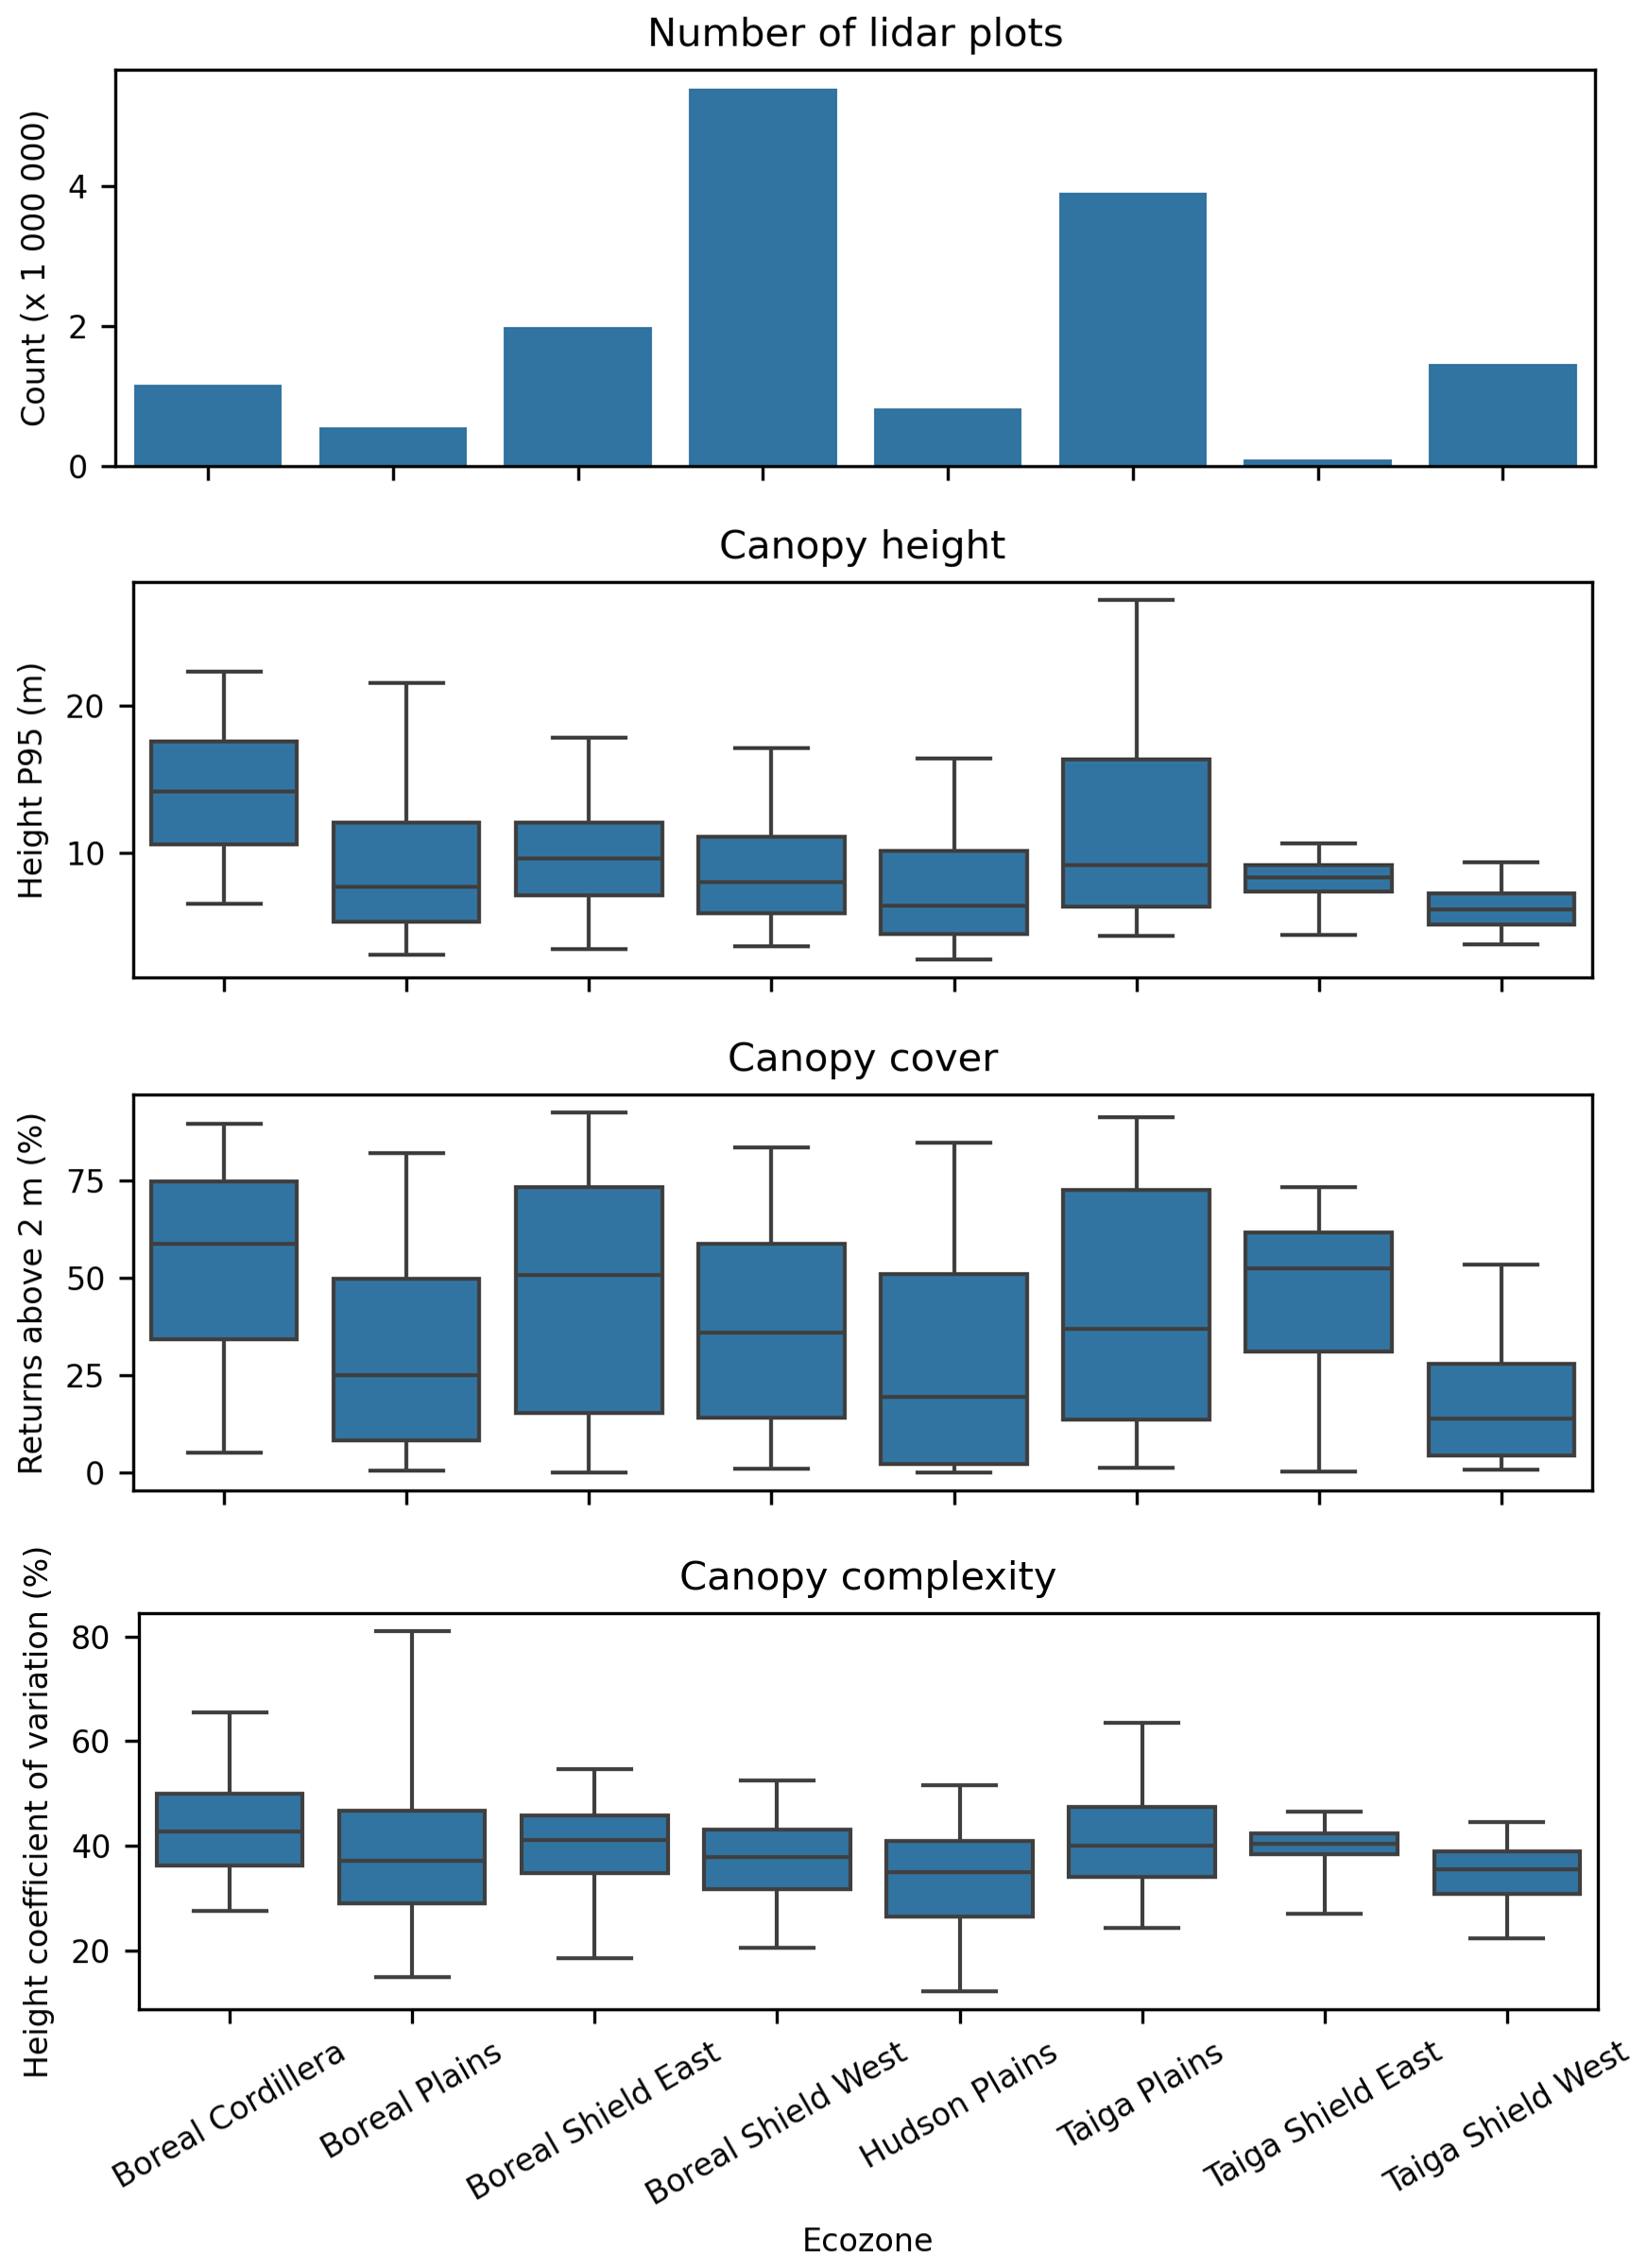
Figure 5Summary of vegetation metrics by ecozone (Fig. 1) for the 2023 acquisition (total n = 15 353 866 lidar plots). For the box and whisker plots, the box represents the interquartile range with the centre line showing the median, while the whiskers represent the 5th and 95th percentiles.
Fundamentally, lidar characterizes vegetation height, vertical structure, and cover (Li et al., 2008). Figure 4 shows examples of lidar plots with point cloud metrics related to these attributes along a reach of the Liard River in Northern British Columbia. Figure 5 provides summaries of height, cover and structure by ecozone for all 2023 lidar plots.
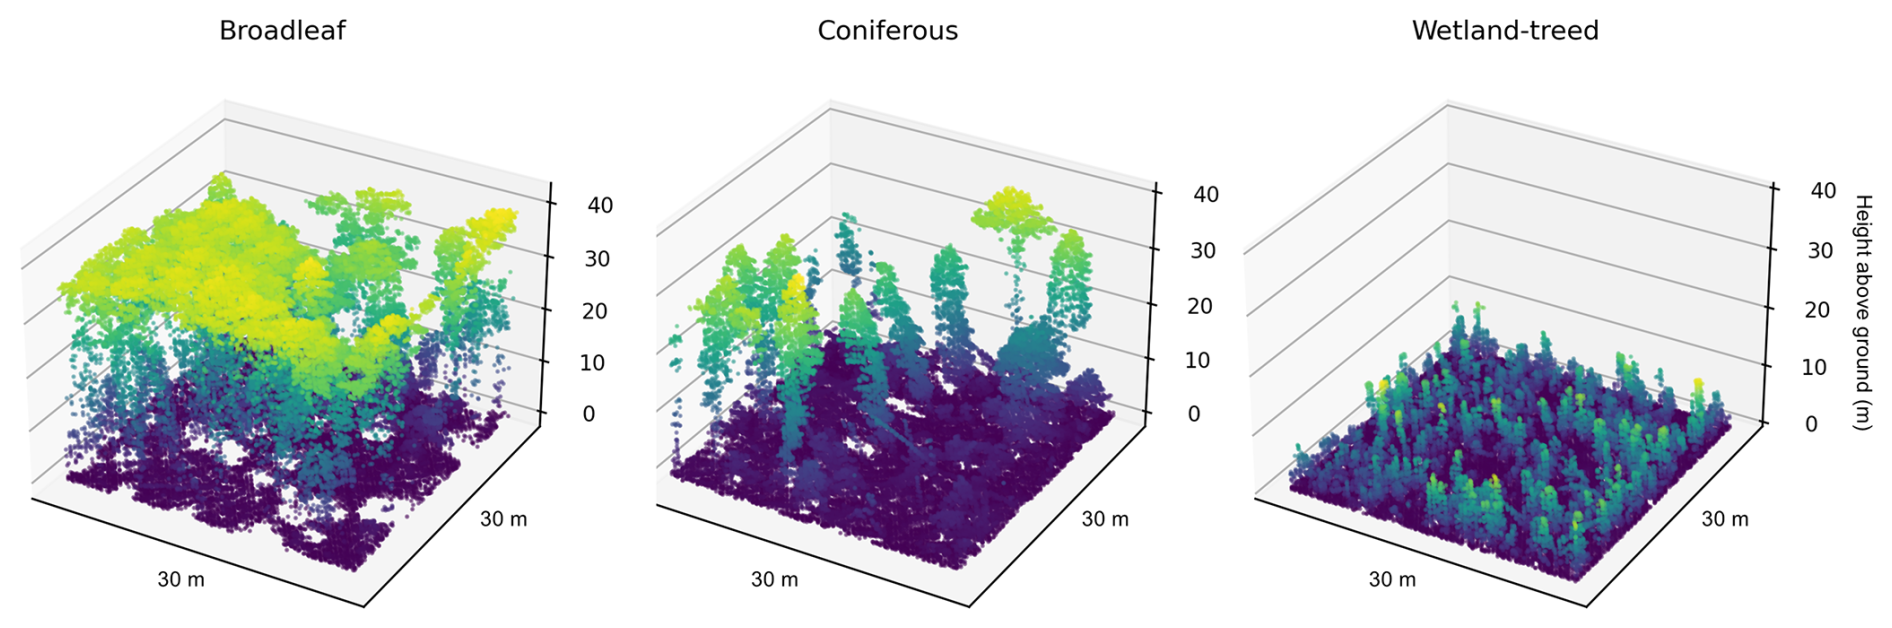
Figure 6Examples of point clouds within lidar plots for three different treed land cover types. The plots are located along the Prophet River in northern British Columbia (58°17′19′′ N, 122°52′30′′ W).
3.3.1 Comparison of lidar plots with NTEMS satellite information products
The NTEMS project provides a number of satellite-derived products characterizing forest-dominated ecozones, including land cover (Hermosilla et al., 2022) and recent wildfire disturbance history (Hermosilla et al., 2016). Figure 6 provides examples of point clouds clipped to lidar plots in three different treed land cover types. The broadleaf and coniferous plots are located in productive riparian stands, while the wetland-treed plot is located in a nearby treed bog or fen.
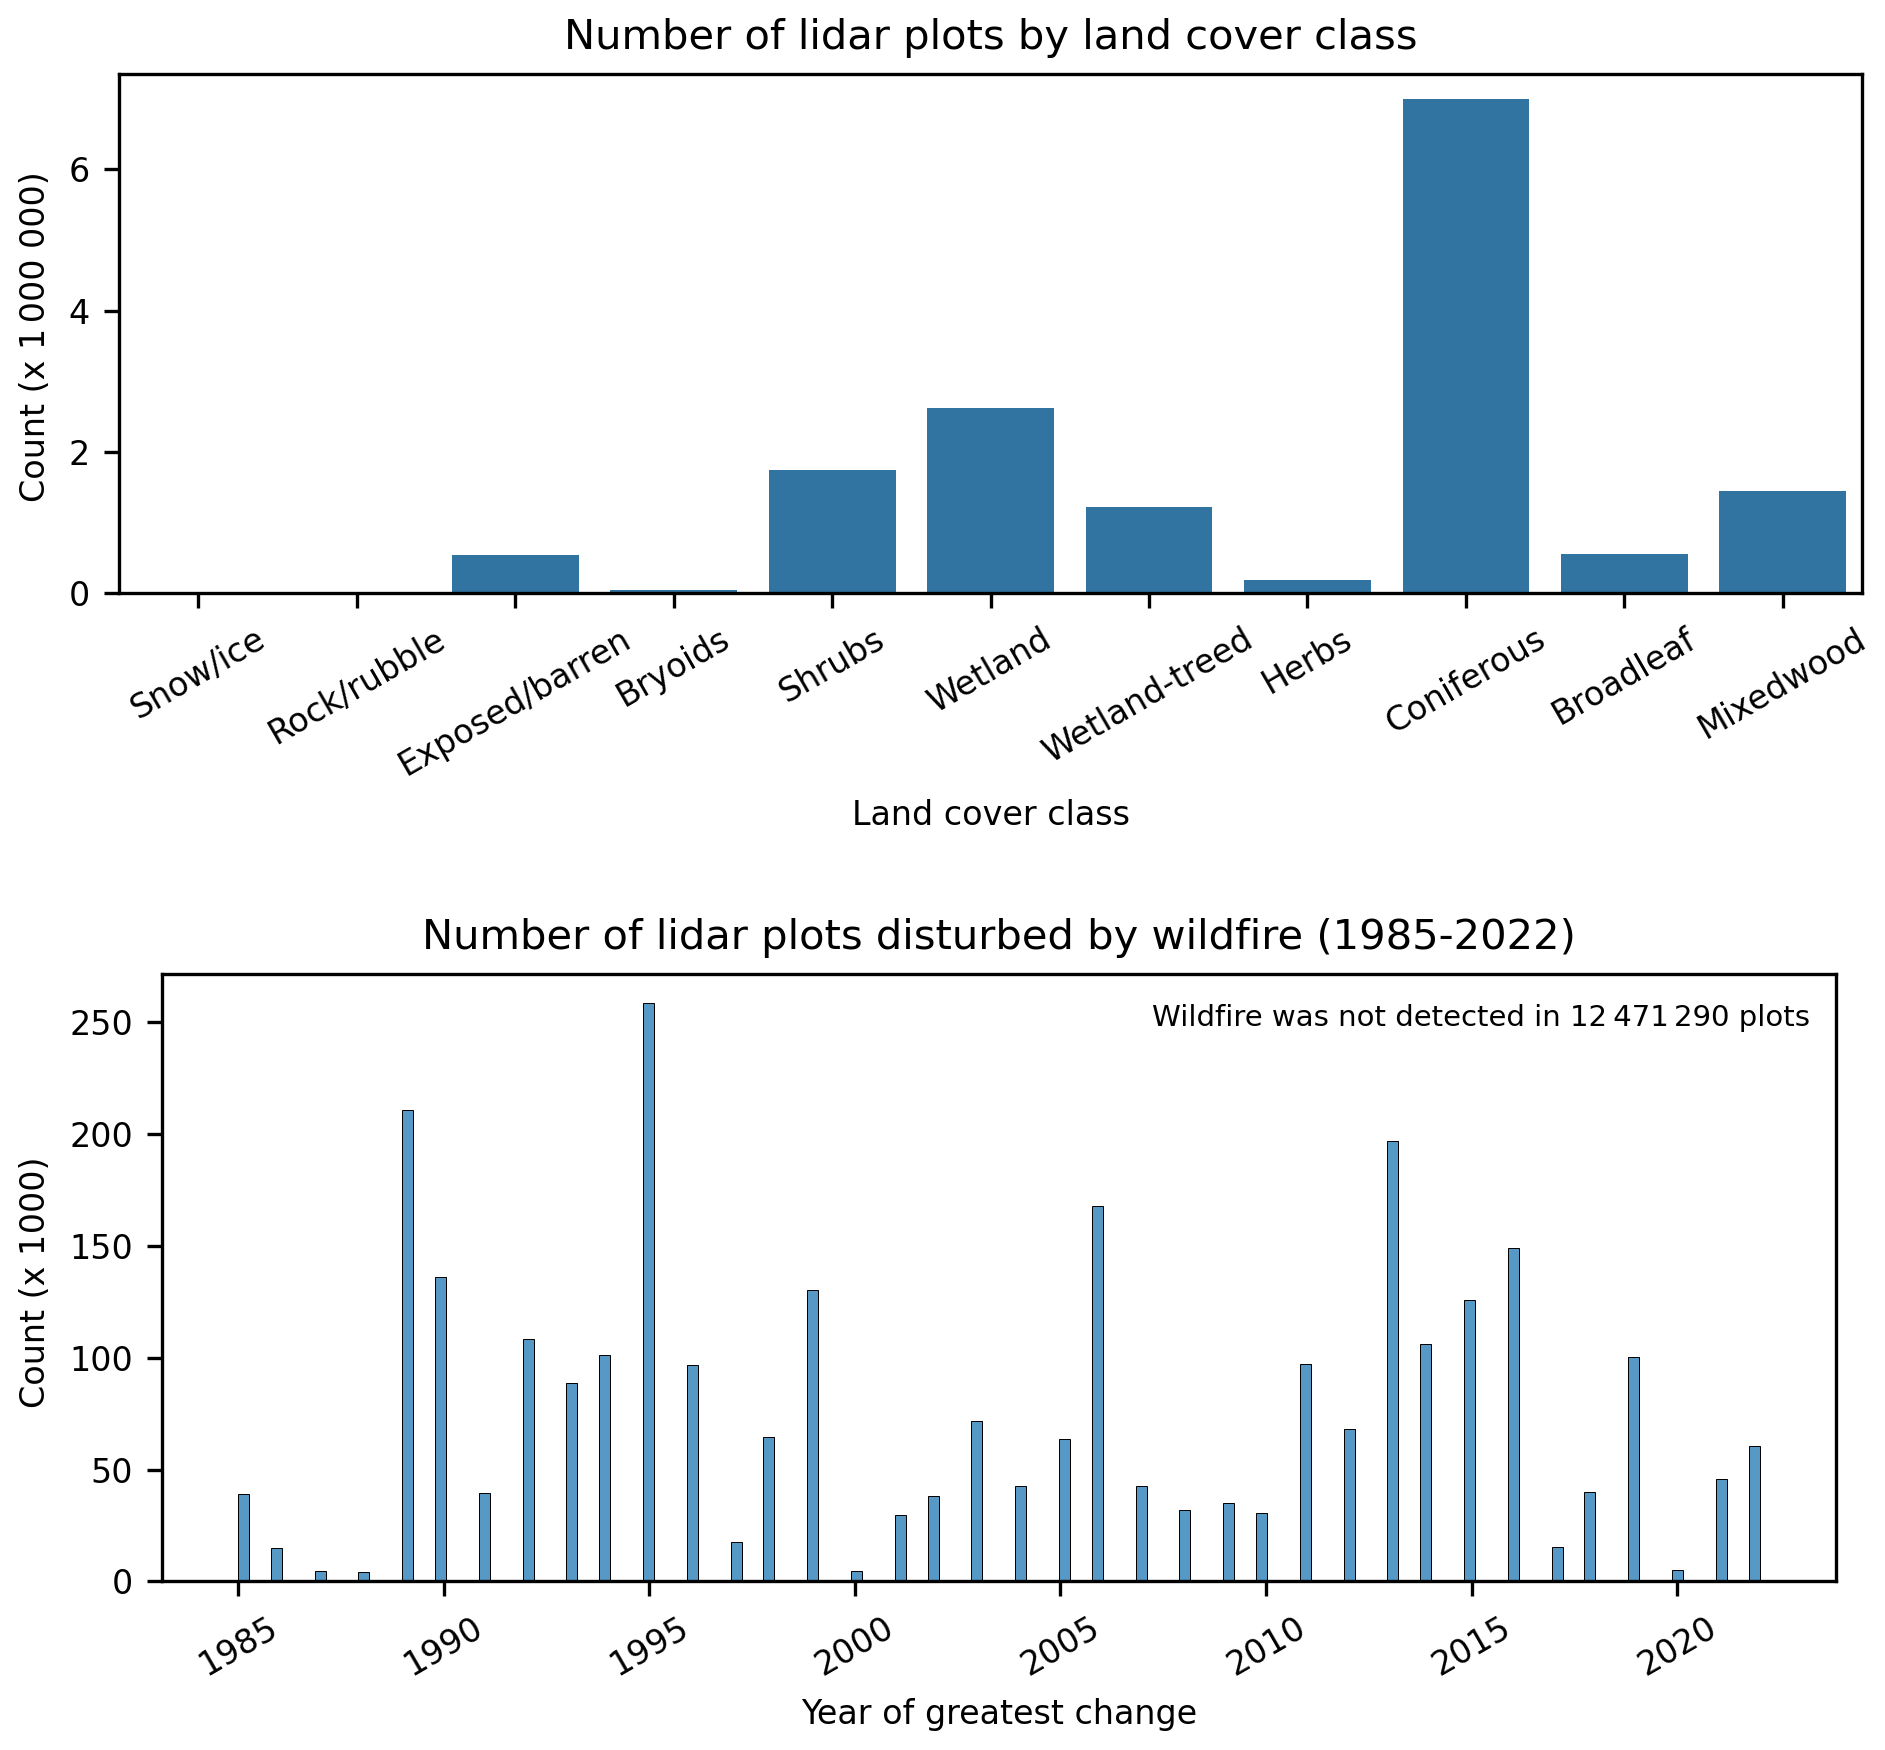
Figure 7Comparison between lidar plots and multidecadal NTEMS satellite information products, including land cover class (excluding water) and number of plots disturbed by wildfire between 1985 and 2022 (Hermosilla et al., 2016, 2022).
Figure 7 provides distributions of 2023 lidar plots for land cover and year of recent wildfire disturbance (1985–2022). For the 15 353 866 plots, the dominant land cover type (Hermosilla et al., 2022), excluding water within the plots, was coniferous (46 %), followed by wetland (17 %), shrubs (11 %), mixedwood (9 %), wetland-treed (8 %), broadleaf (4 %), exposed/barren land (3 %), herbs (1 %), bryoids (0.3 %), rock/rubble (0.04 %), and snow/ice (0.001 %). Moreover, 19 % were disturbed by wildfire (Hermosilla et al., 2016) between 1985 and 2022 (Fig. 7).
The ALS transects, lidar plots, and point cloud metrices presented here represent a comprehensive and coordinated effort to sample forest structure in Canada's unmanaged northern forests. By collecting high-density ALS data across ecologically diverse regions that lack structural information, this dataset fills a critical gap in the national forest monitoring landscape. The design and implementation of the acquisitions can address both scientific and operational needs, with particular relevance to wildfire fuel mapping (Andersen et al., 2005; Martin-Ducup et al., 2025; Riaño et al., 2003), forest inventory (Reutebuch et al., 2005; Wulder et al., 2008), carbon accounting (Andersen et al., 2011; Babcock et al., 2018), and ecosystem monitoring (Bolton et al., 2015; Matasci et al., 2018b). Open datasets allow fire researchers and other specialists unfamiliar with ALS point cloud processing to access these data in an analysis-ready and easy-to-use format. We chose to package the data as SQLite GeoPackages, using vector feature classes to store spatial data. The aim is to ensure that the data are readily accessible and easy to use for those familiar with geographic information systems or scientific programming languages such as Python, R or Julia. While ALS derivatives are typically distributed using raster formats (e.g. Assmann et al., 2022; Shi et al., 2025), the layout of the transects (Fig. 1) would result in raster surfaces consisting largely of “no data” values. Should a user desire, the point feature classes can be easily rasterized for inclusion in an analysis workflow requiring gridded surfaces. For users interested in leveraging NTEMS datasets (e.g. Hermosilla et al., 2022, 2024; Matasci et al., 2018a, b), the lidar plots will integrate seamlessly as all data share a common spatial resolution, projection (Table 3), and origin coordinates. Should users prefer to generate metrics at other spatial resolutions, the raw ALS point cloud data will also be made publicly available.
A key advantage of this dataset lies in its flexibility. The inclusion of point cloud metrics from the four combinations of return types and height thresholds (all returns and first returns, > 0 and > 2 m) supports diverse modeling approaches, including forest inventory, regeneration assessment, and canopy fuel characterization (Table 4, Fig. 3, Supplements S1 and S2). For those focused on developing forest inventories, point cloud metrics based on returns above 2 m, which remove the effects of shrubs and small trees, may be the most appropriate. For users interested in forest regeneration or fuels attributes such as canopy base height, retaining lower returns may be beneficial (Arumäe and Lang, 2018; Næsset, 2011; Stefanidou et al., 2020). The decision to use first returns or all returns may be guided by examining performance diagnostics from predictive models (Arumäe and Lang, 2018; Bater et al., 2011). White et al. (2013, 2017a) provide advice on model development for enhanced forest inventories, and the methods described and citations therein can inform a wide range of applications related to ALS and ecology.
The value of lidar plots lies in their role as a scalable intermediary between field measurements and satellite-based inventories, effectively increasing the sample size of required model inputs (Wulder et al., 2012b). When integrated with ground plots and satellite data, lidar plots can enable the generation of wall-to-wall maps of forest attributes such as height, volume, and biomass. This approach has been demonstrated nationally for Canada's forests using previously acquired ALS transects (Matasci et al., 2018a, b) and the expansion of this sampling framework with the new acquisitions described herein substantially increases coverage across previously unsampled areas.
Despite the aforementioned strengths of lidar plots, several aspects of these data warrant further consideration. In particular, the ALS acquisitions are largely restricted to northern forests (Fig. 1). Given the focused sampling to these northern forests, conditions present in the southern extent of Canada's forests will not be captured, as exemplified by the distributions of land cover classes within lidar plots (Fig. 7), which differ markedly from the national summaries reported by Hermosilla et al. (2022). As these lidar transects were specifically designed to characterize northern forest conditions, they would need to be augmented with ALS data from southern forests to enable the development of national models of forest structure, as demonstrated in Matasci et al. (2018b). With more than 70 % of Canada's managed forest area in the south having ALS data available (White et al., 2025), additional samples of ALS are readily available. Sampled transects also inhabit an unfamiliar form and scale for most users of ALS data. Within the lidar plots can be found detailed characterizations of both vegetation structure and terrain morphology (Figs. 4 and 6). The data can also be analyzed at regional scales, by pooling lidar plots (Fig. 5) to contribute to population estimates of attributes such as volume or biomass (Andersen et al., 2011; Margolis et al., 2015). However, by design transect data alone are not spatially exhaustive, precluding independent wall-to-wall mapping, and are intended to be incorporated with satellite and other ancillary data to support mapping via modelling methods such as imputation (Coops et al., 2021).
One of the objectives of the NorthForM program is the collection of coincident ALS and ground plot data. As the program progresses, GNSS locations from ground plots will be used to clip ALS point clouds to the plot extents. The same suite of 369 metrics described above (Table 4, Supplement file S1) will then be generated for the ground plots and made available. In combination, the forest inventory measurements made in situ within ground plots, ground plot point cloud metrics, and the lidar plot point cloud metrics will be powerful datasets for the spatially explicit predictive modelling of forest structure (Matasci et al., 2018a, b; Zald et al., 2016).
These data will be used for a number of initiatives. Wildfire specialists will employ the data to contribute to the development of predictive models that estimate fuel attributes such as canopy species composition, crown base height, crown bulk density, forest floor cover type, and litter load (Boucher et al., 2024). National models of forest inventory attributes will be improved and brought up-to-date, including those related to height, structural complexity, biomass, and volume (Matasci et al., 2018b). The data will also inform carbon accounting by contributing to the development of pixel-based biomass yield curves (Tompalski et al., 2025).
Beyond Canada, the ALS transect network provides an example for characterizing vegetation structure over large areas at a relatively low cost. The transects-based approach offers a transferable framework for designing national forest monitoring programs in countries where consistent, high spatial resolution structural data are lacking. By linking ALS measurements to ground plots and satellite observations, the dataset can support regional to global assessments of carbon stocks, disturbance dynamics, and climate-driven change.
Herein we focus largely on point cloud metrics derived from ALS data acquired in 2023; however, data collected in 2024 and 2025 will be made available following the same processing stream and use the same basic database schema described herein. The addition of terrain metrics (e.g. height, slope, curvature, solar radiation) is underway and will be included as an additional table in future releases. The raw ALS point cloud data will also be made publicly available.
The 2023 lidar plots and point cloud metrics described here are available at https://doi.org/10.5281/zenodo.16782860 on Zenodo (Bater et al., 2025). The 2023 data and collections from subsequent acquisition years collected under the same monitoring framework will be released as independent datasets and will share a common structure and repository. They will be made available in 2026 through Canada's National Forest Information System (NFIS, 2026) at: https://opendata.nfis.org/mapserver/nfis-change_eng.html. The most current versions of the metrics databases and raw ALS point clouds will be made findable through NFIS.
The lidar plots and point cloud metrics described herein form part of an open-data initiative to enhance structural information on Canada's northern forests. By sampling remote and underrepresented forest-dominated ecozones, this dataset supports key applications in wildfire risk assessment, forest inventory, and ecosystem monitoring. These data offer a scalable foundation for integrating field and satellite observations to inform national mapping and monitoring efforts, helping address long-standing data gaps in Canada's forest information landscape. In combination with similar lidar plots representing conditions in southern Canada, these data form a key input towards updating and improving the structural data layers (e.g., biomass, canopy height and cover) delivered via the National Terrestrial Ecosystem Monitoring System. The inclusion of a wide range of metrics provides flexibility for diverse predictive modeling needs, while the database structure ensures usability by researchers and practitioners who may not be well-versed in remote sensing.
The supplement related to this article is available online at https://doi.org/10.5194/essd-18-2075-2026-supplement.
Conceptualization by MW, JW, TH, and CB. Data curation by CB. Formal analysis by CB. Methodology by JW, CB, HC, and PT. Software by CB, HC, and PT. Supervision by MW, JW, and TH. Writing by CB, MW, JW, TH, and PT.
The contact author has declared that none of the authors has any competing interests.
Publisher's note: Copernicus Publications remains neutral with regard to jurisdictional claims made in the text, published maps, institutional affiliations, or any other geographical representation in this paper. The authors bear the ultimate responsibility for providing appropriate place names. Views expressed in the text are those of the authors and do not necessarily reflect the views of the publisher.
The ALS data were acquired with funding from the Canadian Forest Service's Northern Forest Mapping (NorthForM) program, which aims to enhance mapping of Canada's northern forests, identify wildfire hazards, and support community wildfire resilience and mitigation measures.
We thank Jonathan Boucher (Canadian Forest Service, Laurentian Forestry Centre) for his invaluable insights into the next generation of the Canadian Forest Fire Danger Rating System and how remote sensing data can support future fire beviour models.
The ALS data were acquired with funding from the Canadian Forest Service’s Northern Forest Mapping (NorthForM) program, which aims to enhance mapping of Canada’s northern forests, identify wildfire hazards, and support community wildfire resilience and mitigation measures.
This paper was edited by Christine I. B. Wallis and reviewed by Henning Buddenbaum and Yifang Shi.
Aldred, A. and Bonnor, G. M.: Application of airborne lasers to forest surveys, Canadian Forestry Service, Petawawa National Forestry Centre, Information Report PI-X-051, 62 pp., https://osdp-psdo.canada.ca/dp/en/search/metadata/NRCAN-CFS-1-4525 (last access: 6 March 2026), 1985.
Andersen, H. E., McGaughey, R. J., and Reutebuch, S. E.: Estimating forest canopy fuel parameters using LIDAR data, Remote Sens. Environ., 94, 441–449, https://doi.org/10.1016/j.rse.2004.10.013, 2005.
Andersen, H. E., Strunk, J., and Temesgen, H.: Using airborne light detection and ranging as a sampling tool for estimating forest biomass resources in the upper Tanana Valley of interior Alaska, West. J. Appl. For., 26, 157–164, https://doi.org/10.1093/wjaf/26.4.157, 2011.
Arumäe, T. and Lang, M.: Estimation of canopy cover in dense mixed-species forests using airborne lidar data, Eur. J. Remote Sens., 51, 132–141, https://doi.org/10.1080/22797254.2017.1411169, 2018.
Assmann, J. J., Moeslund, J. E., Treier, U. A., and Normand, S.: EcoDes-DK15: high-resolution ecological descriptors of vegetation and terrain derived from Denmark's national airborne laser scanning data set, Earth Syst. Sci. Data, 14, 823–844, https://doi.org/10.5194/essd-14-823-2022, 2022.
Babcock, C., Finley, A. O., Andersen, H. E., Pattison, R., Cook, B. D., Morton, D. C., Alonzo, M., Nelson, R., Gregoire, T., Ene, L., Gobakken, T., and Næsset, E.: Geostatistical estimation of forest biomass in interior Alaska combining Landsat-derived tree cover, sampled airborne lidar and field observations, Remote Sens. Environ., 212, 212–230, https://doi.org/10.1016/j.rse.2018.04.044, 2018.
Bater, C., White, J., Chen, H., Tompalski, P., Hermosilla, T., and Wulder, M.: Lidar plots and point cloud metrics derived from airborne laser scanning transects acquired over forests in northern Canada, Zenodo [data set], https://doi.org/10.5281/zenodo.16782860, 2025.
Bater, C. W., Wulder, M. A., Coops, N. C., Nelson, R. F., Hilker, T., and Nasset, E.: Stability of sample-based scanning-LiDAR-derived vegetation metrics for forest monitoring, IEEE T. Geosci. Remote, 49, 2385–2392, https://doi.org/10.1109/TGRS.2010.2099232, 2011.
Bolton, D. K., Coops, N. C., and Wulder, M. A.: Characterizing residual structure and forest recovery following high-severity fire in the western boreal of Canada using Landsat time-series and airborne lidar data, Remote Sens. Environ., 163, 48–60, https://doi.org/10.1016/j.rse.2015.03.004, 2015.
Boucher, J., Cotton-Gagnon, A., Dagnault, S., Zerb, J., Smiley, B. P., Russo, G., and Nolan, M.: Field guide: sampling fuels in the context of the Next-Generation Canadian Forest Fire Danger Rating System (NG-CFFDRS), Field Sampling Protocol and List of Attributes for Field Crews (2024), 30 pp., https://nfi.nfis.org/resources/others/Field_Guide_of_NG_Protocol_2024_v1.1_en.pdf (last access: 6 March 2026), 2024.
Bourdeau-Goulet, S. and Hassanzadeh, E.: Comparisons between CMIP5 and CMIP6 models: simulations of climate indices influencing food security, infrastructure resilience, and human health in Canada, Earths Future, 9, e2021EF001995, https://doi.org/10.1029/2021EF001995, 2021.
Bouvier, M., Durrieu, S., Fournier, R. A., and Renaud, J. P.: Generalizing predictive models of forest inventory attributes using an area-based approach with airborne LiDAR data, Remote Sens. Environ., 156, 322–334, https://doi.org/10.1016/j.rse.2014.10.004, 2015.
Brandt, J. P.: The extent of the North American boreal zone, Environ. Rev., 17, 101–161, https://doi.org/10.1139/A09-004, 2009.
Burton, P. J.: Understanding spring wildfires in Canada's northern forests, Glob. Change Biol., 29, 5983–5985, https://doi.org/10.1111/gcb.16879, 2023.
Canada's National Forest Information System: NTEMS Products, https://opendata.nfis.org/mapserver/nfis-change_eng.html, last access: 6 March 2026.
Canadian Forest Service Fire Danger Group: An overview of the next generation of the Canadian Forest Fire Danger Rating System (Information Report GLC-X-26), 70 pp., https://osdp-psdo.canada.ca/dp/en/search/metadata/NRCAN-CFS-1-40474 (last access: 6 March 2026), 2021.
Coops, N. C., Tompalski, P., Goodbody, T. R. H., Queinnec, M., Luther, J. E., Bolton, D. K., White, J. C., Wulder, M. A., van Lier, O. R., and Hermosilla, T.: Modelling lidar-derived estimates of forest attributes over space and time: A review of approaches and future trends, Remote Sens. Environ., 260, 112477, https://doi.org/10.1016/j.rse.2021.112477, 2021.
Crowley, M. A., Stockdale, C. A., Johnston, J. M., Wulder, M. A., Liu, T., McCarty, J. L., Rieb, J. T., Cardille, J. A., and White, J. C.: Towards a whole-system framework for wildfire monitoring using Earth observations, Glob. Change Biol., 29, 1423–1436, https://doi.org/10.1111/gcb.16567, 2023.
CSA Group: Airborne lidar data acquisition, 83 pp., https://www.csagroup.org/store/product/2431645/ (last access: 6 March 2026), 2025.
Fassnacht, F. E., White, J. C., Wulder, M. A., and Næsset, E.: Remote sensing in forestry: current challenges, considerations and directions, Forestry, 97, 11–37, https://doi.org/10.1093/forestry/cpad024, 2024.
Frazer, G. W., Magnussen, S., Wulder, M. A., and Niemann, K. O.: Simulated impact of sample plot size and co-registration error on the accuracy and uncertainty of LiDAR-derived estimates of forest stand biomass, Remote Sens. Environ., 115, 636–649, https://doi.org/10.1016/j.rse.2010.10.008, 2011.
Gillis, M. D., Omule, A. Y., and Brierley, T.: Monitoring Canada's forests: The National Forest Inventory, Forest. Chron., 81, 214–221, https://doi.org/10.5558/tfc81214-2, 2005.
Guindon, L., Manka, F., Correia, D. L. P., Villemaire, P., Smiley, B., Bernier, P., Gauthier, S., Beaudoin, A., Boucher, J., and Boulanger, Y.: A new approach for Spatializing the CAnadian National Forest Inventory (SCANFI) using Landsat dense time series, Can. J. Forest Res., 2010, https://doi.org/10.1139/cjfr-2023-0118, 2024.
Hansen, M. C., Egorov, A., Potapov, P. V., Stehman, S. V., Tyukavina, A., Turubanova, S. A., Roy, D. P., Goetz, S. J., Loveland, T. R., Ju, J., Kommareddy, A., Kovalskyy, V., Forsyth, C., and Bents, T.: Monitoring conterminous United States (CONUS) land cover change with Web-Enabled Landsat Data (WELD), Remote Sens. Environ., 140, 466–484, https://doi.org/10.1016/j.rse.2013.08.014, 2014.
Haslem, A., Kelly, L. T., Nimmo, D. G., Watson, S. J., Kenny, S. A., Taylor, R. S., Avitabile, S. C., Callister, K. E., Spence-Bailey, L. M., Clarke, M. F., and Bennett, A. F.: Habitat or fuel? Implications of long-term, post-fire dynamics for the development of key resources for fauna and fire, J. Appl. Ecol., 48, 247–256, https://doi.org/10.1111/j.1365-2664.2010.01906.x, 2011.
Hermosilla, T., Wulder, M. A., White, J. C., Coops, N. C., Hobart, G. W., and Campbell, L. B.: Mass data processing of time series Landsat imagery: pixels to data products for forest monitoring, Int. J. Digit. Earth, 9, 1035–1054, https://doi.org/10.1080/17538947.2016.1187673, 2016.
Hermosilla, T., Wulder, M. A., White, J. C., and Coops, N. C.: Land cover classification in an era of big and open data: Optimizing localized implementation and training data selection to improve mapping outcomes, Remote Sens. Environ., 268, 112780, https://doi.org/10.1016/j.rse.2021.112780, 2022.
Hermosilla, T., Wulder, M. A., White, J. C., Coops, N. C., Bater, C. W., and Hobart, G. W.: Characterizing long-term tree species dynamics in Canada's forested ecosystems using annual time series remote sensing data, Forest Ecol. Manag., 572, 122313, https://doi.org/10.1016/j.foreco.2024.122313, 2024.
Hopkinson, C., Wulder, M. A., Coops, N. C., Milne, T., Fox, A., and Bater, C. W.: Airborne lidar sampling of the Canadian boreal forest: planning, execution, and initial processing, in: Proceedings of the SilviLaser 2011 Conference, https://www.researchgate.net/profile/Michael-Wulder/publication/236455362_Airborne_lidar_sampling_of_the_ Canadian_boreal_forest_planning_execution_and_initial_ processing/links/63d99d73c97bd76a82 4ec55a/Airborne-lidar-sampling-of-the-Canadian-boreal-forest-planning-execution-and-initial-processing.pdf (last access: 6 March 2026), 2011.
Hopkinson, C., Lovell, J., Chasmer, L., Jupp, D., Kljun, N., and van Gorsel, E.: Integrating terrestrial and airborne lidar to calibrate a 3D canopy model of effective leaf area index, Remote Sens. Environ., 136, 301–314, https://doi.org/10.1016/j.rse.2013.05.012, 2013.
Jain, P., Barber, Q. E., Taylor, S. W., Whitman, E., Castellanos Acuna, D., Boulanger, Y., Chavardès, R. D., Chen, J., Englefield, P., Flannigan, M., Girardin, M. P., Hanes, C. C., Little, J., Morrison, K., Skakun, R. S., Thompson, D. K., Wang, X., and Parisien, M.: Drivers and impacts of the record-breaking 2023 wildfire season in Canada, Nat. Commun., 15, 6764, https://doi.org/10.1038/s41467-024-51154-7, 2024.
Kane, V. R., Bakker, J. D., McGaughey, R. J., Lutz, J. A., Gersonde, R. F., and Franklin, J. F.: Examining conifer canopy structural complexity across forest ages and elevations with LiDAR data, Can. J. Forest Res., 40, 774–787, https://doi.org/10.1139/X10-064, 2010.
Keane, R. E., Reinhardt, E. D., Scott, J., Gray, K., and Reardon, J.: Estimating forest canopy bulk density using six indirect methods, Can. J. Forest Res., 35, 724–739, https://doi.org/10.1139/x04-213, 2005.
Keith, H., Mackey, B. G., and Lindenmayer, D. B.: Re-evaluation of forest biomass carbon stocks and lessons from the world's most carbon-dense forests, P. Natl. Acad. Sci. USA, 106, 11635–11640, https://doi.org/10.1073/pnas.0901970106, 2009.
Lefsky, M. A., Cohen, W. B., Parker, G. G., and Harding, D. J.: Lidar remote sensing for ecosystem studies, BioScience, 52, 19–30, https://doi.org/10.1641/0006-3568(2002)052[0019:LRSFES]2.0.CO;2, 2002.
Lefsky, M. A., Hudak, A. T., Cohen, W. B., and Acker, S. A.: Patterns of covariance between forest stand and canopy structure in the Pacific Northwest, Remote Sens. Environ., 95, 517–531, https://doi.org/10.1016/j.rse.2005.01.004, 2005.
Li, Y., Andersen, H., and McGaughey, R.: A comparison of statistical methods for estimating forest biomass from light detection and ranging data, West. J. Appl. For., 23, 223–231, https://doi.org/10.1093/wjaf/23.4.223, 2008.
Magnussen, S. and Boudewyn, P.: Derivations of stand heights from airborne laser scanner data with canopy-based quantile estimators, Can. J. Forest Res., 28, 1016–1031, 1998.
Margolis, H. A., Nelson, R. F., Montesano, P. M., Beaudoin, A., Sun, G., Andersen, H. E., and Wulder, M. A.: Combining satellite lidar, airborne lidar, and ground plots to estimate the amount and distribution of aboveground biomass in the boreal forest of North America, Can. J. Forest Res., 45, 838–855, https://doi.org/10.1139/cjfr-2015-0006, 2015.
Martin-Ducup, O., Dupuy, J. L., Soma, M., Guerra-Hernandez, J., Marino, E., Fernandes, P. M., Just, A., Corbera, J., Toutchkov, M., Sorribas, C., Bock, J., Piboule, A., Pirotti, F., and Pimont, F.: Unlocking the potential of Airborne LiDAR for direct assessment of fuel bulk density and load distributions for wildfire hazard mapping, Agr. Forest Meteorol., 362, https://doi.org/10.1016/j.agrformet.2024.110341, 2025.
Matasci, G., Hermosilla, T., Wulder, M. A., White, J. C., Coops, N. C., Hobart, G. W., and Zald, H. S. J.: Large-area mapping of Canadian boreal forest cover, height, biomass and other structural attributes using Landsat composites and lidar plots, Remote Sens. Environ., 209, 90–106, https://doi.org/10.1016/j.rse.2017.12.020, 2018a.
Matasci, G., Hermosilla, T., Wulder, M. A., White, J. C., Coops, N. C., Hobart, G. W., Bolton, D. K., Tompalski, P., and Bater, C. W.: Three decades of forest structural dynamics over Canada's forested ecosystems using Landsat time-series and lidar plots, Remote Sens. Environ., 216, 697–714, https://doi.org/10.1016/j.rse.2018.07.024, 2018b.
McGaughey, R. J.: FUSION/LDV: Software for LIDAR Data Analysis and Visualization, http://forsys.sefs.uw.edu/fusion/fusionlatest.html (last access: 6 March 2026), 2024.
Moran, C. J., Kane, V. R., and Seielstad, C. A.: Mapping forest canopy fuels in the western United States with LiDAR-Landsat covariance, Remote Sens., 12, https://doi.org/10.3390/rs12061000, 2020.
Mutlu, M., Popescu, S. C., Stripling, C., and Spencer, T.: Mapping surface fuel models using lidar and multispectral data fusion for fire behavior, Remote Sens. Environ., 112, 274–285, https://doi.org/10.1016/j.rse.2007.05.005, 2008.
Næsset, E.: Predicting forest stand characteristics with airborne scanning laser using a practical two-stage procedure and field data, Remote Sens. Environ., 80, 88–99, https://doi.org/10.1016/S0034-4257(01)00290-5, 2002.
Næsset, E.: Practical large-scale forest stand inventory using a small-footprint airborne scanning laser, Scand. J. Forest Res., 19, 164–179, https://doi.org/10.1080/02827580310019257, 2004.
Næsset, E.: Estimating above-ground biomass in young forests with airborne laser scanning, Int. J. Remote Sens., 32, 473–501, https://doi.org/10.1080/01431160903474970, 2011.
Natural Resources Canada: The State of Canada's Forests: Annual Report 2023, Natural Resources Canada, Canadian Forest Service, Ottawa, Ontario, 116 pp., https://natural-resources.canada.ca/sites/nrcan/files/forest/sof2023/NRCAN_SofForest_Annual_2023_EN_accessible-vf.pdf (last access: 6 March 2026), 2023.
Nelson, R.: How did we get here? An early history of forestry lidar, Can. J. Remote Sens., 39, S6–S17, https://doi.org/10.5589/m13-011, 2013.
Nelson, R., Gobakken, T., Næsset, E., Gregoire, T. G., Ståhl, G., Holm, S., and Flewelling, J.: Lidar sampling - Using an airborne profiler to estimate forest biomass in Hedmark County, Norway, Remote Sens. Environ., 123, 563–578, https://doi.org/10.1016/j.rse.2011.10.036, 2012.
Nilsson, M.: Estimation of tree heights and stand volume using an airborne lidar system, Remote Sens. Environ., 56, 1–7, https://doi.org/10.1016/0034-4257(95)00224-3, 1996.
Ogle, S. M., Domke, G., Kurz, W. A., Rocha, M. T., Huffman, T., Swan, A., Smith, J. E., Woodall, C., and Krug, T.: Delineating managed land for reporting national greenhouse gas emissions and removals to the United Nations framework convention on climate change, Carbon Balance Manag., 13, https://doi.org/10.1186/s13021-018-0095-3, 2018.
Parisien, M. A., Barber, Q. E., Hirsch, K. G., Stockdale, C. A., Erni, S., Wang, X., Arseneault, D., and Parks, S. A.: Fire deficit increases wildfire risk for many communities in the Canadian boreal forest, Nat. Commun., 11, https://doi.org/10.1038/s41467-020-15961-y, 2020.
Parisien, M. A., Barber, Q. E., Flannigan, M. D., and Jain, P.: Broadleaf tree phenology and springtime wildfire occurrence in boreal Canada, Glob. Change Biol., 29, 6106–6119, https://doi.org/10.1111/gcb.16820, 2023.
Reutebuch, S. E., Anderson, H. E., and McGaughey, R. J.: Light detection and ranging (LIDAR): an emerging tool for multiple resource inventory, J. Forest., 103, 286–292, 2005.
Riaño, D., Meier, E., Allgöwer, B., Chuvieco, E., and Ustin, S. L.: Modeling airborne laser scanning data for the spatial generation of critical forest parameters in fire behavior modeling, Remote Sens. Environ., 86, 177–186, https://doi.org/10.1016/S0034-4257(03)00098-1, 2003.
Riaño, D., Chuvieco, E., Condés, S., González-Matesanz, J., and Ustin, S. L.: Generation of crown bulk density for Pinus sylvestris L. from lidar, Remote Sens. Environ., 92, 345–352, https://doi.org/10.1016/j.rse.2003.12.014, 2004.
Roussel, J. R. and Auty, D.: lidR: Airborne LiDAR Data Manipulation and Visualization for Forestry Applications, https://cran.r-project.org/package=lidR (last access: 6 March 2026), 2023.
Roussel, J. R., Auty, D., Coops, N. C., Tompalski, P., Goodbody, T. R. H., Meador, A. S., Bourdon, J. F., de Boissieu, F., and Achim, A.: lidR: An R package for analysis of Airborne Laser Scanning (ALS) data, Remote Sens. Environ., 251, 112061, https://doi.org/10.1016/j.rse.2020.112061, 2020.
Shannon, C. E.: A mathematical theory of communication, Bell Syst. Tech. J., 27, 379–423, https://doi.org/10.1002/j.1538-7305.1948.tb01338.x, 1948.
Shi, Y., Wang, J., and Kissling, W. D.: Multi-temporal high-resolution data products of ecosystem structure derived from country-wide airborne laser scanning surveys of the Netherlands, Earth Syst. Sci. Data, 17, 3641–3677, https://doi.org/10.5194/essd-17-3641-2025, 2025.
Singh, K. K., Chen, G., Vogler, J. B., and Meentemeyer, R. K.: When big data are too much: effects of LiDAR returns and point density on estimation of forest biomass, IEEE J. Sel. Top. Appl., 9, 3210–3218, https://doi.org/10.1109/JSTARS.2016.2522960, 2016.
Solberg, S., Næsset, E., Hanssen, K. H., and Christiansen, E.: Mapping defoliation during a severe insect attack on Scots pine using airborne laser scanning, Remote Sens. Environ., 102, 364–376, https://doi.org/10.1016/j.rse.2006.03.001, 2006.
Stefanidou, A., Gitas, I. Z., Korhonen, L., Stavrakoudis, D., and Georgopoulos, N.: LiDAR-based estimates of canopy base height for a dense uneven-aged structured forest, Remote Sens., 12, 1–20, https://doi.org/10.3390/rs12101565, 2020.
Stinson, G., Thandi, G., Aitkin, D., Bailey, C., Boyd, J., Colley, M., Fraser, C., Gelhorn, L., Groenewegen, K., Hogg, A., Kapron, J., Leboeuf, A., Makar, M., Montigny, M., Pittman, B., Price, K., Salkeld, T., Smith, L., Viveiros, A., and Wilson, D.: A new approach for mapping forest management areas in Canada, Forest. Chron., 95, 101–112, https://doi.org/10.5558/tfc2019-017, 2019.
Tews, J., Brose, U., Grimm, V., Tielbörger, K., Wichmann, M. C., Schwager, M., and Jeltsch, F.: Animal species diversity driven by habitat heterogeneity/diversity: The importance of keystone structures, J. Biogeogr., 31, 79–92, https://doi.org/10.1046/j.0305-0270.2003.00994.x, 2004.
Tompalski, P.: lidRmetrics, https://github.com/ptompalski/lidRmetrics (last access: 9 Mach 2026), 2024.
Tompalski, P., Hermosilla, T., Baral, S. K., Wulder, M. A., and White, J. C.: National remote sensing-derived aboveground biomass yield curves for Canada, Forestry, cpaf067, https://doi.org/10.1093/forestry/cpaf067, 2025.
van Ewijk, K. Y., Treitz, P. M., and Scott, N. A.: Characterizing forest succession in central Ontario using lidar-derived indices, Photogramm. Eng. Rem. S., 77, 261–269, https://doi.org/10.1117/12.2223586, 2011.
Vogelmann, J. E., Howard, S. M., Yang, L., Larson, C. R., Wylie, B. K., and VanDriel, N.: Completion of the 1990s National Land Cover Data set for the conterminous United States from Landsat Thematic Mapper data and ancillary data sources, Photogramm. Eng. Rem. S., 67, 650–662, 2001.
Wells, J. V., Dawson, N., Culver, N., Reid, F. A., and Morgan Siegers, S.: The state of conservation in North America's Boreal Forest: issues and opportunities, Front. For. Glob. Chang., 3, 1–18, https://doi.org/10.3389/ffgc.2020.00090, 2020.
White, J. C., Wulder, M. A., Varhola, A., Vastaranta, M., Coops, N. C., Cook, B. D., Pitt, D., and Woods, M.: A best practices guide for generating forest inventory attributes from airborne laser scanning data using an area-based approach, Natural Resources Canada, Canadian Forest Service, Canadian Wood Fibre Centre, Information Report FI-X-010, 50 pp., https://ostrnrcan-dostrncan.canada.ca/handle/1845/245224 (last access: 9 March 2026), 2013.
White, J. C., Wulder, M. A., Hobart, G. W., Luther, J. E., Hermosilla, T., Griffiths, P., Coops, N. C., Hall, R. J., Hostert, P., Dyk, A., and Guindon, L.: Pixel-based image compositing for large-area dense time series applications and science, Can. J. Remote Sens., 40, 192–212, https://doi.org/10.1080/07038992.2014.945827, 2014.
White, J. C., Tompalski, P., Vastaranta, M., Wulder, M. A., Saarinen, Stepper, C., and Coops, N. C.: A model development and application guide for generating an enhanced forest inventory using airborne laser scanning data and an area-based approach, CWFC Information Report FI-X-018, https://ostrnrcan-dostrncan.canada.ca/handle/1845/229341 (last access: 9 March 2026), 2017a.
White, J. C., Wulder, M. A., Hermosilla, T., Coops, N. C., and Hobart, G. W.: A nationwide annual characterization of 25 years of forest disturbance and recovery for Canada using Landsat time series, Remote Sens. Environ., 194, 303–321, https://doi.org/10.1016/j.rse.2017.03.035, 2017b.
White, J. C., Tompalski, P., Bater, C. W., Wulder, M. A., Fortin, M., Hennigar, C., Robere-McGugan, G., Sinclair, I., and White, R.: Enhanced forest inventories in Canada: implementation, status, and research needs, Can. J. Forest Res., 55, 1–37, https://doi.org/10.1139/cjfr-2024-0255, 2025.
Woods, M., Lim, K., and Treitz, P.: Predicting forest stand variables from LiDAR data in the Great Lakes – St. Lawrence forest of Ontario, Forest. Chron., 84, 827–839, 2008.
Wulder, M. A., Bater, C. W., Coops, N. C., Hilker, T., and White, J. C.: The role of LiDAR in sustainable forest management, Fores. Chron., 84, 807–826, https://doi.org/10.5558/tfc84807-6, 2008.
Wulder, M. A., White, J. C., Bater, C. W., Coops, N. C., Hopkinson, C., and Chen, G.: Lidar plots — a new large-area data collection option: context, concepts, and case study, Can. J. Remote Sens., 38, 600–618, https://doi.org/10.5589/m12-049, 2012a.
Wulder, M. A., White, J. C., Nelson, R. F., Næsset, E., Ørka, H. O., Coops, N. C., Hilker, T., Bater, C. W., and Gobakken, T.: Lidar sampling for large-area forest characterization: A review, Remote Sens. Environ., 121, 196–209, https://doi.org/10.1016/j.rse.2012.02.001, 2012b.
Wulder, M. A., Hermosilla, T., White, J. C., Bater, C. W., Hobart, G., and Bronson, S. C.: Development and implementation of a stand-level satellite-based forest inventory for Canada, Forestry, 97, 546–563, https://doi.org/10.1093/forestry/cpad065, 2024.
Zald, H. S. J., Wulder, M. A., White, J. C., Hilker, T., Hermosilla, T., Hobart, G. W., and Coops, N. C.: Integrating Landsat pixel composites and change metrics with lidar plots to predictively map forest structure and aboveground biomass in Saskatchewan, Canada, Remote Sens. Environ., 176, 188–201, https://doi.org/10.1016/j.rse.2016.01.015, 2016.