the Creative Commons Attribution 4.0 License.
the Creative Commons Attribution 4.0 License.
 | 04 Mar 2026
A 1 km hourly high-resolution 3D wind field dataset over the Yangtze River Delta incorporating dynamical downscaling, observational assimilation, and land use updates
Zhengyan Zhang
Xinjian Ma
Zhenglong Li
Pengbo Xu
Juan Zhang
Di Di
Bo Li
High-resolution three-dimensional (3D) wind field data are critical for a wide range of applications, including wind energy assessment, low-altitude aviation, air quality modeling, and extreme weather forecasting. Although ERA5 reanalysis remains widely used, its relatively coarse spatial resolution (∼ 31 km) limits its ability to capture local-scale atmospheric processes. To address this, this study develops an hourly 3D dynamic wind field dataset with 1 km horizontal resolution covering the Yangtze River Delta (YRD) region during the summer months (June–August) from 2021 to 2023, namely YRD1km, generated through advanced dynamical downscaling of ERA5 using a customized Weather Research and Forecasting (WRF) model configuration. The methodology integrates multi-source observational nudging with high-resolution land use parameterization to enhance near-surface wind accuracy and terrain-induced flow representation, particularly in urban clusters and mountainous areas. Validation against ground-based observations confirms the superior performance of YRD1km over ERA5 for hourly 10 m wind components, with Mean Absolute Error (MAE) reduced by 21.61 % for U and 26.04 % for V, Root Mean Square Error (RMSE) reduced by 18.30 % for U and 22.63 % for V, and Nash–Sutcliffe Efficiency (NSE) improved by 33.27 % and 40.13%, respectively. On a daily mean basis, both MAE and RMSE are reduced to below 0.5 m s−1, and NSE reaches approximately 0.88. Spatially, YRD1km captures finer spatial wind speed gradients and localized terrain-induced circulations that are not captured by ERA5. Temporally, consistent accuracy improvements with approximately 20 % lower hourly error variability are seen when compared to ERA5. Vertically, 42.18 % accuracy gains are observed in the near-surface layer when compared with radiosonde profiles. Moreover, convective case analyses indicate that YRD1km captures vertically coherent wind structures across multiple tropospheric levels that are closely linked to the initiation and maintenance of deep convection, highlighting its diagnostic advantage in high-impact weather events. Overall, the YRD1km 3D wind field dataset and its integrated methodological framework provide a robust foundation for regional meteorological applications, including high-resolution AI-based forecasting, renewable energy planning, and weather risk management in rapidly developing regions such as the YRD. The YRD1km 3D wind field dataset is available at https://doi.org/10.57760/sciencedb.23752 (Zhang and Liu, 2025).
- Article
(15013 KB) - Full-text XML
- BibTeX
- EndNote


Accurate characterization of three-dimensional (3D) wind fields with high spatiotemporal resolution is fundamental to modern meteorological services, wind energy development, and the safe operation of low-altitude economy. Although widely used ERA5 atmospheric reanalysis datasets are capable of providing wind field variables that exhibit temporal continuity and physical consistency, their relatively coarse spatial resolution limits the capability to resolve regional-scale wind field features (Hu et al., 2023; Jung and Schindler, 2022), particularly in areas with complex terrain and intense urbanization (Molina et al., 2021).
The Yangtze River Delta (YRD), as one of the most intensely urbanized regions in China, exhibits evident spatiotemporal heterogeneity in local wind fields due to the combined effects of sea-land thermal contrasts, urban heat island effects, and boundary layer turbulence (Zhang et al., 2010). This presents significant challenges for precise wind energy resource assessment, urban ventilation capacity diagnosis, and early warning of wind storm events. To address these challenges, spatial downscaling of coarse-resolution reanalysis datasets has become a promising strategy for improving regional wind field reanalysis and supporting fine-scale applications (Boé et al., 2007; Tang et al., 2016; Zhang et al., 2020).
Spatial downscaling techniques primarily include statistical downscaling and dynamical downscaling approaches. Statistical downscaling establishes statistical relationships between coarse-resolution meteorological variables and local observational data (Dayon et al., 2015; Tareghian and Rasmussen, 2013), enabling the acquisition of high-resolution wind field information at relatively low computational costs (Zamo et al., 2016). However, such methods often overlook the physical constraints among meteorological variables. In recent years, deep learning has been increasingly applied to enhance the accuracy of statistical downscaling of wind fields (Dujardin and Lehning, 2022; Dupuy et al., 2023; Höhlein et al., 2020; Lian et al., 2024; Liu et al., 2024a; Zhang and Li, 2021). Nevertheless, incorporating physical consistency into deep learning frameworks remains a significant challenge (Sun et al., 2024). In contrast, dynamical downscaling employs the fundamental equations governing the atmospheric dynamics to explicitly resolve physical processes, thereby reconstructing regional weather systems at high resolutions (Tang et al., 2016). Its effectiveness has been demonstrated in various applications (Bao et al., 2015; Liu et al., 2024b; Xu et al., 2021). Horvath et al. (2012) applied the Weather Research and Forecasting (WRF) model with sub-kilometer grid spacing over mountainous regions of Nevada and showed that dynamical downscaling significantly improved the representation of near-surface wind speed and variability compared to coarser reanalysis products. Notably, when combined with nudging techniques, the model's responsiveness to the actual atmospheric state is further enhanced (Harkey and Holloway, 2013; Lo et al., 2008).
Nudging, also known as Newtonian relaxation, is a data assimilation method that introduces forcing terms into numerical model equations to incrementally adjust model variables toward observations or analysis fields (Hoke and Anthes, 1976). Compared with variational assimilation methods, nudging does not require the construction of an adjoint model or the estimation of background error covariance matrices. As a result, it offers a simpler implementation and lower computational cost (Daescu and Langland, 2013; Lei and Hacker, 2015). Research has demonstrated that this method has been successfully applied in the construction of several high-resolution reanalysis datasets. For example, the MERIDA HRES (4 km resolution, hourly) (Viterbo et al., 2024) and the BAYWRF (1.5 km resolution, daily) (Collier and Mölg, 2020) datasets both employ the WRF model to perform dynamical downscaling on ERA5 reanalysis data. By integrating nudging techniques, these datasets have reconstructed local wind field characteristics for Italy and the Bavarian region of Germany, respectively. Although dynamical downscaling demands substantial computational resources, advancements in regional model structures and high-performance computing technologies are expected to greatly improve its feasibility for regional complex terrain studies and non-climate research applications (Gutowski et al., 2020; Yuan et al., 2024).
Furthermore, accurate representation of land surface parameters is another critical factor influencing the performance of wind field dynamical downscaling. In recent years, high-resolution land use data have been increasingly incorporated into wind field modeling to optimize surface parameterization (De Bode et al., 2023; Fu et al., 2020; Santos-Alamillos et al., 2015). The updated land use datasets enable more precise characterization of various land surface features such as urban areas, mountainous regions, and water bodies, which improve simulation of terrain-induced flows and boundary layer processes, particularly in complex terrain regions (Golzio et al., 2021; Siewert and Kroszczynski, 2023).
In summary, this study presents the development of a 1 km hourly 3D dynamic wind field dataset over the YRD region (YRD1km), covering the period of the summer months (June to August) from 2021 to 2023. The YRD1km dataset is generated by applying a state-of-the-art dynamical downscaling technique to the ERA5 reanalysis data, integrating multi-source observational nudging, and updating land surface information with high-resolution ESA WorldCover 2020 (EWC2020) land use data. The resulting dataset provides enhanced accuracy in simulating near-surface winds and tropospheric dynamic structures, particularly in urban and mountainous areas where wind variability is often high.
This study evaluates the performance of YRD1km relative to ERA5, with a focus on both horizontal and vertical wind field accuracy. It also assesses the effectiveness of an integrated methodology that combines dynamical downscaling, observational nudging, and updated land use data in improving wind field simulations over regions with complex land surface characteristics and atmospheric variability. The findings highlight the potential of YRD1km to support a wide range of applications, such as high-resolution diagnostic analyses of regional wind fields, renewable energy planning, air quality modeling, and urban environmental management in rapidly urbanizing areas.
2.1 ERA5 Reanalysis Data
The ERA5 reanalysis dataset (Hersbach et al., 2020), developed by the European Centre for Medium-Range Weather Forecasts (ECMWF), integrates global multi-source observations through 4D-Var data assimilation (https://doi.org/10.24381/cds.bd0915c6). It provides three-dimensional hourly atmospheric variables (e.g., temperature, humidity, wind fields, and pressure) with a horizontal resolution of 0.25° × 0.25° (about 31 km), serving as a widely adopted benchmark in meteorological research. In this study, ERA5 supplies initial and boundary conditions for the WRF model dynamical downscaling. Additionally, ERA5 serves as a baseline dataset for comparative validation of YRD1km performance enhancements.
2.2 Surface and Upper Air Weather Observations
This study assimilates two observational datasets: (1) the NCEP ADP Global Upper Air and Surface Weather Observations (National Centers for Environmental Prediction/National Weather Service/National Oceanic and Atmospheric Administration/U.S. Department of Commerce, 2008; https://doi.org/10.5065/Z83F-N512), comprising global terrestrial stations, ocean buoys, ships, radiosondes, aircraft reports, and ASCAT satellite-derived winds from the Global Telecommunication System (GTS), and (2) hourly data from Automatic Weather Stations (AWS) operated by the China Meteorological Administration (CMA) (http://data.cma.cn/, last access: 6 March 2025). The spatial distributions of the two observational datasets over the YRD are illustrated in Fig. 1a. The NCEP ADP dataset provides three-dimensional conventional meteorological measurements from multiple observational platforms. As a complement to the NCEP ADP dataset, the CMA AWS network delivers high-density surface observations across China, with a total of 2169 stations – approximately six times the number of surface stations available from the NCEP ADP dataset within the Chinese domain. This higher station density significantly enhances the spatial representativeness of near-surface meteorological conditions in the YRD region. Using Observation Nudging assimilation techniques, these datasets collectively correct systemic biases in ERA5's near-surface fields within the WRF framework, enhancing the model's capacity to resolve localized circulation patterns. The AWS data further act as a cross-validation source to quantify YRD1km's accuracy improvements.
2.3 High-resolution Land Cover Geographical Data
Conventional land use datasets in WRF (USGS 1992–1993 or MODIS 2001) (Anderson et al., 1976) are limited in their ability to reflect the rapid urban expansion and evolving land surface characteristics of the YRD region. To address this, we integrate the EWC2020 dataset – a global land cover product with 10 m spatial resolution that classifies 11 surface types (e.g., built-up areas, croplands, water bodies) (https://esa-worldcover.org/en, last access: 6 March 2025). By updating WRF's land surface parameters with EWC2020, we refine the representation of aerodynamic roughness lengths and urban heat island effects. For instance, reclassifying Shanghai's Pudong district from Moderate Resolution Imaging Spectroradiometer (MODIS) “mixed urban” to EWC2020 “high-intensity built-up” improves wind field simulations by better capturing drag effects from high-rise structures, as validated against AWS observations.
3.1 WRF Model Configuration for Dynamical Downscaling
This study employs the WRF-ARW model (v4.4.2) (Skamarock et al., 2019) to establish a dynamic downscaling framework, enhancing the spatial resolution of ERA5 reanalysis data from ∼ 31 to 1 km. The model domain is configured with a triple-nested grid centered at (29.36° N, 115.65° E) with horizontal resolutions of 9 km (D01, with 342 × 305 grid points), 3 km (D02, with 529 × 640 grid points), and 1 km (D03, with 919 × 949 grid points). The innermost domain, D03, covers the entire YRD region (Fig. 1a) and is designed to capture local circulation features associated with urban clusters, lakes, and hilly terrain at a kilometer-scale resolution. Two-way nesting was employed for all three domains to allow feedback between nested grids. All domains were initialized simultaneously, with ERA5 initial conditions interpolated directly onto each domain, including the 1 km grid. In the vertical direction, 61 terrain-following eta levels are used, with the model top set at 10 hPa, which facilitates a detailed resolution of boundary layer dynamics. Based on previous studies (Bernini et al., 2025; Sahu et al., 2026), the following physical parameterization schemes were selected: the Thompson microphysics scheme (Thompson et al., 2008), which is well-suited for high-resolution cloud microphysics; the Dudhia shortwave radiation (Dudhia, 1989) and RRTM longwave radiation schemes (Mlawer et al., 1997) for radiative transfer; and for boundary layer and land surface processes, the YSU non-local closure scheme (Hong et al., 2006) coupled with the Noah land surface model (Tewari et al., 2004), which enhances the representation of near-surface turbulent exchanges. The Kain-Fritsch cumulus parameterization scheme (Kain, 2004) is applied only in the outer grid (D01) to mitigate uncertainties in the “gray zone” below the 3 km grid resolution.
To reduce the accumulation of model errors, a cold-start strategy is implemented, with simulations initiated four times daily at 00:00, 06:00, 12:00, and 18:00 UTC, respectively. Each run generates a continuous 6-hour forecast period, from which the first hour is discarded as model spin-up. Ultimately, this approach produces a continuous hourly three-dimensional wind field dataset.
3.2 Conventional Observational Data Assimilation via Nudging
While WRF dynamical downscaling enhances dataset resolution and preserves dynamical constraints and physical consistency, it struggles to capture fine-scale wind field features over complex underlying surfaces (e.g., urban clusters, water bodies) without dense observational constraints. To address this, this study employs the Four-Dimensional Data Assimilation (FDDA) technique, integrating conventional observations and ERA5 reanalysis fields through a Nudging approach, thereby balancing localized dynamical processes and large-scale circulation consistency. The core formulation of this approach is:
where x represents the model variable, F(x) denotes the model dynamical equations, G is the relaxation coefficient, and W(t) is the temporal weighting function.
This study adopts a hybrid Nudging scheme combining two strategies: (1) Observation Nudging (ON): Direct assimilation of in situ observations from CMA AWS and NCEP ADP to dynamically refine local wind fields. (2) Analysis Nudging (AN): Application of ERA5 reanalysis fields as constraints to impose large-scale adjustments across the entire model domain hourly (Stauffer and Seaman, 1990), preventing deviations from large-scale circulation patterns. Thus, the combined ON + AN assimilation scheme ensures both large-scale consistency and enhanced regional meteorological representation.
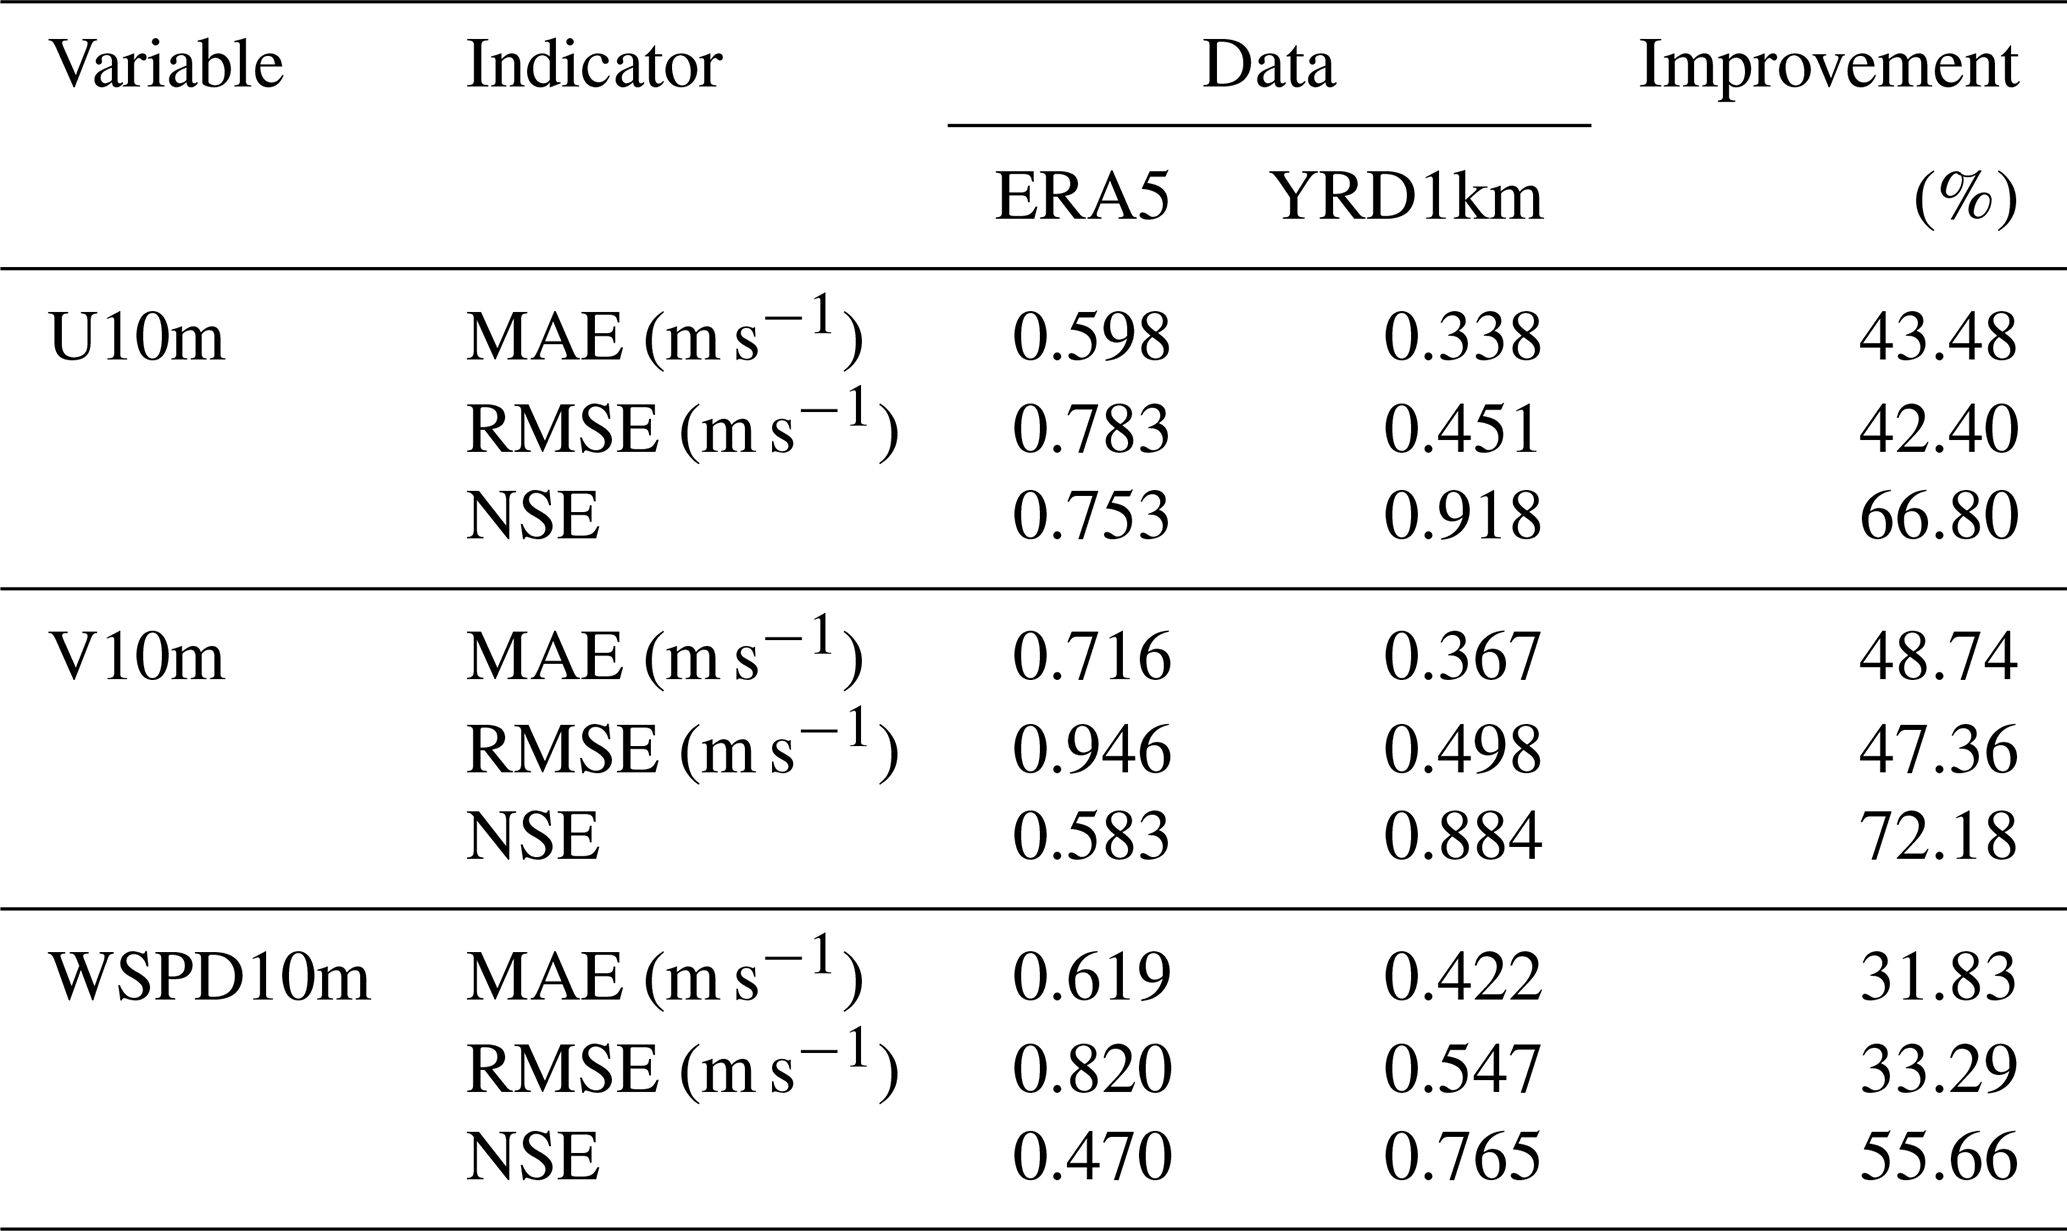
Taking the nudging experiment conducted over a continuous four-day period from 1 to 4 June 2022 as an illustrative example, a time window selected to capture representative synoptic and mesoscale variability, the study quantitatively evaluates wind field accuracy over the YRD against ground-based observations using three statistical metrics: Mean Absolute Error (MAE), Root Mean Square Error (RMSE), and the Nash-Sutcliffe Efficiency coefficient (NSE; Nash and Sutcliffe, 1970), defined as follows:
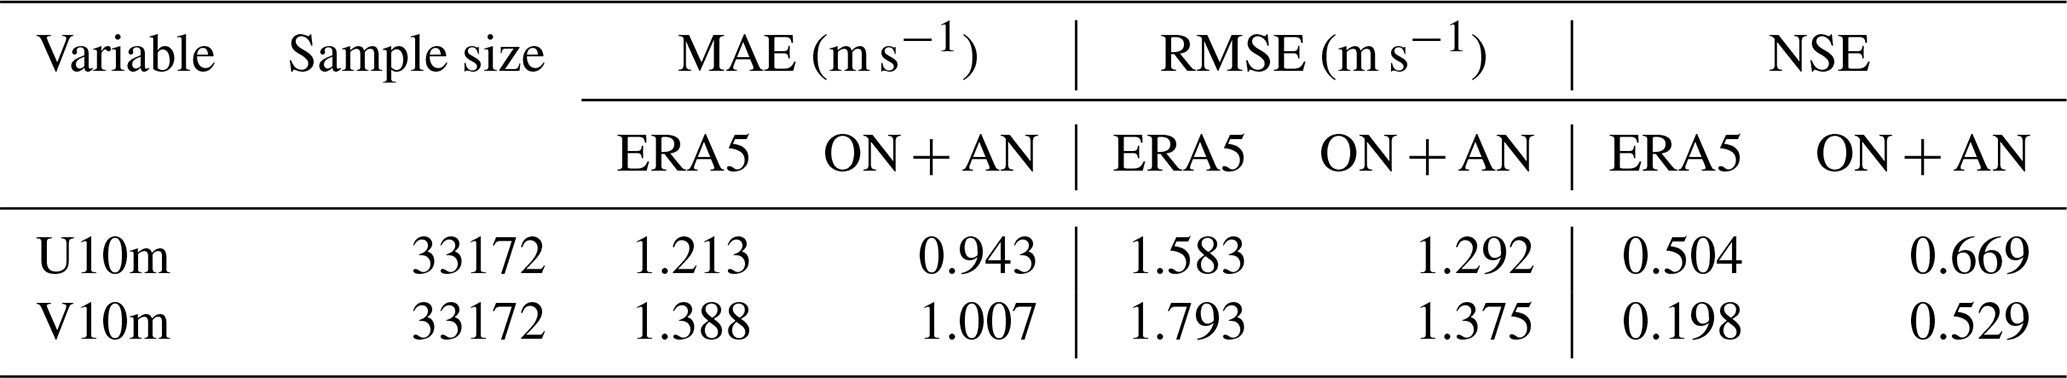
where Ai represents simulated values from either ERA5 reanalysis or the dynamically downscaled results, Oi denotes corresponding in situ observations, n is the total number of spatiotemporally matched observation–simulation pairs. The NSE metric ranges from −∞ to 1, with values approaching 1 indicating perfect agreement between simulations and observations. As shown in Table 1, compared to ERA5 data, the ON + AN assimilated dataset demonstrates significant improvements across all statistical metrics for both the 10 m zonal (U10m) and meridional (V10m) wind components. In particular, the MAE is reduced by 22.26 % for U10m and 27.45 % for V10m, the RMSE is reduced by 18.38 % for U10m and 23.31 % for V10m, and the NSE is enhanced by 33.27 % for U10m and 41.27 % for V10m. These results confirm that the ON + AN hybrid assimilation scheme substantially enhances the precision of high-resolution wind field datasets in the YRD region.
Table 1Comparison of surface (10 m) wind field performance between the ON + AN experiment and ERA5 reanalysis over the YRD region.
3.3 Impact of High-Resolution Land Use Data Updates
To address the impacts of rapid urbanization on wind field simulations in the YRD, this study enhances land surface characterization by updating the default MODIS 2001 land use data in the WRF model with the EWC2020 dataset at 10 m resolution. Comparative analysis reveals substantial discrepancies between MODIS 2001 and EWC2020, particularly in Shanghai's metropolitan core (Fig. 1b and c). The EWC2020 dataset resolves critical urban morphological features, including urban sprawl boundaries, park green spaces within city centers, and modified water-cropland interfaces, thereby more accurately capturing spatial heterogeneity in surface properties.

Figure 1Spatial distributions of key datasets used in this study. (a) Coverage of the innermost WRF domain (D03, 1 km resolution) over the YRD, along with the distribution of CMA Automatic Weather Stations (AWS) and the spatial coverage of NCEP ADP multi-source conventional observations used for nudging assimilation. The red box shows the region to highlight (b) Land use classification from the default MODIS 2001 dataset in WRF and (c) Updated high-resolution land use classification based on the EWC2020 product.
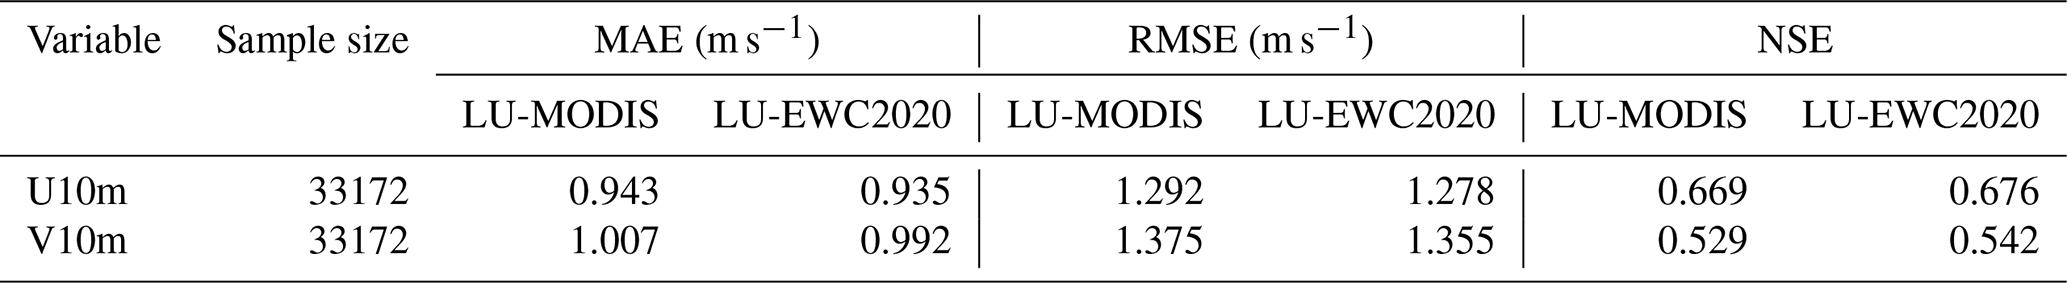
To quantify land use update effects on wind field simulations, we conduct two experiments under the ON + AN assimilation framework: (1) LU-MODIS: Retains default MODIS-based land use types; (2) LU-EWC2020: Incorporates the refined EWC2020-derived surface parameters. Using the four-day case study, validation metrics (Table 2) demonstrate small but obvious positive impacts across all metrics for the LU-EWC2020 experiment compared to LU-MODIS. These results confirm the value of high-resolution land use updates in resolving urbanization-induced land-atmosphere interactions.
Table 2Statistical evaluation of land use sensitivity experiments conducted over the YRD region.
3.4 High-Resolution 3D Wind Field Dataset Generation
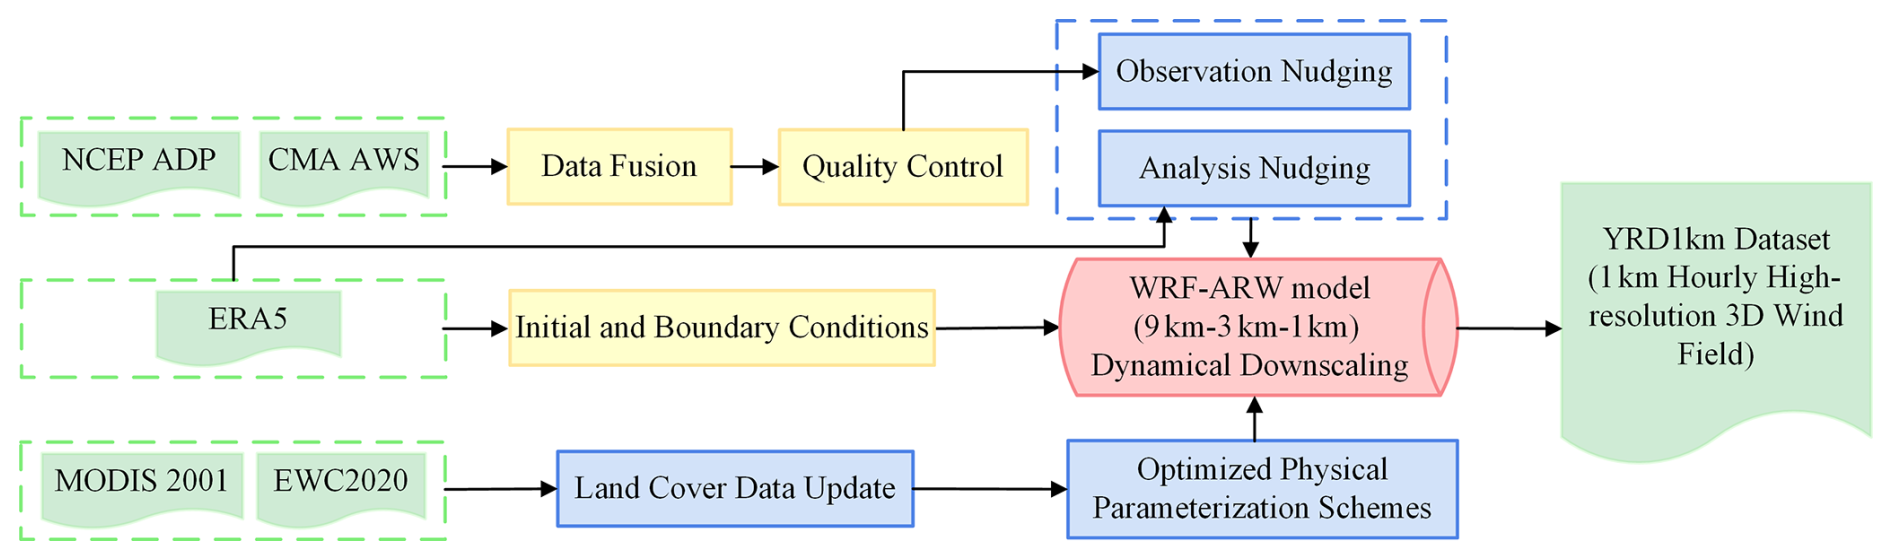
Building on the evaluation results in Sect. 3.2 and 3.3, this study develops a systematic framework for generating the YRD1km dataset over the YRD region, as shown in Fig. 2. In the preprocessing stage, observational constraints for nudging were derived from the integration and quality control (QC) of NCEP ADP and CMA AWS datasets. Surface parameterization was refined by replacing the default MODIS 2001 land-use data with the updated EWC 2020 dataset. For model simulation, ERA5 reanalysis provided the initial and boundary conditions for a triple-nested WRF configuration (9 km → 3 km → 1 km). The updated surface parameters were used to optimize the static fields, while a suite of optimized physical schemes and a cold-start initialization strategy were applied to suppress error accumulation. A hybrid observational nudging scheme (ON + AN) was employed to enhance the model's consistency with observed atmospheric states, resulting in continuous hourly 3D wind vector outputs at 1 km horizontal resolution and 61 vertical levels during the summer months (June–August) from 2021 to 2023.
Comprehensive multi-dimensional validation was performed using both surface station observations and radiosonde profiles. The near-surface wind simulation performance was assessed through MAE, RMSE, and NSE metrics, to evaluate the overall, spatial, and temporal accuracy of the dataset. In addition, radiosonde-derived vertical wind profiles were used to examine the fidelity of the reconstructed wind field structure in the lower and middle troposphere. Furthermore, convective case analyses highlight the capability of the YRD1km dataset to capture fine-scale dynamical features, demonstrating clear improvements over ERA5 and underscoring the effectiveness of the integrated approach in high-resolution wind field reconstruction.
4.1 Evaluation of YRD1km High-Resolution Dataset Accuracy
4.1.1 Accuracy Evaluation of YRD1km and ERA5 Based on AWS Observations
A comprehensive evaluation of near-surface wind field accuracy was conducted using AWS observations across the YRD region over a one-week period from 1 to 7 June 2022, serving as a representative example. Due to the different spatial resolutions of YRD1km and ERA5, a nearest-grid-point matching method was adopted for comparison with station observations (Liu et al., 2025). As shown in Fig. 3, scatterplots of the 10 m wind field U and V components for both ERA5 and YRD1km datasets were analyzed to assess their respective simulation capabilities. Overall, YRD1km exhibited superior performance in both U and V components, as evidenced by higher NSE coefficients, lower MAE and RMSE, and a tighter scatter distribution. Regression slopes for YRD1km were also notably closer to the 1:1 reference line, indicating a more accurate representation of the near-surface wind field compared to ERA5. For the U component (Fig. 3a, c), ERA5 presented an NSE of 0.49, with MAE and RMSE of 1.26 and 1.65 m s−1, respectively, and a regression slope of only 0.56, with increasing deviations under higher wind speed conditions. In contrast, YRD1km achieved a significant improvement with an NSE of 0.67, MAE reduced to 0.98 m s−1, RMSE reduced to 1.33 m s−1, and an increased regression slope of 0.71, significantly reducing systematic biases. Further analysis based on the sign of the U component revealed that ERA5 exhibited a consistent underestimation of both easterly winds (U<0) and westerly winds (U>0), particularly under stronger wind conditions ( m s−1). This finding aligns with previous reports by Hu et al. (2023). While YRD1km also exhibited a similar underestimation pattern, its magnitude was notably reduced, indicating an improved representation of directional wind components compared to ERA5. Additionally, as wind speed increased, scatter dispersion became more pronounced, with fewer samples in the high wind speed range, adding challenges to accurate simulation.
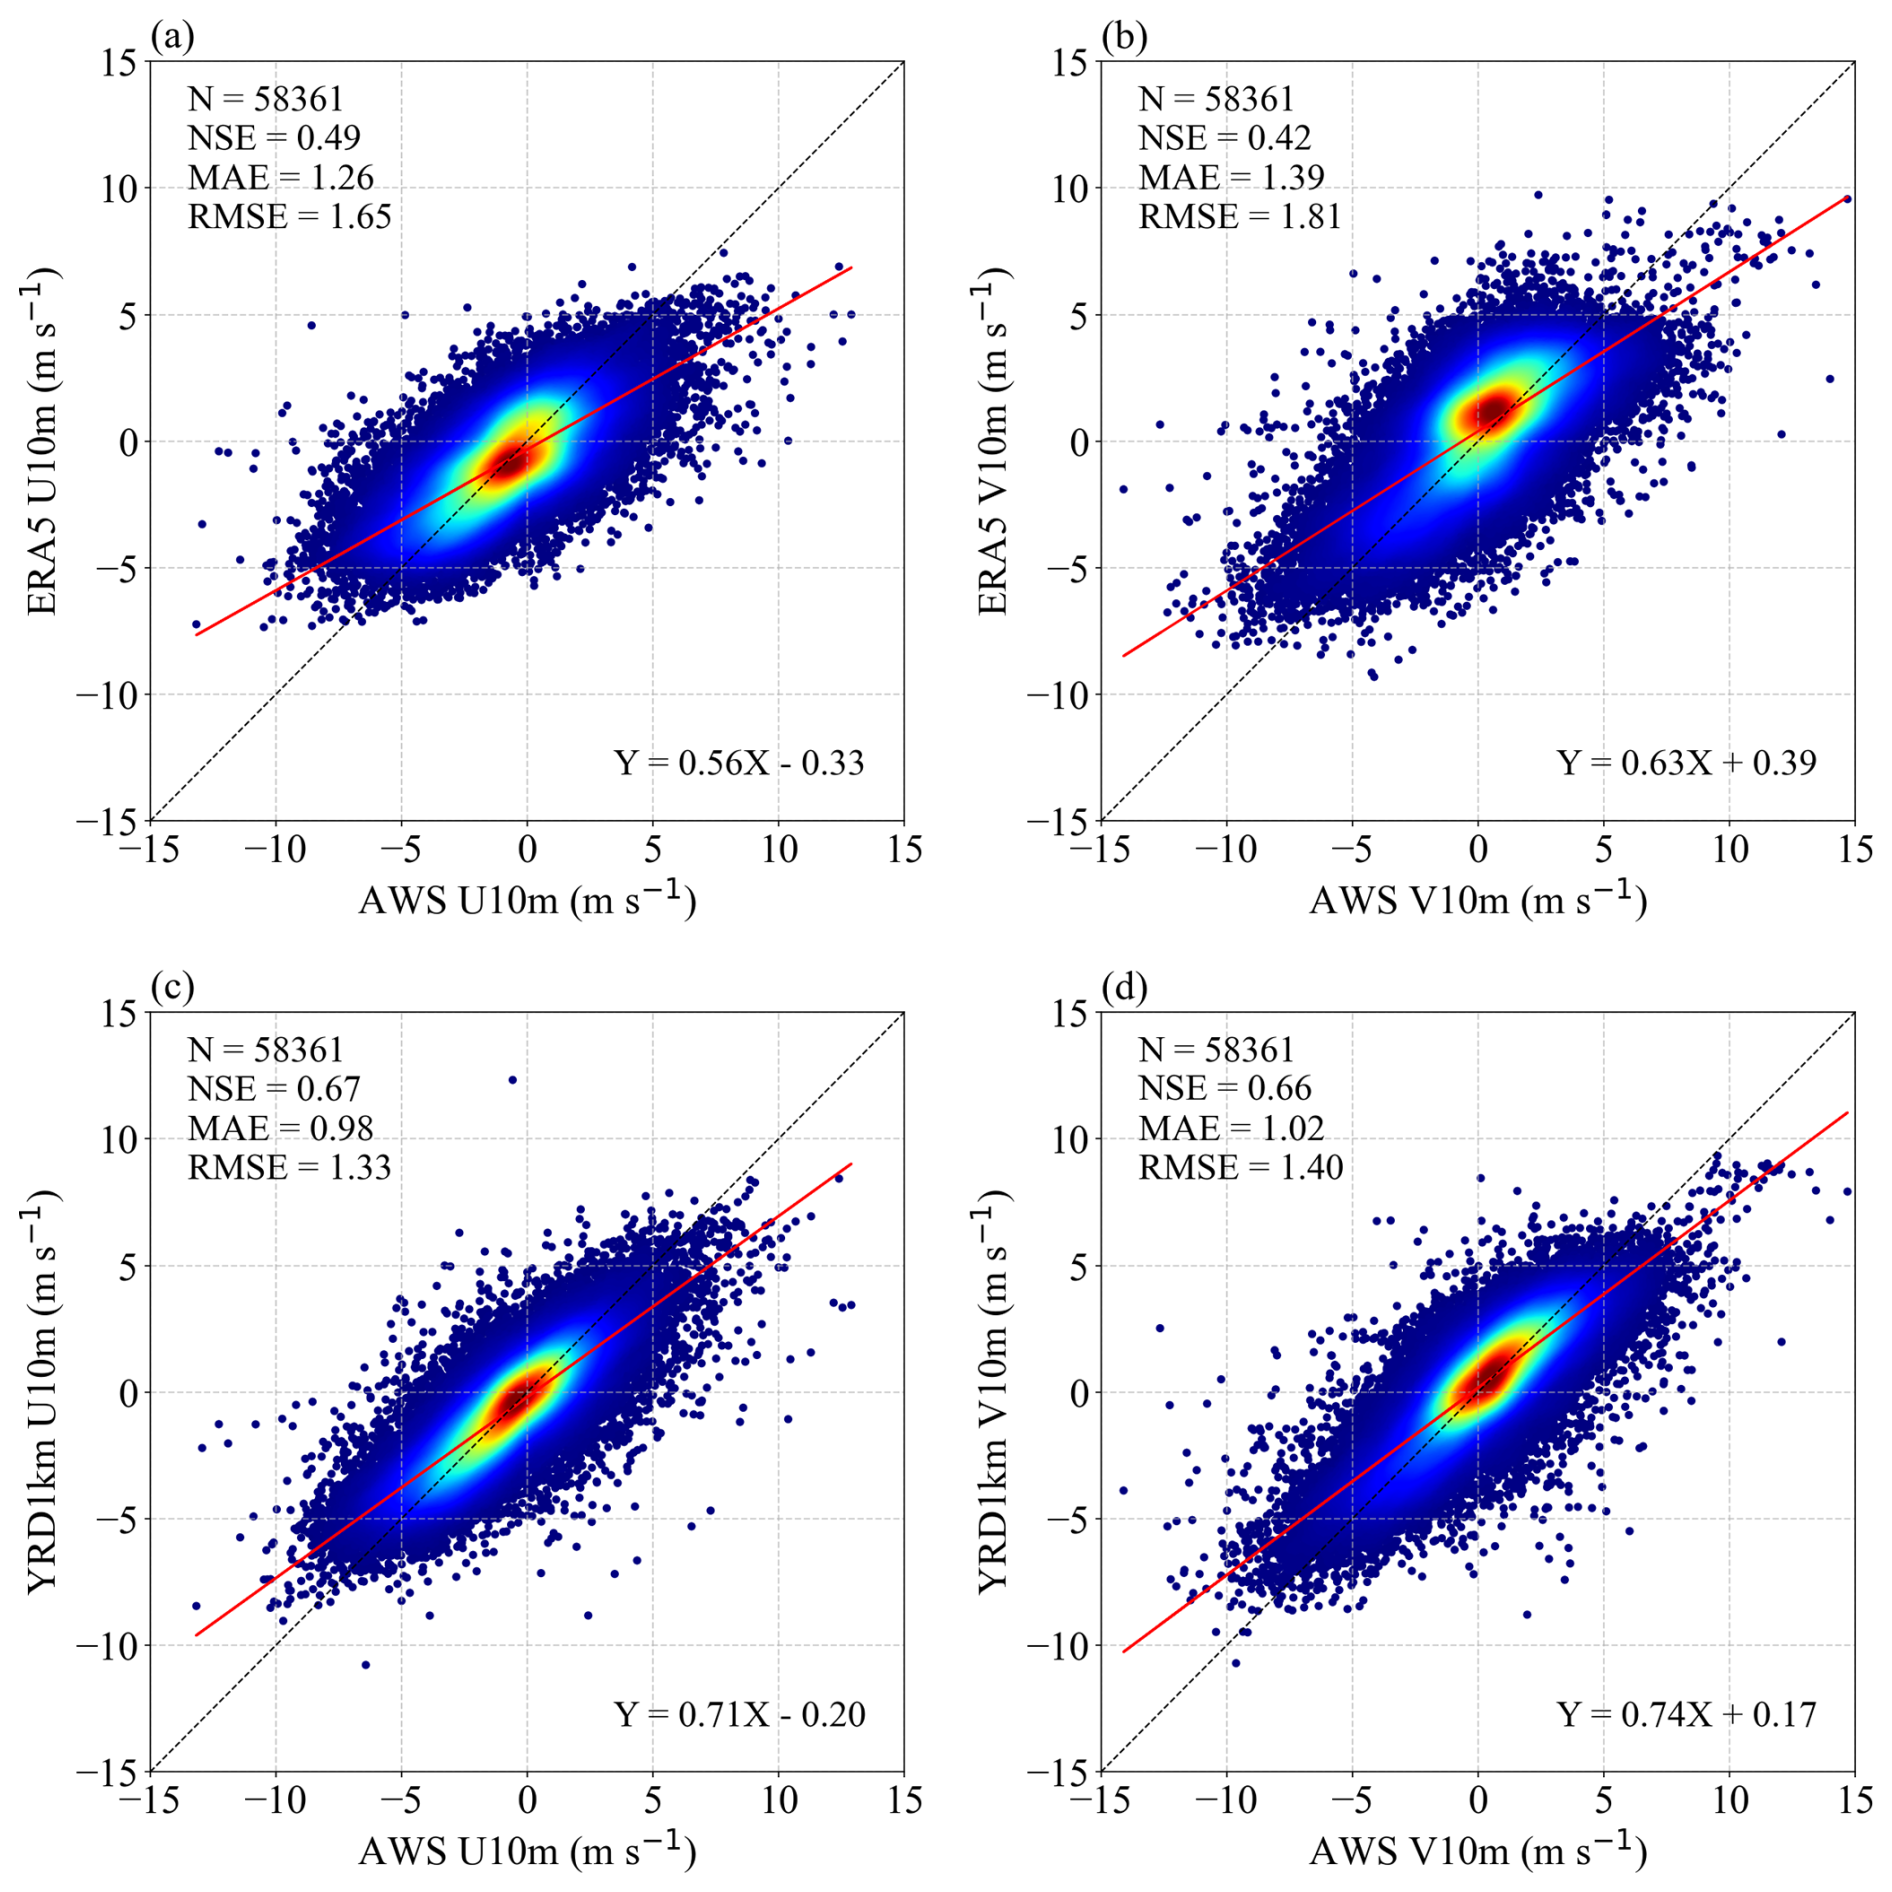
Figure 3Scatterplot evaluation of 10 m wind components over the YRD region: (a) ERA5 U10m, (b) ERA5 V10m, (c) YRD1km U10m, and (d) YRD1km V10m.
For the V component (Fig. 3b, d), ERA5 showed an even lower NSE of 0.42, with MAE and RMSE of 1.39 and 1.81 m s−1, respectively, and a regression slope of 0.63, indicating a less accurate simulation. Conversely, YRD1km significantly improved the NSE to 0.66, reduced MAE to 1.02 m s−1, RMSE to 1.40 m s−1, and increased the regression slope to 0.74. Similar to the U component, the V component displayed a directional-dependent error pattern, with an underestimation of both northerly winds (V<0) and southerly winds (V>0), especially under stronger wind conditions. The increasing scatter dispersion and simulation uncertainty with higher wind speeds further highlight the challenges and needs of reproducing complex wind fields.
Results in Fig. 3 are based on hourly data. Considering that climate research emphasizes the use of daily data to smooth short-term fluctuations and reveal long-term trends (Kotlarski et al., 2019; Nashwan et al., 2019; Zhang et al., 2024), this study further examined the simulation accuracy of 10 m wind filed at the daily mean scale. Based on daily mean observations from more than 300 AWS stations across the YRD region over a continuous seven-day period from 1 to 7 June 2022 (Table 3), the comparison results demonstrate that YRD1km maintains a consistent accuracy advantage over ERA5 for all evaluated metrics, including the U and V wind components as well as 10 m wind speed. Notably, the daily mean values of the U and V components exhibited better statistical performance than their hourly counterparts, as temporal averaging effectively mitigates short-term fluctuations and random errors, enhancing simulation stability. Additionally, compared to 10 m wind speed (WSPD10m), the U and V components demonstrated greater improvements in error metrics, with NSE values closer to 1. This is primarily because wind speed is a scalar variable, while U and V components are vectors accounting for wind direction errors.
Table 3Statistical comparison of daily 10 m wind fields between ERA5 and YRD1km datasets over the YRD region.
4.1.2 Independent Validation
To rigorously evaluate the generalization capability of the YRD1km dataset beyond locations directly constrained by the nudging procedure, we implemented an independent validation strategy using a subset of AWS stations withheld from the assimilation process. Specifically, approximately 10 % of the stations employed in the ON + AN nudging experiments were randomly selected and reserved exclusively for independent evaluation, while the remaining stations continued to provide observational constraints for WRF simulations.
The independent validation was conducted over a continuous four-day period from 1 to 4 June 2022, allowing the evaluation to sample a range of synoptic and mesoscale meteorological conditions. Validation against observations at these withheld stations shows that the YRD1km dataset exhibits improved performance relative to ERA5 in simulating near-surface wind fields. For the U component, NSE increases by 5.08 %, MAE decreases by 4.80 %, and RMSE decreases by 3.01 % relative to ERA5. For the V component, NSE increases by 10.11 %, while MAE and RMSE decrease by 8.09 % and 5.14 %, respectively. In addition, the fitted relationships between simulated and observed U and V components shifted closer to the 1:1 line, indicating enhanced fidelity in reproducing near-surface wind variability (Fig. 4). These results indicate that the performance gains in YRD1km are not limited to assimilated locations. Instead, the improvements extend spatially, demonstrating that the combination of dynamical downscaling, high-resolution land-surface updates, and the hybrid ON + AN nudging framework enhances the regional wind field representation in a physically coherent manner.

Figure 4Independent validation scatterplots of 10 m wind components over the YRD region: (a) ERA5 U10m, (b) ERA5 V10m, (c) YRD1km U10m, and (d) YRD1km V10m.
4.1.3 Comparison of spatial variations between YRD1km and ERA5
Building upon the preceding quantitative accuracy assessment, the study further examines the spatial variations of near-surface wind fields represented by the YRD1km and ERA5 datasets, as illustrated in Fig. 5. Overall, while both datasets (Fig. 5a and c) adequately capture the large-scale spatial variations of 10 m wind speeds across the YRD, YRD1km demonstrates a notable advantage in resolving mesoscale and local-scale wind field characteristics. Specifically, YRD1km (Fig. 5c) offers a much finer spatial representation of wind speed variations compared to ERA5, closely aligned with observational data, particularly over complex terrain and urbanized areas. This includes enhanced wind speed zones over large water bodies such as Lake Taihu, realistic gradients in mountainous regions like southern Anhui and Zhejiang driven by valley flows and orographic effects, as well as improved wind speed structures over highly urbanized areas such as Shanghai. Furthermore, ERA5 exhibits underestimation of wind speed maxima near offshore observation points (e.g., in the East China Sea). YRD1km mitigates these biases through assimilation of AWS data via a nudging approach, enabling better alignment with ground truth observations and significantly enhancing the fidelity of simulated wind fields.
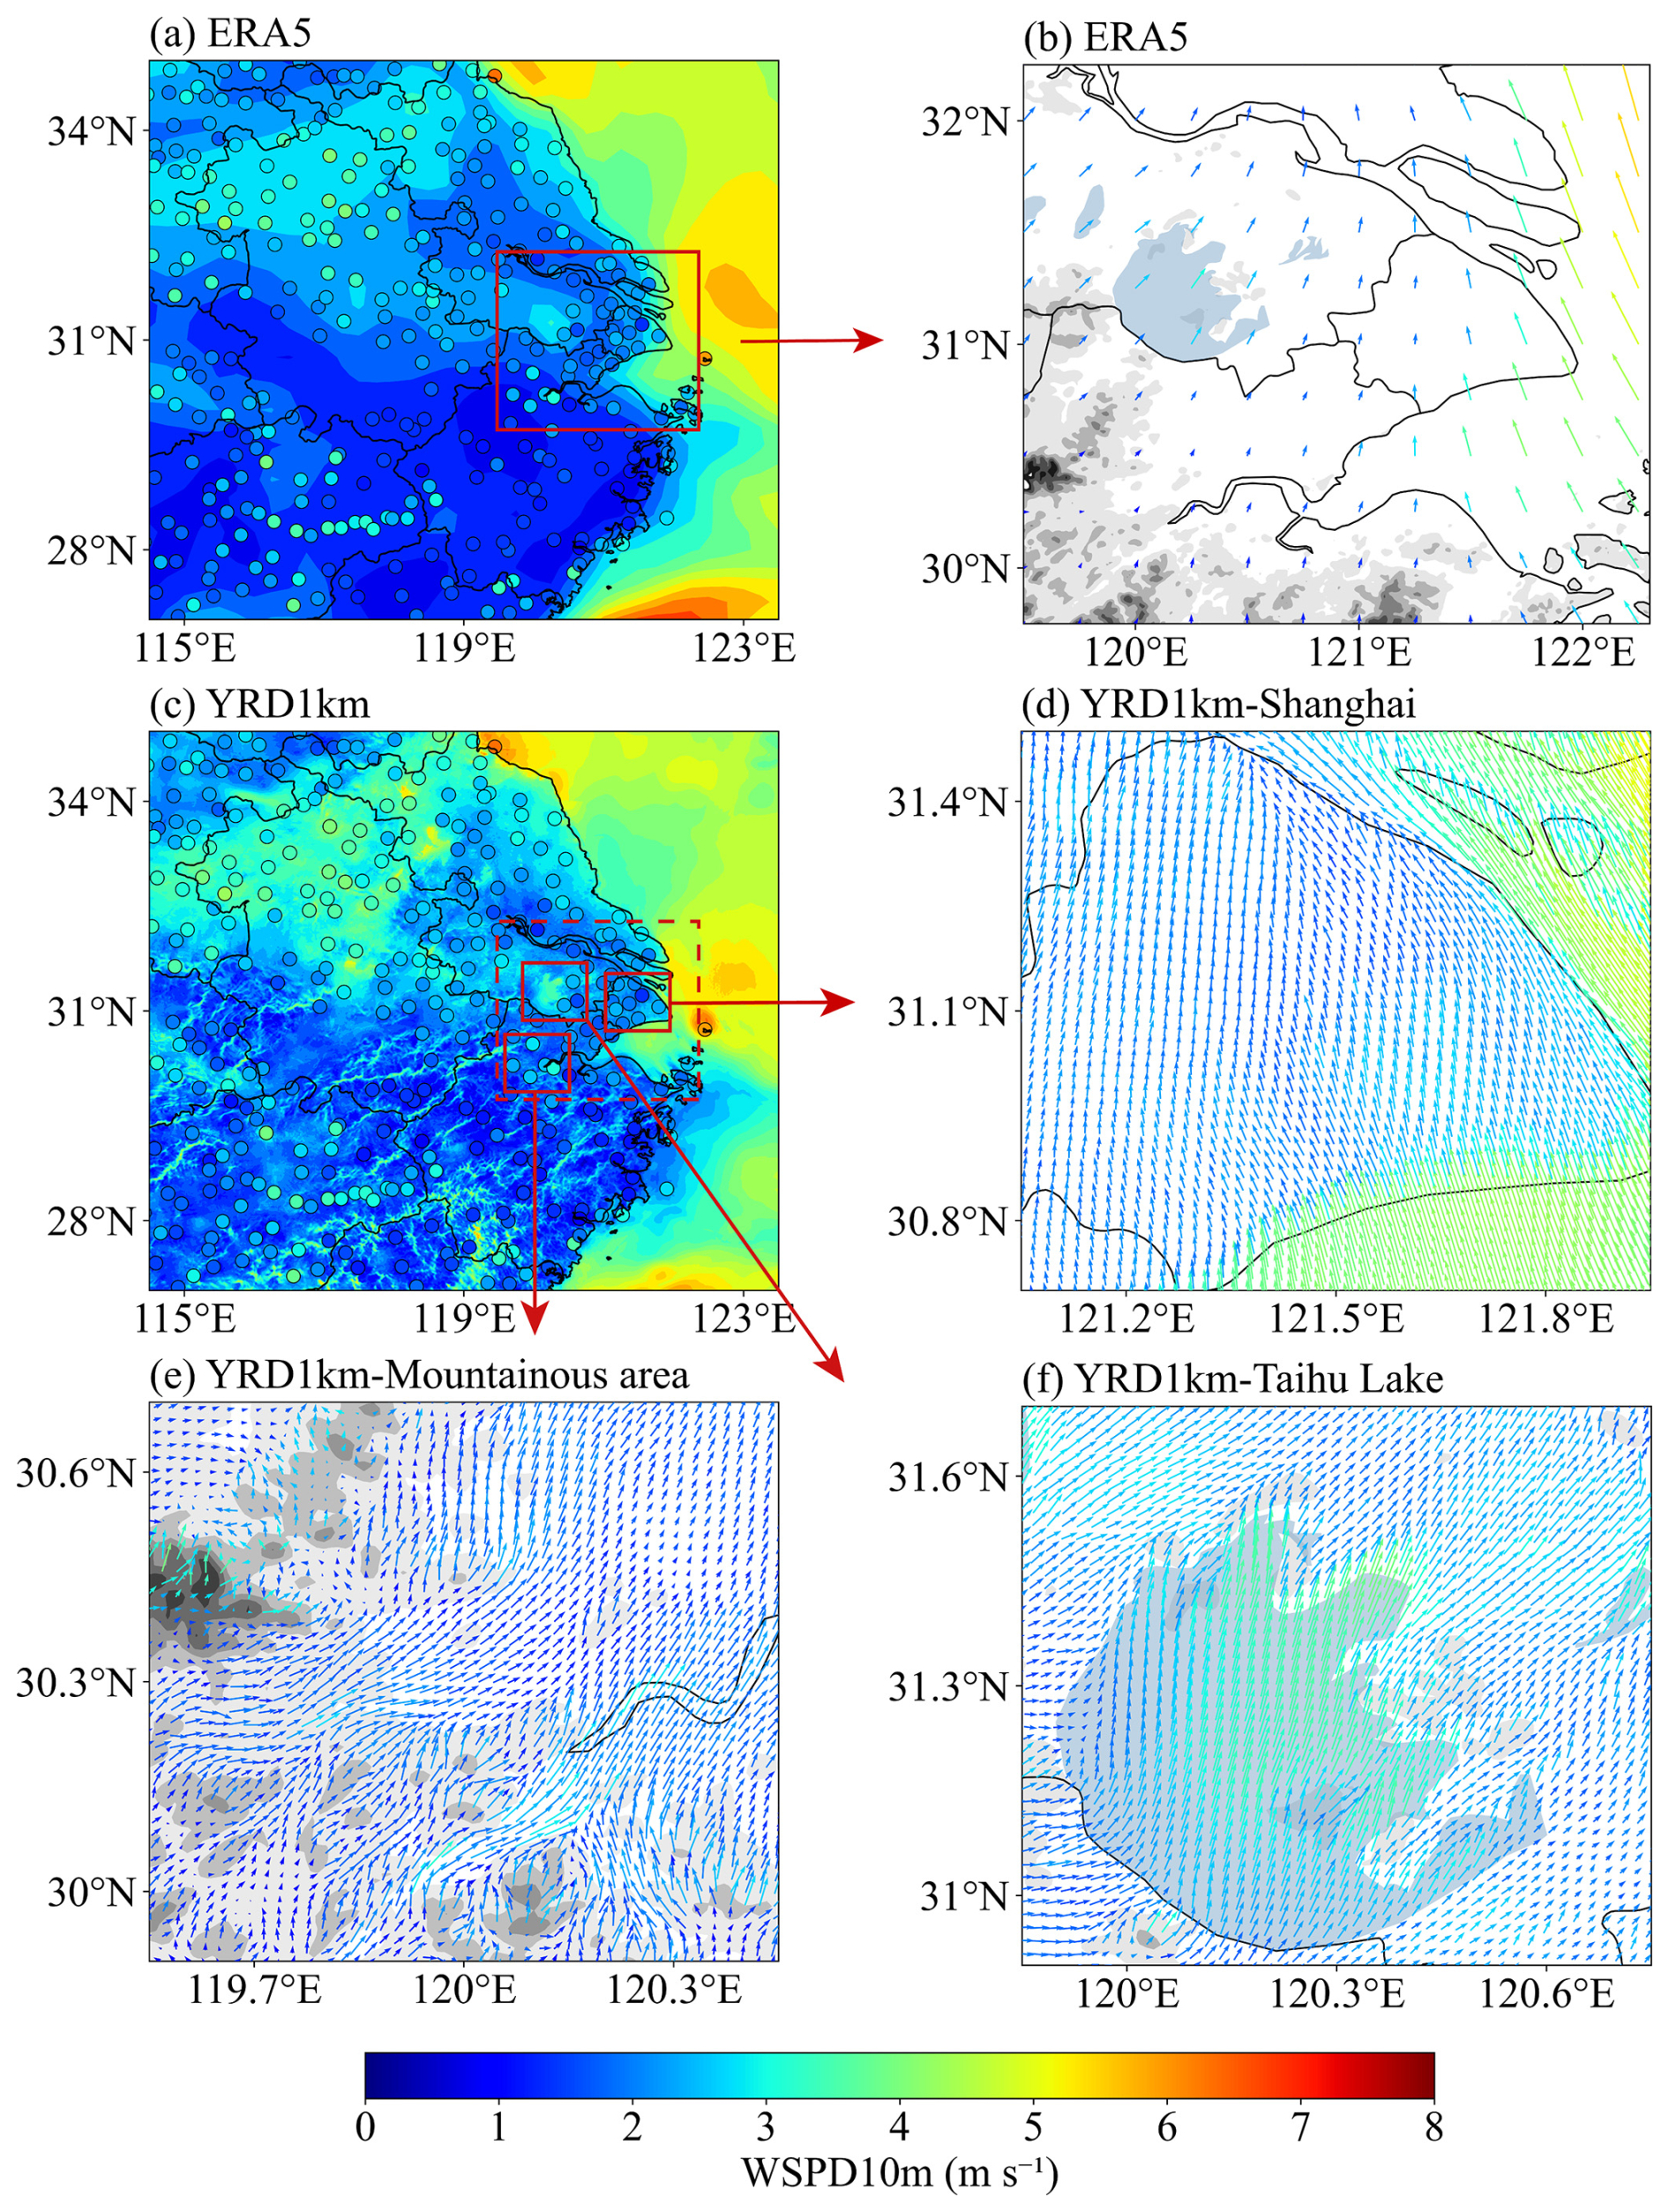
Figure 5Spatial distribution of daily mean near-surface wind fields over the YRD region on 1 June 2022. Panels (a) and (c) show daily mean 10 m wind speed (WSPD10m) from the ERA5 and YRD1km datasets, respectively, overlaid with AWS station observations (colored dots). Panels (b), (d), (e), and (f) show locally enlarged wind vector fields: (b) ERA5 over Shanghai and its surrounding urban agglomeration; (d) YRD1km over the Shanghai metropolitan area; (e) the mountainous region near Hangzhou; and (f) Lake Taihu. Arrows are color-coded by wind speed magnitude and overlaid on shaded terrain elevation, with darker tones indicating higher altitudes. Major water bodies are shaded in steelblue for clearer identification.
These spatial advantages are further highlighted through detailed analyses of wind vector fields. As shown in Fig. 5b, ERA5 exhibits an overly smoothed wind field with limited flow differentiation near topographic boundaries. In contrast, the YRD1km dataset presents highly structured and terrain-conforming wind directions. Over the Shanghai metropolitan area (Fig. 5d), the wind field aligns with urban morphological structures, showing clear directional deflection near city boundaries and dense river network regions, primarily due to thermal forcing and surface drag associated with urbanization. In the mountainous region near Hangzhou (Fig. 5e), the wind field captures pronounced curvature and flow separation that closely follow terrain contours, effectively representing multiple terrain-induced processes such as valley and slope winds. Over Lake Taihu (Fig. 5f), YRD1km simulates a divergent wind pattern, with significantly higher wind speeds over the lake surface relative to surrounding land, indicative of thermally driven lake–land breeze circulations.
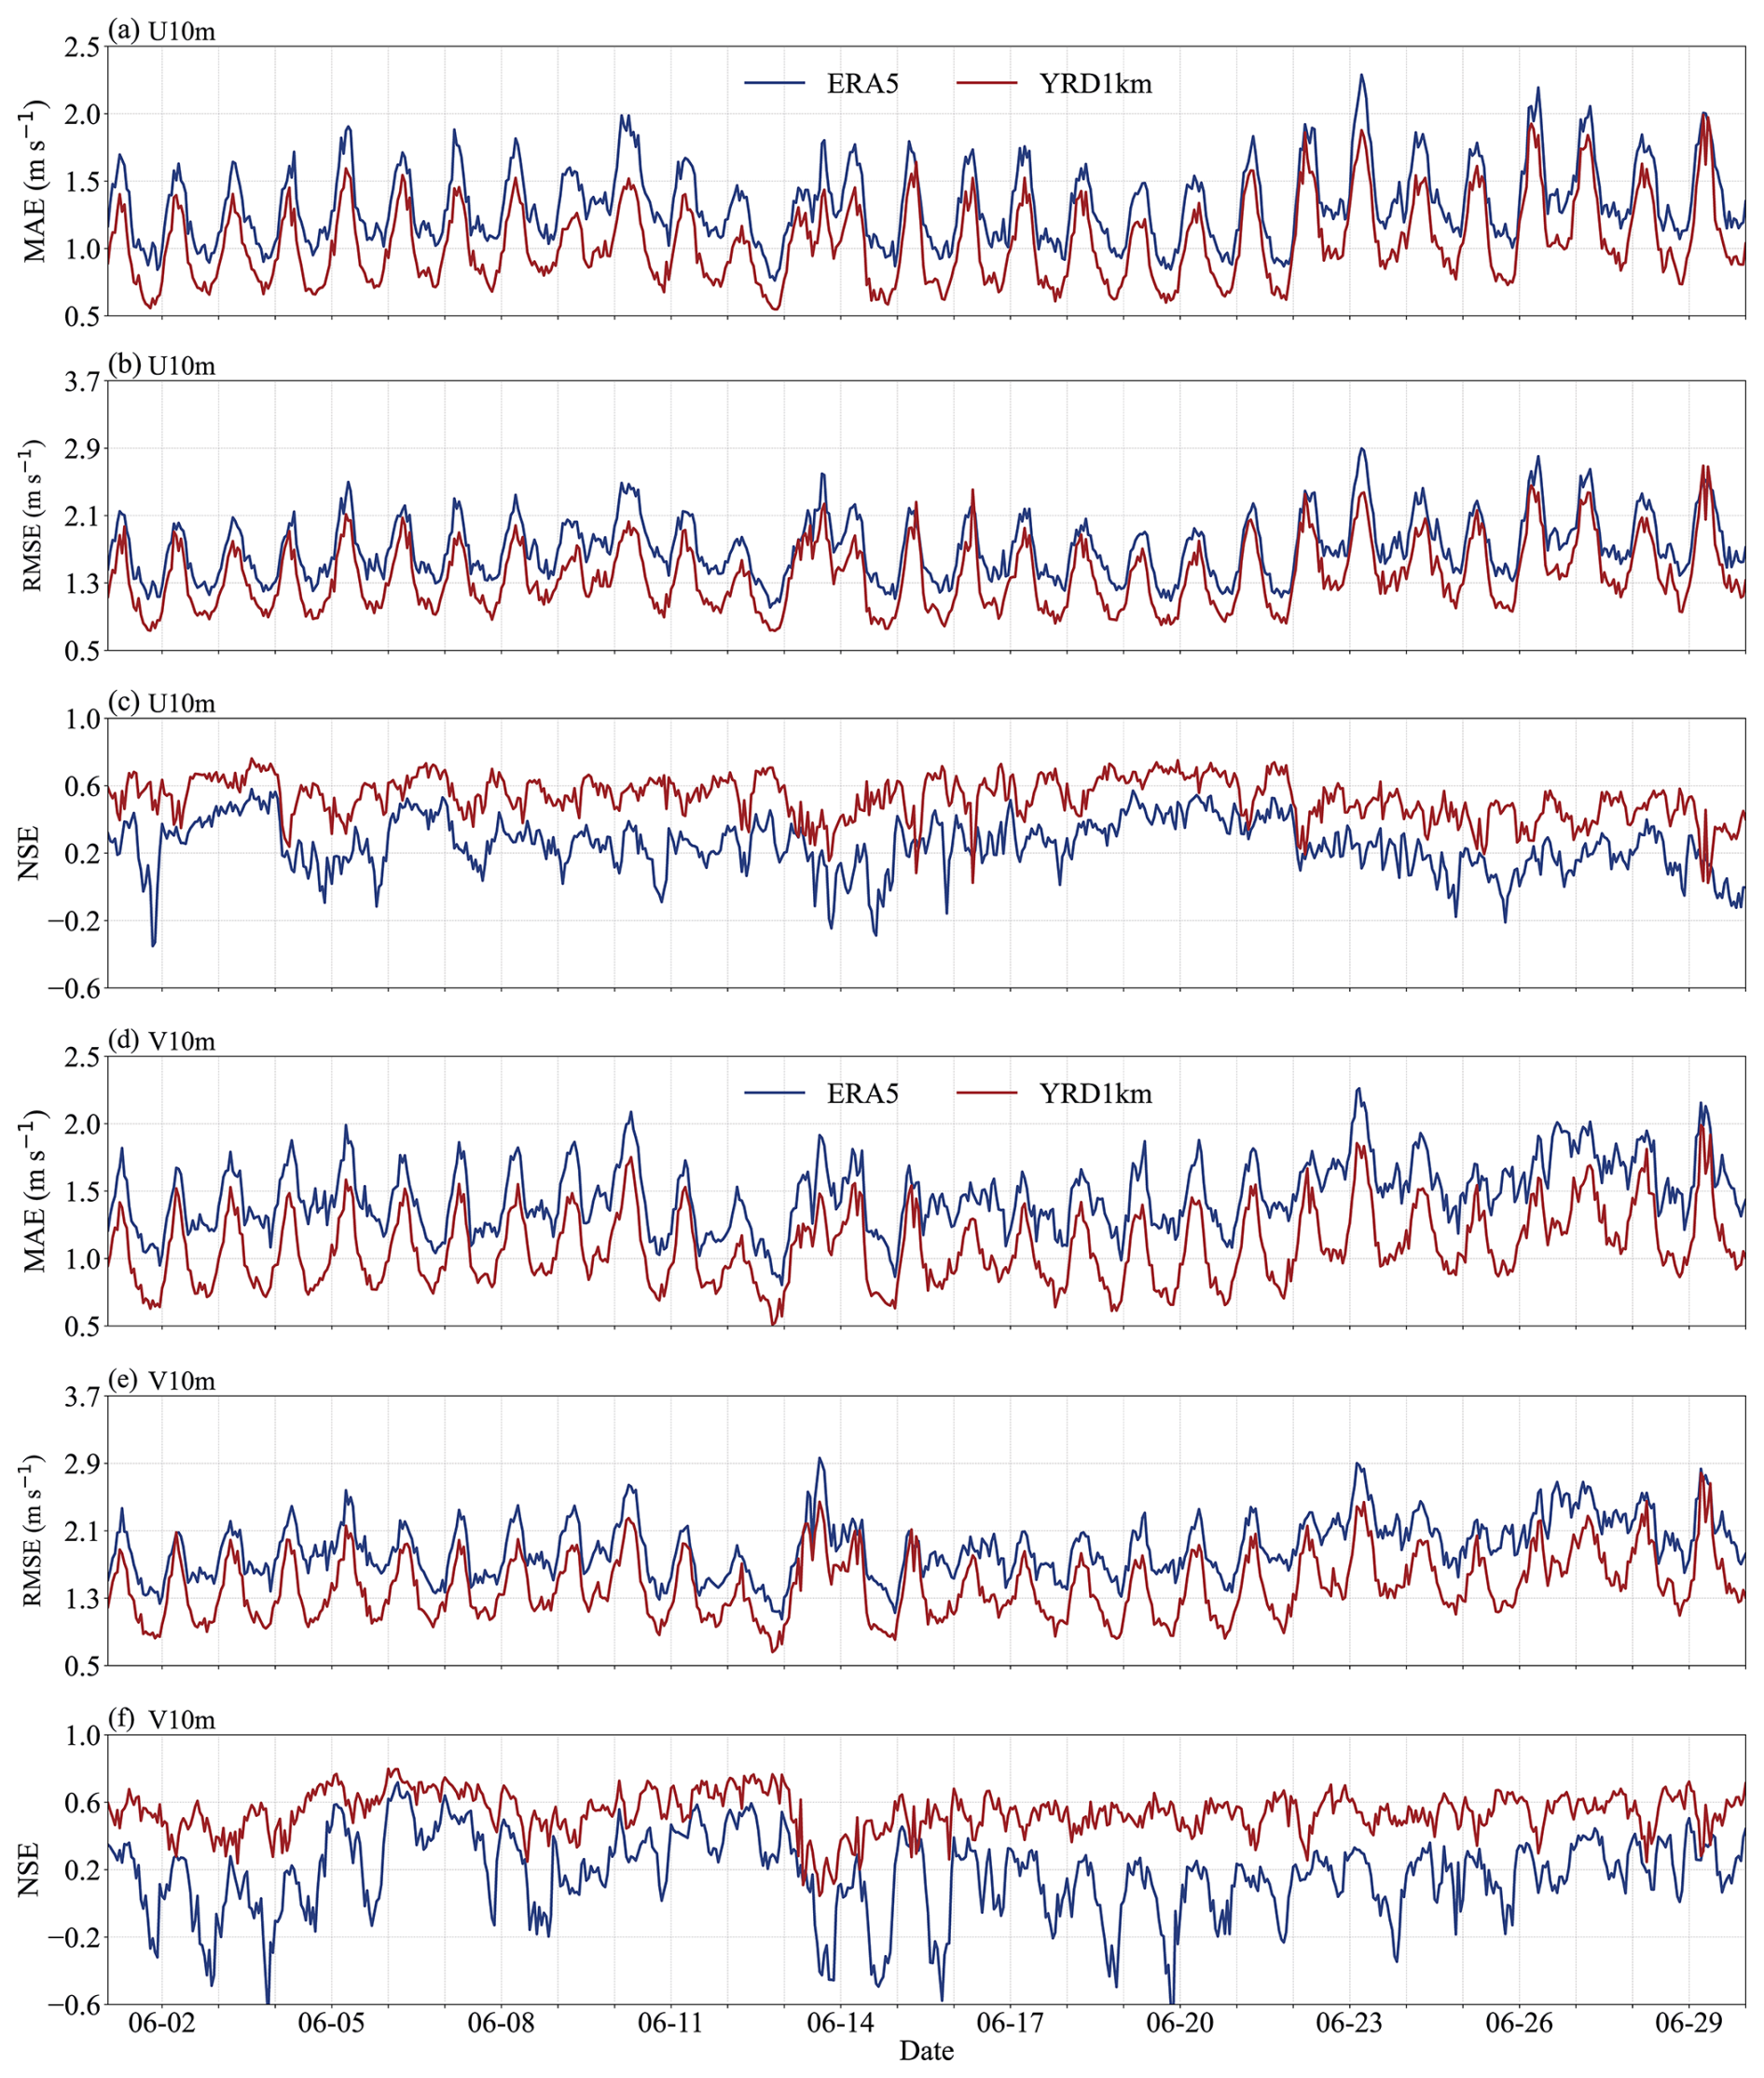
Figure 6Time series of model performance metrics for hourly 10 m wind components over the YRD region in June 2022. Panels (a), (b) and (c) show the MAE, RMSE and NSE, respectively, for the U10m. Panels (d), (e) and (f) show the corresponding MAE, RMSE and NSE metrics for the V10m. All metrics are computed for each hour by spatially averaging errors over all available surface stations across the YRD region. The red and blue lines represent the YRD1km and ERA5 datasets, respectively.
Collectively, the spatial patterns observed in both scalar (wind speed) and vector (wind direction) fields strongly affirm the capability of YRD1km to resolve sub-regional atmospheric dynamics. These results further highlight the dataset's potential for supporting a broad spectrum of regional meteorological applications.
Table 4Evaluation of 10 m wind field simulation performance over the YRD region in June 2022.
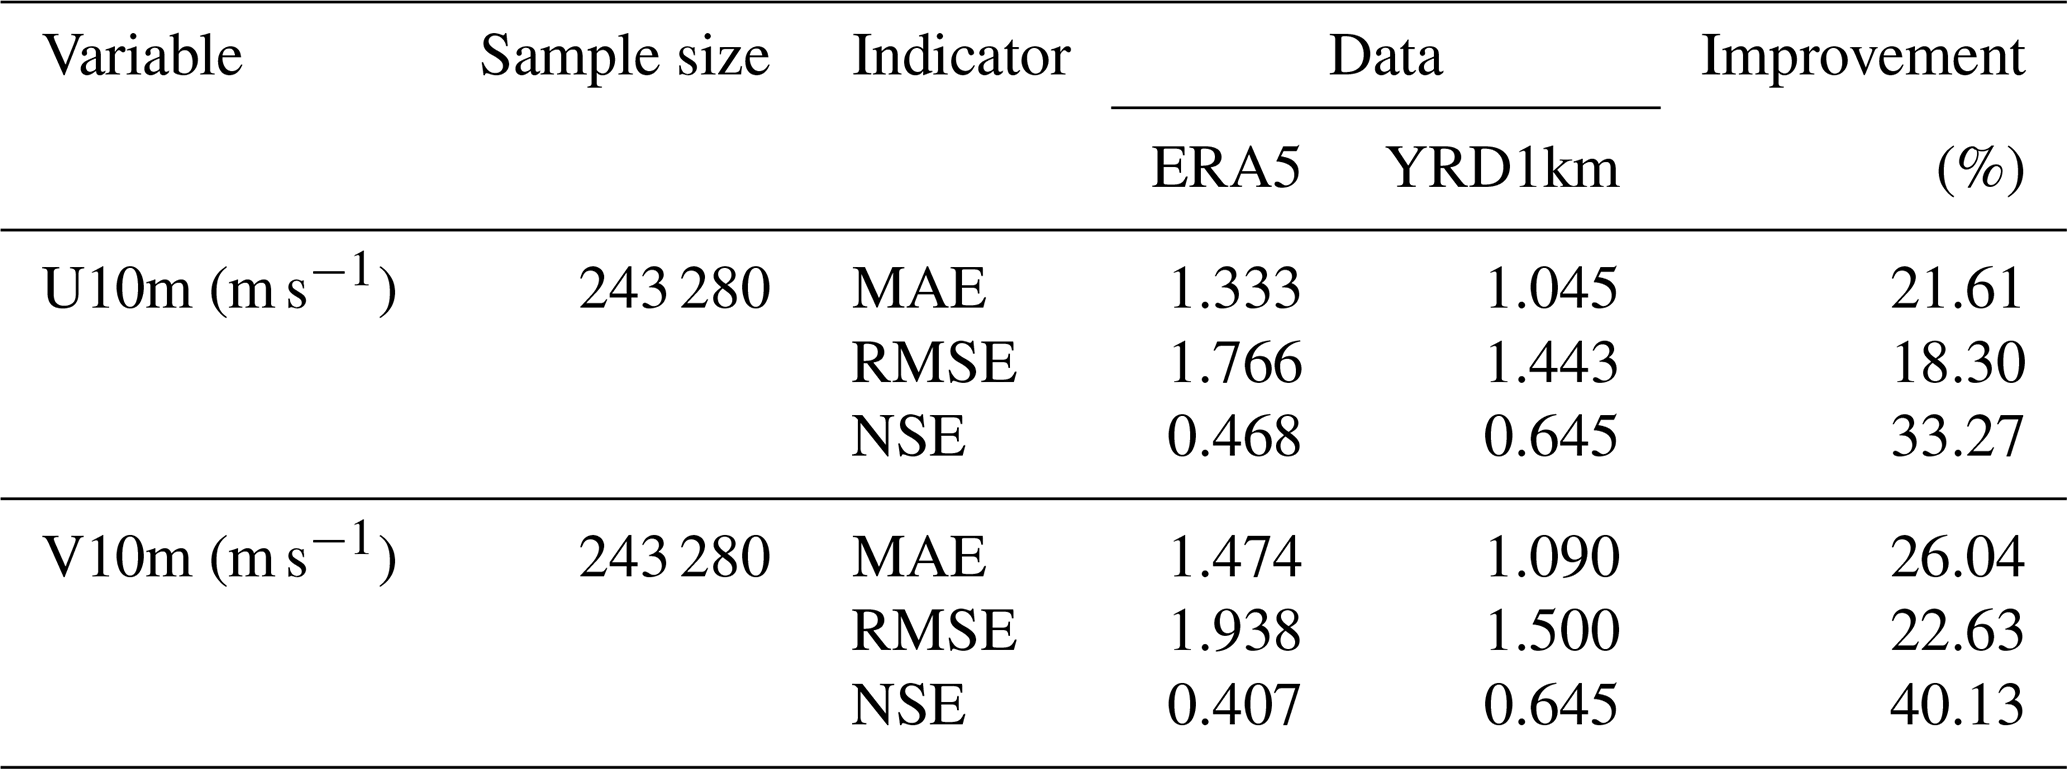

Figure 7Vertical evaluation of wind field performance from the YRD1km and ERA5 datasets against radiosonde observations at the Baoshan station in Shanghai during June 2022. (a) Vertical profiles of wind speed MAE (dashed lines) and RMSE (solid lines) for YRD1km (red) and ERA5 (blue), calculated from all available soundings at 00:00 and 12:00 UTC. (b) Time–height cross-section of wind vector differences between ERA5 and radiosonde observations (RAOB), with wind speed differences (m s−1) indicated by color shading. (c) As in (b), but for YRD1km minus RAOB. Wind difference plots are shown at 24 h intervals, beginning at 00:00 UTC on 2 June 2022.
4.2 Statistical Analysis of the Long-term Time Series of Surface Wind
To assess the temporal performance of the proposed YRD1km dataset, hourly time series analyses of the U10m and V10m wind components were conducted over the YRD region for June 2022. For each hour, the performance metrics were computed by spatially averaging errors over all available surface stations within the region. Figure 6 presents the corresponding evolutions of MAE, RMSE and NSE for both wind components, comparing the YRD1km product (red lines) with the ERA5 reanalysis (blue lines), based on validation against ground-based observational data.
The YRD1km dataset consistently outperforms ERA5 across both components and all metrics. MAE values for YRD1km remain consistently lower than those of ERA5, particularly during nighttime hours, in agreement with the statistical results summarized in Table 4, which show MAE reductions of 21.61 % for U10m and 26.04 % for V10m. In addition, the RMSE values for U10m and V10m are reduced by 18.30 % and 22.63 %, respectively. These results indicate the effectiveness of combining multi-source nudging and high-resolution land use data in consistently capturing subtle wind variations over time.
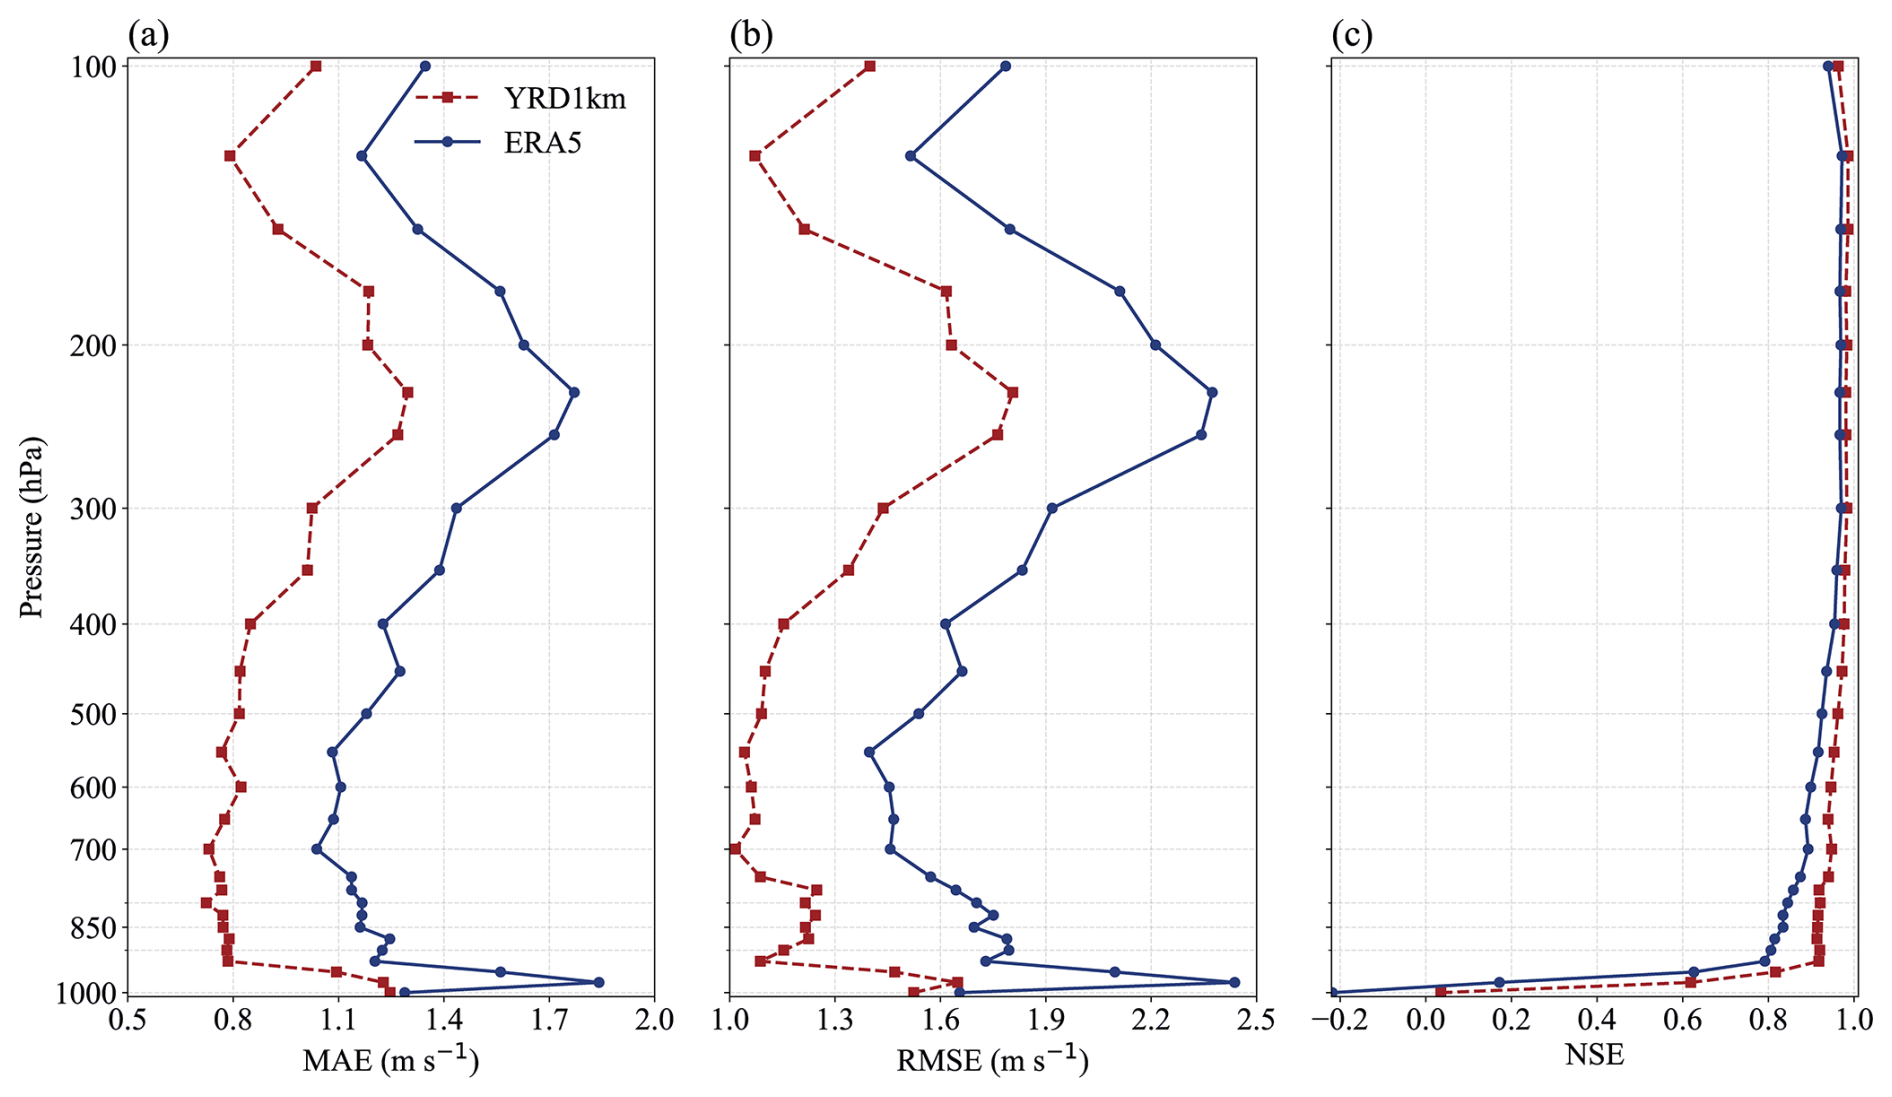
Figure 8Vertical evaluation of wind field performance from the YRD1km and ERA5 datasets against radiosonde observations at 11 stations across the Yangtze River Delta in June 2022. Panels show (a) MAE, (b) RMSE and (c) NSE, computed using all available 00:00 and 12:00 UTC soundings.
Both wind components exhibit pronounced diurnal cycles in MAE and RMSE, characterized by peak errors during daytime, particularly around local noon, and reduced errors during nighttime. This pattern reflects the influence of boundary layer dynamics, where daytime convective mixing enhances wind variability and poses greater challenges for model accuracy, whereas nocturnal stability leads to more predictable near-surface wind behavior. The persistence and regularity of this fluctuation across the month highlight the necessity of capturing diurnal processes in high-resolution simulations.
In terms of NSE, YRD1km maintains higher and more stable values throughout the month for both U10m and V10m. Specifically, NSE values increase by 33.27 % for U10m and 40.13 % for V10m compared to ERA5. While ERA5 frequently exhibits degraded performance, including negative NSE values during high-variability periods, YRD1km often sustains NSE above 0.4, with frequent peaks exceeding 0.6, especially during nocturnal hours. This reflects a markedly improved temporal agreement between modeled and observed wind variations.
Overall, the consistent improvements observed across both horizontal wind components confirm the robustness of the proposed downscaling framework. By effectively addressing both synoptic-scale and diurnal-scale variability, the YRD1km dataset provides a substantially enhanced representation of near-surface wind fields in a complex and highly urbanized region such as the YRD.
4.3 Evaluation of Vertical Wind Profile Accuracy Using Radiosonde Observations
To comprehensively evaluate the vertical simulation performance of the YRD1km dataset, radiosonde observations from the Baoshan station in Shanghai (ID: 58362) were used for the month of June 2022 at 00:00 and 12:00 UTC. This station is situated at 31.39° N, 121.45° E with an elevation of 3.3 m, within a densely built-up urban area. A comparative analysis was conducted between YRD1km and ERA5 reanalysis data for wind speed accuracy within the 1000–100 hPa pressure range, focusing on both Bias and RMSE metrics. The YRD1km dataset provides outputs at 32 standard vertical levels, ranging from 1000 hPa near the surface to 10 hPa in the upper atmosphere. These levels are obtained through vertical interpolation from the original 61 terrain-following eta levels of the WRF model. Key pressure levels include: 1000, 975, 950, 925, 900, 875, 850, 825, 800, 775, 750, 700, 650, 600, 550, 500, 450, 400, 350, 300, 250, 225, 200, 175, 150, 125, 100, 70, 50, 30, 20, and 10 hPa.
As illustrated in Fig. 7a, the vertical profiles of MAE (dashed lines) and RMSE (solid lines) reveal that the YRD1km dataset outperforms ERA5 across all pressure levels. The improvements are pronounced in the lower troposphere, benefiting from the dynamic constraints of multi-source observational nudging on near-surface winds and the refined land surface flux representation driven by high-resolution land use data. The maximum reduction in RMSE reaches up to 1.1 m s−1 at 975 hPa, representing a 42.18 % improvement and highlighting the substantial enhancement in near-surface wind speed accuracy provided by YRD1km.

Figure 9Hourly evolution of precipitation associated with a convective storm over northern Yancheng, Jiangsu Province, on 16 June 2022.
Time–height cross-section of wind vector differences plot (Fig. 7b and c) further highlights the clear performance of YRD1km. In Fig. 7b, ERA5 exhibits frequent and large wind speed differences, often exceeding ±5 m s−1, along with abrupt directional shifts, particularly within the near-surface layer. Notably, at 00:00 UTC on 24 June, radiosonde data indicate a sharp wind speed increase above the 950 hPa level, exceeding 19.5 m s−1, which ERA5 significantly underestimates. This result is consistent with previous studies that have identified ERA5's limitations in capturing extreme wind events due to its coarser resolution and less-constrained boundary layer parameterizations (Alkhalidi et al., 2025). In contrast, the YRD1km dataset exhibits a more stable vertical wind structure, with smaller deviations from observed values. Although slight underestimations remain during high wind episodes, the magnitude of extreme discrepancies is considerably reduced compared to ERA5. This improvement underscores the effectiveness of the multi-source observational nudging system in locally constraining vertical wind profiles and enhancing model fidelity.
To further assess the representativeness of the vertical performance, we conducted similar validations from all valid sounding samples at 11 radiosonde stations across the Yangtze River Delta are now presented in Fig. 8. These statistics show robust and systematic improvements of YRD1km relative to ERA5, including average reductions of approximately 29.64 % in MAE, 27.78 % in RMSE, and increases of about 47.75 % in NSE, confirming that the enhanced 3D wind performance of YRD1km is robust and regionally representative throughout the troposphere.
In summary, the YRD1km dataset, developed through the synergistic integration of high-resolution land surface information and multi-source data assimilation techniques, significantly improves not only near-surface wind simulations but also the representation of vertical wind structures. This provides a reliable, high-quality data foundation for a wide range of 3D wind field–dependent applications, such as low-level wind shear, wind turbine load estimation, pollutant cross-layer transport modeling, and urban atmospheric environment studies.
4.4 Case Studies of Severe Convection Events
While previous statistical validations have demonstrated the superior performance of the YRD1km dataset spatially and temporally, its advantages are further illustrated in short-term, high-impact convective events. In such situations, the high spatial and temporal resolution of YRD1km enables a more detailed diagnosis of mesoscale and vertical dynamical structures associated with convective initiation and evolution.
As illustrated in Fig. 9, based on the China Multi-Source Merged Precipitation Analysis (CMPAS) dataset, a convective storm outbreak occurred over northern Yancheng, Jiangsu Province, on the afternoon of 16 June 2022. The event was characterized by highly localized and intense precipitation, with peak hourly rainfall rates reaching up to 20 mm h−1.
To investigate the applicability of the YRD1km dataset in high-impact weather scenarios, this study conducts a comparative analysis of wind field structures between ERA5 and YRD1km during the convective event, focusing on three key pressure levels: 500, 700, and 850 hPa (Fig. 10). These levels are critical for identifying shear lines, low-level jets, and convective initiation mechanisms.
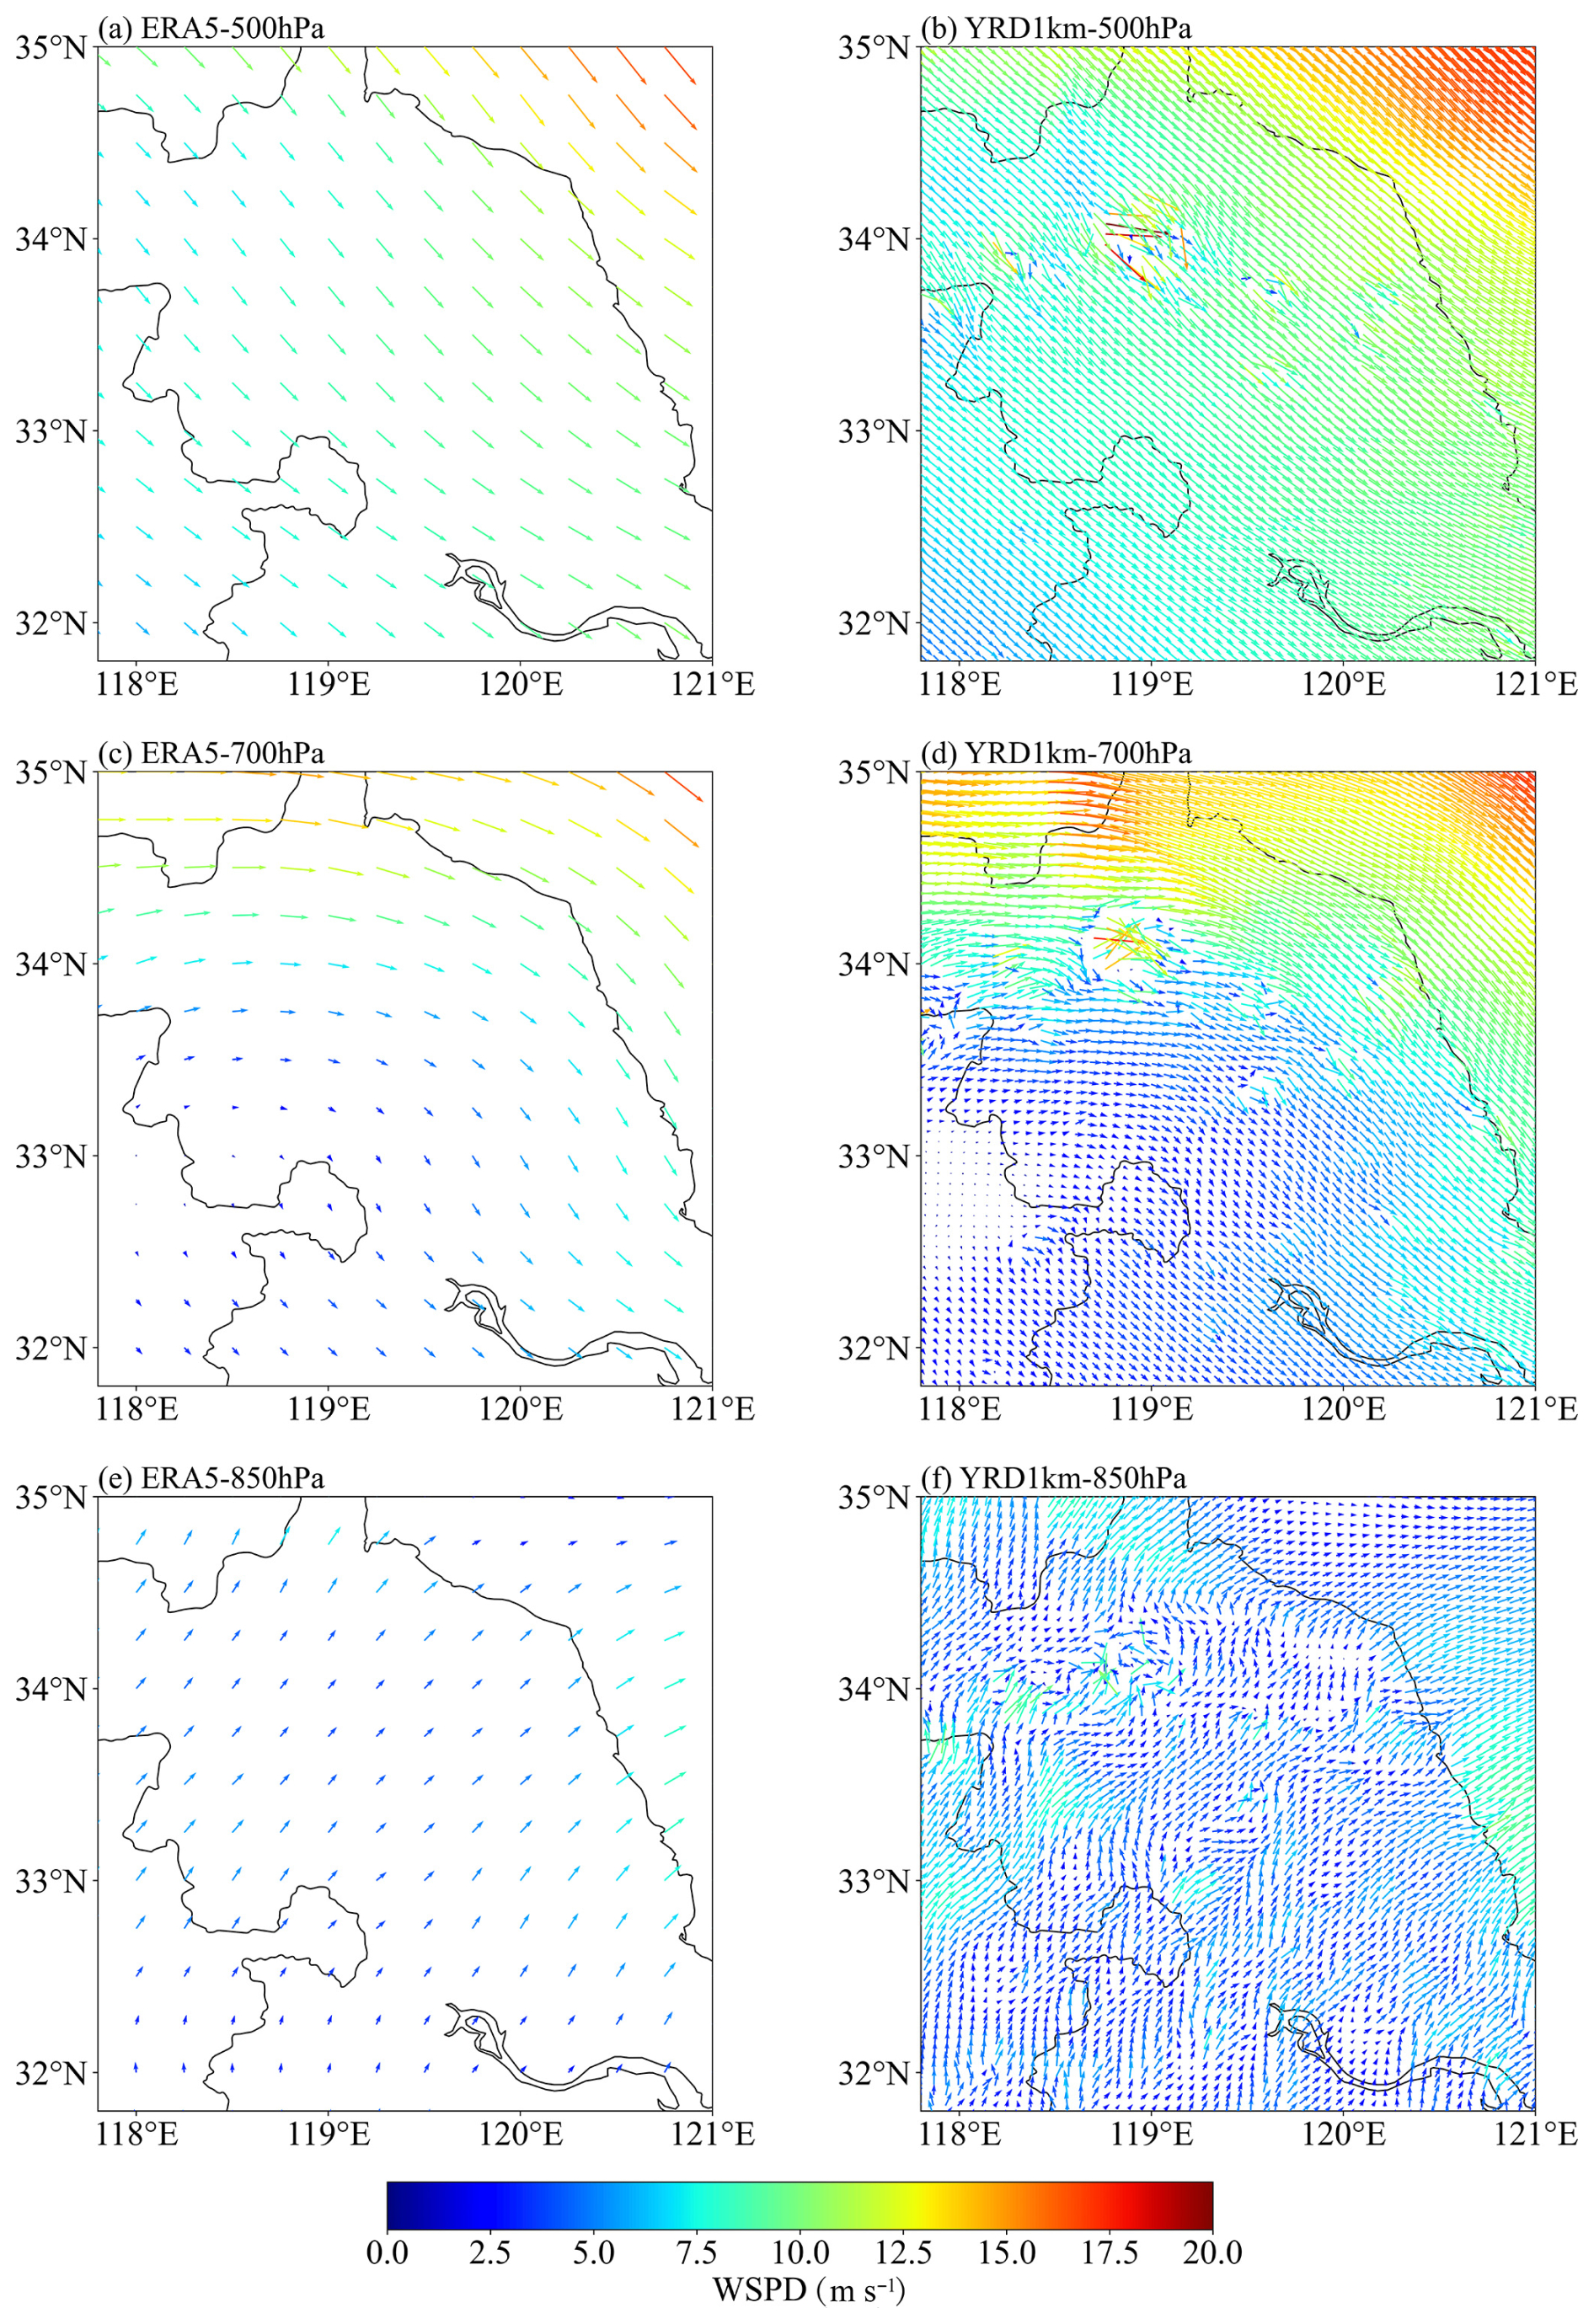
Figure 10Comparative analysis of wind field structures between the YRD1km and ERA5 datasets during the short-duration severe convective event over Yancheng, Jiangsu Province. Displayed are horizontal wind vectors (arrows) and wind speed (color shading) at the (a, b) 500 hPa, (c, d) 700 hPa, and (e, f) 850 hPa levels from ERA5 (left column) and YRD1km (right column) at 08:00 UTC on 16 June 2022. For visual clarity, YRD1km wind vectors have been thinned by a factor of six.
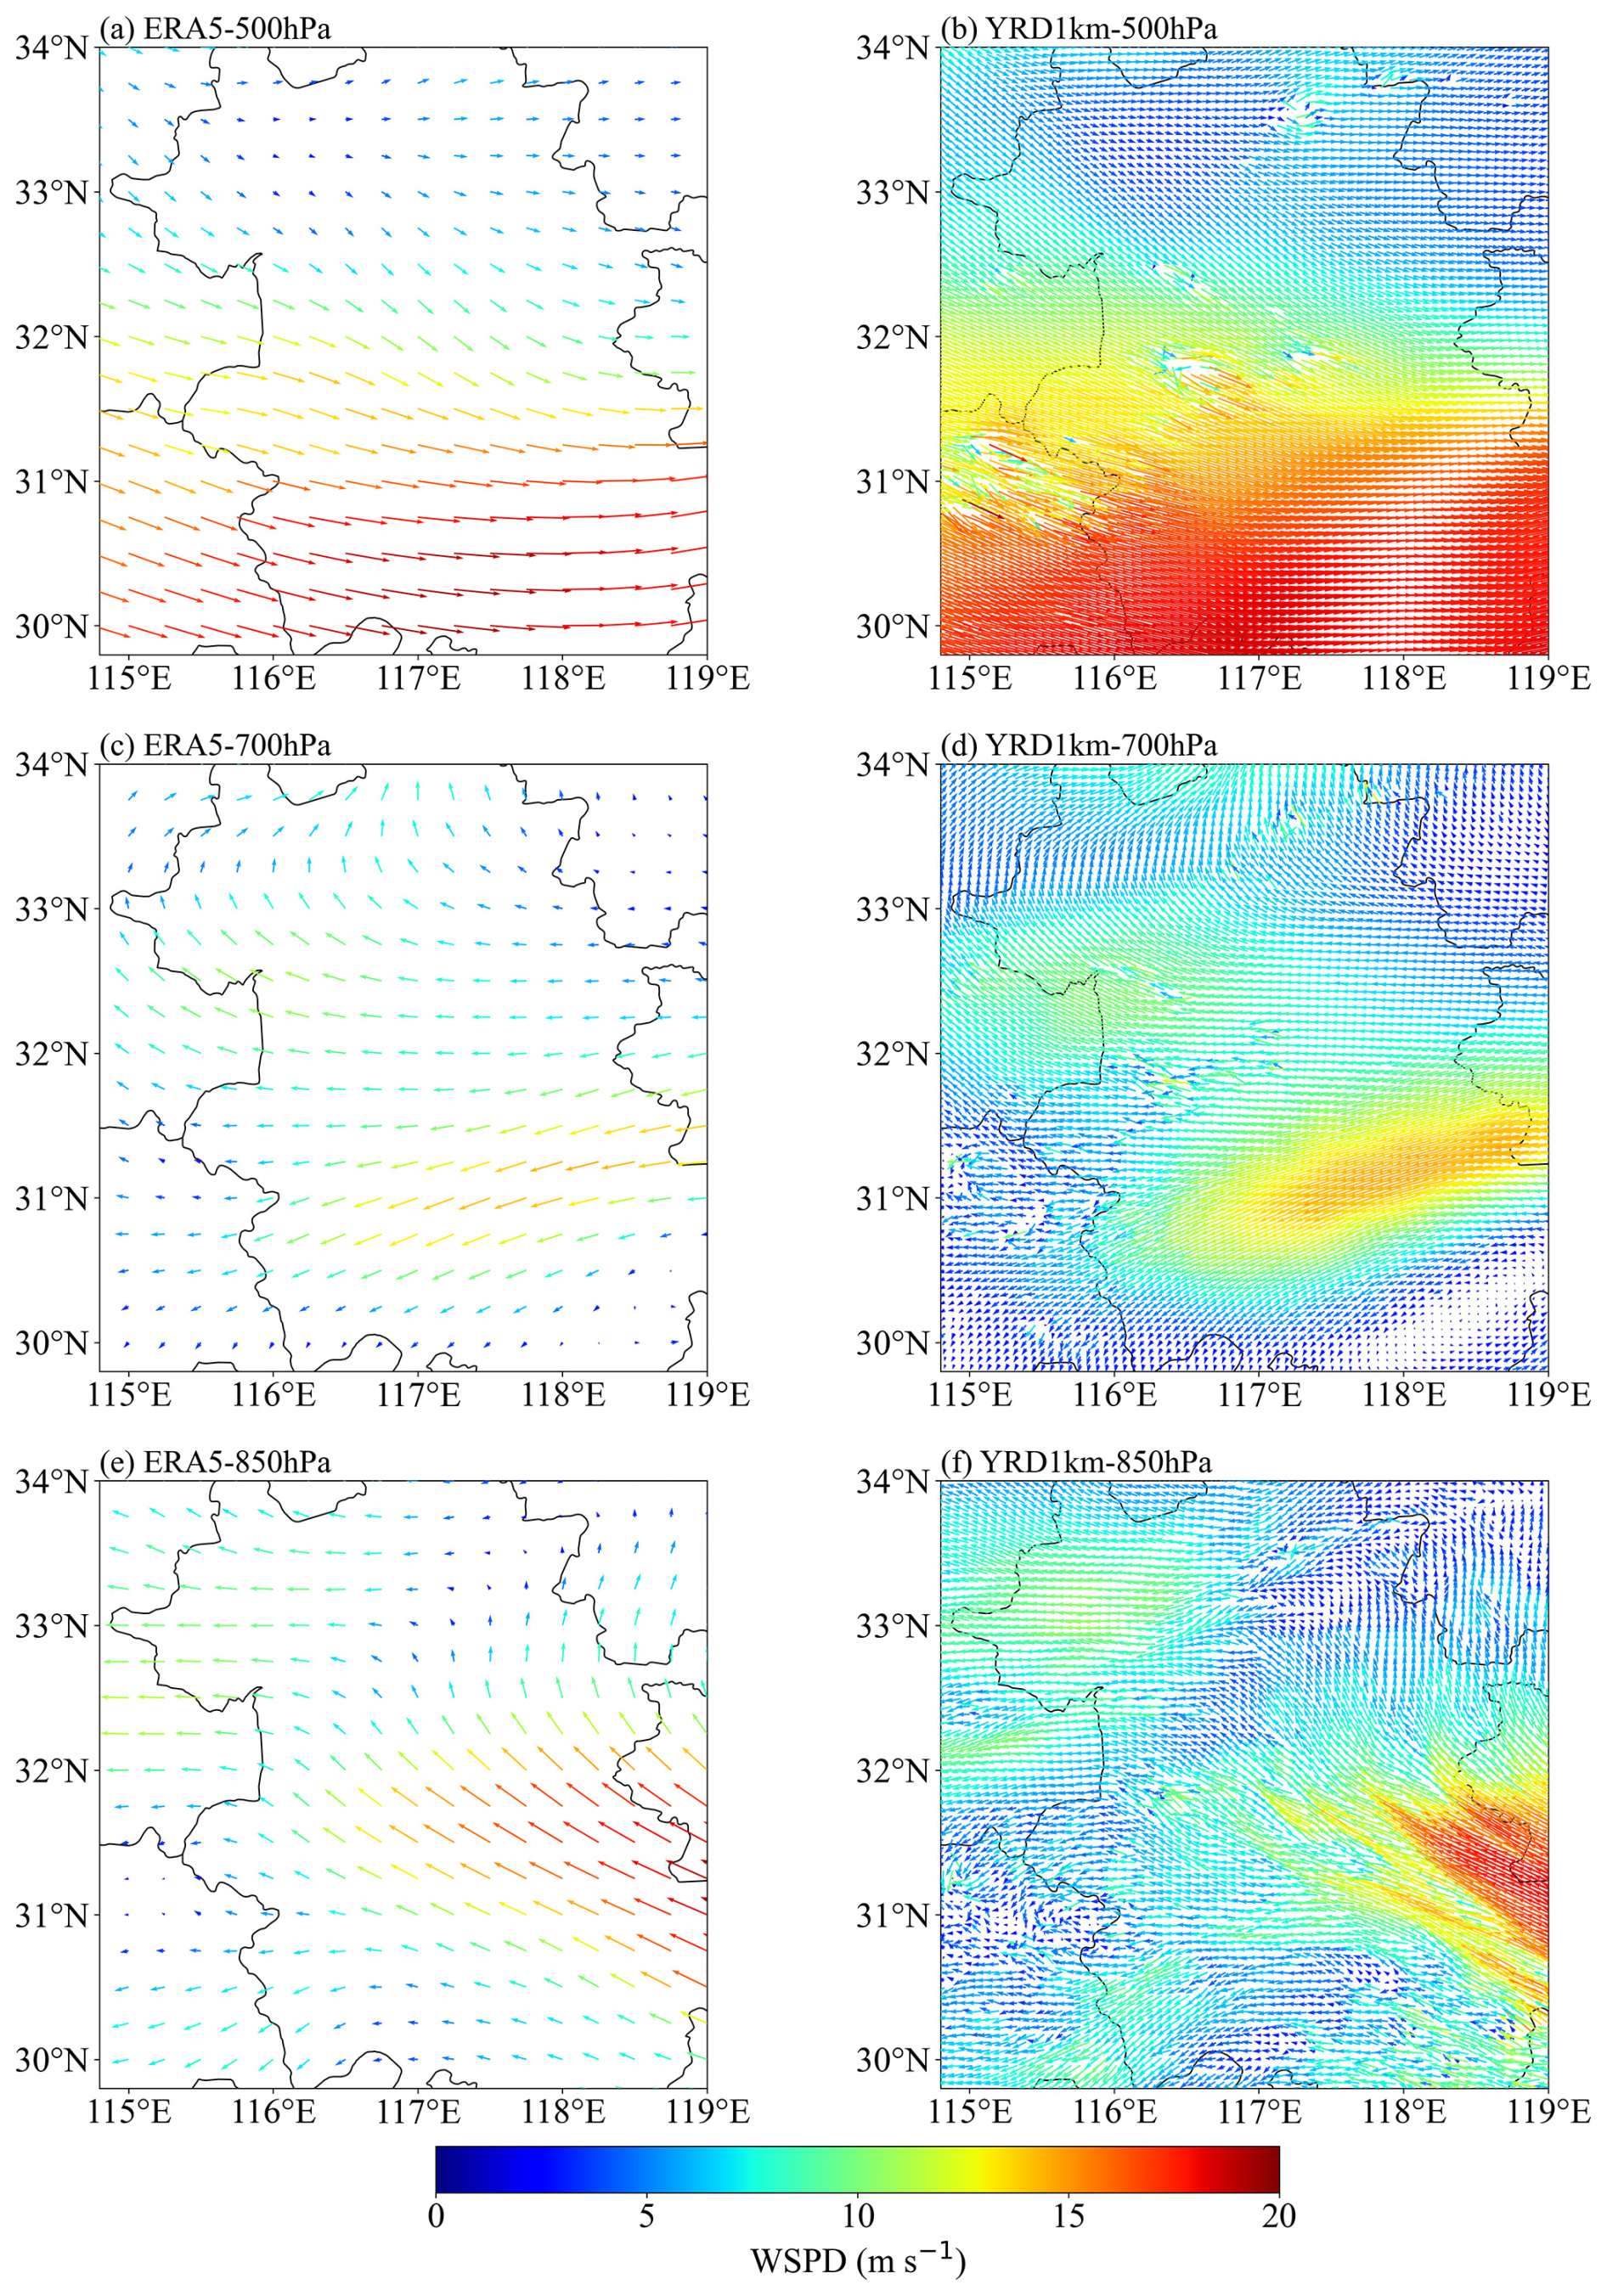
Figure 11Comparative analysis of horizontal wind field structures between ERA5 and YRD1km during a mesoscale convective precipitation event over the study region on 10 June 2022. Shown are horizontal wind vectors (arrows) and wind speed (color shading) at the (a, b) 500 hPa, (c, d) 700 hPa, and (e, f) 850 hPa levels from ERA5 (left column) and YRD1km (right column) at 04:00 UTC, corresponding to the mature stage of the convective system. For visual clarity, wind vectors in YRD1km are thinned by a factor of six.
Overall, the wind field structure in ERA5 appears relatively homogeneous, limiting its ability to capture mesoscale and sub-mesoscale disturbances. In contrast, YRD1km reveals more detailed local structures and dynamic features, demonstrating a stronger capacity to resolve mesoscale systems. Across all three pressure levels, YRD1km consistently captures regions of enhanced wind speed, wind shear, and convergence. Notably, near 34° N, 119° E at 500 hPa, YRD1km identifies a localized wind speed maximum exceeding 17.5 m s−1 and a well-defined shear zone. At 700 hPa, a clear convergence band and wind speed enhancement area are observed, which is conducive to the maintenance and development of the convective system. Although wind speeds weaken at 850 hPa, perturbation signatures remain evident. These structural features spatially align with the center of heavy precipitation during the event, indicating that YRD1km has enhanced diagnostic capability in capturing the dynamical background for the initiation and maintenance of deep convective systems.
Similar three-dimensional wind structures and dynamical consistency are also observed in an independent mesoscale convective precipitation event on 10 June 2022 (Fig. 11). During the mature stage of this event, YRD1km consistently resolves enhanced wind speed gradients, low-level convergence, and vertically coherent shear structures across the 500, 700, and 850 hPa levels, whereas ERA5 depicts comparatively smooth and spatially homogeneous flow patterns. In particular, YRD1km captures a well-defined low-level jet and its associated convergence zone at 850 hPa, together with mesoscale wind speed enhancements at mid-levels. The spatial configuration of these features closely corresponds to the observed organization of convective precipitation, highlighting the ability of YRD1km to represent dynamically relevant structures that are critical for convective system development.
Collectively, these case analyses demonstrate that the high spatial resolution of YRD1km enables a physically consistent depiction of three-dimensional wind field structures during severe convective events. Such capability supports its use in diagnostic studies of mesoscale and convective-scale dynamics, and provides a valuable background wind field for applications including high-resolution air-quality dispersion modeling, event-based wind hazard assessment, and the development of training datasets for data-driven downscaling approaches.
The YRD1km 3D wind field dataset is available at https://doi.org/10.57760/sciencedb.23752 (Zhang and Liu, 2025).
This study developed and rigorously validated YRD1km, a high-resolution (1 km, hourly) 3D wind field dataset over the YRD region. The dataset was generated through dynamical downscaling of ERA5 reanalysis data using a customized WRF model configuration. It was further refined by integrating multi-source observational nudging and updated land use representations to improve surface parameterization.
Comprehensive validations using surface station and radiosonde observations confirmed that YRD1km significantly outperforms ERA5 in both near-surface and vertical wind simulations. For 10 m wind fields, YRD1km consistently achieved smaller errors and higher skill scores across MAE, RMSE, and NSE, at both hourly and daily scales. The dataset also better characterizes spatial variability in wind speed, particularly over complex terrain and densely urbanized areas. Its wind vector fields align well with underlying geographic features, and monthly statistics show reductions in MAE and RMSE of approximately 20 %, with NSE improved by more than 33 %. In the vertical dimension, YRD1km exhibited reduced RMSE across nearly all pressure levels and produced observation-consistent vertical profiles. Analyses of severe convective events demonstrated YRD1km's ability to resolve fine-scale dynamic signatures, including wind shear, low-level convergence, and enhanced wind zones, supporting improved diagnosis of convective development mechanisms.
These findings highlight the value of high-resolution wind datasets that integrate physically consistent dynamical downscaling with observational constraints in representing mesoscale and diurnal wind variability over complex urbanized environments. The YRD1km dataset provides a robust, physically coherent foundation for applications that require detailed three-dimensional wind information, including wind energy resource assessment, urban boundary-layer diagnostics, and high-resolution air quality and pollutant dispersion modeling. In particular, the resolved fine-scale vertical wind structures offer important potential for diagnosing low-level wind shear and related dynamical features, which are critical for understanding urban atmospheric processes and for supporting safety-oriented analyses relevant to low-altitude airspace operations in rapidly developing metropolitan regions.
Looking ahead, the proposed framework can be further extended to generate longer-term, seasonally continuous high-resolution wind datasets and applied to other regions with complex terrain and heterogeneous land use. Future developments may also incorporate additional observational constraints, such as satellite-based wind products and higher-frequency ground-based remote sensing measurements. In addition, the YRD1km dataset can serve as a physically consistent reference or training dataset for emerging data-driven downscaling approaches, including machine learning models and sub-kilometer-scale simulations, thereby supporting next-generation high-resolution atmospheric modeling and applied research.
ZZ: data collection and processing; methodology and analysis; writing (original draft preparation). YL: conceptualization; supervision; methodology and analysis; writing (original draft preparation, review, and editing). XM, PX, and JZ: data collection. ZL, MM, DD, and BL: writing (review and editing). JL: supervision; writing (review and editing).
The contact author has declared that none of the authors has any competing interests.
Publisher's note: Copernicus Publications remains neutral with regard to jurisdictional claims made in the text, published maps, institutional affiliations, or any other geographical representation in this paper. The authors bear the ultimate responsibility for providing appropriate place names. Views expressed in the text are those of the authors and do not necessarily reflect the views of the publisher.
We gratefully acknowledge the ECNU Multifunctional Platform for Innovation 001 for providing high-performance computing resources. We also thank the ECMWF for access to the ERA5 reanalysis data, the NCEP for the global upper air and surface weather observations, the CMA for providing AWS data, and the ESA for the WorldCover 2020 land use data. Finally, we sincerely thank the editor and anonymous reviewers for their insightful comments and constructive suggestions, which greatly improved the quality of this manuscript.
This research was supported by the National Natural Science Foundation of China (grant nos. U2542201 and 42575164) and the Shanghai Science and Technology Program (grant no. 25ZR1401099).
This paper was edited by Qingxiang Li and reviewed by Timothy Chui and one anonymous referee.
Alkhalidi, M., Al-Dabbous, A., Al-Dabbous, S., and Alzaid, D.: Evaluating the Accuracy of the ERA5 Model in Predicting Wind Speeds Across Coastal and Offshore Regions, J. Mar. Sci. Eng., 13, 149, https://doi.org/10.3390/jmse13010149, 2025.
Anderson, J. T., Hardy, E. E., Roach, J. T., and Witmer, R. E.: A land use and land cover classification system for use with remote sensor data, Professional Paper, U.S. Geological Survey, https://doi.org/10.3133/pp964, 1976.
Bao, J., Feng, J., and Wang, Y.: Dynamical downscaling simulation and future projection of precipitation over China, J. Geophys. Res.-Atmos., 120, 8227–8243, https://doi.org/10.1002/2015JD023275, 2015.
Bernini, L., Lagasio, M., Milelli, M., Oberto, E., Parodi, A., Hachinger, S., Kranzlmüller, D., and Tartaglione, N.: Convection-permitting dynamical downscaling of ERA5 for Europe and the Mediterranean basin, Q. J. Roy. Meteor. Soc., 151, e5014, https://doi.org/10.1002/qj.5014, 2025.
Boé, J., Terray, L., Habets, F., and Martin, E.: Statistical and dynamical downscaling of the Seine basin climate for hydro-meteorological studies, Int. J. Climatol., 27, 1643–1655, https://doi.org/10.1002/joc.1602, 2007.
Collier, E. and Mölg, T.: BAYWRF: a high-resolution present-day climatological atmospheric dataset for Bavaria, Earth Syst. Sci. Data, 12, 3097–3112, https://doi.org/10.5194/essd-12-3097-2020, 2020.
Daescu, D. N. and Langland, R. H.: Error covariance sensitivity and impact estimation with adjoint 4D-Var: theoretical aspects and first applications to NAVDAS-AR, Q. J. Roy. Meteor. Soc., 139, 226–241, https://doi.org/10.1002/qj.1943, 2013.
Dayon, G., Boé, J., and Martin, E.: Transferability in the future climate of a statistical downscaling method for precipitation in France, J. Geophys. Res.-Atmos., 120, 1023–1043, https://doi.org/10.1002/2014JD022236, 2015.
De Bode, M., Hedde, T., Roubin, P., and Durand, P.: A Method to Improve Land Use Representation for Weather Simulations Based on High-Resolution Data Sets – Application to Corine Land Cover Data in the WRF Model, Earth Space Sci., 10, e2021EA002123, https://doi.org/10.1029/2021EA002123, 2023.
Dudhia, J.: Numerical Study of Convection Observed during the Winter Monsoon Experiment Using a Mesoscale Two-Dimensional Model, J. Atmos. Sci., 46, 3077–3107, https://doi.org/10.1175/1520-0469(1989)046<3077:NSOCOD>2.0.CO;2, 1989.
Dujardin, J. and Lehning, M.: Wind-Topo: Downscaling near-surface wind fields to high-resolution topography in highly complex terrain with deep learning, Q. J. Roy. Meteor. Soc., 148, 1368–1388, https://doi.org/10.1002/qj.4265, 2022.
Dupuy, F., Durand, P., and Hedde, T.: Downscaling of surface wind forecasts using convolutional neural networks, Nonlin. Processes Geophys., 30, 553–570, https://doi.org/10.5194/npg-30-553-2023, 2023.
Fu, D., Liu, Y., Li, H., Liu, S., Li, B., Thapa, S., Yabo, S., Sun, X., Tang, B., Zuo, J., Qi, H., and Tian, C.: Evaluating the Impacts of Land Cover and Soil Texture Changes on Simulated Surface Wind and Temperature, Earth Space Sci., 7, e2020EA001173, https://doi.org/10.1029/2020EA001173, 2020.
Golzio, A., Ferrarese, S., Cassardo, C., Diolaiuti, G. A., and Pelfini, M.: Land-Use Improvements in the Weather Research and Forecasting Model over Complex Mountainous Terrain and Comparison of Different Grid Sizes, Bound.-Lay. Meteorol., 180, 319–351, https://doi.org/10.1007/s10546-021-00617-1, 2021.
Gutowski, W. J., Ullrich, P. A., Hall, A., Leung, L. R., O'Brien, T. A., Patricola, C. M., Arritt, R. W., Bukovsky, M. S., Calvin, K. V., Feng, Z., Jones, A. D., Kooperman, G. J., Monier, E., Pritchard, M. S., Pryor, S. C., Qian, Y., Rhoades, A. M., Roberts, A. F., Sakaguchi, K., Urban, N., and Zarzycki, C.: The Ongoing Need for High-Resolution Regional Climate Models: Process Understanding and Stakeholder Information, B. Am. Meteorol. Soc., 101, E664–E683, https://doi.org/10.1175/bams-d-19-0113.1, 2020.
Harkey, M. and Holloway, T.: Constrained dynamical downscaling for assessment of climate impacts, J. Geophys. Res.-Atmos., 118, 2136–2148, https://doi.org/10.1002/jgrd.50223, 2013.
Hersbach, H., Bell, B., Berrisford, P., Hirahara, S., Horányi, A., Muñoz-Sabater, J., Nicolas, J., Peubey, C., Radu, R., Schepers, D., Simmons, A., Soci, C., Abdalla, S., Abellan, X., Balsamo, G., Bechtold, P., Biavati, G., Bidlot, J., Bonavita, M., De Chiara, G., Dahlgren, P., Dee, D., Diamantakis, M., Dragani, R., Flemming, J., Forbes, R., Fuentes, M., Geer, A., Haimberger, L., Healy, S., Hogan, R. J., Hólm, E., Janisková, M., Keeley, S., Laloyaux, P., Lopez, P., Lupu, C., Radnoti, G., de Rosnay, P., Rozum, I., Vamborg, F., Villaume, S., and Thépaut, J.-N.: The ERA5 global reanalysis, Q. J. Roy. Meteor. Soc., 146, 1999–2049, https://doi.org/10.1002/qj.3803, 2020.
Höhlein, K., Kern, M., Hewson, T., and Westermann, R.: A comparative study of convolutional neural network models for wind field downscaling, Meteorol. Appl., 27, e1961, https://doi.org/10.1002/met.1961, 2020.
Hoke, J. E. and Anthes, R. A.: The Initialization of Numerical Models by a Dynamic-Initialization Technique, Mon. Weather Rev., 104, 1551–1556, https://doi.org/10.1175/1520-0493(1976)104<1551:tionmb>2.0.co;2, 1976.
Hong, S.-Y., Noh, Y., and Dudhia, J.: A New Vertical Diffusion Package with an Explicit Treatment of Entrainment Processes, Mon. Weather Rev., 134, 2318–2341, https://doi.org/10.1175/mwr3199.1, 2006.
Horvath, K., Koracin, D., Vellore, R., Jiang, J., and Belu, R.: Sub-kilometer dynamical downscaling of near-surface winds in complex terrain using WRF and MM5 mesoscale models, J. Geophys. Res.-Atmos., 117, https://doi.org/10.1029/2012JD017432, 2012.
Hu, W., Scholz, Y., Yeligeti, M., von Bremen, L. , and Deng, Y.: Downscaling ERA5 wind speed data: a machine learning approach considering topographic influences, Environ. Res. Lett., 18, 094007, https://doi.org/10.1088/1748-9326/aceb0a, 2023.
Jung, C. and Schindler, D.: On the influence of wind speed model resolution on the global technical wind energy potential, Renew. Sust. Energ. Rev., 156, 112001, https://doi.org/10.1016/j.rser.2021.112001, 2022.
Kain, J. S.: The Kain–Fritsch Convective Parameterization: An Update, J. Appl. Meteorol., 43, 170–181, https://doi.org/10.1175/1520-0450(2004)043<0170:TKCPAU>2.0.CO;2, 2004.
Kotlarski, S., Szabó, P., Herrera, S., Räty, O., Keuler, K., Soares, P. M., Cardoso, R. M., Bosshard, T., Pagé, C., Boberg, F., Gutiérrez, J. M., Isotta, F. A., Jaczewski, A., Kreienkamp, F., Liniger, M. A., Lussana, C., and Pianko-Kluczyńska, K.: Observational uncertainty and regional climate model evaluation: A pan-European perspective, Int. J. Climatol., 39, 3730–3749, https://doi.org/10.1002/joc.5249, 2019.
Lei, L. and Hacker, J. P.: Nudging, Ensemble, and Nudging Ensembles for Data Assimilation in the Presence of Model Error, Mon. Weather Rev., 143, 2600–2610, https://doi.org/10.1175/MWR-D-14-00295.1, 2015.
Lian, J., Huang, S., Shao, J., Chen, P., Tang, S., Lu, Y., and Yu, H.: TerraWind: A Deep Learning-Based Near-Surface Winds Downscaling Model for Complex Terrain Region, Geophys. Res. Lett., 51, e2024GL112124, https://doi.org/10.1029/2024GL112124, 2024.
Liu, J., Shi, C., Ge, L., Tie, R., Chen, X., Zhou, T., Gu, X., and Shen, Z.: Enhanced Wind Field Spatial Downscaling Method Using UNET Architecture and Dual Cross-Attention Mechanism, Remote Sens., 16, 1867, https://doi.org/10.3390/rs16111867, 2024a.
Liu, S., Zeman, C., and Schär, C.: Dynamical Downscaling of Climate Simulations in the Tropics, Geophys. Res. Lett., 51, e2023GL105733, https://doi.org/10.1029/2023GL105733, 2024b.
Liu, Y., Di, D., Li, J., Li, Z., Ma, Z., Zheng, J., Liu, Y.-A., and Zhang, T.: Consistency Assessment of the Winds in Reanalysis Datasets and the GIIRS Product Using Radiosondes, Adv. Atmos. Sci., https://doi.org/10.1007/s00376-025-4138-x, 2025.
Lo, J. C., Yang, Z., and Pielke, R. A.: Assessment of three dynamical climate downscaling methods using the Weather Research and Forecasting (WRF) model, J. Geophys. Res.-Atmos., 113, 2007JD009216, https://doi.org/10.1029/2007JD009216, 2008.
Mlawer, E. J., Taubman, S. J., Brown, P. D., Iacono, M. J., and Clough, S. A.: Radiative transfer for inhomogeneous atmospheres: RRTM, a validated correlated-k model for the longwave, J. Geophys. Res.-Atmos., 102, 16663–16682, https://doi.org/10.1029/97JD00237, 1997.
Molina, M. O., Gutiérrez, C., and Sánchez, E.: Comparison of ERA5 surface wind speed climatologies over Europe with observations from the HadISD dataset, Int. J. Climatol., 41, 4864–4878, https://doi.org/10.1002/joc.7103, 2021.
Nash, J. E. and Sutcliffe, J. V.: River flow forecasting through conceptual models part I – A discussion of principles, J. Hydrol., 10, 282–290, https://doi.org/10.1016/0022-1694(70)90255-6, 1970.
Nashwan, M. S., Shahid, S., and Chung, E.-S.: Development of high-resolution daily gridded temperature datasets for the central north region of Egypt, Sci. Data, 6, 138, https://doi.org/10.1038/s41597-019-0144-0, 2019.
National Centers for Environmental Prediction/National Weather Service/National Oceanic and Atmospheric Administration/U.S. Department of Commerce: NCEP ADP global upper air and surface weather observations (PREPBUFR format) (updated daily), Research Data Archive at the National Center for Atmospheric Research, Computational and Information Systems Laboratory, https://doi.org/10.5065/Z83F-N512, 2008.
Sahu, R. K., Bangalath, H. K., Mostamandi, S., Evans, J., Kucera, P. A., and Beck, H. E.: Evaluation of microphysics and boundary layer schemes for simulating extreme rainfall events over Saudi Arabia using WRF-ARW, Nat. Hazards Earth Syst. Sci., 26, 21–40, https://doi.org/10.5194/nhess-26-21-2026, 2026.
Santos-Alamillos, F. J., Pozo-Vázquez, D., Ruiz-Arias, J. A., and Tovar-Pescador, J.: Influence of land-use misrepresentation on the accuracy of WRF wind estimates: Evaluation of GLCC and CORINE land-use maps in southern Spain, Atmos. Res., 157, 17–28, https://doi.org/10.1016/j.atmosres.2015.01.006, 2015.
Siewert, J. and Kroszczynski, K.: Evaluation of High-Resolution Land Cover Geographical Data for the WRF Model Simulations, Remote Sens., 15, 2389, https://doi.org/10.3390/rs15092389, 2023.
Skamarock, W. C., Klemp, J. B., Dudhia, J., Gill, D. O., Liu, Z., Berner, J., Wang, W., Powers, J. G., Duda, M. G., Barker, D. M., and Huang, X.-Y.: A Description of the Advanced Research WRF Model Version 4, NSF, https://doi.org/10.5065/1DFH-6P97, 2019.
Stauffer, D. R. and Seaman, N. L.: Use of four-dimensional data assimilation in a limited-area mesoscale model. Part I: Experiments with synoptic-scale data, Mon. Weather Rev., 118, 1250–1277, https://doi.org/10.1175/1520-0493(1990)118<1250:UOFDDA>2.0.CO;2, 1990.
Sun, Y., Deng, K., Ren, K., Liu, J., Deng, C., and Jin, Y.: Deep learning in statistical downscaling for deriving high spatial resolution gridded meteorological data: A systematic review, ISPRS J. Photogramm., 208, 14–38, https://doi.org/10.1016/j.isprsjprs.2023.12.011, 2024.
Tang, J., Niu, X., Wang, S., Gao, H., Wang, X., and Wu, J.: Statistical downscaling and dynamical downscaling of regional climate in China: Present climate evaluations and future climate projections, J. Geophys. Res.-Atmos., 121, 2110–2129, https://doi.org/10.1002/2015JD023977, 2016.
Tareghian, R. and Rasmussen, P. F.: Statistical downscaling of precipitation using quantile regression, J. Hydrol., 487, 122–135, https://doi.org/10.1016/j.jhydrol.2013.02.029, 2013.
Tewari, M., Chen, F., Wang, W., Dudhia, J., LeMone, M. A., Mitchell, K., Ek, M., Gayno, G., Wegiel, J., and Cuenca, R.: Implementation and verification of the unified Noah land surface model in the WRF model, Proc. 20th Conf. Weather Analysis and Forecasting/16th Conf. Numerical Weather Prediction, Seattle, WA, American Meteorological Society, https://ams.confex.com/ams/84Annual/webprogram/Paper69061.html (last access: 25 June 2025), 2004.
Thompson, G., Field, P. R., Rasmussen, R. M., and Hall, W. D.: Explicit Forecasts of Winter Precipitation Using an Improved Bulk Microphysics Scheme. Part II: Implementation of a New Snow Parameterization, Mon. Weather Rev., 136, 5095–5115, https://doi.org/10.1175/2008mwr2387.1, 2008.
Viterbo, F., Sperati, S., Vitali, B., D'Amico, F., Cavalleri, F., Bonanno, R., and Lacavalla, M.: MERIDA HRES: A new high-resolution reanalysis dataset for Italy, Meteorol. Appl., 31, e70011, https://doi.org/10.1002/met.70011, 2024.
Xu, Z., Han, Y., Tam, C.-Y., Yang, Z.-L., and Fu, C.: Bias-corrected CMIP6 global dataset for dynamical downscaling of the historical and future climate (1979–2100), Sci. Data, 8, 293, https://doi.org/10.1038/s41597-021-01079-3, 2021.
Yuan, H., Cheng, L., Pan, Y., Tan, Z., Liu, Q., and Jin, Z.: A multi-level parallel approach to increase the computation efficiency of a global ocean temperature dataset reconstruction, J. Parallel Distr. Comp., 192, 104938, https://doi.org/10.1016/j.jpdc.2024.104938, 2024.
Zamo, M., Bel, L., Mestre, O., and Stein, J.: Improved Gridded Wind Speed Forecasts by Statistical Postprocessing of Numerical Models with Block Regression, Weather Forecast., 31, 1929–1945, https://doi.org/10.1175/waf-d-16-0052.1, 2016.
Zhang, J., Liu, B., Ren, S., Han, W., Ding, Y., and Peng, S.: A 4 km daily gridded meteorological dataset for China from 2000 to 2020, Sci. Data, 11, 1230, https://doi.org/10.1038/s41597-024-04029-x, 2024.
Zhang, L., Xu, Y., Meng, C., Li, X., Liu, H., and Wang, C.: Comparison of Statistical and Dynamic Downscaling Techniques in Generating High-Resolution Temperatures in China from CMIP5 GCMs, J. Appl. Meteorol. Clim., 59, 207–235, https://doi.org/10.1175/jamc-d-19-0048.1, 2020.
Zhang, N., Gao, Z., Wang, X., and Chen, Y.: Modeling the impact of urbanization on the local and regional climate in Yangtze River Delta, China, Theor. Appl. Climatol., 102, 331–342, https://doi.org/10.1007/s00704-010-0263-1, 2010.
Zhang, S. and Li, X.: Future projections of offshore wind energy resources in China using CMIP6 simulations and a deep learning-based downscaling method, Energy, 217, 119321, https://doi.org/10.1016/j.energy.2020.119321, 2021.
Zhang, Z. and Liu, Y.-A.: A 1 km Hourly High-Resolution 3D Wind Field Dataset over the Yangtze River Delta during June–August 2021–2023, Science Data Bank [data set], https://doi.org/10.57760/sciencedb.23752, 2025.