the Creative Commons Attribution 4.0 License.
the Creative Commons Attribution 4.0 License.
 | 02 Mar 2026
Global high-resolution forest disturbance type dataset
Li Wang
Wanjuan Song
Shengping Ding
Jie Zhang
Forests play a pivotal role in global carbon cycling and biodiversity conservation, yet they face increasing disturbances from both anthropogenic and natural drivers. This study presents the first high-resolution (30 m) global forest disturbance dataset (GFD) for 2000–2020, classifying 11 disturbance types by integrating Landsat-based Continuous Change Detection and Classification (CCDC) time-series analysis with spatial metrics and machine learning. A total of 57 000 expert-validated sample points were used to train and validate a decision tree model, achieving an overall accuracy of 99 %. The results reveal that forestry replanting (44 %), shifting cultivation (24 %), and forest fires (11 %) dominate global forest loss. There are regional differences in global forest disturbance, such as farmland expansion in South America and Africa, forest fires in northern regions, and shifting cultivation in tropical regions. Disturbed forests span 1247.06 Mha, accounting for 31 % of the global forest area. Notably, 3 % of global forests were newly established, primarily in China, India, and Brazil. The spatial consistency analysis (R2= 0.93) highlights a strong overall agreement between the GFD product and other datasets, while the GFD product offers superior spatial resolution. The GFD dataset advances our understanding of forest dynamics and underscores the need for targeted conservation strategies in an era of escalating environmental change. The 30 m resolution GFD generated by this study is openly available at https://doi.org/10.6084/m9.figshare.28465178 (Liu et al., 2025a).
- Article
(9640 KB) - Full-text XML
- BibTeX
- EndNote


Forests, the dominant component of terrestrial ecosystems and the most widespread vegetation type on land, play a pivotal role in delivering critical ecosystem services, including climate regulation (Piao et al., 2020; Xu et al., 2022), biodiversity conservation (Betts et al., 2017), soil and water retention, carbon sequestration (Tong et al., 2020), and habitat provision (Oeser et al., 2021). However, in recent decades, forest ecosystems have faced escalating disturbances from both natural drivers (Leverkus et al., 2018; Yan et al., 2022; Mayer et al., 2024) (droughts, extreme rainfall, and wildfires exacerbated by climate anomalies) and anthropogenic activities (deforestation, shifting cultivation, cropland expansion, and urbanization) (Acil et al., 2025; Chowdhury et al., 2017; Rivera et al., 2023; Liu et al., 2025b). These disturbances have severely compromised forest composition, structure, and functionality, thereby degrading their ecological services (Yang et al., 2020; Feng et al., 2021). Consequently, accurate, timely, and continuous monitoring of forest disturbances is imperative for effective forest management, climate change mitigation, and global carbon accounting (He et al., 2025).
Forest disturbance represents one of the most critical processes in ecosystem succession (Ross et al., 2021; Mason et al., 2019; Blaschke et al., 1992), essential for maintaining regional ecological equilibrium (Reza and Abdullah, 2011; Kittel et al., 2000). Forest dynamics encompass two opposing processes: disturbance (forest cover loss or structural degradation caused by natural or human factors) and gain (forest recovery through natural regeneration or afforestation). Rapid population growth and urbanization have intensified conflicts between natural resource exploitation and human activities (Jiang et al., 2021; Miatto et al., 2021). Thus, characterizing the spatiotemporal patterns of forest disturbance and gain is vital for understanding forest dynamics, estimating carbon stocks, and elucidating global change mechanisms (Chen et al., 2023b; Cuni-Sanchez et al., 2021; Peng et al., 2023). Given this context, high-accuracy identification of disturbance types has emerged as a key scientific challenge in global environmental governance and sustainable development.
Traditional forest monitoring predominantly relies on field surveys, which are limited by low temporal resolution and high labor costs, rendering them difficult to scale for large-area or frequent-assessment applications (Scheeres et al., 2023; Finger et al., 2021). Satellite remote sensing has revolutionized this field by offering extensive spatial coverage, continuous temporal observations, and rich spectral information (Zhao et al., 2023; Skidmore et al., 2021; Liu et al., 2025c). Early remote sensing approaches, such as bi-temporal image comparison (post-classification change detection or spectral differencing), were limited by their sensitivity to image registration accuracy and inability to capture gradual disturbances (Wang et al., 2021). Pixel-based methods (NDVI thresholding) could detect vegetation changes but failed to discriminate disturbance types (deforestation, fires, or shifting cultivation).
Recent advances in time-series analysis have significantly improved monitoring capabilities (Tollerud et al., 2023; Liu et al., 2024). For instance, the Continuous Change Detection and Classification (CCDC) algorithm decomposes Landsat time-series data into trend, seasonal, and noise components, enabling disturbance detection at 30 m resolution (Tollerud et al., 2023; Hwang et al., 2022). Nevertheless, these methods exhibit notable limitations: inadequate spectral-temporal feature integration, leading to high confusion errors between plantation rotation and shifting cultivation; and poor model generalizability, algorithms like CUSUM, developed for temperate forests, underperform in tropical regions due to cloud contamination and phenological variability (Aquino et al., 2022; Ygorra et al., 2021).
To address these challenges, we propose a machine learning framework that synergizes time-series features with spatial aggregation metrics, leveraging the nonlinear modeling strengths of ensemble algorithms. This study aims to produce the first high-resolution (30 m) global map of 11 major forest disturbance types (Table 1) in 2000–2020 by integrating Landsat CCDC time-series and spatial predictors within Google Earth Engine (GEE). The global forest disturbance classification framework is established through a comprehensive synthesis of key disturbance characteristics, including disturbance intensity, disturbance source, forest types affected, disturbance processes, and recovery type. Based primarily on disturbance intensity, disturbances are categorized into negative disturbance (newly added forest, 22), positive strong disturbance, and positive weak disturbance. According to the differences in disturbance sources, such as human activities, natural wildfires, climatic factors, insect and disease outbreaks, and flooding, weak disturbances are further differentiated into drought-induced disturbances (16) and forest pest and disease disturbances (17). Similarly, strong disturbances are subdivided into forest fires (15), flood disasters (19), and human-induced forest disturbances. Depending on post-disturbance recovery status and land use type, human-induced disturbances are further distinguished into built-up area expansion (18) and cropland occupation (19), where forests are not restored. Taking into account the forest type disturbed, human-induced disturbances are also classified into renewal plantation (13) and oil palm expansion (21), both of which involve manual reversion. Based on the presence of short-term agricultural activities during the disturbance process, natural recovery secondary forests are categorized into natural forest deforestation (14) and shifting cultivation (11). Meanwhile, natural forest areas that were logged and then actively restored by humans are identified as forestry replanting (12). To account for regional heterogeneity in forest types, climate regimes, and disturbance drivers, we partitioned the globe into four subregions for model training. Our results will directly support the Paris Agreement's carbon accounting framework, provide subtype data for platforms like Global Forest Watch (GFW) and Hansen's global forest change dataset, and inform regional forest restoration strategies.
Table 1Global forest disturbance classification framework.
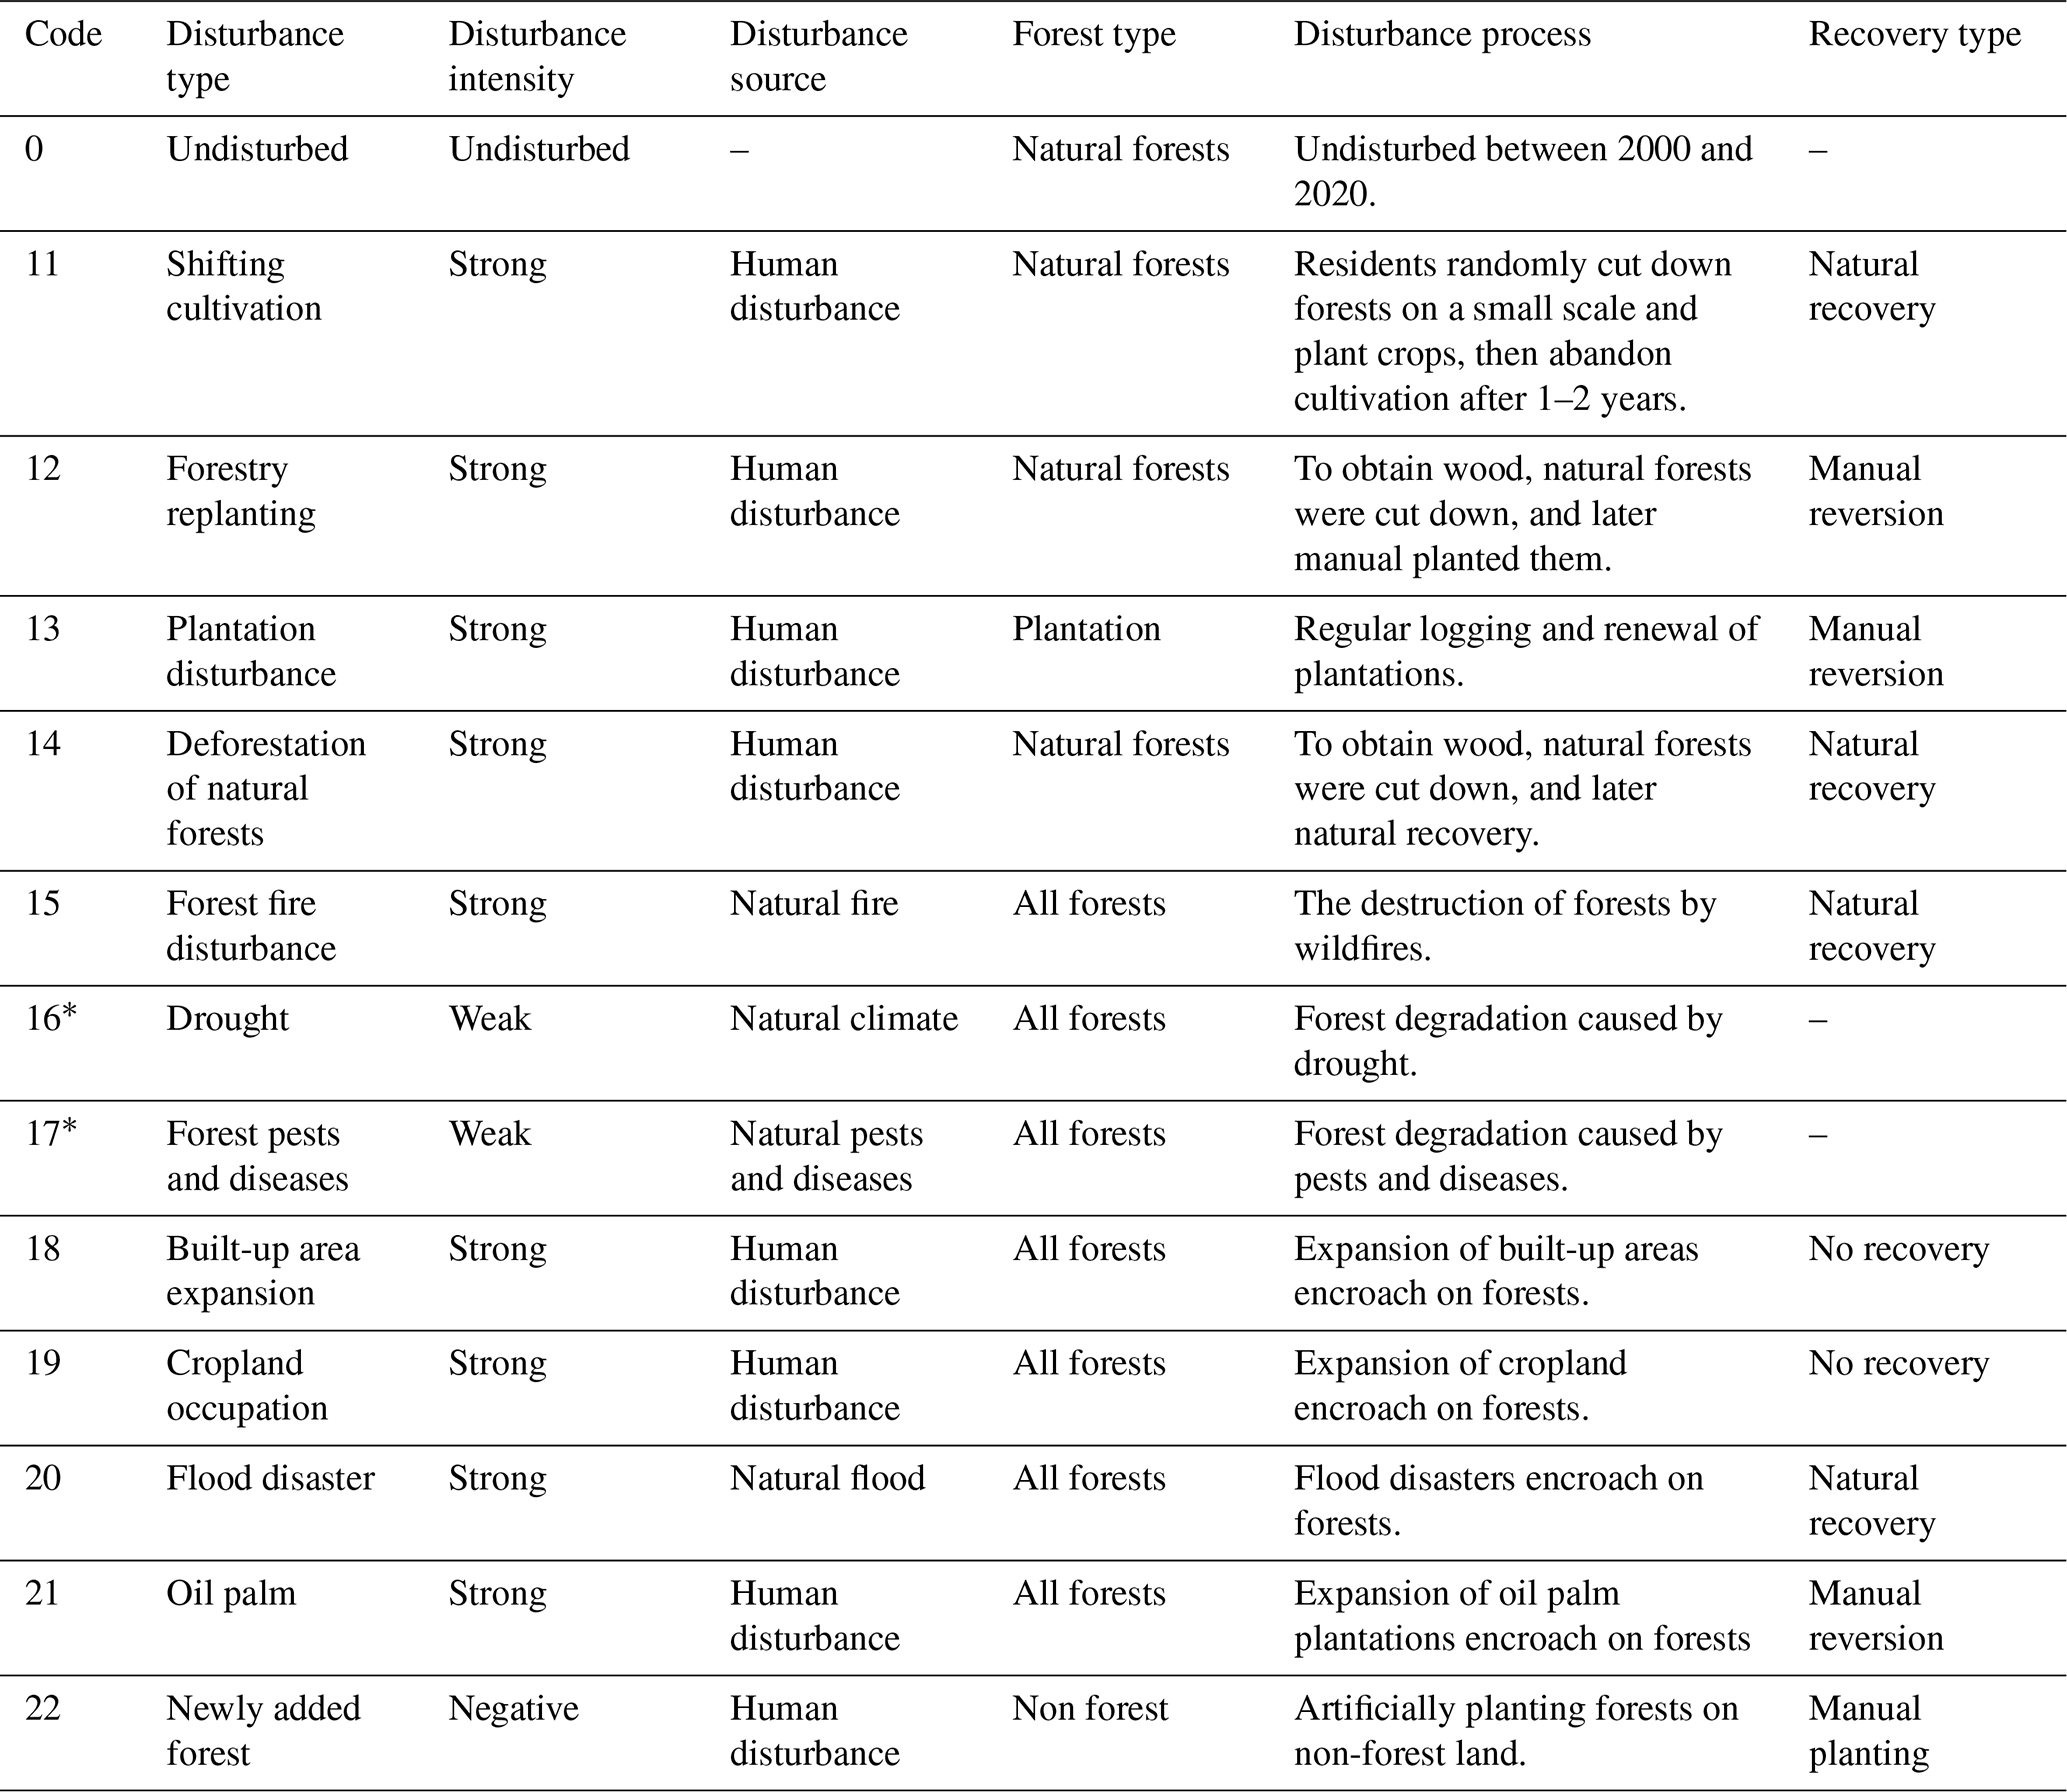
Note: * indicates weak disturbance type. Due to the spatial overlap between weak and strong disturbance types, this study did not consider weak disturbances.
2.1 Study workflow
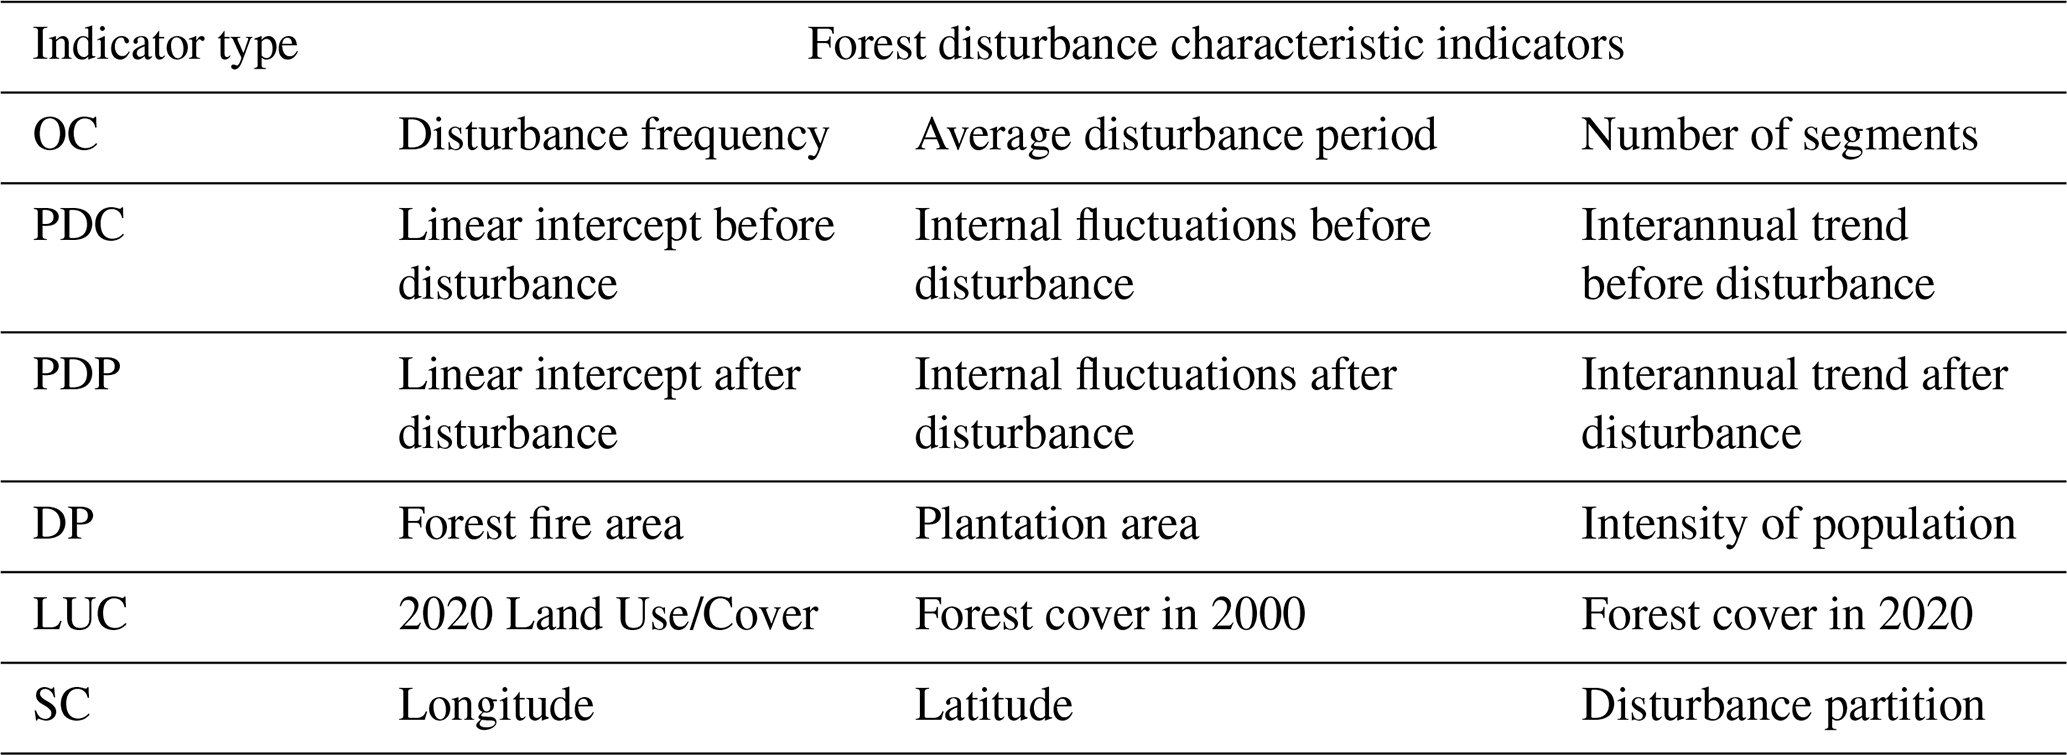
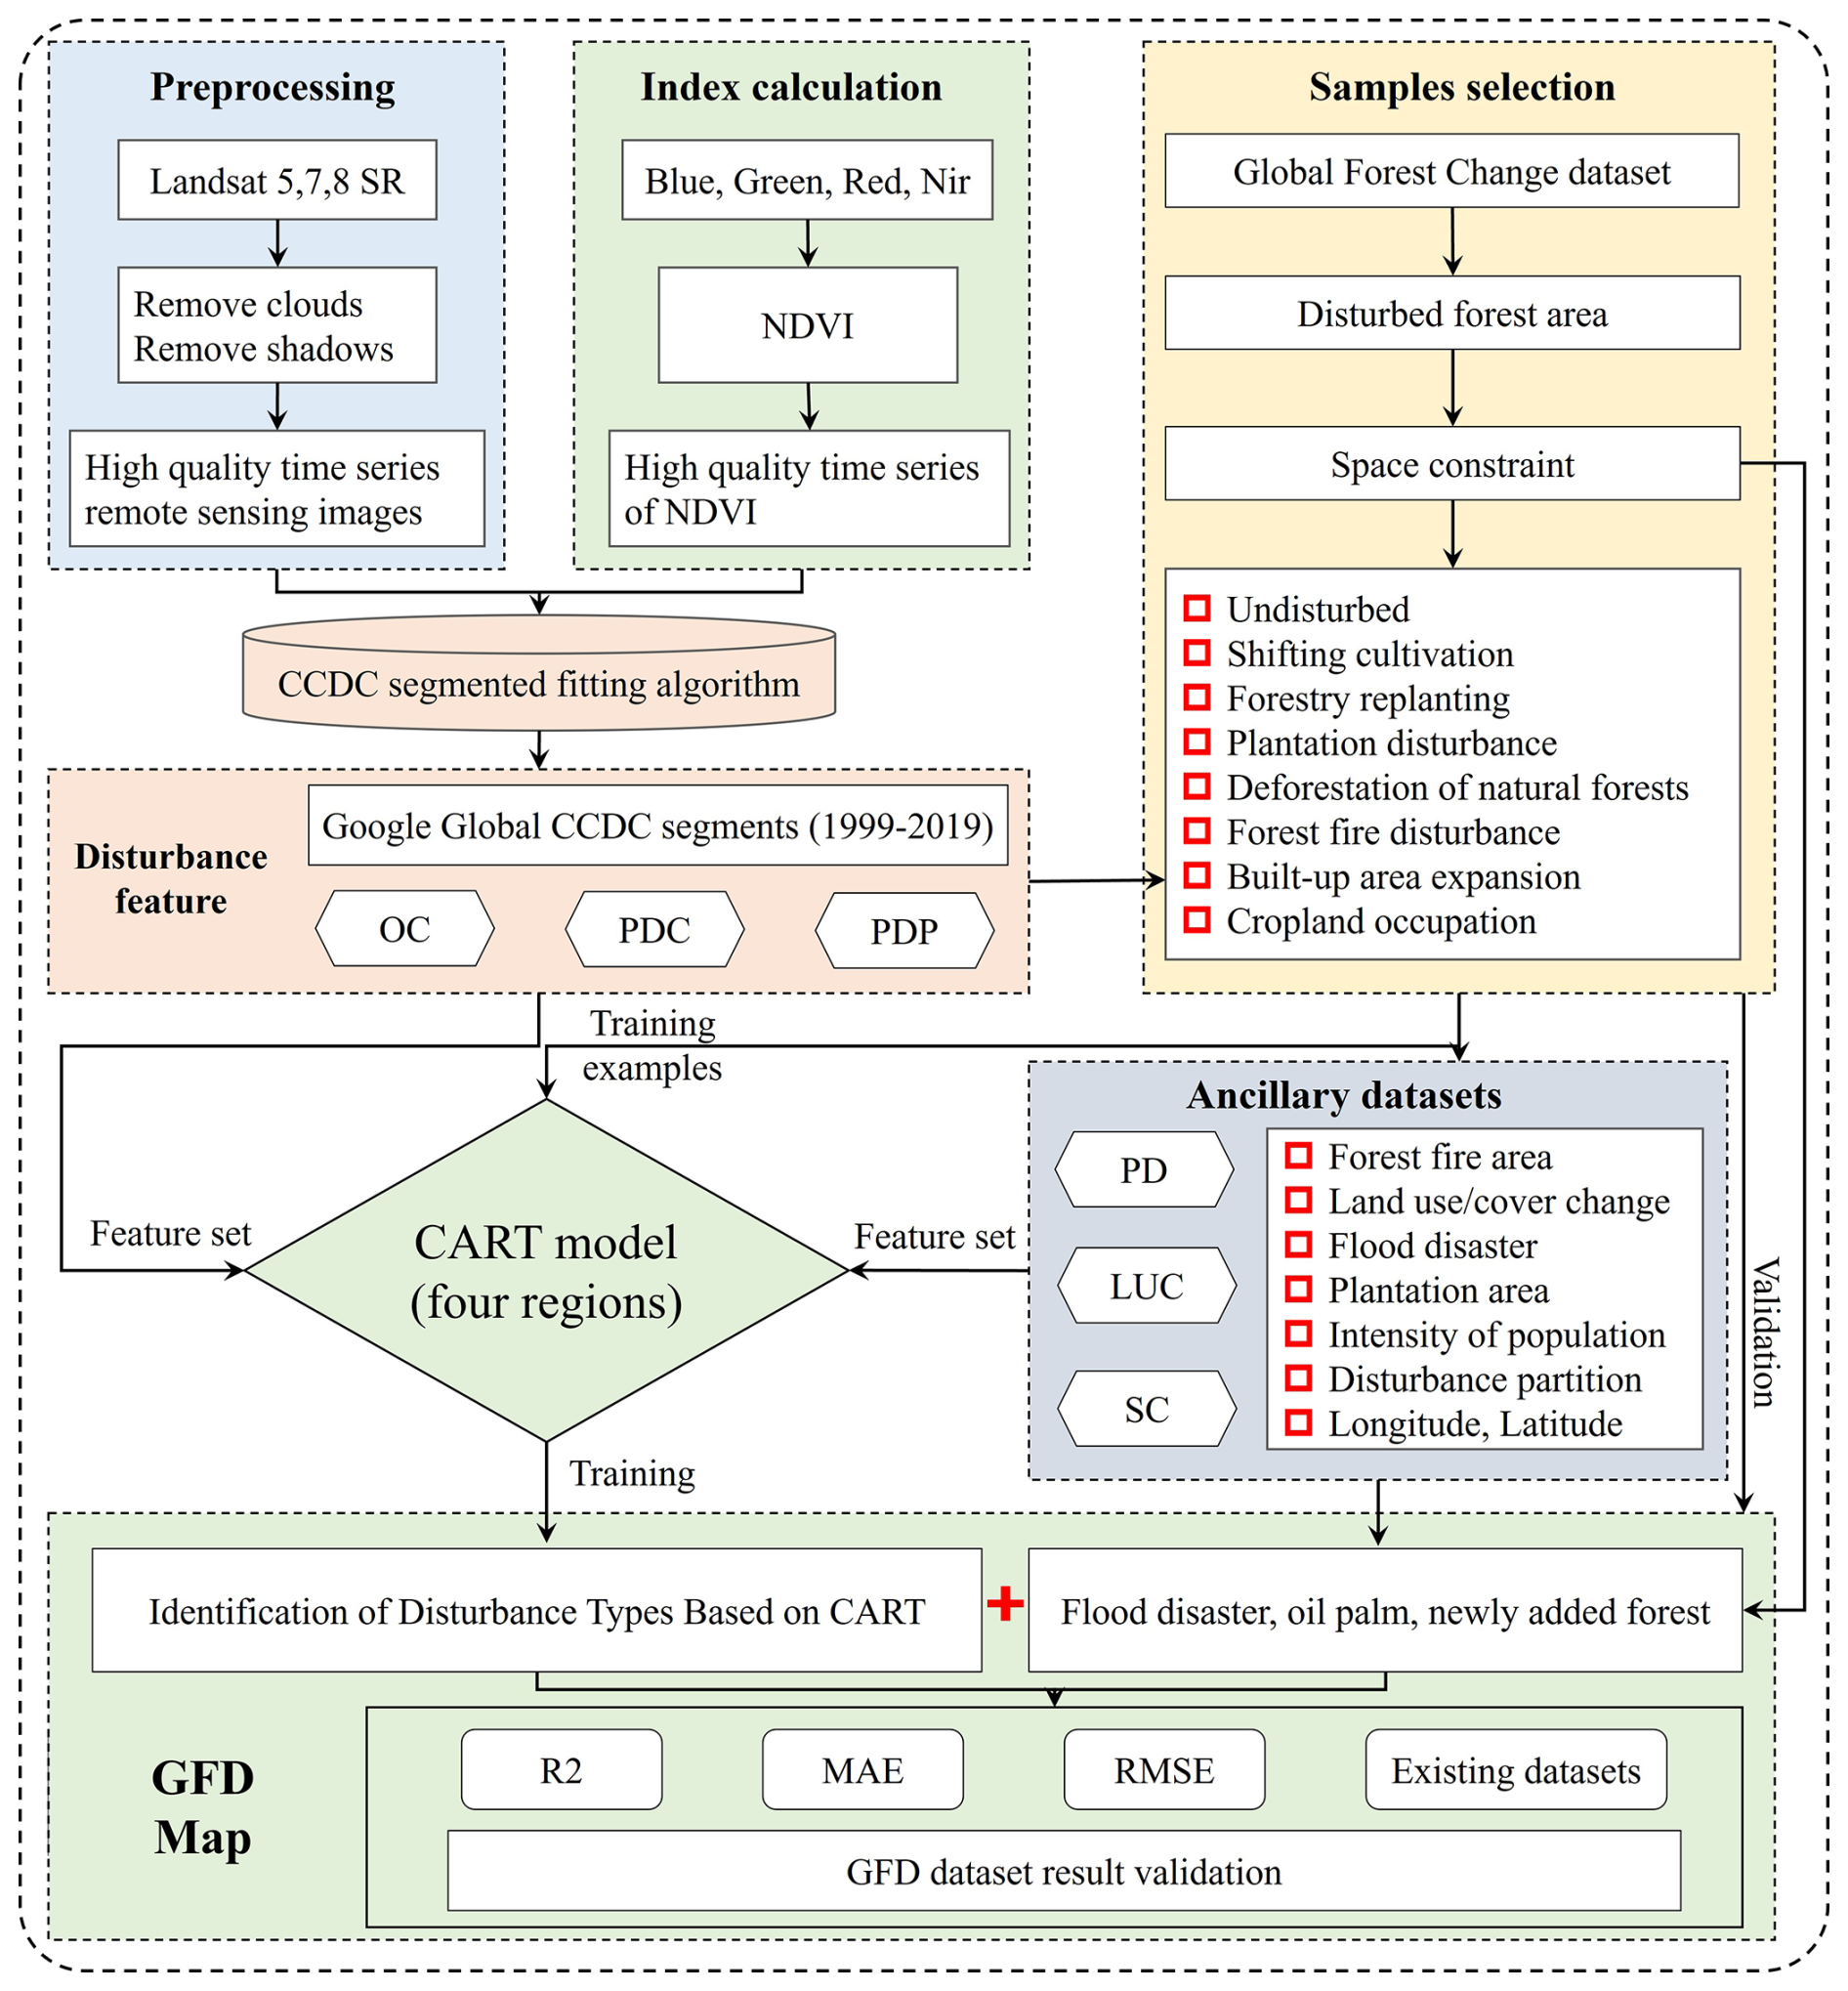
We developed a novel classification algorithm using machine learning within the GEE platform that integrates Landsat-based CCDC time-series analysis with spatial characteristics of forest cover to classify main distinct forest disturbance types globally. The model training and validation incorporated 57 000 expertly labeled sample points of forest disturbance, which were visually interpreted by trained remote sensing specialists specializing in forest monitoring. Utilizing multi-temporal Landsat data in 2000–2020 and ancillary datasets (Sect. 2.2.5), we constructed a comprehensive feature set comprising 18 disturbance indicators (Table 2). These features were systematically derived from both temporal and spatial dimensions, including: Overall characteristics of forest disturbance (OC), pre-disturbance forest conditions (PDC), post-disturbance recovery patterns (PDP), disturbance potential metrics (DP), land use/cover features (LUC), spatial contextual attributes (SC). All feature variables were pre-processed in GEE and subsequently resampled to correspond with the 57 000 sample points. The classifier was locally trained using Python3.9, with rigorous validation performed at sample point locations. Our classification approach employed a decision tree-based machine learning algorithm (CART), with accuracy metrics quantitatively assessed using independent test sample points (Fig. 1).
2.2 Data collection and preprocessing
2.2.1 Landsat Image
The first layer surface reflectance (SR) image of Landsat Collection 1 (C1) is selected, including all available Landsat 5–8 images from 2000 to 2020. These images, which have undergone atmospheric correction using the LaSRC algorithm (Skakun et al., 2021), were directly obtained from the GEE platform (https://developers.google.com/earth-engine/datasets/catalog/landsat last access: 10 May 2025). We preprocessed global images based on the quality assessment (QA) bands of Landsat SR, including removing shadows and cloud interference. These data are used to calculate CCDC to supplement the current missing CCDC dataset in some forest disturbance areas. At the same time, high-quality Landsat images are also the main dataset for us to visually select sample points.
2.2.2 Spatial distribution dataset
Previous studies have shown that global forest disturbances have a high degree of spatial clustering (Hansen et al., 2013). For example, shifting cultivation is mainly distributed in the tropics (Chen et al., 2023a); Forest fires are mainly distributed in northern forests (Scholten et al., 2021). Adding spatial distribution information of forests is beneficial for improving the accuracy of forest disturbance identification. Considering the regional differences in the distribution of global forest disturbances, we defined four major regions, Africa, Southeast Asia and Australia, Central America and South America, and the Northern Forest Region. Therefore, we added latitude and longitude information as well as partition information when extracting the spatial attributes of the sample points. A large number of non-forest areas and undisturbed regions around the world do not require calculation. In order to reduce the consumption of computing power, we use Hansen's global forest change dataset to identify disturbed forest areas worldwide from 2000 to 2020 (Hansen et al., 2013).
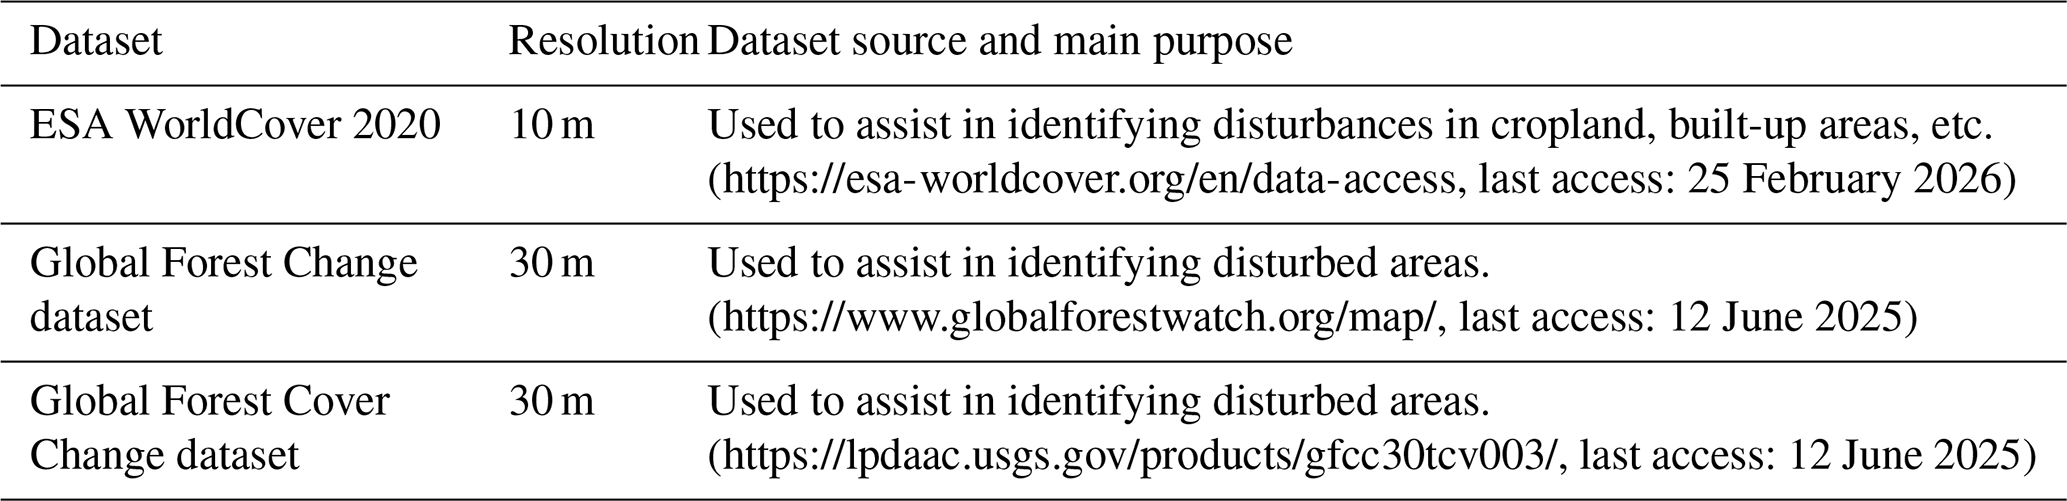
2.2.3 Land use/cover dataset
To assess the mapping accuracy of global forest change areas, this study incorporated multiple authoritative land cover and forest cover products as reference datasets, including: (1) ESA WorldCover 2020, (2) Global Forest Change dataset (Hansen et al., 2013), and (3) the Global Forest Cover Change dataset (Roffe et al., 2022). These datasets served three primary functions in our analysis: delineating the global forest extent in 2000, identifying 2020 forest cover distribution, and classifying non-forest land cover types in 2020. The detailed information of these datasets is systematically documented in Table 3.
2.2.4 Disturbance feature
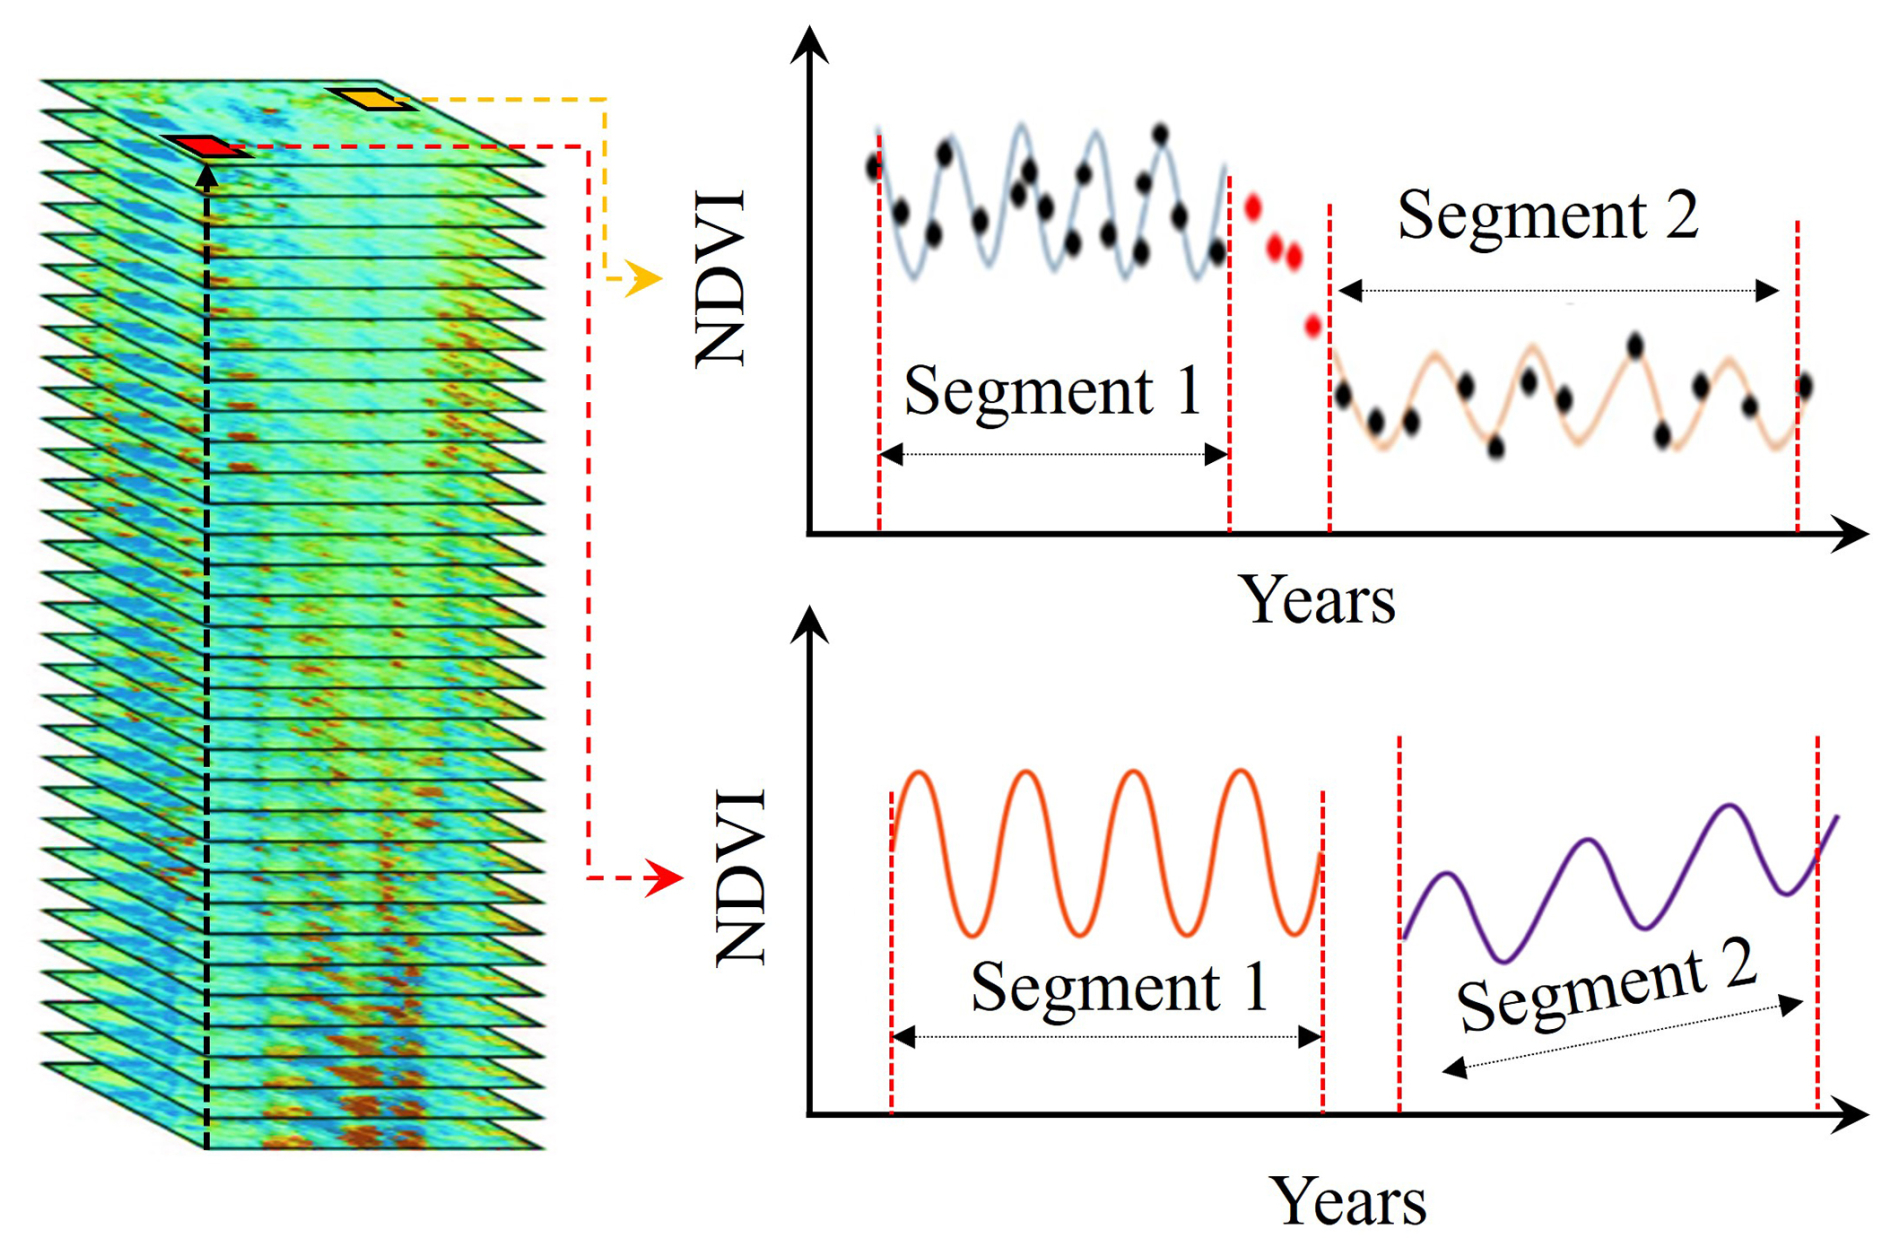
The CCDC algorithm is commonly used to monitor surface cover disturbances (Zhu and Woodcock, 2014). It fits the model to the Normalized Difference Vegetation Index (NDVI) of spectral observations and can reflect three types of pixel changes: seasonal changes (such as phenology), slow changes (such as vegetation growth or degradation), and rapid changes (such as deforestation, fires) (Zhu and Woodcock, 2014). CCDC uses a powerful iterative reweighted least squares method (RIRLS) (Burrus et al., 1994) to fit the observed geomorphological features and trends that reflect phenology (Tollerud et al., 2023; Hwang et al., 2022). The expression for the mathematical fitting line is as follows:
Where x represents day of year; T represents the number of days per year; N represents the number of years of Landsat. a0 represents the benchmark value of NDVI; a1 and b1 represent the annual changes in NDVI; a2 and b2 represent the interannual changes in NDVI. represents the predicted value of NDVI based on RIRLS fitting corresponding to the xth day of year.
We collected Google Global Landsat based CCDC segments (1999–2019). The dataset was created from the Landsat 5, 7, and 8 Collection-1, Tier-1, surface reflectance time series, using all daytime images between 1 January 1999 and 31 December 2019. Each image was preprocessed to mask pixels identified as cloud, shadow, or snow (according to the “pixel_qa” band), saturated pixels, and pixels with an atmospheric opacity > 300 (as identified by the “sr_atmos_opacity” and “sr_aerosol” bands). We have removed duplicate pixels in the overlapping scenes between the north and south. The results were output in 2° tiles for all landmasses between −60 and +85° latitude. We can directly call this dataset [ee.ImageCollection(“GOOGLE/GLOBAL_CCDC/V1”)] in GEE. The dataset provides extensive coverage of global forest areas, but small number of missing areas occur along the edges of some images, accounting for approximately 6 % of the total global forest area. For the missing areas in the dataset, the CCDC algorithm is used to complete them, thereby obtaining vegetation change characteristics covering all forest areas worldwide. Based on the segmented fitting results of these features, we extracted the OC, PDC, and PDP of each pixel separately (Fig. 2). In fact, not all the pixels will perfectly fit into this assumed model, which would consequently affect the fitting performance of CCDC and therefore the subsequent disturbance mapping. To address this issue, we also added feature indicators such as DP and LUC (Table 2) before machine learning training and classification to improve the robustness of the classification model.
2.2.5 Ancillary datasets
Forest disturbance has strong disturbance sources. Therefore, using existing disturbance source datasets to assist in identifying typical forest disturbance types can effectively improve the accuracy of mapping results. Generally, a high spatial consistency is typically observed between disturbance types such as forest fires and plantation expansion and global fire and plantation distribution. This study uses global fire distribution datasets, artificial plantation distribution datasets, oil palm datasets, and other auxiliary methods to identify forest disturbance types. Meanwhile, there is a high correlation between population distribution and forest disturbance. This study collected a forest disturbance potential dataset from three aspects: population density, forest fire distribution, and spatial distribution of oil palms.
2.3 Derivation of training and validation sample points
Based on literature and actual disturbance image characteristics, 8 types of forest disturbances have been preliminarily identified through research: undisturbed (0), shifting cultivation disturbance (11), forestry replanting (12), plantation disturbance (13), deforestation of natural forests (14), forest fire disturbance (15), built-up area expansion (18), and cropland occupation (19). To ensure spatial representativeness and class balance, we adopted a stratified random sampling design combined with targeted class-balancing sampling. Through class-balanced sampling, we prevented the sample from being overly skewed toward large-area categories, thereby avoiding a decline in the classification performance of small-area categories and ultimately improving the overall classification accuracy. The sampling and labeling procedures were conducted independently to ensure statistical rigor and validation reliability. In contrast, the validation sample was obtained through a stratified random sampling design to ensure unbiased accuracy estimation. The validation sample satisfies the requirements of a probability sample, and the accuracy estimates are computed using formulas appropriate for stratified sampling (Stehman, 2014; Olofsson et al., 2014).
2.3.1 Sampling framework and stratification
We constructed the sampling framework based on the Hansen Global Forest Change dataset and auxiliary disturbance distribution maps. The global forest region was stratified into potential disturbance layers, each corresponding to a likely disturbance type based on auxiliary data. This stratification ensured that even rare disturbance types were adequately represented in the sample pool.
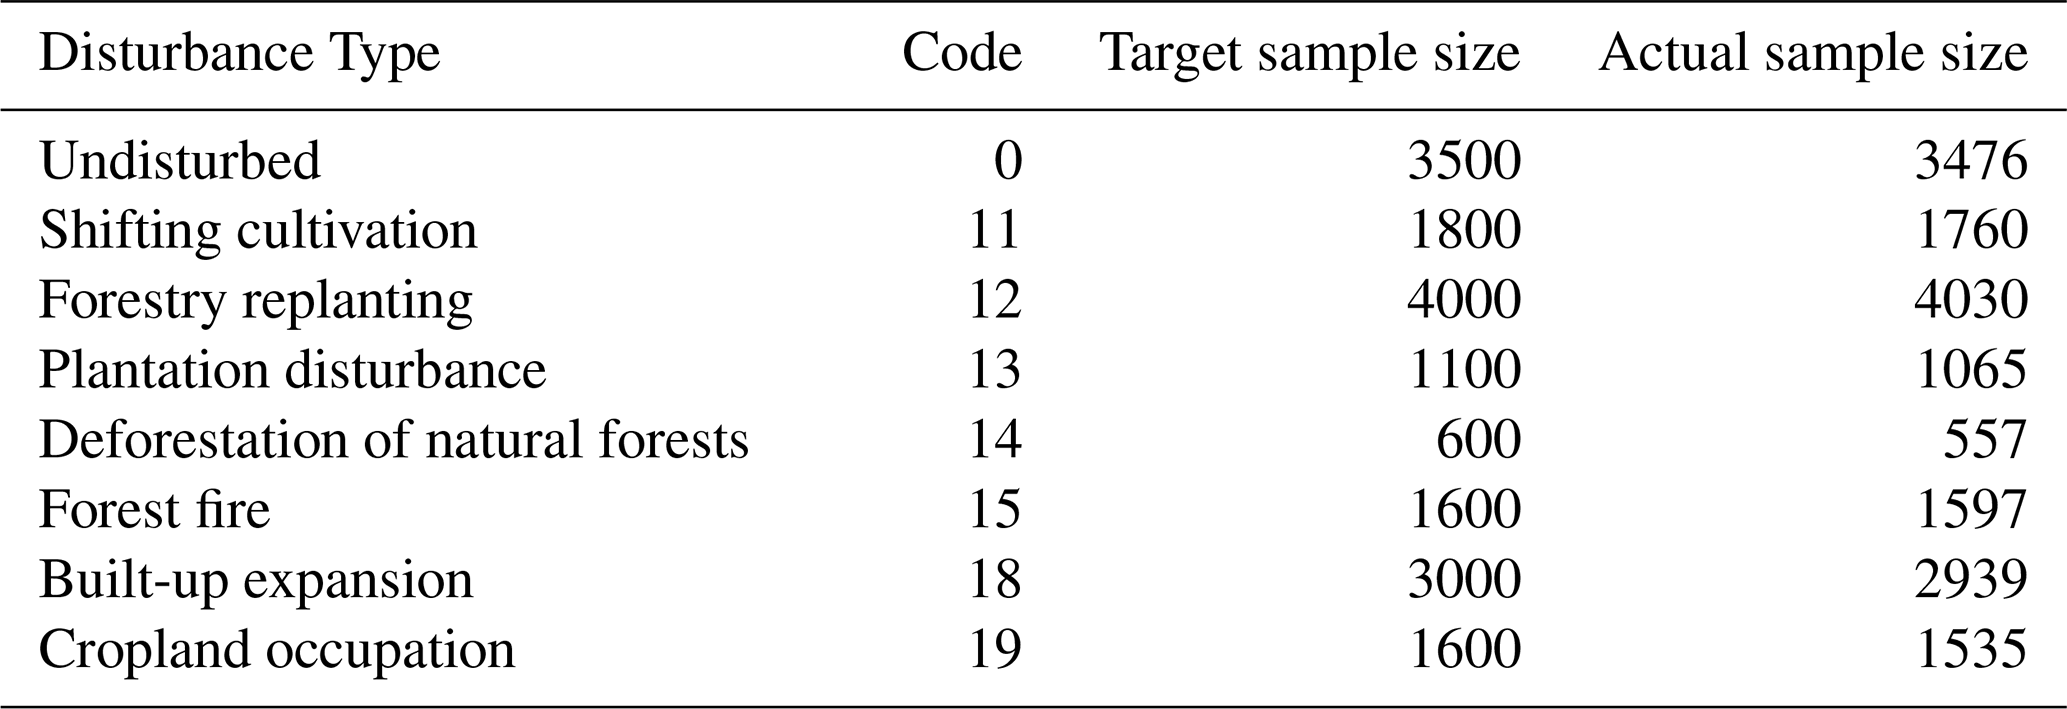
2.3.2 Class-balanced random sampling
To prevent overrepresentation of dominant disturbance types, we defined minimum target sample sizes for each class (Table A1). Within each stratum, candidate sample points were generated using random coordinate sampling, ensuring that each class met or exceeded its target sample size. The final sample sizes reflect only the visually interpretable and high-quality points retained after rigorous screening, which removed points affected by cloud, shadows, or poor image quality. This quality control step resulted in minor variations (< 10 % per class) from the target sample sizes. This approach ensured balanced representation across all disturbance types while maintaining spatial randomness within strata. Note that the class-balanced sampling and stratified design described above pertain to the training sample. The validation sample was selected under the same stratification but without class balancing, following a probability sampling approach to ensure unbiased accuracy estimation.
2.3.3 Independent visual interpretation and labeling
For 8 elementary disturbance types, 12 well-trained forest remote sensing professionals visually identified 57 000 forest disturbance type sample points for over 300 h based on Landsat time-series imagery (2000–2020) and high-resolution google imagery. The labeling process was completely independent of the initial stratification information. To ensure global consistency in sample points selection, 8 individuals were uniquely responsible for selecting 8 types, while an additional 4 individuals conducted secondary confirmation of the selected sample points. Undisturbed sample points were randomly selected from global forest cover areas and underwent the same visual verification. A point was labeled as “undisturbed” only if no detectable disturbance was observed throughout the study period in both Landsat time-series and high-resolution imagery. The sample point are evenly distributed in the global forest disturbance area (Fig. B1).
For the challenging distinction of “shifting cultivation”, its identification relied on detecting unique cyclical patterns in the time series. Interpreters were trained to confirm three key characteristics within the high-resolution historical imagery. (1) Clear cyclical boundaries: evidence of alternating phases of forest (fallow), clearing/burning (clearance), and crops (cultivation) on the same parcel of land over multiple years; (2) Short-cycle land cover change: a complete cycle typically lasts a few years, distinguishing it from permanent deforestation for agriculture; and (3) Small-scale and fragmented spatial patterns: shifting cultivation plots are usually small, irregularly shaped, and interspersed with patches of mature forest. Sample points were only designated as shifting cultivation if they met multiple of these criteria simultaneously to ensure accuracy. For the forest weak disturbance types caused by drought disturbance (16) and pest disturbance (17), their sample point selection needs to refer to high-resolution long-term remote sensing images. Meanwhile, weak disturbances in forest cover are highly time-bound. For example, the decline in vegetation index caused by a period of drought will quickly recover due to an increase in precipitation. At the global scale, it is currently limited by the availability of remote sensing images. We are unable to select relevant sample points through Landsat imagery. Therefore, this study did not consider these two weak disturbance types of drought disturbance and pest disturbance. This will be an independent topic for further research.
2.4 Decision Tree Classification Model
2.4.1 CART-based classification of core forest disturbance types
Considering that the core of this study is forest disturbance type classification, the Classification and Regression Tree (CART) classification regression tree algorithm, which has a high advantage in convenient classification, was chosen. In this article, we only discuss CART used for classification. For classification trees, CART uses the Gini coefficient minimization criterion for feature selection to generate binary trees. The specific process consists of two steps: decision tree generation and pruning. During the decision tree generation phase, a tree is constructed from the training dataset and is grown to its maximum possible size. Subsequently, pruning is performed using the validation dataset to select the optimal subtree, with the minimization of the loss function serving as the criterion for pruning.
Considering the significant differences in disturbances in different regions of the world, four CART sub decision trees were trained for four typical disturbance regions, namely Africa, Southeast Asia Australia, Central America South America, and the Northern Forest region, to form a larger global forest disturbance classification tree model. The entire process is completed interactively on three platforms: Python, GEE, and ArcGIS. During the training and validation process of the model, the sample points we selected were divided into a training set and a validation set according to a 7:3 pattern. 40 000 sample points are used for model training, and another 17 000 randomly selected sample points are used to validate the model training results (Stehman, 2014; Olofsson et al., 2014).
2.4.2 Identification of supplementary forest disturbance types
Based on the preliminary identification of 8 types of forest disturbances and the global forest change range by CART, considering the dynamic changes of flood inundation areas from 2001 to 2020, the forest areas that have been submerged by floods are determined, and then flood disaster disturbances are classified (20). Meanwhile, based on the distribution of oil palm in the plantation, the interference of oil palm since 2000 has been extracted (21). In addition, by overlaying the forest coverage in 2000 and the quantity coverage in 2020, the newly added forest areas in 2020 were extracted from the non-forest areas in the early stage (22). Combine the 8 core forest disturbance types identified by the CART with these 3 supplementary forest disturbance types to form a complete GFD map. Finally, this study generated a global forest disturbance type dataset containing 11 forest disturbance types. The final GFD map, except for the newly added forest, uses Hansen's global forest change dataset as a mask to remove pixels that have not undergone forest changes.
2.5 Verification of results
We overlay validation sample points and generated GFD maps to calculate confusion matrices and evaluate user, producer, and overall accuracy. Because the validation sample was obtained using stratified random sampling (with strata defined by GFD map classes), all accuracy estimates and standard errors were computed using estimators consistent with stratified random sampling following Stehman.
2.5.1 Error matrix
The error matrix is a simple cross tabulation of class labels assigned by remote sensing data classification and reference data of sample point locations. The error matrix organizes the collected sample data in a way that summarizes key results and helps quantify accuracy of various types of forest disturbance. The main diagonal of the error matrix highlights the correct classification, while the diagonal elements show omissions and errors. The cell entries and marginal values of the error matrix are the basis for accuracy evaluation estimation. In the matrix, nij represents the number of sample points whose map label is class i and whose reference label is class j. Let be the total number of sample points in map class i, and be the total number of validation sample points.
Because the validation sample is obtained by stratified random sampling with strata defined by map classes, the contribution of each map class to the overall accuracy should be weighted by its mapped area. Let denote the proportion of mapped area (or pixel count) belonging to map class i within the assessment domain, where Ni is the number of pixels (or area) mapped as class i and .
Overall accuracy (OA) is the proportion of area correctly classified. It is computed as the area-weighted sum of the within-class correct proportions:
User's accuracy for Class i (Ui) (the number of sample points mapped to class i with reference to class i):
Producer's accuracy for class j is the probability that a reference sample of class j is correctly mapped as class j. Under the stratified design, the total proportion of area belonging to reference class j is estimated by combining all map classes using their area weights, i.e., . Therefore:
2.5.2 Estimating accuracy
The sampling variability associated with the accuracy estimates should be quantified by reporting standard errors. The variance estimators are provided below, and taking the square root of the estimated variance results in the standard error of the estimator. For overall accuracy, note that , where . The estimated variance is:
For user's accuracy of map class i, the estimated variance is
For producer's accuracy of reference class j, let , where . Using a first-order approximation, the estimated variance is
with
and Cov(AjBj)=V(Aj) because the i=j component of Bj contains Aj, while the remaining components of Bj come from other strata. The standard error of each estimator is computed as SE .
2.5.3 Comparison with other datasets
We compared GFD map with these other datasets to calculate the degree of agreement on typical forest disturbance types. At the global scale, the currently available dataset, “Classifying drivers of global forest loss (CDGFL)”, has a relatively low resolution (10 km) (Curtis et al., 2018), and the concept of forest loss differs from that of forest disturbance in this study. Therefore, the absolute area of forest loss under different drivers cannot be directly compared with the forest area under different disturbance types. Consequently, we only compared the proportional characteristics of forest cover under the same drivers and disturbance types across different global regions to validate the agreement of our global spatial distribution of forest disturbances.
Here, we divided the global continental area into 200 grids (n) with spatial location information, each measuring 10° × 10°. First, we calculated the proportion of forest loss area under different drivers within each grid relative to the global forest loss area, denoted as pi, where i represents the driver type. Second, we calculated the proportion of forest area under different disturbance types within each grid relative to the global forest disturbance area, denoted as qi, where i represents the disturbance type. The agreement of this study was determined by examining the spatial consistency between these two proportions. The primary metrics used for validation included the coefficient of determination (R2) from linear regression (James et al., 2013), mean absolute error (MAE), and root mean square error (RMSE).
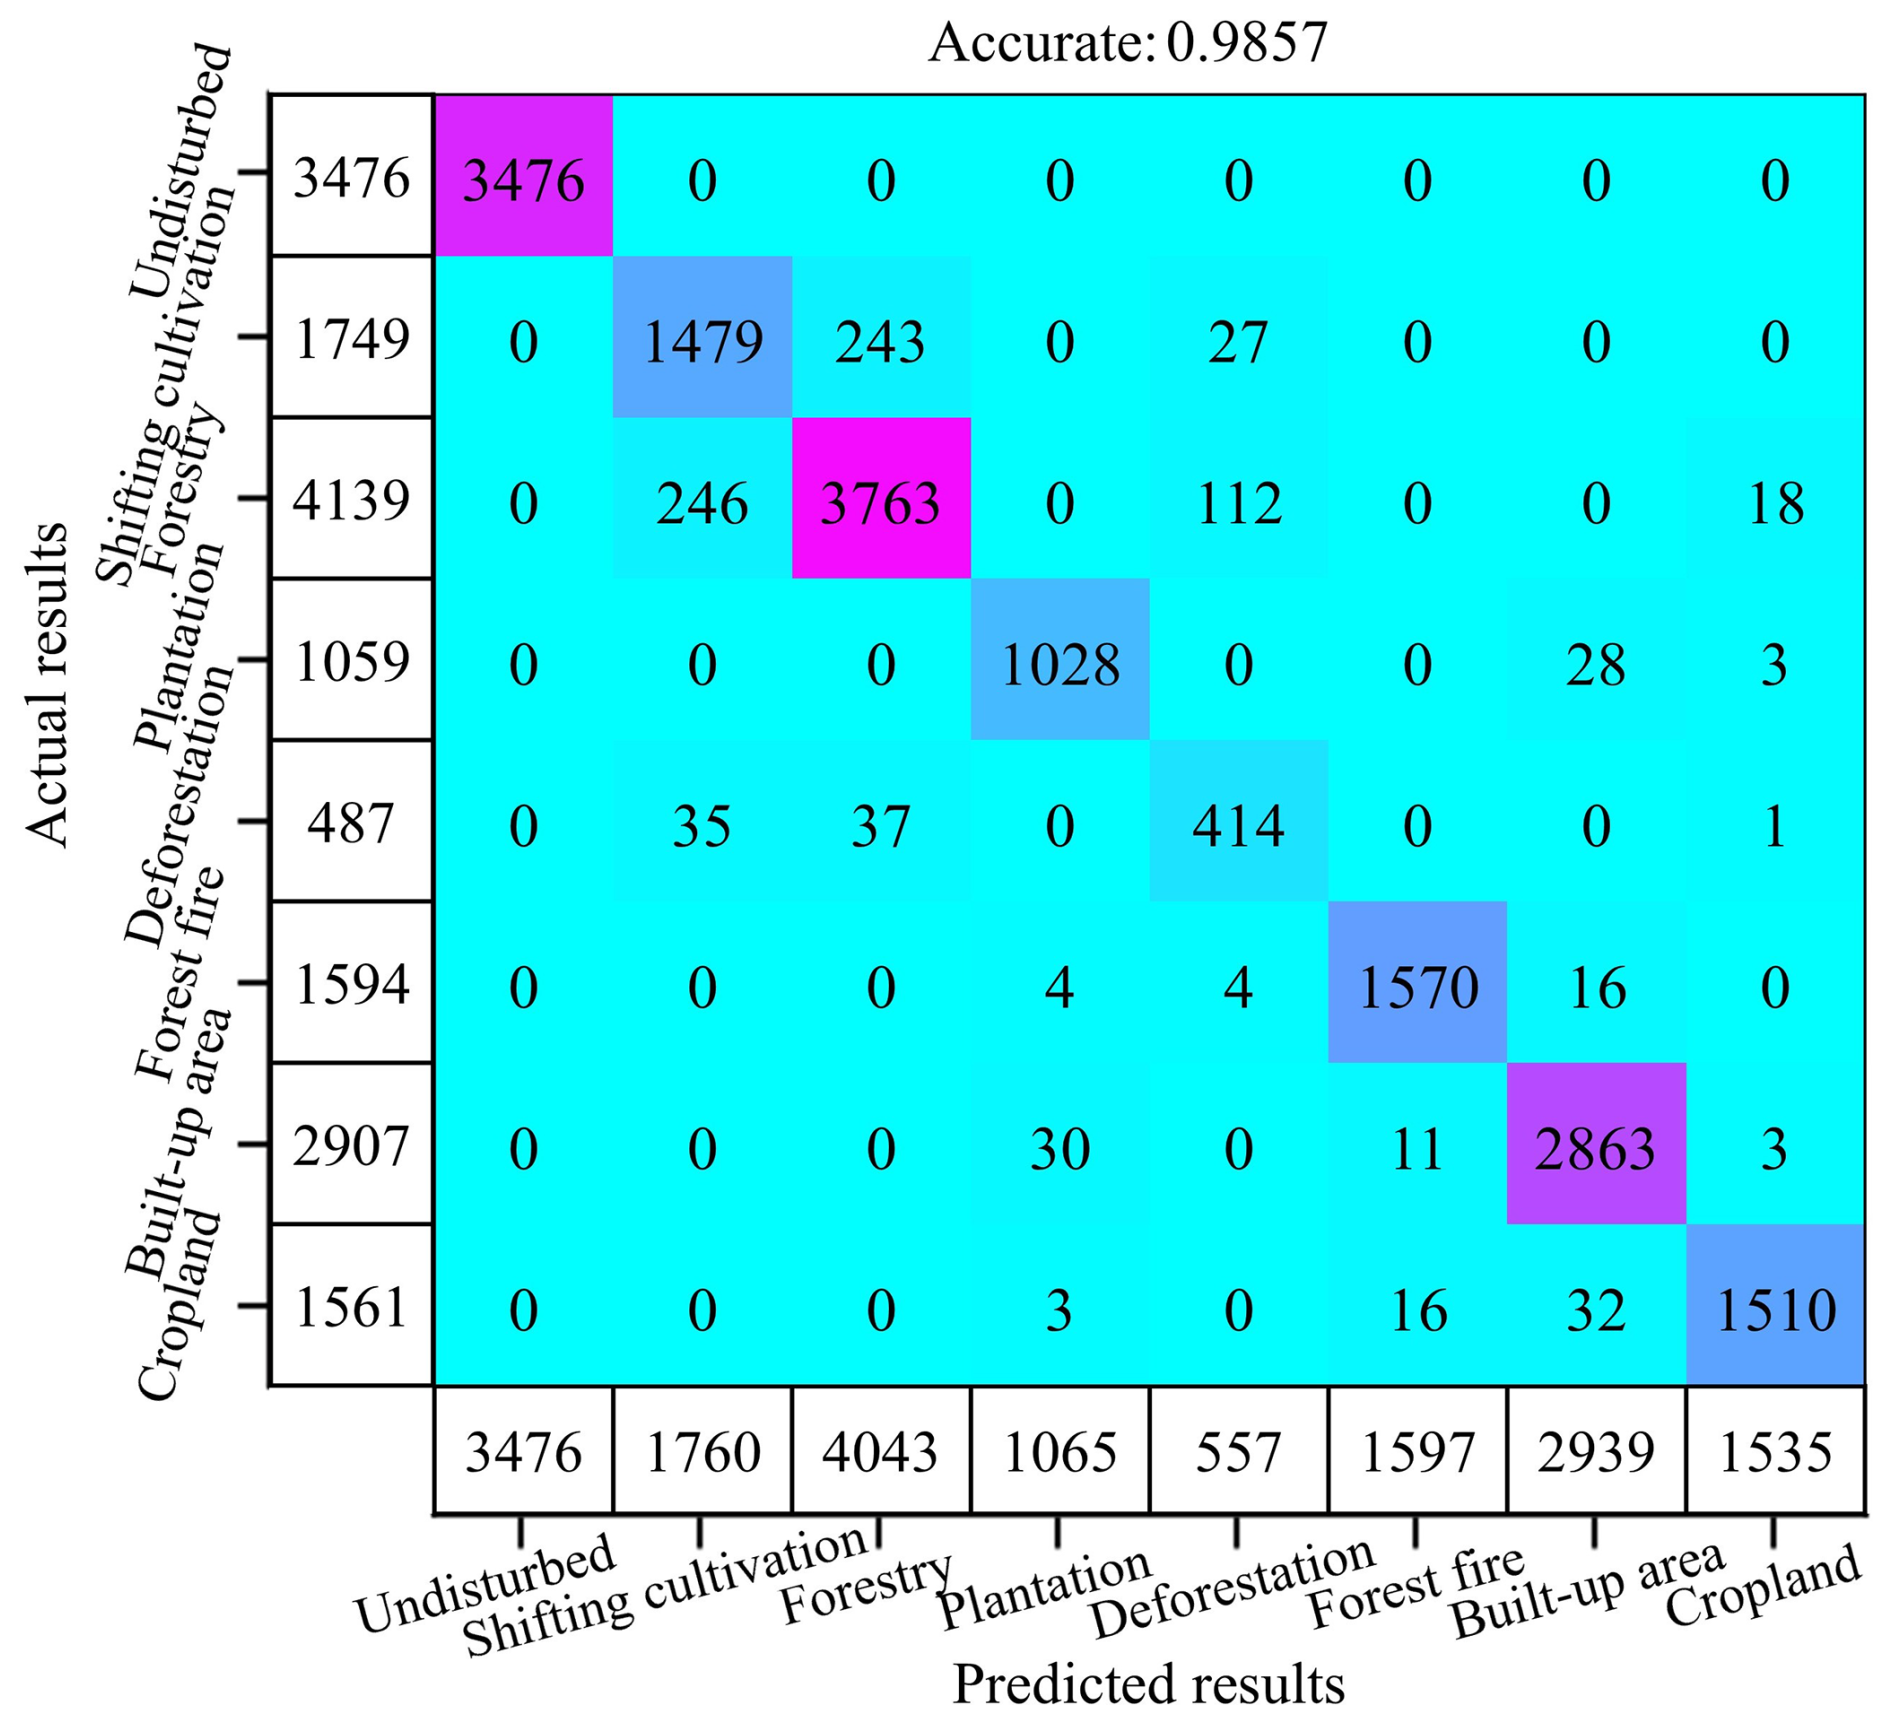
3.1 Accuracy verification of GFD mapping results
The confusion matrix validation results indicate an overall accuracy of 99 % (Fig. 3). The highest confusion occurs between shifting cultivation and forestry replanting, as well as deforestation of natural forests, though the accuracy remains relatively high. Owing to the high accuracy of current DP and LUC datasets, such as forest fire maps, plantation maps, and land use/cover maps, the identification accuracy of their corresponding disturbance types is considerably improved. The identification accuracy for disturbances such as fire reaches nearly 98 %. Here, there is no validation of the three disturbance types of oil palm, flood disaster, and newly added forests, as the identification of these disturbance types is based on the superposition with existing datasets, and their accuracy directly depends on the accuracy of the reference dataset. Here, we restricted our analysis to areas that had undergone forest disturbance. The observed 100 % accuracy for the undisturbed class is attributable to the masking procedure applied using Hansen's Global Forest Change dataset.
The accuracy assessment results reveal significant variations in classification performance across different forest disturbance types. The overall accuracy reaches 99 % (±0.03 %), indicating robust model performance at the aggregate level (Table 4). Forest fire disturbance (98 % ± 0.31 % user's accuracy, 99 % ± 0.09 % producer's accuracy) and plantation occupation (97 % ± 0.52 %, 98 % ± 0.74 %) demonstrate the highest classification reliability. Forestry replanting shows strong (91 % ± 0.45 %, 91 % ± 0.47 %), while shifting cultivation achieves moderate performance and slightly more variable accuracy (85 % ± 0.86 %, 86 % ± 0.70 %). Deforestation of natural forests exhibits the lowest user's accuracy (85 % ± 1.62 %), suggesting significant confusion with other disturbance types. Built-up area expansion shows high user's accuracy (98.49 % ± 0.23 %) but relatively lower producer's accuracy (46.99 % ± 3.34 %), indicating omission of this class in the mapped results. These results highlight the model's effectiveness for dominant disturbance types.
Table 4Accuracy Evaluation of GFD Mapping Results.
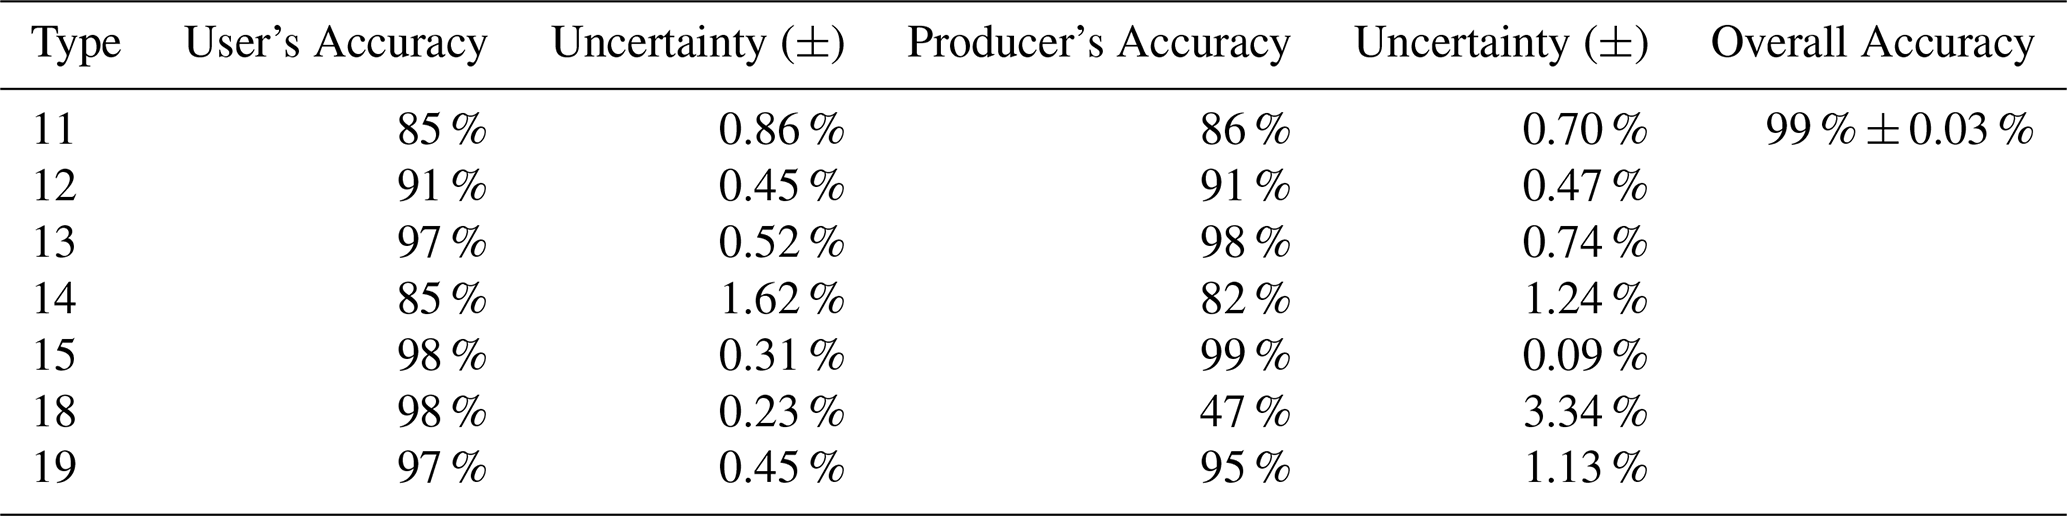
Note: the uncertainty is the standard error of the estimate.
3.2 The spatial distribution of GFD
A high-resolution forest disturbance distribution map of the world has been developed (Fig. 4). The global forest cover disturbance changes mainly occur in South America, Asia, Africa, and North America, accounting for 24 %, 23 %, 20 %, and 18 % of the total, respectively. The evergreen coniferous forest exhibits significant disturbance in the central Cordillera Mountains, southern Labrador Plateau, Eastern European Plain, and Western Siberian Plain. In the northern part of Eurasia, forest fires remain the most important factor affecting forests. Significant changes in evergreen broad-leaved forests have been observed in the southern Amazon Basin, South Asia, and Indonesia.
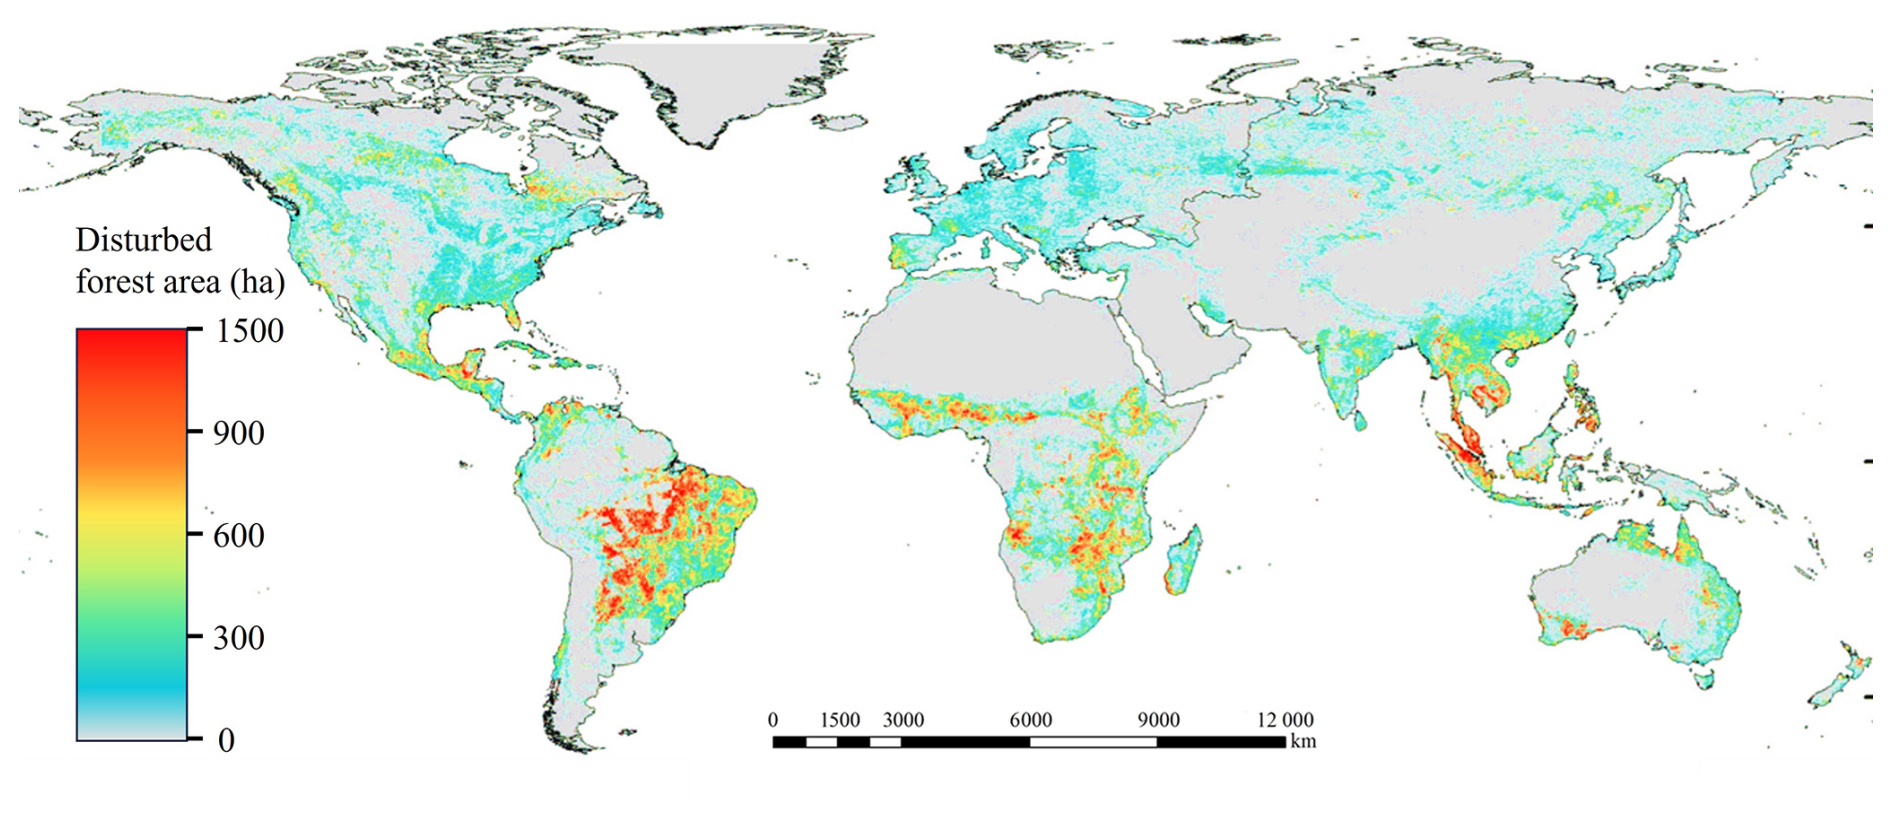
Figure 4Global Forest Disturbance Distribution Map in 5.5 km resolution.
Between 2000 and 2020, the area of disturbed forests worldwide reached 1247.06 Mha, accounting for 31 % of the global forest area. The main types of global forest disturbance are forestry replanting (44 %), shifting cultivation (24 %), and forest fires (11 %) (Fig. 5). The large-scale deforestation of natural forests also accounts for 9 % of global forest disturbance. The disturbance to forests caused by the cropland occupation, plantation disturbance, oil palm cultivation, and built-up area expansion also accounted for 4 %, 2 %, 0.78 %, and 0.22 %, respectively. Meanwhile, the newly added forests worldwide account for 3 % of the global forest disturbance area.
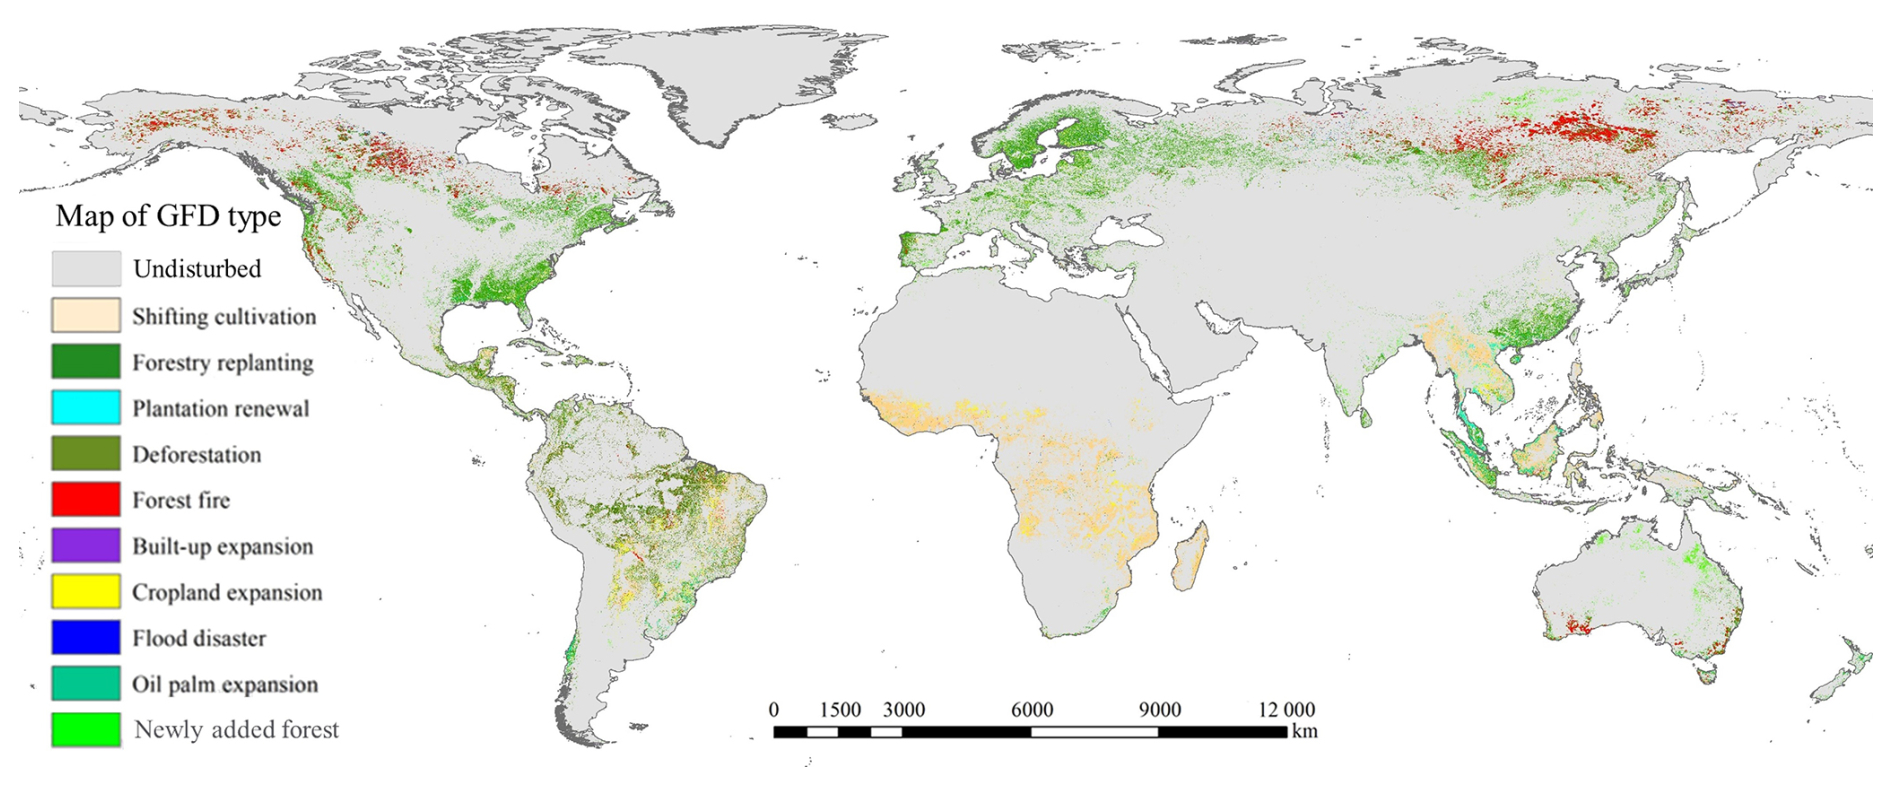
Figure 5Global Forest Disturbance Classification Map in 30 m resolution.
3.3 Spatial distribution of typical GFD
The encroachment of cropland expansion into forests is predominantly distributed in Brazil in South America, the southern coast of West Africa, East Africa, and mainland Southeast Asia (Fig. 6a). Forest fires primarily occur in Siberia, Russia; Canada and Alaska in North America; the southern coast of Australia; and the southern edge of the Amazon in South America (Fig. 6b). Shifting agriculture is mainly concentrated in tropical regions, particularly in African forests, mainland and insular areas of Southeast Asia, and certain parts of Latin America (Fig. 6c). Global plantation-induced forest disturbances are primarily observed along the eastern coast of the United States, the southeastern coast of South America, Western Europe, Southeast Asia, and the southeastern coastal regions of China (Fig. 6d).
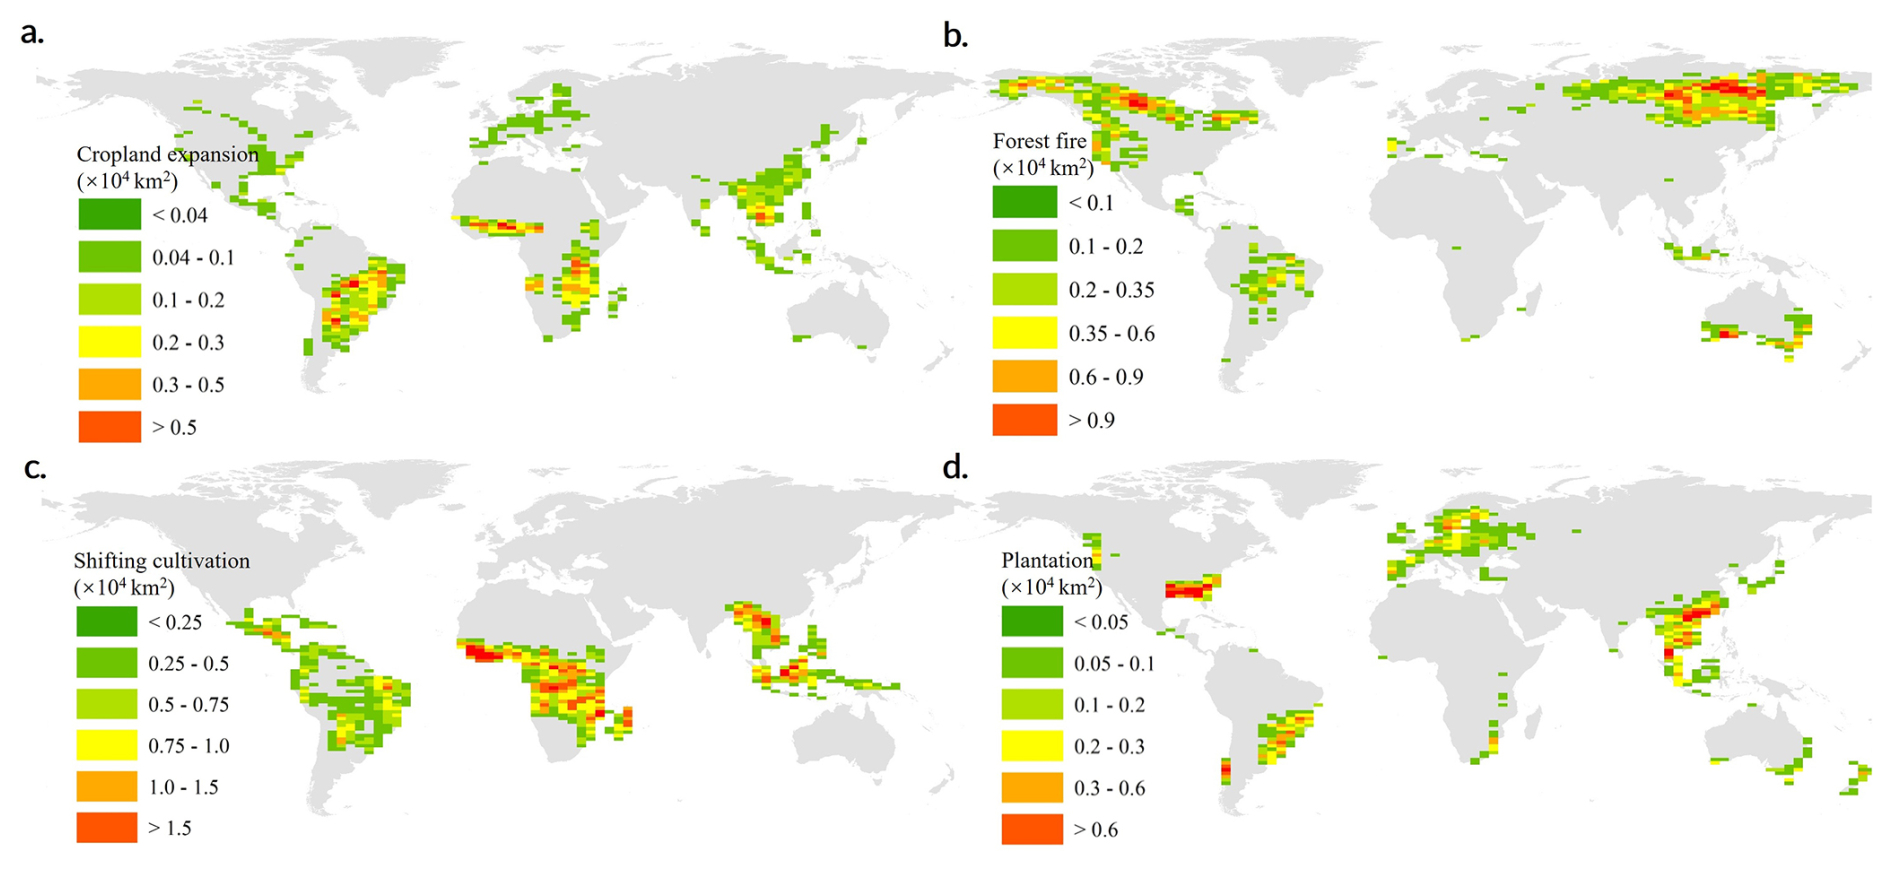
Figure 6Global Typical Forest Disturbance Statistics. (a) is the cropland occupation on forests; (b) is the disturbance caused by forest fires; (c) is the disturbance of shifting cultivation; (d) is the disturbance of plantations (excluding oil palm). These results are presented on a grid of 1.5° × 2.5°, and note varying scales.
Based on disturbance trajectories and recovery status, this study classified global forest cover into four categories: (a) disturbed then recovered, (b) disturbed but unrecovered, (c) undisturbed forests, and (d) newly established forests (Fig. 7). The recovered forests were predominantly located in wildfire-affected areas in North America and Siberia, plantation areas in Southeast Asia and the U.S. Eastern Seaboard, shifting cultivation regions across Southeast Asia, the Americas and Africa, as well as the Amazon rainforest (Fig. 7a). Unrecovered disturbed forests were primarily concentrated in cropland expansion areas of mainland Southeast Asia, South America and Africa (Fig. 7b). Globally undisturbed forests over the past two decades were mainly distributed across tropical rainforests in Africa, the Americas and Southeast Asia, along with primary forest regions in southeastern China, Russia, the United States and Canada (Fig. 7c). Newly added forest since the 2000 were principally found in India, China, southern Brazil, northern Australia, mountainous areas of the western United States, and Siberia (Fig. 7d).
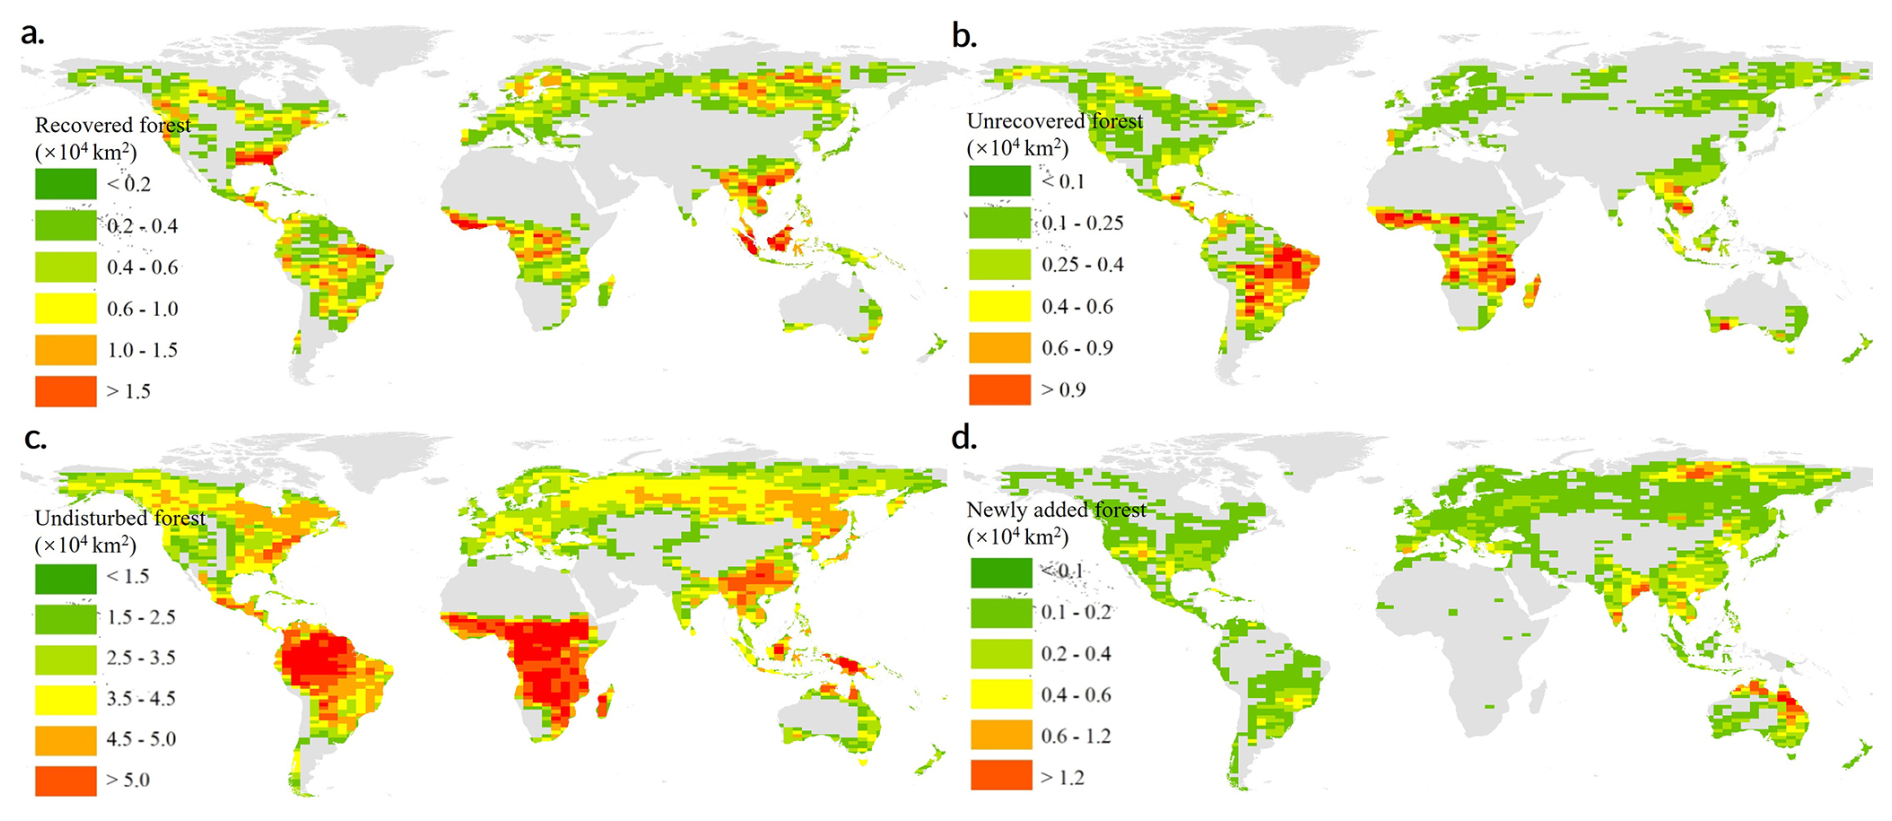
Figure 7Global Forest Disturbance Characteristics. (a) is recovered forest area; (b) is unrecovered disturbed area; (c) is undisturbed forest area; (d) is newly added forest area. These results are presented on a grid of 1.5° × 2.5°, and note varying scales.
3.4 Spatial consistency with other products
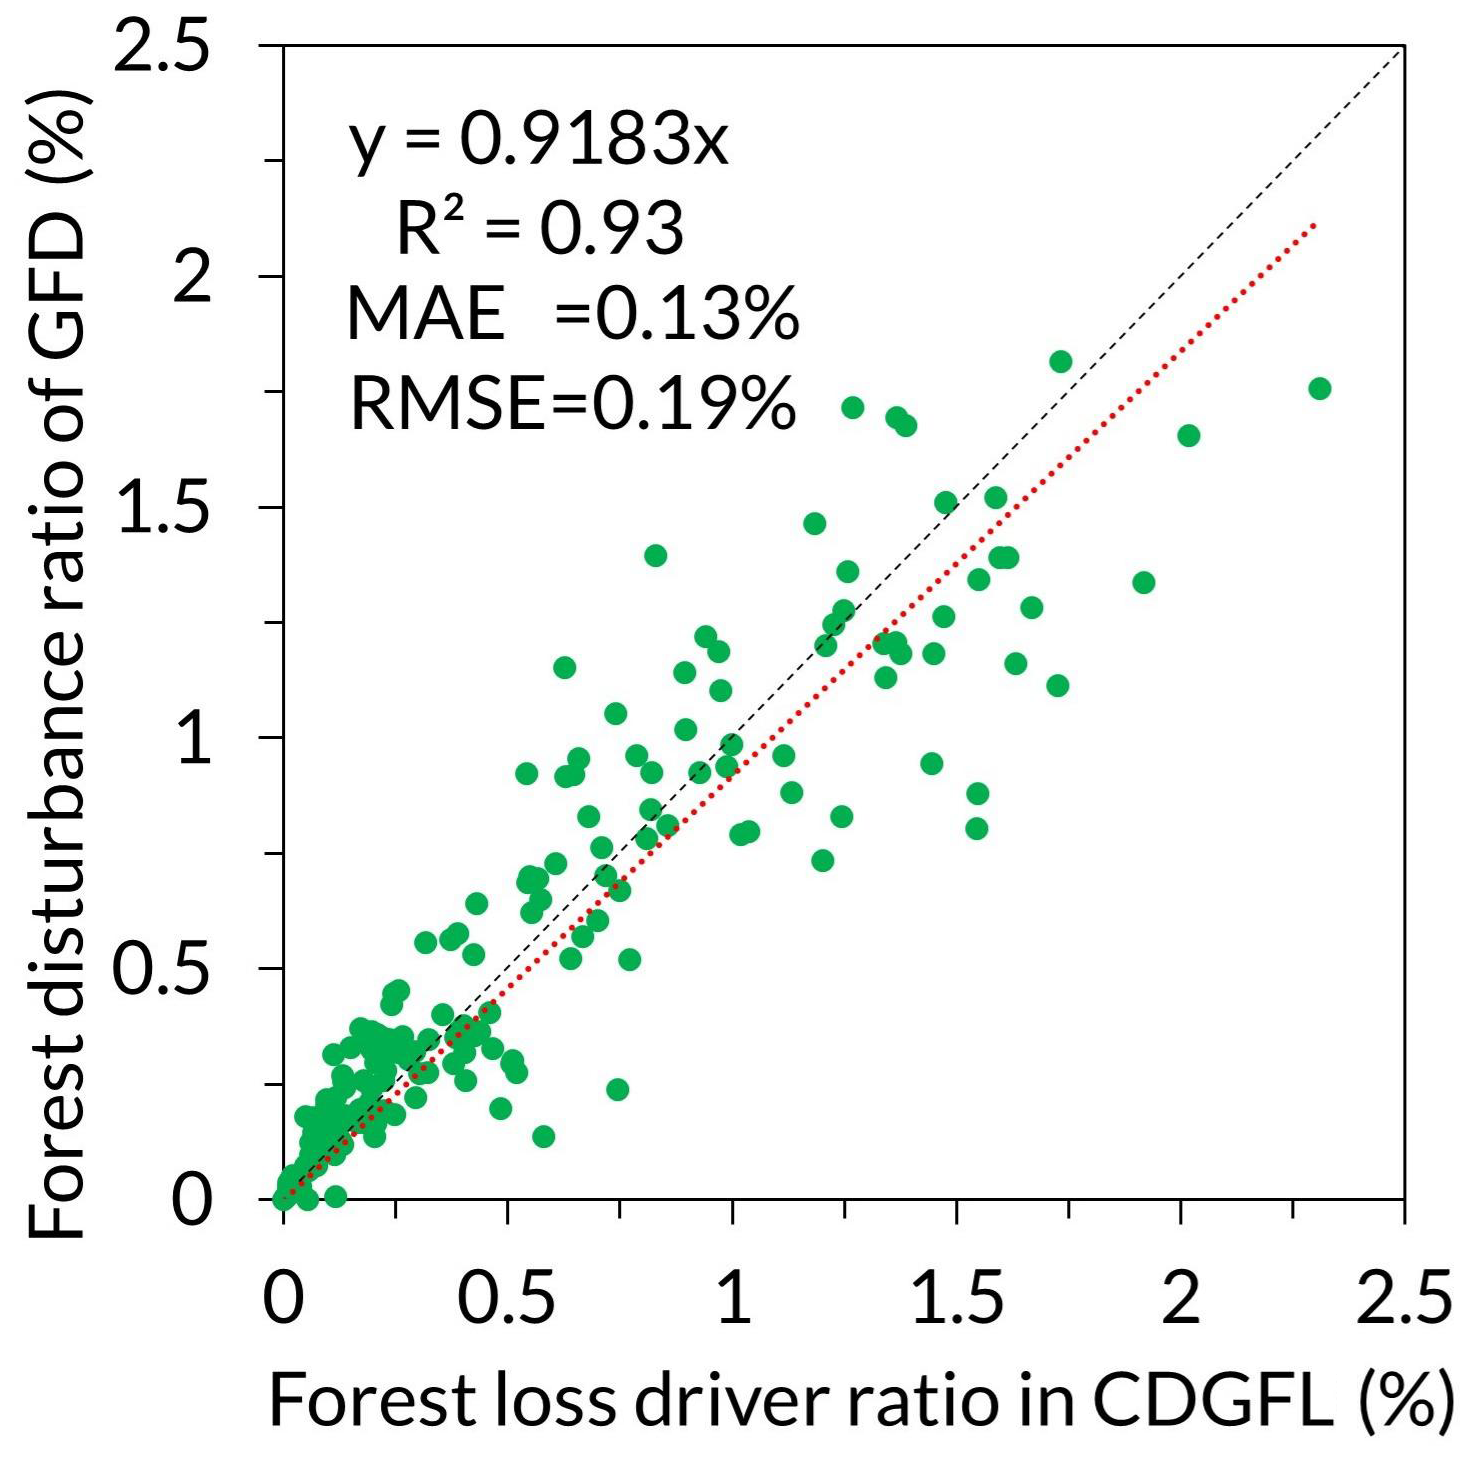
We compared the proportional characteristics of forest cover under the same drivers and disturbance types across different global regions. The agreement of this study was determined by examining the spatial consistency between these two proportions. The goodness of fit coefficient (R2) between the two was used as the consistency coefficient. According to 200 grids covering a wide range of forest areas worldwide, the proportion of GFD in each grid has a high consistency with the proportion of CDGFL, with a consistency coefficient of 0.93 (R2= 0.93). From the perspective of error, the MAE and RMSE of the two are 0.13 % and 0.19 %, respectively (Fig. 8). From the statistical proportion of different types of forest disturbance or forest loss drivers worldwide, both show forestry replanting > shifting cultivation > forest fires > deforestation of natural forest.
Across different forest disturbance types, all categories exhibit strong spatial consistency with the existing CDGFL dataset (Fig. 9). We quantified the four dominant disturbance types with the largest proportions: forestry replanting, shifting cultivation, forest fire, and deforestation of natural forests (Fig. 9). The comparative analysis reveals that these four major disturbance types display high spatial agreement with the existing low-resolution CDGFL dataset, with the following metrics: shifting cultivation (R2= 0.78, MAE = 0.07 %, RMSE = 0.16 %), forestry replanting (R2= 0.83, MAE = 0.11 %, RMSE = 0.17 %), forest fire (R2= 0.85, MAE = 0.06 %, RMSE = 0.12 %), and deforestation of natural forest (R2= 0.62, MAE = 0.05 %, RMSE = 0.11 %). Notably, forestry replanting, despite having the highest consistency coefficient (0.91), shows the largest error index (RMSE = 0.17 %) (Fig. 9b). In contrast, deforestation of natural forest, with the lowest consistency coefficient (0.75), exhibits the smallest error index (RMSE = 0.11 %) (Fig. 9d). This discrepancy is likely attributable to the high degree of confusion between forestry replanting and other disturbance types (Fig. 3).
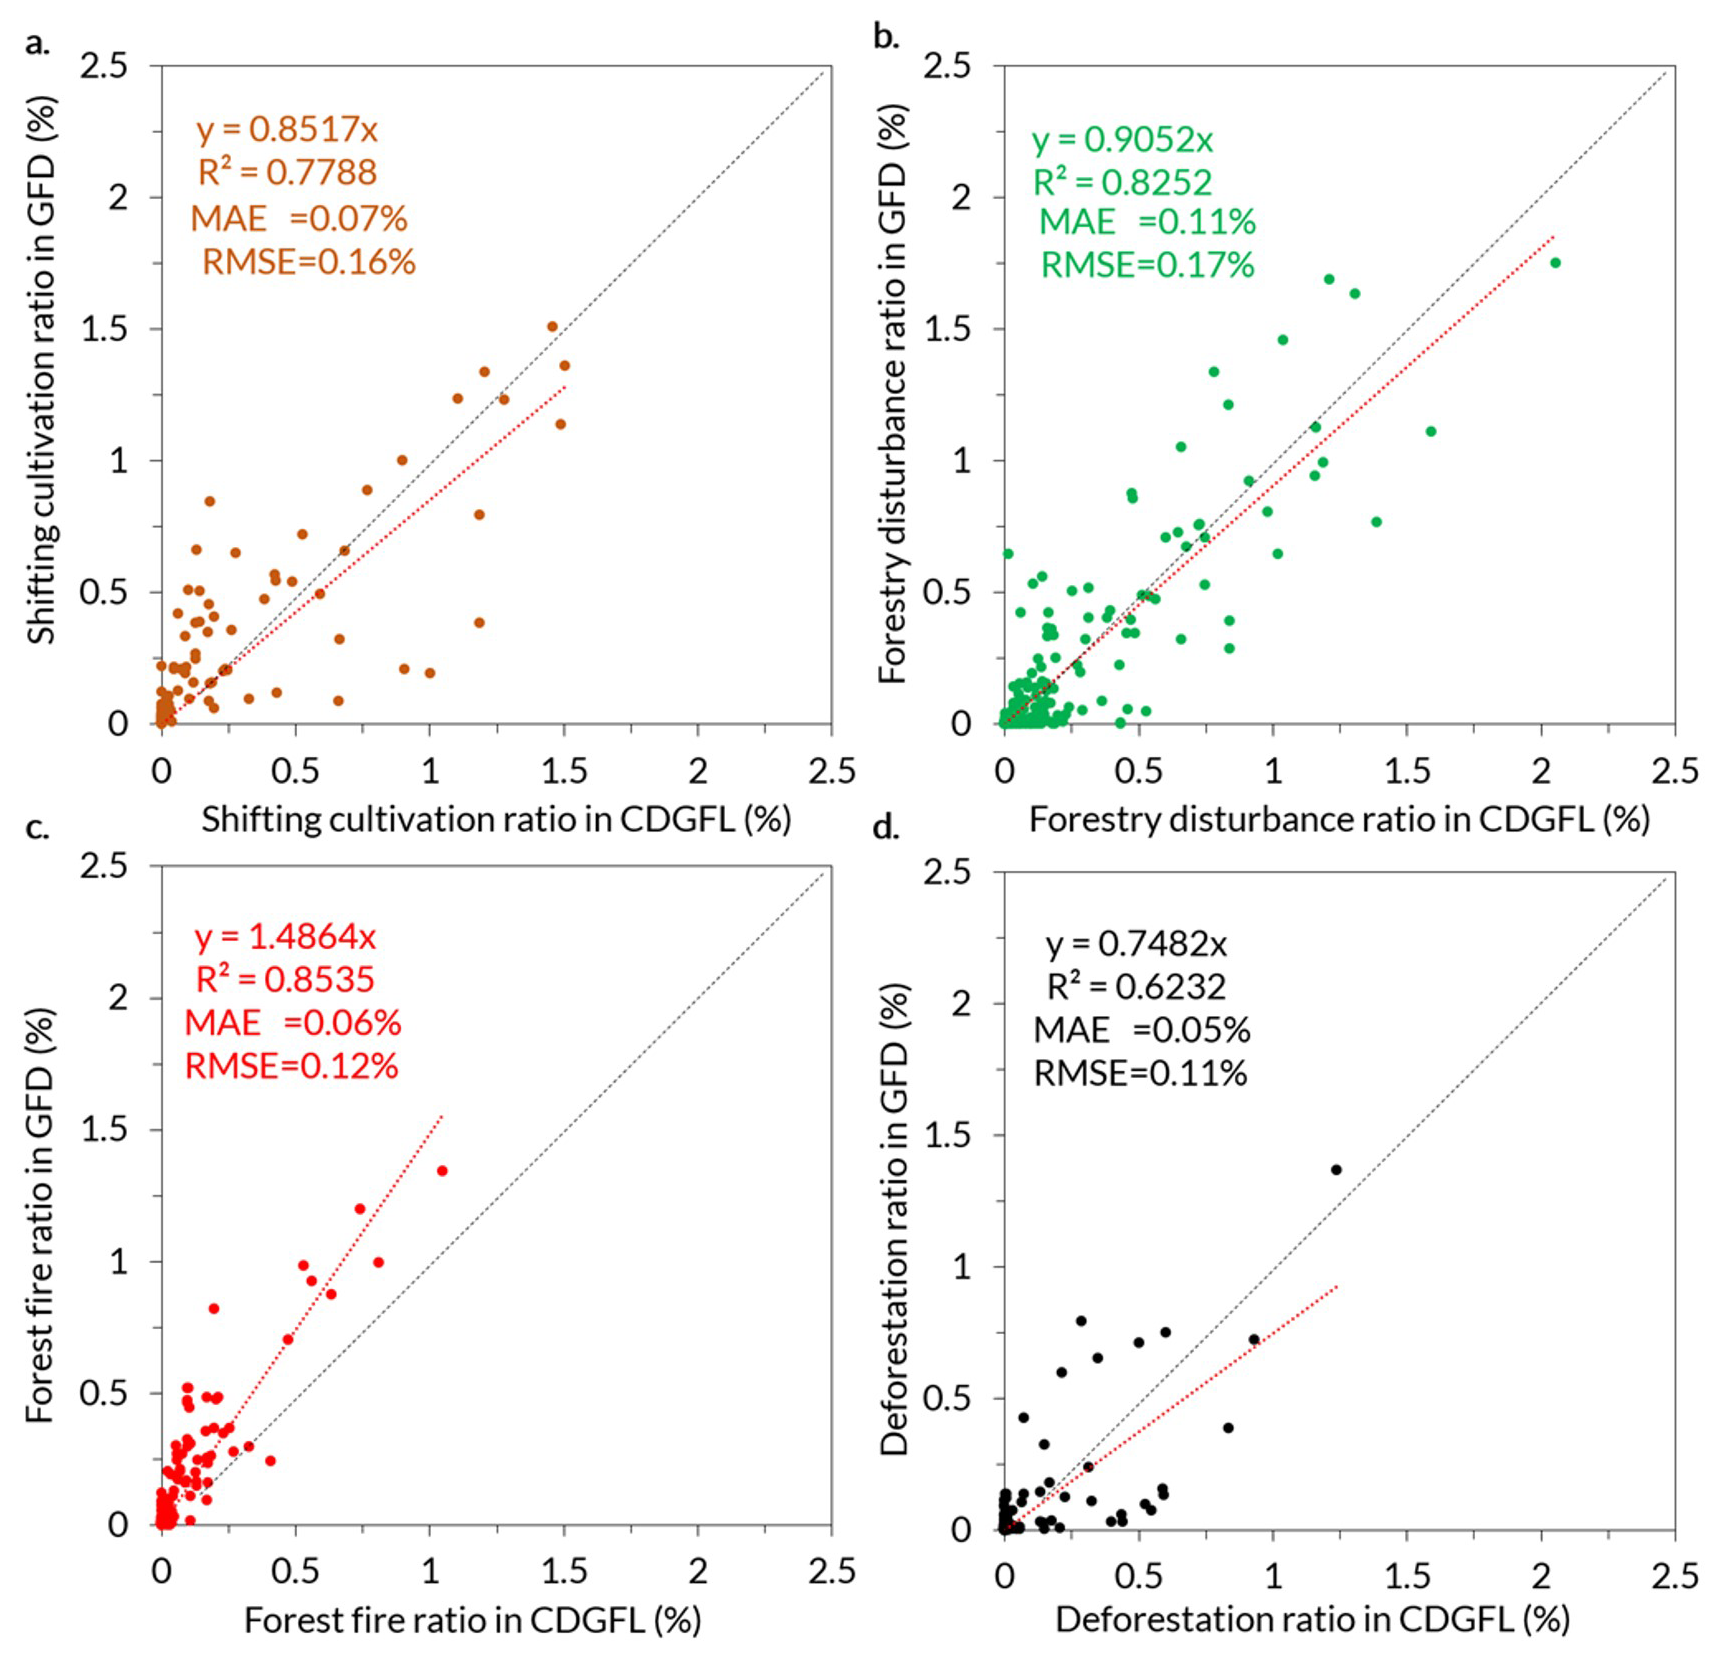
Figure 9Spatial consistency under different forest disturbance types. (a)–(d) represent the spatial consistency of between the GFD and the CDGFL in shifting cultivation, forestry replanting, forest fire, and deforestation of natural forest, respectively.
Landsat data and auxiliary data are sourced from public data archives and GEE's user team (https://code.earthengine.google.com/, last access: 10 May 2025), which requires logging into a GEE account. The GFD type map produced in this study is openly available at https://doi.org/10.6084/m9.figshare.28465178 (Liu et al., 2025a).
The study presents the first high-resolution global forest disturbance (GFD) dataset, which significantly advances the monitoring and understanding of forest dynamics from 2000 to 2020. By integrating Landsat-based Continuous Change Detection and Classification (CCDC) time-series analysis with spatial predictors and machine learning techniques, the dataset achieves an impressive overall accuracy of 99 %, demonstrating robust performance in classifying 11 major forest disturbance types. The results highlight forestry replanting (44 %), shifting cultivation (24 %), and forest fires (11 %) as the dominant drivers of global forest cover changes, collectively accounting for nearly 80 % of the total disturbed area. Meanwhile, the newly added forests worldwide account for 3 % of the global forest disturbance area. These findings underscore the pervasive impact of anthropogenic activities and natural disturbances on forest ecosystems, with significant regional variations observed across tropical, temperate, and boreal forests.
The spatial distribution of disturbances reveals critical patterns: cropland expansion primarily affects forests in South America, West Africa, and Southeast Asia; forest fires are concentrated in Siberia, North America, and Australia; and shifting cultivation dominates tropical regions. The study also identifies areas of forest recovery, particularly in wildfire-affected zones and plantation regions, as well as newly established forests in countries like China, India, and Brazil. These insights are vital for informing targeted conservation strategies and climate change mitigation efforts, such as those under the Paris Agreement.
Despite its achievements, the study acknowledges limitations, including the exclusion of weak disturbances (drought and pests) due to data constraints and the challenges in distinguishing between certain disturbance types, such as forestry replanting and deforestation. Future research should focus on incorporating higher-resolution data and refining classification algorithms to address these gaps. Nevertheless, the GFD dataset provides a valuable foundation for global forest governance, carbon accounting, and sustainable land management, offering policymakers and scientists a reliable tool to track forest changes and implement evidence-based interventions.
In conclusion, this study represents a significant step forward in global forest monitoring, combining advanced remote sensing technologies with machine learning to deliver a comprehensive, high-accuracy dataset. Its findings emphasize the urgent need for coordinated international efforts to mitigate forest degradation and promote restoration, ensuring the continued provision of essential ecosystem services in the face of escalating environmental challenges.
The selection of sample points was primarily based on the time-series changes observed in Landsat images from 2000 to 2020, supplemented by historical high-resolution imagery from Google Earth. Through extensive analysis, eight types of forest disturbances were preliminarily identified: undisturbed (0), shifting cultivation disturbance (11), forestry replanting (12), plantation disturbance (13), deforestation of natural forests (14), forest fire disturbance (15), built-up area expansion (18), and cropland occupation (19). A total of 57 000 sample points representing these disturbance types were visually interpreted. These sample points are evenly distributed across global forest disturbance areas (Fig. B1).
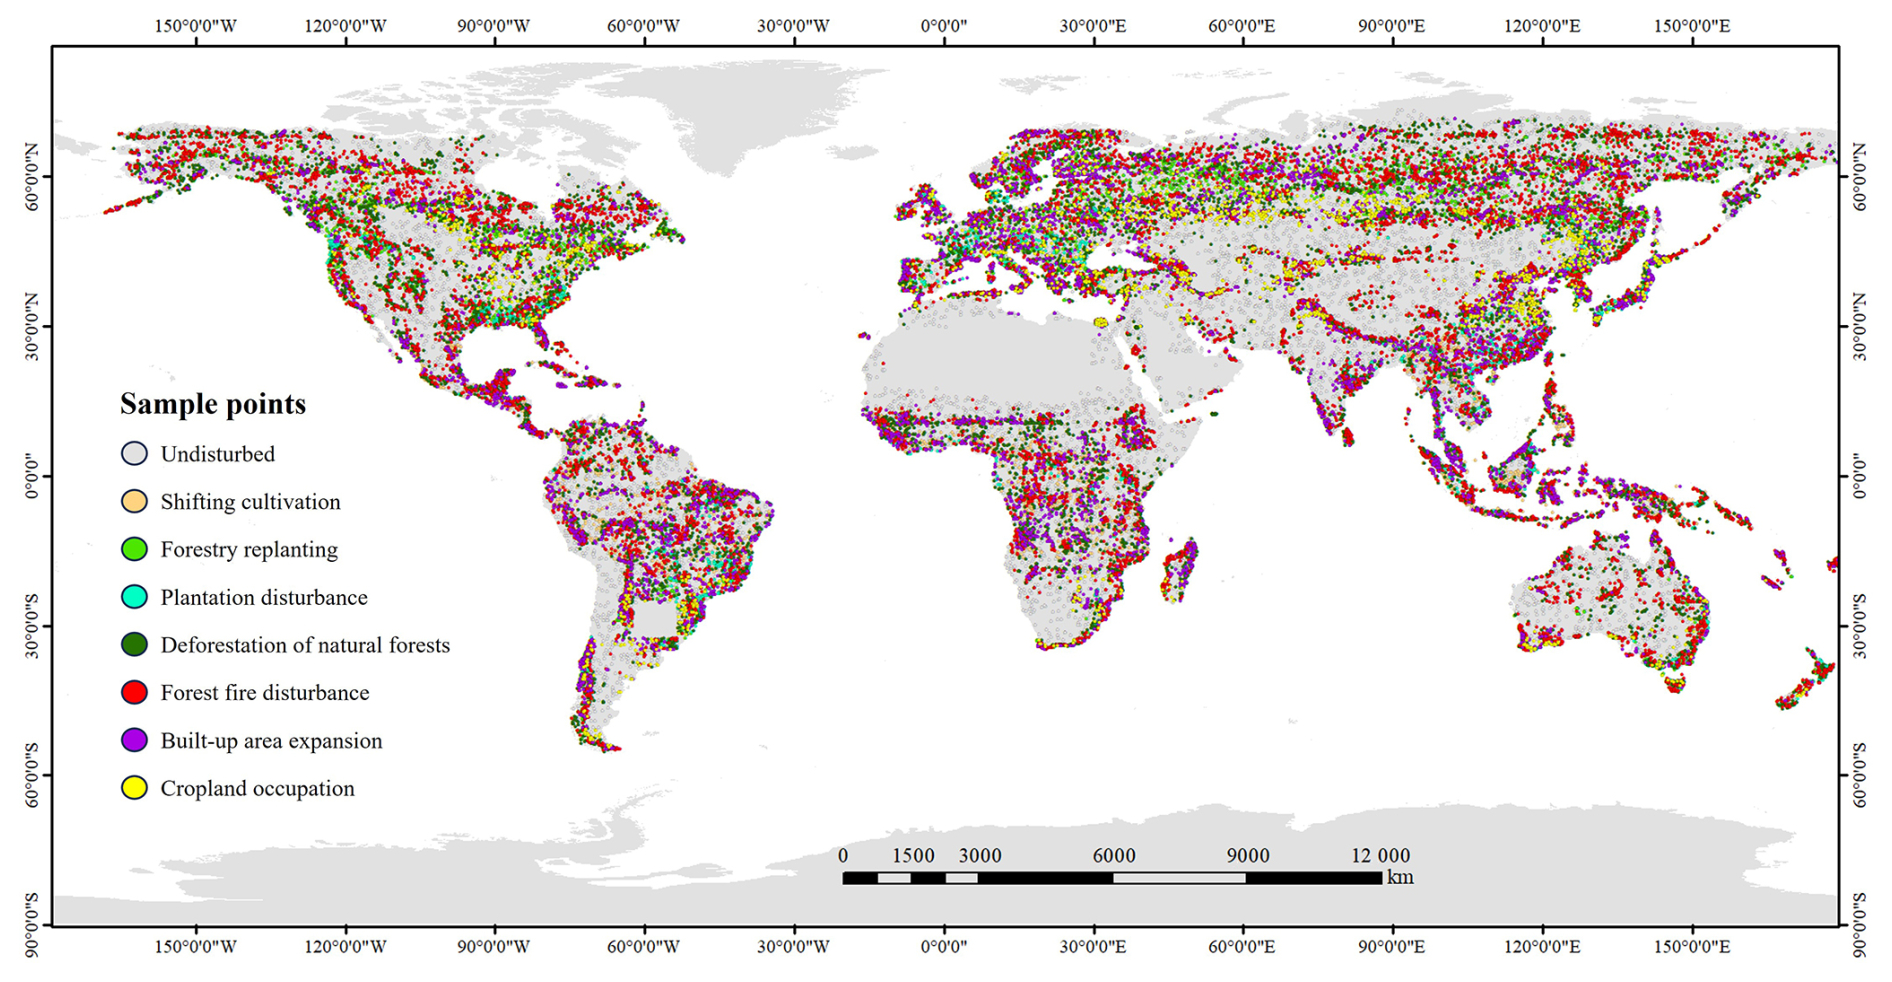
Figure B1Overall spatial consistency comparison with CDGFL under logarithmic scale.
SL and LW designed the research. LW, JZ, and SL performed the analysis. JZ, WS, SD, and LW collected the sample points and existing remote sensing products. LW and SL wrote the manuscript. JZ, WS, and SD reviewed the manuscript.
The contact author has declared that none of the authors has any competing interests.
Publisher's note: Copernicus Publications remains neutral with regard to jurisdictional claims made in the text, published maps, institutional affiliations, or any other geographical representation in this paper. The authors bear the ultimate responsibility for providing appropriate place names. Views expressed in the text are those of the authors and do not necessarily reflect the views of the publisher.
We thank the editor and the reviewers for their valuable comments.
This work was supported by the National Key Research and Development Program of China (grant no. 2021YFE0117900), National Natural Science Foundation of China (grant no. 42401082), Future Star Program of Chinese Academy of Sciences, and Project funded by China Postdoctoral Science Foundation (grant no. 2024M763351).
This paper was edited by Kaiguang Zhao and reviewed by Ian Evans and three anonymous referees.
Acil, N., Sadler, J. P., Senf, C., Suvanto, S., and Pugh, T. A. M.: Landscape patterns in stand-replacing disturbances across the world's forests, Nature Sustainability, 8, https://doi.org/10.1038/s41893-024-01450-3, 2025.
Aquino, C., Mitchard, E. T. A., McNicol, I. M., Carstairs, H., Burt, A., Vilca, B. L. P., Ebanega, M. O., Dikongo, A. M., Dassi, C., Mayta, S., Tamayo, M., Grijalba, P., Miranda, F., and Disney, M.: Reliably mapping low-intensity forest disturbance using satellite radar data, Frontiers in Forests and Global Change, 5, https://doi.org/10.3389/ffgc.2022.1018762, 2022.
Betts, M. G., Wolf, C., Ripple, W. J., Phalan, B., Millers, K. A., Duarte, A., Butchart, S. H. M., and Levi, T.: Global forest loss disproportionately erodes biodiversity in intact landscapes, Nature, 547, 441–444, https://doi.org/10.1038/nature23285, 2017.
Blaschke, P. M., Trustrum, N. A., and Derose, R. C.: Ecosystem processes and sustainable land-use in New-Zealand steeplands, Agr. Ecosyst. Environ., 41, 153–178, https://doi.org/10.1016/0167-8809(92)90107-m, 1992.
Burrus, C. S., Barreto, J. A., and Selesnick, I. W.: Iterative reweighted least-squares design of fir filters, IEEE T. Signal Proces., 42, 2926–2936, https://doi.org/10.1109/78.330353, 1994.
Chen, S. J., Olofsson, P., Saphangthong, T., and Woodcock, C. E.: Monitoring shifting cultivation in Laos with Landsat time series, Remote Sens. Environ., 288, https://doi.org/10.1016/j.rse.2023.113507, 2023a.
Chen, X. L., Taylor, A. R., Reich, P. B., Hisano, M., Chen, H. Y. H., and Chang, S. X.: Tree diversity increases decadal forest soil carbon and nitrogen accrual, Nature, 618, 94–101, https://doi.org/10.1038/s41586-023-05941-9, 2023b.
Chowdhury, S., Chao, D. K., Shipman, T. C., and Wulder, M. A.: Utilization of Landsat data to quantify land-use and land-cover changes related to oil and gas activities in West-Central Alberta from 2005 to 2013, Gisci. Remote Sens., 54, 700–720, https://doi.org/10.1080/15481603.2017.1317453, 2017.
Cuni-Sanchez, A., Sullivan, M. J. P., Platts, P. J., Lewis, S. L., Marchant, R., Imani, G., Hubau, W., Abiem, I., Adhikari, H., Albrecht, T., Altman, J., Amani, C., Aneseyee, A. B., Avitabile, V., Banin, L., Batumike, R., Bauters, M., Beeckman, H., Begne, S. K., Bennett, A. C., Bitariho, R., Boeckx, P., Bogaert, J., Bräuning, A., Bulonvu, F., Burgess, N. D., Calders, K., Chapman, C., Chapman, H., Comiskey, J., de Haulleville, T., Decuyper, M., DeVries, B., Dolezal, J., Droissart, V., Ewango, C., Feyera, S., Gebrekirstos, A., Gereau, R., Gilpin, M., Hakizimana, D., Hall, J., Hamilton, A., Hardy, O., Hart, T., Heiskanen, J., Hemp, A., Herold, M., Hiltner, U., Horak, D., Kamdem, M. N., Kayijamahe, C., Kenfack, D., Kinyanjui, M. J., Klein, J., Lisingo, J., Lovett, J., Lung, M., Makana, J. R., Malhi, Y., Marshall, A., Martin, E. H., Mitchard, E. T. A., Morel, A., Mukendi, J. T., Muller, T., Nchu, F., Nyirambangutse, B., Okello, J., Peh, K. S. H., Pellikka, P., Phillips, O. L., Plumptre, A., Qie, L., Rovero, F., Sainge, M. N., Schmitt, C. B., Sedlacek, O., Ngute, A. S. K., Sheil, D., Sheleme, D., Simegn, T. Y., Simo-Droissart, M., Sonké, B., Soromessa, T., Sunderland, T., Svoboda, M., Taedoumg, H., Taplin, J., Taylor, D., Thomas, S. C., Timberlake, J., Tuagben, D., Umunay, P., Uzabaho, E., Verbeeck, H., Vleminckx, J., Wallin, G., Wheeler, C., Willcock, S., Woods, J. T., and Zibera, E.: High aboveground carbon stock of African tropical montane forests, Nature, 596, 536–542, https://doi.org/10.1038/s41586-021-03728-4, 2021.
Curtis, P. G., Slay, C. M., Harris, N. L., Tyukavina, A., and Hansen, M. C.: Classifying drivers of global forest loss, Science, 361, 1108–1111, https://doi.org/10.1126/science.aau3445, 2018.
Feng, Y., Ziegler, A. D., Elsen, P. R., Liu, Y., He, X. Y., Spracklen, D. V., Holden, J., Jiang, X., Zheng, C. M., and Zeng, Z. Z.: Upward expansion and acceleration of forest clearance in the mountains of Southeast Asia, Nature Sustainability, 4, 892–899, https://doi.org/10.1038/s41893-021-00738-y, 2021.
Finger, D. J. I., McPherson, M. L., Houskeeper, H. F., and Kudela, R. M.: Mapping bull kelp canopy in northern California using Landsat to enable long-term monitoring, Remote Sens. Environ., 254, https://doi.org/10.1016/j.rse.2020.112243, 2021.
Hansen, M. C., Potapov, P. V., Moore, R., Hancher, M., Turubanova, S. A., Tyukavina, A., Thau, D., Stehman, S. V., Goetz, S. J., Loveland, T. R., Kommareddy, A., Egorov, A., Chini, L., Justice, C. O., and Townshend, J. R. G.: High-Resolution Global Maps of 21st-Century Forest Cover Change, Science, 342, 850–853, https://doi.org/10.1126/science.1244693, 2013.
He, Y., Wang, L., Pei, J., Liu, S., Yang, H., Cao, J., Li, W., Niu, Z., Huang, N., Xu, X., Duan, J., Nath, B., Ding, S., and Chen, F.: Differential vegetation drought adaptability in global karst areas, npj Climate and Atmospheric Science, 8, 343, https://doi.org/10.1038/s41612-025-01223-5, 2025.
Hwang, Y., Ryu, Y., and Qu, S.: Expanding vegetated areas by human activities and strengthening vegetation growth concurrently explain the greening of Seoul, Landscape Urban Plan., 227, https://doi.org/10.1016/j.landurbplan.2022.104518, 2022.
James, G., Witten, D., Hastie, T., and Tibshirani, R.: An introduction to statistical learning: with applications in R, Springer, 59–128, https://doi.org/10.1007/978-1-0716-1418-1, 2013.
Jiang, S., Meng, J. J., Zhu, L. K., and Cheng, H. R.: Spatial-temporal pattern of land use conflict in China and its multilevel driving mechanisms, Sci. Total Environ., 801, https://doi.org/10.1016/j.scitotenv.2021.149697, 2021.
Kittel, T. G. F., Steffen, W. L., and Chapin, F. S.: Global and regional modelling of Arctic-boreal vegetation distribution and its sensitivity to altered forcing, Glob. Change Biol., 6, 1–18, https://doi.org/10.1046/j.1365-2486.2000.06011.x, 2000.
Leverkus, A. B., Lindenmayer, D. B., Thorn, S., and Gustafsson, L.: Salvage logging in the world's forests: Interactions between natural disturbance and logging need recognition, Global Ecol. Biogeogr., 27, 1140–1154, https://doi.org/10.1111/geb.12772, 2018.
Liu, S., Wang, L., and Zhang, J.: The dataset of main grain land changes in China over 1985–2020, Scientific Data, 11, 1430, https://doi.org/10.1038/s41597-024-04292-y, 2024.
Liu, S., Wang, L., and Song, W.: Global forest main disturbance types between 2000 and 2020, figshare [data set], https://doi.org/10.6084/m9.figshare.28465178, 2025a.
Liu, S., Wang, L., Zhang, J., and Ding, S.: Opposite effect on soil organic carbon between grain and non-grain crops: Evidence from Main Grain Land, China, Agr. Ecosyst. Environ., 379, 109364, https://doi.org/10.1016/j.agee.2024.109364, 2025b.
Liu, S. D., Zhang, J., Wang, L., Ciais, P., Zhang, J. J., Penuelas, J., Nath, B., Jacquet, I., Wu, X., Ding, S. P., Li, W., Huang, N., Song, W. J., Ni, W. J., and Niu, Z.: Mapping previously undetected trees reveals overlooked changes in pan-tropical tree cover, Nat. Commun., 16, https://doi.org/10.1038/s41467-025-60662-z, 2025c.
Mason, K. E., Oakley, S., Street, L. E., Arróniz-Crespo, M., Jones, D. L., DeLuca, T. H., and Ostle, N. J.: Boreal Forest Floor Greenhouse Gas Emissions Across a Pleurozium schreberi-Dominated, Wildfire-Disturbed Chronosequence, Ecosystems, 22, 1381–1392, https://doi.org/10.1007/s10021-019-00344-2, 2019.
Mayer, M., Baltensweiler, A., James, J., Rigling, A., and Hagedorn, F.: A global synthesis and conceptualization of the magnitude and duration of soil carbon losses in response to forest disturbances, Global Ecol. Biogeogr., 33, 141–150, https://doi.org/10.1111/geb.13779, 2024.
Miatto, A., Dawson, D., Nguyen, P. D., Kanaoka, K. S., and Tanikawa, H.: The urbanisation-environment conflict: Insights from material stock and productivity of transport infrastructure in Hanoi, Vietnam, J. Environ. Manage., 294, https://doi.org/10.1016/j.jenvman.2021.113007, 2021.
Oeser, J., Heurich, M., Senf, C., Pflugmacher, D., and Kuemmerle, T.: Satellite-based habitat monitoring reveals long-term dynamics of deer habitat in response to forest disturbances, Ecol. Appl., 31, https://doi.org/10.1002/eap.2269, 2021.
Olofsson, P., Foody, G. M., Herold, M., Stehman, S. V., Woodcock, C. E., and Wulder, M. A.: Good practices for estimating area and assessing accuracy of land change, Remote Sens. Environ., 148, 42–57, https://doi.org/10.1016/j.rse.2014.02.015, 2014.
Peng, L. Q., Searchinger, T. D., Zionts, J., and Waite, R.: The carbon costs of global wood harvests, Nature, 620, 110–115, https://doi.org/10.1038/s41586-023-06187-1, 2023.
Piao, S. L., Wang, X. H., Park, T., Chen, C., Lian, X., He, Y., Bjerke, J. W., Chen, A. P., Ciais, P., Tommervik, H., Nemani, R. R., and Myneni, R. B.: Characteristics, drivers and feedbacks of global greening, Nature Reviews Earth & Environment, 1, 14–27, https://doi.org/10.1038/s43017-019-0001-x, 2020.
Reza, M. I. H. and Abdullah, S. A.: Regional Index of Ecological Integrity: A need for sustainable management of natural resources, Ecol. Indic., 11, 220–229, https://doi.org/10.1016/j.ecolind.2010.08.010, 2011.
Rivera, J. D., de los Monteros, A. E., Saldaña-Vázquez, R. A., and Favila, M. E.: Beyond species loss: How anthropogenic disturbances drive functional and phylogenetic homogenization of Neotropical dung beetles, Sci. Total Environ., 869, https://doi.org/10.1016/j.scitotenv.2023.161663, 2023.
Roffe, T. G., Couturier, S., and García-Romero, A.: Suitability of the global forest cover change map to assess climatic megadisturbance impacts on remote tropical forests, Sci. Rep., 12, https://doi.org/10.1038/s41598-022-13558-7, 2022.
Ross, M. R. V., Nippgen, F., McGlynn, B. L., Thomas, C. J., Brooks, A. C., Shriver, R. K., Moore, E. M., and Bernhardt, E. S.: Mountaintop mining legacies constrain ecological, hydrological and biogeochemical recovery trajectories, Environ. Res. Lett., 16, https://doi.org/10.1088/1748-9326/ac09ac, 2021.
Scheeres, J., de Jong, J., Brede, B., Brancalion, P. H. S., Broadbent, E. N., Zambrano, A. M. A., Gorgens, E. B., Silva, C. A., Valbuena, R., Molin, P., Stark, S., Rodrigues, R. R., Rodrigues, R., Santoro, G. B., de Almeida, C. T., and de Almeida, D. R. A.: Distinguishing forest types in restored tropical landscapes with UAV-borne LIDAR, Remote Sens. Environ., 290, https://doi.org/10.1016/j.rse.2023.113533, 2023.
Scholten, R. C., Jandt, R., Miller, E. A., Rogers, B. M., and Veraverbeke, S.: Overwintering fires in boreal forests, Nature, 593, 399–404, https://doi.org/10.1038/s41586-021-03437-y, 2021.
Skakun, S., Vermote, E. F., Artigas, A. E. S., Rountree, W. H., and Roger, J. C.: An experimental sky-image-derived cloud validation dataset for Sentinel-2 and Landsat 8 satellites over NASA GSFC, Int. J. Appl. Earth Obs., 95, https://doi.org/10.1016/j.jag.2020.102253, 2021.
Skidmore, A. K., Coops, N. C., Neinavaz, E., Ali, A., Schaepman, M. E., Paganini, M., Kissling, W. D., Vihervaara, P., Darvishzadeh, R., Feilhauer, H., Fernandez, M., Fernández, N., Gorelick, N., Geizendorffer, I., Heiden, U., Heurich, M., Hobern, D., Holzwarth, S., Muller-Karger, F. E., Van De Kerchove, R., Lausch, A., Leitau, P. J., Lock, M. C., Mücher, C. A., O'Connor, B., Rocchini, D., Turner, W., Vis, J. K., Wang, T. J., Wegmann, M., and Wingate, V.: Priority list of biodiversity metrics to observe from space, Nature Ecology & Evolution, 5, 896–906, https://doi.org/10.1038/s41559-021-01451-x, 2021.
Stehman, S. V.: Estimating area and map accuracy for stratified random sampling when the strata are different from the map classes, Int. J. Remote Sens., 35, 4923–4939, https://doi.org/10.1080/01431161.2014.930207, 2014.
Tollerud, H. J., Zhu, Z., Smith, K., Wellington, D. F., Hussain, R. A., and Viola, D.: Toward consistent change detection across irregular remote sensing time series observations, Remote Sens. Environ., 285, https://doi.org/10.1016/j.rse.2022.113372, 2023.
Tong, X. W., Brandt, M., Yue, Y. M., Ciais, P., Jepsen, M. R., Penuelas, J., Wigneron, J. P., Xiao, X. M., Song, X. P., Horion, S., Rasmussen, K., Saatchi, S., Fan, L., Wang, K. L., Zhang, B., Chen, Z. C., Wang, Y. H., Li, X. J., and Fensholt, R.: Forest management in southern China generates short term extensive carbon sequestration, Nat. Commun., 11, https://doi.org/10.1038/s41467-019-13798-8, 2020.
Wang, D. C., Chen, X. N., Jiang, M. Y., Du, S. H., Xu, B. J., and Wang, J. D.: ADS-Net:An Attention-Based deeply supervised network for remote sensing image change detection, Int. J. Appl. Earth Obs., 101, https://doi.org/10.1016/j.jag.2021.102348, 2021.
Xu, R., Li, Y., Teuling, A. J., Zhao, L., Spracklen, D., Garcia-Carreras, L., Meier, R., Chen, L., Zheng, Y. T., Lin, H. Q., and Fu, B. J.: Contrasting impacts of forests on cloud cover based on satellite observations, Nat. Commun., 13, https://doi.org/10.1038/s41467-022-28161-7, 2022.
Yan, X. R., Wang, J. L., Liu, X. T., Zhao, H. Y., and Wu, Y. X.: Mining the drivers of forest cover change in the upper Indus Valley, high Asia region from 1990 to 2020, Ecol. Indic., 144, https://doi.org/10.1016/j.ecolind.2022.109566, 2022.
Yang, Y., Anderson, M., Gao, F., Hain, C., Noormets, A., Sun, G., Wynne, R., Thomas, V., and Sun, L.: Investigating impacts of drought and disturbance on evapotranspiration over a forested landscape in North Carolina, USA using high spatiotemporal resolution remotely sensed data, Remote Sens. Environ., 238, https://doi.org/10.1016/j.rse.2018.12.017, 2020.
Ygorra, B., Frappart, F., Wigneron, J. P., Moisy, C., Catry, T., Baup, F., Hamunyela, E., and Riazanoff, S.: Monitoring loss of tropical forest cover from Sentinel-1 time-series: A CuSum-based approach, Int. J. Appl. Earth Obs., 103, https://doi.org/10.1016/j.jag.2021.102532, 2021.
Zhao, Y. L., Diao, C. Y., Augspurger, C. K., and Yang, Z. J.: Monitoring spring leaf phenology of individual trees in a temperate forest fragment with multi-scale satellite time series, Remote Sens. Environ., 297, https://doi.org/10.1016/j.rse.2023.113790, 2023.
Zhu, Z. and Woodcock, C. E.: Continuous change detection and classification of land cover using all available Landsat data, Remote Sens. Environ., 144, 152–171, https://doi.org/10.1016/j.rse.2014.01.011, 2014.