the Creative Commons Attribution 4.0 License.
the Creative Commons Attribution 4.0 License.
 | 26 Feb 2026
Rapidly changing lake-terminating glaciers in High Mountain Asia: a dataset from 1990 to 2022
Yunyi Luo
Xueyuan Lu
Yongsheng Yin
Jiawei Yang
Xuyang Lu
Lake-terminating glaciers (LTGs) typically exhibit higher rates of retreat and thinning compared to land-terminating glaciers. However, a comprehensive inventory for LTGs and their associated proglacial lakes across High Mountain Asia (HMA) is currently lacking, limiting further understanding of their spatial heterogeneity in glacier change. This study employs a semi-automated identification method, coupled with rigorous visual inspection, to construct a comprehensive inventory of LTGs and proglacial lakes in HMA for 1990 and 2022. Our data indicate that, by 2022, HMA hosted 1740 LTGs (5082.08 ± 13.15 km2), among which 667 glaciers (3454.59 ± 12.43 km2) remained in contact with proglacial lakes since 1990, 1073 (1627.49 ± 4.30 km2) are newly developed and 468 (960.13 ± 3.18 km2) had disconnected from proglacial lakes during the investigation period. Accordingly, 645 proglacial lakes (207.18 ± 0.82 km2) remained in contact with ice, 1123 new lakes (54.85 ± 0.35 km2) formed, and 485 lakes (45.31 ± 0.34 km2) detached from ice (including 25 disappeared). During the past 32 years, the total area of proglacial lakes increased by 138.19 ± 1.18 km2 (81.7 %), alongside a glacier area loss of 324.43 ± 19.23 km2 (5.1 %). The southern regions of HMA, particularly the Hindu Kush, Himalayas, Nyainqentanglha, and Gangdise Mountains, exhibited the highest concentration and most rapid changes of the glacier-lake system. We hope that this dataset will improve our understanding of mountain glacier-lake interactions, water availability, as well as glacier-related hazards in HMA.
The dataset is openly available in GeoPackage format, with full attribute tables compliant with the RGI 7.0 vocabulary, and is hosted on Zenodo at https://doi.org/10.5281/zenodo.17369580 (Luo and Liu, 2025).
- Article
(15949 KB) - Full-text XML
-
Supplement
(1033 KB) - BibTeX
- EndNote


Proglacial lakes in direct contact with glacier termini play a critical role in glacier evolution (Liu et al., 2020; Truffer and Motyka, 2016; Chernos et al., 2016) and are a primary driver of spatial heterogeneity in glacier responses to climate change (Brun et al., 2019; Maurer et al., 2019). Proglacial lakes typically form behind end or lateral moraines, on debris-covered glaciers often developed through the coalescence of multiple supraglacial ponds near the glacier terminus (Carrivick and Tweed, 2013; Quincey et al., 2007; Mertes et al., 2017). The influence of lake water on glacier change operates primarily through two mechanisms: (1) thermal undercutting by lake water (Truffer and Motyka, 2016) and calving at the glacier front (Benn et al., 2007a), which together accelerate subaquatic and frontal ablation; and (2) when glacier termini come into contact with sufficiently deep water, the buoyancy of the lake reduces basal effective pressure, thereby enhancing glacier flow and dynamic thinning (Sugiyama et al., 2011; Sutherland et al., 2020; Benn et al., 2007b). Observations indicate that LTGs in High Mountain Asia (HMA) have mass loss rates 18 %–97 % higher than the regional average (Brun et al., 2019), and under comparable geographic conditions, their surface velocities are typically two- to threefold greater than those of land-terminating counterparts (Pronk et al., 2021; Tsutaki et al., 2019). Furthermore, Zhang et al. (2023) reported that existing geodetic methods, by failing to account for the replacement of glacier ice by lake water, underestimate the mass loss of Himalayan LTGs by approximately 6.5 %.
HMA, encompassing the entire Tibetan Plateau and its surroundings contains the largest concentration of mid-latitude mountain glaciers on Earth. Driven by ongoing global warming, glaciers in HMA have undergone a persistent negative mass balance, with an average mass loss rate of −20.1 Gt a−1 during 2000–2019 (Hugonnet et al., 2021). Glacier meltwater has driven substantial runoff and facilitated the formation and expansion of glacial lakes. From 1990 to 2018, the number of glacial lakes in HMA increased by 11 %, and their total area expanded by 15 % (Wang et al., 2020). The ongoing increase in both the number and extent of proglacial lakes underscores the critical need for a comprehensive assessment of lake-terminating glacier-proglacial lake systems in HMA. Such an evaluation is essential for elucidating feedback between the lake and ice, forecasting their responses to future climate change, and informing evidence-based strategies for water resource management and disaster risk mitigation. Although several regional-scale glacial lake inventories have been published in recent years (Wang et al., 2020; Chen et al., 2021; Zhang et al., 2015; Worni et al., 2013; Salerno et al., 2012; Shugar et al., 2020), most datasets do not distinguish the contact status and its change between glaciers and proglacial lakes. Moreover, there is currently no comprehensive inventory of lake-terminating glacier-proglacial lake systems covering the entire HMA, and their spatiotemporal evolution remains poorly understood. Therefore, this study aims to construct a dataset of LTGs and proglacial lakes for HMA based on multi-source remote sensing data, thereby filling this research gap and providing a fundamental database to support studies on regional glacier change, water resource assessment, disaster management, and glacier hydrology.
High Mountain Asia (HMA), encompassing the Tibetan Plateau and its surrounding ranges – including the Himalayas, Karakoram, and Pamir Plateau, etc. – constitutes the most glacier-rich region in the mid-latitudes (Fig. 1). HMA lies between 26–45° N and 67–105° E. It has an average elevation of approximately 4500 m (SRTM DEM). The region features a complex topography. This topography is characterized by higher elevations in the northwest and lower elevations in the southeast. It comprises a network of interwoven mountain ranges, valleys, and river systems. The dominant orographic orientation is east-west. The Tanggula Shan, located in the central part of the region, rises above 6000 m, while the Himalayas contain 15 peaks exceeding 8000 m, and most peaks on the northern plateau surpass 6500 m. North-south trending ranges are mainly distributed in the southeastern Tibetan Plateau and the Hengduan Shan, forming the geomorphological framework of the region and controlling the overall topographic configuration of the plateau.
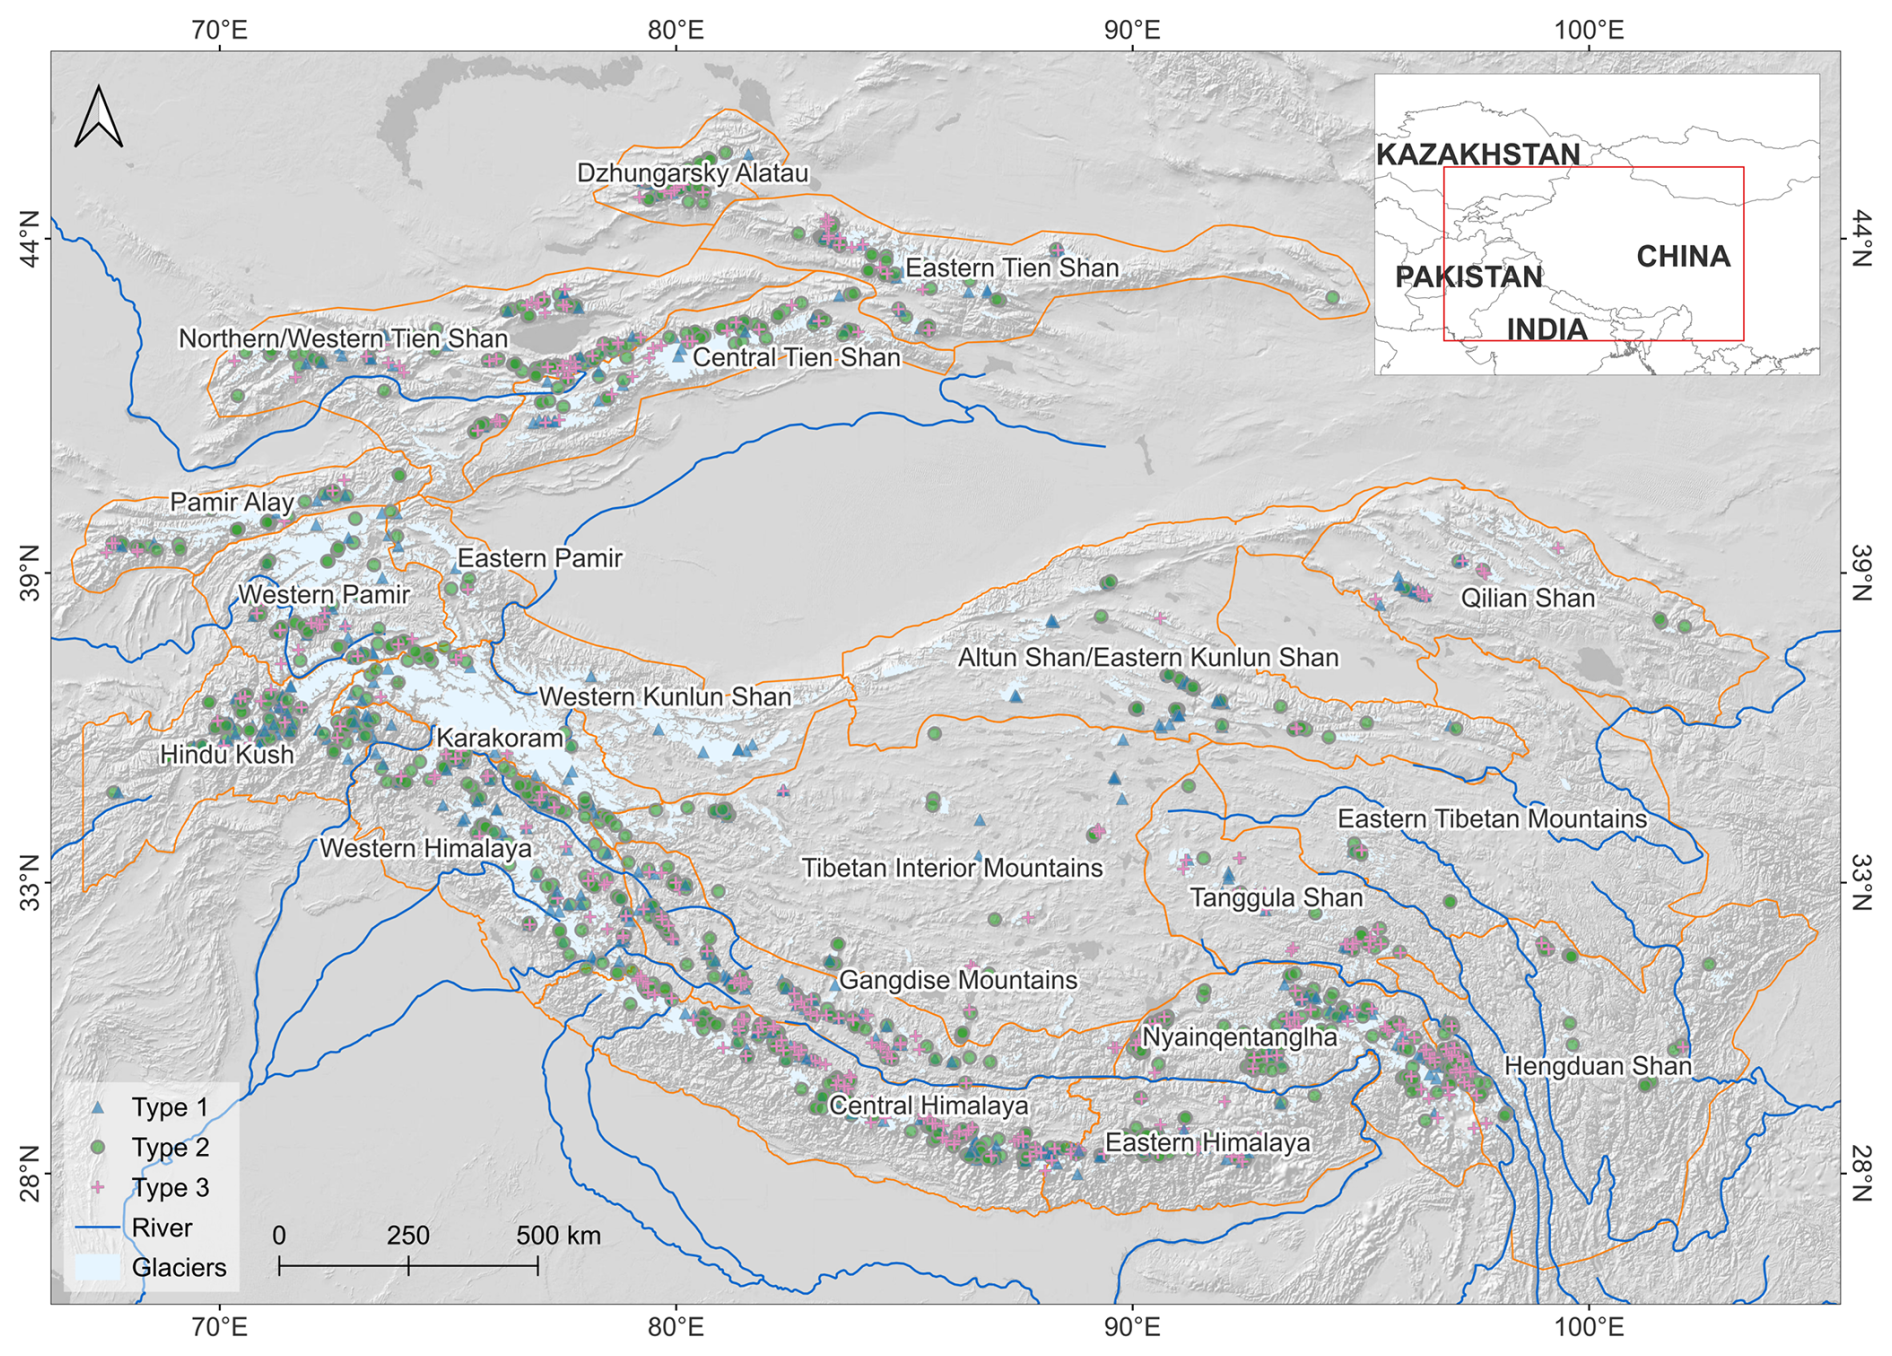
Figure 1Location of HMA and distribution of LTGs. Glacier outlines from the Randolph Glacier Inventory (RGI v7.0). Types of LTGs are shown in Table 1. Basemap is Powered by Esri.
Climatically, HMA lies in the transition zone between the midlatitude westerlies and the Asian monsoon systems, leading to pronounced seasonal and spatial contrasts (Yao et al., 2012). In general, the southern and eastern sectors receive most precipitation during the summer monsoon, whereas the northern and western sectors are more strongly influenced by the westerlies, with overall drier conditions and a larger contribution from cold-season precipitation (Khanal et al., 2023). This pronounced hydroclimatic gradient produces highly heterogeneous patterns of glacier accumulation and ablation across the region. HMA is the headwater region for several major Asian rivers, including the Yellow River, Yangtze River, Yarlung Tsangpo, Indus, Ganges, Salween, Mekong, and Irrawaddy, and thus plays an important role in downstream hydrology and water resources. According to the Randolph Glacier Inventory (RGI 7.0), HMA contains 131 761 modern glaciers with a total area of approximately 99 625.7 km2, making it the most extensively glacierized region outside polar areas. The Karakoram hosts the largest number of glaciers, totalling 13 988, and accounts for the largest share of glacier area at 29 %. In contrast, the eastern Tibetan Plateau contains the fewest glaciers, with 819. The Eastern Tibetan Mountains represent the lowest glacier-area share, at 0.1 %. Most glaciers in HMA are undergoing retreat (Brun et al., 2017; Hugonnet et al., 2021). However, slight mass gains have been observed in parts of the Karakoram and western Kunlun ranges (Gardelle et al., 2012; Kääb et al., 2015), though recent studies suggest this trend may be diminishing (Hugonnet et al., 2021). Glacial lakes are also widespread across HMA. Based on a recent manually interpreted inventory (Wang et al., 2020), 27 205 and 30 121 glacial lakes were mapped in 1990 and 2018, with total areas of 1806.47 ± 2.11 km2 and 2080.12 ± 2.28 km2, respectively. This inventory includes the Altai and Sayan region, which is not part of our HMA definition. The largest glacial lake areas were concentrated in the Altai and Sayan (335.42 ± 0.88 km2, 16.1 % of the total) and the eastern Himalaya (310.37 ± 0.89 km2, 14.9 %). In contrast, relatively small lake areas were found in the eastern Kunlun and Qilian Shan (38.85 ± 0.29 km2, 1.9 %) and the eastern Tien Shan (40.55 ± 0.32 km2, 2.0 %). Over 1990–2018, glacial lakes across HMA experienced widespread areal expansion, with an average increase of 15.2 %
3.1 Extraction of proglacial lake outlines
Before developing a comprehensive inventory of LTGs shown in Fig. 1, we first generated a proglacial lake dataset using an automated delineation workflow within the Google Earth Engine (GEE) platform (Fig. 2). We used Landsat imagery from the Thematic Mapper (TM) and Operational Land Imager (OLI) sensors, selected for their long-term record (since 1972), 30 m resolution, global coverage, and open access. All images were pre-processed in GEE, including radiometric, atmospheric, and geometric corrections. To minimize seasonal variability and the presence of snow and ice, we selected images acquired from July to November. Two-time windows were defined: 1990 ± 2 years (historical) and 2022 ± 1 year (recent). Due to limited image availability around 1990, imagery from 1993 to 1996 was used to supplement data gaps. A 2 km buffer around each glacier was applied to focus on potential ice-contact proglacial lakes. Cloud contamination was reduced using the CFMask algorithm (Foga et al., 2017) to detect and mask clouds and shadows, followed by compositing cloud-free mosaics (Fig. 3a, b). In total, 4570 Landsat TM scenes were used for the 1990 period and 5493 OLI scenes for the 2022 period (Fig. 3c, d).
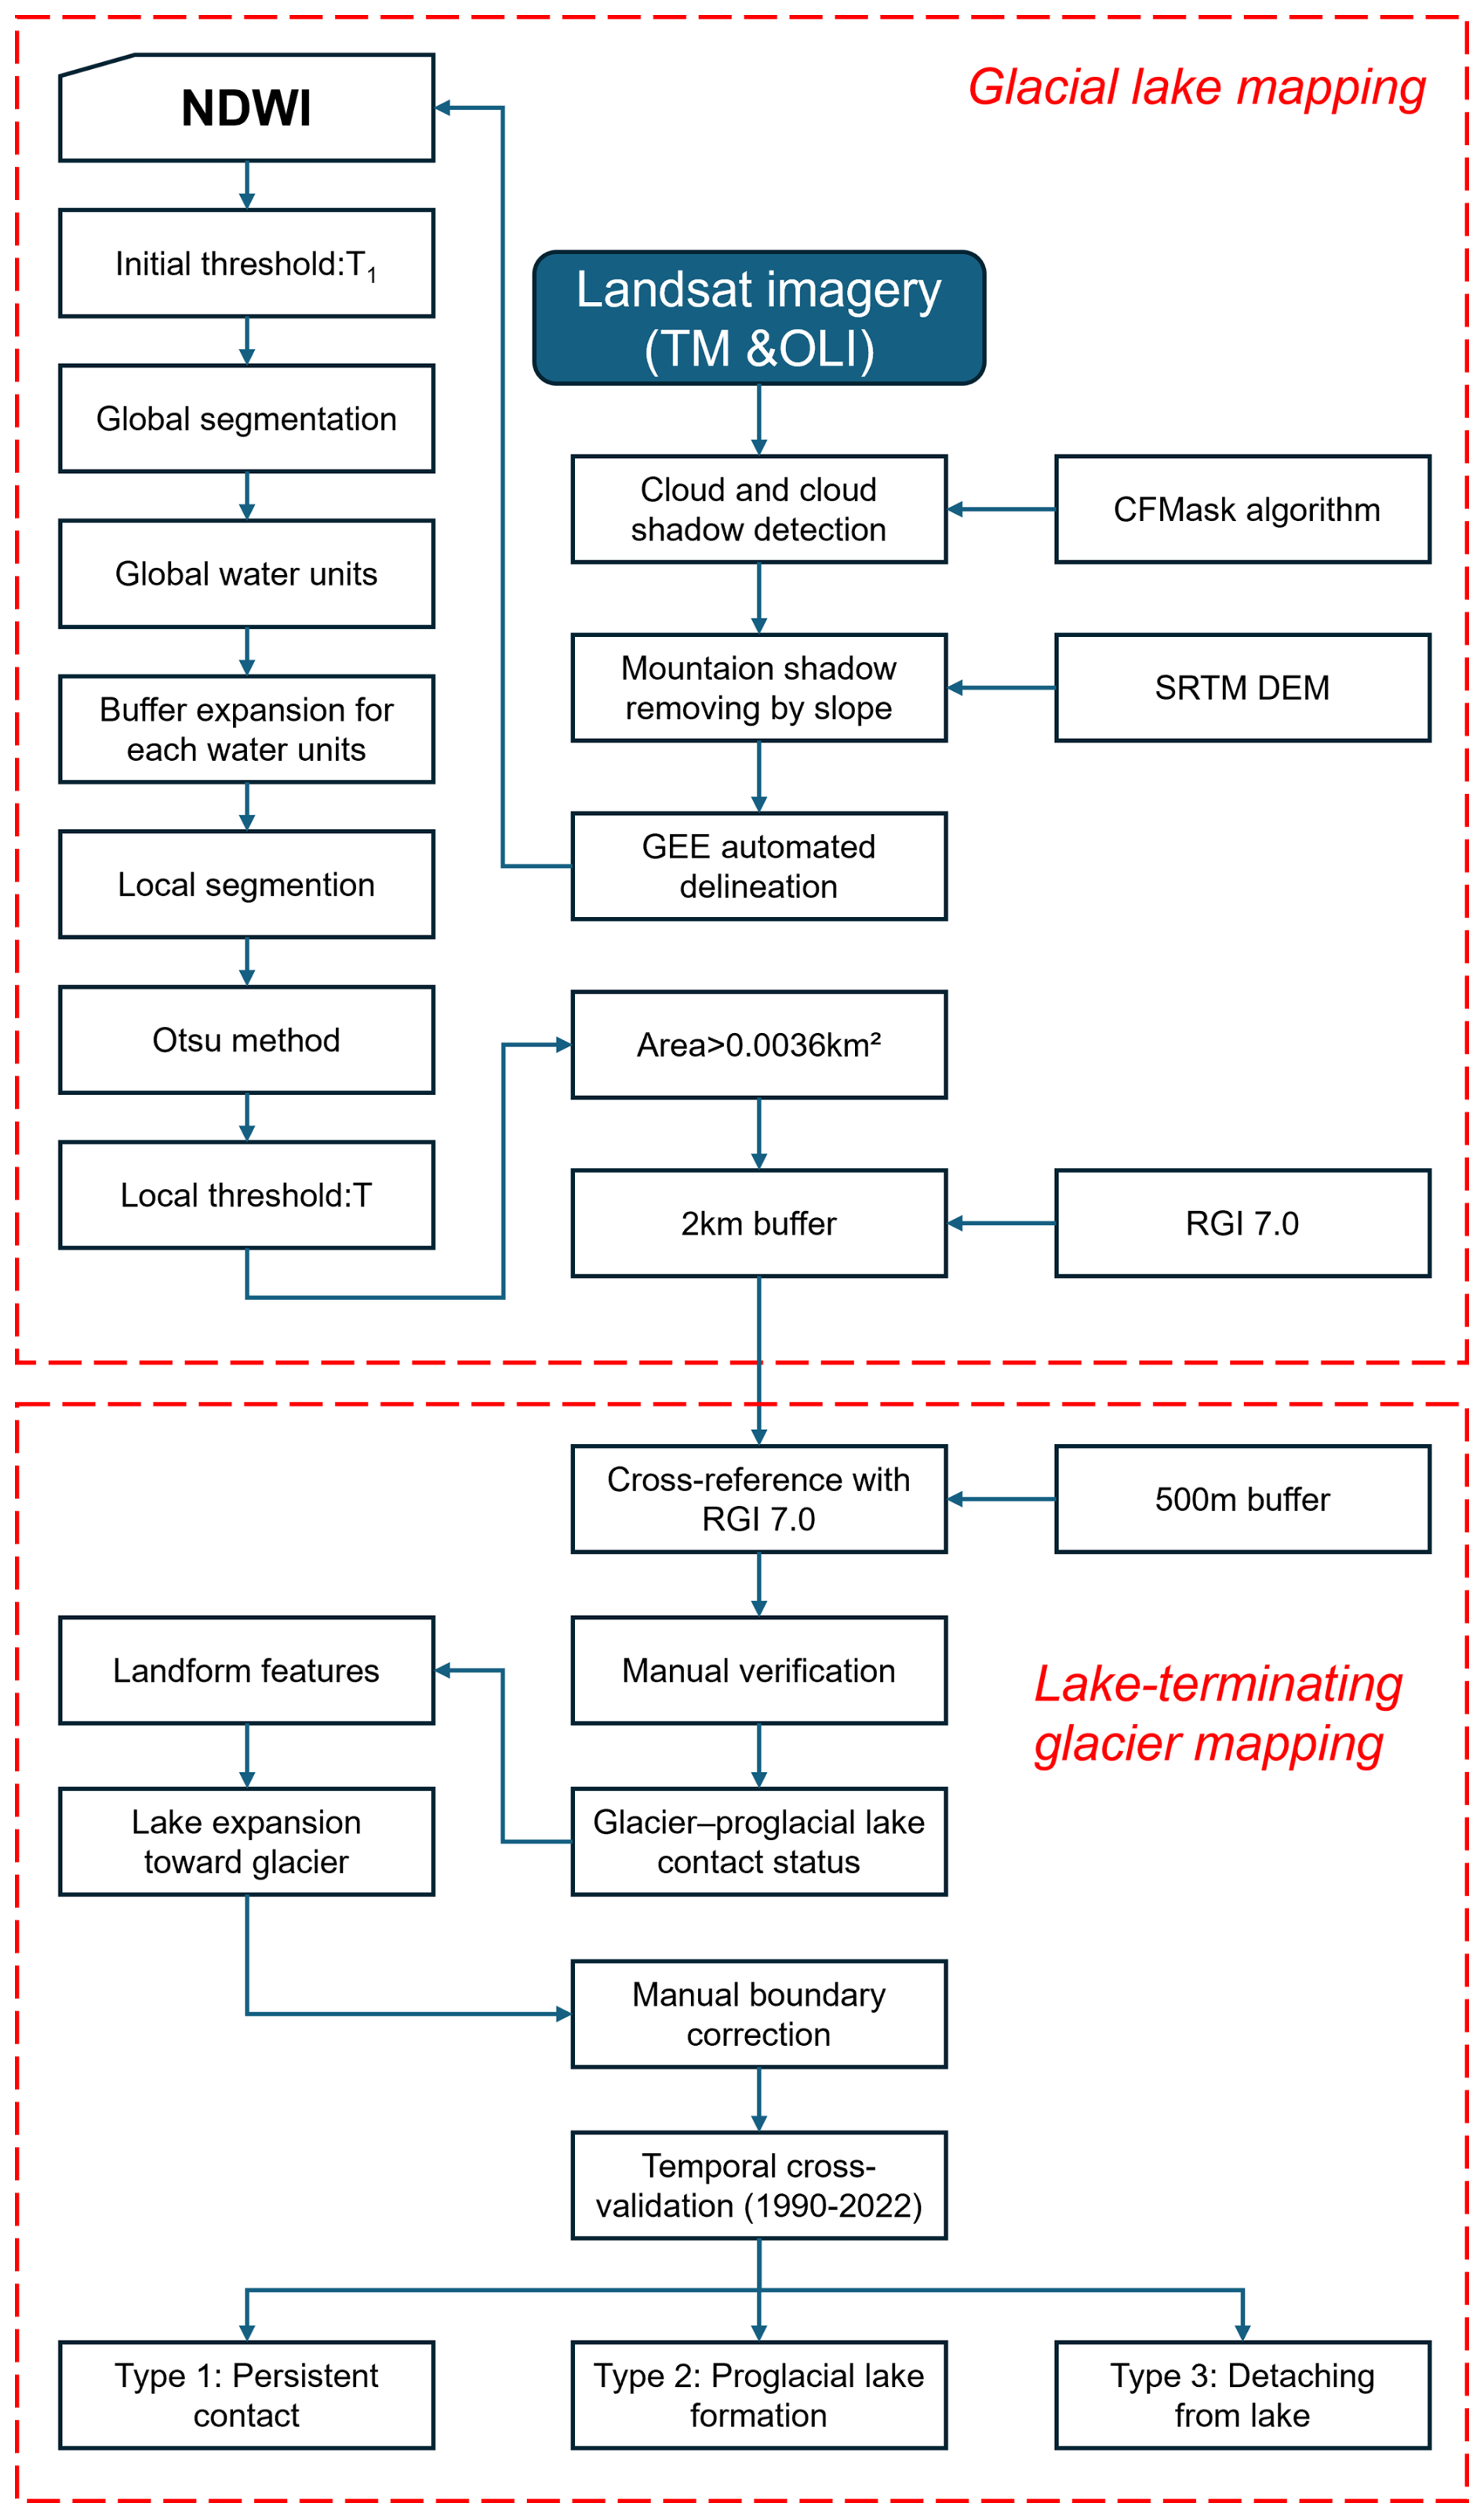
Glacial lake extents were delineated using an automated mapping algorithm based on hierarchical image segmentation and terrain analysis (Li and Sheng, 2012; Zhang et al., 2017). To reduce the influence of mountain shadows, pixels with slopes > 20° or shaded relief values < 0.25 were excluded (Zheng et al., 2021b). Previous studies applied varying minimum area thresholds for glacial lake identification: 0.0054 km2 (Wang et al., 2020), 0.0081 km2 (Chen et al., 2021), 0.0036 km2 (Luo et al., 2020), and 0.01 km2 (Li et al., 2020). Smaller thresholds can lead to greater uncertainties due to the limitations of pixel resolution (Salerno et al., 2012). To improve the accuracy of lake-terminating glacier identification, we adopted a minimum lake area threshold of 0.0036 km2 (equivalent to at least four pixels), following Luo et al. (2020).
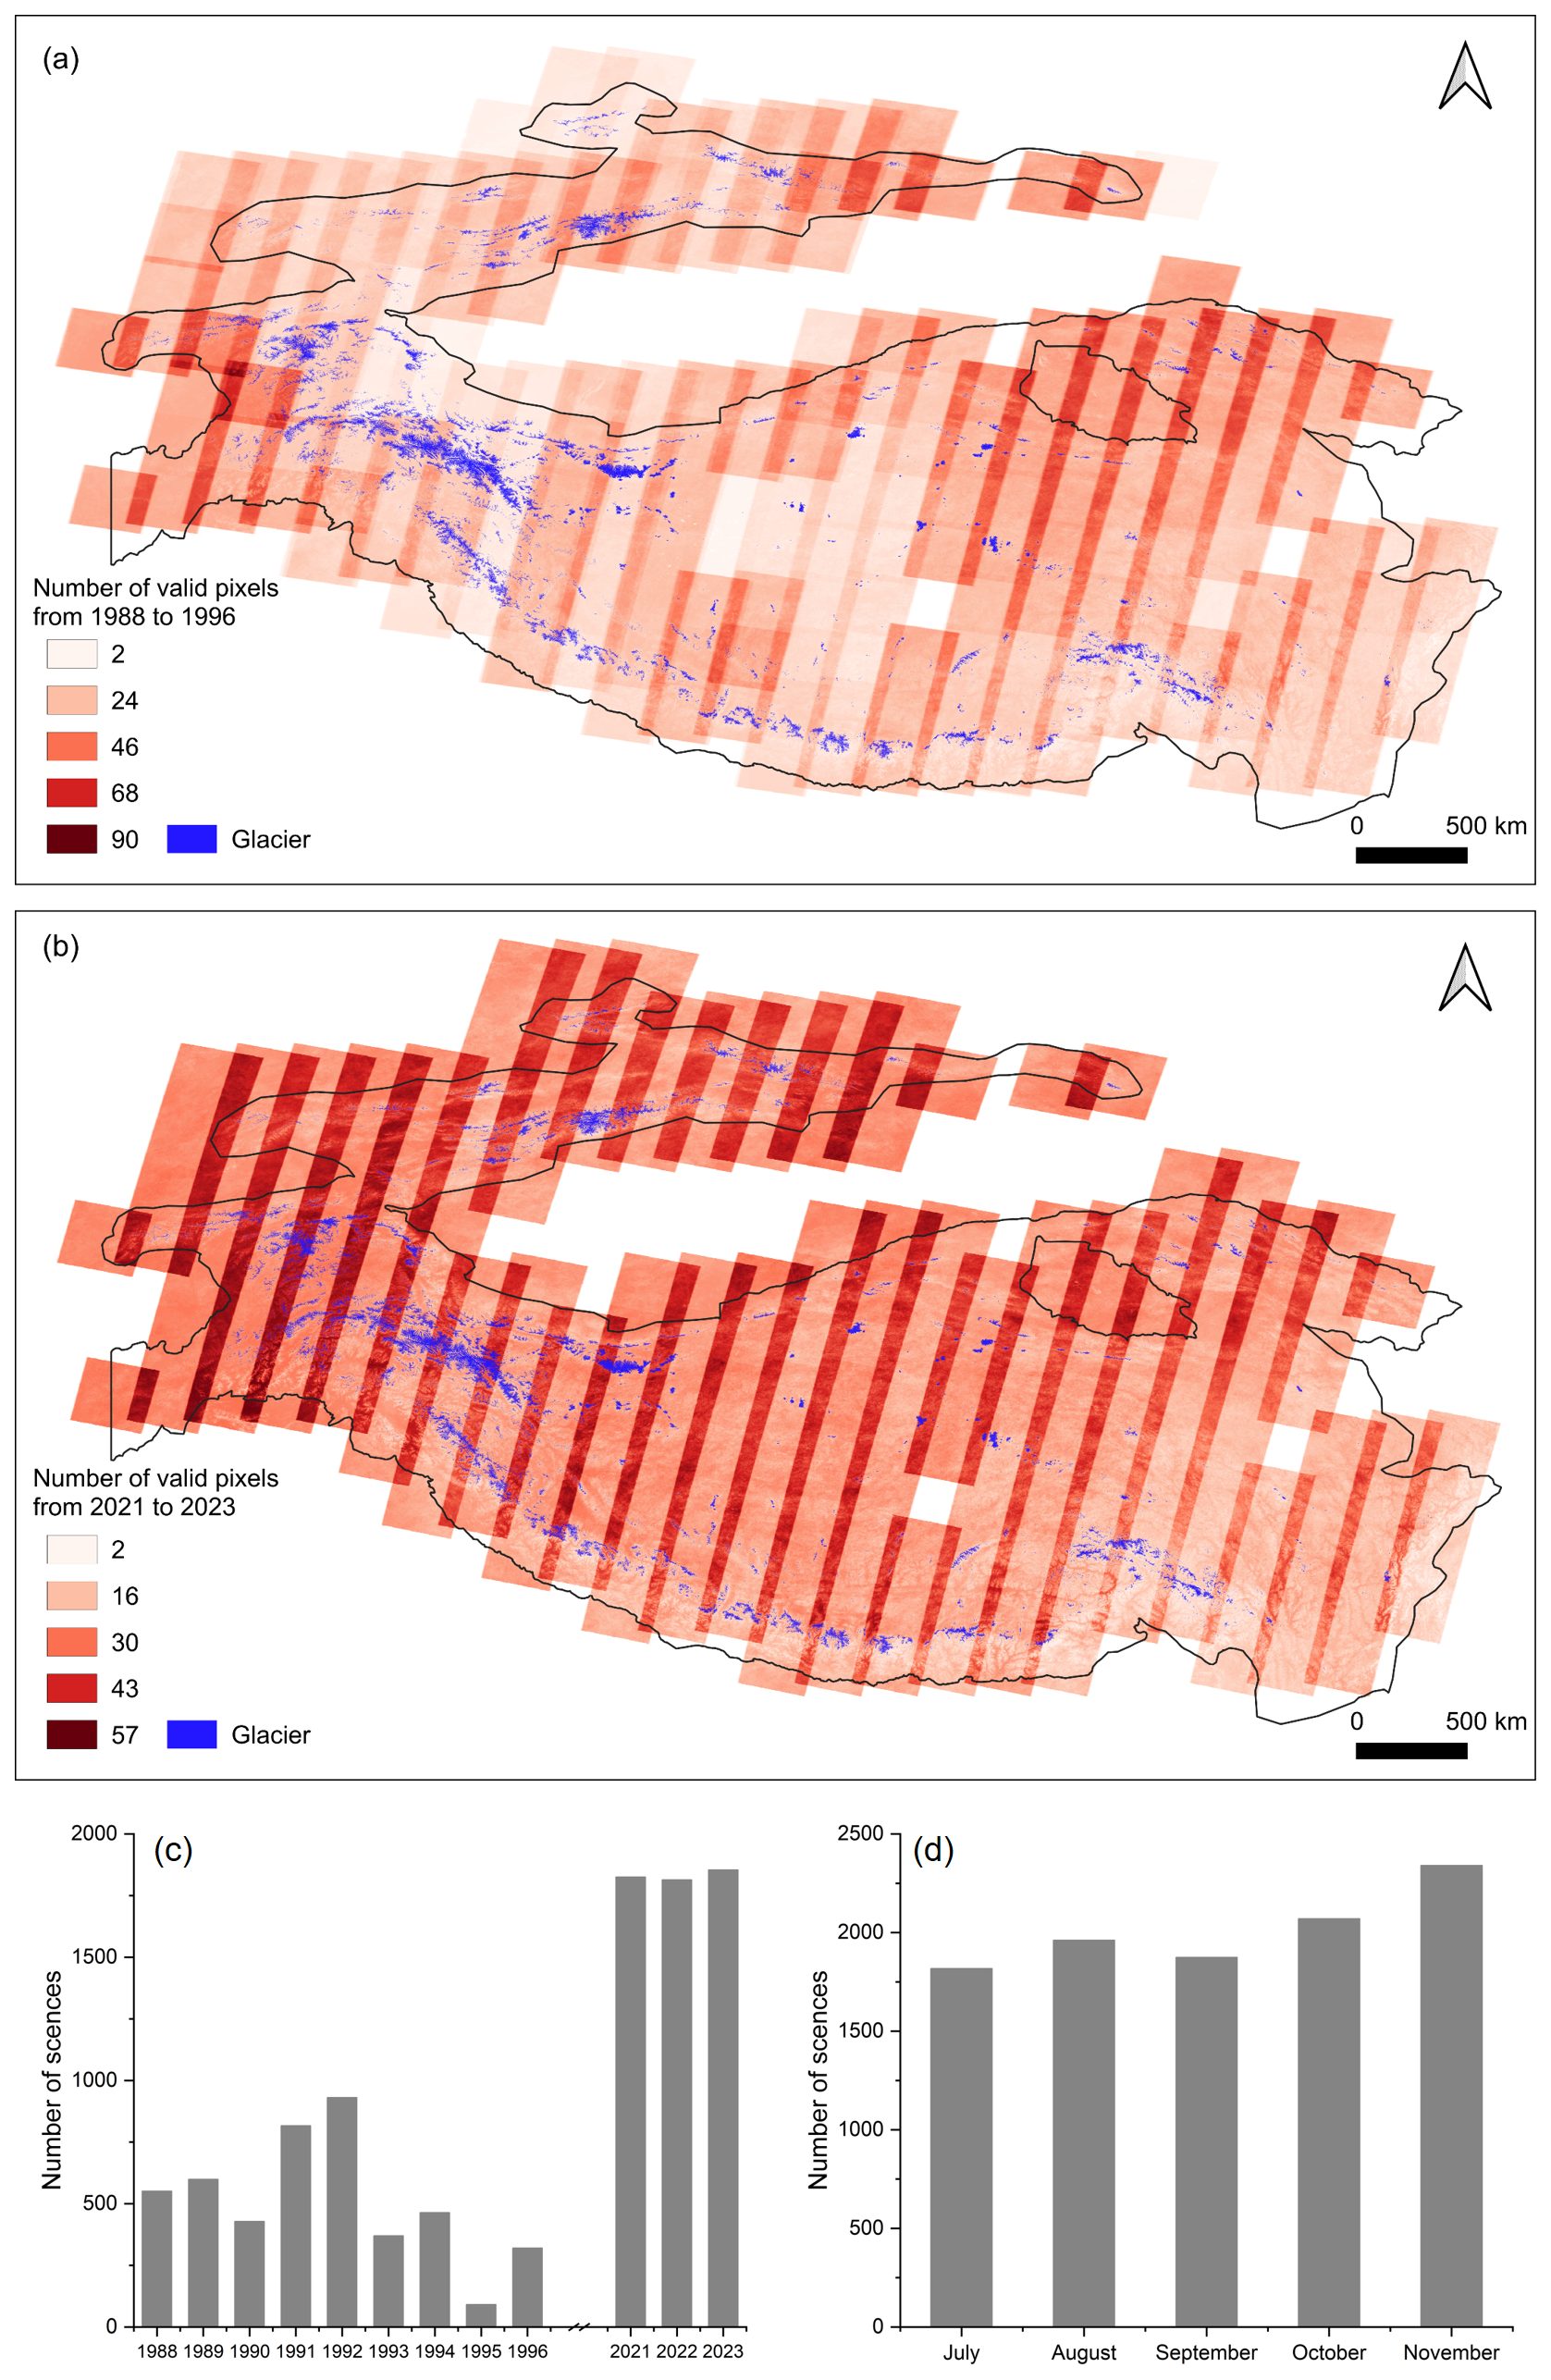
Figure 3The number of usable pixels remaining in the study area after cloud removal during 1988–1996 (a) and 2021–2023 (b). Temporal distribution of the number of images used, by year (c) and by month (d).
3.2 Mapping of LTGs
In this study, LTGs are defined as glaciers that develop proglacial lakes along the direction of ice flow and are in direct contact with these lakes. The proglacial lake dataset was cross-referenced with the RGI 7.0 glacier inventory to identify LTGs. Results were refined through detailed visual inspection and manual correction using multi-source data, including Landsat and PlanetScope imagery, online maps (e.g., Google Earth, Esri basemap), and existing glacial lake datasets (Wang et al., 2020; Chen et al., 2021; Zhang et al., 2023). The identification of glacier-lake contact followed a two-step procedure. (1) Preliminary screening: A 500 m buffer was applied to assess spatial intersections between glacier boundaries and proglacial lakes, identifying potentially connected glacier-lake pairs. (2) Manual verification: Different criteria were applied for different periods. For the year 2022, multi-source moderate-to-high resolution imagery (e.g., PlanetScope, Landsat, Google Earth, Esri basemaps) was used. Glacier-lake contact was confirmed when proglacial lakes overlapped with the glacier terminus and exhibited diagnostic geomorphic features, such as terminal ice cliffs or transverse crevasses perpendicular to the flow direction. Due to limited data availability and the relatively coarse spatial resolution of Landsat imagery (30 m) in 1990, direct identification of LTGs for that year involved considerable uncertainty, particularly for small glaciers, where boundary errors increase with decreasing glacier area. To address this, a temporal cross-validation approach was employed. Glaciers with ambiguous contact in 1990 were classified as interacting if satellite imagery from 1990 to 2022 showed lake expansion toward the glacier terminus. Based on the temporal evolution of glacier-lake contact, LTGs were categorized into three types (Fig. 4): (1) terminus persistent contacting with proglacial lake (Type 1); (2) terminus experiencing transition from supraglacial lake to proglacial lake (Type 2); and (3) terminus detaching from proglacial lake (Type 3).
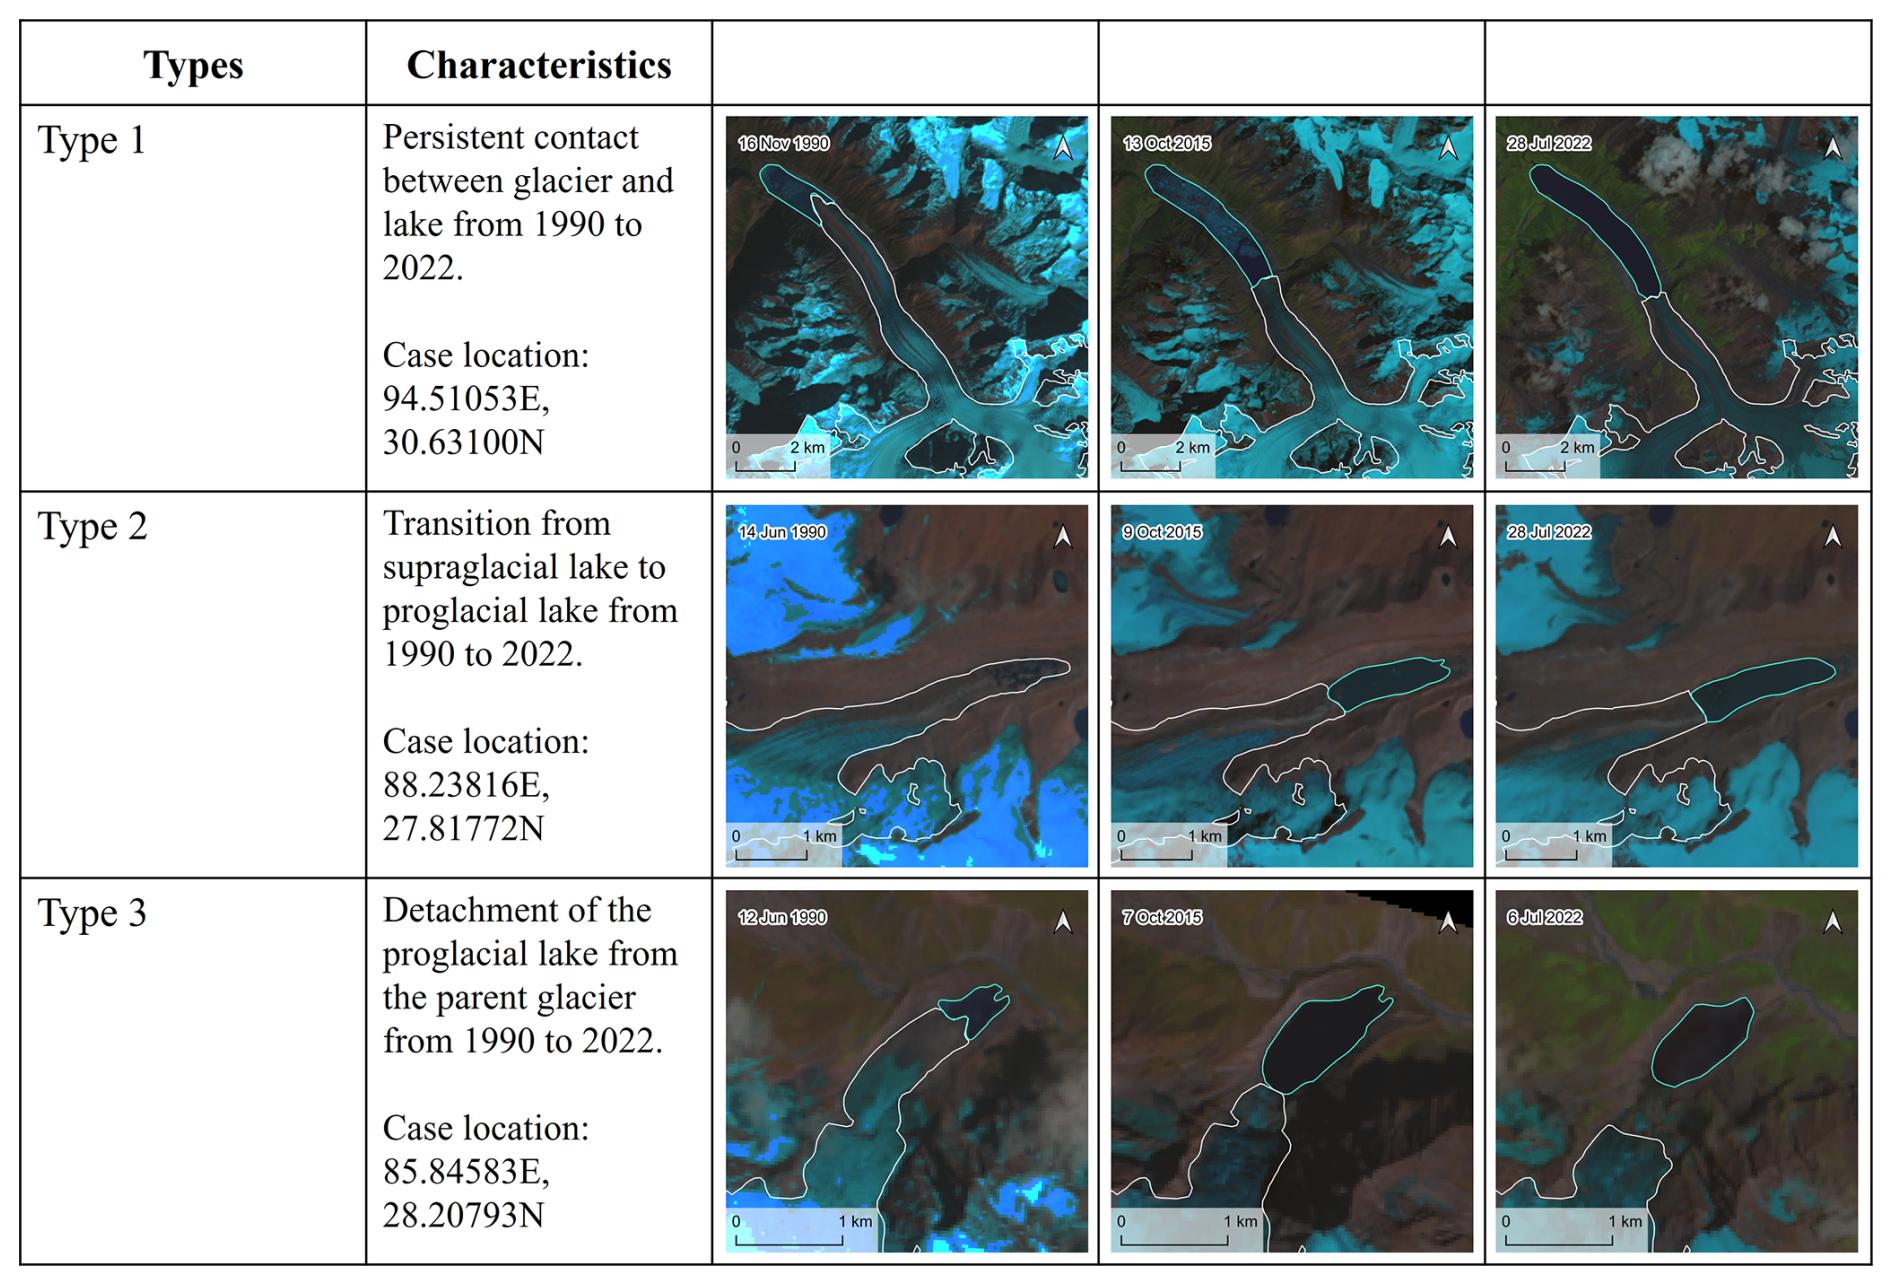
Figure 4The classification system of glaciers is based on the dynamic changes in glacier–lake contact. The basemap is derived from Landsat imagery.
3.3 Uncertainty estimates
When interpreting glacial lake and glacier boundaries using remote sensing data, errors are inevitable even when manual visual delineation is applied. These errors are typically associated with various factors related to image quality, such as spatial resolution, cloud cover, mountain shadows, and subjective interpretation biases. Previous studies have reported that the area error in delineating glacier or glacial lake boundaries from remote sensing imagery is approximately ±0.5 pixels, depending on the quality of the imagery. The uncertainty (δ) and relative error (El) of glacial lake area was estimated using the equations (Hanshaw and Bookhagen, 2014):
where P is the perimeter of the glacial lake, and A is the glacial lake area.
The uncertainty (λ) and relative error (Eg) in glacier area were estimated using the equation (Bolch et al., 2010):
where N is the total count of pixels along the outline of ice coverage, G is the spatial resolution of the images used, and S is the glacier area.
3.4 Attributes of inventory data
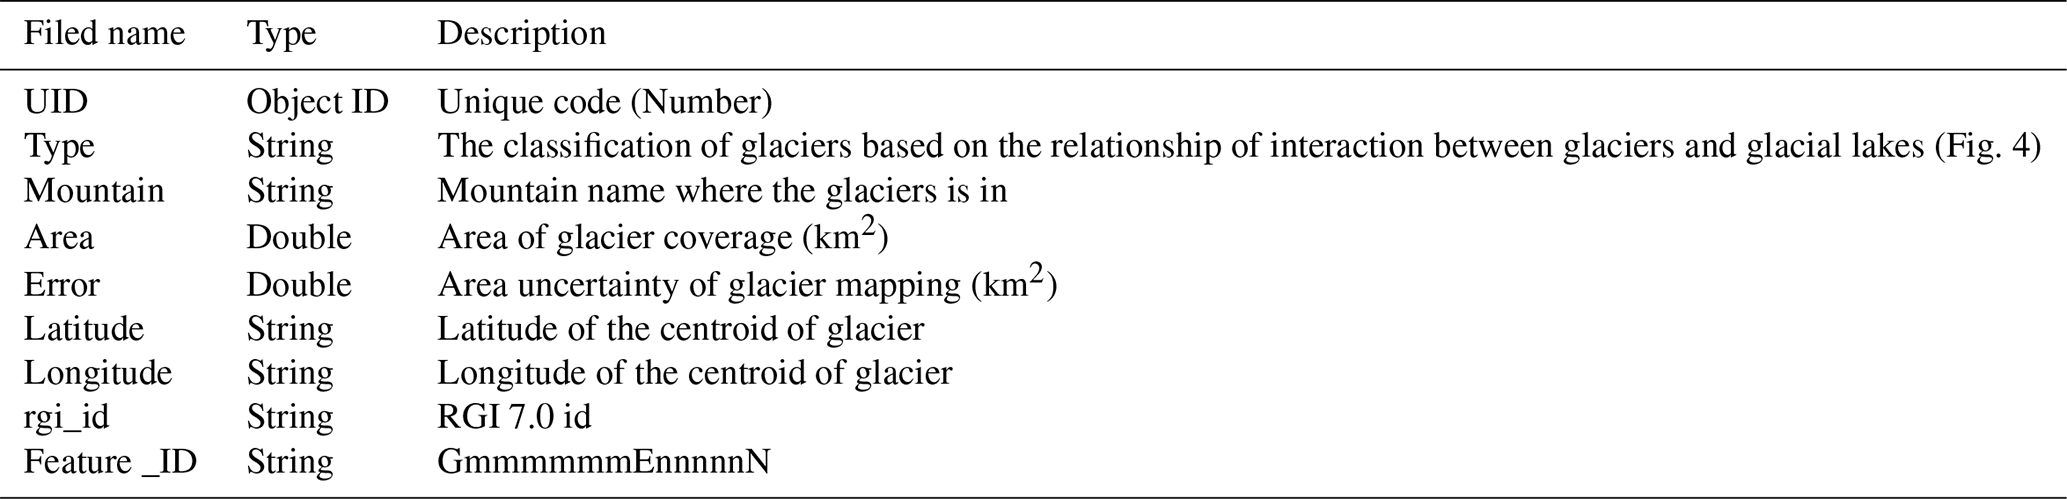
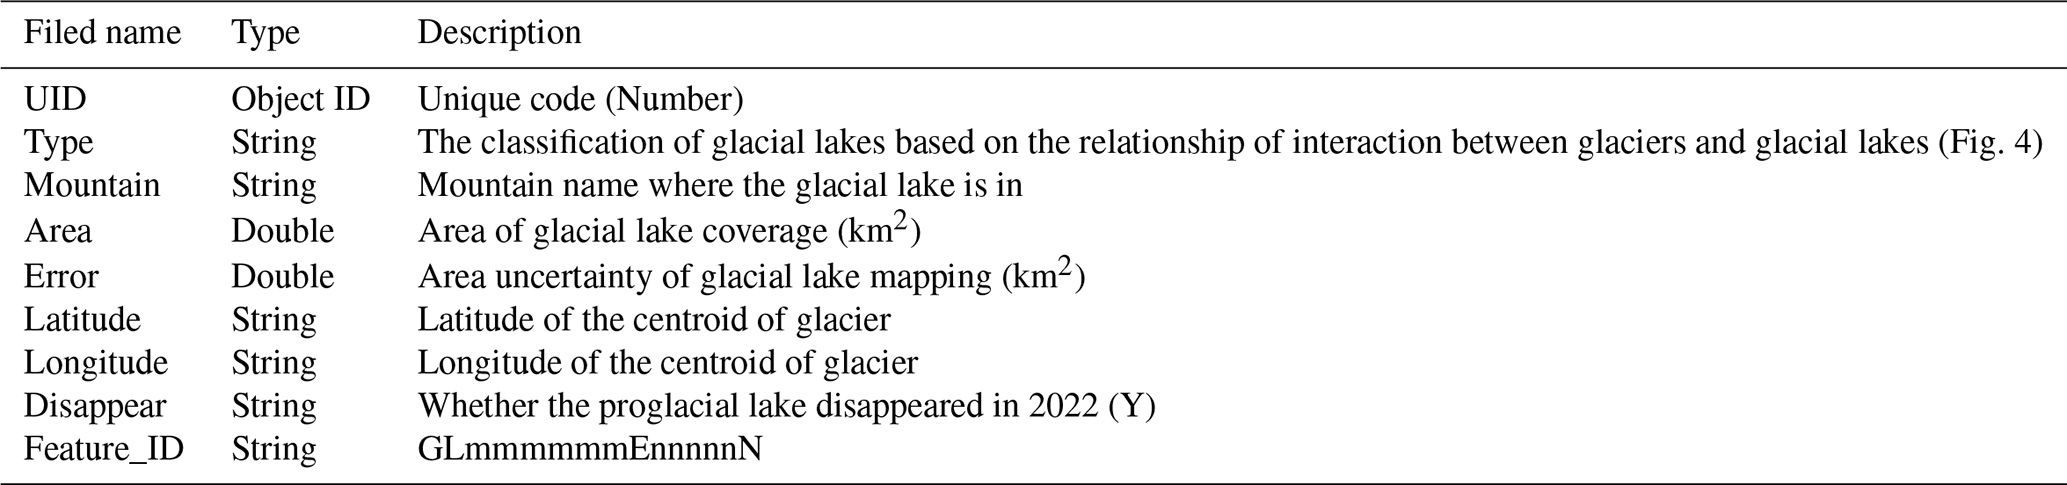
In this inventory, 9 attribute fields (Table 1) were recorded for the LTG, including a unique identifier, type, associated mountain range, area, mapping uncertainty, location (longitude and latitude), RGI7 ID, and feature code. Similarly, the proglacial lake inventory contains 9 attribute fields (Table 2), including a unique identifier, associated mountain range, type, mapping uncertainty, location (longitude and latitude), feature code, and a flag indicating whether the lake has disappeared. Both LTG and proglacial lake datasets include data for two time periods: 1990 and 2022, with identical attributes for both periods. The unique identifier is an automatically generated sequential integer, while the feature code follows the formats GmmmmmmEnnnnnN (Feature_ID) for glaciers and GLmmmmmmEnnnnnN (Featrue_ID) for lakes, where G denotes glacier, GL denotes glacial lake, m and n represent the longitude and latitude multiplied by 1000, respectively, and E and N indicate east longitude and north latitude. Identical LTGs and proglacial lakes share the same feature code (Feature_ID) to facilitate data linkage. Area and perimeter are calculated automatically from the feature geometry. The type of classification follows the criteria described in Sect. 3.2. Each feature's associated mountain range is determined by overlaying with mountain range boundaries, and mapping uncertainty is estimated according to Sect. 3.3.
4.1 Spatial distribution of LTGs and proglacial lakes
Based on the changes in glacier-proglacial lake contact relationships from 1990 to 2022, glaciers were classified into three types (Fig. 4). Among them, Type 1 and Type 2 glaciers remained in contact with proglacial lakes in 2022 and are therefore defined as LTGs. In contrast, Type 3 glaciers had become disconnected from proglacial lakes by 2022. Accordingly, only Type 1 and Type 2 glaciers were included when analyzing the distribution and extent of LTGs in 2022. In 2022, a total of 1740 LTGs were identified, with a combined area of 5082.08 ± 13.15 km2. Concurrently, 1768 proglacial lakes were detected, with a total area of 262.10 ± 0.89 km2. The discrepancy between glacier and lake counts stems from multi-lake associations per glacier and the fact that some lakes were associated with two glaciers, and two lakes were in contact with three glaciers. The distribution of LTGs in HMA shows marked heterogeneity (Fig. 5). Predominantly concentrated along the southern margin, including the Himalayas, Nyainqentanglha, Gangdise Mountains, and Hindu Kush, these glaciers total 994, representing 57.13 % of the study population (Fig. 5b, Table S1). The Central Himalaya hosts the highest number, with 232 glaciers (Table S1), while the Nyainqentanglha accounts for the largest total glacier area (1001.05 ± 3.32 km2, Fig. 5c). Glaciers were classified into nine size categories, ranging from < 0.05 to > 100 km2 (Table S2). Among these, 1095 glaciers (62.93 %) are smaller than 1 km2, covering 399.05 ± 1.07 km2 (7.85 % of the total area), while 93 glaciers (5.35 %) exceed 10 km2, covering 2964.68 ± 4.85 km2 (58.34 %). Only three glaciers exceed 100 km2, spanning 785.42 ± 10.96 km2. LTGs in HMA span elevations from 2735 to 8016 m, with a mean elevation of 5074 m (Fig. 6). They are primarily concentrated between 5000 and 6000 m, where their combined area reaches 3030.2 ± 5.72 km2 (59.52 % of the total glacier area). Regional variations in elevation distribution are evident (Fig. 6). In the Central Himalaya, Eastern Himalaya, Gangdise Mountains, Tibetan Interior Mountains, and Western Kunlun Shan, glacier area peaks occur around 6000 m.
Proglacial lakes in HMA are predominantly concentrated along the southern margin, with 1010 lakes (57.09 %) in the Himalayas, Nyainqentanglha, Gangdise Mountains, and Hindu Kush (Table S3). The Central Himalayas host the most lakes (240), with the largest total area (86.91 ± 0.54 km2, Fig. 5e). Proglacial lakes were grouped into five size categories (< 0.05 to > 1 km2, Table S4 in the Supplement). Lakes smaller than 0.1 km2 are the most abundant, totaling 1384 (78.28 %) and covering a combined area of 47.12 ± 0.30 km2. Proglacial lakes in HMA span elevations from 2684 to 6012 m, with most concentrated between 5000 and 5700 m, where 748 lakes (42.34 %) cover 106.46 ± 0.59 km2. Regional variations in elevation distribution are evident (Fig. 7). In the Gangdise Mountains and Western Kunlun Shan, proglacial lake numbers and areas peak around 5700 m. Conversely, in the Hindu Kush, Nyainqentanglha, Tanggula Shan, and Western Kunlun Shan, peak lake areas occur at lower elevations than peak lake numbers (Fig. 7).
Significant variations exist in the number and area distributions among glacier types in HMA. From 1990 to 2022, Type 2 glaciers, those forming new proglacial lakes, were the most numerous (1073, Table S1), dominating in all regions except Altun Shan/Eastern Kunlun Shan, Qilian Shan, and Tanggula Shan. Conversely, Type 1 glaciers have the largest total area (3454.59 ± 12.43 km2), concentrated primarily in the Himalayas, Nyainqentanglha, Central Tien Shan, Qilian Shan, Tanggula Shan, and Western Kunlun Shan (Table S1). The Central Himalaya hosts the most glaciers across all types: 94 Type 1 (552.77 ± 2.71 km2), 138 Type 2 (244.80 ± 1.56 km2), and 84 Type 3 (202.67 ± 1.11 km2). All glacier types show consistent area peaks between 5000 and 6000 m, with similar patterns across subregions (Fig. 6). In 2022, Type 2 proglacial lakes were the most numerous in HMA (1123, Table S3), dominating in number across all regions except Altun Shan/Eastern Kunlun Shan, Qilian Shan, Karakoram, and Western Kunlun Shan. Conversely, Type 1 lakes had the largest total area (207.18 ± 0.82 km2) and accounted for the largest share of total area in all regions except the Western Pamir, Hengduan Shan, Dzhungarsky Alatau, and Eastern Tibetan Mountains. The Central Himalaya hosted the greatest abundance of all three lake types, with 91 Type 1 (76.89 ± 0.51 km2), 149 Type 2, and 80 Type 3 (15.70 ± 0.21 km2) lakes. The Eastern Himalaya had the largest Type 2 lake area (10.73 ± 0.03 km2, Table S3). In HMA, the elevation distribution of proglacial lake types is generally consistent, with peak numbers between 5000 and 5700 m and peak areas between 4700 and 5400 m (Fig. 7). However, regional variations are observed in the elevation distribution of lake numbers for different lake types. Specifically, in the Nyainqentanglha region, Type 2 proglacial lakes exhibit a higher peak number range, between 5200 and 5400 m. Regarding area-elevation patterns, certain subregions display lower peak elevations, encompassing Type 2 lakes in the Eastern Himalaya and Northern Tibetan Mountains, and Type 1 lakes in the Eastern Pamirs, Hindu Kush, Nyainqentanglha, and Tanggula Shan (Fig. 6).
4.2 Temporal changes in LTGs and proglacial lakes
From 1990 to 2022, glacier size has been continuously shrinking (Fig. 5d). The total area of all glacier types decreased by approximately 324.43 ± 19.22 km2, with Type 1 glaciers experiencing the largest absolute loss of 137.46 ± 17.62 km2, accounting for 42.37 % of the total reduction (Table S5). The Central Himalaya showed the most pronounced absolute area loss, with a decrease of 74.46 ± 3.46 km2, while the Hengduan Shan exhibited the highest relative shrinkage at 16.42 %. The Central Himalaya also recorded the largest absolute losses for all three glacier types, with reductions of 37.20 ± 3.91 km2 for Type 1, 20.13 ± 2.26 km2 for Type 2, and 17.13 ± 1.62 km2 for Type 3 glaciers. In contrast, the Hengduan Shan had the highest relative losses for all three types, at 25.34 %, 13.95 %, and 17.37 %, respectively (Table S5).
Small glaciers (< 0.5 km2) exhibited a significant increase in number, particularly those smaller than 0.05 km2, which grew by 51 in count with a total area increase of 1.68 ± 0.08 km2 (Table S6). In contrast, glaciers in the 0.5–50 km2 range showed a declining trend in number. Among them, glaciers sized 0.5–1 km2 experienced the largest numerical decrease (−57) and the greatest relative area loss (−13.56 %), while those in the 1–5 km2 range incurred the most substantial absolute area reduction, losing 97.17 ± 3.5 km2 (Table S6).
Among the different glacier types, Type 1 glaciers experienced the greatest absolute area loss, decreasing by 137.46 ± 17.62 km2 (Table S5). However, their relative area reduction of 3.83 % was the smallest among the three types. By size class (Table S6), Type 1 glaciers showed the largest loss (63.39 ± 6.38 km2) in the 10–50 km2 range; Type 2 glaciers experienced the greatest reduction (52.52 ± 2.21 km2) in the 1–5 km2 range. Type 3 glaciers showed the most significant loss (27.51 ± 1.57 km2) in the 5–10 km2 range. For all three types, the 0.5–1 km2 size class exhibited the highest relative area reduction, at 9.06 %, 15.37 %, and 15.15 %, respectively.
Between 1990 and 2022, the total area of proglacial lakes increased by 138.19 ± 1.18 km2, representing a 62.09 % expansion (Fig. 5f and Table S2). The Central Himalaya experienced the most significant absolute growth, with an increase of 42.32 ± 0.72 km2 (70.19 %), while the Western Pamirs recorded the fastest relative growth, surging by 210.24 %. The Central Himalaya also saw the largest area increases across all three glacier types, with growth of 30.42 ± 0.64 km2 for Type 1 lakes, 10.02 ± 0.16 km2 for Type 2, and 1.88 ± 0.29 km2 for Type 3. Regionally, the Dzhungarsky Alatau had the highest proportional increase in Type 1 lake area at 176.38 %, whereas the Eastern Himalaya recorded the largest proportional growth for Type 3 lakes at 29.48 % (Table S7).
During the study period, 1123 new proglacial lakes formed, while 25 lakes disappeared. The number of small proglacial lakes (< 0.5 km2) increased significantly, especially those smaller than 0.05 km2, which increased by 702 and accounted for 64.11 % of the total increase in lake numbers (Table S8). Lakes larger than 1 km2 contributed the largest increase in area (60.44 ± 0.81 km2), accounting for 43.74 % of the total area growth. Moreover, lakes smaller than 0.05 km2 had the highest proportional area growth at 114.49 %. Type 1 proglacial lakes exhibited the most significant area growth, reaching 79.36 ± 1.02 km2, with a growth rate of 62.09 %. Among size categories, the number of Type 1 lakes increased most in the 0.05–0.1 km2 range, with 49 new lakes added, while lakes larger than 1 km2 showed the greatest area increase at 52.07 ± 0.79 km2 and the highest proportional growth at 85.19 %.
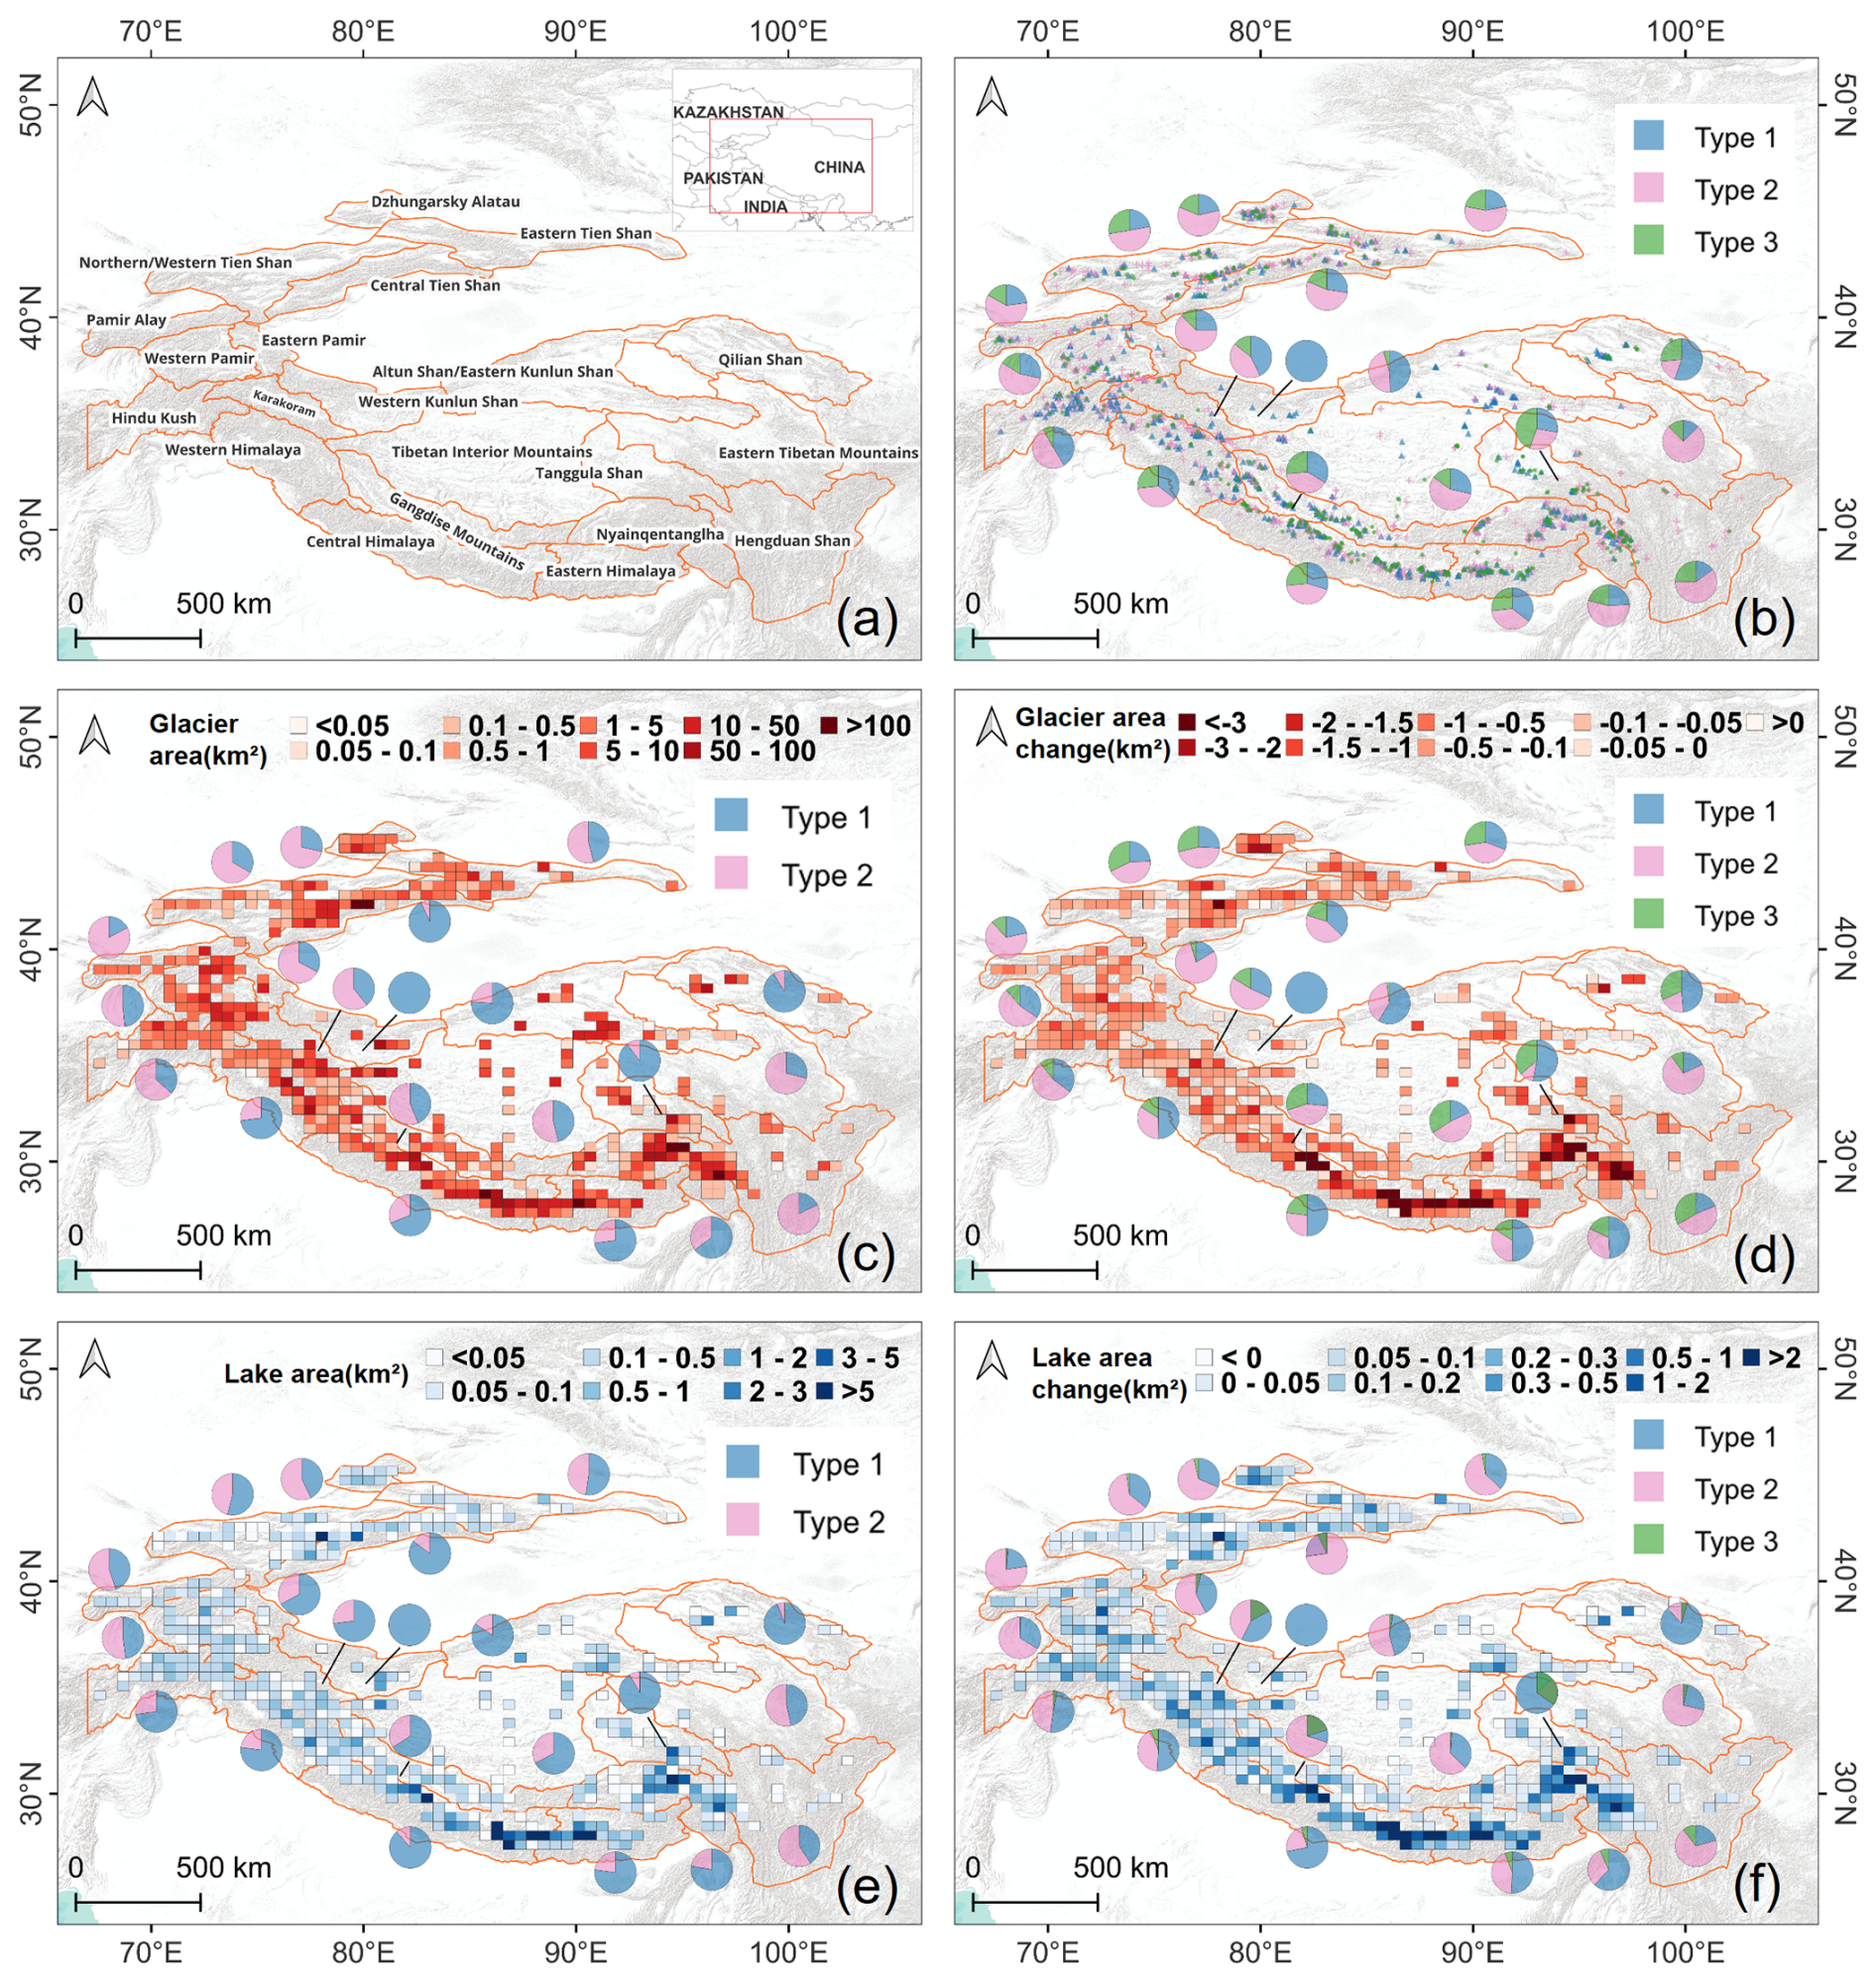
Figure 5(a) Geographic extent of the mountain ranges in HMA. (b) Distribution of the three types of LTGs in 2022 and their numerical proportions across mountain regions. (c) Size distribution (Types 1 and 2) in 2022 and their area proportions. (d) Area changes of the three types of glaciers from 1990 to 2022 and their area-change proportions across mountain regions. (e) Area distribution of proglacial lakes (associated with Types 1 and 2 glaciers) in 2022 and their area proportions across mountain regions. (f) Area changes of the three types of proglacial lakes from 1990 to 2022 and their area-change proportions across mountain regions. Basemap is Powered by Esri.
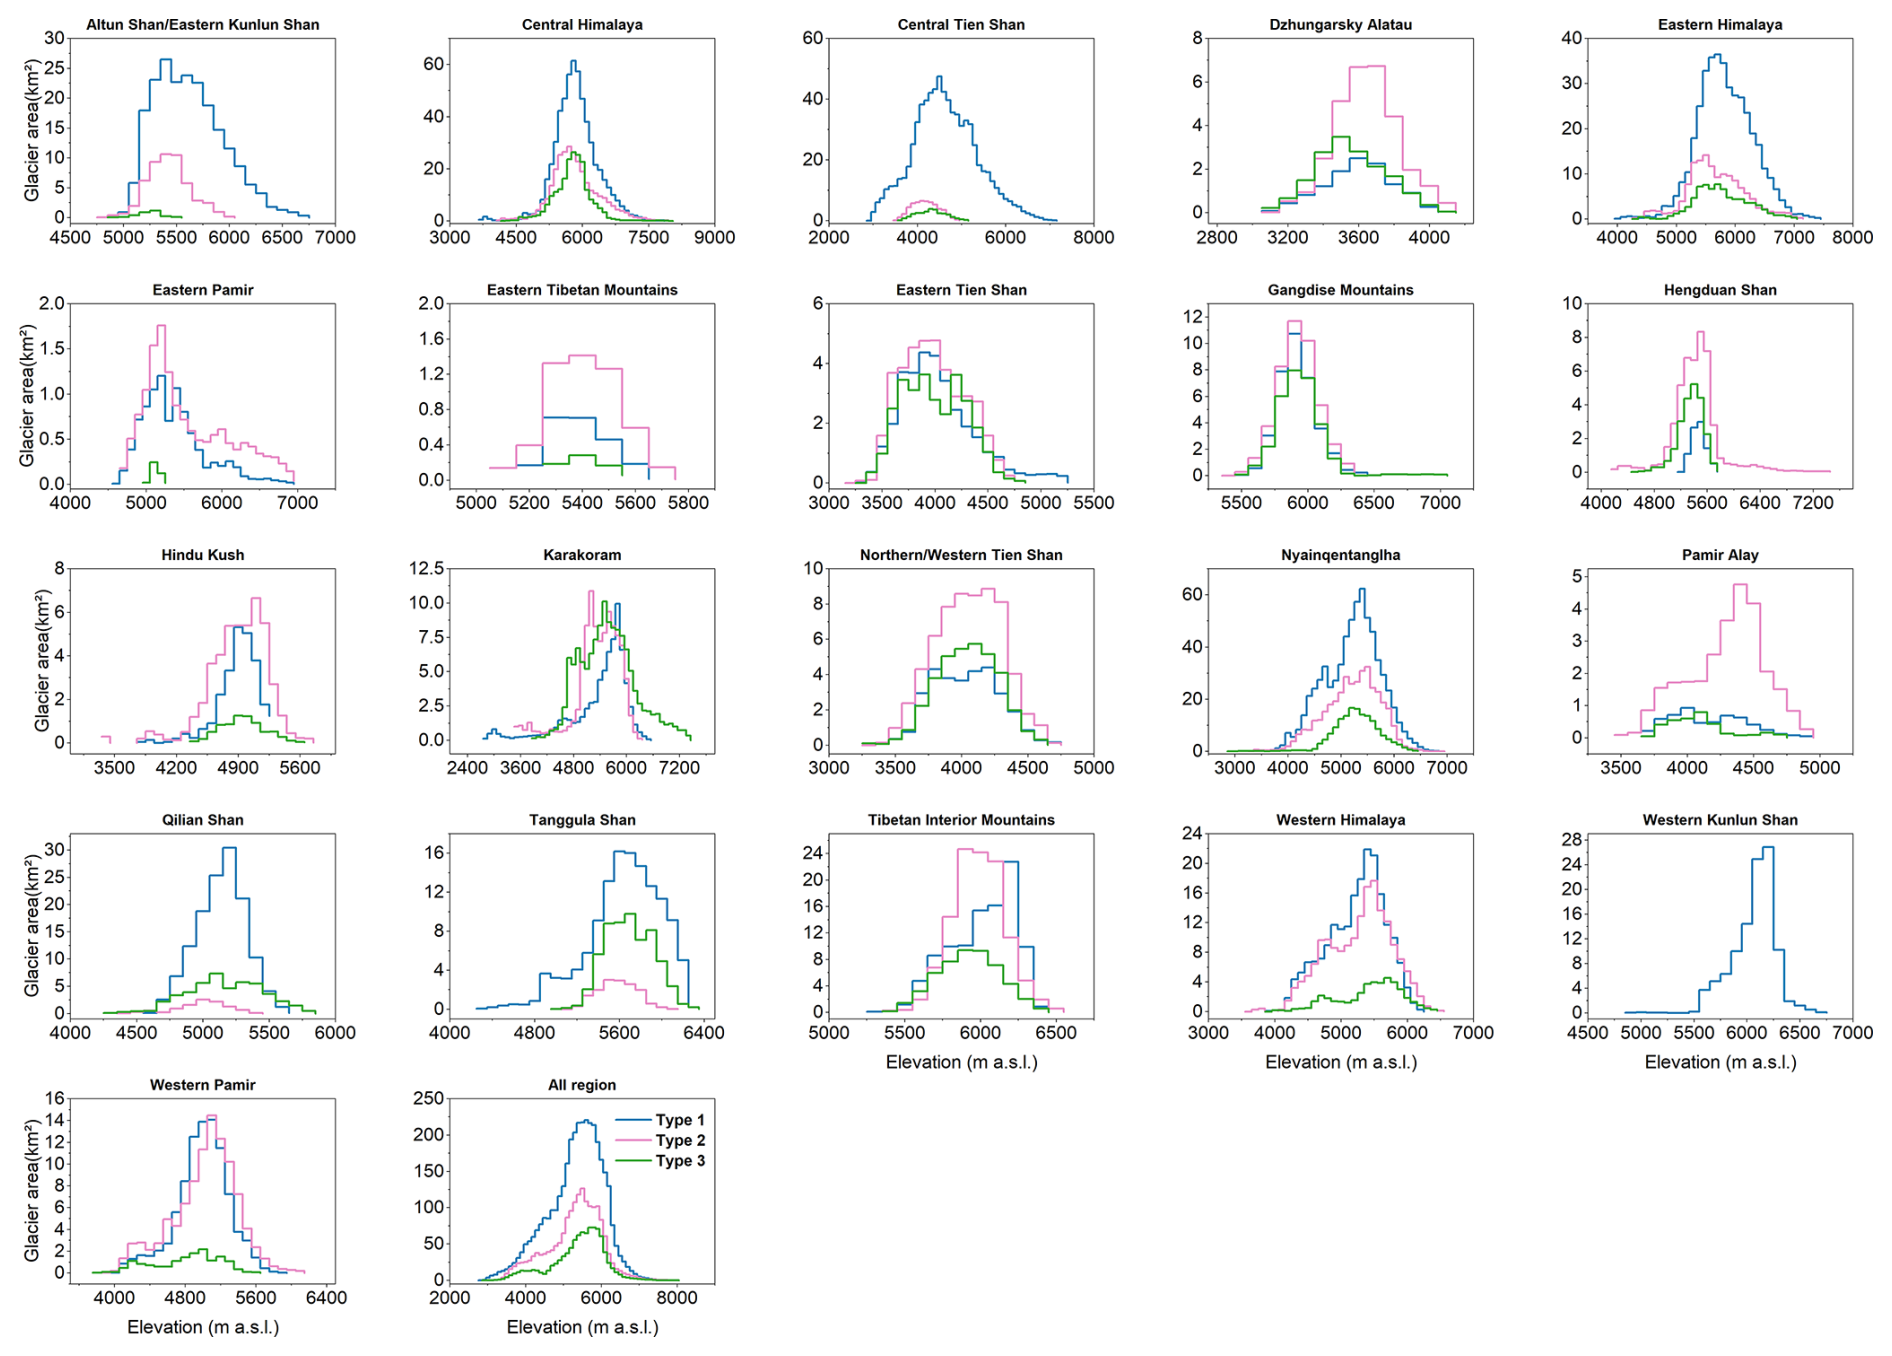
Figure 6Area-Elevation distribution of LTGs across subregions, showing glacier area within 100 m elevation bins.
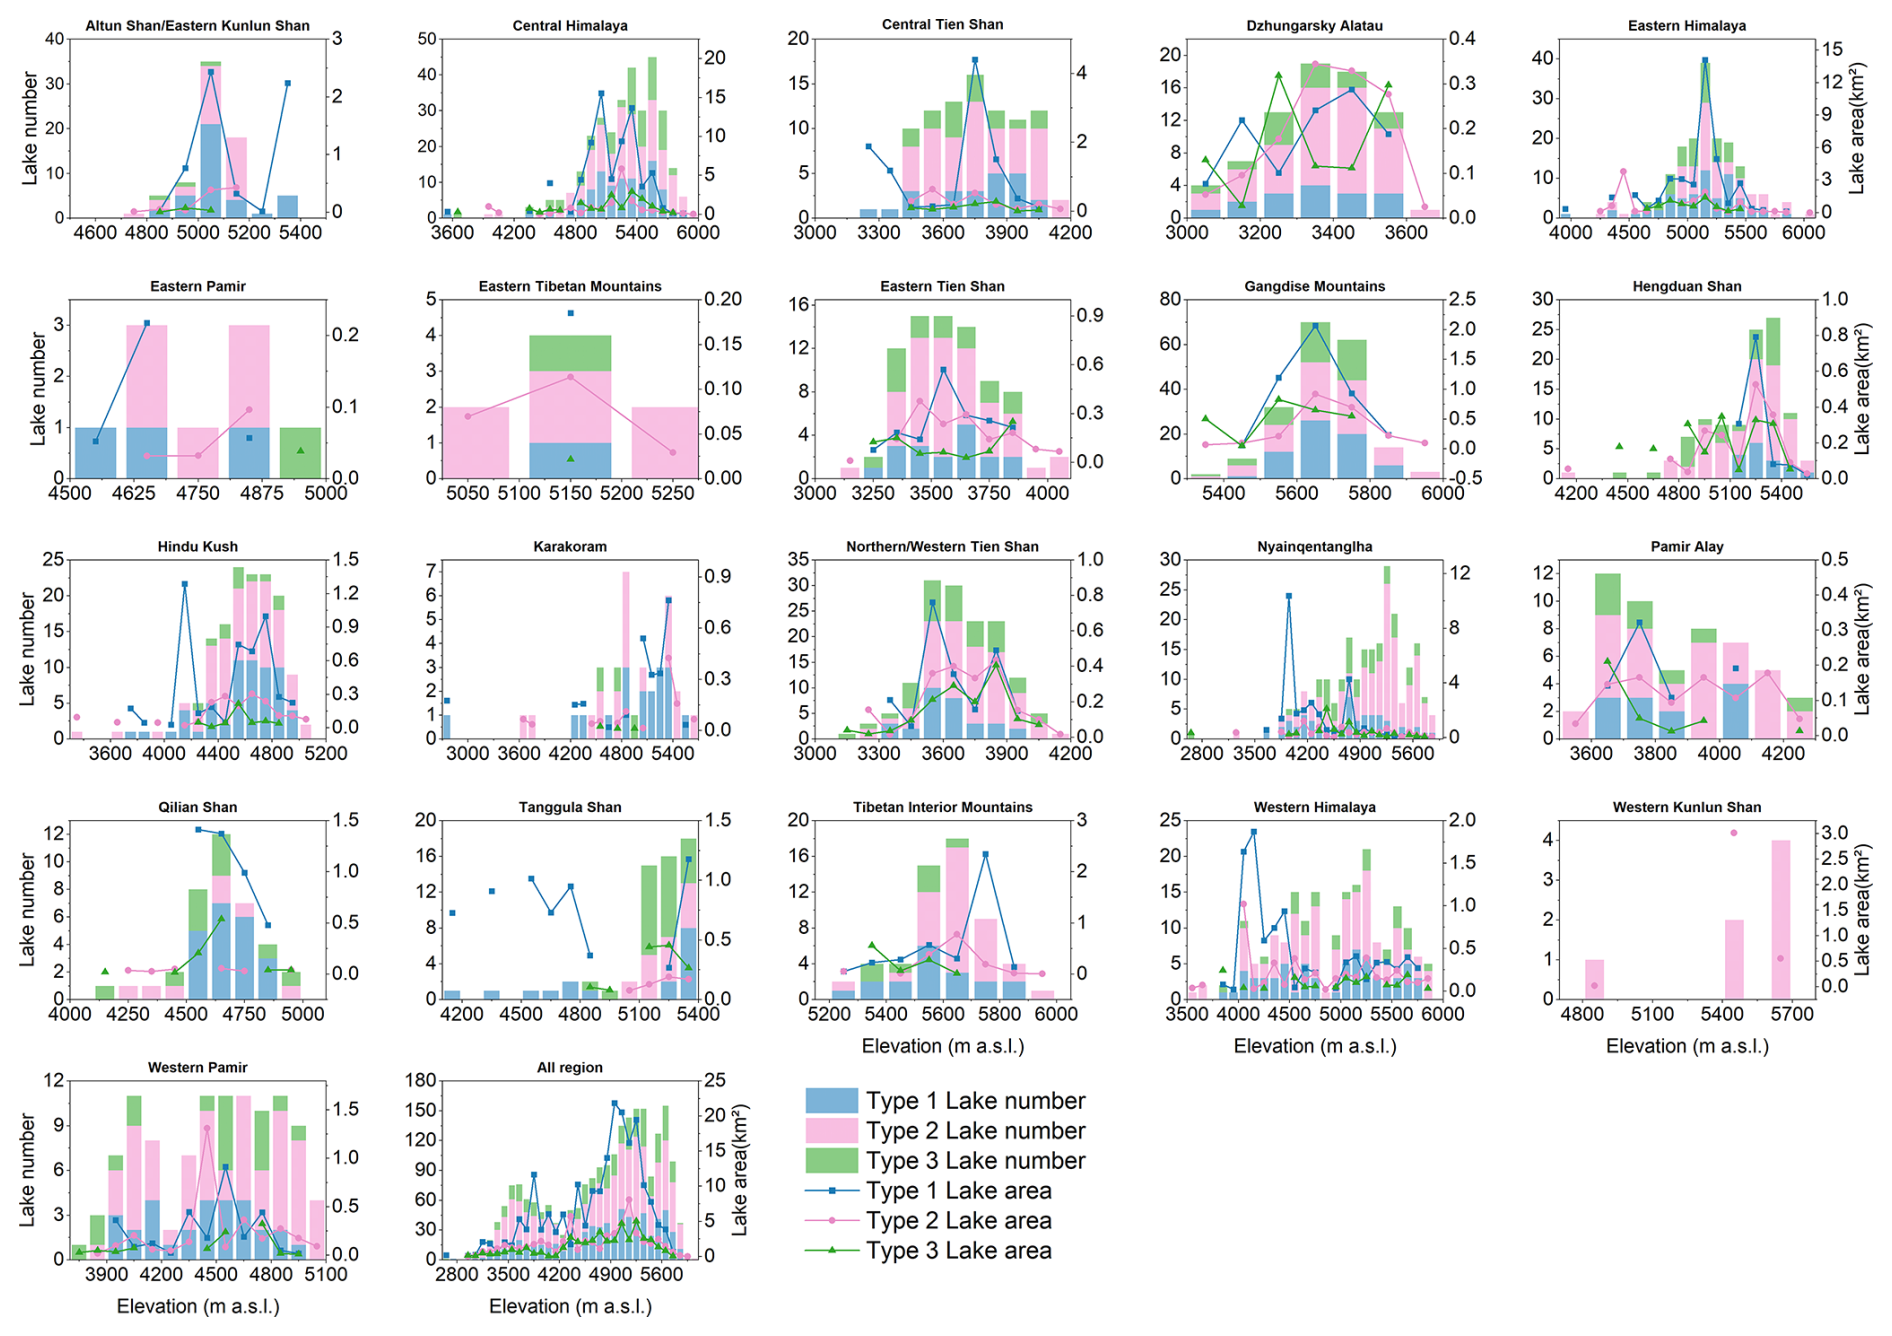
Figure 7Distribution of proglacial lake numbers and areas across elevation ranges in each subregion. The number and area of proglacial lakes are presented within 100 m elevation bins for each subregion.
5.1 Assessment of accuracy and errors
The uncertainty estimates indicate that as the glacier or lake area increases, the relative error of individual features decreases. In the study area, the total absolute area errors for glaciers in 1990 and 2022 were ±13.65 km2 and ±13.53 km2, respectively, with average relative errors of ±7.24 % and ±8.12 %. The relative error of glacier area shows a significant power-law relationship with the glacier size (, R2=0.92, Fig. 8a). Additionally, the total absolute area error for proglacial lakes in 1990 and 2022 were ±0.69 km2 and ±0.96 km2, respectively, with average relative errors of ±21.99 % and ±23.69 %, following a similar significant power-law relationship (, R2=0.94, Fig. 8b). We found that the maximum relative error for proglacial lakes exceeds 80 %. We therefore stratified relative error statistics by lake area bins and glacier types. The largest errors are primarily associated with lakes smaller than 0.01 km2, which have a mean relative error of 49 %. Within this size class, Type 2 proglacial lakes are most prevalent, accounting for 52 % of all lakes < 0.01 km2. To better constrain the impact of these small lakes on overall dataset accuracy, we visually verified them using higher resolution remote sensing imagery (PlanetScope, Esri basemaps, and Google imagery), thereby reducing misidentification arising from limited spatial resolution.
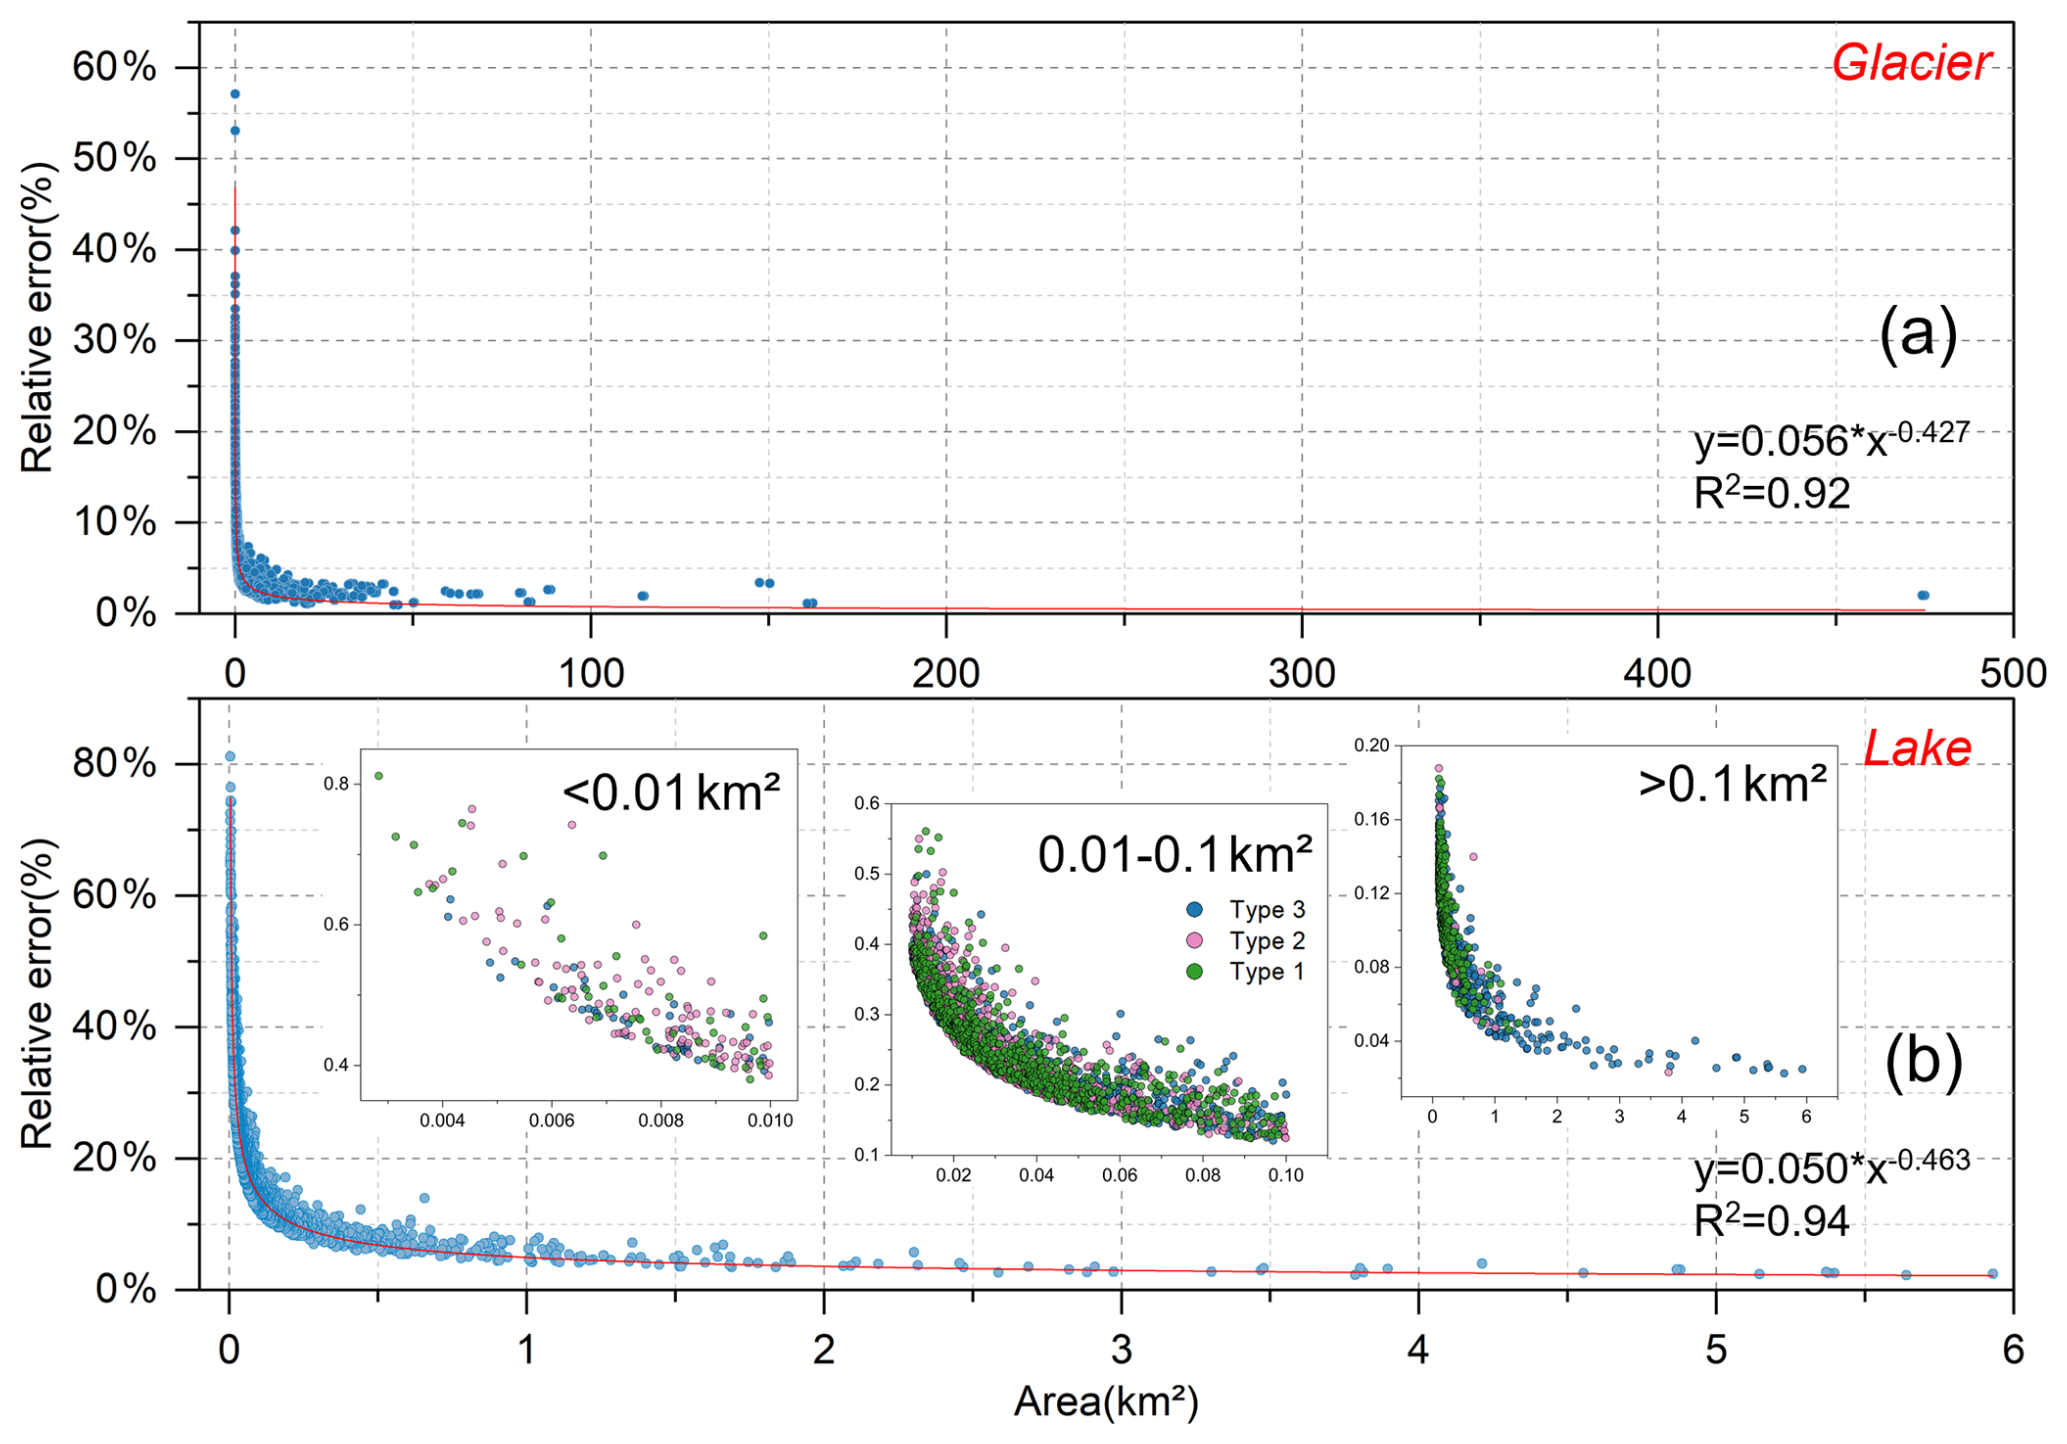
Figure 8Estimation of relative errors for glaciers and proglacial lakes in the study area. (a) Glaciers, (b) Proglacial lakes. We also divided the proglacial lakes into three area intervals and quantified the relative errors for different types.
5.2 Comparison and limitations
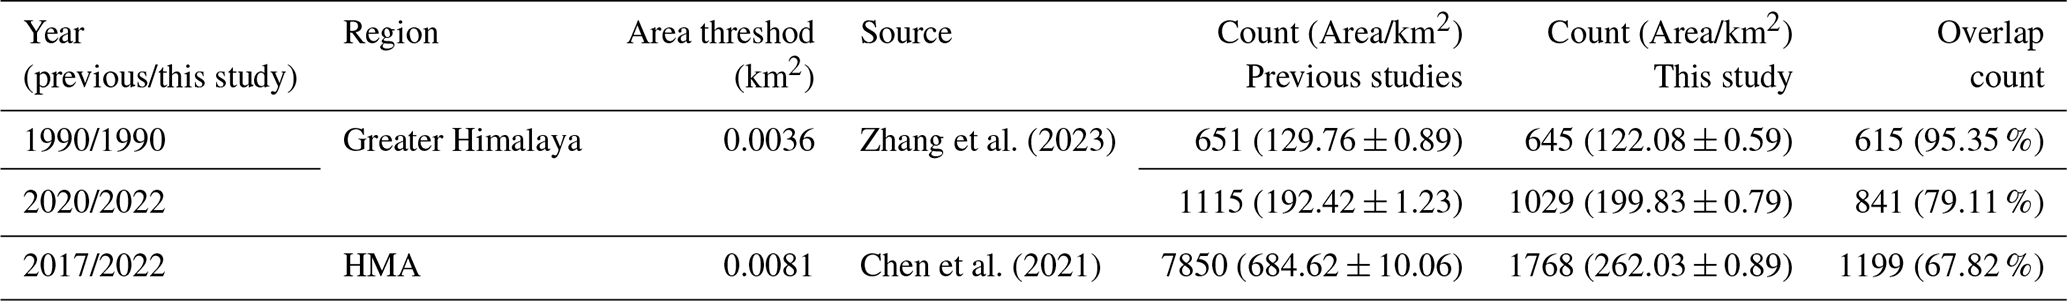
Publicly available data on LTGs and their proglacial lakes in HMA remain scarce, with recent datasets primarily focusing on glacial lakes. Consequently, this study selected two glacial lake datasets that partially overlap in time with our research and include proglacial lakes for comparison (Table 3). The results indicate that, within the same study area, our data closely align with those of Zhang et al. (2023). In 1990, the overlap rate of proglacial lakes between the dataset of Zhang et al. (2023) and ours exceeded 90 %, while in 2020/2022, the overlap rate was 79 %. In contrast, significant discrepancies were observed with the dataset of Chen et al. (2021). For the period 2017/2022, the dataset of Chen et al. (2021) identified 7850 proglacial lakes, whereas our study identified only 1768, with an overlap rate of 67.82 %. To further clarify the causes of these discrepancies, we selected a representative subregion in the central Himalaya as a sample area for cross-validation (Fig. S1). Our dataset indicates that 45 proglacial lakes were present in this area in 2022. In contrast, Chen et al. (2021) reported 335 glacial lakes in 2017, of which only 29 (64 % of our proglacial lakes) overlap with our inventory Zhang et al. (2023) reported 38 proglacial lakes in 2020, with 30 (67 %) overlapping with our results. Chen et al. (2021) likely used a more permissive definition when screening lakes in front of glacier termini, effectively including many water bodies that are not in direct contact with glacier. We apply strict criterion (Sect. 3.2) and define proglacial lakes as those that are in contact with glacier ice and situated at the downstream end along the glacier flow direction. Part of the mismatch may also arise from differences in lake-type labeling during transitional stages. Several water bodies that we classify as proglacial lakes were labeled as supraglacial lakes by Chen et al. (2021) and Zhang et al. (2023). In addition, some supraglacial ponds are currently merging and evolving into a single, unified proglacial lake, and we classify lakes with a high degree of transition as proglacial lakes. Differences in the minimum mapping area threshold further amplify the mismatch. Our inventory and Zhang et al. (2023) uses 0.0036 km2, whereas Chen et al. (2021) used 0.0081 km2, which affects the inclusion of small lakes and therefore the total lake count. Finally, we corrected omissions in earlier inventories where applicable, and additional factors, such as image quality, acquisition dates, and vectorization workflows, may also contribute to the observed discrepancies.
A global inventory of LTGs was released in 2025 (Steiner et al., 2025). This dataset was derived from the RGI7 glacier outlines, primarily using Landsat 5 and 7 TM/ETM+ imagery (ca. 1998–2002), supplemented by ASTER data in some high-latitude regions (for a small portion of the Canadian Arctic and Greenland Periphery). Existing regional proglacial lake inventories (when close to 2000) were also incorporated, and the identification of LTGs was conducted through manual interpretation and expert cross-validation. Based on the degree of glacier–lake contact, glaciers were classified into three types (Level 1: glacier–lake contact exceeds 50 % of the terminus perimeter. Level 2 : glacier–lake contact ranges from 10 % to 50 % of the terminus perimeter. Level 3: glacier–lake contact is less than 10 % of the terminus perimeter). In HMA, a total of 1912 LTGs were identified. Although the glacier termini in this dataset were delineated for 2000 ± 2, the overlap with our 2022 dataset is 50 %. Specifically, our dataset shows an overlap rate of 63 % with level 1 glaciers, 43 % with level 2 glaciers, and 19 % with level 3 glaciers. The differences in results can be attributed to two primary factors. First, temporal differences. The reference dataset is mainly based on imagery from around the year 2000, whereas our dataset relies on imagery from around 2022. Given that glacier–lake contact relationships are inherently unstable (Luo et al., 2025), the emergence of newly formed proglacial lakes and glaciers that no longer maintain contact with proglacial lakes during this period may have significantly influenced the statistical outcomes. Second, methodological differences. Although both studies adopt a broadly similar semi-automatic approach to screening glaciers based on lake data, the specific implementations differ. The reference dataset utilizes existing open-access lake inventories (Chen et al., 2021; Wang et al., 2020), while our lake dataset was extracted by ourself, with different lake area thresholds applied (0.0054 and 0.0081 km2 in the reference dataset versus 0.0036 km2 in our study). Such differences may contribute to discrepancies in the results. Moreover, the criteria for identifying lake-terminating glaciers also diverge. The reference dataset classifies glaciers according to the proportion of lake contact relative to the glacier terminus perimeter, whereas our study emphasizes geomorphological features (e.g., ice cliffs, crevasses) and the expansion trend of proglacial lakes, i.e., whether lakes continue to expand toward the glacier. Due to these differences in classification standards, our dataset may not include some of the level 2 and level 3 glaciers identified in the reference dataset, which likely explains the lower overlap rates with these categories.
Although this study employed standardized criteria for the qualitative identification of LTGs and their proglacial lakes, subjective factors remain challenging to eliminate entirely during remote sensing imagery analysis. Differences in how analysts interpret imagery, apply calibration standards, and process data quality directly impact the results. While measures such as independent labeling and cross-validation by multiple analysts can reduce subjective bias, uncertainties stemming from variations in individual experience, judgment criteria, and image quality remain difficult to fully resolve. Consequently, further quantification of identification criteria is of paramount importance. In the future, more refined technical approaches can optimize the identification of glacier-lake contact lines, leveraging high-resolution imagery and automated analysis tools to enhance accuracy. Additionally, quantifying the depth of glaciers within lakes will provide more precise data support. These quantitative standards not only effectively minimize human-induced variability but also significantly improve the precision of glacier-lake contact relationship assessments, laying a more reliable data foundation for subsequent studies of glacier dynamics.
Table 3Comparisons of glacial lake mapping in this study with previous studies for the similar extended region.
5.3 Drivers of changes in lake-terminating glaciers and associated disaster risks
Climate warming is a primary driver of both the number and size of proglacial lakes, which in turn has contributed to the increasing prevalence of lake-terminating glaciers (LTGs). Glaciers across High Mountain Asia (HMA) have experienced widespread retreat during the 21st century (Brun et al., 2017; Hugonnet et al., 2021), with the most significant mass losses occurring in the Nyainqentanglha region (−0.62 ± 0.23 m w.e. a−1, locally reaching −0.80 ± 0.25 m w.e. a−1). Moderate mass losses are observed in the central Himalaya, with rates of −0.42 ± 0.20 m w.e. a−1 in Bhutan and −0.33 ± 0.20 m w.e. a−1 in eastern Nepal. Consequently, the Himalayan–southeastern Tibetan Plateau has emerged as a hotspot of glacier wastage. Glacier retreat provides both the material supply and geomorphic setting for proglacial lake development, fostering a high concentration of LTGs in this region. LTGs in the Himalayan–southeastern Tibetan Plateau account for 61 % of the total number of LTGs in HMA and 55 % of newly formed LTGs.
However, the formation of proglacial lakes is not solely driven by climate forcing; it also amplifies the nonlinear response of glaciers to climate change. Proglacial lakes are closely linked to enhanced glacier mass loss, primarily through processes such as subaqueous melting (Zhang et al., 2023), accelerated ice flow (Pronk et al., 2021), and the potential risk of glacial lake outburst floods (Zheng et al., 2021b). As glacial lakes expand, the increasing water depth at glacier termini further elevates the uncertainty surrounding calving, as greater water depths are generally thought to accelerate terminus collapse (Minowa et al., 2023). Incorporating glacier morphological variables (e.g., supraglacial debris cover, slope, elevation) into the analysis is, therefore, essential for understanding the role of proglacial lakes in influencing glacier mass balance. Monitoring of Bridge Glacier by Chernos et al. (2016) revealed that calving at the glacier terminus has consistently remained a secondary contributor to ablation. While calving accounted for up to 49 % of ablation in some individual years, its multi-year average contribution was only 10 %–25 %. Rapid retreat has been strongly associated with increasing water depth, but such high calving rates are typically transient and tend to decrease as glacier termini recede into shallower waters. Our results further demonstrate that glacier-lake contact relationships are inherently unstable. Between 1990 and 2022, 41 % of glaciers that were previously in contact with proglacial lakes lost this connection. This rapid change underscores the episodic and unstable nature of the influence of proglacial lakes on glacier evolution. Therefore, projections of glacier mass loss should consider not only climatic factors but also the evolving glacier-lake contact relationships and their heterogeneous impacts on glacier dynamics.
The risk of glacial lake outburst floods (GLOFs) in the High Mountain Asia (HMA) region is increasing under the backdrop of climate warming, particularly in the Himalaya (Zheng et al., 2021b). Our study finds that the total area of proglacial lake expansion in the southeastern Tibetan Plateau and eastern Himalayas accounts for 78 % of the total glacial lake expansion in the HMA. As glaciers retreat, proglacial lakes in contact with them expose their basins. This significantly increases their potential for expansion compared to other types of glacial lakes, making them a higher-risk disaster source. Over the past three decades, 188 GLOF events have been recorded in the HMA (Shrestha et al., 2023), of which 55 events (29 %) occurred in glacier-proglacial lake systems. The main triggers of these floods include ice avalanches (Sherpa et al., 2025) and slope instability caused by rapid glacier retreat, leading to landslides into the lakes (Zheng et al., 2021a). Due to the continuous impact of climate warming, the interactions between glaciers and proglacial lakes may become increasingly complex in the coming decades. The number and size of glacial lakes may further increase, and the relationships between glaciers and proglacial lakes may undergo significant changes. As a result, traditional climate-based disaster risk models may not fully capture these complex, nonlinear interactions, especially those involving glacial lake expansion and glacier retreat. To effectively address these challenges, future disaster risk management strategies must be more comprehensive and forward-looking. This should include strengthening monitoring and early warning systems for GLOFs, incorporating the evolution of glacier-lake contact relationships, and considering glacier morphological characteristics to improve prediction capabilities.
Data described in this manuscript can be accessed at Zenodo under https://doi.org/10.5281/zenodo.17369580 (Luo and Liu, 2025).
The code for proglacial lake identification is included in the Supplement.
Using Landsat imagery, we applied a semi-automated mapping approach in Google Earth Engine (GEE) to inventory proglacial lakes across High Mountain Asia (HMA) in the 1990s and 2020s, and compiled the first region-wide dataset of LTGs and their proglacial lakes. In 2022, HMA contained 1740 LTGs (5082.08 ± 13.15 km2), of which 667 glaciers (3454.59 ± 12.43 km2) maintained lake contact since 1990, and 1073 glaciers (1,627.49 ± 4.30 km2) developed new proglacial lakes. These glaciers were mainly distributed between 2735 and 8016 m a.s.l. Additionally, 468 glaciers (960.13 ± 3.18 km2) lost lake contact during the period.
A total of 1768 proglacial lakes (262.10 ± 0.89 km2) were connected to glaciers in 2022, including 645 lakes (207.18 ± 0.82 km2) with continuous glacier contact and 1123 newly formed lakes (54.85 ± 0.35 km2). Lakes were mainly distributed between 2684 and 6012 m a.s.l. Meanwhile, 485 lakes (45.31 ± 0.34 km2) lost glacier contact, with 25 disappearing entirely. From 1990 to 2022, LTGs retreated by 324.43 ± 19.23 km2 (−5.1 %), while proglacial lake area increased by 138.19 ± 1.18 km2 (+81.7 %). The development and evolution of lake-terminating glacier–proglacial lake systems are predominantly concentrated along the southern margin of HMA, including the Hindu Kush, Himalayas, Nyainqentanglha, and Gangdise Mountains.
This dataset offers a robust basis for examining spatially heterogeneous glacier responses to climate change, coupled glacier–lake evolution, glacier hydrological modeling, glacial lake outburst flood (GLOF) assessment, and water resource management. Nevertheless, further improvements in data quality remain necessary, particularly in quantifying glacier–lake contact line length, the degree of glacier–lake contact (e.g., lake depth and subaqueous glacier front depth), and water temperature measurements.
The supplement related to this article is available online at https://doi.org/10.5194/essd-18-1503-2026-supplement.
YL designed the study, developed the methodology, performed analysis, and wrote the manuscript. QL provided funding, support and supervision. XL, YY and JY produced data and performed analysis. All other authors discussed and drafted the formulation of the specifications of the glacial lake inventory in this study. All authors contributed to the final form of the paper.
The contact author has declared that none of the authors has any competing interests.
Publisher's note: Copernicus Publications remains neutral with regard to jurisdictional claims made in the text, published maps, institutional affiliations, or any other geographical representation in this paper. The authors bear the ultimate responsibility for providing appropriate place names. Views expressed in the text are those of the authors and do not necessarily reflect the views of the publisher.
We acknowledge the free availability of Landsat data (USGS Landsat Data Access: https://www.usgs.gov/landsat-missions/landsat-data-access, last access: 18 January 2026). We thank Planet Labs Inc. for imagery access through the Education and Research Programme via Planet Explorer (https://www.planet.com/, last access: 18 January 2026). We further acknowledge Esri for providing basemap services used in this study (https://www.esri.com/en-us/arcgis/products/arcgis-location-platform/services/basemaps, last access: 18 January 2026). We also thank Achim A. Beylich and two anonymous referees for their constructive comments, which improved the manuscript and dataset quality.
This work was funded by the National Key R&D Program of China (grant no. 2024YFC3013400) and National Science Foundation of China (grant no. 42361144874).
This paper was edited by Achim A. Beylich and reviewed by two anonymous referees.
Benn, D. I., Hulton, N. R. J., and Mottram, R. H.: “Calving laws”, “sliding laws” and the stability of tidewater glaciers, Ann. Glaciol., 46, 123–130, https://doi.org/10.3189/172756407782871161, 2007a.
Benn, D. I., Warren, C. R., and Mottram, R. H.: Calving processes and the dynamics of calving glaciers, Earth-Science Reviews, 82, 143–179, https://doi.org/10.1016/j.earscirev.2007.02.002, 2007b.
Bolch, T., Menounos, B., and Wheate, R.: Landsat-based inventory of glaciers in western Canada, 1985–2005, Remote Sens. Environ., 114, 127–137, https://doi.org/10.1016/j.rse.2009.08.015, 2010.
Brun, F., Berthier, E., Wagnon, P., Kaab, A., and Treichler, D.: A spatially resolved estimate of High Mountain Asia glacier mass balances, 2000–2016, Nat. Geosci., 10, 668–673, https://doi.org/10.1038/NGEO2999, 2017.
Brun, F., Wagnon, P., Berthier, E., Jomelli, V., Maharjan, S. B., Shrestha, F., and Kraaijenbrink, P. D. A.: Heterogeneous Influence of Glacier Morphology on the Mass Balance Variability in High Mountain Asia, Journal of Geophysical Research: Earth Surface, 124, 1331–1345, https://doi.org/10.1029/2018jf004838, 2019.
Carrivick, J. L. and Tweed, F. S.: Proglacial lakes: character, behaviour and geological importance, Quaternary Sci. Rev., 78, 34–52, https://doi.org/10.1016/j.quascirev.2013.07.028, 2013.
Chen, F., Zhang, M., Guo, H., Allen, S., Kargel, J. S., Haritashya, U. K., and Watson, C. S.: Annual 30 m dataset for glacial lakes in High Mountain Asia from 2008 to 2017, Earth Syst. Sci. Data, 13, 741–766, https://doi.org/10.5194/essd-13-741-2021, 2021.
Chernos, M., Koppes, M., and Moore, R. D.: Ablation from calving and surface melt at lake-terminating Bridge Glacier, British Columbia, 1984–2013, The Cryosphere, 10, 87–102, https://doi.org/10.5194/tc-10-87-2016, 2016.
Foga, S., Scaramuzza, P. L., Guo, S., Zhu, Z., Dilley, R. D., Beckmann, T., Schmidt, G. L., Dwyer, J. L., Joseph Hughes, M., and Laue, B.: Cloud detection algorithm comparison and validation for operational Landsat data products, Remote Sens. Environ., 194, 379–390, https://doi.org/10.1016/j.rse.2017.03.026, 2017.
Gardelle, J., Berthier, E., and Arnaud, Y.: Slight mass gain of Karakoram glaciers in the early twenty-first century, Nat. Geosci., 5, 322–325, https://doi.org/10.1038/Ngeo1450, 2012.
Hanshaw, M. N. and Bookhagen, B.: Glacial areas, lake areas, and snow lines from 1975 to 2012: status of the Cordillera Vilcanota, including the Quelccaya Ice Cap, northern central Andes, Peru, The Cryosphere, 8, 359–376, https://doi.org/10.5194/tc-8-359-2014, 2014.
Hugonnet, R., McNabb, R., Berthier, E., Menounos, B., Nuth, C., Girod, L., Farinotti, D., Huss, M., Dussaillant, I., Brun, F., and Kaab, A.: Accelerated global glacier mass loss in the early twenty-first century, Nature, 592, 726–731, https://doi.org/10.1038/s41586-021-03436-z, 2021.
Kääb, A., Treichler, D., Nuth, C., and Berthier, E.: Brief Communication: Contending estimates of 2003–2008 glacier mass balance over the Pamir–Karakoram–Himalaya, The Cryosphere, 9, 557–564, https://doi.org/10.5194/tc-9-557-2015, 2015.
Khanal, S., Tiwari, S., Lutz, A. F., Hurk, B. V. D., and Immerzeel, W. W.: Historical Climate Trends over High Mountain Asia Derived from ERA5 Reanalysis Data, Journal of Applied Meteorology and Climatology, 62, 263–288, https://doi.org/10.1175/JAMC-D-21-0045.1, 2023.
Li, D., Shangguan, D., and Anjum, M. N.: Glacial Lake Inventory Derived from Landsat 8 OLI in 2016–2018 in China–Pakistan Economic Corridor, ISPRS International Journal of Geo-Information, 9, https://doi.org/10.3390/ijgi9050294, 2020.
Li, J. and Sheng, Y.: An automated scheme for glacial lake dynamics mapping using Landsat imagery and digital elevation models: a case study in the Himalayas, Int. J. Remote Sens., 33, 5194–5213, https://doi.org/10.1080/01431161.2012.657370, 2012.
Liu, Q., Mayer, C., Wang, X., Nie, Y., Wu, K., Wei, J., and Liu, S.: Interannual flow dynamics driven by frontal retreat of a lake-terminating glacier in the Chinese Central Himalaya, Earth Planet. Sc. Lett., 546, https://doi.org/10.1016/j.epsl.2020.116450, 2020.
Luo, W., Zhang, G., Chen, W., and Xu, F.: Response of glacial lakes to glacier and climate changes in the western Nyainqentanglha range, Sci. Total Environ., 735, 139607, https://doi.org/10.1016/j.scitotenv.2020.139607, 2020.
Luo, Y. and Liu, Q.: Rapidly Changing Lake-Terminating Glaciers in High Mountain Asia: A Dataset from 1990 to 2022, Zenodo [data set], https://doi.org/10.5281/zenodo.17369580, 2025.
Luo, Y., Yin, Y., Zhong, Y., Lu, X., Yang, J., Sapkota, L., Lu, X., and Liu, Q.: Dynamics of lake–terminating glaciers in the Himalaya and Southeastern Tibet between 1990 and 2020, Journal of Glaciology, 1–20, https://doi.org/10.1017/jog.2025.10088, 2025.
Maurer, J. M., Schaefer, J. M., Rupper, S., and Corley, A.: Acceleration of ice loss across the Himalayas over the past 40 years, Science Advances, 5, eaav7266, https://doi.org/10.1126/sciadv.aav7266, 2019.
Mertes, J. R., Thompson, S. S., Booth, A. D., Gulley, J. D., and Benn, D. I.: A conceptual model of supra-glacial lake formation on debris-covered glaciers based on GPR facies analysis, Earth Surface Processes and Landforms, 42, 903–914, https://doi.org/10.1002/esp.4068, 2017.
Minowa, M., Schaefer, M., and Skvarca, P.: Effects of topography on dynamics and mass loss of lake-terminating glaciers in southern Patagonia, Journal of Glaciology, 1–18, https://doi.org/10.1017/jog.2023.42, 2023.
Pronk, J. B., Bolch, T., King, O., Wouters, B., and Benn, D. I.: Contrasting surface velocities between lake- and land-terminating glaciers in the Himalayan region, The Cryosphere, 15, 5577–5599, https://doi.org/10.5194/tc-15-5577-2021, 2021.
Quincey, D. J., Richardson, S. D., Luckman, A., Lucas, R. M., Reynolds, J. M., Hambrey, M. J., and Glasser, N. F.: Early recognition of glacial lake hazards in the Himalaya using remote sensing datasets, Global Planet Change, 56, 137–152, https://doi.org/10.1016/j.gloplacha.2006.07.013, 2007.
Salerno, F., Thakuri, S., D'Agata, C., Smiraglia, C., Manfredi, E. C., Viviano, G., and Tartari, G.: Glacial lake distribution in the Mount Everest region: Uncertainty of measurement and conditions of formation, Global Planet Change, 92–93, 30–39, https://doi.org/10.1016/j.gloplacha.2012.04.001, 2012.
Sherpa, S. F., Smith, L. C., Wang, B., and Stuurman, C.: Brief Communication: Multisource Remote Sensing Detects Growing Himalayan Glacial Lake Outburst Flood Hazards, EGUsphere [preprint], https://doi.org/10.5194/egusphere-2025-133, 2025.
Shrestha, F., Steiner, J. F., Shrestha, R., Dhungel, Y., Joshi, S. P., Inglis, S., Ashraf, A., Wali, S., Walizada, K. M., and Zhang, T.: A comprehensive and version-controlled database of glacial lake outburst floods in High Mountain Asia, Earth Syst. Sci. Data, 15, 3941–3961, https://doi.org/10.5194/essd-15-3941-2023, 2023.
Shugar, D. H., Burr, A., Haritashya, U. K., Kargel, J. S., Watson, C. S., Kennedy, M. C., Bevington, A. R., Betts, R. A., Harrison, S., and Strattman, K.: Rapid worldwide growth of glacial lakes since 1990, Nat. Clim. Change, 10, 939–945, https://doi.org/10.1038/s41558-020-0855-4, 2020.
Steiner, J., Armstrong, W., Kochtitzky, W., McNabb, R., Aguayo, R., Bolch, T., Maussion, F., Agarwal, V., Barr, I., Baurley, N. R., Cloutier, M., DeWater, K., Donachie, F., Drocourt, Y., Garg, S., Joshi, G., Guzman, B., Kutuzov, S., Loriaux, T., Mathias, C., Menounos, B., Miles, E., Osika, A., Potter, K., Racoviteanu, A., Rick, B., Sterner, M., Tallentire, G. D., Tielidze, L., White, R., Wu, K., and Zheng, W.: Global mapping of lake-terminating glaciers, Earth Syst. Sci. Data Discuss. [preprint], https://doi.org/10.5194/essd-2025-315, in review, 2025.
Sugiyama, S., Skvarca, P., Naito, N., Enomoto, H., Tsutaki, S., Tone, K., Marinsek, S., and Aniya, M.: Ice speed of a calving glacier modulated by small fluctuations in basal water pressure, Nat. Geosci., 4, 597–600, https://doi.org/10.1038/ngeo1218, 2011.
Sutherland, J. L., Carrivick, J. L., Gandy, N., Shulmeister, J., Quincey, D. J., and Cornford, S. L.: Proglacial Lakes Control Glacier Geometry and Behavior During Recession, Geophysical Research Letters, 47, https://doi.org/10.1029/2020gl088865, 2020.
Truffer, M. and Motyka, R. J.: Where glaciers meet water: Subaqueous melt and its relevance to glaciers in various settings, Reviews of Geophysics, 54, 220–239, https://doi.org/10.1002/2015rg000494, 2016.
Tsutaki, S., Fujita, K., Nuimura, T., Sakai, A., Sugiyama, S., Komori, J., and Tshering, P.: Contrasting thinning patterns between lake- and land-terminating glaciers in the Bhutanese Himalaya, The Cryosphere, 13, 2733–2750, https://doi.org/10.5194/tc-13-2733-2019, 2019.
Wang, X., Guo, X., Yang, C., Liu, Q., Wei, J., Zhang, Y., Liu, S., Zhang, Y., Jiang, Z., and Tang, Z.: Glacial lake inventory of high-mountain Asia in 1990 and 2018 derived from Landsat images, Earth Syst. Sci. Data, 12, 2169–2182, https://doi.org/10.5194/essd-12-2169-2020, 2020.
Worni, R., Huggel, C., and Stoffel, M.: Glacial lakes in the Indian Himalayas–from an area-wide glacial lake inventory to on-site and modeling based risk assessment of critical glacial lakes, Sci. Total Environ., 468–469 Suppl, S71–84, https://doi.org/10.1016/j.scitotenv.2012.11.043, 2013.
Yao, T., Thompson, L., Yang, W., Yu, W., Gao, Y., Guo, X., Yang, X., Duan, K., Zhao, H., Xu, B., Pu, J., Lu, A., Xiang, Y., Kattel, D. B., and Joswiak, D.: Different glacier status with atmospheric circulations in Tibetan Plateau and surroundings, Nat. Clim. Change, 2, 663–667, https://doi.org/10.1038/nclimate1580, 2012.
Zhang, G., Yao, T., Xie, H., Wang, W., and Yang, W.: An inventory of glacial lakes in the Third Pole region and their changes in response to global warming, Global Planet Change, 131, 148–157, https://doi.org/10.1016/j.gloplacha.2015.05.013, 2015.
Zhang, G., Zheng, G., Gao, Y., Xiang, Y., Lei, Y., and Li, J.: Automated Water Classification in the Tibetan Plateau Using Chinese GF-1 WFV Data, Photogrammetric Engineering & Remote Sensing, 83, 509–519, https://doi.org/10.14358/pers.83.7.509, 2017.
Zhang, G., Bolch, T., Yao, T., Rounce, D. R., Chen, W., Veh, G., King, O., Allen, S. K., Wang, M., and Wang, W.: Underestimated mass loss from lake-terminating glaciers in the greater Himalaya, Nat. Geosci., 16, 333–338, https://doi.org/10.1038/s41561-023-01150-1, 2023.
Zheng, G., Mergili, M., Emmer, A., Allen, S., Bao, A., Guo, H., and Stoffel, M.: The 2020 glacial lake outburst flood at Jinwuco, Tibet: causes, impacts, and implications for hazard and risk assessment, The Cryosphere, 15, 3159–3180, https://doi.org/10.5194/tc-15-3159-2021, 2021a.
Zheng, G., Allen, S. K., Bao, A., Ballesteros-Cánovas, J. A., Huss, M., Zhang, G., Li, J., Yuan, Y., Jiang, L., Yu, T., Chen, W., and Stoffel, M.: Increasing risk of glacial lake outburst floods from future Third Pole deglaciation, Nat Clim Change, 11, 411–417, https://doi.org/10.1038/s41558-021-01028-3, 2021b.