the Creative Commons Attribution 4.0 License.
the Creative Commons Attribution 4.0 License.
 | 25 Feb 2026
More than a century of oceanic hydrography observations reveals profound climate-related changes in the Northwest Atlantic Ocean and its Arctic Gateways
Jonathan Coyne
Sheila Atchison
Charlie Bishop
Sébastien Donnet
Peter S. Galbraith
Maxime Geoffroy
David Hebert
Chantelle Layton
Andry Ratsimandresy
Jose-Luis del Rio Iglesias
Jean-Luc Shaw
Stephen Snook
Nancy Soontiens
Elena Tel
Wojciech Walkusz
As part of the new Fisheries Act, Fisheries and Oceans Canada (DFO) has made it a priority to disseminate its data publicly. The project proposed here is to create an open-access data product that includes most of the historical temperature and salinity profiles collected in Northwest Atlantic Ocean and its Arctic gateways. This project does not aim to replace a potential database, but rather provides an easily accessible and quality-controlled product that can inform fisheries management and support DFO priorities such as the Ecosystem Approach to Fisheries Management, Marine Spatial Planning and the Blue Economy. The Canadian Atlantic Shelf Temperature-Salinity (CASTS) data product consists of 853 748 individual casts (as of 22 August 2025) collected in a geographical zone corresponding to [35–80° N] and [42–100° W] since 1873. The data sources used to make this product were gathered from multiple sources, including DFO regional archives at the Maurice-Lamontagne Institute (MLI), the Bedford Institute of Oceanography (BIO), and the Northwest Atlantic Fisheries Center (NAFC). Other sources of data include the Fisheries and Marine Institute of Memorial University, data from international ships of opportunity archived by the Marine Environmental Data Services (MEDS), and the Polar Data Catalog. This data product also offers new opportunities to review the changes in the ocean climate of Atlantic Canada, another priority of the Government of Canada. The analysis of these data collected over more than a century also reveals the profound changes undergone by the Northwest (NW) Atlantic Ocean during that period. Climate highlights include large decadal fluctuations of temperature and salinity throughout the entire zone, as well as sustained warming trends on the Scotian Shelf and the Bay of Fundy since the early 1990s, coinciding with an important freshening on the Newfoundland and Labrador Shelf during the same period. The CASTS data product is available at https://doi.org/10.20383/103.01462 (Coyne et al., 2023).
- Article
(7283 KB) - Full-text XML
-
Supplement
(179748 KB) - BibTeX
- EndNote


The world's oceans are undergoing profound changes as a result of anthropogenic climate change (Loder and Wang, 2015; Oliver, 2019; Pörtner et al., 2019). Globally, oceans have absorbed 91 % of Earth's heat excess caused by global warming (Ranasinghe, 2022) and, as a result, oceans around the world are warming (Johnson et al., 2020). As sea ice disappears at an unprecedented rate in the Arctic and the Greenland ice sheet loses mass, the waters in the subpolar North Atlantic ocean are freshening, with potential consequences on convection in the Labrador and Irminger Seas (Yashayaev, 2024; Schiller-Weiss et al., 2024). The extent to which the recent freshening can be explained by sea ice melt and glacier runoff is an area of active research (e.g., Yashayaev, 2024). Although warming trends dominate the oceans globally, the regional scale often features strong decadal-to-multidecadal cycles that makes the characterization of any short-term trends hazardous (e.g., Percival and Rothrock, 2005). This is especially true in the Northwest (NW) Atlantic, a region at the confluence of arctic, subarctic, and subtropical waters.
The western NW Atlantic (the Canadian Atlantic Shelf) includes, from north to south, its arctic gateways (Baffin Bay, Hudson Strait, and Hudson Bay), the Newfoundland and Labrador (NL) Shelf (including the Grand Banks of Newfoundland and the Flemish Cap), the Gulf of St. Lawrence, the Scotian Shelf, and part of the Gulf of Maine (Fig. 1). These regions are under the influence of the subarctic Labrador Current system and the subtropical Gulf Stream (and its offshore extension, the North Atlantic Current), two of the most important ocean currents in the North Atlantic. Along the Labrador coast, the Labrador Coastal Current (Smith et al., 1937; Florindo-López et al., 2020), fills the NL Shelf with frigid Arctic-origin waters that spread all the way to southern Newfoundland and into the Gulf of St. Lawrence through the Strait of Belle-Isle (Petrie and Anderson, 1983; Loder, 1991; Chen et al., 2022). Further south, along the Scotian Shelf, the Gulf Stream and the North Atlantic Current, bring warm and salty water northwards along the tail of the Grand Banks before being diverted east (Loder et al., 1998). Due to this balance between waters of different origins, the NL Shelf is not only located at a crossroad of global ocean circulation, but is also subject to large natural decadal variability in its ocean climate (Loder and Wang, 2015; Cyr and Galbraith, 2021). Areas of the domain close to shore are also being increasingly influenced by continental forcings such as river runoff (Haine et al., 2015).

Figure 1Bathymetric map of the NW Atlantic and Eastern Arctic. The CIL area and the five DFO AZMP historical oceanographic stations are also given and labeled by the legend in the bottom left corner Locations referenced in the paper are also labeled directly on the map. The dashed red line shows the CASTS domain.
Hydrographic observations (temperature and salinity) have been collected regularly in this region by Canada and other countries since the mid 1800s (Deser et al., 2010). The number of ocean temperature and salinity measurements taken in the NW Atlantic is unusually high compared to other regions, due to the presence of historical trade routes between Europe and North America (Deser et al., 2010). More recently, yearly oceanographic surveys, such as those from the Atlantic Zone Monitoring Program (AZMP; Therriault et al., 1998) (1998–present), have ensured consistent oceanographic coverage over the Canadian Atlantic Shelf and slope (e.g., Galbraith et al., 2025). One of the first attempts to make a comprehensive version of these historical data publicly available was made by Gregory (2004). The database referred to as Climate has been a great asset for years, but was not updated or maintained beginning about 2009 due to the lack of dedicated funding. Since 2019, the Canadian Integrated Ocean Observing System (CIOOS), Canada’s nucleus for integrated ocean science and observing activities, is working to create an open-access national platform that facilitates data discovery for end-users. Some of the data presented in this study are already present in CIOOS, and this number is expected to grow in the years to come.
This paper presents the Canadian Atlantic Shelf Temperature-Salinity (CASTS) data product (Coyne et al., 2023), the culmination of efforts to provide an openly accessible data product that contains the bulk of temperature and salinity casts made in the NW Atlantic its Arctic gateways since 1873. CASTS focuses on temperature-salinity profiles, while removing glider, mooring, and seal-borne probes due to data formatting difficulties (e.g. high temporal frequency measurements, non-vertical profiles, etc.) when integrating these specific data sources. Temperature and salinity data from these sources may be added at a future date. This initiative does not aim to be a database or claim to have all available data, but rather to provide an easily accessible and organized data product. CASTS applicability is diverse (e.g., academic research, environmental assessment, model validation) and is already being used to validate ocean prediction systems in Eastern Canada (Paquin et al., 2024).
This data paper is organized as follows. First, the methodology behind CASTS, including source descriptions and quality assurance/control, is presented in Sect. 3. The data aggregation and quality control are described in Sect. 4. Section 5 then describes the CASTS structure, including the number of profiles per year, the source per year, and the instrument type used per year. Section 6.1 investigates depth-averaged temperature, depth-averaged salinity, and stratification at five historic oceanographic stations along the NW Atlantic Shelf. In Sect. 6.2, we investigate the changes in the mean thickness and mean minimum temperature of the cold intermediate layer (CIL) in the Northwest Grand Banks between 1950 and 2024. Lastly, in Sect. 9 we discuss the long-term observed changes in depth-averaged temperature, salinity, and stratification and conclude with an overview of the ecological implications of these changes.
The Canadian Atlantic Shelf can be roughly defined as the region of the Eastern North American Continent from the southern tip of Nova Scotia (thus including the northern part of the Gulf of Maine) to Davis Strait at the border with the Arctic Ocean, and from the coast to the beginning of the continental slope down to 2000 m depth (Fig. 1). Since 1998, a large part of this region has been closely monitored by Fisheries and Oceans Canada (DFO) as part of the AZMP (Therriault et al., 1998). While this work focused on this area (e.g. most Figures and results presented herein), the search for data was extended beyond these limits to include large parts of the NW Atlantic Ocean and its Arctic gateways down to 5000 m depth. We adopted the same geographical limits as the one used for the Climate database: [35–80° N] and [42–100° W] (Gregory, 2004, see also Sect. 3.3.1).
The data product presented here is the results of years of searching, processing, and cleaning historical data archived in national, regional, or institutional data bases. Thirteen data sources were selected on the basis of researchers' knowledge and data availability. These sources are individually introduced here, starting with the World Ocean Database and then ordered in chronological order of the start date. Information on how they were pre-screened is also provided. At the end of this step, all data sources were averaged in vertical pressure bins 1, 10, or 100 dbar (depending on depth) from the surface to 5000 dbar and converted into Network Common Data Form (NetCDF) file format to facilitate further manipulation.
3.1 World Ocean Database (1873–1910, 2008–2018)
Temperature and salinity measurements were taken from the World Ocean Database (WOD) from 1873 to 1910 and 2008–2018. The following years have no data available; 1874–1876, 1878–1882, 1888, 1890–1894, 1896–1897, 1899, 1901, 1904, and 1911. Data were gathered specifically from 2008 to 2018 to decrease our dependence on the BIO Ocean Monitoring and Modelling (BIO-OMM) data product (Sect. 3.3.3). The WOD is a collection of quality-controlled physical, chemical, and biological ocean profiles taken globally from 1772 to present (Mishonov et al., 2024). Updates to the dataset are carried out every 3 months. For our purposes here, we early collect temperature and salinity measurements (1873–1910) from the ocean station data (using reversing thermometers or buckets) and mechanical bathythermograph (MBT) data. Both categories typically have a low vertical resolution, with many profiles only containing a few measurements. WOD temperature and salinity profiles undergo a suite of quality assurances and controls, including data formatting, measurement position and time, gradients, and variable ranges (Mishonov et al., 2024). This gives us confidence to use and compare measurements taken over multiple time periods. Included in the WOD database and relevant for this study, are occupations of the Halifax section by the research vessel Challenger (Mishonov et al., 2024). Data were only selected up to 1910 to ensure minimal duplicate casts with other sources. There are also missing years between 1873 and 1910 where no data is available. More recent temperature and salinity data (2008–2018) were collected from conductivity temperature depth (CTD) sensor, ocean station data, profiling float, expendable bathythermograph (XBT) (none available upon time of download), and undulating oceanographic recorder (towed CTD).
3.2 Northwest Atlantic Fisheries Centre (1912–2024)
DFO's Northwest Atlantic Fisheries Centre (NAFC) Oceanography Section provided temperature and salinity casts from 1912 to 2024. Data were retrieved in three ways, as described below.
3.2.1 Northwest Atlantic Fisheries Centre Oceanography Section (1912–2024)
The NAFC regional data center has historical observations collected by Canada, the United Kingdom, France, and other countries. In addition, to retrieve ships of opportunity, profiling floats and other data collected in the region, but not necessarily shared with the regional data center, the NAFC created a routine to mirror DFO’s centralized database at MEDS and further converted them into the same format as the data processed directly at the NAFC.
These data includes historical (since 1912) and more recent casts collected by non-DFO programs (e.g., the groundfish survey realized in the Northwest Atlantic Fisheries Organization (NAFO) division 3M by the European Union (EU)). Thus, a large part of the data collected in this second step overlaps with the data present in the Climate database discussed in Sect. 3.3.1 (Gregory, 2004). A duplicate removal scheme is described below. In addition, a large part of the data collected after the creation of the AZMP in 1999 have already been archived on CIOOS (see next Section), and therefore most of the data referred to in this section are pre-1999, although not limited to.
The casts retrieved were all converted into the same ASCII (American Standard Code for Information Interchange; a character-based encoding format) house-format commonly referred to as .pfiles. All casts collected recently using Seabird probes are automatically processed within the Seabird Data Processing software. This includes a variable-dependent low-pass filter, derivation of measurements from raw sensor data, and bin averaging. The metadata provided includes latitude, longitude, time, instrument type, instrument identification, trip identification, and data type. If the data type for a specific cast was Global Telecommunications System (GTS) (prefix TE- or BA-), it was removed from the dataset (see Sect. 3.3.1 for more details).
Unlike casts obtained from other sources, the temperature and salinity cast files from NAFC had not all been quality controlled. Therefore, additional steps were required before the casts could be combined with all other sources. First, casts that contained abnormalities were flagged and not considered for further analysis. These include casts with missing or non-sensical latitudes (outside []° N range), longitudes (outside []° W range), and time records (impossible recordings or time in the future, for example). Casts would also be ignored if there was no pressure record or if the temperature and salinity variables were empty. If no irregularities were found, temperature and salinity measurements would be bin-averaged according to pressure from surface to 5000 dbar using 1 dbar vertical resolution and converted from .pfile into yearly NetCDF files. Note that for some files, only the depth (in m) was available, so we used the latter as an approximation for the pressure. Latitude, longitude, cast identification, comments, instrument type, instrument identification, sounder depth, and time were also recorded. During the 1960s and 1970s, negative temperature measurements taken from MBTs were incorrectly recorded as either 0 values or switched to positive (−1.5 °C becomes 1.5 °C for example). These casts were manually removed from the data product after an exhaustive visual inspection of the meta data (this problem only affected data that originated from one source).
If two or more casts in the combined dataset were taken within the same 10 min period, and were within 0.01° latitude/longitude from one another, they were flagged as duplicates. Then, all flagged casts were visually inspected. The integrity of the profile, the number of measurements, the inclusion of temperature and salinity data, and the type of data were all considered during the visual inspection. If two comparative casts using different data types were flagged, such as an XBT cast and a bottle cast, both were kept. In cases where two or more reasonable casts of the same data type were flagged, the cast with the most temperature and salinity measurements would be kept. If all flagged duplicate casts had the same number of measurements and were all equally reasonable, the first cast was kept, and all others were removed.
After the removal of empty (3032 profiles removed) and duplicate casts (1225 profiles removed), outlier measurements and profiles were flagged and removed. The process of removing outliers is as follows. First, a monthly spatial “climatology” was created by binning temperature and salinity records from individual casts into 1° latitude by 1° longitude by 1 dbar level grid cells, between 35–80° N and 42–100° W. First, all measurements present in the month and the spatial area of interest, and within ±10 dbar of the depth of the sea floor were isolated. In cases where the depth window was within 10 dbar of the surface or bottom, the depth window would only extend to the surface or bottom. The depth averages of each of the measurements were found to ensure that each sample was weighted equally and did not depend on the vertical resolution of the measurements. If more than three measurements were present, isolated measurements were randomly selected 100 times with replacement (i.e., bootstrap). If three or fewer measurements were present, the climatology for this pixel would remain empty (NaN) and no outlier check would be completed. The mean of the 100 randomly selected values was then found and recorded. This process was repeated 100 times, creating a list of 100 means. The mean and standard deviation (bootstrap standard error) of 100 repetitions were then calculated. This was repeated for each depth, in each grid cell, for each month. Each NAFC Oceanography cast was compared with the mean and bootstrap standard error. If a temperature or salinity measurement was outside the mean plus or minus 40 times the bootstrap standard error, then the measurement was flagged as an outlier. If 25 % or more of the measurements in a cast were flagged as outliers, then the entire cast was classified as suspect and removed. If both the temperature and salinity casts exceeded the 25 % threshold, then the resulting empty cast was also removed (169 profiles removed). The remaining clean casts were kept.
3.2.2 Northwest Atlantic Fisheries Centre Canadian Integrated Ocean Observing System (1983–2024)
NAFC-sourced data acquired in the NL region through multiple ship-based monitoring programs from DFO (e.g., AZMP, Multispecies survey, cod-tagging, capelin/crab surveys), academia (e.g. Memorial University of Newfoundland and Labrador, the Fisheries and Marine Institute of Memorial University) or industry (e.g. Northern Shrimp Research Foundation) since 1983 have been archived in collaboration with MEDS on CIOOS (Marine Environmental Data Section, 2024a, b, c, d, e). These data are regulary updated and cover the period 1983–2024, except for Station 27 data that cover the period 1946–2024. They are readily available in NetCDF format.
These casts were collected with instruments comparable to those from DFO, such as standard Seabird CTD/Rosette or XBTs, and processed within the NAFC using a set of routines described in the Marine Environmental Data Section (2024a, b, c, d, e). They have been thoroughly quality-controlled.
3.2.3 Northwest Atlantic Fisheries Centre Aquaculture Section (2009–2022)
Temperature and salinity casts (2009–2022) were gathered from the Aquaculture Section of DFO Newfoundland and Labrador Region. The metadata includes latitude, longitude, and time. CTD casts were part of field operations carried out in the south coast (Coast of Bays), southeastern coast (Placentia Bay), and Notre Dame Bay (South Arm) areas of Newfoundland, mostly in May and November each year, for approximately 10–15 d (Donnet et al., 2018; Sharpe et al., 2024). These CTD data were mainly coastal, typically within 30 nm from shoreline. Individual CTD profiles were processed and quality-controlled using Sea-Bird Electronic data analysis software and averaged to 1 m bins as described in Donnet et al. (2018).
3.3 Bedford Institute of Oceanography (1913–2024)
3.3.1 Bedford Institute of Oceanography – Climate (1913–2010)
The Ocean Science Hydrographic Climate Database (or simply Climate) was a comprehensive open access collection of temperature and salinity data for the NW Atlantic and the Eastern Arctic (Gregory, 2004). Its domain ranges from [35–80° N] and [42–100° W]. The data forming Climate comes from a variety of sources including hydrographic Niskin/Nansen bottles with reversing thermometer, CTD casts, profiling floats, spatially and temporally averaged Batfish tows, XBTs, digital bathythermographs (BT), and MBTs. Near real-time observations of temperature and salinity from the GTS were also included for later years, but were removed as part of this study due to the lower vertical resolution of the profile. At the time of publication, the database consisted of approximately 850 000 profiles and 35 million individual observations between 1913 and 2010. The vertical resolution ranged from 1 m (for CTDs) to ∼ 10–100 m for traditional bottle casts.
Climate has been a great asset for various scientists, researchers, industry, and government clients who were interested in accessing hydrographic data in Atlantic Canada from its inception in 2004 to the mid 2010s. The problems associated with this database prior to it being taken off line were primarily two-fold: (1) there was no centralized archive responsible for gathering all regional DFO data on an annual basis and Climate rapidly became incomplete following 2010; (2) Some observation profiles were duplicated (e.g., low resolution GTS data, raw full resolution profile and quality-controlled vertically binned data of the same profile may all be present in the database) without simple ways to filter them. These problems eventually led to the decision to put Climate offline in the late 2010s.
An offline version of Climate was accessed from archived files at the Bedford Institute of Oceanography (BIO). This file contained all the data between 1913 and 2010, a year before the problems mentioned above started to become prominent. The metadata included latitude, longitude, time, cruise identification, cruise date, cruise time, station identification, flag, and data type (e.g., GTS, CTD, bathythermograph). At this stage, no further quality control was performed other than those described in Gregory (2004). These include the assumption that casts originating from institutions outside of BIO were validated independently and the application of a suite of 25 tests including metadata and climatological checks based on UNESCO (1991) real time quality control manual. Low resolution data originating from the GTS, that is, casts whose data type prefix is TE- (temperature salinity and current GTS message) and BA- (GTS low resolution for XBTs and Bathythermograph (BTs)), were removed from further consideration. A known issue concerning the rounding of time values to midnight or noon was investigated, but no additional duplicate casts were found because of this practice. The entire database was vertically averaged into 1 dbar pressure bins and converted into NetCDF file format.
3.3.2 Bedford Institute of Oceanography Canadian Integrated Ocean Observing System (1996–2024)
The CIOOS – Environmental Research Division's Data Access Program (CIOOS-ERDDAP) temperature and salinity casts for the Maritime region were gathered from 1996 to 2024. The metadata includes latitude, longitude, time, project name, platform name, platform identification, cruise name, cruise number, station identification, and event number. Three NetCDF files were pulled from CIOOS-Atlantic, all sourced from BIO (Marine Environmental Data Section, 2023a, b, c). They include the AZMP, the Atlantic Zone Off-Shelf Monitoring Program (AZOMP), and the Maritime Region Ecosystem Survey. Before 2016, the CTD files were quality controlled by visually checking metadata and profiles. On top of what was done previously; starting in 2016, quality flag fields were added to the files and have also been run through a suite of Global Temperature and Salinity Profile Programme (GTSPP) automated checks (code initially developed at Maurice Lamontagne Institute (MLI)). The file header indicates what type of quality control was performed on each file. The metadata included in the file also indicates if any of the sensor data were calibrated by a post-cruise calibration process. The retrieved files were bin-averaged according to depth from surface to 2000 m using 1 m vertical resolution and converted into individual NetCDF files.
3.3.3 Bedford Institute of Oceanography Ocean Monitoring and Modelling Section (2008–2018)
After the shelving of Climate, a collection of profiles from databases in MS Access format were created at BIO, once per year between 1999 and 2018 for internal reporting on the Gulf of Maine, the Scotian Shelf and part of the Gulf of St. Lawrence (Roger Pettipas, personal communication, 2018). This data product is referred to as here as the BIO Ocean Monitoring and Modelling (BIO-OMM). The temperature and salinity profiles were collected directly from multiple organizations, including BIO (Climate), the Maurice-Lamontagne Institute, the US National Oceanic and Atmospheric Administration National Marine Fisheries Service, the Northeastern Regional Association of Coastal Ocean Observing Systems, and Ocean Tracking Network. Metadata including cruise number, latitude, longitude, time, maximum pressure, sounding, and station identification were also taken from each of the sources listed above.
This dataset was manually curated over the years and contains very little metadata to track the original source. For example, the station identification is not unique between databases, and two unrelated unique casts may share the same station identification. In recent years, the station identification field was constructed (where possible) as a maximum 12 digit double precision integer, with year (4 digits), cruise number (3 digits) and station number (4 digits). If a cruise number were duplicated, an additional zero was added. Various manual quality controls were performed on the combined dataset, including duplication, checks of nonsensical latitudes and longitudes, and time checks but it is difficult to determine specific methodologies. The Microsoft Access databases were converted into two .RData files and provided to us for the period 2008–2018.
Although this dataset overlaps with many other products used in this study, preliminary analyses suggested that it fills an important gap following the shelving of Climate and before the more recent data management effort described above, which led to archival with CIOOS. However, additional quality control of these data was needed.
Temperature and salinity casts from ocean gliders or moorings were ignored. CTD casts which are duplicates of GTS data could not be filtered out using the data type field because it is not provided in this data source. Instead we opted for a filtering strategy based on the number of temperature measurements per cast. Casts obtained from GTS in the Climate database between 1913 and 2010 have on average 3 or fewer temperature measurements. Based on this, all casts with 3 or fewer measurements between 2008 and 2018 were removed from the dataset. The remaining casts have an average of 155±38 measurements per cast. Therefore, we cannot be certain if all GTS-sourced casts were removed, but all casts have a higher number of measurements per cast compared to the average for GTS-sourced casts from Climate. As explained further, a duplicate removal scheme is applied to all data sources and gives lower priority to this dataset.
3.4 Maurice-Lamontagne Institute (1972–2024)
Temperature and salinity casts from the MLI AZMP data collection from 1972 to 2024 were in the form of one grouped ragged (https://cfconventions.org/, last access: 15 September 2018) NetCDF file. Most of the casts collected by MLI were taken from the Gulf of St. Lawrence. The casts provided were collected directly by the MLI or by other regional DFO offices near the Gulf of St. Lawrence. The casts were quality controlled using the UNESCO 1990 real-time quality control manual (UNESCO, 1991), which includes criteria for testing metadata and climatology. Tests were also conducted across casts from the same mission and visual tests were also completed.
3.5 Northeast Fisheries Science Center (1981–2024)
Casts sourced from the Northeast Fisheries Science Center (NEFSC) were collected from 1981 to 2024 (no data were available during 1983 and 1984). The metadata includes latitude, longitude, time, country code, ship code, cruise code, cast number, deployment method, CTD serial number, and station number. Temperature and salinity data were collected from southern New England to the southern Scotian Shelf as part of routine monitoring programs by both NEFSC and DFO, with DFO sampling the northern Gulf of Maine and the southern Scotian Shelf as part of AZMP (Clark et al., 2022). From 1981 to 1987, most of the temperature and salinity measurements taken by NEFSC used bottles. All NEFSC CTD temperature and salinity measurements were processed using the Sea-Bird Electronics Data Processing Program. NEFSC CTD data were further processed using a visual quality control suite developed by NEFSC to flag low-quality or suspicious data. Quality control methods vary depending on the instrument type and time of measurement. After individual casts were processed, density instabilities were flagged and removed. Outlier detection is handled on a case-by-case basis. Different factors are considered when determining the reliability of abnormal temperature and salinity events (as an example, is the salinity cast close to a high river outflow event). All DFO CTD casts were post-processed using the CTD Data Acquisition and Processing System, developed by BIO (Clark et al., 2022). This application downloads, processes, and saves the cast output in open document format (ODF). The resulting ODF files contain bin-averaged variables in intervals of 1 dbar. These files were converted into individual NetCDF after retrieval.
3.6 European Union – Northwest Atlantic Fisheries Organization (1988–2021)
Temperature and salinity measurements beyond Canada's Exclusive Economic Zone around the Flemish Cap and near the tail of the Grand Banks were collected by the EU as part of the NAFO and International Council for the Exploration for the Sea (ICES) surveys since 1988. These data are annually provided to NAFO via DFO MEDS. Quality checks and control are performed by the institutions responsible for the data collection, such as the Spanish Institute of Oceanography (IEO) and the Portuguese Institute for the Ocean and Atmosphere (IPMA).
The core of the EU-survey data presented here have been received directly from IEO for the years 1988-2020 (Casas et al., 2025). Profiles were taken using the SBE25 CTD and quality controlled using Sea-Bird's own routines following UNESCO's 1990 methodology (UNESCO, 1991). This subset was completed with data received on a year-to-year basis (such as for year 2021 and for previous year from other sources such as IPMA). Years 2022–2024 are currently missing. We are currently working directly with EU institutions responsible of the survey to update those data. This update will be reflected in a future version of CASTS.
3.7 National Centers for Environmental Information (1990–2024)
The National Centers for Environmental Information – GTSPP (NCEI-GTSPP) casts were gathered from 1990 to 2023. NCEI-GTSPP is a joint international program that gathers temperature and salinity data from multiple organizations, performs quality control, and makes the output freely accessible in order to support global and local research programs (Sun et al., 2010). Casts, saved in individual NetCDF files, were organized according to ocean (Atlantic, Pacific, and Indian) and month. After downloading all available Atlantic casts under the “bestcopy” folder, we further isolated the area to our set domain of interest. If the data type for a cast were GTS (TE or BA), it was also removed. Finally, temperature and salinity were bin-averaged according to pressure. Multiple stages of quality control were performed on the NCEI-GTSPP casts by the provider including location and climatological tests to ensure that local outliers were flagged (Sun et al., 2010). The current quality control methodologies used by NCEI-GTSPP are outlined in Sun et al. (2010) under the quality control tab (consulted 14 May 2025).
3.8 Polar Data Catalogue (2002–2023)
Multiple sources were taken from the Polar Data Catalogue in order to provide more casts in the Arctic region. Using the Polar Data Catalogue Search tool (https://www.polardata.ca/pdcsearch/PDCSearch.jsp, last access: 27 May 2024), a spatial domain was specified between 35–80° N and 42–100° W. A time range between January 2002 and December 2024 was also specified. Lastly, the keyword “CTD” was given. Of all the sources in the resulting list, only data that were available in .int file-type format were downloaded. If the downloaded file had temperature and salinity measurements at multiple depths, the file was kept. If, instead, the file only recorded surface temperature and salinity, then it was discarded. This resulted in 32 different sources being downloaded between 2002 and 2023 (no data was available in 2003). Most of the temperature and salinity measurements available were taken as part of the ArcticNet sampling expeditions and organized as one file per mission. All temperature and salinity measurements were quality controlled according to UNESCO's 1990 algorithm standards (Simard et al., 2010). The Sea-Bird Electronic Data Processing Program was also used on casts taken after 2010. ASCII files (.int) were averaged in 1 m vertical bins from surface to 2000 m and converted into NetCDF (one file per data source).
3.9 Argo Program (2000–2025)
Temperature and salinity measurements were taken from the Argo profiling float program from 2000 to 2025. These data were collected and made freely available by the International Argo Program and the national programs that contribute to it (https://argo.ucsd.edu, last access: 19 February 2026, https://www.ocean-ops.org, last access: 6 February 2026). The Argo Program is part of the Global Ocean Observing System, deploying profiling floats in all the world's oceans, with more than two million profiles being taken since September 2018 (Wong et al., 2020). A typical Argo float moves from the surface to mid-water levels (approximately 1000 dbar) before again sinking to 2000 bar (Wong et al., 2020). The temperature-salinity profile is then taken during the upcast from 2000 dbar back to the surface. Due to the Argo profiles target depths, most profiles are taken away from the shelf in deeper waters (Fig. 4). Temperature and salinity output went through variaous levels of quality control to ensure that output drift over time was minimal. Oka (2005) determined that temperature output drifted less than 0.002 °C over several years A large number of real-time salinity output taken after 2015 were found to have a higher-than-average level of drift (> 0.01 PSS-78), although most problem measurements have been bias-corrected in the delayed-mode data stream (Wong et al., 2020).
4.1 Yearly NetCDF File Generation
Temperature, salinity, and all available metadata (latitude, longitude, time, instrument identification, instrument type, data type, trip identification, etc.) were collected from the 13 different sources mentioned above and converted into yearly NetCDF files (one file per year containing all observations available). Each yearly NetCDF file has the dimensions time (equal to the number of profiles; sorted in chronological order) and level (1130 pressure levels, 0 to 1000 dbar at 1 dbar spacing, 1000 to 2000 dbar at 10 dbar spacing, and 2000 to 5000 dbar at 100 dbar spacing), with temperature and salinity being 2D variables and all metadata (except levels) being 1D variables according to time.
In addition to all of the metadata provided by the various sources, the file name and source were also saved in each of the yearly NetCDF files. For casts that were not originally saved in individual cast formats, the grouped file was recorded. This is for the purpose of easily flagging and removing potentially problematic casts during future iterations of the CASTS data product.
An example of one yearly NetCDF file header is provided here for reference:
dimensions:
    time = UNLIMITED ; // (8606 currently)
    level = 1130 ;
variables:
    string file_names(time) ;
        file_names:standard_name = "file_names" ;
        file_names:variable_name = "file_names" ;
    string instrument_ID(time) ;
        instrument_ID:standard_name = "instrument_identification" ;
        instrument_ID:variable_name = "instrument_ID" ;
    string instrument_ID_manual(time) ;
        instrument_ID_manual:standard_name "instrument_identification_manual" ;
        instrument_ID_manual:variable_name = "instrument_ID_manual" ;
    string instrument_type(time) ;
        instrument_type:standard_name = "instrument_type" ;
        instrument_type:variable_name = "instrument_type" ;
    float latitude(time) ;
        latitude:_FillValue = NaNf ;
        latitude:units = "degree_north" ;
        latitude:standard_name = "latitude" ;
        latitude:variable_name = "latitude" ;
    int64 level(level) ;
        level:standard_name = "sea_water_pressure" ;
        level:maximum_level = "5000" ;
        level:units = "dbar" ;
        level:variable_name = "level" ;
        level:example_boundary = "level 0: (0, 1], level 4900: (4900,5000]" ;
    float longitude(time) ;
        longitude:_FillValue = NaNf ;
        longitude:units = "degree_east" ;
        longitude:standard_name = "longitude" ;
        longitude:variable_name = "longitude" ;
    float salinity(time, level) ;
        salinity:_FillValue = NaNf ;
        salinity:standard_name = "sea_water_practical_salinity" ;
        salinity:variable_name = "salinity" ;
        salinity:units = "psu" ;
        salinity:valid_min = "0" ;
        salinity:valid_max = "45" ;
        salinity:missing_value = "nan" ;
    string sounder_depth(time) ;
        sounder_depth:standard_name = "sounder_depth" ;
        sounder_depth:variable_name = "sounder_depth" ;
        sounder_depth:units = "dbar" ;
    string source(time) ;
        source:standard_name = "cast_source" ;
        source:variable_name = "source" ;
    string station_ID(time) ;
        station_ID:standard_name = "station_identification" ;
        station_ID:variable_name = "station_ID" ;
    string station_ID_manual(time) ;
        station_ID_manual:standard_name = "station_identification_manual" ;
        station_ID_manual:variable_name = "station_ID_manual" ;
    float temperature(time, level) ;
        temperature:_FillValue = NaNf ;
        temperature:standard_name = "sea_water_potential_temperature" ;
        temperature:variable_name = "temperature" ;
        temperature:units = "degree_C" ;
        temperature:valid_min = "-1.825" ;
        temperature:valid_max = "35" ;
        temperature:missing_value = "nan" ;
    int64 time(time) ;
        time:standard_name = "time" ;
        time:variable_name = "time" ;
        time:units = "seconds since 1900-01-01" ;
        time:calendar = "gregorian" ;
    string trip_ID(time) ;
        trip_ID:standard_name = "trip_identification" ;
    trip_ID:variable_name = "trip_ID" ;

// global attributes:
    :Conventions = "CF-1.6" ;
    :title = "Canadian Atlantic Shelf Temperature-Salinity (CASTS)
    Data Product, 2023, V2.0" ;
    :institution = "Northwest Atlantic Fisheries Centre, Fisheries
    and Oceans Canada (DFO)" ;
    :source = "https://doi.org/10.20383/102.0739" ;
    :references = "Coyne and Cyr et al., 2026" ;
    :description = "Temperature and salinity cast records from the
    CASTS Dataset" ;
    :history = "Fri Sep  5 14:41:20 2025: ncks -O --mk_rec_dmn time/gpfs/fs7/dfo/dpnm/joc000/
    Data/CASTS/Data_Products/5_final_product/2024.nc/gpfs/fs7/dfo/dpnm/joc000/Data/
    CASTS/Data_Products/5_final_product/2024.nc\n
    Created Fri Sep  5 12:25:19 2025" ;
    :project_url = "https://github.com/jn533213/CASTS" ;
    :comment = "This work is licensed under the Creative Commons Attribution 4.0
    International License. To view a copy of this license, visit
    http://creativecommons.org/licenses/by/4.0/." ;
    :doi = "10.20383/102.0739" ;
    :creator_names = "Jonathan Coyne, Frederic Cyr" ;
    :creator_emails = "jonathan.coyne@dfo-mpo.gc.ca, frederic.cyr@mi.mun.ca" ;
    :geospatial_lon_max = "-42degE" ;
    :geospatial_lon_min = "-100degE" ;
    :geospatial_lat_min = "35degN" ;
    :geospatial_lat_max = "80degN" ;
    :file_year = "2024" ;
    :keywords = "Ocean Science, Ocean Temperature, Ocean Salinity, Historical Data" ;
    :NCO = "netCDF Operators version 5.0.6
    (Homepage = http://nco.sf.net, Code = http://github.com/nco/nco)" ;
}
Note that the fact that all yearly files have the same vertical axis (level) allows a rapid manipulation of the entire data product using dedicated software. For example, using the Python module Xarray (https://docs.xarray.dev/en/stable/, last access: 13 January 2023), the entire data product can be loaded into memory using one simple command:
    >> xarray.open_mfdataset
     ("path/to/my/files/*.nc")
Once data from all sources were aggregated into yearly files, multiple duplicates and non-physical measurements still remained in the product. These are removed next.
4.2 Non-Physical Data Removal
Temperatures greater than 35 °C and less than or equal to −2 °C were identified as non-physical and removed from individual casts. Salinities greater than 45 and less than 0 were also removed. Temperature and salinity profiles containing more than three measurements, and having a standard deviation equal to 0, were also removed.
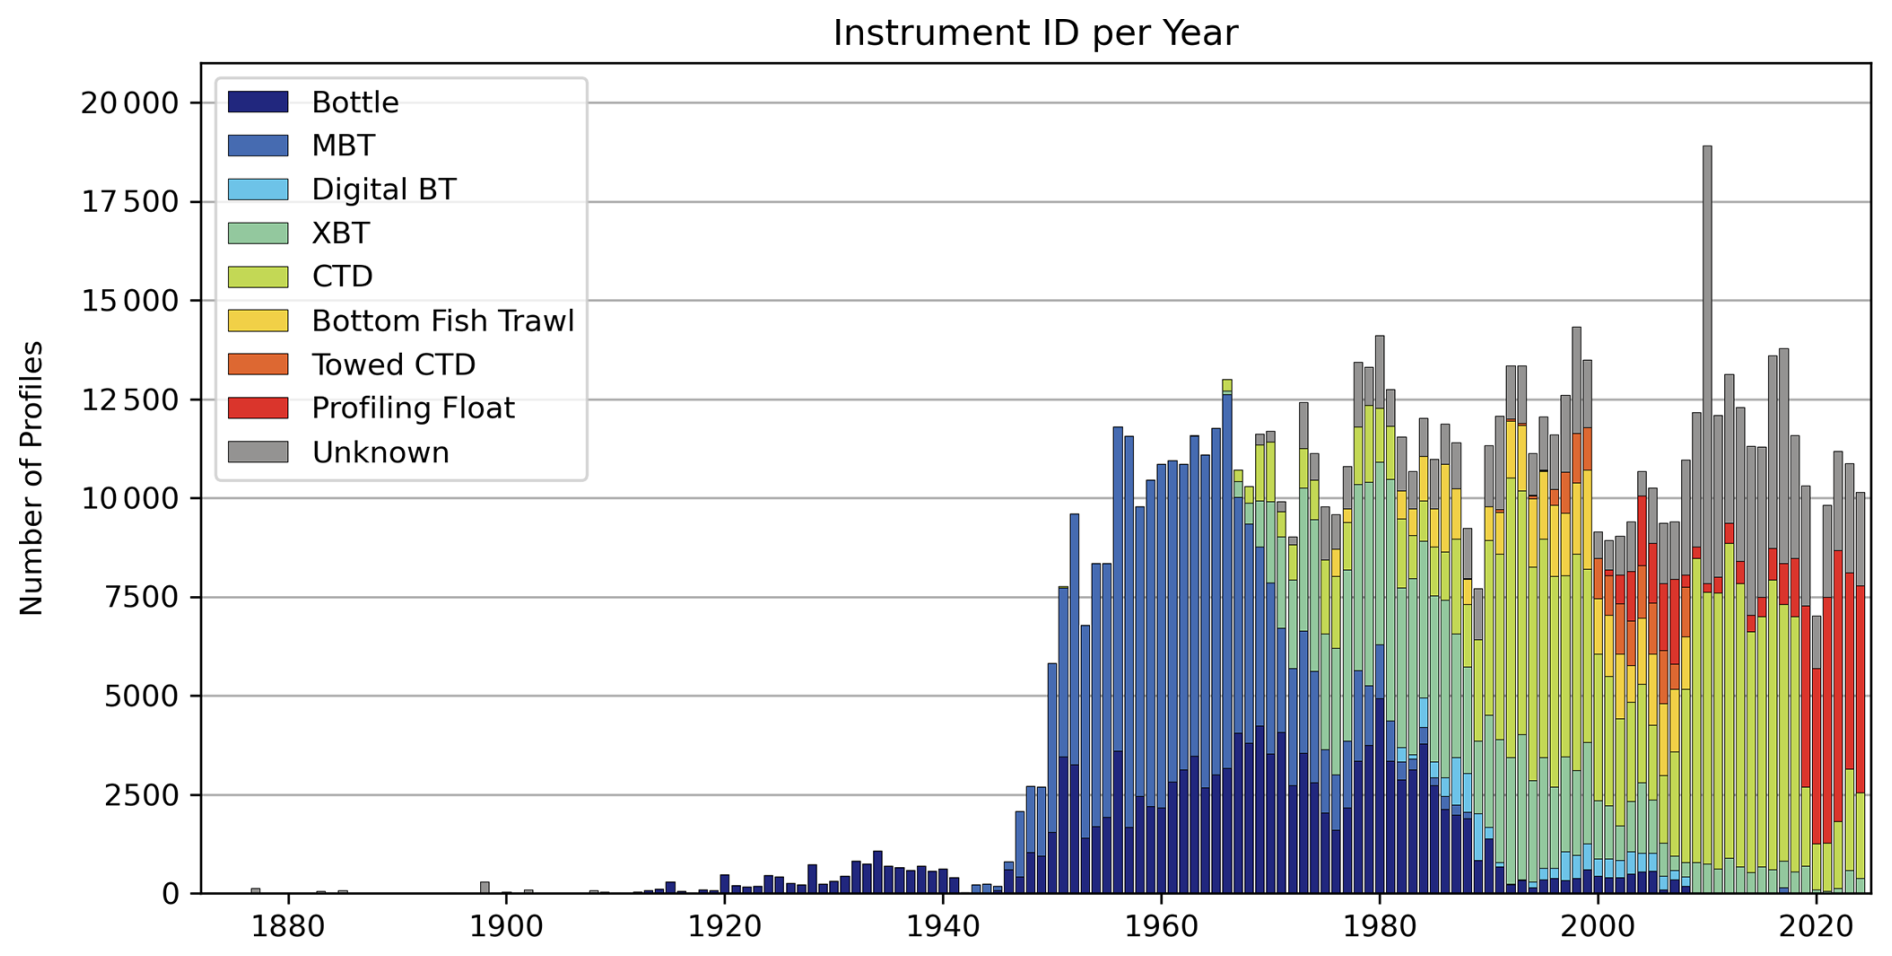
Figure 2Number of occurrences for each instrument type per year (1873–2024) using the CASTS instrument identification variable. The instrument identification of each cast and its corresponding colour is given in the legend in the top left corner. Profiles with an empty or unique instrument identification were categorized as unknown. The large number of unknown profiles from 2008 to 2018 are associated with the BIO-OMM data source where instrument identification is not provided.

Figure 3Number of profiles associated with each CASTS source (1873–2024) using the CASTS source variable. The source and its corresponding colour are given in the legend in the top left corner.
4.3 Duplicate Removal
The duplicates that were flagged and removed are mainly Climate and NAFC-Oceanography sourced until the year 1990. After this, the majority of flagged duplicates are split between Climate, NAFC-Oceanography, and NCEI. This duplicate check differs from the one performed on NAFC-Oceanography sourced casts (Sect. 3.2.1). If two or more casts in the combined dataset were taken within 10 min of each other and were within 0.01° latitude/longitude of each other, they were flagged as duplicates. Given that casts sourced from Climate went through an exhaustive quality control process (Gregory, 2004) while other historical sources such as NAFC-Oceanography did not, we therefore gave priority to the Climate data set. This means that if at least one of two or more flagged duplicate casts was sourced from Climate, the latter would be kept if it contains at least 90 % of the measurements compared to all other casts. The rationale for this procedure is that CTD profiles that may have been trimmed to remove outliers near the bottom or the surface may have smaller data return than their original counterpart, but should be given priority.
The number of measurements in a cast is the total sum of the temperature and salinity measurements present. In cases where only Climate casts were flagged as duplicates, the cast with the highest number of measurements would be kept. In cases where no Climate casts were flagged, the cast with the highest number of measurements was kept. Unlike the NAFC-Oceanography duplicate methodology (Sect. 3.2.1), the combined CASTS duplicate methodology does not contain a visual inspection component. In cases where one CIOOS-NAFC and one NAFC-Oceanography cast were flagged, the CIOOS-NAFC cast was kept. Similarly, in cases where one CIOOS-BIO and one BIO-OMM cast were flagged, the CIOOS-BIO cast was kept.
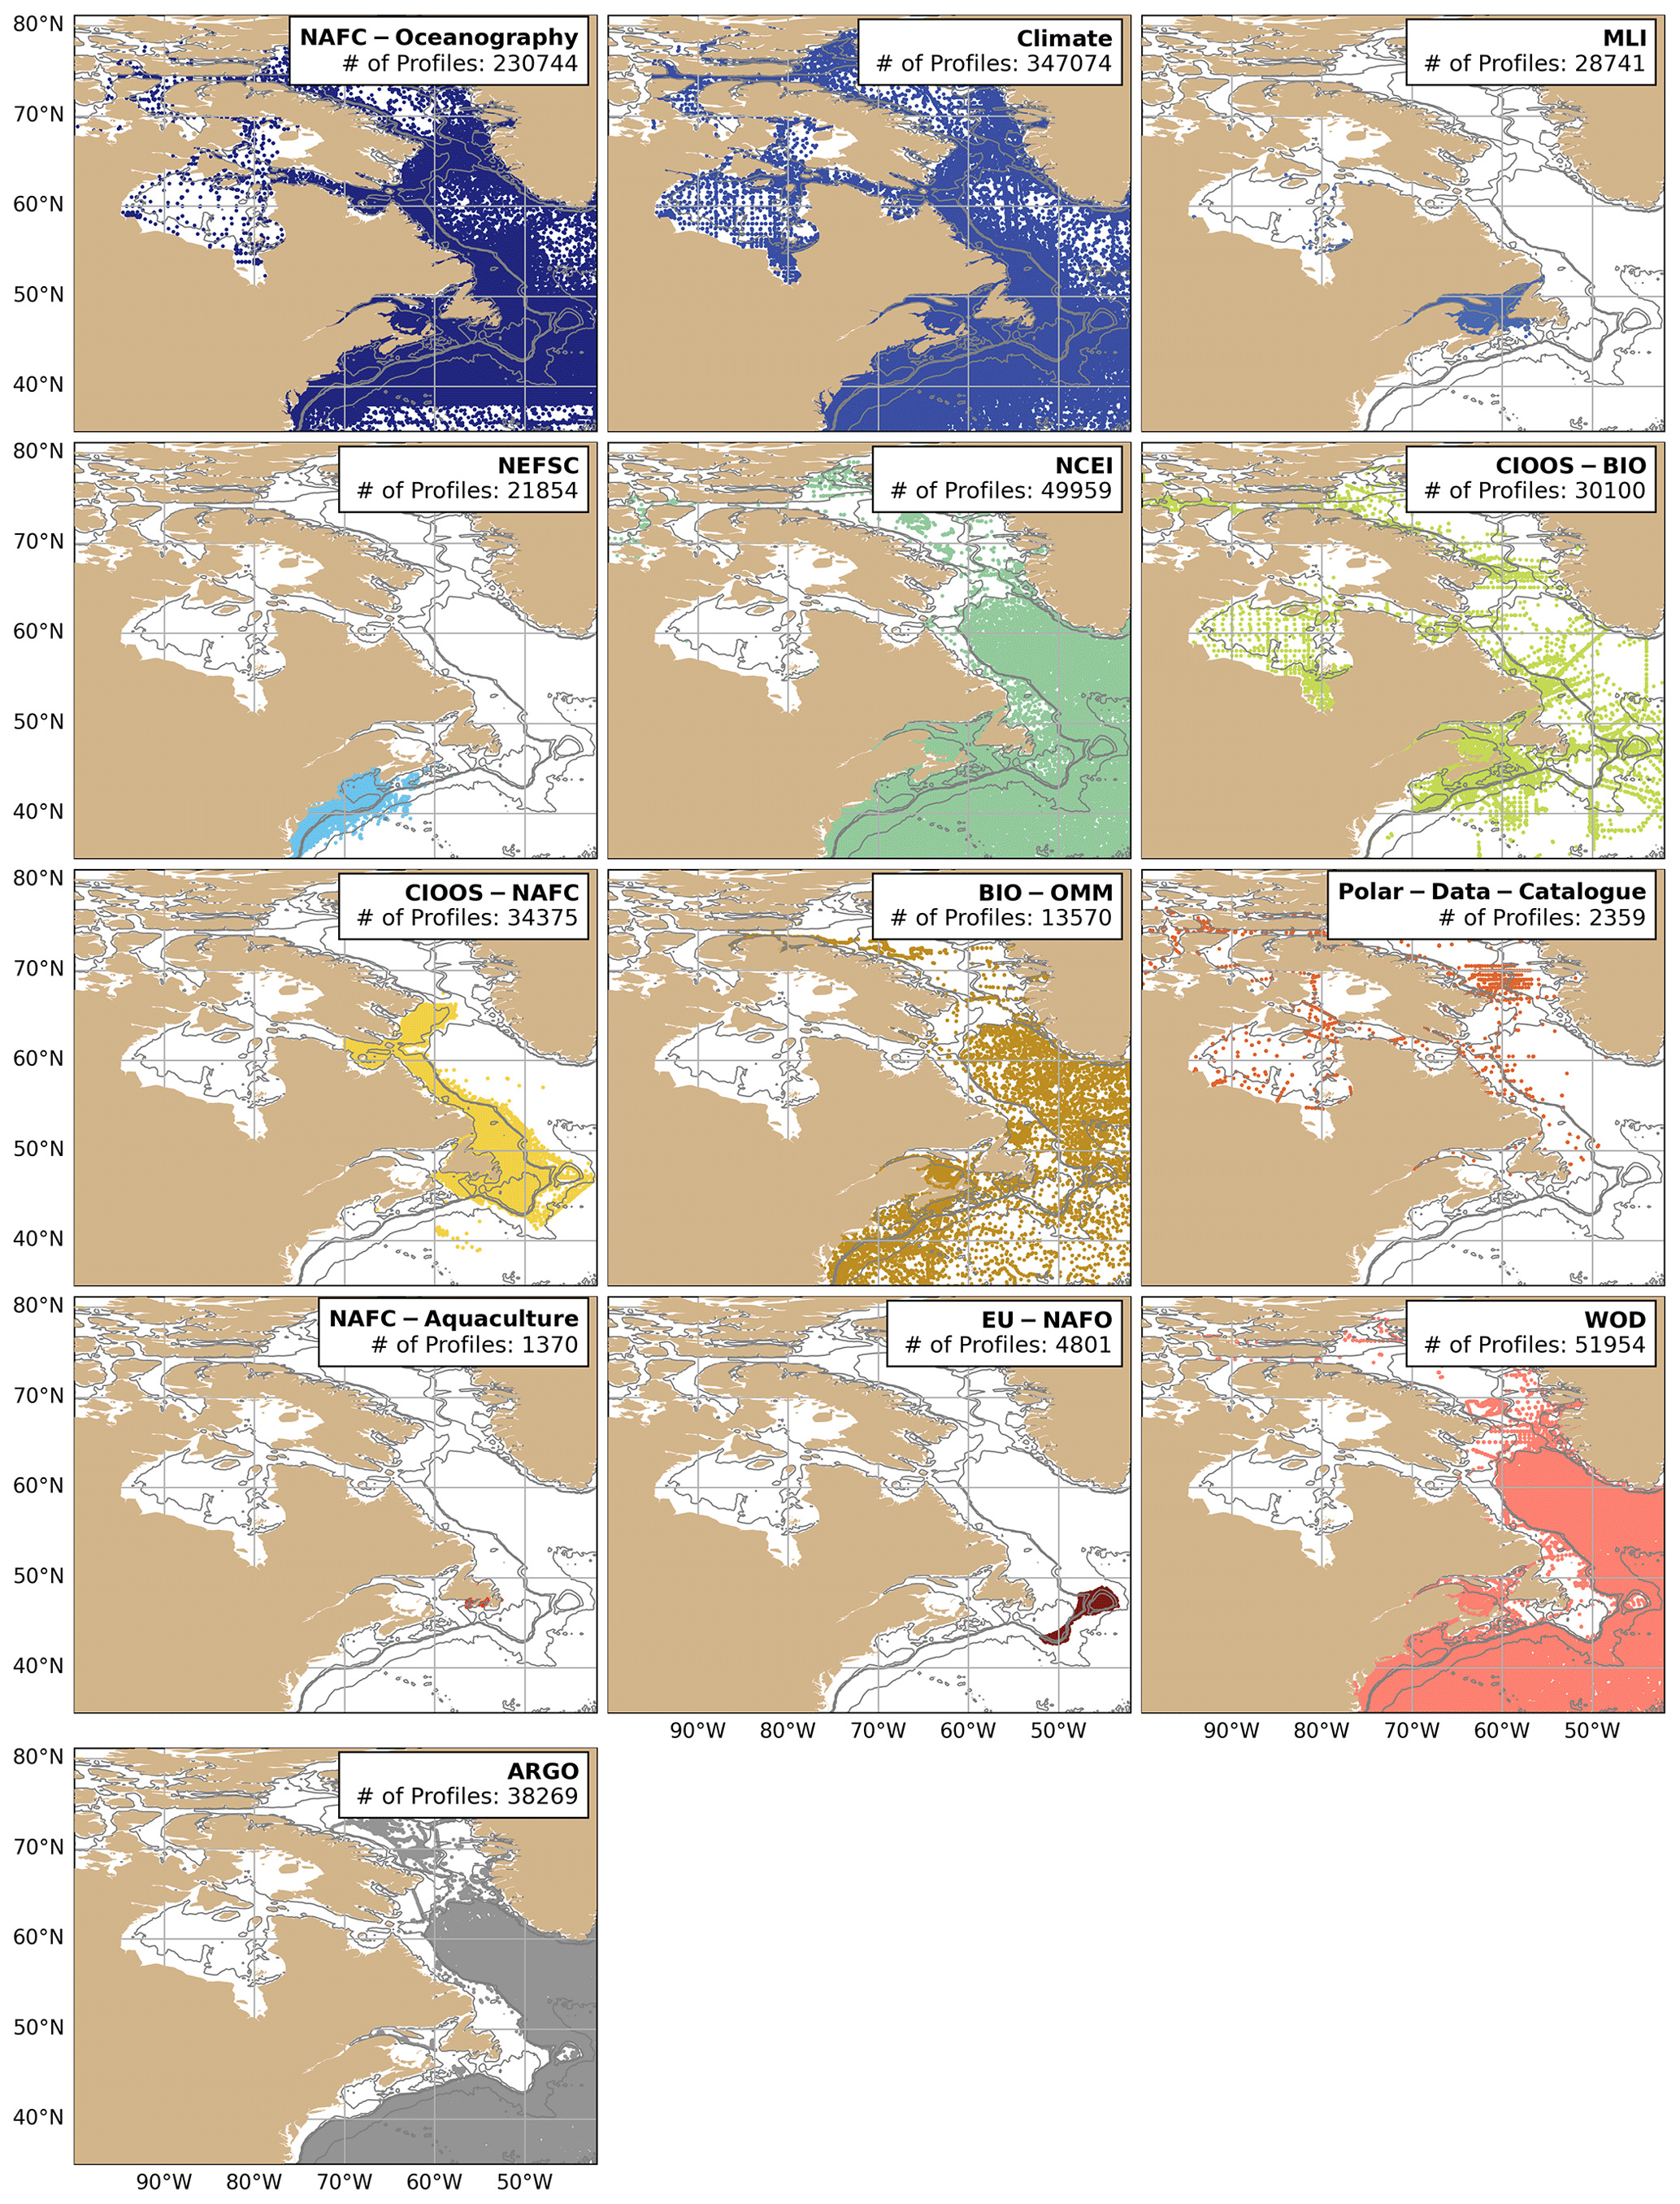
Figure 4Distribution of profiles organized by source (1873–2024) using the CASTS source variable. The name of the source and the number of profiles associated are given in the top right corner of each subplot. The lines of constant latitude and longitude are also provided. Isobaths are shown at 100, 500, 1000, and 4000 m.
4.4 Depth of Cast Check
Some casts were observed to have depths at levels far deeper than the recorded bathymetry at the cast location. In order to address this issue, a simple depth check was implemented. For each cast, the depth of the deepest measurement of this cast was determined. For the same location, the depth of the seafloor was determined using the General Bathymetric Chart of the Oceans (GEBCO Bathymetric Compilation Group, 2023). If this deepest measurement exceeded the depth of the seafloor by 200 m or more, then the cast was flagged and removed. The Intergovernmental Oceanographic Commission (2010) recommends a 50 m cut-off to allow for the possibility of slight variations in profile location along the shelf break without entirely removing the profile. After inspection of the data, we instead chose a 200 m depth cut-off to account for larger uncertainties in bathymetry in some areas of the domain (slopes, seamounts, and canyons, especially in the northern parts of the domain and remote locations). 1388 profiles were removed during this step.
4.5 Climatological Check
The climatological check is similar to the one performed initially with NAFC-Oceanography data (Sect. 3.2.1). A monthly, spatial “climatology” was created by binning temperature and salinity records from individual casts into 1° latitude by 1° longitude by 1 dbar level grid cells, between 35–80° N and 42–100° W. First, all measurements present in the month and the spatial area of interest, and within ±10 dbar of the depth of the sea floor were isolated. In cases where the depth window was within 10 dbar of the surface or bottom, the depth window would only extend to the surface or bottom. The depth averages of each of the measurements were found to ensure that each sample was weighted equally and did not depend on the vertical resolution of the measurements. If more than three measurements were present, isolated measurements were randomly selected 100 times with replacement (i.e., bootstrap). If three or fewer measurements were present, the value would remain empty (NaN). The mean of the 100 randomly selected values was then found and recorded. Then, this process was repeated 100 times, creating a list of 100 means. Then, the mean and standard deviation (bootstrap standard error) of 100 repetitions were calculated. This was repeated for each depth, in each grid cell, for each month.
Each temperature and salinity profile was then compared to the previously determined climatology. If a temperature or salinity measurement was outside the mean plus or minus 40 times the bootstrap standard error, then the measurement was identified as an outlier. No manual comparison check was performed. If 25 % or more of the measurements in a cast were flagged as outliers, than the entire profile was removed. If both the temperature and salinity profiles were completely removed, then the resulting empty cast was also removed. 1553 profiles were removed during this step.
4.6 Manually Defining Stations of Interest and Instrument Identification
A list of stations of interest was created and used to manually define stations of interest (provided in the Supplement, file Station_ID.xlsx). Stations of interest include historical and current AZMP, AZOMP, and ocean weather ship (BRAVO, DELTA, etc.) stations. Casts that have a location within 0.0125° of these stations had the station identification metadata manually set to the relevant station of interest. If a cast location did not match any of the stations of interest, its station identification was set as empty. Manually defined stations for each cast are stored in the variable station_ID_manual of the NetCDF files, while the variable station_ID contains the station names that were present in the original metadata, when available.
The types of instrument identification were organized into the following categories: bottle, MBT, digital BT, XBT, CTD, bottom fish trawl, towed CTD, and profiling float (Fig. 2). Profiles that did not fit into these categories or did not have associated instrument identification information were left blank. A list of strings used to define each category is provided in the Supplement (file Instrument_ID.xlsx). Manually defined instrument identifications for each cast are stored in the variable instrument_ID_manual of the NetCDF files, while the variable instrument_ID contains the instrument identifications that were present in the original metadata, when available.
4.7 Methodology Overview
An outline of the methodology is provided here for reference:
-
Data are gathered from 13 different sources and pre-screened. Files are restructured into NetCDF format with time and level (pressure) as the dimensions; Data are binned vertically along the level dimension from 1 to 5000 dbar with a 1 dbar resolution;
-
NAFC-Oceanography sourced profiles are put through quality control:
- a.
Empty profiles are removed;
- b.
Duplicate profiles and problem bottle/MBT profiles are removed;
- c.
A climatology is created using only NAFC-Oceanography profiles;
- d.
Outliers are removed from NAFC-Oceanography based on the climatology created above. New empty profiles as a result of outliers are also removed;
- a.
-
All data sources are brought together, including NAFC-Oceanography, and converted into combined yearly files (one NetCDF file per year containing all available data);
-
Data are binned vertically along the level dimension from 1 to 1000 dbar (1 dbar resolution), 1000 to 2000 dbar (10 dbar resolution), and 2000 to 5000 dbar (100 dbar resolution).;
-
Duplicate profiles are removed from the combined dataset;
-
The region of the dataset is restricted, removing all casts outside of 35–80° N and 42–100° W;
-
Blanket cutoffs are put in place for temperature and salinity to remove measurements that are improbable. New empty profiles as a result of these cutoffs are also removed;
-
A depth check is performed on each profile to ensure that the profile depth reflects local bathymetry;
-
A new, combined-source climatology is created using this new combined dataset;
-
Outliers are removed from the combined dataset according to the combined dataset climatology (not just NAFC-Oceanography this time);
-
The manually set station identification and instrument identification variables are created for each profile when the associated metadata is available.
In total, CASTS (1873–2024) contains 849 695 individual profiles, including 103 625 995 individual temperature measurements and 66 916 630 individual salinity measurements as of January 2026. Profiles were taken from 13 different sources and span from the Mid-Atlantic Bight to Hudson Bay and Baffin Bay. The yearly NetCDF files can be found on the Federated Research Data Repository (FRDR, https://www.frdr-dfdr.ca/repo/, last access: 19 February 2026) website and will be regulary updated (e.g. targeted release in the summer of the following year) (Coyne et al., 2023).
All profiles taken before 2008 come mainly from NAFC-Oceanography, Climate and NCEI (Fig. 3). After 2008 and the discontinuation of Climate, BIO-OMM, WOD, and Argo makes up a larger portion of the total number of profiles. Finally, from 2018 onward, the majority of profiles come from NCEI, NAFC-Oceanography, CIOOS-NAFC, and Argo. From 1999 to present, the majority of NAFC-Oceanography profiles come from AZMP and Multispecies survey trips (Cyr et al., 2024b). Climate, NAFC-Oceanography, and WOD are respectively the first, second, and third highest contributors to CASTS in terms of number of profiles (Fig. 3). The majority of profiles are taken during the summer and ice-free months. Each month from May to September contains over 10 % of the total number of profiles taken. The least number of profiles were taken during January and December, at 4.3 % and 3.8 % respectively
The spatial distribution of profiles largely depends on the source. NAFC-Oceanography, Climate, NCEI, BIO-OMM, WOD, and Argo all cover the majority of the NW Atlantic and, to a lesser extent, the Arctic (Fig. 4). NAFC-Oceanography and Climate also provide moderate coverage of Hudson Bay. MLI and NEFSC provide extensive coverage of the Gulf of St. Lawrence and Gulf of Maine, respectively. The CIOOS-BIO profiles originate mainly from the Scotian Shelf, Gulf of St. Lawrence, and the Gulf of Maine. Clear lines can also be seen along repeated transects from AZMP and AZOMP. Profiles from the Polar Data Catalogue are mostly taken in transit from St. John's, Newfoundland to different parts of the Arctic, including in Hudson Bay. The NAFC-Aquaculture profiles were taken along the southern coast of NL. EU-NAFO profiles were taken on the Grand Banks and the Flemish Cap, outside of Canada's exclusive economic zone.
The spatial distribution of profiles is also time-dependent. From 1873 to 1949, the majority of profiles were taken along the shelf from the Mid-Atlantic Bight to the Grand Banks (Fig. 5). From 1950 onward, we start to see better coverage of the deep ocean and Arctic. During the same time, the number of profiles taken along the shelf also increases. In more recent years, from 1990 to 2023, clear lines can be seen along repeat transects from programs like AZMP and AZOMP.
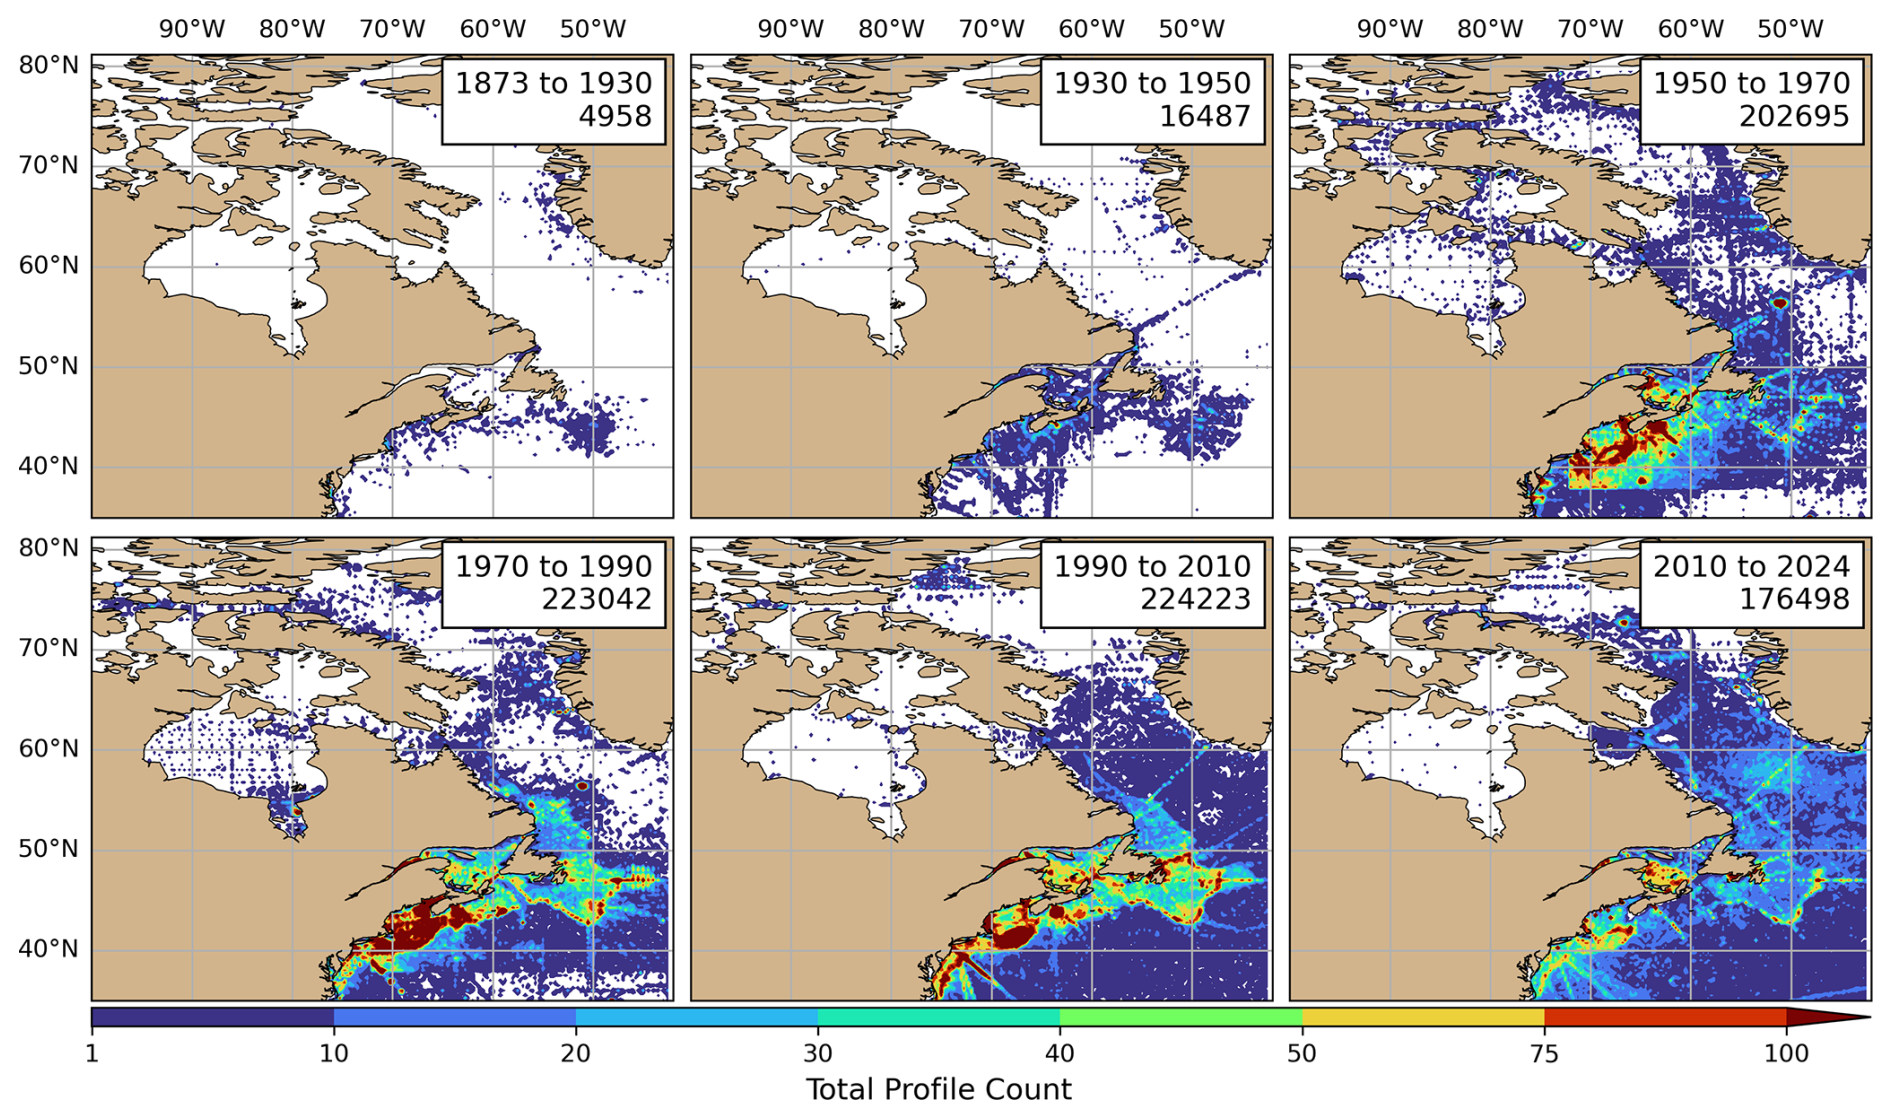
Figure 5Total number of profiles, binned into 0.25° length grid cells using CASTS from 1873 to 1929, 1930 to 1949, 1950 to 1969, 1970 to 1989, 1990 to 2009, and 2010 to 2024. Areas where no casts are present are shown in white. The lines of constant latitude and longitude are also provided. The time period and total number of casts are shown in the top right corner.
From 1873 to 1945, most of the profiles were taken using bottles (Fig. 2). After World War 2 (post-1945), MBTs became more widely used until around 1980, when they were replaced by digital BTs and XBTs. Starting around 1970, CTDs began to be used more frequently for completing profiles and are still widely used to this day. Bottom fish trawls, towed CTDs, and profiling floats (such as Argo) have also become more widely used for conducting oceanography work. A large number of profile instrument identifications remains unknown, especially between 2008 and 2018. These profiles are from BIO-OMM and do not include such information.
We also note that older instruments, such as XBTs, MBTs or BTs are known to have instrument-specific biases (e.g., for temperature and depth) and that corrections have been recommended by previous studies (e.g., Boyer et al., 2016; Cheng et al., 2016, 2018). Those biases, for example positive for temperature on the order of 0.13–0.15 °C for analog systems and 0.01–0.07 °C for digital systems (e.g., Emery et al., 1986; Cowley et al., 2013; Cheng et al., 2016) are extremely important for the calculation of global heat budget of the ocean (Ishii and Kimoto, 2009). However, they may be negligible for some of the coastal observations presented in this study where interannual fluctuations are large (several degrees). As the recommendations for those bias corrections are rapidly evolving, and because some of the meta-data for those corrections (e.g., instrument manufacturer) is not available, our strategy for this data product was to leave those observations uncorrected. The user can apply a correction at its own discretion or simply discard those observations since they are identified with the variable station_ID_manual.
CASTS spans more than a century of ocean observations. Although the exploration potential of this dataset is immense, we present here only preliminary results that reveal profound climate-related changes that have occurred in the region. We first discuss long-term changes in temperature, salinity, and stratification at historical high-frequency sampling stations of Atlantic Canada. Second, we discuss CIL variability on the Northwest Grand Banks of Newfoundland. The CIL is a remnant of the winter's cold mixed layer that remains in the subsurface for most of the year (Petrie et al., 1988; Andres et al., 2024). The CIL is an important feature of the NL Shelf that exerts an important control on the habitat and productivity of the NL ecosystem (Cyr et al., 2025). When possible, these observations are put in relation with the long-term average.
Depth-averaged temperature and salinity anomalies and the corresponding stratification were calculated for five historic sampling locations. Station 27, Halifax 2, and Prince 5 sampling stations are all considered long-term, with measurements going as far back as the 1920s (Fig. 6). Using the station_ID_manual variable available in CASTS, profiles associated with each station were isolated and averaged to a monthly time step. For the three long-term stations, a monthly climatology was determined between 1950 and 2000 in order to take advantage of the longer time series and reduce the impact of the cold 1990s on the climatology. For the short-term Rimouski station and Shediac Valley station, the climatology was determined between 1990 and 2010 in accordance with the World Meteorological Organization (World Meteorological Organization, 2017) (Fig. 7). The climatology was then removed from the original time series to determine the associated anomaly, which were then averaged to yearly. Finally, the climatology mean was added to the depth-averaged anomalies to determine the reconstructed annual average (Fig. 6, top two rows). Because the water column at Rimouski station and Shediac Valley station are made up of distinct bodies of water (Galbraith et al., 2024), temperature was averaged from May to October between 0 and 50 m (Fig. 7, top row). The bottom temperature at Rimouski and Shediac Valley is also provided, taken at 290 and 84 m depth respectively (Fig. 7, third row). The CIL minimum temperature from May to October at Rimouski station is also presented (Fig. 7, second row left column). The CIL minimum temperature was not calculated at the Shediac Valley Station due to the station depth being shallower than the CIL maximum depth at nearby locations.

Figure 6Depth-averaged annual mean of temperature (top row) and salinity (middle row) reconstructed from monthly anomalies for Station 27 (0–176 m), Halifax 2 (0–150 m), and Prince 5 (0–50 m). The annual mean stratification between 0 and 50 m reconstructed from monthly anomalies is also presented (bottom row). In all panels, the yearly average is shown by the white dots and thin black line. The five-year running average is shown by the thick black line. The mean temperature anomaly, salinity anomaly, and stratification over the 1950–2000 period are given by the solid black horizontal line. One standard deviation about the mean is shown by the dashed lines. The mean temperature, salinity and stratification over the 1950–2000 period is also provided in the bottom left corner.
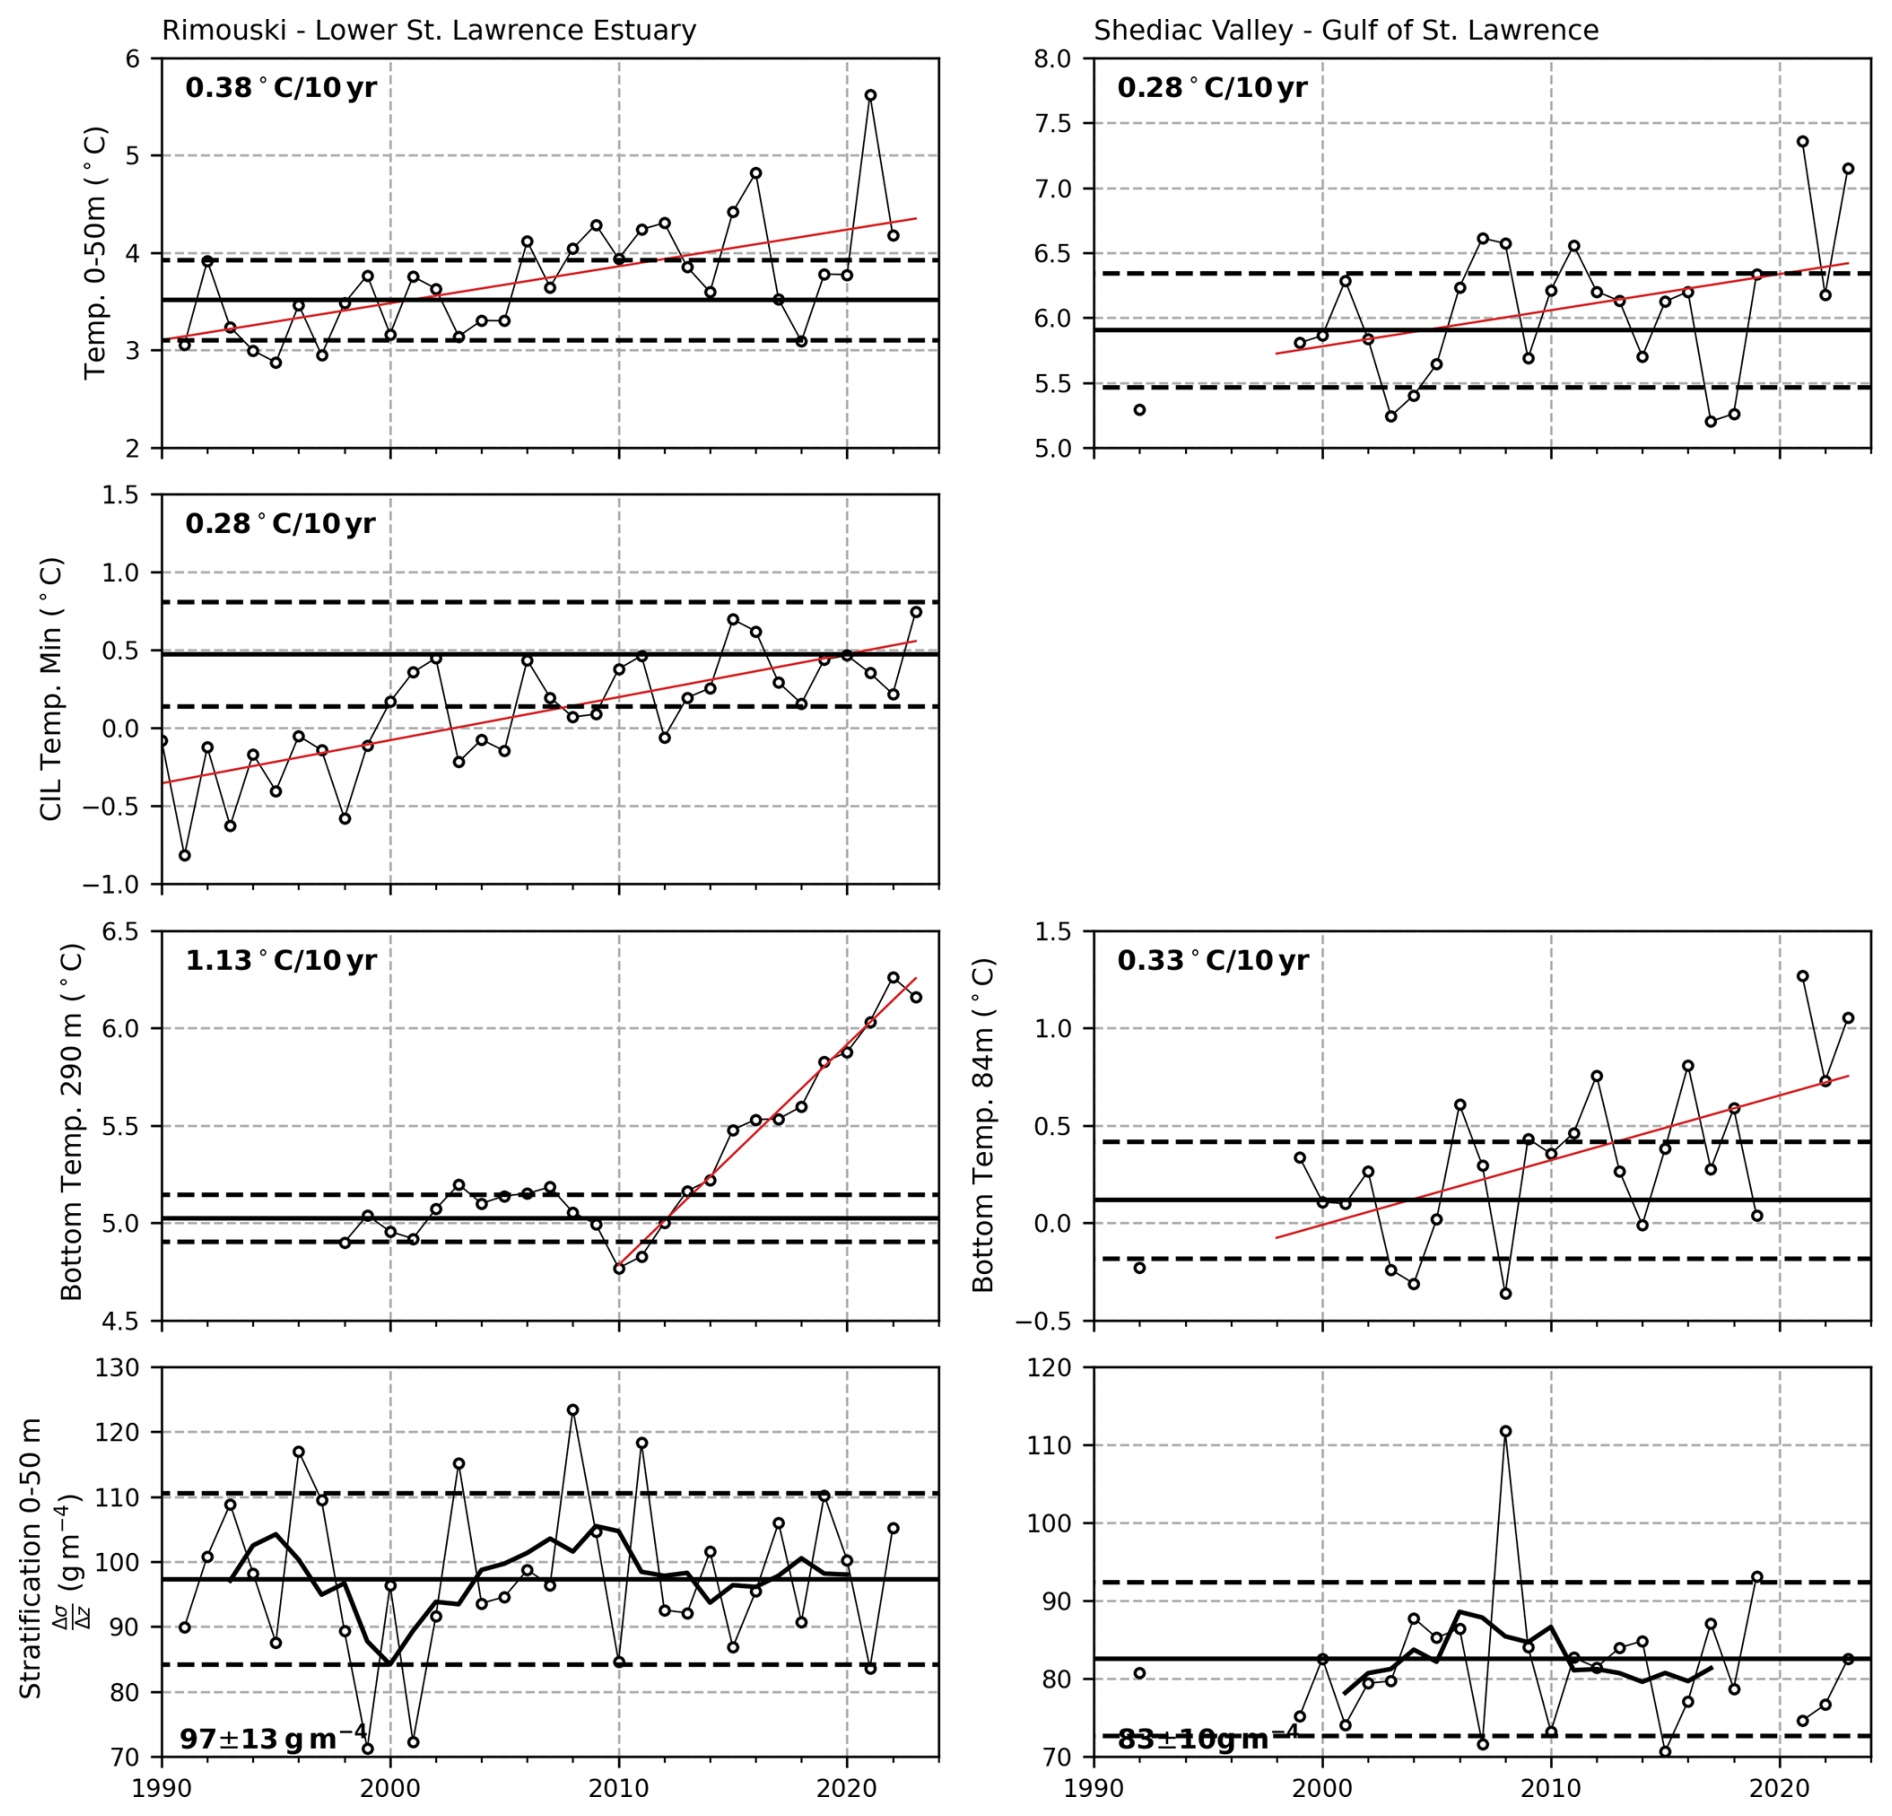
Figure 7Depth-averaged (0–50 m) annual mean of temperature (top row) reconstructed from monthly anomalies for Rimouski (left column) and Shediac Valley (right column). The associated linear trend for both stations is shown in red, with the trend written in the top left corner. The CIL minimum temperature and linear trend for Rimouski are shown in the second row. The bottom temperature at Rimouski and Shediac Valley is shown in the third row, taken at 290 and 84 m depth respectively. The linear trend from Rimouski was calculated from 2010 to 2023 and 1998 to 2023 for Shediac Valley. The annual mean stratification between 0 and 50 m reconstructed from monthly anomalies are also presented for both stations (bottom row). The mean stratification over the 1990–2010 period is also provided in the bottom left corner. In all panels, the yearly average is shown by the white dots and thin black line. The mean reconstructed temperature, CIL temperature, and stratification over the 1990–2010 period are given by the solid black horizontal line, while one standard deviation about the mean is shown by the dashed lines.
In order to calculate stratification, the associated density was calculated for station profiles where both temperature and salinity are available (Figs. 6 and 7, bottom rows). The stratification was then calculated from the monthly average density profiles using discrete differences between 0 and 50 m depth.
Similar to Figs. 6 and 7, the temperature and its anomaly were calculated for the Northwest Grand Banks region, including Station 27, this time using a Hovmöller diagram in order to show anomalies at depth (Fig. 8). The climatology was calculated between 1991 and 2020 and the climatology mean was not added to the resulting anomaly. The associated CIL thickness was determined for each month by finding the sum of gridcells with temperature less than 0 °C multiplied by the associated z value. The summer mean CIL thickness was determined by finding the mean CIL thickness between May and July for each year. The summer mean minimum CIL temperature was determined by finding the mean minimum CIL temperature between May and July for each year.
6.1 Historical High-Frequency Stations
6.1.1 Station 27
Station 27 (47°32.8′ N, 52°35.2′ W, 176 m depth) is located in the Avalon Channel just outside St. John's Harbour (Fig. 1). It is downstream of the Coastal Labrador Current flowing southward along the Labrador Shelf.
Its local ocean parameters are considered a good proxy for the inter-annual fluctuations of the NL Shelf climate and the climate of the NW Atlantic as a whole (Petrie et al., 1991, 1992; Colbourne et al., 1994; Drinkwater, 1996; Han et al., 2015; Cyr and Galbraith, 2021). With regular occupations (near monthly basis) since the late 1940s, it is one of the longest hydrographic time series in Canada. On average, we cover 10.1 months yr−1 since 1940. Since 1998, Station 27 is monitored as part of DFO's AZMP (Therriault et al., 1998). Measurements taken before CTD and XBT were taken at discrete depths (0, 10, 20, 30, 50, 75, 100, 125, 150, and 175 m) (Drinkwater, 1993).
Depth-averaged temperature and salinity anomalies, along with stratification anomaly between 0 and 50 m depth were calculated using all available Station 27 data (Fig. 6, first column).
Station 27 exhibits the coldest annual mean depth-averaged temperature among the stations presented in this report, with a climatological mean of 0.2±0.4 °C. Depth-averaged temperature also exhibit a strong pattern of multidecadal variability, with positive periods occurring from 1960–1970 and 2000 to present and negative periods from 1985 to 1995. The year 2021 exhibited the highest anomaly on record for the entire time period covered with a mean annual temperature of more than 1.5 °C (Fig. 6, first column).
The depth-averaged salinity anomalies show a relatively consistent 10-year oscillation pattern from 1945 until 1990. High-salinity periods can be seen during the mid 1960s, early 1980s, and early 1990s, while low-salinity periods can be seen during the mid 1970s and mid 1980s. More importantly, a significant freshening of the water column has occurred since the early 1990s, with a further increase since the early 2010s: six of the last eight years are fresher than average by more than one standard deviation. The freshest year on record is 2018 (2024 being the second freshest), surpassing 1970 which occurred during the Great Salinity Anomaly in the North Atlantic (Dickson et al., 1988). This pattern is consistent with other observations from the North Atlantic (Holliday et al., 2020; Yashayaev, 2024), and may be a consequence of increased freshwater export from the Arctic since Station 27 is located downstream of the Davis and Hudson Straits.
The combined effect of increasing temperature and decreasing salinity could have an effect on water column density stratification. Defined as the density difference between 0 and 50 m, the stratification at Station 27 exhibits slow fluctuations on multi-decadal time scales (Fig. 6, bottom left). Overall, a stepwise increase appears to have occurred since the mid-1980s, although weak stratification comparable to pre-1980 conditions was also observed in the late 2010s. Differences in sampling procedure (bottle vs. CTD casts) may result in extra uncertainty in stratification calculations. Increased stratification may have widespread consequences for the ecosystem, such as changes in the timing of the spring phytoplankton bloom (Cyr et al., 2024a) or prevalence of surface marine heat waves (Soontiens et al., 2025).
6.1.2 Halifax 2
Halifax 2 (44°15.58′ N, 63°18.58′ W, 150 m depth) is located southeast of Halifax on the Scotian Shelf (Fig. 1). It is the second sampling station along the AZMP hydrographic section Halifax Line (Hebert et al., 2024). Measurements were sparse prior to its inclusion to the AZMP in 1998, although a relatively high number of measurements are present between 1950 and 1970. After 1998, temperature and salinity measurements were taken consistently. On average, we cover 5.9 months yr−1 since 1952.
The climatological annual mean water temperature at Halifax 2 is 4.6±0.8 °C. Since 1998, the Halifax 2 depth-averaged temperature anomaly has risen by approximately 2 °C, while also exhibiting interannual fluctuations with a local minima occurring around 2008 (Fig. 6 in the 5-year running mean).
A similar decadal signal can be seen in depth-averaged salinity in the same phase as depth-averaged temperature. Low-salinity periods occurred during the late 1990s, mid 2000s, and after 2020, while high-salinity periods occurred in the early 2000s and 2010s.
Due to the scarcity of the data, the stratification can only be calculated for a few years prior to 1998. In the mid- to late-2000s, stratification at Halifax 2 reached low values similar to those measured in the 1960s. The highest stratification was reached in the late 1990s, late 2010s, and early 2020s.
6.1.3 Prince 5
Prince 5 (44°55.48′ N, 66°50.60′ W, 100 m depth) is located in the Bay of Fundy, north of the Gulf of Maine (Fig. 1). The Bay of Fundy experiences some of the highest tidal fluctuations in the world, up to 16 m (Desplanque and Mossman, 2001). Generally, the water column at Prince 5 is less stratified than than at Station 27 or Halifax 2 stations, mainly due to the presence of strong tidal mixing (Drinkwater, 1993).
Prince 5 has been routinely sampled since 1920 and is Canada's oldest oceanographic station (Hebert et al., 2024). Measurements are taken at Prince 5 once per month (Drinkwater, 1993; Petrie and Drinkwater, 1993) as part of the AZMP. On average, we cover 11.0 months yr−1 since 1920.
The climatological annual mean water temperature at Prince 5 is 6.9±0.6 °C. Similar to Station 27, Prince 5 depth-averaged temperature anomalies also contain a strong multidecadal signal with colder periods from 1930–1945 and 1960–1970 and warmer periods from 1945–1955 and 2010 onward (Fig. 6, second column). Since the early 2010s, temperature at Prince 5 reached new record highs, with the warmest anomaly occurring in 2021 at a mean annual temperature of 9 °C.
Depth-averaged salinity anomalies exhibit a less clear multidecadal signal and instead oscillate more frequently (e.g., decadal time period), possibly influenced by the presence of the nearby St. John river. Consistent low-salinity periods can be seen during the 1960s, the late 1990s and early 2000s, and the early 2010s. No clear trends are observed. Prince-5 and Halifax 2 running average salinity in the last 20 years have shown a somewhat strong correlation (0.50).
The water at Station Prince 5 is generally less stratified than at other stations presented here (10±3 g m−4 compared to 23±3 and 38±6 g m−4 for Station 27 and Halifax 2, respectively) and stratification exhibits oscillations at multi-decadal time scales (Fig. 6, bottom right). When considering the running mean, the weakest stratification periods were the 1950s–1970s and from the early 1990s to the mid-2010s. In the 1930s–1940s, the late 1970s/early 1980s and during the late 2010s/early 2020s, the stratification was high.
6.1.4 Rimouski Station
Rimouski Station (48°40′ N, 68°35′ W, 330 m depth) is located in the Lower St. Lawrence Estuary of the Gulf of St. Lawrence (Fig. 1). Regular sampling began at this location in 1991 and by 1993 it was occupied weekly from June through September (Plourde et al., 2009). The weekly sampling was extended to include May in 1997 and sparser sampling occurred past September from 1999 onwards, and in April from 2006 onwards. It was incorporated into the AZMP in 2013. Since 1991, the three water layers (surface, CIL, deep) have experienced warming (Fig. 7). The surface (0–50 m May–October average) and CIL minimum temperature (May–October average) have increased by 0.46 and 0.39 °C per decade. Bottom temperature (290 m) has increased since 2010 by 1.1 °C per decade, from 4.8 to 6.3 °C in 2024, due to changes in water masses that make up the mixture advected into the Gulf from the continental slope (Gilbert et al., 2005; Jutras et al., 2023). The inter-annual variability of seasonal (May–October) stratification (0–50 m) is correlated with seasonally averaged runoff (1991–2024; r2=0.65; Galbraith et al., 2025), but shows no trend since 1991. Exact values for temperature, salinity and density reported in this paper slightly differ from similar metrics reported in annual AZMP reports (Galbraith et al., 2025) because CASTS does not consider oceanographic buoy data when calculating monthly averages. Those differences do not affect the interpretation of the results.
6.1.5 Shediac Valley Station
Shediac Valley Station (47°46.8′ N, 64°01.8′ W, 84 m depth) is located on the Magdalen Shallows in the Gulf of St. Lawrence (Fig. 1). It receives outflow from the St. Lawrence Estuary from the Gaspé Current. It has been sampled irregularly since 1947, nearly every year since 1957, and more regularly during the summer months since 1999 when the AZMP began. The surface (0–50 m May–October average) and bottom (84 m) temperatures have increased by 0.28 and 0.33 °C per decade, respectively, between 1999 and 2024 (Fig. 7).
6.2 Cold Intermediate Layer along the Newfoundland Shelf
The CIL on the Northwest Grand Banks has historically been defined as the sub-surface layer colder than 0 °C (Petrie et al., 1987; Drinkwater, 1993). The CIL is low salinity water that is distinctly different from other local water masses (e.g. continental slope water). Typically, the cross-shelf area occupied by the CIL is largest in the late summer/early fall months and occupies from the near surface to the sea floor depending on the year (Petrie et al., 1987; Colbourne et al., 1994). Florindo-López et al. (2020) found a strong correlation between freshwater flux in typical CIL areas with Arctic waters flowing through the Davis Strait.
The Northwest Grand Banks region (Fig. 1) ocean temperature contains a strong seasonal signal, with temperature in the upper 50 m climatologically larger than 7 °C during the summer months and lower than 2 °C during the winter and spring (Fig. 8, first row). During the summer and fall months, this warm layer sits above the CIL, before the entire water column is mixed during the winter months due to increased storm action and atmospheric cooling, typically removing the CIL as the temperature increases above the 0 °C threshold. A clear multidecadal signal can also be seen in the monthly temperature anomalies (Fig. 8, second row), with warm periods throughout the water column occurring in the late 1960s, the early 1980s, and the early 2020s. A 5-year cold period also occurred during the early 1990s, with negative temperature anomalies being present throughout the water column.
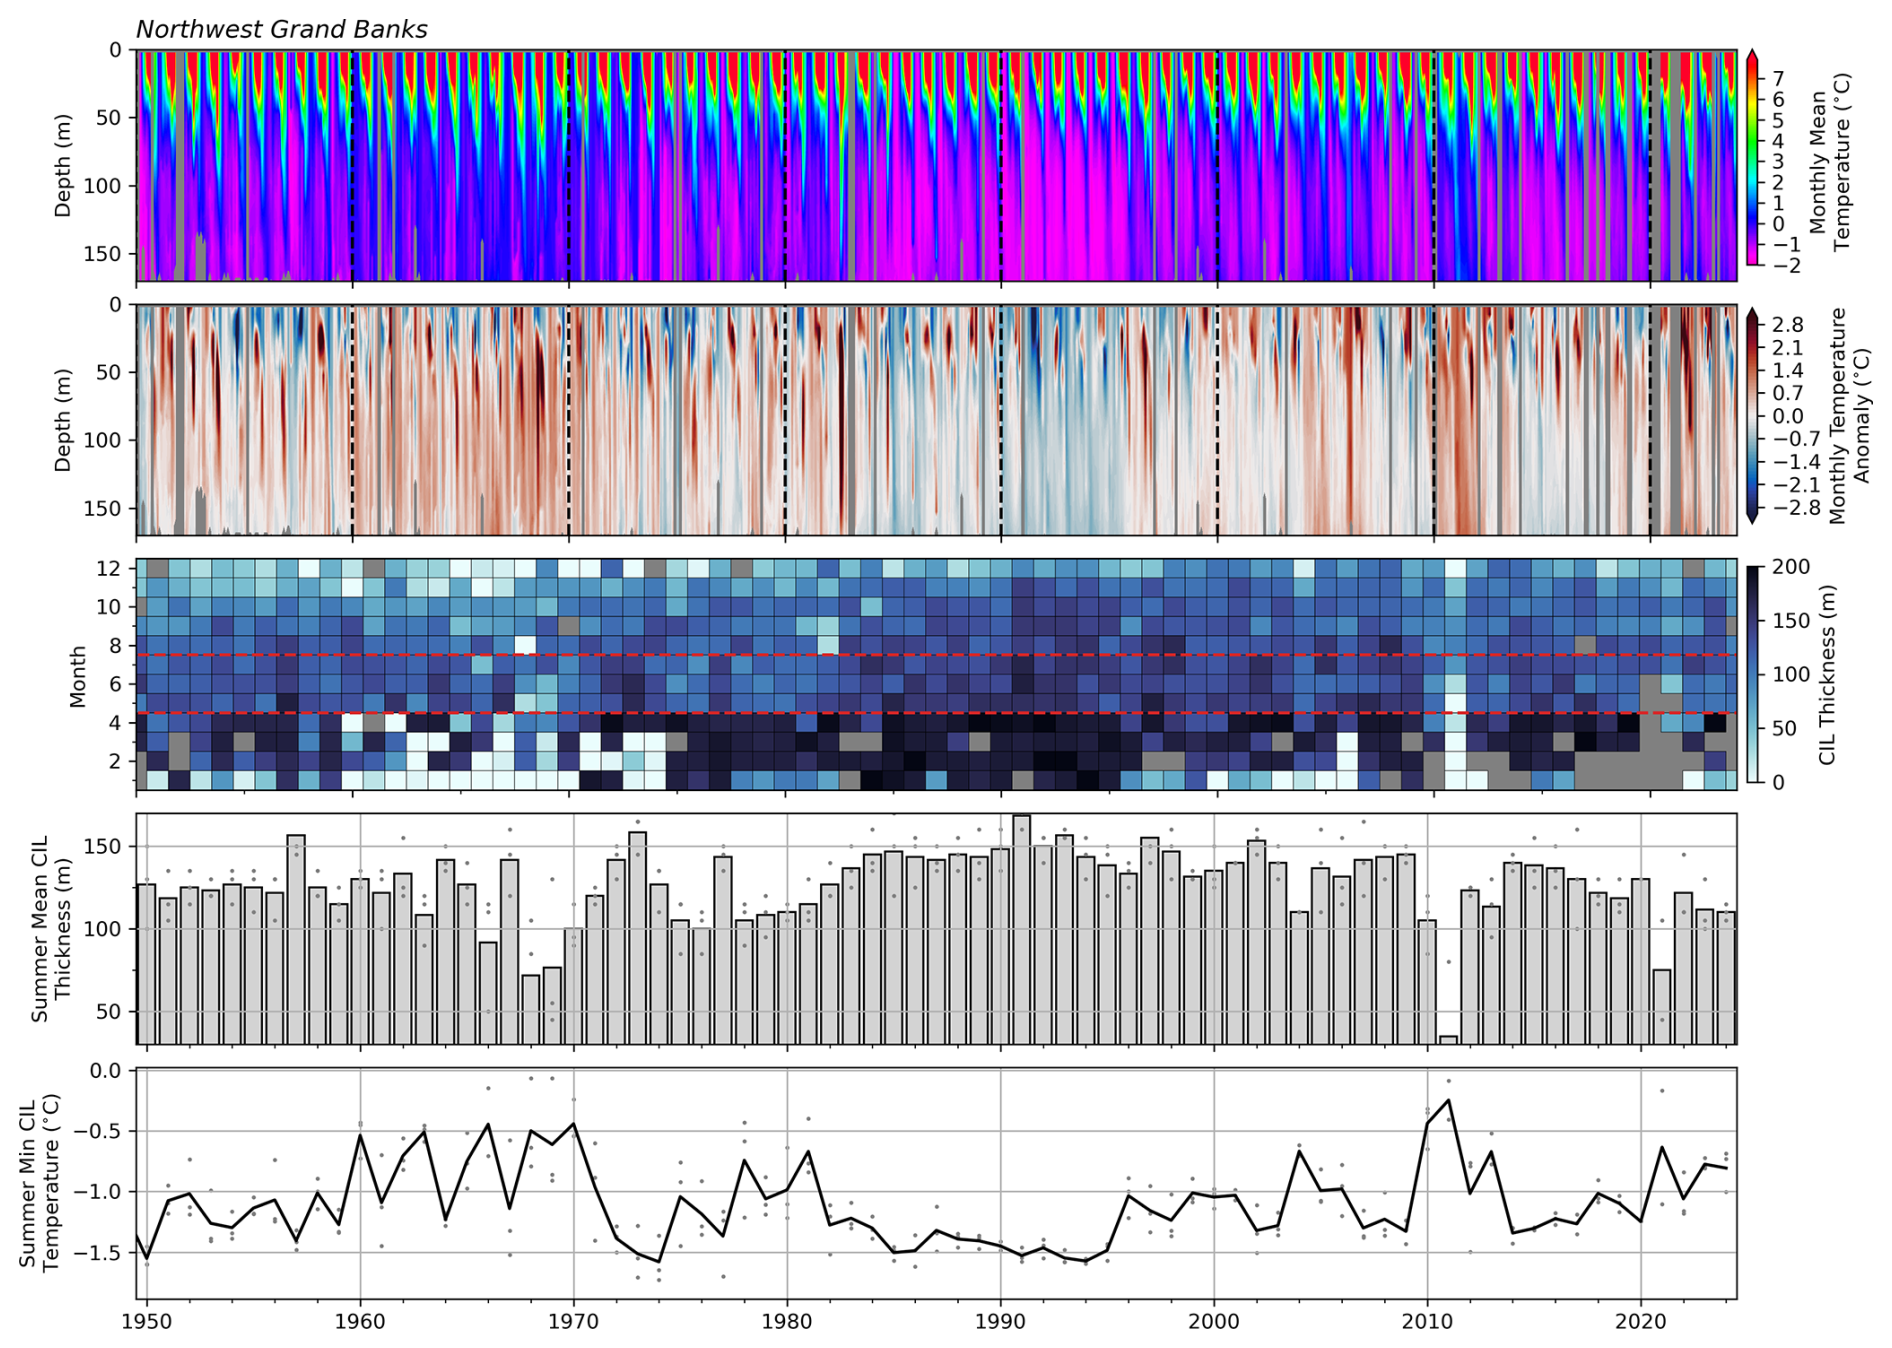
Figure 8Northwest Grand Banks temperature Hovmöller diagram (first row), temperature anomaly Hovmöller diagram calculated from the 1991–2020 climatology (second row), monthly CIL thickness (third row), summer (May to July) mean CIL thickness (fourth row), and summer mean minimum CIL temperature (fifth row) from 1950 to 2024. The months of May, June, and July are used to calculate the summer mean CIL thickness and mean minimum CIL temperature are outlined by a dashed red line (third row). The grey grid cells in the third row represent missing data. The grey dots in the bottom two rows show all available measurements for the summer mean CIL thickness and summer mean minimum CIL temperature respectively for a particular year. The area of interest used to calculate all metrics is shown in Fig. 1. The CIL is defined as all depths where temperature is less than 0 °C. For many months, no CIL is present, therefore making the grey dots not visible. The colour-map used in the first row is not perceptually uniform and was primarily chosen to highlight the CIL layer clearly (i.e. light purple colour).
Monthly CIL thickness (Fig. 8, third row) contains a less clear climatology when compared to the monthly mean temperature (Fig. 8, first row). Typically CIL thickness is low between January and June, before increasing the late summer and early fall months. Multiple time periods contradict this cycle, with high CIL thickness being present from January to March during the 1950s and 1980s to early 1990s. The mid-1980s and early 1990s stand out especially (and to a lesser extent, the mid-2010s), as CIL thickness is greater than 0 m throughout the entire year. The summer mean CIL thickness (Fig. 8, fourth row), shows the yearly average CIL thickness between May and July. Large increases in summer mean CIL thickness occurred during the late-1970s, and early 1980s, while a slow decrease can be seen from the mid-2000s onwards. The late 1960s, early 1980s, and 2010 stand out as times with lower mean CIL thickness, with 2010 having a very low summer mean CIL thickness. The summer mean minimum CIL temperature (Fig. 8, bottom row), shows the yearly mean minimum CIL temperature between May and July. Local increases in mean minimum CIL temperature can be seen during the 1960s, early 1980s, and around 2010. A consistent decrease in minimum temperature is present from the mid-1980s to the mid-1990s. A slow increase in mean minimum CIL temperature can be seen from the mid-2010s to present.
The data presented in this study are available here: https://doi.org/10.20383/103.01462 (Coyne et al., 2023). Yearly NetCDF files are provided from 1873 onward. For the foreseeable future, this index will be updated on an annual basis once the update from the previous year is completed (e.g. targeted release in the summer of the following year).
All scripts used to create CASTS are available at https://doi.org/10.5281/zenodo.18701275 (Coyne, 2026).
In this paper, the CASTS data product containing ocean temperature and salinity from 1873 to 2024 is discussed. Using 13 different sources and multiple levels of quality assurance/quality control, we provide an exhaustive and pre-filtered data product that is ready to be used immediately upon being downloaded. CASTS provides extensive coverage of the NW Atlantic and its Arctic gateways, including shelf, slope, and open ocean areas, especially during more recent years at shallower depths. A higher number of profiles are available at shallower depths on the shelf as that area has been more systematically sampled in recent years. Regular updates to CASTS will be completed to ensure that the data product remains up-to-date (Coyne et al., 2023).
Using CASTS, we were able to create historical temperature, salinity and stratification time series for three long-term historic stations (Station 27, Prince 5, Halifax 2; Fig. 6) and two shorter-term time series (Rimouski and Shediac Valley stations; Fig. 7). Similar to previous studies, the shelf area temperature from Southern Newfoundland to the Bay of Fundy is dominated by low-frequency variability which has been closely linked to relevant climate modes (e.g. North Atlantic Oscillation, Atlantic Multidecadal Oscillation; Petrie and Drinkwater, 1993; Loder and Wang, 2015). The periods of low salinity anomalies at Station 27 during the 1970s, 1980s, and 1990s, match the periods known as “great salinity anomalies” which are defined as time periods of prolonged low salinity in the North Atlantic (Belkin et al., 1998; Belkin, 2004). The great salinity anomalies are related to the export of freshwater from the Arctic (Florindo-López et al., 2020). What is especially striking is the low salinity anomalies seen over the last 10 years, which reach lower levels than during previous great salinity anomaly time periods (lowest salinity anomaly occurred in 2018). This recent freshening occurs during the same time as subpolar North Atlantic freshwater content is increasing, and Arctic freshwater content reaches unprecedented levels (Florindo-López et al., 2020). The same anomalous decrease is not seen in the Bay of Fundy or Scotian Shelf, but Arctic freshwater export is less prevalent at the more southern regions.
Recent consistent temperature increases over the last 20 years can be seen at all three long-term historic stations, especially at Prince 5 and Halifax 2 stations (Fig. 6, first row). Relatively high sea surface temperature trends were noted by Loder and Wang (2015) from 1979 to 2011 on the Scotian Shelf and Bay of Fundy when compared to other areas in the North Atlantic. Even after extending the time series back to the 1920s at Prince 5, relatively high sea surface temperature trends can still be seen. This is mimicked by the depth-averaged reconstructed averaged temperature observed at Prince 5, where multidecadal variability can be seen oscillating about a steady trend upwards since 1920.
Interestingly, Station 27 (Newfoundland Shelf) and Prince 5 (Bay of Fundy) often historically exhibited out of phase depth-average temperature signals (e.g., warmer 1950s and cooler 1960s at Prince 5 corresponded to cooler and warmer conditions at Station 27, respectively). This out of phase dynamics may be attributed to the amount of cold Labrador Current continuing south along the Northeast American Shelf versus being retroflected toward the subpolar gyre (Jutras et al., 2023). However, the relationship seems to have weakened and may be masked by warming trends exhibited by both time series recently.
A brief analysis of mean CIL thickness and minimum CIL temperature in the Northwest Grand Banks reveals that summer mean CIL thickness remained consistently high between the mid-1980s to the early 1990s (Fig. 8). During this same time period, summer minimum CIL temperature remained low. Additionally, a sizable CIL layer was present in the Northwest Grand Banks during most months of the year between the mid-1980s and mid-1990s. The increase in mean CIL thickness and decrease in minimum CIL temperature during the early 1990s corresponds to a time of significant negative temperature anomalies in the NW Atlantic along with the collapse of the northern cod fishery in NL (DeYoung and Rose, 1993; Rose et al., 2000). A similar increase can also be seen in CIL area along the Labrador Shelf during the mid 1980s and early 1990s. CIL area time series for the Labrador and Newfoundland shelves starting in 1928 and 1950, respectively, are reported in the ICES Report on Ocean Climate (Cyr and Galbraith, 2023).
The Newfoundland and Labrador climate index, which uses the summer CIL in its calculation, marks 1984–1985 and 1990–1993 as two of the coldest periods on record since 1950 (Cyr and Galbraith, 2021). This shows that anomalies in ocean and atmospheric variables were mostly indicative of colder ocean temperatures, including air temperature, sea ice, and bottom ocean temperature.
The role of the ocean climate in shaping the productivity of the northwest Atlantic ecosystems is becoming clearer. For example, it is now agreed that poor ecosystem productivity associated with unprecedented cold environmental conditions precipitated the northern cod collapse in the early 1970s and early 1990s (Cyr et al., 2025). It is also becoming clearer that the fluctuations of the climate are shaping the productivity of the ecosystems on decadal time scales. An effective monitoring and dissemination of environmental data is therefore essential to ensure effective fisheries management in Canada. The CASTS dataset contributes to this effort by making environmental data widely available.
For future work, a more thorough analysis of potential bias from instrument type should be completed, including known temperature biases in XBT profiles at depth (Cheng et al., 2016). A flagging system, the same as or similar to UNESCO 1990 framework could also be implemented to allow end users to easily determine the confidence behind a specific cast (UNESCO, 1991). The addition of observations from new technologies, such as underwater gliders and/or animals, can also be added. We hope to add these recommendations in future iterations of the CASTS data product. Yearly updates to CASTS will be completed and published once data for the specific year is available from all active sources.
Long-term environmental datasets are integral to our understanding of the Earth system and its response to climate change (Rosi et al., 2022). In this paper, we gathered, packaged, made available, and disseminated more than a century of ocean hydrographic observations collected in the NW Atlantic Ocean and the Eastern Arctic. We hope that this new data product will enable various follow up climate and ecosystem studies.
The supplement related to this article is available online at https://doi.org/10.5194/essd-18-1463-2026-supplement.
Jonathan Coyne and Frédéric Cyr contributed equally to the conceptualization, research, data gathering, programming, and writing of this paper. All other authors contributed data, writing, and expertise from their respective regions.
The contact author has declared that none of the authors has any competing interests.
Publisher's note: Copernicus Publications remains neutral with regard to jurisdictional claims made in the text, published maps, institutional affiliations, or any other geographical representation in this paper. The authors bear the ultimate responsibility for providing appropriate place names. Views expressed in the text are those of the authors and do not necessarily reflect the views of the publisher.
This work is a contribution to the Atlantic Zone Monitoring Program of Fisheries and Oceans Canada. The authors thank the numerous scientists, technicians, captains and crew members who have participated in the sampling and analysis effort since 1873. The authors also thank Trajce Alcinov, Heather Andres, Eugene Colbourne, Pascal Guillot, Roger Petitpas, Brian Petrie, Tahiana Ratsimbazafy, and Dave Senciall for their help with the preparation of this work.
This paper was edited by Alberto Ribotti and reviewed by two anonymous referees.
Andres, H. J., Soontiens, N., Penney, J., and Cyr, F.: Seasonal variations of the cold intermediate layer on the Newfoundland and Labrador Shelf, Progress in Oceanography, 229, 103379, https://doi.org/10.1016/j.pocean.2024.103379, 2024. a
Belkin, I. M.: Propagation of the “Great Salinity Anomaly” of the 1990s around the northern North Atlantic, Geophysical Research Letters, 31, 4–7, https://doi.org/10.1029/2003GL019334, 2004. a
Belkin, I. M., Levitus, S., Antonov, J., and Malmberg, S. A.: “Great Salinity Anomalies” in the North Atlantic, Progress in Oceanography, 41, 1–68, https://doi.org/10.1016/S0079-6611(98)00015-9, 1998. a
Boyer, T., Domingues, C. M., Good, S. A., Johnson, G. C., Lyman, J. M., Ishii, M., Gouretski, V., Willis, J. K., Antonov, J., Wijffels, S., Church, J. A., Cowley, R., and Bindoff, N. L.: Sensitivity of Global Upper-Ocean Heat Content Estimates to Mapping Methods , XBT Bias Corrections , and Baseline Climatologies, Journal of Climate, 29, 4817–4842, https://doi.org/10.1175/JCLI-D-15-0801.1, 2016. a
Casas, J., Roman Marcote, E., Del rio, J., Blanco Perez, R., and Tel, E.: NAFO-EU-Spain-SL, An ocean variables dataset from the Spanish Oceanographic Surveys at NAFO Regulatory Area, SEANOE [data set], https://doi.org/10.17882/108300, 2025. a
Chen, K., Gawarkiewicz, G., and Yang, J.: Mesoscale and Submesoscale Shelf-Ocean Exchanges Initialize an Advective Marine Heatwave, Journal of Geophysical Research: Oceans, 127, https://doi.org/10.1029/2021JC017927, 2022. a
Cheng, L., Abraham, J., Goni, G., Boyer, T., Wijffels, S., Cowley, R., Gouretski, V., Reseghetti, F., Kizu, S., Dong, S., Bringas, F., Goes, M., Houpert, L., Sprintall, J., and Zhu, J.: XBT science: Assessment of instrumental biases and errors, Bulletin of the American Meteorological Society, 97, 923–933, https://doi.org/10.1175/BAMS-D-15-00031.1, 2016. a, b, c
Cheng, L., Luo, H., Boyer, T., Cowley, R., Abraham, J., Gouretski, V., Reseghetti, F., and Zhu, J.: How Well Can We Correct Systematic Errors in Historical XBT Data ?, Journal of Atmospheric and Oceanic Technology, 35, 1103–1125, https://doi.org/10.1175/JTECH-D-17-0122.1, 2018. a
Clark, D., Politis, P., Beazley, L., Foley, C., Kostovick, P., MacMahon, M., Martin, R., and Melrose, C.: Working Group on Northwest Atlantic Ecosystem Observations (WGNAEO), ICES Scientific Reports, 4, https://doi.org/10.17895/ices.pub.20473014, 2022. a, b
Colbourne, E. B., Narayanan, S., and Prinsenberg, S.: Climatic changes and environmental conditions in the Northwest Atlantic, 1970–1993, ICES Marine Science Symposia, 198, 311–322, 1994. a, b
Cowley, R., Wijffels, S., Cheng, L., Boyer, T., and Kizu, S.: Biases in Expendable Bathythermograph Data: A New View Based on Historical Side-by-Side Comparisons, Journal of Atmospheric and Oceanic Technology, 30, 1195–1225, https://doi.org/10.1175/JTECH-D-12-00127.1, 2013. a
Coyne, J.: jn533213/CASTS: CASTS Data Product Code, Zenodo [code], https://doi.org/10.5281/zenodo.18701275, 2026. a
Coyne, J., Cyr, F., Donnet, S., Galbraith, P., Geoffroy, M., Hebert, D., Layton, C., Ratsimandresy, A., Snook, S., Soontiens, N., and Walkusz, W.: Canadian Atlantic Shelf Temperature-Salinity (CASTS), Federated Research Data Repository (FRDR) [data set], https://doi.org/10.20383/103.01462, 2023. a, b, c, d, e
Cyr, F. and Galbraith, P. S.: A climate index for the Newfoundland and Labrador shelf, Earth Syst. Sci. Data, 13, 1807–1828, https://doi.org/10.5194/essd-13-1807-2021, 2021. a, b, c
Cyr, F. and Galbraith, P. S.: Newfoundland-Labrador Shelf, in: ICES Report on ocean climate, edited by: González-Pola, C., Larsen, K. M. H., Fratantoni, P., and Beszczynska-Möller, A., ICES Cooperative Research Reports, Copenhagen, DK, 358, chap. 4.3, 36–39, https://doi.org/10.17895/ices.pub.24755574, 2023. a
Cyr, F., Adamack, A., Bélanger, D., Mullowney, D., Murphy, H., and Pepin, P.: Environmental Control on the Productivity of a Heavily Fished Ecosystem, Research Square [preprint], https://doi.org/10.21203/rs.3.rs-4108948/v1, 2024a. a
Cyr, F., Coyne, J., Snook, S., Bishop, C., Galbraith, P. S., Chen, N., and Han, G.: Physical Oceanographic Conditions on the Newfoundland and Labrador Shelf during 2023, vol. 382, ISBN 9780660488059, 2024b. a
Cyr, F., Adamack, A. T., Bélanger, D., Koen-Alonso, M., Mullowney, D., Murphy, H., Regular, P., and Pepin, P.: Environmental control on the productivity of a heavily fished ecosystem, Nature Communications, 16, 5277, https://doi.org/10.1038/s41467-025-60453-6, 2025. a, b
Deser, C., Alexander, M. A., Xie, S. P., and Phillips, A. S.: Sea surface temperature variability: Patterns and mechanisms, Annual Review of Marine Science, 2, 115–143, https://doi.org/10.1146/annurev-marine-120408-151453, 2010. a, b
Desplanque, C. and Mossman, D. J.: Bay of fundy tides, Geoscience Canada, 28, 1–11, 2001. a
DeYoung, B. and Rose, G.: On Recruitment and Distribution of Atlantic Cod (Gadus morhua) off Newfoundland, Can. J. Fish. Aquat. Sci., 50, 2729–2741, 1993. a
Dickson, R. R., Meincke, J., Malmberg, S. A., and Lee, A.: The “great salinity anomaly” in the northern North Atlantic 1968–1982, Progress in Oceanography, 20, 103–151, 1988. a
Donnet, S., Ratsimandresy, A. W., Goulet, P., Doody, C., Burke, S., and Cross, S.: Coast of Bays Metrics: Geography, Hydrology and Physical Oceanography of an Aquaculture Area of the South Coast of Newfoundland, DFO Can. Sci. Advis. Sec. Res. Doc, 2017/076, 109 pp., http://www.dfo-mpo.gc.ca/csas-sccs/ (last access: 19 February 2026), 2018. a, b
Drinkwater, K. F.: Overview of Environmental Conditions in the Northwest Atlantic in 1992, Tech. rep., 1993. a, b, c, d
Drinkwater, K. F.: Atmospheric and oceanic variability in the northwest Atlantic during the 1980s and early 1990s, Journal of Northwest Atlantic Fishery Science, 18, 77–97, https://doi.org/10.2960/J.v18.a6, 1996. a
Emery, W. J., Lee, W., Zenk, W., and Meincke, J.: A Low-Cost Digital XBT System and its Application to the Real-Time Computation of Dynamic Height, Journal of Atmospheric and Oceanic Technology, 3, 75–83, 1986. a
Florindo-López, C., Bacon, S., Aksenov, Y., Chafik, L., Colbourne, E., and Holliday, N. P.: Arctic Ocean and Hudson Bay Freshwater Exports: New Estimates from Seven Decades of Hydrographic Surveys on the Labrador Shelf, Journal of Climate, 33, 8849–8868, https://doi.org/10.1175/JCLI-D-19-0083.1, 2020. a, b, c, d
Galbraith, P., Lizotte, M., Blais, M., Bélanger, D., Casault, B., Coyne, J., Layton, C., Azetsu-Scott, K., Beazley, L., Chassé, J., Clay, S., Cyr, F., Devred, E., Fudge, A., Gabriel, C.-E., Greenan, B., Hébert, A.-J., Johnson, C., Maillet, G., Penney, J., Rastin, S., Ringuette, M., Shaw, J.-L., Snook, S., and Starr, M.: Oceanographic conditions in the Atlantic zone in 2024, Can. Tech. Rep. Hydrogr. Ocean. Sci., v + x pp., https://doi.org/10.60825/e92v-d229, 2025. a, b, c
Galbraith, P. S., Chassé, J., Shaw, J.-L., Dumas, J., and Bourassa, M.-N.: Physical Oceanographic Conditions in the Gulf of St. Lawrence during 2023, Can. Tech. Rep. Hydrogr. Ocean Sci., 378, v + 91 p., 13. https://doi.org/10.60825/eznq-0815, 2024. a
GEBCO Bathymetric Compilation Group: The GEBCO_2023 Grid – a continuous terrain model of the global oceans and land, NERC EDS British Oceanographic Data Centre NOC [data set], https://doi.org/10.5285/f98b053b-0cbc-6c23-e053-6c86abc0af7b, 2023. a
Gilbert, D., Sundby, B., Gobeil, C., Mucci, A., and Tremblay, G. H.: A seventy-two-year record of diminishing deep-water oxygen in the St. Lawrence estuary: The northwest Atlantic connection, Limnology and Oceanography, 50, 1654–1666, https://doi.org/10.4319/lo.2005.50.5.1654, 2005. a
Gregory, D.: Climate: A database of Temperature and salinity Observations for the Northwest Atlantic, Can. Sci. Advis. Sec. Res. Doc., 2004/075, http://www.dfo-mpo.gc.ca/csas/%5Cnhttp://scholar.google.com/scholar?hl=en&btnG=Search&q=intitle:Climate:+A+database+of+Temperature+and+salinity+Observations+for+the+Northwest+Atlantic#0 (last access; 18 September 2015), 2004. a, b, c, d, e, f
Haine, T. W. N., Curry, B., Gerdes, R., Hansen, E., Karcher, M., Lee, C., Rudels, B., Spreen, G., Steur, L. D., Stewart, K. D., and Woodgate, R.: Arctic freshwater export: Status, mechanisms, and prospects, Global and Planetary Change, 125, 13–35, https://doi.org/10.1016/j.gloplacha.2014.11.013, 2015. a
Han, G., Colbourne, E., Pepin, P., and Xie, Y.: Statistical Projections of Ocean Climate Indices off Newfoundland and Labrador, Atmosphere-Ocean, 1–15, https://doi.org/10.1080/07055900.2015.1047732, 2015. a
Hebert, D., Layton, C., Brickman, D., and Galbraith, P.: Physical Oceanographic Conditions on the Scotian Shelf and in the Eastern Gulf of Maine, vol. 380, ISBN 9780660726816, 2024. a, b
Holliday, N. P., Bersch, M., Berx, B., Chafik, L., Cunningham, S., Florindo-López, C., Hátún, H., Johns, W., Josey, S. A., Larsen, K. M. H., Mulet, S., Oltmanns, M., Reverdin, G., Rossby, T., Thierry, V., Valdimarsson, H., and Yashayaev, I.: Ocean circulation causes the largest freshening event for 120 years in eastern subpolar North Atlantic, Nature Communications, 11, https://doi.org/10.1038/s41467-020-14474-y, 2020. a
Intergovernmental Oceanographic Commission: GTSPP Real-Time Quality Control Manual. Revised edition 2010, https://doi.org/10.25607/OBP-1425, 2010. a
Ishii, M. and Kimoto, M.: Reevaluation of Historical Ocean Heat Content Variations with Time-Varying XBT and MBT Depth Bias Corrections, Journal of Oceanography, 65, 287–299, 2009. a
Johnson, C., Inall, M., Gary, S., and Cunningham, S.: Significance of Climate Indices to Benthic Conditions Across the Northern North Atlantic and Adjacent Shelf Seas, Frontiers in Marine Science, 7, https://doi.org/10.3389/fmars.2020.00002, 2020. a
Jutras, M., Mucci, A., Chaillou, G., Nesbitt, W. A., and Wallace, D. W. R.: Temporal and spatial evolution of bottom-water hypoxia in the St Lawrence estuarine system, Biogeosciences, 20, 839–849, https://doi.org/10.5194/bg-20-839-2023, 2023. a, b
Loder, J. W.: Summertime Bottom Temperatures on the Southeast Shoal of the Grand Banks, and Implications for Exchange Rates, Canadian Journal of Fisheries and Aquatic Sciences, 48, 1316–1325, 1991. a
Loder, J. W. and Wang, Z.: Trends and Variability of Sea Surface Temperature in the Northwest Atlantic from Three Historical Gridded Datasets, Atmosphere-Ocean, 53, 510–528, https://doi.org/10.1080/07055900.2015.1071237, 2015. a, b, c, d
Loder, J. W., Petrie, B., and Gawarkiewicz, G.: The coastal ocean off northeastern North America: A large-scale view, in: The Sea, volume 11: the global coastal ocean – regional studies and syntheses, edited by: Robinson, A. R. and Brink, K. H., John Wiley & Sons, Inc., vol. 11, chap. 5, 105–133, ISBN 0-471-11545-2, 1998. a
Marine Environmental Data Section: Maritimes Region Atlantic Zone Monitoring Program (AZMP) Rosette Vertical Profiles, Canadian Integrated Ocean Observing System [data set], https://catalogue.cioosatlantic.ca/dataset/ca-cioos_9a4bd73f-12a2-40ff-a7c7-b961a1d11311?local=en (last access: 27 March 2025), 2023a. a
Marine Environmental Data Section: Maritimes Region Atlantic Zone Off-Shelf Monitoring Program (AZOMP) Rosette Vertical Profiles, Canadian Integrated Ocean Observing System [data set], https://catalogue.cioosatlantic.ca/dataset/ca-cioos_15f90eab-21ed-447d-aea7-8fe98ea27fe5?local=en (last access: 27 March 2025), 2023b. a
Marine Environmental Data Section: Maritimes Region Ecosystem Survey Rosette Vertical Profiles, Canadian Integrated Ocean Observing System [data set], https://catalogue.cioosatlantic.ca/dataset/ca-cioos_0270f89c-1b0a-43ea-b687-829a011c089e?local=en (last access: 27 March 2025), 2023c. a
Marine Environmental Data Section: Newfoundland and Labrador Region Atlantic Zone Monitoring Program (AZMP) Rosette Vertical Profiles, Canadian Integrated Ocean Observing System [data set], https://catalogue.cioosatlantic.ca/dataset/ca-cioos_e4ac21ff-414c-40e0-a943-21f664c92e7e?local=en (last access: 8 January 2025), 2024a. a, b
Marine Environmental Data Section: Newfoundland and Labrador Region Hydrographic Data Collection 1980- Present, Canadian Integrated Ocean Observing System [data set], https://catalogue.cioosatlantic.ca/dataset/ca-cioos_9859f53e-92b8-411d-880a-fdec32b9dc2e?local=en (last access: 8 January 2025), 2024b. a, b
Marine Environmental Data Section: Newfoundland and Labrador Region Multi-Species Survey Trawl-Mounted CTD Profiles, Canadian Integrated Ocean Observing System [data set], https://catalogue.cioosatlantic.ca/dataset/ca-cioos_dabda19f-fe2f-45a8-8fee-01805364fc43?local=en (last access: 8 January 2025), 2024c. a, b
Marine Environmental Data Section: Northern Shrimp Research Foundation (NSRF) CTD Profiles, Canadian Integrated Ocean Observing System [data set], https://catalogue.cioosatlantic.ca/dataset/ca-cioos_584b3c0c-fd99-435a-a6ef-9a470ee2c800?local=en (last access: 8 January 2025), 2024d. a, b
Marine Environmental Data Section: Station 27 Oceanographic Monitoring Station, Canadian Integrated Ocean Observing System [data set], https://catalogue.cioosatlantic.ca/dataset/ca-cioos_c96eb674-ff35-4b1d-b6c2-0356b99f530a?local=en (last access: 8 January 2025), 2024e. a, b
Mishonov, A. V., Boyer, T. P., Baranova, O. K., Bouchard, C. N., Cross, S. L., Garcia, H. E., Locarnini, R. A., Paver, C. R., Reagan, J. R., Wang, Z., Seidov, D., Grodsky, A. I., and Beauchamp, J. G.: World Ocean Database 2023, NOAA Atlas NESDIS 97, https://doi.org/10.25923/z885-h264, 2024. a, b, c
Oka, E.: Long-term Sensor Drift Found in Recovered Argo Pro- filing Floats, Journal of Oceanography, 61, 775–781, 2005. a
Oliver, E. C.: Mean warming not variability drives marine heatwave trends, Climate Dynamics, 53, 1653–1659, https://doi.org/10.1007/s00382-019-04707-2, 2019. a
Paquin, J. P., Roy, F., Smith, G. C., MacDermid, S., Lei, J., Dupont, F., Lu, Y., Taylor, S., St-Onge-Drouin, S., Blanken, H., Dunphy, M., and Soontiens, N.: A new high-resolution Coastal Ice-Ocean Prediction System for the East Coast of Canada, Ocean Dynamics, 74, 799–826, https://doi.org/10.1007/s10236-024-01634-7, 2024. a
Percival, D. B. and Rothrock, D. A.: “Eyeballing” trends in climate time series: A cautionary note, Journal of Climate, 18, 886–891, https://doi.org/10.1175/JCLI-3300.1, 2005. a
Petrie, B. and Anderson, C.: Circulation on the Newfoundland Continental Shelf, Atmosphere-Ocean, 21, 207–226, https://doi.org/10.1080/07055900.1983.9649165, 1983. a
Petrie, B. and Drinkwater, K.: Temperature and Salinity Variability on the Scotian Shelf and in the Gulf of Maine 1945–1990, Journal of Geophysical Research, 98, 20079–20089, 1993. a, b
Petrie, B., Akenhead, S., Lazier, J., and Loder, J.: The Cold Intermediate Layer on the Labrador and Northeast Newfoundland Shelves, 1978–1986, Tech. rep., 1987. a, b
Petrie, B., Akenhead, S. A., Lazier, S. A., and Loder, J.: The cold intermediate layer on the Labrador and Northeast Newfoundland Shelves, 1978–86, NAFO Science Council Studies, 12, 57–69, 1988. a
Petrie, B., Loder, J., Akenhead, S., and Lazier, J.: Temperature and salinity variability on the eastern Newfoundland shelf: The annual harmonic, Atmosphere-Ocean, 29, 14–36, https://doi.org/10.1080/07055900.1992.9649433, 1991. a
Petrie, B., Loder, J., Lazier, J., and Akenhead, S.: Temperature and salinity variability on the eastern Newfoundland shelf: The residual field, Atmosphere-Ocean, 30, 120–139, https://doi.org/10.1080/07055900.1992.9649433, 1992. a
Plourde, S., Joly, P., St-Amand, L., and Starr, M.: La station de monitorage de Rimouski: plus de 400 visites et 18 ans de monitorage et de recherche, Atlantic Zone Monitoring Program Bulletin, Dept. of Fisheries and Oceans Canada, 51–55, http://waves-vagues.dfo-mpo.gc.ca/Library/365689.pdf (last access: 23 February 2026), 2009. a
Pörtner, H.-O., Roberts, D. C., Masson-Delmotte, V., Zhai, P., Tignor, M., Poloczanska, E., Mintenbeck, K., Nicolai, M., Okem, A., Petzold, J., Rama, B., and Weyer, N. M.: IPCC special report on the ocean and cryosphere in a changing climate, IPCC Intergovernmental Panel on Climate Change (IPCC), https://doi.org/10.1017/9781009157964, 2019. a
Ranasinghe, R.: Climate Change 2021: Summary for all, vol. 2022, Intergovernmental Panel on Climate Change, 3rd edn., https://www.ipcc.ch/report/ar6/wg1/downloads/outreach/IPCC_AR6_WGI_SummaryForAll.pdf (last access: 23 February 2026), 2022. a
Rose, G., DeYoung, B., Kulka, D., Goddard, S., and Fletcher, G.: Distribution shifts and overfishing the northern cod (Gadus morhua): a view from the ocean, Canadian Journal of Fisheries and Aquatic Sciences, 57, 644–663, https://doi.org/10.1139/cjfas-57-3-644, 2000. a
Rosi, E. J., Bernhardt, E. S., Solomon, C. T., Likens, G. E., McDowell, W. H., and Creed, I. F.: Give long-term datasets World Heritage status, Science, 378, 1180–1181, 2022. a
Schiller-Weiss, I., Martin, T., and Schwarzkopf, F. U.: Emerging Influence of Enhanced Greenland Melting on Boundary Currents and Deep Convection Regimes in the Labrador and Irminger Seas, Geophysical Research Letters, 51, 1–12, https://doi.org/10.1029/2024GL109022, 2024. a
Sharpe, H., Gallardi, D., Gurney-Smith, H., Guyondet, T., McKindsey, C. W., and Lacoursière-Roussel, A.: Ecological insight of seasonal plankton succession to monitor shellfish aquaculture ecosystem interactions, Frontiers in Marine Science, 11, https://doi.org/10.3389/fmars.2024.1448718, 2024. a
Simard, A., Rail, M. E., and Gratton, Y.: Distribution of temperature and salinity in the Canadian Arctic Archipelago during the 2006 ARCTICNET sampling expeditions (from 22 August to 9 November 2006), Report No R1127, INRS-ETE, Québec (Qc), vii + 79 p., ISBN 978-2-89146-743-8, 2010. a
Smith, E. H., Soule, F. M., and Mosby, O.: The Marion and General Green Expeditions, Bull. US Coast Guard, 19, 1–259, 1937. a
Soontiens, N., Andres, H. J., Coyne, J., Cyr, F., Galbraith, P. S., and Penney, J.: An analysis of the 2023 summer and fall marine heat waves on the Newfoundland and Labrador Shelf, in: 9th edition of the Copernicus Ocean State Report (OSR9), edited by: Karina von Schuckmann (Mercator Ocean International, France), Lorena Moreira (Nologin, Spain), Álvaro de Pascual Collar (Nologin, Spain), Marilaure Grégoire (University of Liège, Belgium), Pierre Brasseur (CNRS, France), Gilles Garric (Mercator Ocean International, France), Johannes Karstensen (GEOMAR Helmholtz Centre for Ocean Research Kiel, Germany), Piero Lionello (University of Salento, Italy), Marta Marcos (University of the Balearic Islands, Spain), Pierre-Marie Poulain (Istituto Nazionale di Oceanografia e di Geofisica Sperimentale (OGS), Italy), and Joanna Staneva (Helmholtz-Zentrum Hereon, Germany), Copernicus Publications, State Planet, 6-osr9, 12, https://doi.org/10.5194/sp-6-osr9-12-2025, 2025. a
Sun, C., Thresher, A., Keeley, R., Hall, N., Hamilton, M., Chinn, P., Tran, A., Goni, G., Petit de la Villeon, L., Carval, T., Cowen, L., Manzella, G., Gopalakrishna, V., Guerrero, R., Reseghetti, F., Kanno, Y., Klein, B., Rickards, L., Baldoni, A., Lin, S., F, J., and Nagaya, Y.: The Data Management System for the Global Temperature and Salinity Profile Programme, 931–938, https://doi.org/10.5270/oceanobs09.cwp.86, 2010. a, b, c
Therriault, J., Petrie, B., Pepin, P., Gagnon, J., Gregory, D., Helbig, J., Herman, A., Lefaivre, D., Mitchell, M., Pelchat, B., Runge, J., and Sameoto, D.: Proposal for a northwest zonal monitoring program, Canadian Technical Report of Hydrographic and Ocean Sciences, 194, p. vii + 57, https://waves-vagues.dfo-mpo.gc.ca/Library/224076.pdf (last access: 23 February 2026), 1998. a, b, c
UNESCO: Processing of oceanographic station data, UNESCO, 1991, Paris, ISBN 978-92-3-102756-7, 1991. a, b, c, d
Wong, A. P. S., Wijffels, S. E., Riser, S. C., Pouliquen, S., Hosoda, S., Roemmich, D., Gilson, J., Johnson, G. C., Martini, K., Murphy, D. J., Scanderbeg, M., Bhaskar, T. V. S. U., Buck, J. J. H., Merceur, F., Carval, T., Maze, G., Cabanes, C., André, X., Belbéoch, M., Ignaszewski, M., Baringer, M. O. N., Schmid, C., Lyman, J. M., Mctaggart, K. E., Purkey, S. G., Zilberman, N., Alkire, M. B., Swift, D., Owens, W. B., Jayne, S. R., Hersh, C., Robbins, P., West-mack, D., Bahr, F., Yoshida, S., Sutton, P. J. H., Cancouët, R., Coatanoan, C., Dobbler, D., Juan, A. G., Gourrion, J., Kolodziejczyk, N., Bernard, V., Bourlès, B., Loch, S. G., Mowat, M., Turton, J., Rao, E. P. R., Ravichandran, M., Freeland, H. J., Gaboury, I., Gilbert, D., Greenan, B. J., Ouellet, M., Ross, T., Tran, A., Dong, M., Liu, Z., Xu, J., Kang, K., Jo, H., Kim, S.-D., and Park, H.-M.: Argo Data 1999–2019: Two Million Temperature-Salinity Profiles and Subsurface Velocity Observations From a Global Array of Profiling Floats, Frontiers in Marine Science, 7, 1–23, https://doi.org/10.3389/fmars.2020.00700, 2020. a, b, c
World Meteorological Organization: WMO guidelines on the calculation of climate normals, Tech. rep., Geneva, Switzerland, ISBN 9789263112033, https://library.wmo.int/doc_num.php?explnum_id=4166 (last access: 24 September 2025), 2017. a
Yashayaev, I.: Intensification and shutdown of deep convection in the Labrador Sea were caused by changes in atmospheric and freshwater dynamics, Communications Earth and Environment, 5, https://doi.org/10.1038/s43247-024-01296-9, 2024. a, b, c
- Abstract
- Introduction
- Region of Interest
- Data Source and Pre-Screening
- Data Aggregation and Quality Control
- Data Product Description
- A Century of Oceanic Hydrography Changes
- Data availability
- Code availability
- Discussion and Conclusion
- Author contributions
- Competing interests
- Disclaimer
- Acknowledgements
- Review statement
- References
- Supplement