the Creative Commons Attribution 4.0 License.
the Creative Commons Attribution 4.0 License.
 | 19 Feb 2026
GFC2020: a global map of forest land use for year 2020 to support the EU Deforestation Regulation
Clément Bourgoin
Astrid Verhegghen
Silvia Carboni
Iban Ameztoy
Lucas Degreve
Steffen Fritz
Martin Herold
Nandika Tsendbazar
Myroslava Lesiv
Frédéric Achard
René Colditz
Remote sensing-based observations are used to map tree cover extent, estimate canopy height, detect disturbances, and classify land cover and land use. However, comprehensive global information on forest cover, capturing both physical characteristics and land use components as defined by the United Nations Food and Agriculture Organization (FAO), remains limited. Here, we present a harmonized and globally consistent map of forest presence or absence at 10 m spatial resolution for the year 2020, hereafter referred to as GFC2020. Our approach combines multiple spatial datasets, primarily derived from Earth observation (EO), to harness their complementary strengths within a transparent, flexible, and open science framework. GFC2020 maps 4562 million hectares (Mha) of forests globally, which is 9.5 % more than the estimate from latest FAO Global Forest Resources Assessment (FRA) for 2020. GFC2020 forest area does not include 578 Mha of tree cover (11 % of the global tree cover area) because these areas do not meet the height threshold or occur on agricultural or urban land. Conversely, around 0.6 % (∼ 25 Mha) of the area classified as forest in GFC2020 is unstocked, due to forest management practices or natural disturbances such as fire. Based on the reinterpretation of a previously collected reference set of 21 752 sample units, GFC2020 achieves an overall accuracy of 91 %, with a commission error of 18 % and an omission error of 8 % for forest. Improvements in EO products, such as better detection of trees in dry and open landscapes, distinguishing natural from human drivers of forest disturbance, mapping tree crops at high spatial resolution or identifying agroforestry systems, will contribute to enhancing future versions of GFC2020. The shift from tree cover to forest cover mapping is not only essential for ecological and climate-related applications but also provides new opportunities to support policy needs. GFC2020 is one of many tools to inform the deforestation risk assessments under supply chain oriented regulations such as the European Union's Deforestation Regulation (EUDR). Even though this map follows the EUDR's definition of forest, it is a non-exclusive, non-mandatory, and not legally binding source. The data availability is as follows: GFC2020 (Bourgoin et al., 2024a, http://data.europa.eu/89h/e554d6fb-6340-45d5-9309-332337e5bc26) and the validation dataset (Colditz et al., 2025a, http://data.europa.eu/89h/8fbace34-a2fe-47b9-ad82-3e9226b7a9a6).
- Article
(24438 KB) - Full-text XML
- BibTeX
- EndNote


Forests provide vital ecosystem services, including climate and water cycle regulation, carbon storage and biodiversity conservation. They also support the livelihood of over 1.6 billion people worldwide by providing timber and non-timber resources (Harris et al., 2021; Pan et al., 2024; Watson et al., 2018). Beyond their environmental and economic value, forests hold deep social and cultural significance. They offer spaces for recreation and spiritual connection and form the foundation of life, identity, and tradition for indigenous people and local communities (González and Kröger, 2020). Despite their critical importance, forests continue to face alarming rates of deforestation and degradation (Sims et al., 2025; Bourgoin et al., 2024b; Xu et al., 2026), contributing significantly to biodiversity loss and accounting for 12 %–20 % of global greenhouse gas emissions (FAO, 2022a). Agricultural expansion remains the primary driver, with crop cultivation and cattle ranching, particularly in tropical regions, responsible for 86 % of global deforestation (West et al., 2025). Specifically, the expansion of pastureland, oil palm, soybeans, rubber, and tree crops such as cocoa and coffee accounts for over half of global deforestation (Pendrill et al., 2022; Goldman et al., 2020).
In response to recent global pledges to halt deforestation by 2030 (Gasser et al., 2022), the European Union (EU) introduced new regulatory measures to reduce its contribution to global deforestation and forest degradation. The Regulation on deforestation-free products (Regulation (EU) 2023/1115, commonly referred to as EUDR) sets binding rules for seven key commodities: cattle, cocoa, coffee, oil palm, rubber, soy, and wood, along with their derived products. For putting them on the EU market or exporting from it, relevant commodities or products must be deforestation-free, produced in accordance with the laws of the producing country and covered by a due diligence statement. Deforestation-free means that there was no conversion of forest land use to agriculture and no forest degradation after the cut-off date (31 December 2020). The due diligence statement requires a set of information, including the product name, the quantity, the geographic coordinates of the production area, the supplier, etc. Operators and traders sourcing from both standard and high-risk countries, as categorized by the EUDR benchmarking system, must conduct risk assessments and potentially a risk mitigation as part of their due diligence to confirm that the products are deforestation-free (EU, 2023 with amendments EU, 2024, 2025).
For risk assessment, an understanding of the state of the land use in 2020 is essential. One possibility to support the EUDR implementation is wall-to-wall spatial mapping of global forest extent in 2020. Even though forest maps have no authoritative status, they can support operators in assessing the risk of deforestation after 2020 when declaring land parcels by geolocation for targeted commodities and derived products placed on the EU market or exported by Member States. Beyond the EUDR, maps of forest cover serve as the foundation for a wide range of ecological and climate-related applications such as effective forest management, conservation, climate policy, the assessment of landscape connectivity, and evaluating ecosystem services (Tiemann and Ring, 2022; Vogt et al., 2024; Hunka et al., 2024).
Recent developments in remote sensing for land cover and land use mapping have significantly expanded the ability to monitor and analyze tree cover, tree height and land cover and land use dynamics (Mercier et al., 2019; Brown et al., 2022). Notable progress has been made in detecting both industrial and smallholder tree crop plantations (Clinton et al., 2024; Descals et al., 2024; Wang et al., 2023), enabling improved differentiation between natural forests and managed tree crops. Advances in high-resolution imagery, as demonstrated by Brandt et al. (2023), have enhanced the ability to map low-density tree cover and trees outside forests, contributing to a more complete understanding of tree presence across heterogeneous landscapes. Innovations in estimating canopy height by applying deep learning techniques to high-resolution optical and radar imagery and spaceborne LiDAR open new avenues for assessing forest structure and estimating aboveground biomass with greater accuracy (Pauls et al., 2024; Lang et al., 2023). Additionally, remote sensing is increasingly used to characterize the drivers of tree cover loss, with recent work providing spatially explicit information on pressures such as agriculture, infrastructure expansion, and fire (Slagter et al., 2023; Shapiro et al., 2023; Masolele et al., 2024; Sims et al., 2025). Research by Hansen et al. (2013) and Vancutsem et al. (2021) reconstruct trajectories of global tree cover changes and tropical moist forest changes, respectively, offering valuable data for monitoring long-term trends and inform policy makers.
Earth observation systems enable global mapping of tree cover presence, reflecting the biophysical characteristics of the land surface. However, ”forest”, as a land use designation, requires contextual information that goes beyond the simple application of biophysical thresholds for tree cover, height, and minimum area. Not every tree constitutes a forest and not all forest lands have trees standing at the time of data acquisition for mapping. Some tree-covered areas do not meet the minimum crown cover or area thresholds defined for forests, or they may belong to other land uses. Examples are urban spaces or agricultural plantations such as full sun tree crop production or crop in agroforestry systems where trees provide shade for crops underneath. Conversely, areas classified as forest may temporarily lack tree cover due to events such as harvesting or wildfires, while awaiting regrowth through restocking or natural regeneration. Land-use definitions still consider these areas as forest if, at maturity, the trees can reach specified thresholds for area, density, and height.
To date, only three global-scale forest maps exist that align with FAO definitions: (i) a hybrid forest map calibrated with FAO FRA data at 1 km resolution for the year 2000 (Schepaschenko et al., 2015), (ii) a forest management map at 100 m resolution for the year 2015, which categorizes forest land use according to FAO classification (Lesiv et al., 2022), and (iii) a natural forest map for the year 2020 at 10 m resolution produced from Sentinel-2 imagery and deep learning methods (Neumann et al., 2025). The natural forest map excludes planted and plantation forests from its forest cover extent. Currently, there is no global map at 10 m resolution for the year 2020 that encompasses all components of forest as defined by the FAO.
The primary objective of this paper is to introduce the second version of the Global Forest Cover map for the year 2020, known as GFC2020, which provides a spatially explicit representation of forest presence or absence at 10 m spatial resolution. More broadly, the paper aims to present a globally consistent and harmonized methodology for mapping forest land use using existing global datasets. Building on recent and scientifically validated advancements in remote sensing products, our approach integrates global (or global in their scope) spatial datasets on tree cover, tree height, and land use and combines them to systematically exclude treed areas that do not meet forest criteria under the EUDR forest definition. The paper includes a thorough validation of this new global map, a comparison with FAO Global Forest Resources Assessment data, a review of limitations, and a discussion of potential applications in ecological monitoring and policy implementation.
2.1 Forest definition
The forest definition used in the GFC2020 map aligns with definitions set out in the EUDR (EU, 2023) and by the Food and Agriculture Organization (FAO, 2018, 2025). A forest is defined as land spanning more than 0.5 ha, with trees higher than 5 m and a canopy cover greater than 10 %, or with trees capable of reaching those thresholds in situ. Land used for urban or agricultural purposes is excluded from the definition of “forest”. Agricultural use refers to land used for crop cultivation, including agricultural plantations, set-aside agricultural areas, and land used for livestock rearing. Agricultural plantations are areas with tree stands in agricultural production systems, such as fruit tree plantations, oil palm plantations, rubber, olive orchards, and agroforestry systems where crops are grown under tree cover. In other words, all plantations of relevant non-wood commodities, such as cocoa, coffee, oil palm, rubber, and soya, are excluded from the forest definition.
2.2 Approach
To establish a global map of forest land use at 10 m spatial resolution, we conducted a Boolean analysis of a suite of existing and publicly available datasets of global scope, including satellite-derived tree cover, height, age, and land use classification layers (Table A1 in the Appendix). Most datasets are derived from remote sensing with a spatial resolution varying from 10 to 30 m. Vector datasets with a global scope are also taken into account. Stratification layers on ecological zones from FAO, drivers of global forest loss, gridded production data of agricultural tree plantation, and maps on the potential of agroforestry land use were introduced in the workflow to further refine the combination of input datasets.
The mapping approach consists of three steps. First, we merge existing global layers that identify tree cover extent around the year 2020. This step creates a global maximum extent of tree cover, including mangrove, planted and natural trees. We expand this extent by including areas without standing trees that potentially correspond to unstocked forest by incorporating datasets on historical tree cover and analysing historical tree cover losses driven by natural disturbances or forest management. This consolidation of the maximum potential extent of forest cover is critical because areas not identified in this initial mask cannot be classified as forest cover in subsequent steps.
The second step uses layers that allow to remove tree-covered areas that do not correspond to the forest definition. These exclusion layers are related to tree height, prior agricultural land use through indicators of deforestation, presence of cropland or agroforestry systems, other land use types and urban areas. This exclusion phase is aimed to minimise commission errors (Fig. 1). We developed these two first steps through an iterative process involving literature screening of most recent relevant datasets for the year 2020 and feedback from internal (Joint Research Centre – JRC) and external (EUDR stakeholders) qualitative assessments (see Bourgoin et al., 2024c; Colditz et al., 2024). In the third step we correct local errors and apply a minimum mapping unit (MMU) of 0.5 ha to mimic the EUDR forest definition.
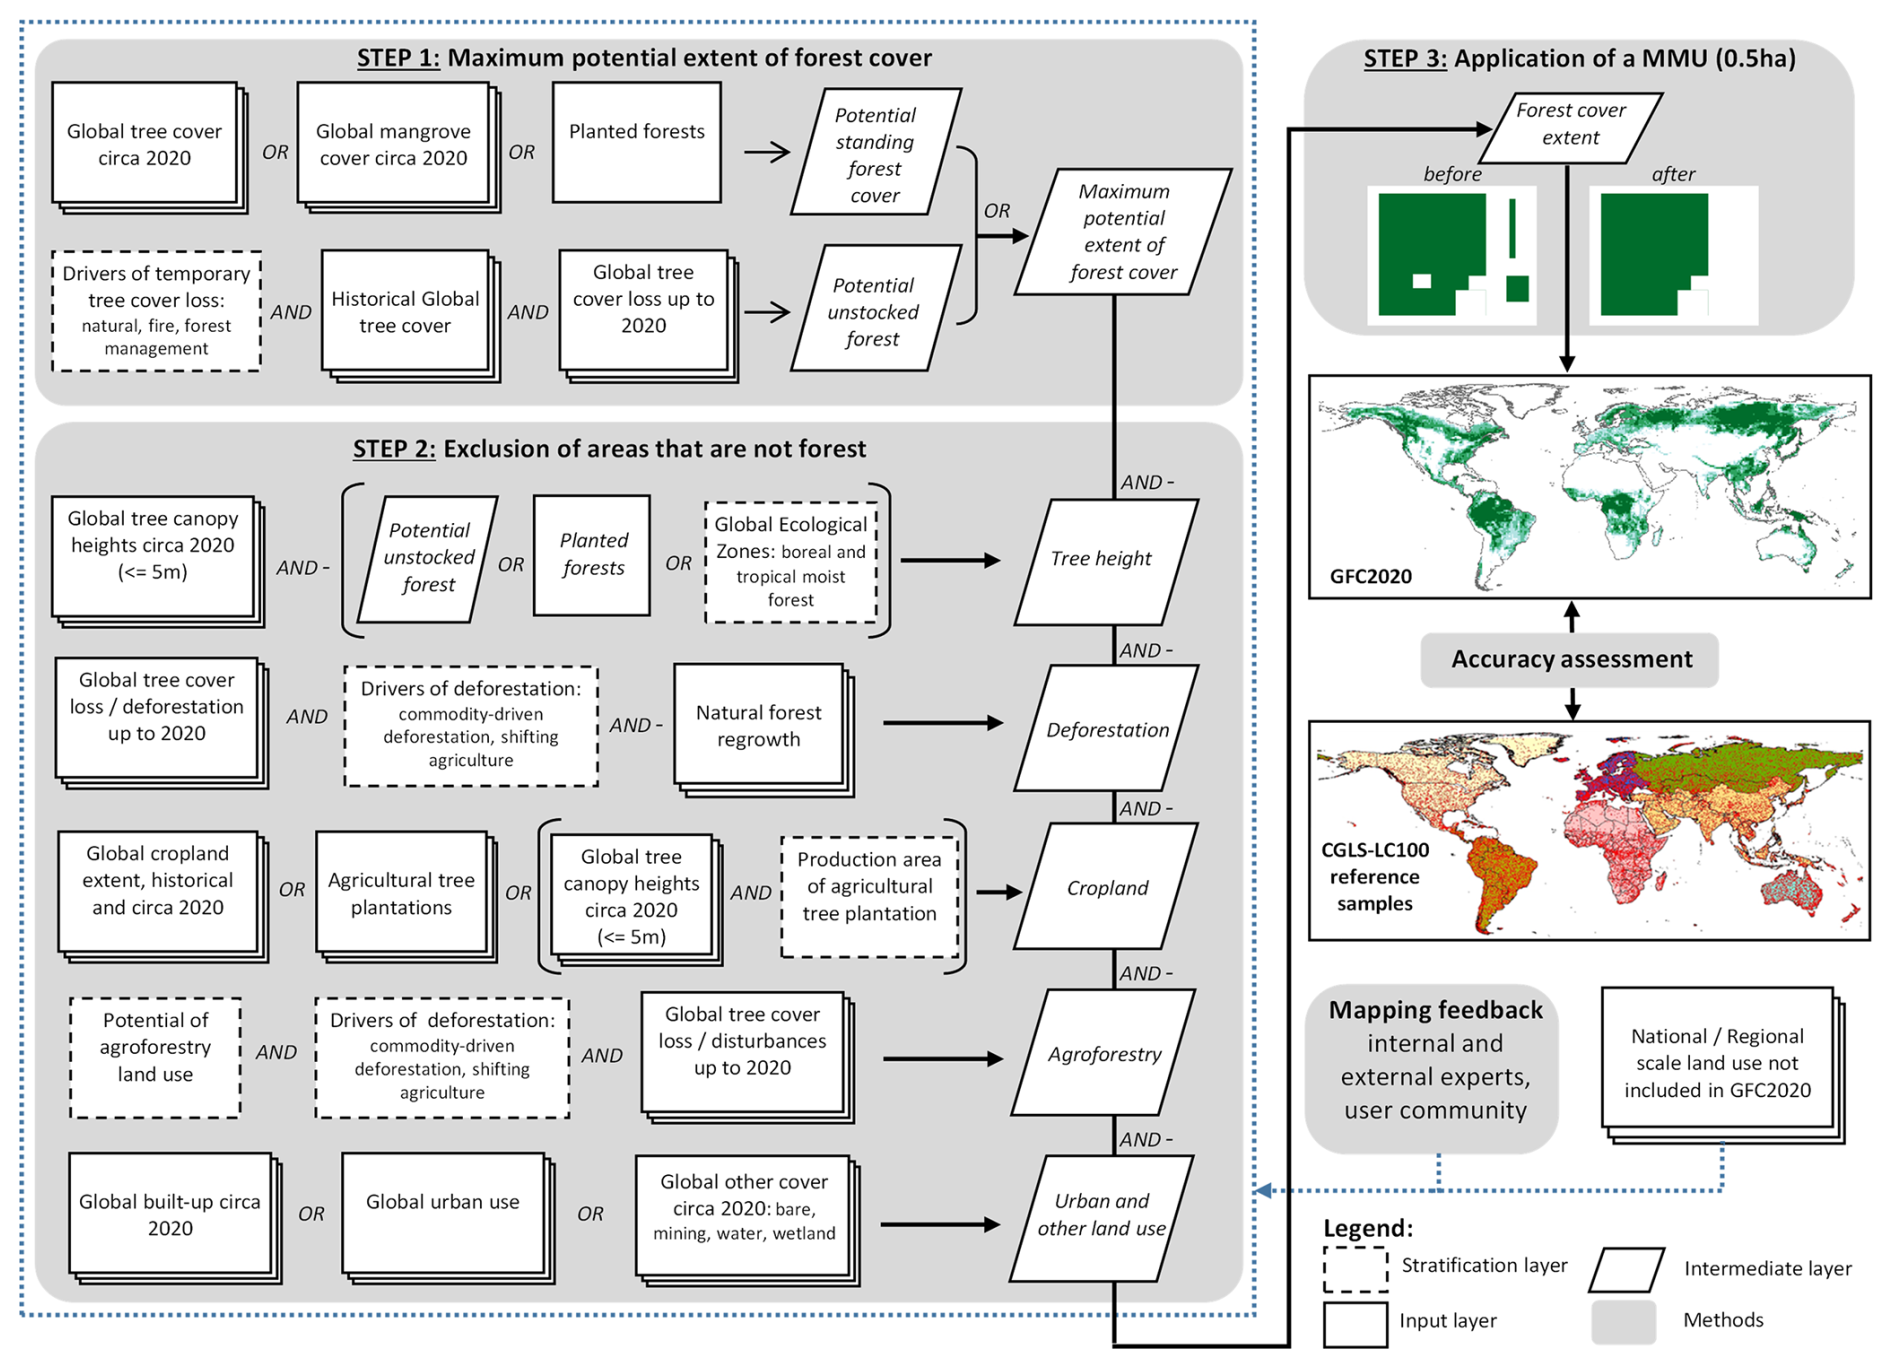
Figure 1Three-step workflow of the global forest cover mapping approach, feedback and accuracy assessment. Key data inputs and outputs are organized thematically according to the forest definition. The feedback loop is crucial for refining revised versions of the map. “AND” and “OR” refer to the Boolean expression. “–” refers to a logical “NOT” expression.
The global classification leverages Google Earth Engine (GEE, Gorelick et al., 2017), which provides both high-performance computing for processing global geospatial datasets and give access to a multi-petabyte, analysis-ready data catalogue. Input datasets that were initially not present in the GEE catalogue were ingested in their original resolution with the EPSG: 4326 projection for the production of this new global map. Vector datasets were rasterized to the 10 m per pixel resolution.
We assess GFC2020 against independent validation samples collected at global level. We build on the existing sample design for the validation dataset of the Copernicus Global Land Service – Land Cover map at 100 m (CGLS-LC100, Tsendbazar et al., 2021; Xu et al., 2024) and interpreted each sample unit according to the forest land use definition.
The mapping approach is flexible and can be continuously refined when new global-scope datasets become available as proven by improvements from version 1 to version 2; the latter is presented in this study. The feedback and local knowledge from the user community and insights from internal and external experts is used to refine this global approach. The workflow can also benefit from continued collaborations with research groups (e.g., World Resources Institute – WRI, International Institute for Applied Systems Analysis – IIASA) to identify new global or globally relevant spatial datasets and potential enhancements. Furthermore, internal analyses comparing the Global Forest Cover (GFC) product with open-access regional or national land use datasets (e.g., from New Zealand, Côte d'Ivoire, North America, Brazil) allows to identify regions with discrepancies in forest mapping for potential improvement. These comparisons aim primarily to inform the refinement of decision rules in the approach, as non-global datasets (regional or national) cannot be integrated directly into the core workflow (Verhegghen et al., 2024; Bourgoin et al., 2025).
2.2.1 Input datasets
This section details the input layers for land cover, land use, tree cover, and tree height that are used to produce the GFC2020 map version 2 (Table 1). Most datasets represent the landscape in circa year 2020, with a few exceptions that are presented and justified in subsequent sections. Global spatial datasets on ecological zones, forest cover change drivers, forest management types or coarse resolution cropland distribution are used as stratification layers to refine the data integration.
Table 1Input datasets. Detailed information on each input data layer can be found in Table A1 and in dedicated JRC policy reports (Bourgoin et al., 2024b, 2025).
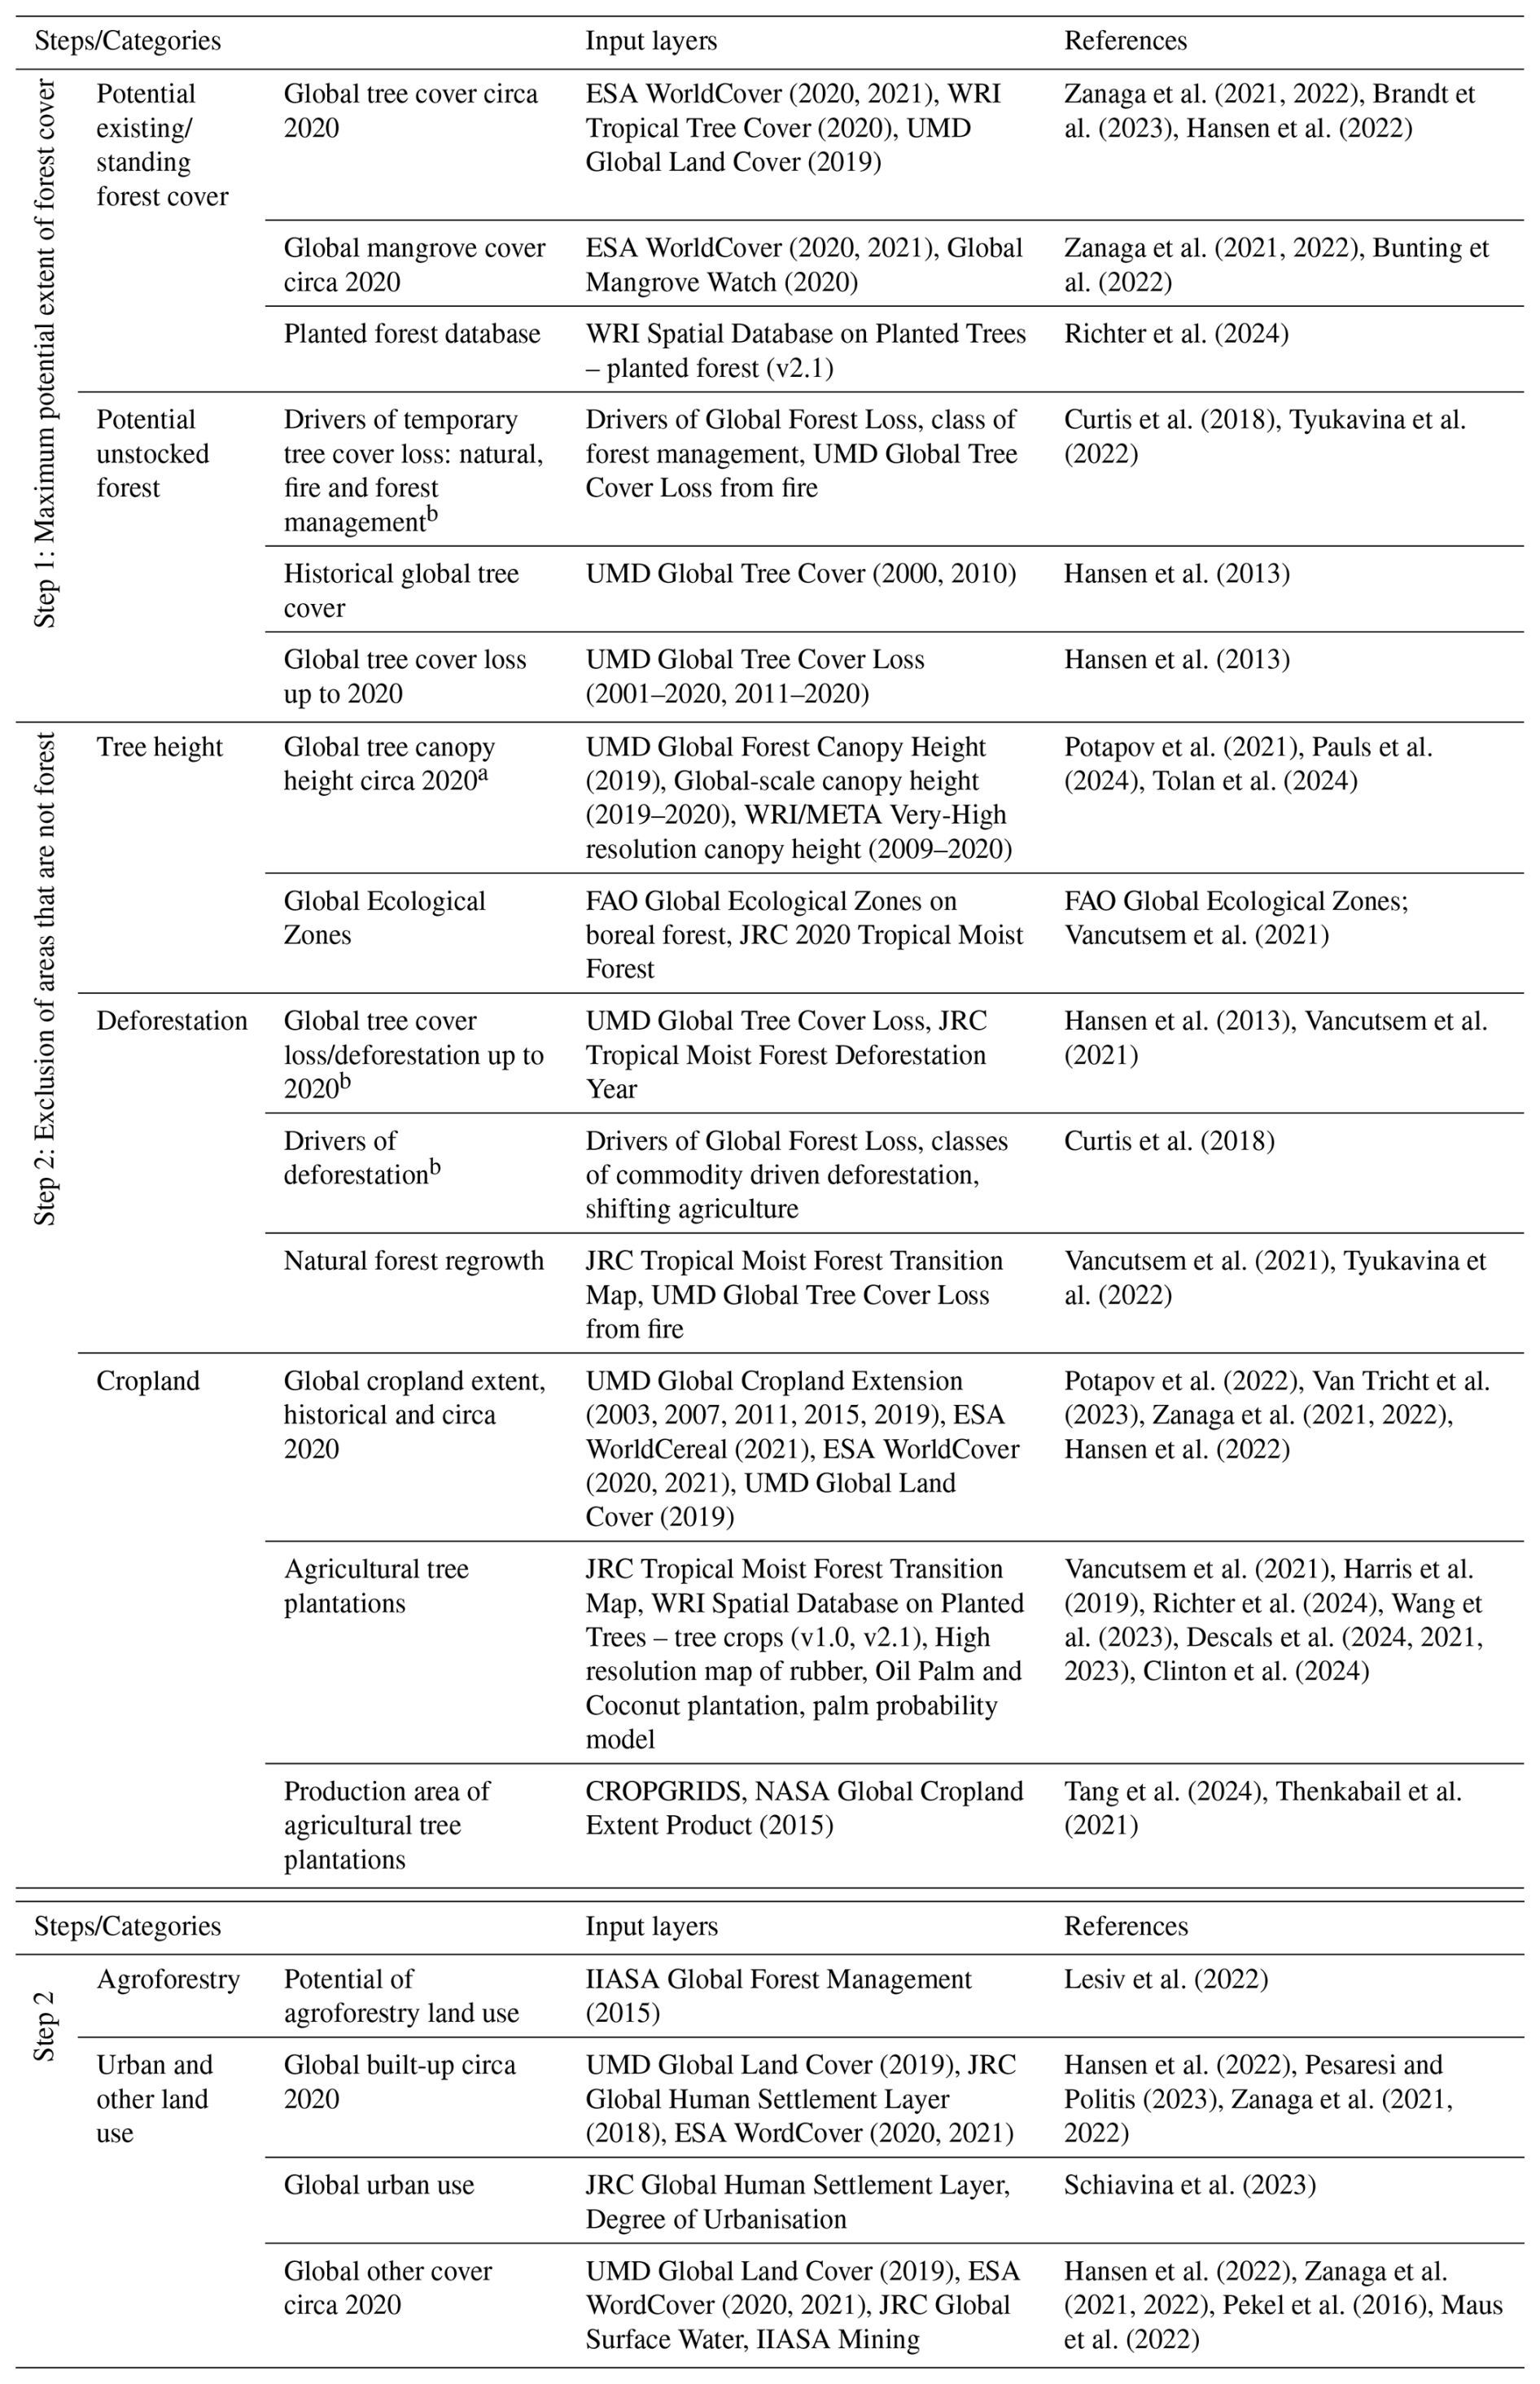
Note: a Also used for cropland mapping. b Also used for agroforestry mapping.
2.2.2 Boolean decision rules
Step 1 maps the maximum potential extent of global forest cover (Fig. 1, Tables 2 and A1). To identify potential existing/standing forest cover, we integrate three categories of spatial datasets with equal weight: (i) global tree cover circa 2020 derived from a combination of ESA WorldCover tree cover for 2020 and 2021, WRI Tropical Tree Cover 2020, and UMD Global Land Cover and Land Use 2019; (ii) global mangrove cover circa 2020 based on data from the Global Mangrove Watch (GMW) 2020 and ESA WorldCover mangrove layers for 2020 and 2021; and (iii) planted forest areas from the WRI Spatial Database on Planted Trees (SDPT) v2.1.
To map potential unstocked forest in 2020, we combine UMD global tree cover loss data with historical tree cover – using UMD tree cover from 2000, or from 2010 for areas where loss occurred after 2011 – alongside two spatial datasets identifying the drivers of temporary tree cover loss. If (i) forestry operations are identified as the primary cause of tree cover loss by the Drivers of Global Forest Loss dataset and no tree cover is detected in WorldCover 2020 or 2021, these areas are included as potential unstocked forest resulting from clear-cut harvesting; or (ii) if fire is identified as the primary driver of tree cover loss after 2011 using the UMD fire-attributed loss dataset and no tree cover is present in WorldCover 2020 or 2021, these areas are included as potential unstocked forest resulting from fire disturbance.
Step 2 applies five exclusion masks to remove treed areas that do not qualify as forest from the maximum potential forest extent (Fig. 1, Table 2 and A1):
-
Tree height: we exclude areas with top canopy heights below 5 m using data from UMD Global Forest Canopy Height (GFCH) and Global-scale canopy height (GSCH), except where they overlapped with the potential unstocked forest layer identified in Step 1, planted forests, or specific ecological zones. Exempted zones include Boreal Coniferous Forest, Boreal Tundra Woodland, Boreal Mountain System, and Polar Regions as defined by FAO, as well as Tropical Moist Forests – covering undisturbed, degraded, regrowth, and mangrove areas – according to JRC-Tropical Moist Forest classification.
-
Deforestation: we exclude areas where tree cover loss from UMD (2001–2020) was attributed to a deforestation driver – specifically commodity-driven deforestation and shifting agriculture, as defined by Curtis et al. (2018) – or where deforestation up to 2020 was mapped by JRC-TMF, including forest conversion to agricultural plantations (e.g., oil palm, rubber). Exceptions were made for areas showing evidence of natural forest regrowth, such as loss caused by fire (Tyukavina et al., 2022) or areas within JRC-TMF forest and mangrove zones with regeneration potential following temporary disturbance, as well as forest regrowth older than five years.
-
Cropland: we create a global cropland extent by combining historical UMD cropland expansion data (2003–2019) with 2020 datasets, including WorldCereal temporary crops, ESA WorldCover cropland (2020, 2021), and UMD Global Land Cover (GLC) cropland 2019. To map agricultural tree plantations, we compile global datasets such as WRI SDPT tree crops (v1 and v2.1), Asian rubber plantations from Wang et al. (2023), and global industrial and smallholder oil palm and coconut plantations from Descals et al. (2021, 2023, 2024), along with palm probability data from Clinton et al. (2024). We also use crop production area data for coffee, cocoa, and cashew from CROPGRIDS, and coarse cropland extent from NASA Global Cropland Extent Product (GCEP), combined with canopy height data (<5 m from META/WRI or GSCH), to identify and exclude other tree crop areas. All areas intersecting with one or more of these exclusion masks are classified as non-forest.
-
Agroforestry: We intersect data on the potential for agroforestry land use from the Forest Management Map (Lesiv et al., 2022) with Global tree cover loss from UMD and forest disturbances from JRC-TMF (including both temporary and permanent disturbances) in areas attributed to deforestation drivers (i.e. commodity-driven deforestation and shifting agriculture) to exclude shaded crops such as cocoa or coffee, which may otherwise be misclassified as natural forest.
-
Urban and other land use: we exclude trees intersecting with global built-up areas circa 2020, using data from UMD GLC (0 %–100 % built-up), JRC Global Human Settlement Characteristics (GHS-BUILT-C), and ESA WorldCover (2020 and 2021). To further refine exclusions, we use the JRC Global Human Settlement Layer Settlement Model (GHS-SMOD) to remove tree cover within suburban, peri-urban, and dense urban areas (see Table A1 for details). We also build a global exclusion layer for “other land cover” by combining UMD land cover classes (desert, semi-arid land, dense short vegetation, salt pans, sparse wetland vegetation, and ice), JRC Global Surface Water (permanent, newly permanent, and seasonal-to-permanent water), ESA WorldCover (2020/2021 water and wetland/bare soil classes), and mining land use data from IIASA.
Step 3 involves post-processing to correct artifacts and enforce forest definition standards. We manually correct or replace artifacts, such as striping caused by the Landsat-7 scan line corrector failure, using WorldCover 2021 tree cover data. Forest pixels overlapping with lava flows are removed using a mask from the Global Surface Water dataset. To align with forest definition standards, we apply a minimum mapping unit (MMU) of 0.5 ha. This MMU also reclassifies small non-forest gaps (<0.5 ha) within large forest patches (>0.5 ha) as part of a single forested area. We calculate the patch area using latitude-adjusted pixel sizes (EPSG: 4326) and delineate patches using an eight-neighbour connectivity rule, i.e. cardinal and intercardinal directions.
2.3 Accuracy assessment
We conducted an accuracy assessment of the GFC2020 map with an independent validation dataset to evaluate the accuracy of the map at the global and continental levels. The validation is done following good practices for accuracy assessment of land cover maps (Strahler et al., 2006) and meets the requirements of stage 3 validation guidelines of the Land Product Validation (LPV) subgroup of the Committee on Earth Observing Satellites (CEOS) (Tyukavina et al., 2025).
2.3.1 Sampling and response design
The accuracy assessment uses the 21 752 sample units from the validation dataset of the Copernicus Global Land Service Land Cover product for the year 2015 (CGLS-LC100) (Tsendbazar et al., 2020, 2021). The CGLS-LC100 validation dataset follows the recommendations introduced by Tsendbazar et al. (2018) for creating a multi-purpose validation dataset for Africa and expands to the global scale. The statistical approach builds on a global set of 149 continental strata (Tsendbazar et al., 2018, 2021). Koeppen climate zones and human population density served as basic parameters for spatial sample unit distribution per continent. Tsendbazar et al. (2021) introduced additional strata to increase sampling intensity in rare land cover types, specifically wetlands, urban areas, water bodies, and shrublands, as identified in the discrete land cover map from the Copernicus Global Land Service (Buchhorn et al., 2020). Figure 2A shows the geographical distribution of all 21 752 sample unit locations. The sample units consist of Primary Sample Units (PSU) of 100 × 100 m (blue frame in Fig. 2B) divided into 100 10 × 10 m Secondary Sampling Units (SSU, yellow mesh in Fig. 2B). We selected the top-left SSU in the centre of each PSU (red cell in Fig. 2) for validation of the 10 m GFC2020 map.
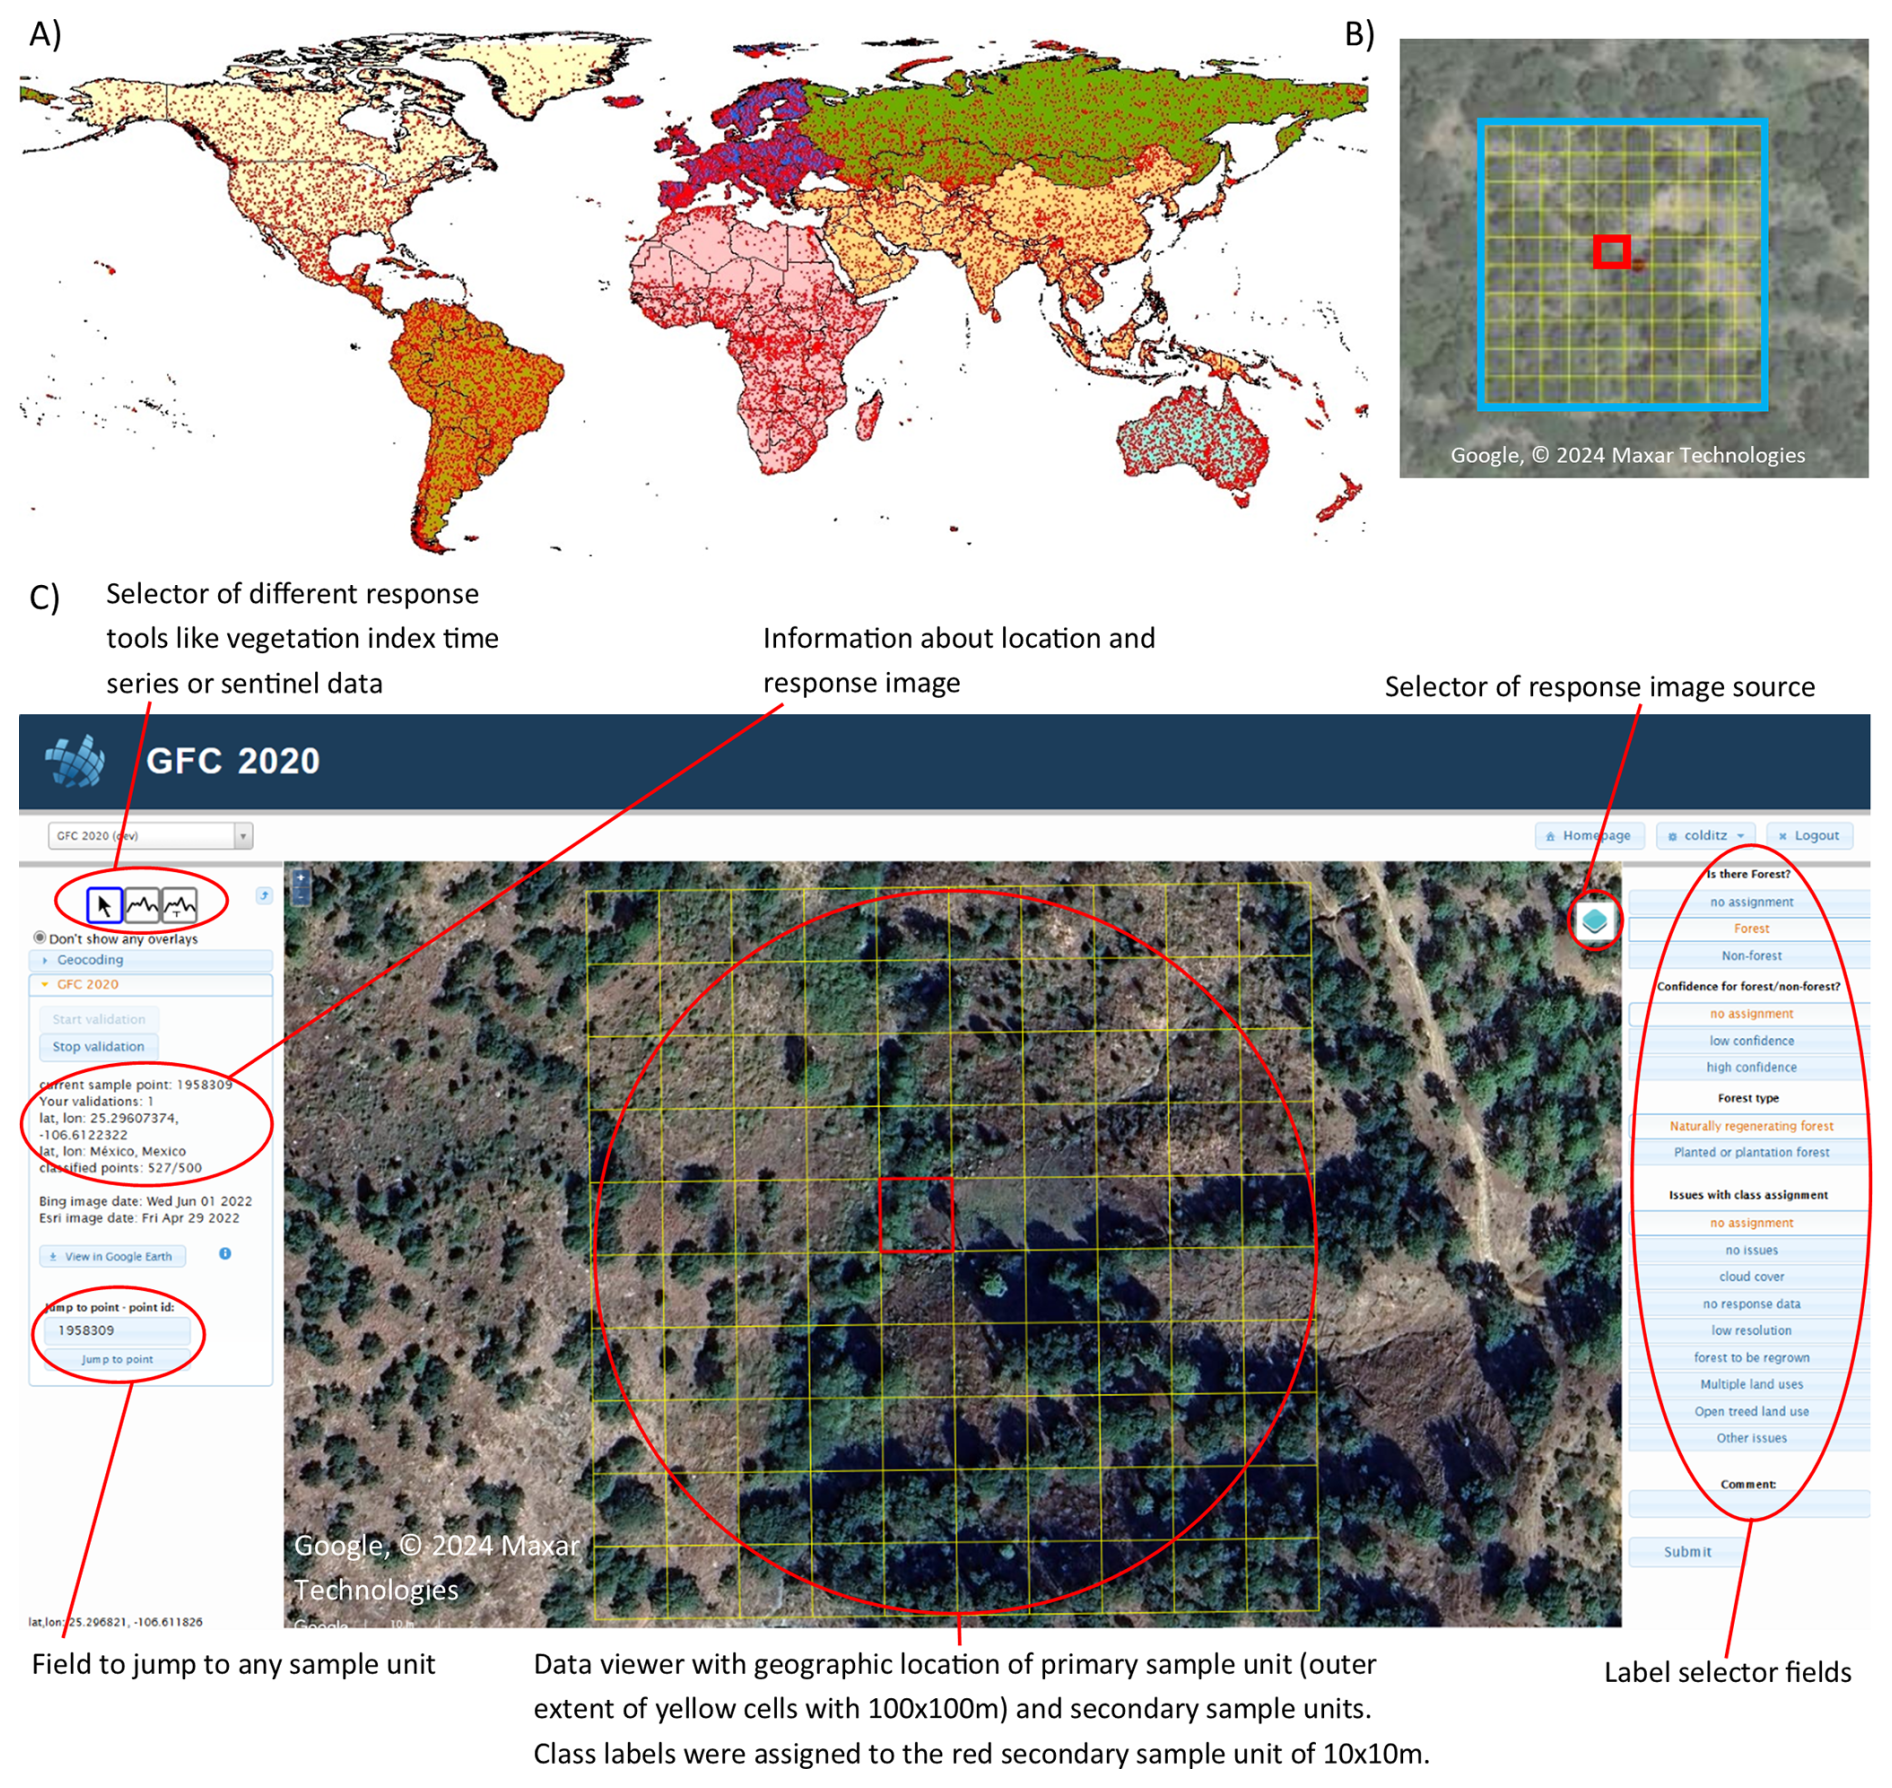
Figure 2Sampling and response design: Continental strata and sample location (A). 100 × 100 m Primary sample unit (PSU, blue box) with 10 × 10 m Secondary Sample Units (yellow mesh) (B). The red cell of 10 × 10 m indicates the secondary sample unit for which interpreters assigned the response label and which is used to assess GFC2020. Geo-Wiki validation interface showing a very high-resolution image and the secondary sample units (yellow) altogether forming the primary sample unit with the selected secondary sample unit for assessment of GFC2020 in red (C). Map data © 2024 Google.
Geo-Wiki by IIASA was the main tool for response data viewing and collection of labels by interpreters (Fig. 2C). Very high spatial resolution (mostly <1 m) from ESRI, Bing and Google are available in Geo-Wiki. In most cases interpreters also consulted the high spatial resolution image time series for sample unit locations in Google Earth Pro to select response images close to the EUDR cut-off date (31 December 2020) and checked nearby Google Street View photographs. In tropical regions some interpreters also used the JRC IMPACT toolbox (Simonetti et al., 2015) to display data from Planet scope accessed through Norway's International Climate & Forests Initiative (NICFI).
A protocol was developed to interpret and assign labels for sample units using VHR image sources. The protocol, detailed in Colditz et al. (2025b), follows a two-level interpretation legend presented in Table A2. First, the sample unit is labelled either as forest or non-forest. Second, the interpreters were asked to report on the forest type or the land use type for non-forest assignments. In addition, the interpreters were also asked to report on their confidence (high/low confidence) of the interpretation and mapping issues, if any.
Figure 3 illustrates a variety of sample unit interpretations using the protocol. The assessment of forest follows the EUDR and FAO definition (FAO, 2018). A sample unit is labelled as forest if all the physical thresholds (tree height >5 m, density >10 %, area >0.5 ha) and land use requirements are met. According to the definition, forest also includes land that is unstocked or where trees for forest land use are temporarily below the 5 m threshold, for instance following forest harvesting operations or fire (Fig. 3 example A illustrates a forest in regrowing state).
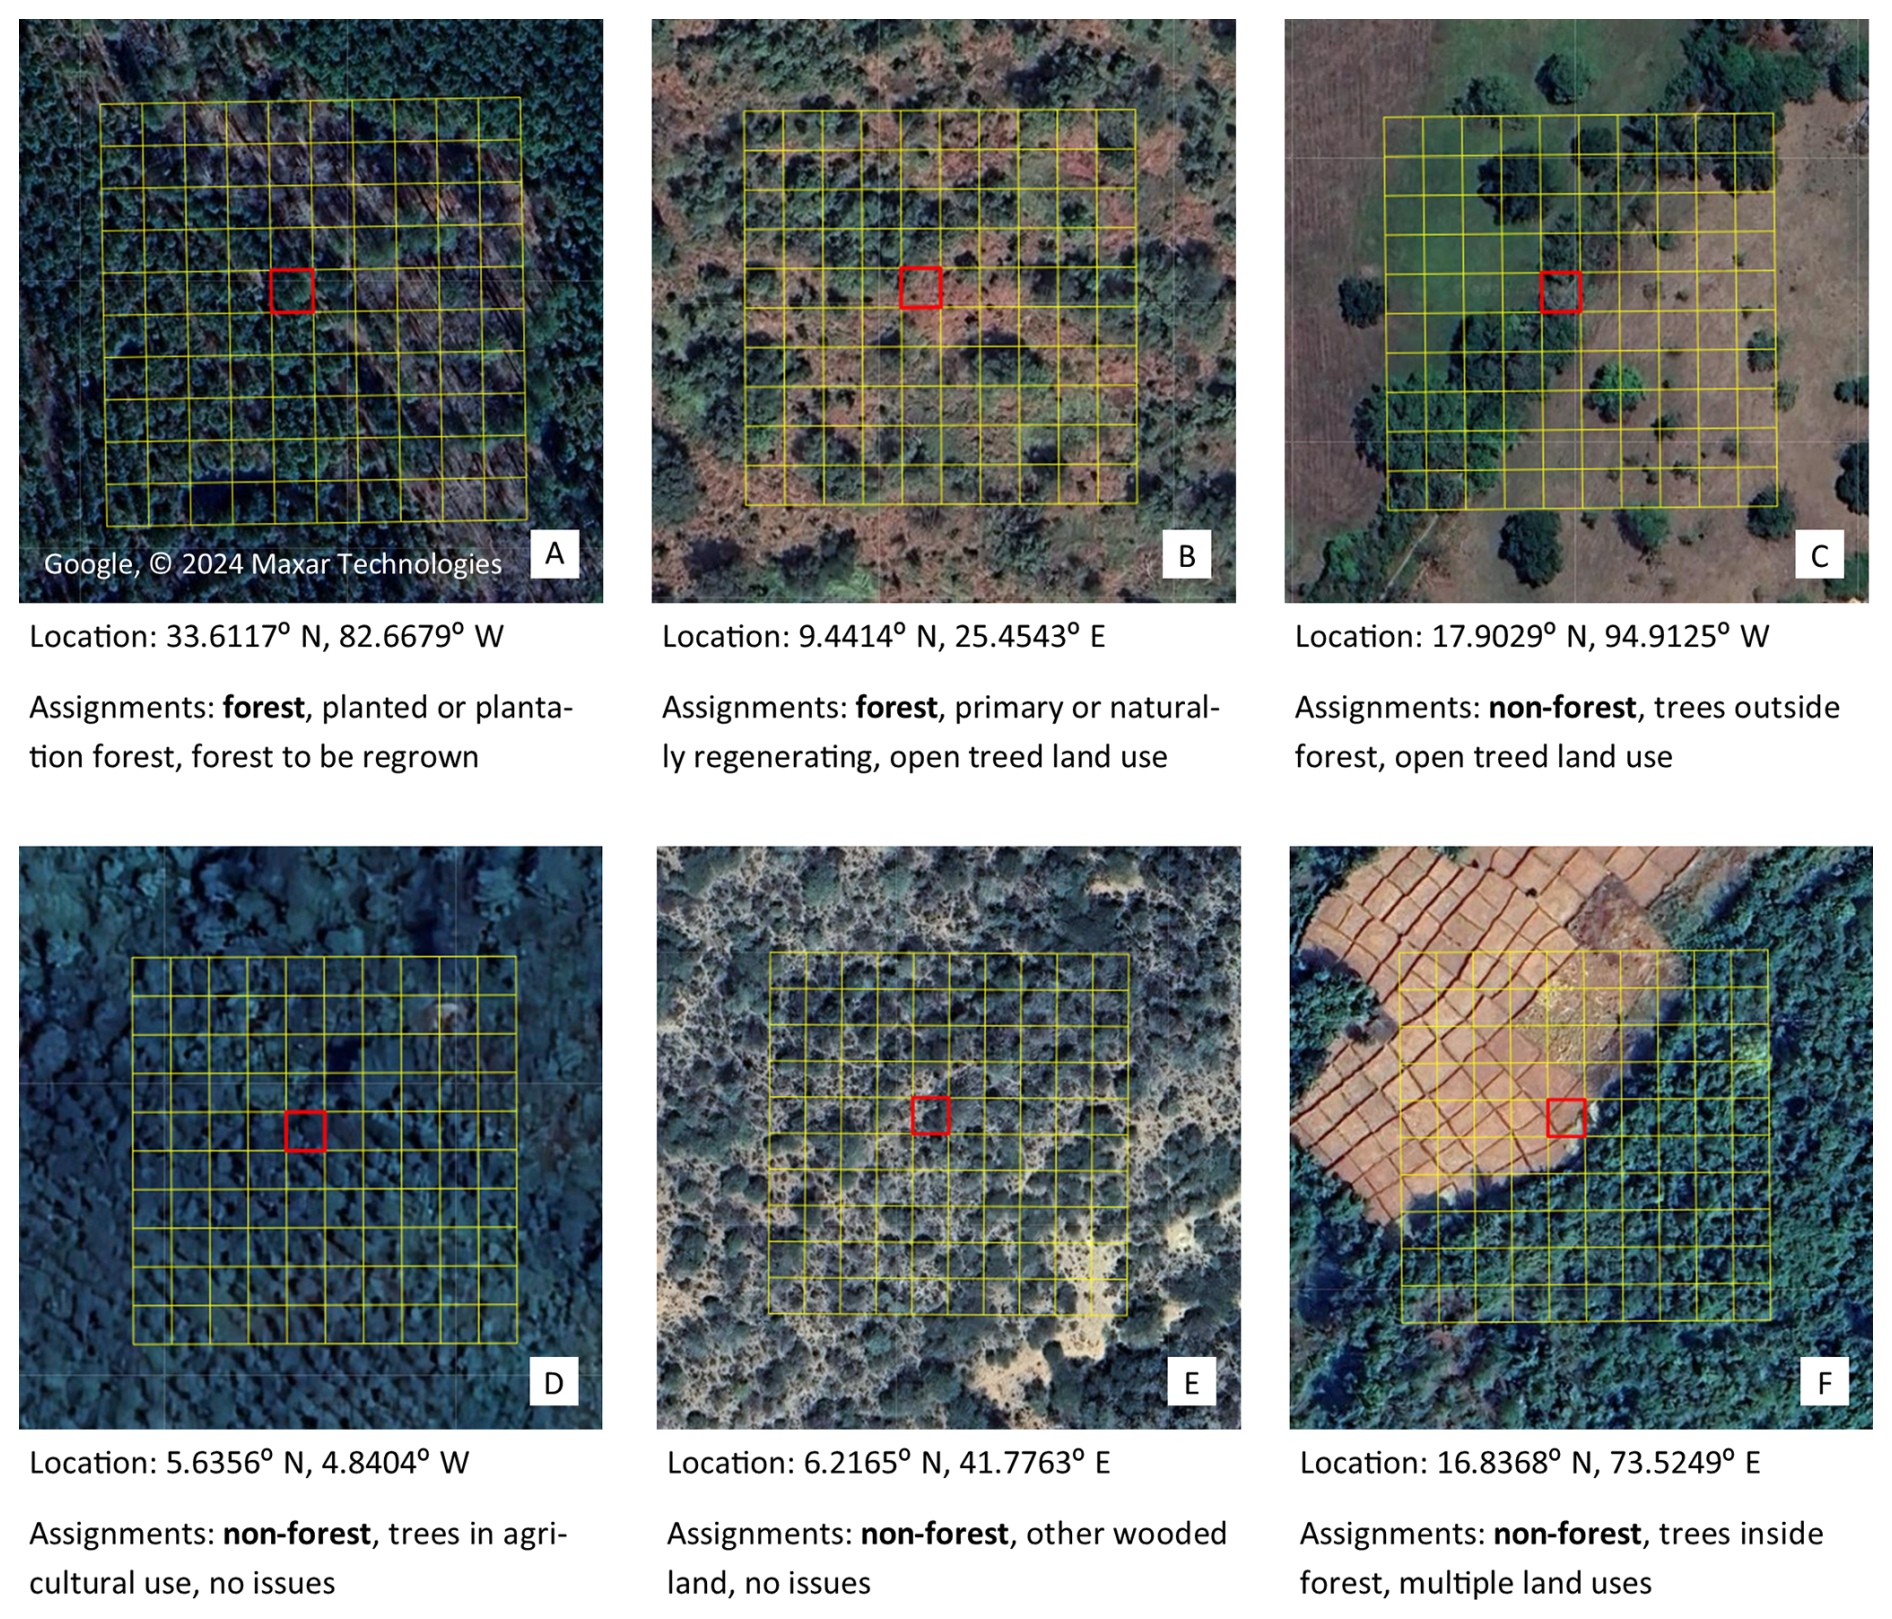
Figure 3Examples of sample units (red cell) class assignment taking into account the primary sample unit (yellow mesh). Reproduced from Colditz et al. (2025b). Forest, land without standing trees is regrowing, and presence of planted forest in the primary sample unit (A). Forest, even though the sample unit falls into an area without trees, because the area within the primary sample unit has tall trees with a density well above 10 % and there are no signs of other land uses than forest (B). Non-forest, where the dominant land use is grazing, even though all physical criteria of “forest” would be met (C). Non-forest, an agricultural tree plantation (cocoa and rubber) which precludes this land being labelled “forest” even if the physical criteria are met (D). Non-forest, contains woody vegetation below 5 m (E). Non-forest, the land use with the largest area in the primary sample unit is forest, but the secondary sample unit for assignment is located outside and the non-forest parcel is larger than 0.5 ha (F). Map data © 2024 Google.
Even though experts assigned response labels to the centre 10 × 10 m secondary sample unit, the forest definition includes a few criteria that require the interpretation of a larger area. For instance, forest must have an area of at least 0.5 ha, thus the mere presence of trees in the centre 10 × 10 m SSU surrounded by grassland does not qualify as forest. Likewise, a decision of land use, i.e. if the land is predominantly under forest land use (Fig. 3 example B) or dominated by agriculture or grazing animals (Fig. 3 example C) requires the interpretation of a larger area. This larger area was in most cases confined to the extent of the PSU with 100 × 100 m.
The choice of classes for the second-level interpretation depends on whether the sample unit has been categorized as “forest” or “non-forest”. For “forest”, the expert assigned the forest type, either “Primary or naturally regenerating forest” or “Planted or plantation forest”. For “non-forests”, the expert selected either “no trees or shrubs present” or chose from a set of classes (see list in Table A2a) that contain trees which are non-forest and therefore hold potential to be misclassified as forest in the map. For instance, Fig. 3 example D illustrates an agricultural tree plantation (cocoa and rubber), which cannot be classified as “forest” even if it meets the physical criteria. Figure 3 example E contains woody vegetation below 5 m and is labelled “other wooded land”. There are complex cases where the major land use within the PSU is forest, but the SSU (the red cell) is located in a non-forest land use parcel larger than 0.5 ha, labelled as “trees inside forest” (Fig. 3 example F).
The interpretation was conducted in two rounds, involving two independent groups of experts. The World was divided in 14 regions according to the available expertise by interpreters and ensuring an approximate balance of sample units. In a first phase, 13 experts, mainly from the JRC, interpreted response images for 21 752 sample units. In a second phase, a different group of mostly external experts revisited a subset of 4000 sample units. This included all sample units that were assigned with low confidence in the first interpretation and a random selection of sample units with high confidence for quality control. This double-blind interpretation for approximately 12 % of the total sample units ensured high quality interpretations for labels with low confidence and allowed to assess the agreement among interpreters.
2.3.2 Analysis
From the 21 752 sample units, interpreters could not assign classes to 24 sample units while 62 sample units were not associated with a strata class. For the comparison of forest area estimates with FAO-FRA 2025, we intersected the sample with the FAO Global Assessment Unit Layer (FAO, 2015), reducing the sample by an additional 54 sample units. The final reference set (Colditz et al., 2025a) with 21 612 sample units was crossed with the GFC2020 map to report the accuracy metrics. We use the formulas from Stehman (2014), applicable to the case where the stratification does not correspond to the map and to account for unequal inclusion probabilities of sampled units. From this probability confusion matrix we derived overall accuracy, producer and user accuracy and associated omission and commission errors.
2.4 Forest area estimates and comparison with FAO-FRA
We derived forest area estimates from the final reference set following the stratified estimation approach from Stehman (2013, 2014). The approach extrapolates the proportion of sample units labelled “forest” over the total land area, here the area of the 149 strata inside the FAO Global Administrative Unit Layers (GAUL) country limits. This probabilistic calculation allows for variance estimates, reported for the 95 % confidence interval. We then compared the area estimates from the sample-based approach at global and continental levels with those derived from the GFC2020 map, as well as global and regional data for the year 2020 reported in FAO-FRA-2025 (FAO, 2025) and from the FAO FRA-2020 Remote Sensing Survey for the year 2018 which used a sample of more than 400 000 units (FAO, 2022b). For the purpose of this comparison, the Russian Federation is grouped with Europe. Forest areas derived from GFC2020 are calculated by summing the surface area of all pixels mapped as forest in a WGS84-referenced geographic coordinate system; the geodesic area calculation inherently accounts for latitude-dependent pixel size. The global forest area from FAO-FRA builds on national reporting of forest area to year 2020 under the FRA-2025.
3.1 Global distribution of forest extent for year 2020
The Global Forest Cover map for year 2020 (Bourgoin et al., 2024a) depicts the global forest cover extent following the forest definition of the EUDR (Sect. 2.1). The global forest area of the GFC2020 map is distributed amongst the regions as follows: 20.8 % in the Russian Federation, 20.4 % in South America, 18.2 % in North and Central America (including the Caribbean), 16.7 % in Africa, 14.4 % in Asia, 5.1 % in Europe and 4.5 % in Oceania (Fig. 4A).
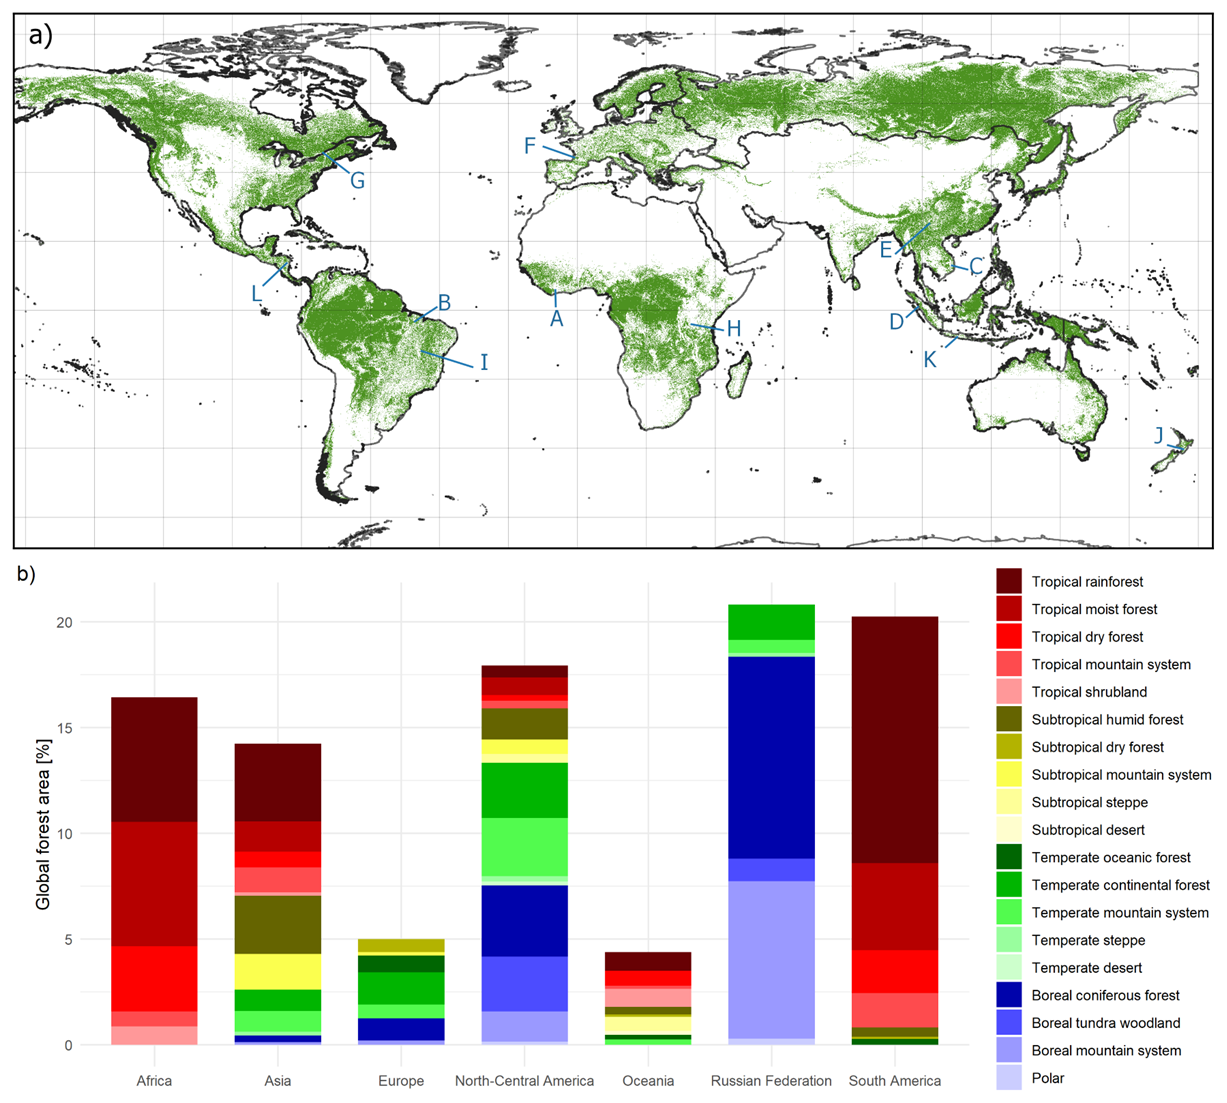
Figure 4Global representation of forest cover (green) (A). Grids represent a 20° fishnet and letters refer to the location of specific close-ups shown in Fig. 5. Proportion of global forest area distributed across continents and ecological zones (B). Global Ecological Zones from FAO are displayed in Fig. A1.
Looking at the distribution of forest cover inside the Global Ecological Zones (GEZ) of the FAO (FAO, 2012, Fig. A1 in the Appendix) at the global level, 23 % of the total forest cover is located in the tropical rainforest, 14 % in the boreal coniferous forest, 13 % in the tropical moist forest, 9 % in the boreal mountain forest, 7 % in the tropical dry forest, 7 % in the temperate continental forest, 5 % in the temperate mountain system and 5 % in the subtropical humid forest ecoregions. The rest of the 11 ecoregions contains less than 17 % of the total forest cover area. Looking at the distribution of forest cover inside the combination of GEZ and continents (Fig. 4B), the tropical rainforest in South America presented the highest share of forest cover, followed by the boreal coniferous forest and boreal mountain system in Russian Federation and the tropical moist forest and tropical rainforest in Africa.
Figure 5 illustrates the mapping of forest areas from GFC2020 across a range of natural and human-made landscapes. Structured agricultural areas – such as full-sun cocoa, soybean, pasture, full-sun coffee, oil palm, and rubber – are generally well distinguished as non-forest due to their regular spatial patterns, clearly defined boundaries, large-scale extent, and the availability of exclusion layers (as described in Step 2 of Fig. 1), as shown in Fig. 5A through E. Large-scale managed plantations for wood production are typically identified as forest areas (Fig. 5F), while trees in dense urban centres are correctly excluded from the forest extent (Fig. 5G).
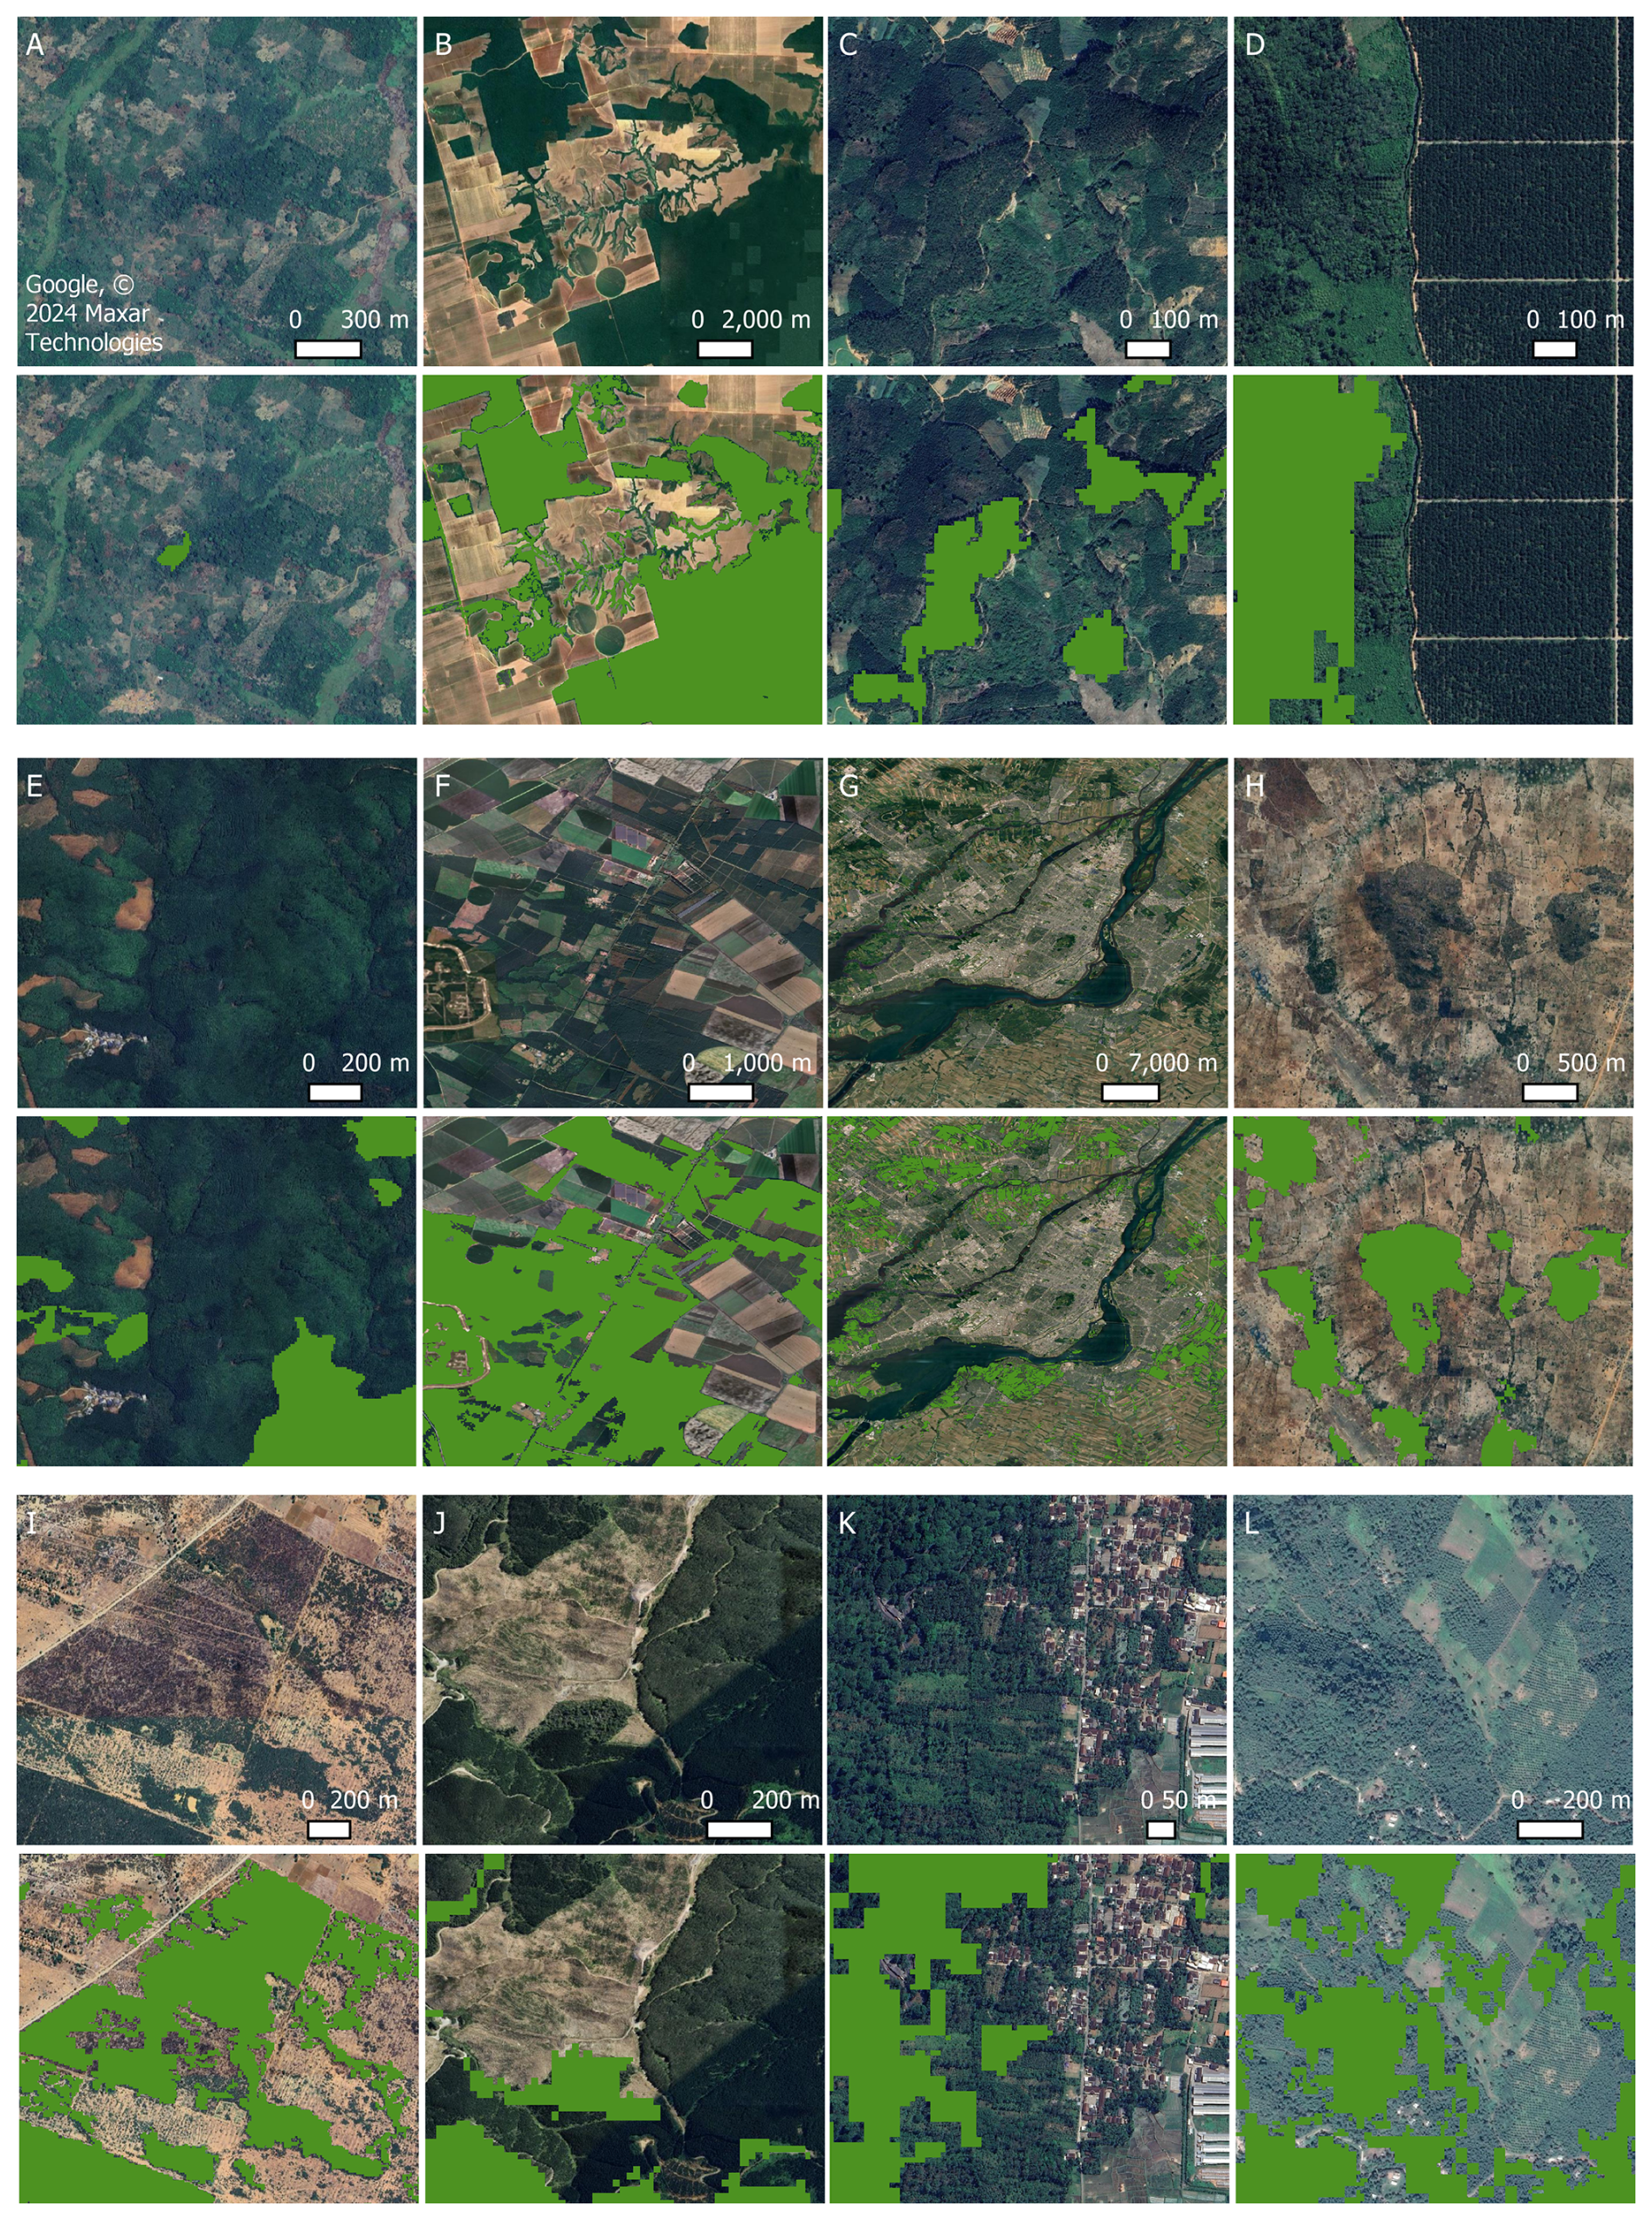
Figure 5GFC2020 mapping in the context of various natural and human-made landscapes: full-sun cocoa plantation (6.7° W, 5.6° N) (A), soybean and pasture structured landscape (47.3° W, 3.3° S) (B), full-sun coffee plantation (108.1° E, 11.5° N) (C), industrial oil palm plantation (98.6° E, 1.8° N) (D), rubber plantation (100.8° E, 21.9° N) (E), planted forest (0.8° W, 44.6° N) (F), urban trees (73.9° W, 45.2° E) (G), dry and open tropical forest (32.5° E, 4.2° S) (H), other wooded land (42.7° W, 10.7° S) (I), clear-cut harvesting on the left side and very young regrowth on the right side (173.4° E, 41.2° S) (J), agroforestry system and mixed urban (113.9° E, 8.3° S) (K), shaded coffee plantation (85.8° W, 13.3° E) (L). Map data © 2024 Google. Locations of each zoom is shown on Fig. 4.
Tree-covered areas in natural dry and open tropical forest landscapes (Fig. 5H) are more difficult to classify accurately. In such cases, the combination of multiple tree cover inputs (also outlined in Step 1 of Fig. 1) improves the detection of forest extent, but occasionally it leads to an overestimation. For instance, other wooded land – although not classified as forest by definition – is sometimes incorrectly mapped as forest (Fig. 5I). Unstocked forests, including areas affected by clear-cutting or very young regrowth, may be misclassified as non-forest when information on forestry activities driving tree cover loss is not available (Fig. 5J).
Finally, complex land-use systems such as mixed urban landscapes and shaded coffee plantations (Fig. 5K and L) can also be misclassified as forest due to their heterogeneous structure and partial canopy cover, which closely resemble natural forest in satellite imagery.
3.2 Statistical accuracy assessment
3.2.1 Accuracy assessment at global and continental levels
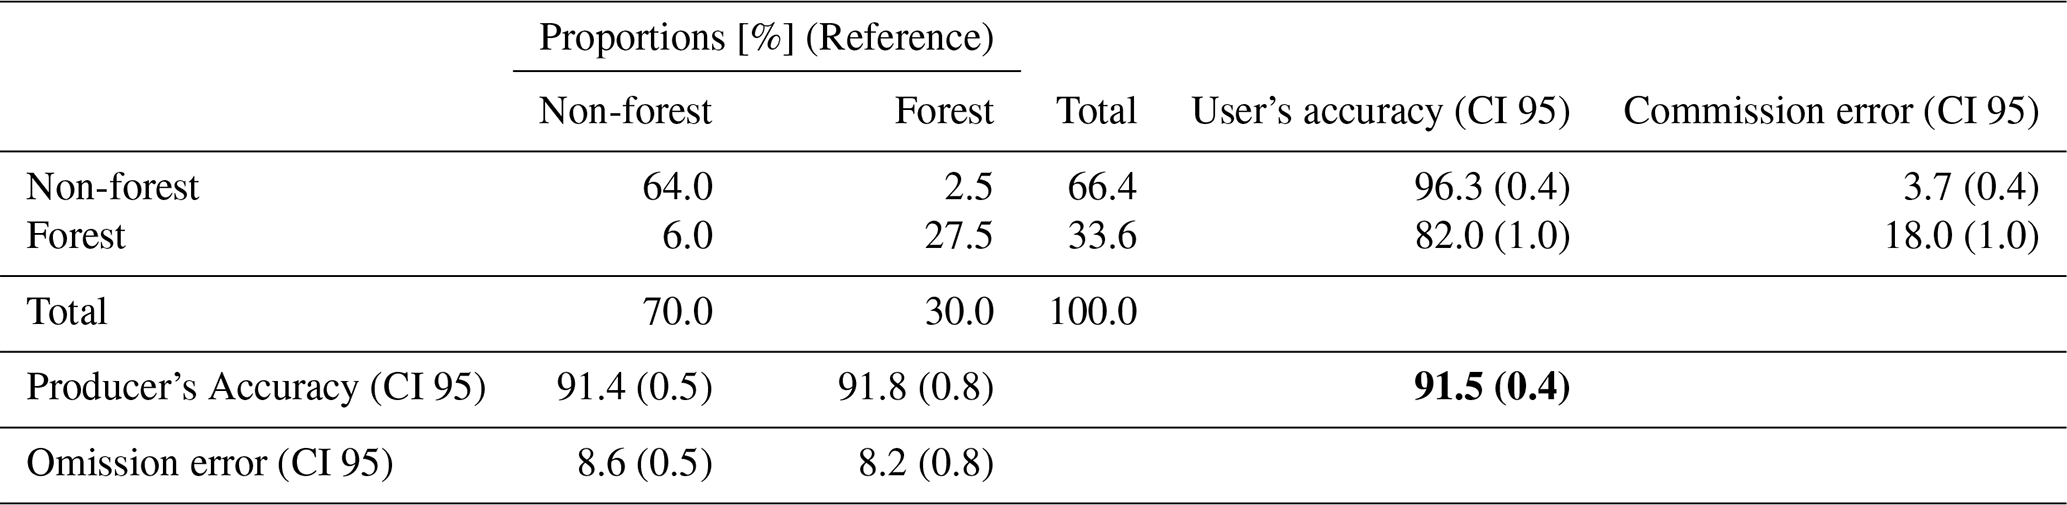
Table 2 shows the probability confusion matrix and accuracies for the GFC2020 map at global level. The confusion matrix represents the correspondence of the GFC2020 map with 21 612 sample units expressed as area proportion. In addition, Table 2 presents the overall accuracy, the producer and user accuracies of both forest and non-forest classes with their 95 % confidence interval, and the associated omission and commission errors. The GFC2020 map presents an overall accuracy of 91.5 %. For the forest class, the map has a user accuracy of 82 % (associated commission error of 18 %) and producer accuracy of 91.8 % (associated omission error of 8.2 %). Given the large sample size, the variance, expressed by the 95 % confidence interval (CI 95), is small. The higher commission error indicates the tendency of the map for a moderate overestimation of the forest area. There is 92.8 % overall agreement between the first and second interpretations and a balanced pattern of under- and overestimation without significant regional differences (Colditz et al., 2025b).
Table 2Confusion matrix (%), overall accuracy (bold) and class accuracies with associated errors for the GFC2020 map at a global scale. CI – confidence interval.
The accuracy of the GFC2020 map was also assessed at the continental level. Table 3 presents the overall accuracy, and commission and omission error of the forest class per continent. All continents have an overall accuracy above 88 %. There are notable differences of the overall accuracy among continents with lowest accuracies for South America (88.6 %) and Russian Federation (88.7 %) and highest for Asia (94.9 %). Commission errors for forest are highest in Africa (24.6 %) and lowest in Asia (12.5 %) and Oceania (12.6 %). Omission errors range between 2.6 % in Russian Federation and 25 % in Oceania.
Table 3Overall accuracy and commission and omission errors for the forest class of the GFC2020 map at continental level. CI – confidence interval.
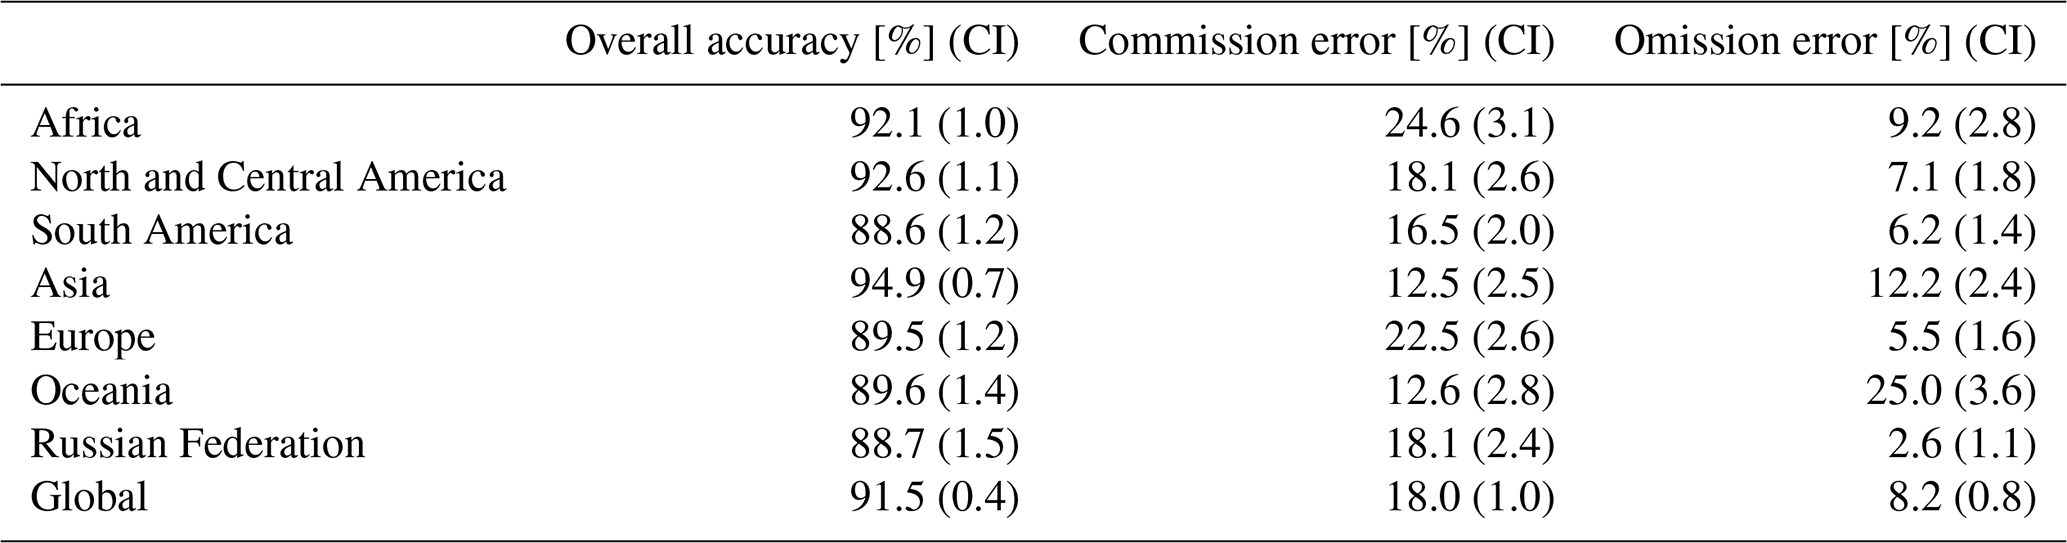
Table A3 presents the overall accuracy and commission and omission error of GFC2020 for each ecological zone.
In the tropical and subtropical zones, lower accuracies are found in ecological zones with open and dry forests, often characterised by low tree height woody vegetation. The tropical moist forest ecological zone, where agricultural tree plantations are frequent, shows lower accuracies and higher errors than the tropical rain forest ecological zone characterised by dense, high forest cover. The temperate ecological zones show accuracies above 90 %, higher than in the boreal belt.
3.2.2 Assessment of forest and land use types
This assessment focuses on the labels assigned at the level of the SSU (second-level assessment in Table A2) to each sample unit. Figure 6A illustrates the number of correctly and incorrectly classified sample units in GFC2020 for each land use type; however, it does not present probabilistic estimates of accuracy or area for these categories. Shares of correctly classified sample units in GFC2020 are highest for land uses “no trees no shrubs” (98 %) and “trees in urban areas” (95 %), both being land uses where physical and spectral characteristics are very distinct from forest. Highest confusions with forest are shown for “trees inside forest” (43 %) and “other wooded land” (28 %). The confusion regarding other wooded land stems from uncertainties in the interpretation by experts and the potential inaccuracies in the mapping algorithm in deciding whether the physical criteria for forest classification are satisfied.
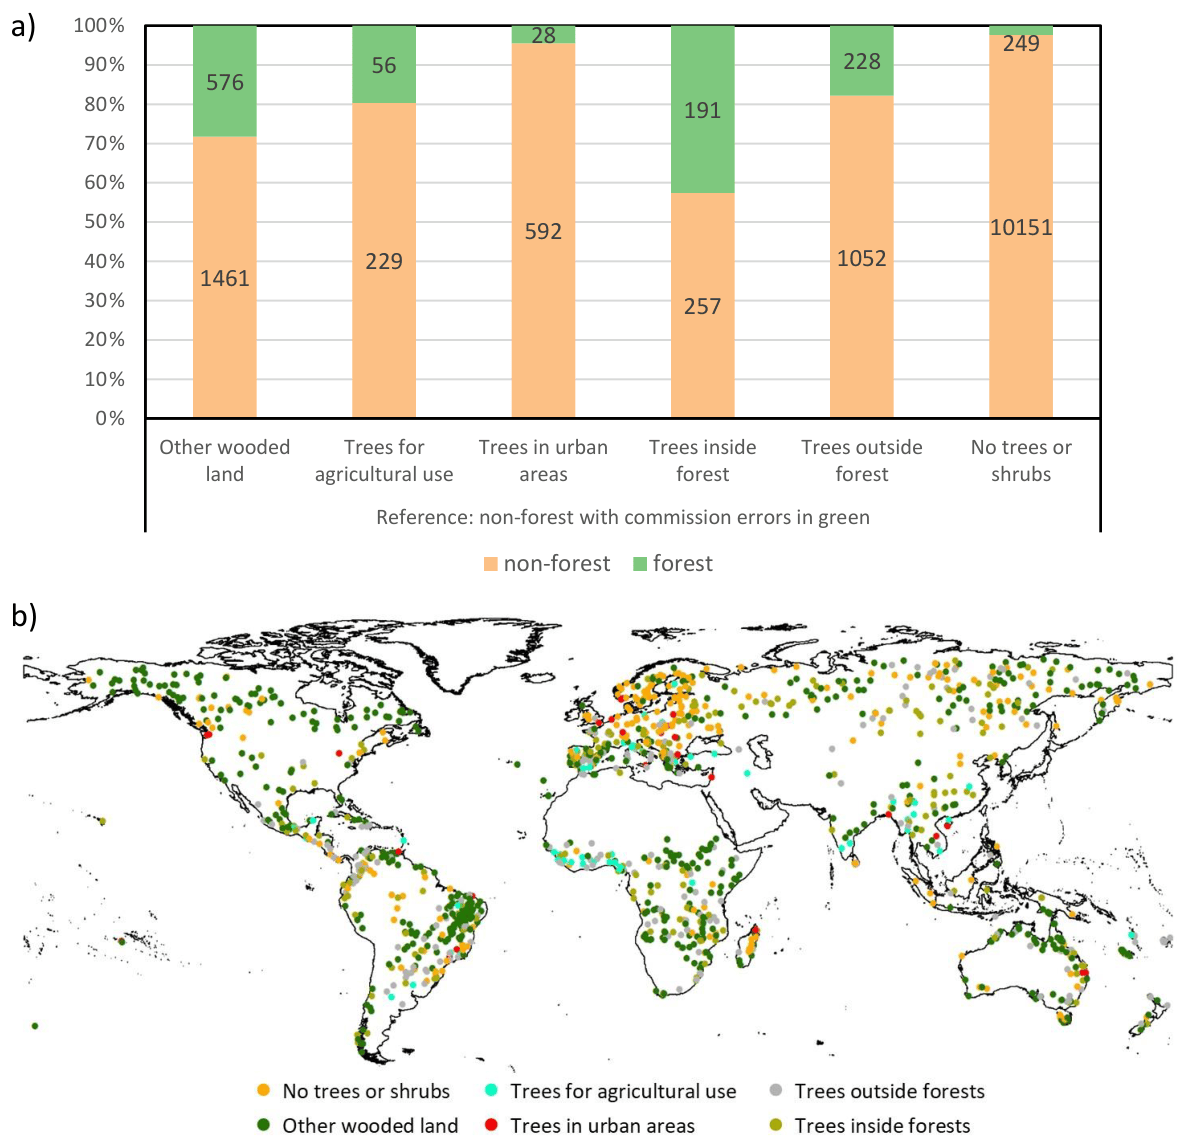
Figure 6Number of correctly and incorrectly classified sample units in GFC2020 for each land use type (expressed in % of each land use type) (A). Sample unit location for land use type incorrectly classified in GFC2020 (B).
Geographically, confusions between forest and non-forest categorized as “other wooded land” cluster in the Brazilian Cerrado and Caatinga biomes (Fig. 6B), due to a high uncertainty about the tree height criterion. Other areas with major confusion are regions with dry open forests, mainly in Africa, and the transition from boreal to tundra landscapes in Canada and Russian Federation. Confusions for trees inside forest could be mainly related to geometric uncertainties between GFC2020 forest mapping and the sample unit location and mapping of forest edges in GFC2020, as in many cases the sample unit was located in a sufficiently large area (>0.5 ha) of non-forest, but close to or surrounded by forest land use. Geographically, this issue concentrates in regions with complex forest edges such as in Central and Southern Europe, Eastern Asia and Eastern Australia.
Approximately 20 % and 18 % of the sample units “Trees for agricultural use” and “Trees outside forest” were mapped as forest in GFC2020. Given the thematic ambiguity in both, mapping in GFC2020 and interpretation for the reference set, this result is satisfactory. Western Africa, especially Cameroon shows a clustering of misclassification for “Trees for agricultural use”. Colombia, Eastern and Southern Brazil, outer-tropical regions in Africa, Mediterranean Europe and Central Siberia show some clusters of misclassified “Trees outside forest”.
3.3 Forest area estimates and comparison with FAO-FRA
3.3.1 Area estimates at global and continental levels
Table 4 shows global forest areas estimates (confined to land in the FAO GAUL dataset) from (i) the GFC2020 map, (ii) the reference set for validation of GFC2020, (iii) FAO FRA-2025 national reporting for 2020 (FAO, 2025) and (iv) FAO FRA-2020 Remote Sensing Survey for year 2018 (FAO, 2022b). There is a near match between the global forest area estimate from FAO-FRA-2025 national reporting and the reference set. The area estimate from the GFC2020 map is 9.5 % more than national reported data to the FAO-FRA-2025, which corresponds to the previous finding of higher commission errors than omission errors in the map. Area estimates from the FAO-FRA-2020 Remote Sensing survey are moderately smaller than nationally reported figures in the FAO-FRA-2025.
Table 4Global Forest area from (i) GFC2020 map, (ii) the reference set for validation of GFC2020, (iii) FAO FRA-2025 national reporting for 2020 and (iv) FAO FRA-2020 Remote Sensing Survey for year 2018. The forest area for GFC2020 is confined to land in the GAUL dataset. The reference set takes into account the strata by Tsendbazar et al. (2018) and the GAUL outline. CI 95…95 % confidence interval. SU…Sample Unit.
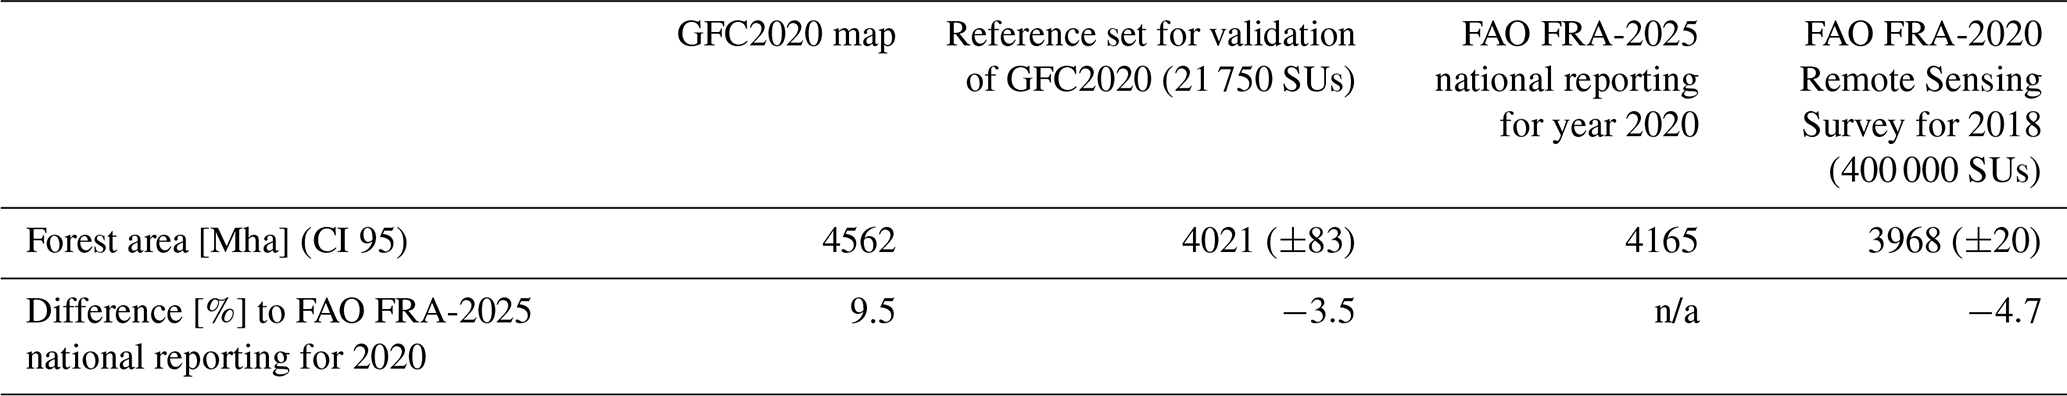
n/a – not applicable.
From the same data sources we estimated forest areas per region (as defined from FAO GAUL dataset). The area estimated from the reference set has a difference of less than 5 % compared to the FAO-FRA 2025 national reporting and is lower than the area obtained from the GFC2020 map, except for Oceania (Fig. 7). The forest area in the GFC2020 map is between 6 % and 14 % higher than the FAO-FRA 2025 national reporting. The forest area in the GFC2020 is between 15 % to 25 % higher than in the reference set, except in Oceania, where it is 17 % lower and in Asia where it is only 1 % higher. The findings per continent correspond to the pattern of higher commission than omission errors, except for Asia (equal shares) and Oceania (higher omission). In Africa, the higher forest area estimates in GFC2020 may be partly explained by underreporting in the FAO-FRA data, as noted by Bastin et al. (2017). Area estimates from the FAO-FRA-2020 Remote Sensing survey generally align well with FAO-FRA 2025 national reporting and the reference set, except for Oceania.
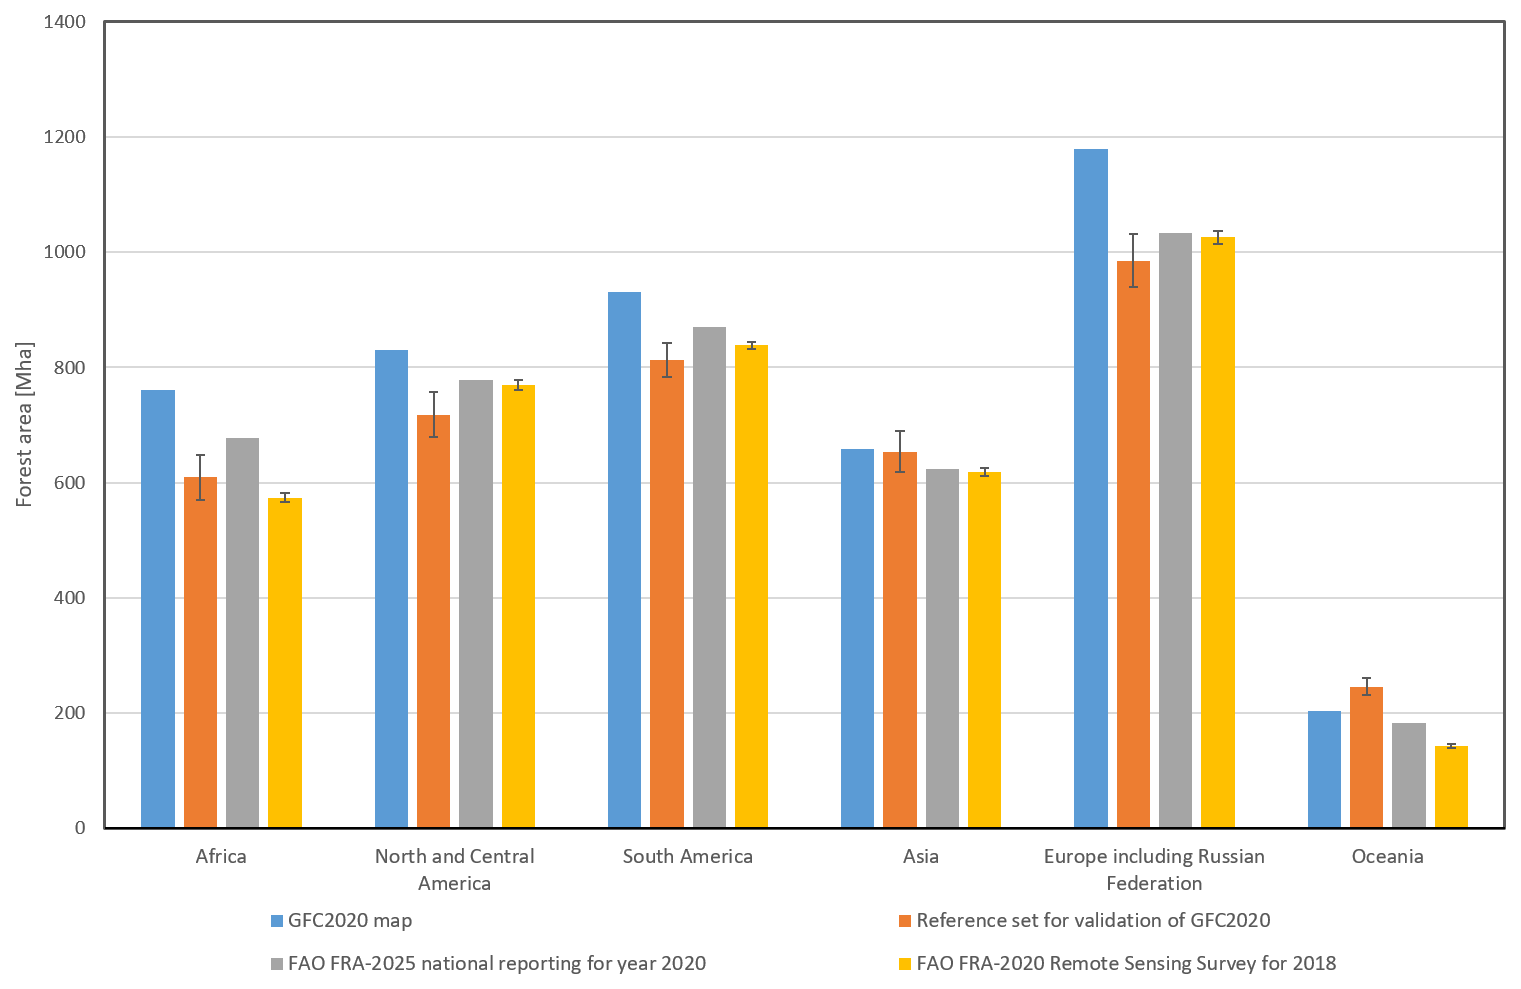
Figure 7Forest areas in Mha for each continent from the GFC2020 map, the reference set for validation of GFC2020, FAO-FRA-2025 national reporting for year 2020, and FAO-FRA-2020 Remote Sensing Survey for year 2018. The error bars for the reference data indicate the 95 % confidence interval.
Additional information on comparisons between GFC2020 and regional or national land cover products across Europe, Côte d'Ivoire, Brazil, and North America, which show spatial agreement in forest cover ranging from 66 % to 87 %, is provided in Bourgoin et al. (2025).
3.3.2 Country level estimates
Figure 8 presents a global comparison of the proportion of forest area by country, with FAO–FRA-2025 national reporting for 2020 on the x-axis and the GFC2020 map within FAO-GAUL country boundaries on the y-axis. The proportions are derived using each dataset's reported forest area and the corresponding FAO-STAT land area. We show a strong overall agreement between the two datasets (R-Squared ≈ 0.85, Mean Absolute Difference = 8.5 %, and Mean Relative Difference = 0.2 %). Several countries show close alignment, including Zambia, Guyana, China, France, Malaysia, Australia, United States of America or Gabon, where forest area proportions are nearly identical. GFC2020 tends to underestimate forest cover in countries such as Tanzania, Lao PDR, Senegal, and Botswana, potentially due to unaccounted secondary forests or sparse tree cover not captured by remote sensing. In contrast, slight overestimations are observed in Indonesia, Brazil, New Zealand, Canada, and Kenya, possibly reflecting the inclusion of trees under agricultural use or confusions with grassland or other wooded land. Strong overestimation is observed in countries with high share of open forests like South Sudan or Central African Republic. This might also be the case in Ivory Coast and Cameroon where the national definition of forest reflected in FAO-FRA national reporting is based on tree cover density of minimum 30 %.
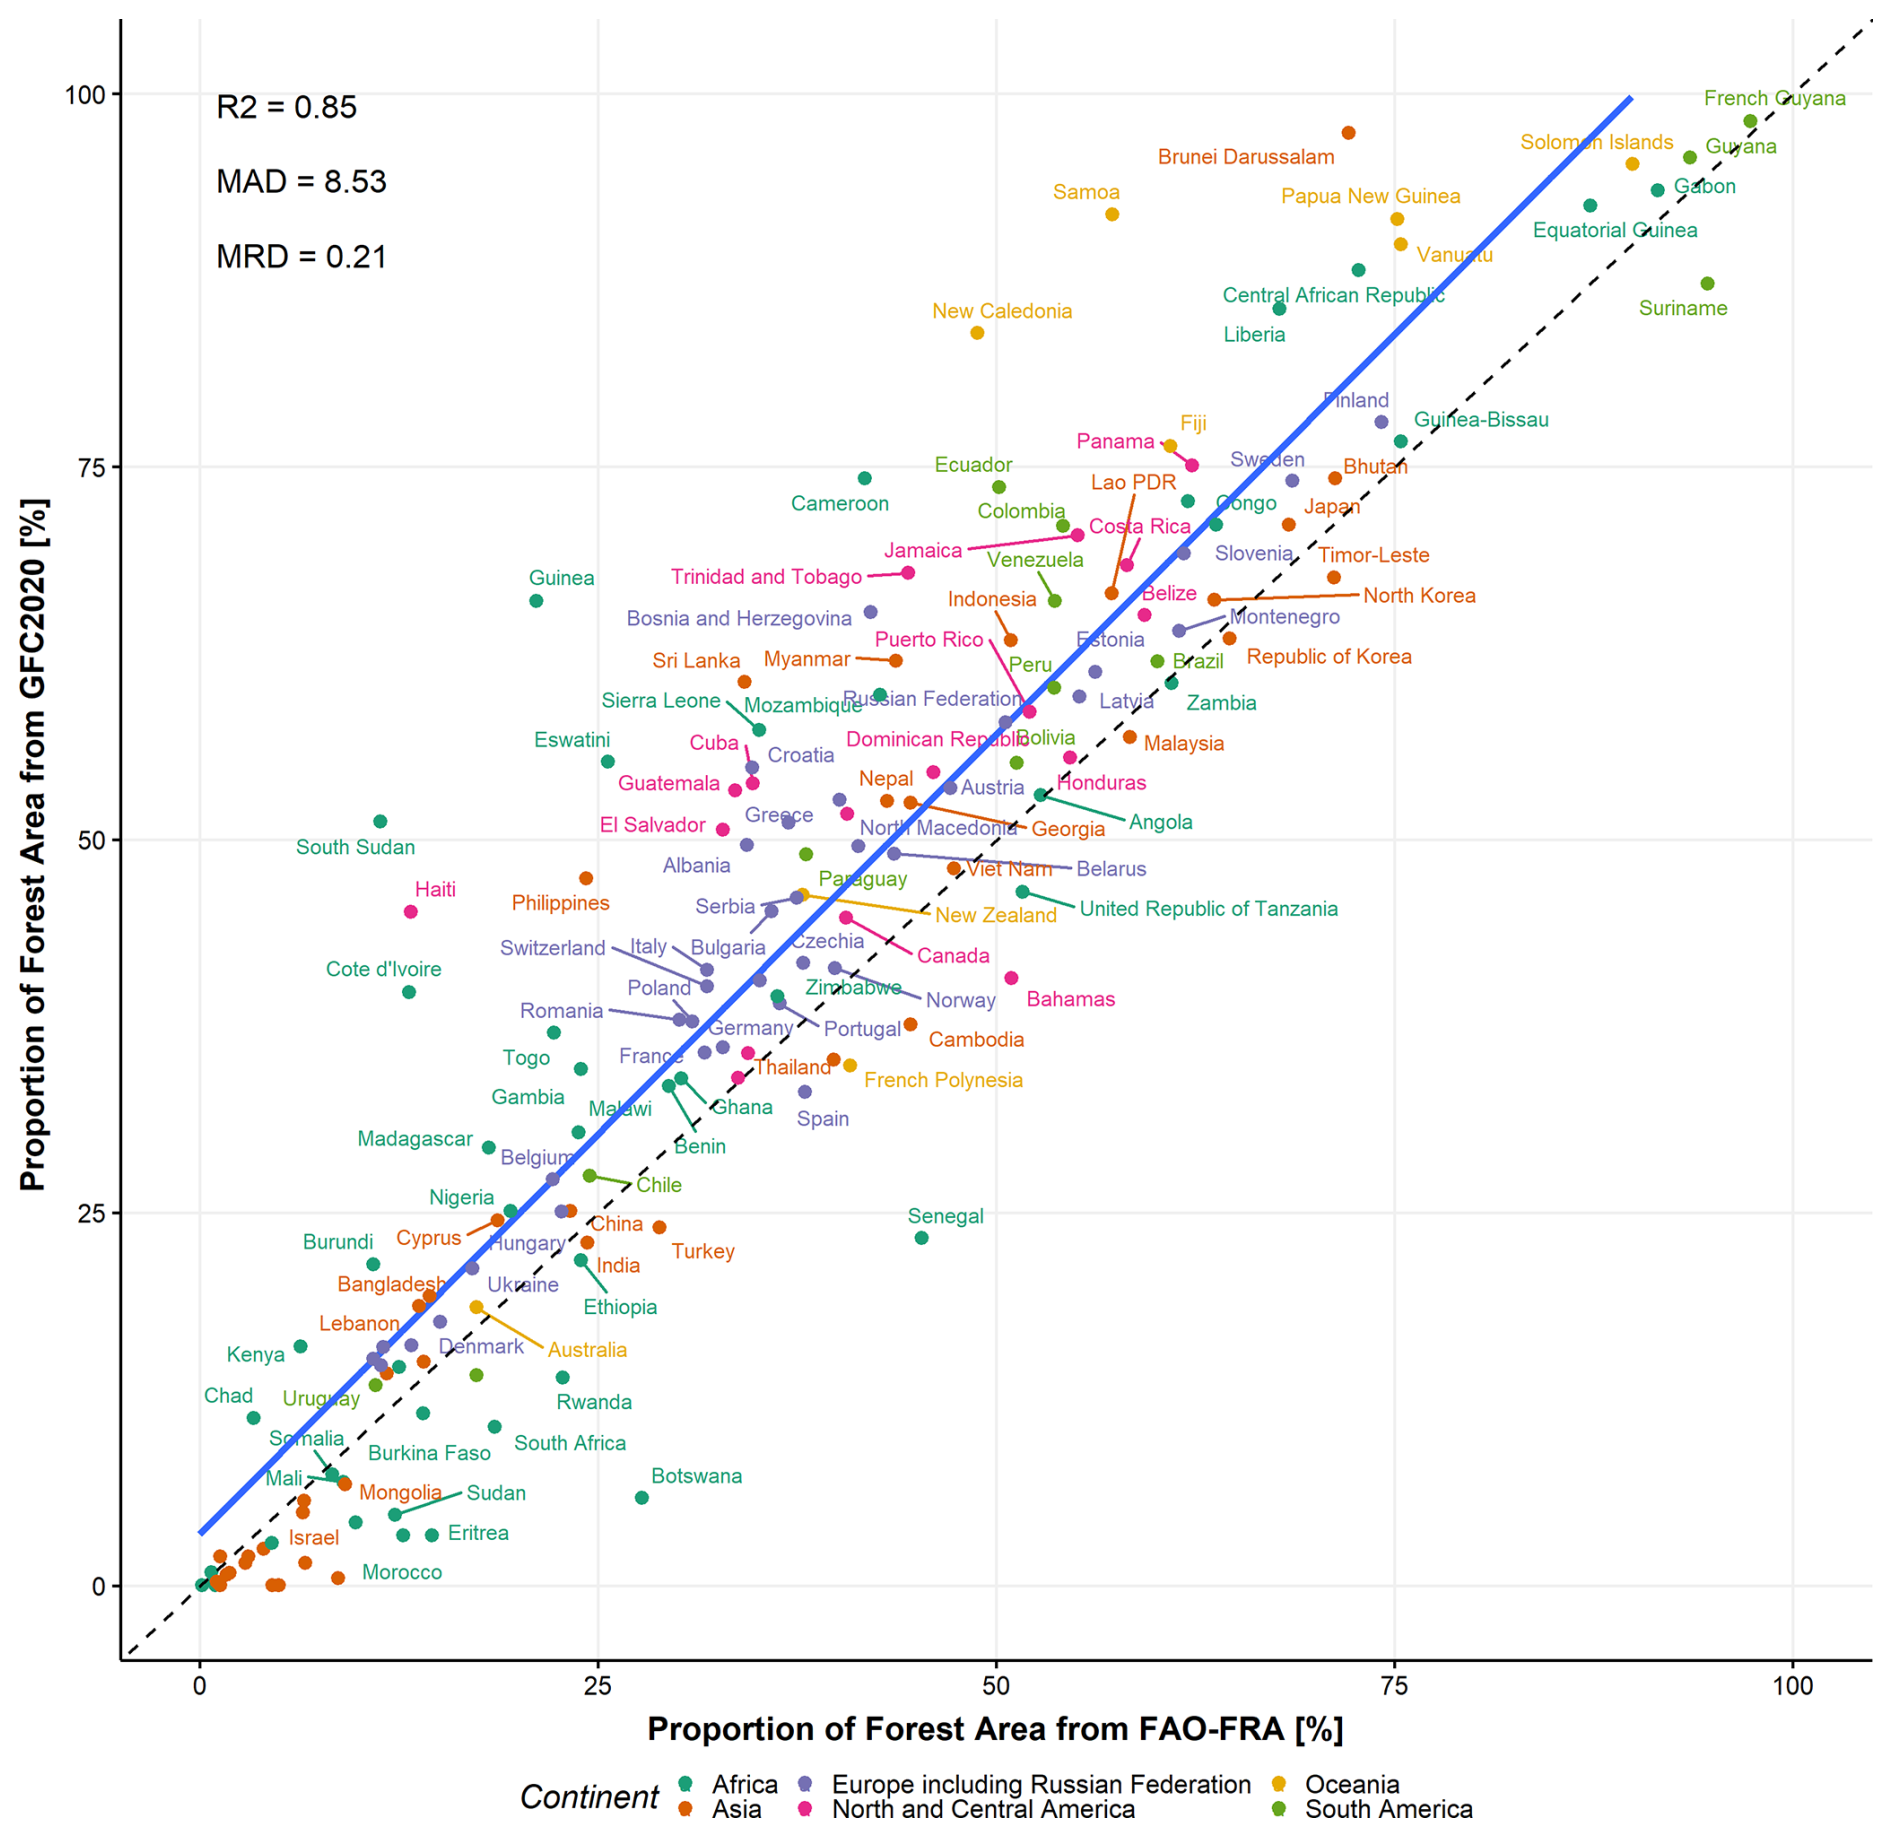
Figure 8Country-level comparison of proportion of forest area between FAO-FRA-2025 national reporting for 2020 and the GFC2020 map. Figures A2 and A3 show this comparison for each continent, including both country-level forest area and forest proportion. R2, MAD and MRD metrics refer to the R-squared, Mean Absolute Difference (in %) and Mean Relative Difference (in %) respectively. Dashed line represents the 1 : 1 line and the blue solid line indicates the linear regression. Only countries with a minimum of 100 000 ha of forest according to FAO-FRA and a minimum of 1000 ha of forest according to GFC2020 are displayed.
4.1 Beyond Tree Cover: Progress and Persistent Challenges in Mapping Forest
4.1.1 Contribution of Global Spatial Datasets to GFC2020
The GFC2020 workflow employs 35 input datasets, where each dataset plays a distinct role. Information from input layers can sometimes overlap due to similarity in topic (e.g. historical deforestation versus crop presence) and use of common sources of Earth Observation data. Figure 9 illustrates the absolute and relative contributions of each input dataset at every step of the methodology, as outlined in Fig. 1. The relative contribution quantifies each dataset's inclusion (step 1) or exclusion (step 2) area based on its position in the processing chain. In contrast, the absolute contribution quantifies the impact of each dataset – considered independently and irrespective of processing order – on either the maximum potential extent of forest cover or the total area of tree cover excluded from GFC2020.
Figure 9Sankey diagram, following the processing flowchart of Fig. 1, quantifying the relative contribution of input datasets to the construction of the maximum potential forest extent and to the exclusion of areas that do not meet the forest definition (expressed in Mha and represented by the thickness of each flow). Inclusions and exclusions depend on the sequential order in which datasets are applied in the processing chain, shown from top to bottom in the diagram. Percentages indicate the absolute contribution of each dataset for inclusion or exclusion. Note that Step 3 (post-processing) is not represented in this diagram and not all flows are shown to simplify the visualization of the diagram. Full dataset names and abbreviations are provided in Table A1.
ESA WorldCover 2020 initially provides the majority of tree cover to Step 1 (4282.46 Mha). The subsequent inclusion of ESA WorldCover 2021, WRI Tropical Tree Cover, UMD GLC, and Global Mangrove Watch expands this extent to 5088.18 Mha. This expansion highlights, for instance, WRI Tropical Tree Cover's unique ability to capture trees that other global products miss. Individually, ESA WorldCover 2021 contributes with the largest proportion (86.7 %) to Step 1. WRI SDPT for Planted Trees and UMD Tree Cover 2010 contribute primarily to the 32.31 Mha extent of potential unstocked forest. Within Step 1's maximum potential extent of forest cover, WRI SDPT Planted Trees alone constitutes 4.9 %.
A total of 577.97 Mha of tree cover are classified as non-forest in Step 2 of GFC2020, driven by the exclusion masks of canopy heights (83 Mha), deforestation (173.6 Mha), cropland (184.23 Mha), agroforestry (2.45 Mha) and other land and urban use (134.69 Mha). Among the datasets used for these exclusion masks, the combination of canopy height products, UMD GFC loss, JRC TMF and UMD Cropland Extension have the highest absolute contribution (more than 13 % of tree cover that are not forest are masked out if used alone) which may partially be explained by their global wall-to-wall coverage. Datasets mapping specific agricultural commodities (e.g. rubber from Wang et al. (2023) or the combination of all palm datasets) or harmonized collection of regional tree crops data (e.g. WRI SDPT) have a low absolute and relative contribution to Step 2 but are nonetheless critical to locally improve the map in areas not captured by global wall-to-wall products.
4.1.2 Challenges and main limitations
Mapping errors in the GFC2020 dataset are attributable to a confluence of complex and interconnected challenges that span input data availability, technological limitations, and the inherent complexities of land cover and land use classification.
The lack of available and consistent global data on agricultural tree plantations complicates the separation between natural forests from tree crops. Although global datasets for oil palm plantations are becoming more prevalent (Descals et al., 2024), data on other significant tree crops such as rubber, coffee, and cocoa remain limited to regional or national scales (Bourgoin et al., 2020; Kalischek et al., 2023; Wang et al., 2023). This is primarily due to technical limitations in remote sensing, such as the difficulty of detecting under-canopy activities, and accurately mapping older or small-scale land uses. For instance, the intricate spatial heterogeneity of cocoa farming landscapes, characterized by dense vegetation, varied land cover, diverse farming practices, and multiple growth stages, often exceeds the capabilities of current mapping techniques (Masolele et al., 2024). Moreover, complex land-use systems, like agroforestry, pose a considerable challenge for accurate mapping. Crops like cocoa and coffee are frequently grown under the shade of a taller tree canopy, creating spectral signatures that can be easily confused with degraded forest when observed using optical satellite imagery (Renier et al., 2023), particularly when the tree cover exceeds 50 % (Escobar-López et al., 2024). While attempts have been made to address this issue by analysing the removal of individual trees over time in conjunction with forest management type data, the global extent of agroforestry systems is still significantly underestimated, highlighting the complexity of distinguishing these integrated land-use practices (Lesiv et al., 2022).
The inclusion of areas under shifting cultivation and consideration for temporarily unutilized agricultural land also contributes to mapping inaccuracies. The forest class in GFC2020 can inadvertently include land undergoing cyclical agricultural use or set-aside agricultural areas with young tree regrowth. In tropical regions, the Joint Research Centre's Tropical Moist Forest maps identify shifting cultivation based on the frequency of temporary tree cover loss and the time of forest regrowth following disturbances (Vancutsem et al., 2021). To mitigate confusion, areas of tropical moist forest regrowth younger than five years were excluded from the GFC2020 forest class. However, a global time threshold for fallow land outside the humid tropics is absent due to a lack of comprehensive global datasets on forest regrowth.
The mapping of temporarily unstocked forests, where tree cover is currently absent but expected to return, presents a challenge. The absence of trees can be due to recent natural disturbances such as fires or storms, diseases, or clear-cut harvesting practices. Distinguishing these areas from permanently non-forested land requires incorporating temporal information and understanding disturbance regimes. GFC2020 integrates various datasets related to planted forests, tree cover in previous years, and forest loss drivers associated with fire and forestry. Future improvements are anticipated with the availability of higher resolution data on forest loss drivers (Sims et al., 2025). However, recent disturbance events (close to 2020), such as those linked to fire or logging, present inherent ambiguity. Satellite imagery alone may not clearly indicate whether the forest will regenerate naturally or by human assistance or if the land will be converted to another use (e.g., agricultural use). Therefore, it is crucial to integrate historical time series on disturbances and drivers not only from before 2020 but also from after 2020 to understand the fate of disturbed forests.
Delineating forest from non-forest using binary classification inherently presents challenges in open woodlands or areas with low tree height, leading inevitably to mapping inaccuracies. Accurately mapping canopy height and tree cover percentage via remote sensing remains complex, particularly near the 5 m threshold where models often underestimate tree height, potentially leading to forest omission if applied directly (Tolan et al., 2024; Moudrý et al., 2024).
Feedback and regional analyses have led to adjustments in the integration of lower tree cover density areas in the tropics in GFC2020, increasing forest area in some dry tropical ecoregions. However, including these lower density areas posed challenges for other aspects of the methodology. For instance, the integration of datasets like Global Pasture Watch (Parente et al., 2024) requires careful consideration, because it classifies some of these areas as semi-natural grasslands. Even though canopy height products offer potential, their current sub-meter accuracy limitations necessitate careful integration with auxiliary datasets to accurately identify low canopy forests in specific regions. Also, this approach only takes into account the state of forest whereas the forest definition includes the prospect that trees may reach the height of 5 m at maturity. The convergence of multiple global canopy height products in low-height areas offers a promising avenue for future improvements.
Finally, urban use presents a unique challenge. GFC2020 integrates a dataset on urbanization degree to better identify urban centres and exclude these trees from the forest classification. Although this update improved accuracy in dense urban areas, it did not fully resolve the issue in dispersed or low-density urban environments due to the coarse resolution of the urbanization data. Enhancing the spatial resolution of urban land use datasets beyond just built-up areas is crucial for further improving the accuracy of forest mapping in complex urban landscapes.
4.2 Future work
4.2.1 Research direction
The rapidly evolving field of remote sensing, particularly its applications in forest land use mapping, offers promising advancements for future GFC2020 versions. This section details specific, non-exhaustive research areas, corresponding to those in Fig. 1, where anticipated product developments are projected to substantially enhance GFC2020's accuracy.
First, the upcoming Copernicus Global Land Cover and Tropical Forest Mapping and Monitoring service (LCFM) could improve global tree cover mapping. Building on the ESA WorldCover product, LCFM will produce a global land cover map at 10 m spatial resolution with a tree cover class and a tree cover density layer for the tropics at the same resolution. In the future, LCFM will generate frequent, sub-annual land surface categorizations for rapid mapping.
Second, canopy height mapping, a key component of forest physical characteristics, is undergoing a revolution in terms of accuracy across multiple forest landscapes and spatial resolution (finer than 1 m) and the availability of input data for calibrating and validating models (Tolan et al., 2024; Dubayah et al., 2020).
Third, we anticipate significant progress in characterizing cropland, pastureland and agroforestry extent through comprehensive, wall-to-wall mapping of agricultural tree plantations and grassland use. This will be driven by initiatives like the Forest Data Partnership (Clinton et al., 2024) to develop state-of-the-art machine learning algorithms or Global Pasture Watch (Parente et al., 2024). These datasets, leveraging big data and multisource remote sensing, will generate global probability maps for key crops such as rubber, coffee, cocoa, and oil palm (Clinton et al., 2024). Complementary to this, the WRI SDPT product will continue to expand its consistent global harmonization of planted trees, including both vector and raster data for agricultural tree plantations and agroforestry systems at national and regional levels (Richter et al., 2024). Currently, the GFC2020 workflow relies on indirect methods such as CROPGRIDS, a coarse-resolution gridded dataset on agricultural tree crop production, to exclude tree crops from forest areas. This mapping approach may be supplemented or replaced if global, wall-to-wall remote sensing approaches for directly mapping tree crops prove more effective. The integration of next-generation commodity layers show promise in mitigating potential overestimation within agricultural tree plantations and cultivated pastures in the GFC2020 product (Fig. 10). However, their effectiveness in reducing commission errors for soybean is more limited, with only a 0.32 % overlap with forest in GFC2020, which is likely due to the spatially accurate exclusion of ground crops from the GFC2020 dataset. For tree crops, the overlap between GFC2020-classified forest and cocoa, oil palm, and rubber plantations is notably high, with 6 %, 7 %, and 31 %, respectively at the 90 % probability threshold. This overlap further increases at the 70 % probability threshold, strongly suggesting a significant potential reduction in commission errors. Furthermore, comparisons with Global Pasture Watch (Parente et al., 2024) reveal substantial potential commission errors in GFC2020 regarding pasturelands, particularly in terms of area (e.g., 48.38 Mha for cultivated pasture and 269.59 Mha for semi-natural pasture). This underscores the inherent challenge of accurately distinguishing between pasturelands and forests, especially in complex mosaic landscapes characterized by open and low-density tree cover, where differentiating forest, pastureland, shrubland, and other wooded land is not trivial (Verhegghen et al., 2022). We acknowledge the potential value of the Global Pasture Watch data and plan to assess it further for possible inclusion in subsequent releases of GFC2020. Finally, the revised 1 km-resolution map of forest drivers (Sims et al., 2025) and the upcoming update of the Forest Management Map provide more thematically detailed and granular information on the main causes of global forest loss and forest practices for 2020, compared to the stratification maps currently used in GFC2020 (Curtis et al., 2018; Lesiv et al., 2022). This is particularly useful for attributing both permanent land-use change (e.g. agroforestry, shifting cultivation, permanent agriculture) and temporary alterations in forest structure (e.g., those following fire, forest management through logging or clear cuts, or natural causes) that do not involve land-use change, to historical time series on forest disturbances (Reiche et al., 2021; Vancutsem et al., 2021; Hansen et al., 2013). We estimate that incorporating historical tree cover loss associated with permanent agriculture, hard commodities, settlements/infrastructure, and shifting cultivation could reduce potential commission errors in GFC2020 by an additional 38.51 Mha. This represents a 7 % increase in the tree-covered area excluded as non-forest compared with the 578 Mha already removed during Step 2 of the workflow (Figs. 9 and 10). Shifting cultivation accounts for the highest percentage of this overlap: 41.63 % of total tree cover loss from small- and medium-scale agriculture is classified as forest in GFC2020.
Figure 10Evaluation of the maximum potential reduction in GFC2020 commission (red bars) and omission (blue bars) errors through the integration of supplementary datasets on commodities and drivers of forest loss. This figure uses independent regional and global datasets not included in its original workflow that could be added in subsequent versions of GFC2020. Potential commission error is shown as: (1) the percentage of commodity areas misclassified as forest in GFC2020 relative to the total area of each commodity (absolute values in Mha are displayed above bars); and (2) the percentage of 2001–2020 tree cover loss from deforestation drivers misclassified as forest in GFC2020 relative to the global area of 2001–2020 tree cover loss for each respective driver. Potential omission error is calculated as the percentage of 2001–2020 tree cover loss from non-deforestation drivers misclassified as non-forest in GFC2020 relative to the global area of 2001–2020 tree cover loss for each respective driver. Data sources of the regional/global datasets: soybean extent in South America for year 2020 (Song et al., 2021), probability estimates (≥70 and ≥90 % threshold) of cocoa (Côte d'Ivoire, Ghana), oil palm (global) and rubber (Thailand, Indonesia, Vietnam, Malaysia, Philippines, Hainan Island, Côte d'Ivoire, Ghana) extents for year 2020 (Clinton et al., 2024). Dominant class maps of grasslands (cultivated and natural/semi-natural) of year 2020 (Parente et al., 2024). Global tree cover loss from 2001–2020 (Hansen et al., 2013) assigned to each driver (Sims et al., 2025).
Conversely, incorporating tree cover loss associated with temporary disturbance drivers; such as forest management, wildfires, and other natural events; could reduce potential omission errors in GFC2020 by an estimated 50.4 Mha. This would represent a more than 200 % increase in the area classified as unstocked forest compared to current GFC2020 estimates. The primary driver of this potential increase is the exclusion of areas affected by natural disturbances (e.g., storms, flooding, landslides, drought, windthrow, and insect outbreaks), of which 33.61 % are currently classified as non-forest in GFC2020. These figures remain hypothetical, because the inclusion of such areas would still need to meet the additional criteria outlined in the EUDR forest definition and by the GFC2020 workflow.
4.2.2 Forest types mapping to address EUDR definition of forest degradation
Forest/non-forest maps can assist in assessing deforestation risks for agricultural commodities under the EUDR but fall short in addressing the EUDR's definition of forest degradation. The EUDR also sets out that wood and derived products need to be harvested from the forest without inducing forest degradation after 31 December 2020. More specifically the EUDR definition of “forest degradation” relates to structural changes in the forest cover, taking the form of the conversion of primary forests or naturally regenerated forests into plantation forest or into other wooded land, or of primary forest into planted forest. Given those conversions, the EUDR requires to distinguish only three main forest types for the initial forest type status in year 2020: primary forests, naturally regenerating forests, and planted forests (which, by definition of the FAO (2018), include plantation forests). However, efforts to map these forest types globally, particularly the characterization of (1) primary forests, (2) naturally regenerating forests, (3) planted forests and plantation forests within the GFC2020 forest extent, are hindered by the limited availability of appropriate global datasets. In particular, mapping primary forests presents a significant challenge due to the lack of consensus on spatial indicators and methodologies. Primary forests are defined as “naturally regenerated forest of native tree species, where there are no clearly visible indications of human activities and the ecological processes are not significantly disturbed”, which encompasses issues of human disturbances and ecological processes.
We are planning to use the GFC2020 extent and to integrate other global datasets including global spatial layers of forest landscape integrity, intactness, protected areas, disturbances, canopy heights, management types, and land use to create a consolidated version of the Global Forest Types (GFT) map. The GFT map will require a multistep approach, similar to that used for GFC2020, including user feedback, incorporation of updated global datasets and a validation approach.
4.3 Mapping forest use for supporting the assessment of deforestation risk under the EUDR
In the context of the EUDR, the GFC2020 map, like any existing global, regional, or national map, is a non-mandatory, non-exclusive, and not legally binding source of information. The colocation of geolocation data (points or polygons) with forest areas identified in GFC2020, or any other map, does not automatically indicate non-compliance with the EUDR (Simonetti et al., 2025). Such plots must undergo further assessment to determine the actual risk of deforestation. In addition to being deforestation-free, commodities and relevant products also need to meet the legal criteria of the EUDR. Similarly, the presence of geolocation data within areas classified as non-forest in GFC2020 or any other map does not guarantee compliance with the EUDR's deforestation-free requirement.
The GFC2020 dataset is intended to support operators and traders as one of several tools for deforestation risk assessment during the due diligence process. Specifically, it can help in the preliminary identification of plots where more detailed or locally relevant data should be gathered for a robust risk evaluation. Given this intended use, the overestimation of forest area in GFC2020 may result in additional assessments by operators. False positives, i.e. areas that are wrongly mapped as forest in GFC2020, will likely be identified as non-forest during subsequent assessments using more detailed or locally relevant data. In contrast, false negatives, i.e. forest areas that are omitted in GFC2020, could be a major concern for operators as deforestation risk areas may be missed. It has to be noted that the overestimation of forest by GFC2020 varies by regions and commodities, in particular with significant overestimation in regions with agroforestry systems like coffee and cocoa. Therefore, we strongly encourage operators to complement GFC2020 with national or regional forest cover datasets that align with the relevant definitions set out in Article 2 of the EUDR, particularly datasets that offer high spatial resolution and known accuracy. Alternatively, ground samples, geotagged photographs or non-spatial data could be used by operators to support or enrich the risk assessment (van Noordwijk et al., 2025). Several studies have demonstrated the value of multi-criteria or “convergence of evidence” approaches in this context (Verhegghen et al., 2024; D'Annunzio et al., 2024). Importantly, no map can ensure 100 % accuracy at the plot level unless it has been specifically developed for small areas under local conditions. The EUDR does not designate or recommend any particular spatial dataset as a reference source. The responsibility lies with operators and traders to select the most appropriate information to support the deforestation risk assessment. There is no obligation to use GFC2020, and it holds no privileged status over other available datasets.
GFC2020 version 2 corresponds to the model version presented in this publication and is available for download as 10 × 10° GeoTIFFs at 0.000083 × 0.000083° resolution at http://data.europa.eu/89h/e554d6fb-6340-45d5-9309-332337e5bc26 (Bourgoin et al., 2024a). The same version of the dataset is also available on Google Earth Engine at https://developers.google.com/earth-engine/datasets/catalog/JRC_GFC2020_V2 (last access: 4 February 2026). The validation dataset is available at http://data.europa.eu/89h/8fbace34-a2fe-47b9-ad82-3e9226b7a9a6 (Colditz et al., 2025a). Note that more recent versions of GFC2020 may be available from https://forobs.jrc.ec.europa.eu/GFC/ (last access: 4 February 2026). The source code of GFC2020 is available at https://doi.org/10.6084/m9.figshare.29315528.v1 (Bourgoin, 2025).
The 2020 Global Forest Cover map (GFC2020) provides a high-resolution (10 m) global view of forest and non-forest areas, aligned with the forest definitions used under the EU Deforestation Regulation (EUDR). Developed using a wide range of global open-access inputs provided by the remote sensing community, the methodology excludes trees in urban and mining areas, wetlands, shifting cultivation zones, and agricultural tree plantations by integrating global datasets on canopy height, cropland extent, and specific commodity crops. The map achieves high overall accuracy (91 %), with commission errors (18 %) exceeding omission errors (8 %). Accuracy varies by region, with dry, open forests and heterogeneous landscapes more prone to misclassification. Common confusions include small forest patches, other wooded land, and shaded tree crop systems.
Table A1Description of the datasets used as input layers in GFC2020 (version 2 – v2), including details of any pre-processing steps applied to certain datasets.
Table A2Response design: Legend for the interpretation of the 10 × 10 m sample units. (A) The first level refers to the binary forest/non-forest classification of the sample unit and the second level to the land use type. (B) The confidence of the interpreter and possible issues encountered.
Table A3Overall accuracy and commission and omission errors for forest in GFC2020 by global ecological zones. All statistics are based on the probability error matrix. Numbers in parenthesis show the 95 % confidence interval. Sample sizes for forest were too small for commission and omission errors in desert and polar biomes, noted in italics and with n/a (not applicable).
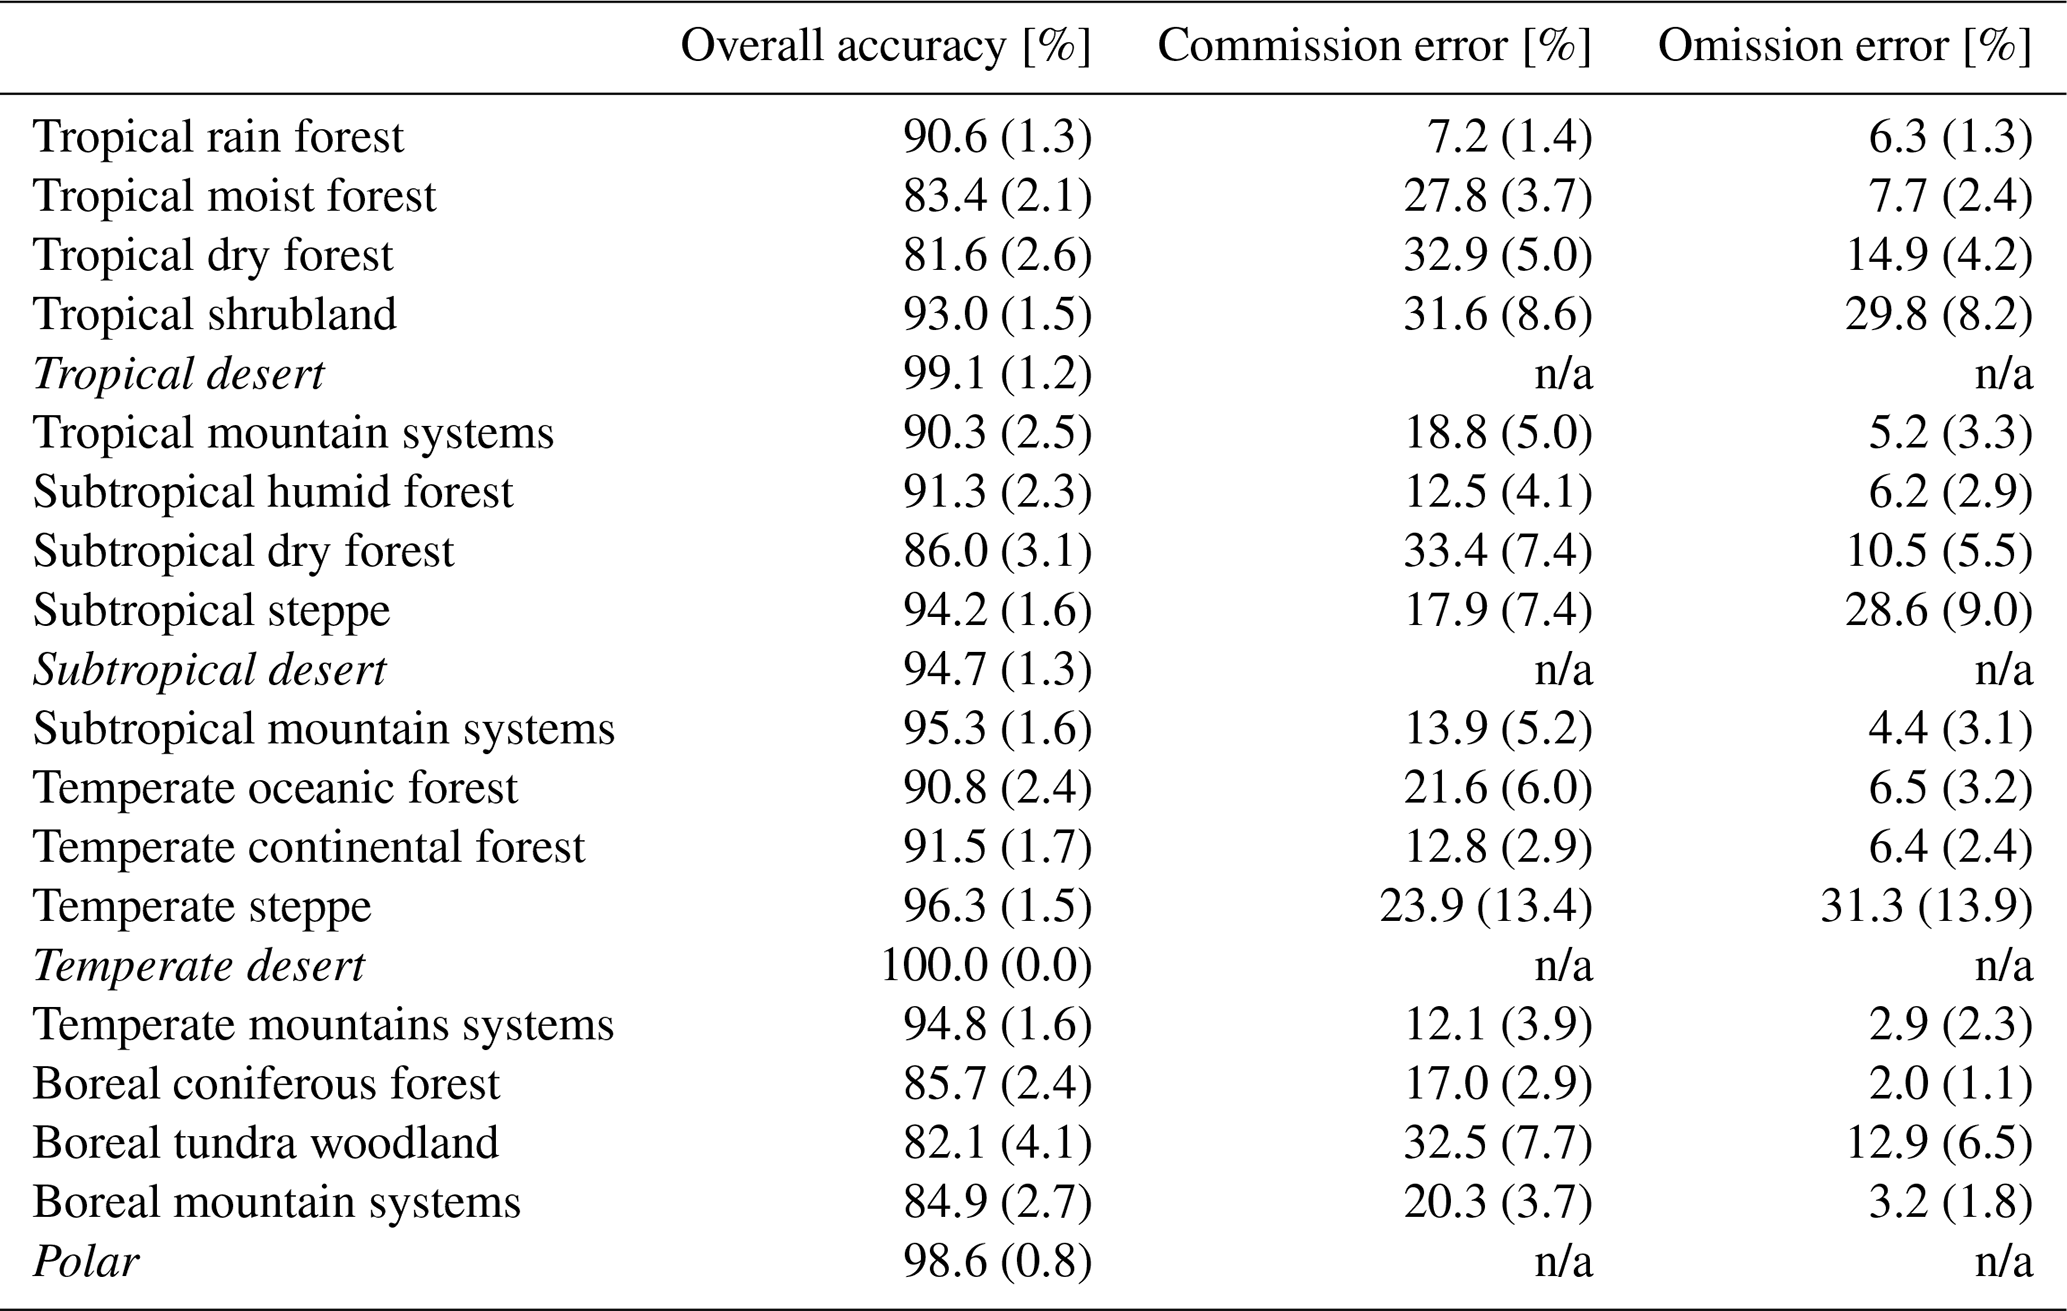
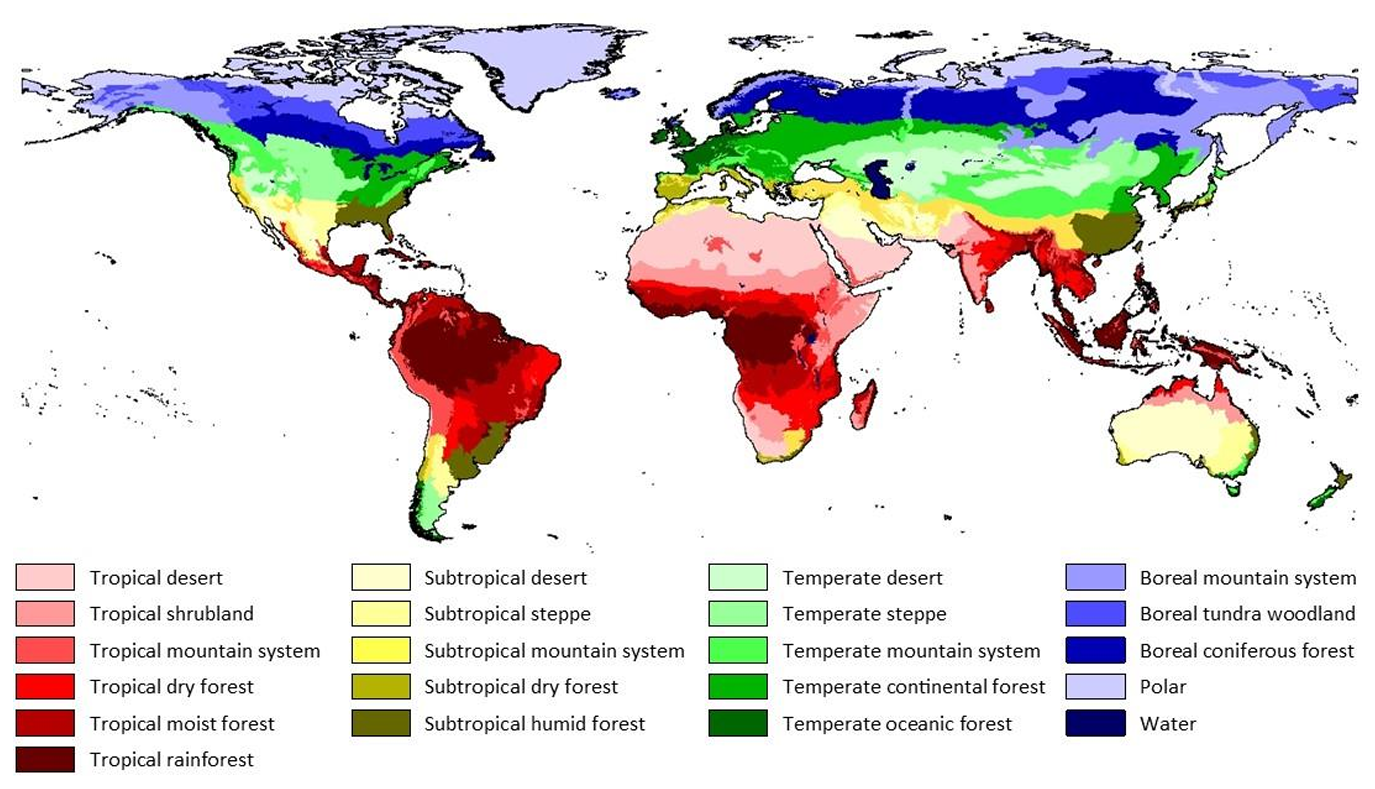
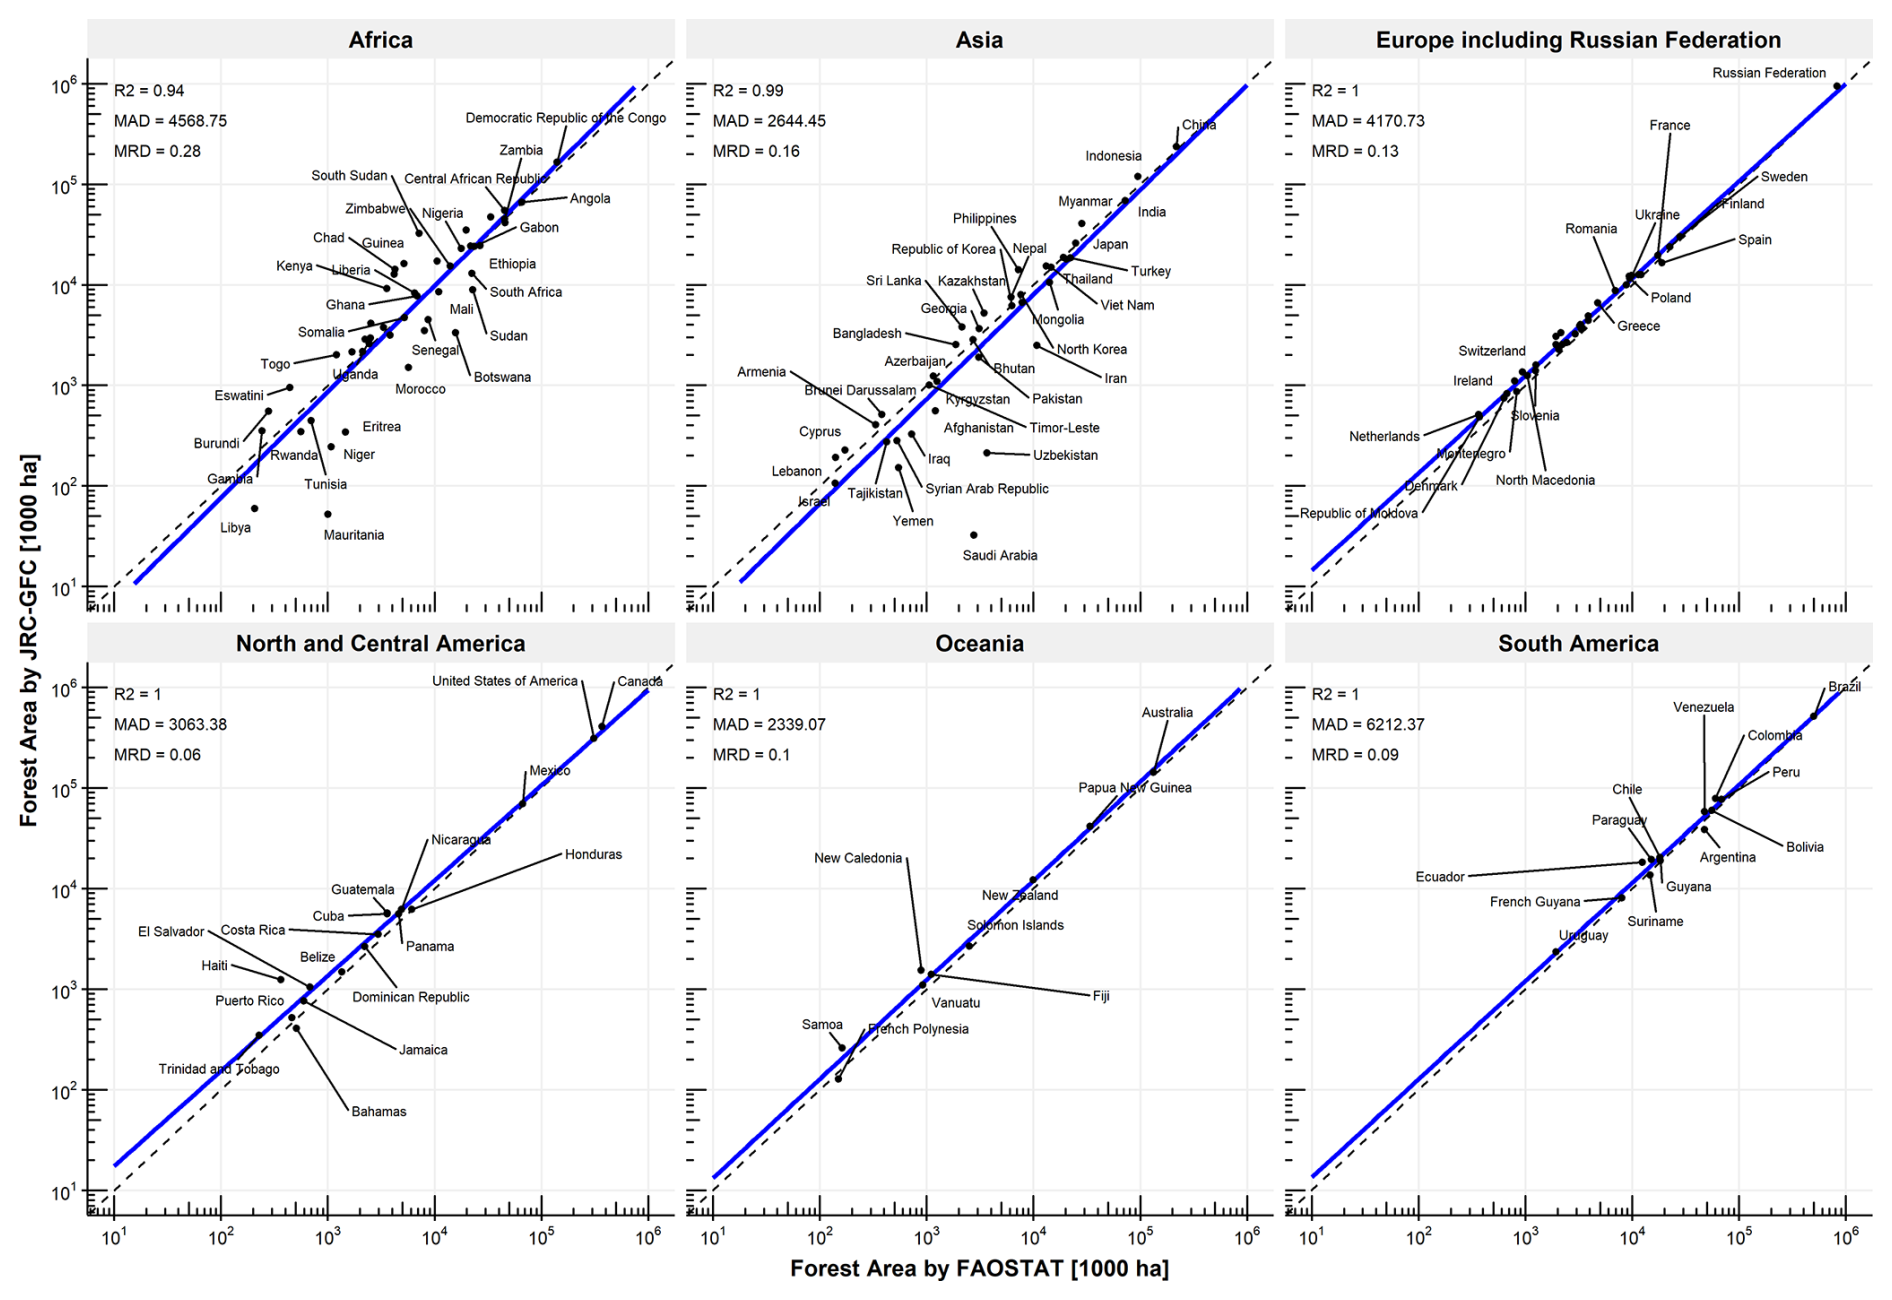
Figure A2Country-level comparison of forest area between the GFC2020 and FAO FRA 2025 database for 2020. R2, MAD and MRD metrics refer to the R-squared, Mean Absolute Difference (in 1000 ha) and Mean Relative Difference (in 1000 ha) respectively. Dashed line represents the 1 : 1 line. The solid blue line represents the fitted linear regression model. Only countries with a minimum of 100 000 ha of forest according to FAO-FRA and a minimum of 1000 ha of forest according to GFC2020 are displayed.
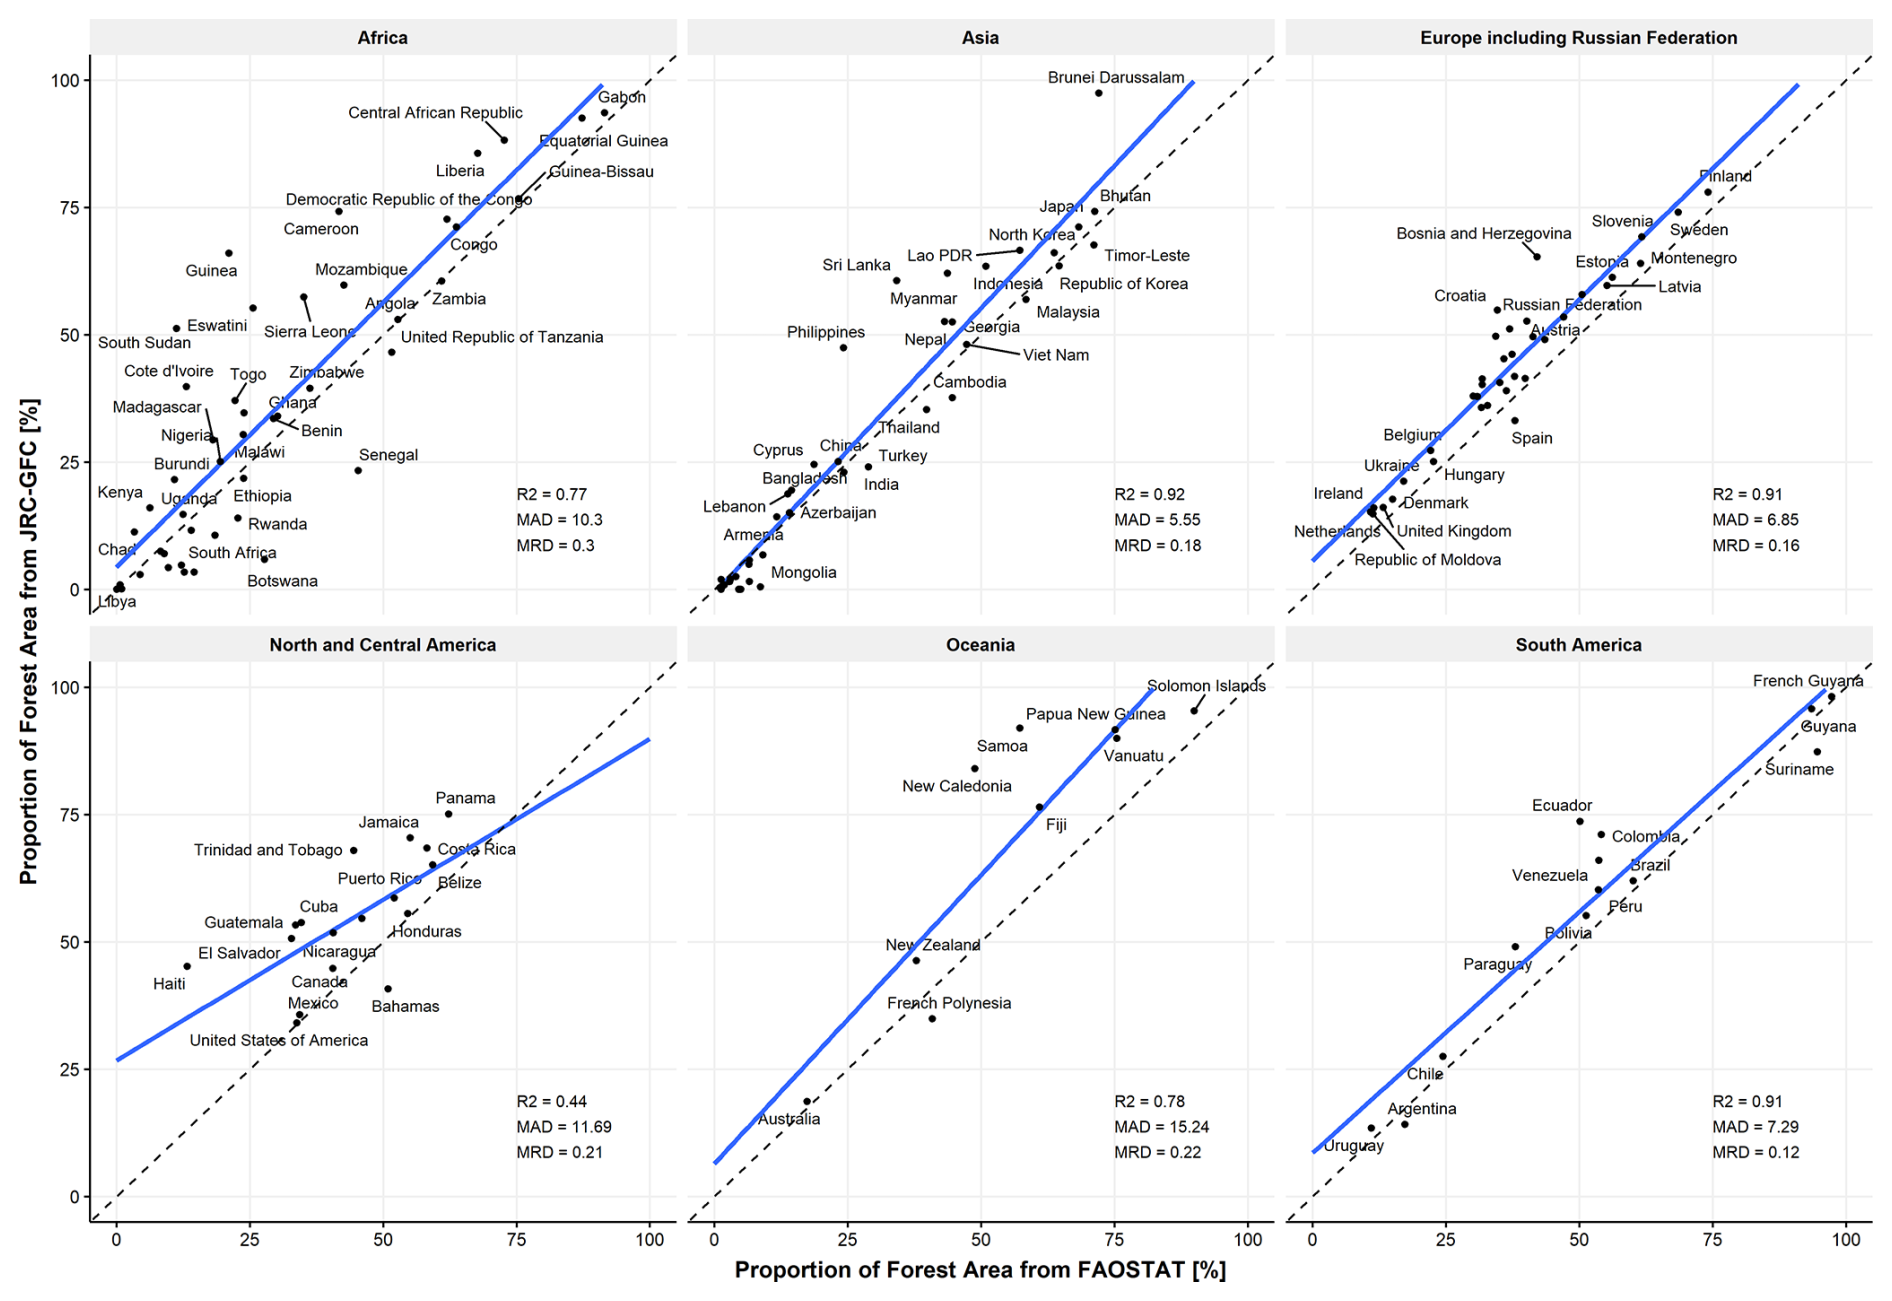
Figure A3Country-level comparison of proportion of forest area between the GFC2020 and FAO FRA 2025 database for 2020. R2, MAD and MRD metrics refer to the R-squared, Mean Absolute Difference (in %) and Mean Relative Difference (in %) respectively. Dashed line represents the 1 : 1 line. The solid blue line represents the fitted linear regression model. Only countries with a minimum of 100 000 ha of forest according to FAO-FRA and a minimum of 1000 ha of forest according to GFC2020 are displayed.
CB, AV, FA and RC conceived the idea and designed the methodology. CB, AV, IA, LD created the GFC2020 dataset. AV, SC, RC, NT, MH and SF designed the validation of GFC2020. AV, SC, RC, ML and FA performed the accuracy assessment. CB and AV led manuscript preparation with contributions from all co-authors. CB and AV contributed equally.
The contact author has declared that none of the authors has any competing interests.
The views expressed are purely those of the writers and may not in any circumstances be regarded as stating an official position of the European Commission.
Publisher's note: Copernicus Publications remains neutral with regard to jurisdictional claims made in the text, published maps, institutional affiliations, or any other geographical representation in this paper. The authors bear the ultimate responsibility for providing appropriate place names. Views expressed in the text are those of the authors and do not necessarily reflect the views of the publisher.
We are grateful for technical support, feedback and comments received during numerous discussions from (in alphabetic order): Jean-François Bastin, René Beuchle, Katja Berger, Audric Bos, Tanya Birch, John Brandt, Teresa Armada Bras, Andreas Brink, Giovanni Caudullo, Guido Ceccherini, João Carreiras, Sarah Carter, Nicholas Clinton, Thibauld Collet, Paula Veronica Figueiredo Vilar Pires Correia, Remi D'Annunzio, Pierre Defourny, Baptiste Delhez, Baudouin Desclée, Gregoire Dubois, Loic Dutrieux, Martina Dürauer, Liz Goldman, Valéry Gond, Thales de Haulleville, Viola Heinrich, Simon Ilyushchenko, Klara Janouskova, Thomas Kemper, Celine Lamarche, Phuong Luong, Andrea Lupi, Nick Mansuy, Andrea Marelli, Teresa De Marzo, Andrea Melchiorre, Flávia De Souza Mendes, Danilo Mollicone, Martin Mutendeudzi, Olga Nepomshina, Duarte Oom, Kasimir Orlowski, Anssi Pekkarinen, Martino Pesaresi, Pierrick Rambaud, Jessica Richter, Jesus San-Miguel Ayanz, Dario Simonetti, Michelle Sims, Timothee Stassin, Stephen Stehman, Fred Stolle, Alicia Sullivan, Christelle Vancutsem, Peter Vogt, Hsiang-En Wei, Michaela Weiss. We recognize using OpenAI's ChatGPT to help reduce the word count.
This work received financial support from the Directorate General for Environment of the European Commission (DG-ENV) through the Dev-ForObs and Dev-ForObs2 project (“EU Observatory on deforestation, forest degradation, changes in the world's forest cover, and associated drivers”).
This paper was edited by Kaiguang Zhao and reviewed by four anonymous referees.
Bastin, J. F., Berrahmouni, N., Grainger, A., Maniatis, D., Mollicone, D., Moore, R., Patriarca, C., Picard, N., Sparrow, B., Abraham, E. M., Aloui, K., Atesoglu, A., Attore, F., Bassüllü, Ç., Bey, A., Garzuglia, M., García-Montero, L. G, Groot, N., Guerin, G., Laestadius, L., Lowe, A. J, Mamane, B., Marchi, G., Patterson, P., Rezende, M., Ricci, S., Salcedo, I., Diaz, A. S. P, Stolle, F., Surappaeva, V., and Castro, R.: The Extent of Forest in Dryland Biomes, Science, 356, 635–638, https://doi.org/10.1126/science.aam6527, 2017.
Bourgoin, C.: Joint Research Centre – Global Forest Cover for year 2020, version 2. Code source, figshare [software], https://doi.org/10.6084/m9.figshare.29315528.v1, 2025.
Bourgoin, C., Oszwald, J., Bourgoin, J., Gond, V., Blanc, L., Dessard, H., Van Phan, T., Sist, P., Läderach, P., and Reymondin L.: Assessing the Ecological Vulnerability of Forest Landscape to Agricultural Frontier Expansion in the Central Highlands of Vietnam, International Journal of Applied Earth Observation and Geoinformation, 84, 101958, https://doi.org/10.1016/j.jag.2019.101958, 2020.
Bourgoin, C., Verhegghen, A., Degreve, L., Ameztoy, I., Carboni, S., Colditz, R., and Achard, F.: Global map of forest cover 2020 – version 2 [deprecated], European Commission, Joint Research Centre (JRC) [data set], http://data.europa.eu/89h/e554d6fb-6340-45d5-9309-332337e5bc26, 2024a.
Bourgoin, C., Ceccherini, G., Girardello, M., Vancutsem, C., Avitabile, V., Beck, P. S. A., Beuchle, R., Blanc, L., Duveiller, G., Migliavacca, M., Vieilledent, G., Cescatti, A., and Achard, F.: Human Degradation of Tropical Moist Forests Is Greater than Previously Estimated, Nature, 631, 570–576, https://doi.org/10.1038/s41586-024-07629-0, 2024b.
Bourgoin, C., Ameztoy, I., Verhegghen, A., Desclée, B., Carboni, S., Bastin, J.-F., Beuchle, R., Brink, A., Defourny, P., Delhez, B., Fritz, S., Gond, V., Herold, M., Lamarche, C., Mansuy, N., Mollicone, D., Oom, D., Peedell, S., San-Michel, J., Colditz, R., and Achard, F.: Mapping Global Forest Cover of the Year 2020 to Support the EU Regulation on Deforestation-Free Supply Chains, Publications Office of the European Union, https://doi.org/10.2760/262532, 2024c.
Bourgoin, C., Verhegghen, A., Carboni, S., Degrève, L., Ameztoy Aramendi, I., Ceccherini, G., Colditz, R., and Achard, F.: Global Forest Maps for the Year 2020 to Support the EU Regulation on Deforestation-Free Supply Chains – Improved Map of Global Forest Cover (GFC2020) and Preliminary Map of Global Forest Types (GFT2020), Publications Office of the European Union, https://doi.org/10.2760/1975879, 2025.
Buchhorn, M., Lesiv, M., Tsendbazar, N.-E., Herold, M., Bertels, L., and Smets, B.: Copernicus global Land Cover layers – collection 2, Remote Sens., 12, 1044, https://doi.org/10.3390/rs12061044, 2020.
Brandt, J., Ertel, J., Spore, J., and Stolle, F.: Wall-to-Wall Mapping of Tree Extent in the Tropics with Sentinel-1 and Sentinel-2, Remote Sensing of Environment, 292, 113574, https://doi.org/10.1016/j.rse.2023.113574, 2023.
Brown, C. F., Brumby, S. P., Guzder-Williams, B., Birch, T., Brooks Hyde, S., Mazzariello, J., Czerwinski, W., Pasquarella, V. J., Haertel, R., Ilyushchenko, S., Schwehr, K., Weisse, M., Stolle, F., Hanson, C., Guinan, O., Moore, R., and Tait, A. M.: Dynamic World, Near Real-Time Global 10 m Land Use Land Cover Mapping, Scientific Data, 9, 251, https://doi.org/10.1038/s41597-022-01307-4, 2022.
Bunting, P., Rosenqvist, A., Hilarides, L., Lucas, R. M., Thomas, N., Tadono, T., Worthington, T. A., Spalding, M., Murray, N. J., and Rebelo, L. M.: Global Mangrove Extent Change 1996–2020: Global Mangrove Watch Version 3.0, Remote Sensing, 14, 3657, https://doi.org/10.3390/rs14153657, 2022.
Clinton, N., Vollrath, A., D'annunzio, R., Liu, D., Glick, H. B., Descals, A., Sullivan, A., Guinan, O., Abramowitz, J., Stolle, F., Goodman, C., Birch, T., Quinn, D., Danylo, O., Lips, T., Coelho, D., Bihari, E., Cronkite-Ratcliff, B., Poortinga, A., Haghighattalab, A., Notman, E., DeWitt, M., Yonas, A., Donchyts, G., Shah, D., Saah, D., Tenneson, K., Hanh Quyen, N., Verma, M., and Wilcox, A.: A Community Palm Model, arXiv [preprint], https://doi.org/10.48550/arXiv.2405.09530, 2024.
Colditz, R. R., Bourgoin, C., Ameztoy, I., Verhegghen, A., Carboni, S., Desclée, B., and Achard, F.: A Global Forest Cover Map for Year 2020: Purpose, Methodology and First Assessment, in: IGARSS 2024 – 2024 IEEE International Geoscience and Remote Sensing Symposium, 4114–4117, https://doi.org/10.1109/IGARSS53475.2024.10641802, 2024.
Colditz, R., Verhegghen, A., Carboni, S., Bourgoin, C., and Achard, F.: Validation dataset for the global map of forest cover 2020 – version 2, European Commission, Joint Research Centre (JRC) [data set], http://data.europa.eu/89h/8fbace34-a2fe-47b9-ad82-3e9226b7a9a6, 2025a.
Colditz, R. R., Verhegghen, A., Carboni, S., Bourgoin, C., Dürauer, M., Mansuy, N., De Marzo, T., Beuchle, R., Janouskova, K., Armada Bras, T., Desclée, B., Orlowski, K., Mutendeudzi, M., Ameztoy Aramendi, I., Fritz, S., Lesiv, M., Oom, D., Carreiras, J., San-Miguel Ayanz, J., Herold, M., Berger, K., Nepomshina, O., Gond, V., Defourny, P., Lamarche, C., Bos, A., Collet, T., Delhez, B., Mollicone, D., Bastin, J.-F., De Haulleville, T., Brink, A., Lupi, A., Tsendbazar, N., Stehman, S., and Achard, F.: Accuracy Assessment of the Global Forest Cover Map for the Year 2020 – Assessment Protocol and Analysis, Publications Office of the European Union, https://doi.org/10.2760/7632707, 2025b.
Curtis, P. G., Slay, C. M., Harris, N. L., Tyukavina, A., and Hansen, M. C.: Classifying Drivers of Global Forest Loss, Science, 361, 1108–1111, https://doi.org/10.1126/science.aau3445, 2018.
D'Annunzio, R., O'Brien, V., Arnell, A., Neeff, T., Fontanarosa, R., Valbuena Perez, P., Shapiro, A.C., Sanchez-Paus Díaz, A., Merle, C., Vega, J., and Fox, J.: Towards a Digital Public Infrastructure for Deforestation-Related Trade Regulations, FAO, https://doi.org/10.4060/cd0957en, 2024.
Descals, A., Wich, S., Meijaard, E., Gaveau, D. L. A., Peedell, S., and Szantoi, Z.: High-resolution global map of smallholder and industrial closed-canopy oil palm plantations, Earth Syst. Sci. Data, 13, 1211–1231, https://doi.org/10.5194/essd-13-1211-2021, 2021.
Descals, A., Wich, S., Szantoi, Z., Struebig, M. J., Dennis, R., Hatton, Z., Ariffin, T., Unus, N., Gaveau, D. L. A., and Meijaard, E.: High-resolution global map of closed-canopy coconut palm, Earth Syst. Sci. Data, 15, 3991–4010, https://doi.org/10.5194/essd-15-3991-2023, 2023.
Descals, A., Gaveau, D. L. A., Wich, S., Szantoi, Z., and Meijaard, E.: Global mapping of oil palm planting year from 1990 to 2021, Earth Syst. Sci. Data, 16, 5111–5129, https://doi.org/10.5194/essd-16-5111-2024, 2024.
Dubayah, R., Blair, J. B., Goetz, S., Fatoyinbo, L., Hansen, M., Healey, S., Hofton, M., Hurtt, G., Kellner, J., Luthcke, S., Armston, J., Tang, H., Duncanson, L., Hancock, S., Jantz, P., Marselis, S., Patterson, P. L., Qi, W., and Silva, C.: The Global Ecosystem Dynamics Investigation: High-Resolution Laser Ranging of the Earth's Forests and Topography, Science of Remote Sensing, 1, 100002, https://doi.org/10.1016/j.srs.2020.100002, 2020.
Escobar-López, A., Castillo-Santiago, M. A., Mas, J. F., Hernández-Stefanoni, J. L., and López-Martínez, J. O.: Identification of Coffee Agroforestry Systems Using Remote Sensing Data: A Review of Methods and Sensor Data, Geocarto International, 39, 2297555, https://doi.org/10.1080/10106049.2023.2297555, 2024.
EU: Regulation (EU) 2023/1115 of the European Parliament and of the Council of 31 May 2023 on the making available on the Union market and the export from the Union of certain commodities and products associated with deforestation and forest degradation and repealing Regulation (EU) No. 995/2010, https://eur-lex.europa.eu/eli/reg/2023/1115/oj/eng (last access: 4 February 2026), 2023.
EU: Regulation (EU) 2024/3234 of the European Parliament and of the Council of 19 December 2024 amending Regulation (EU) 2023/1115 as regards provisions relating to the date of application. https://eur-lex.europa.eu/legal-content/EN/TXT/?uri=celex%3A32024R3234 (last access: 4 February 2026), 2024.
EU: Regulation (EU) 2025/2650 of the European Parliament and of the Council of 19 December 2025 amending Regulation (EU) 2023/1115 as regards certain obligations of operators and traders, https://eur-lex.europa.eu/legal-content/EN/TXT/?uri=OJ:L_202502650 (last access: 4 February 2026), 2025.
FAO: Global ecological zones for FAO forest reporting: 2010 Update, Forest resources Assessment Working Paper 179, Rome, https://openknowledge.fao.org/handle/20.500.14283/ap861e (last access: 4 February 2026), 2012.
FAO: The Global Administrative Unit Layers (GAUL) 2015, https://developers.google.com/earth-engine/datasets/catalog/FAO_GAUL_2015_level0 (last access: 4 February 2026), 2015.
FAO: Global Forest Resources Assessment 2020 – Terms and Definitions. Forest Resources Assessment Working Paper 188, Food and Agriculture Organization of the United Nations, Rome, 2018.
FAO: Greenhouse gas emissions from agrifood systems. Global, regional and country trends, 2000–2020, FAOSTAT Analytical Brief Series No. 50, Rome, FAO, 2022a.
FAO: FRA 2020 Remote Sensing Survey, FAO Forestry Paper No. 186, Rome, https://doi.org/10.4060/cb9970en, 2022b.
FAO: Global Forest Resources Assessment 2025, Rome, https://doi.org/10.4060/cd6709en, 2025.
Gasser, T., Cias, P., and Lewis, S. L.: How the Glasgow Declaration on Forests Can Help Keep Alive the 1.5 °C Target, Proceedings of the National Academy of Sciences, 119, e2200519119, https://doi.org/10.1073/pnas.2200519119, 2022.
Goldman, E. D., Weisse, M., Harris, N., and Schneider, T.: Estimating the Role of Seven Commodities in Agriculture-Linked Deforestation: Oil Palm, Soy, Cattle, Wood Fiber, Cocoa, Coffee, and Rubber, https://www.wri.org/research/estimating-role-seven-commodities-agriculture-linked-deforestation-oil-palm-soy-cattle (last access: 4 February 2026), 2020.
González, N. C. and Kröger, M.: The Potential of Amazon Indigenous Agroforestry Practices and Ontologies for Rethinking Global Forest Governance, Forest Policy and Economics, 118, 102257, https://doi.org/10.1016/j.forpol.2020.102257, 2020.
Gorelick, N., Hancher, M., Dixon, M., Ilyushchenko, S., Thau, D., and Moore, R.: Google Earth Engine: Planetary-Scale Geospatial Analysis for Everyone, Remote Sensing of Environment, 202, 18–27, https://doi.org/10.1016/j.rse.2017.06.031, 2017.
Hansen, M. C., Potapov, P. V., Moore, R., Hancher, M., Turubanova, S. A., Tyukavina, A., Thau, D., Stehman, S. V., Goetz, S. J., Loveland, T. R., Kommareddy, A., Egorov, A., Chini, L., Justice, C. O., and Townshend, J. R. G.: High-Resolution Global Maps of 21st-Century Forest Cover Change, Science, 342, 850–853, https://doi.org/10.1126/science.1244693, 2013.
Hansen, M. C., Potapov, P. V., Pickens, A. H., Tyukavina, A., Hernandez-Serna, A., Zalles, V., Turubanova, S., Kommareddy, I., Stehman, S. V., Song, X.-P., and Kommareddy, A.: Global Land Use Extent and Dispersion within Natural Land Cover Using Landsat Data, Environmental Research Letters, 17, 034050, https://doi.org/10.1088/1748-9326/ac46ec, 2022.
Harris, N., Goldman, E. D., and Gibbes, S.: Spatial Database of Planted Trees (SDPT Version 1.0), November, https://www.wri.org/research/spatial-database-planted-trees-sdpt-version-10 (last access: 4 February 2026), 2019.
Harris, N. L., Gibbs, D. A., Baccini, A., Birdsey, R. A., de Bruin, S., Farina, M., Fatoyinbo, L., Hansen, M. C., Herold, M., Houghton, R. A., Potapov, P. V., Suarez, D. R., Roman-Cuesta, R. M., Saatchi, S. S., Slay, C. M., Turubanova, S. A., and Tyukavina, A.: Global Maps of Twenty-First Century Forest Carbon Fluxes, Nature Climate Change, 11, 234–240, https://doi.org/10.1038/s41558-020-00976-6, 2021.
Hunka, N., Duncanson, L., Armston, J., Dubayah, R., Healey, S. P., Santoro, M., May, P., Araza, A., Bourgoin, C., Montesano, P. M., Neigh, C. S. R., Grantham, H., Potapov, P., Turubanova, S., Tyukavina, A., Richter, J., Harris, N., Urbazaev, M., Pascual, A., Suarez, D. R., Herold, M., Poulter, B., Wilson, S. N., Grassi, G., Federici, S., Sanz, M. J., and Melo, J.: Intergovernmental Panel on Climate Change (IPCC) Tier 1 Forest Biomass Estimates from Earth Observation, Scientific Data, 11, 1127, https://doi.org/10.1038/s41597-024-03930-9, 2024.
Kalischek, N., Lang, N., Renier, C., Daudt, R. C., Addoah, T., Thompson, W., Blaser-Hart, W. J., Garrett, R., Schindler, K., and Wegner, J. D.: Cocoa Plantations Are Associated with Deforestation in Côte d'Ivoire and Ghana, Nature Food, 4, 384–393, https://doi.org/10.1038/s43016-023-00751-8, 2023.
Lang, N., Jetz, W., Schindler, K., and Wegner, J. D.: A High-Resolution Canopy Height Model of the Earth, Nature Ecology & Evolution, https://doi.org/10.1038/s41559-023-02206-6, 2023.
Lesiv, M., Schepaschenko, D., Buchhorn, M., See, L., Dürauer, M., Georgieva, I., Jung, M., Hofhansl, F., Schulze, K., Bilous, A., Blyshchyk, V., Mukhortova, L., Muñoz Brenes, C. L., Krivobokov, L., Ntie, S., Tsogt, K., Pietsch, S. A., Tikhonova, E., Kim, M., Di Fulvio, F., Su, Y.-F., Zadorozhniuk, R., Sirbu, F. S., Panging, K., Bilous, S., Kovalevskii, S. B., Kraxner, F., Rabia, A. H., Vasylyshyn, R., Ahmed, R., Diachuk, P., Kovalevskyi, S. S., Bungnamei, K., Bordoloi, K., Churilov, A., Vasylyshyn, O., Sahariah, D., Tertyshnyi, A. P., Saikia, A., Malek, Ž., Singha, K., Feshchenko, R., Prestele, R., Akhtar, I. U. H., Sharma, K., Domashovets, G., Spawn-Lee, S. A., Blyshchyk, O., Slyva, O., Ilkiv, M., Melnyk, O., Sliusarchuk, V., Karpuk, A., Terentiev, A., Bilous, V., Blyshchyk, K., Bilous, M., Bogovyk, N., Blyshchyk, I., Bartalev, S., Yatskov, M., Smets, B., Visconti, P., Mccallum, I., Obersteiner, M., and Fritz, S.: Global Forest Management Data for 2015 at a 100 m Resolution, Scientific Data, 199, https://doi.org/10.1038/s41597-022-01332-3, 2022.
Masolele, R. N., Marcos, D., De Sy, V., Abu, I. O., Verbesselt, J., Reiche, J., and Herold, M.: Mapping the Diversity of Land Uses Following Deforestation across Africa, Scientific Reports, 14, 1681, https://doi.org/10.1038/s41598-024-52138-9, 2024.
Maus, V., Giljum, S., da Silva, D. M., Gutschlhofer, J., da Rosa, R. P., Luckeneder, S., Gass, S. L. B., Lieber, M., and McCallum, I.: An Update on Global Mining Land Use, Scientific Data, 9, 433, https://doi.org/10.1038/s41597-022-01547-4, 2022.
Mercier, A., Betbeder, J., Rumiano, F., Gond, V., Blanc, L., Bourgoin, C., Cornu, G., Poccard-Chapuis, R., Baudry, J., and Hubert-Moy, L.: Evaluation of Sentinel-1 and 2 Time Series for Land Cover Classification of Forest–Agriculture Mosaics in Temperate and Tropical Landscapes, Remote Sensing, 20, https://doi.org/10.3390/rs11080979, 2019.
Moudrý, V., Gábor, L., Marselis, S., Pracná, P., Barták, V., Prošek, J., Navrátilová, B., Novotný, J., Potůčková, M., Gdulová, K., Crespo-Peremarch, P., Komárek, J., Malavasi, M., Rocchini, D., Ruiz, L. A., Torralba, J., Torresani, M., Cazzolla Gatti, R., and Wild, J.: Comparison of Three Global Canopy Height Maps and Their Applicability to Biodiversity Modeling: Accuracy Issues Revealed, Ecosphere, 15, e70026, https://doi.org/10.1002/ecs2.70026, 2024.
Neumann, M., Raichuk, A., Stanimirova, R., Sims, M., Carter, S., Goldman, E., Rey, M., Jiang, Y., Anderson, K., Poklukar, P., Tarrio, K., Lesiv, M., Fritz, S., Clinton, N., Stanton, C., Morris, D., and Purves, D.: Natural forests of the world – a 2020 baseline for deforestation and degradation monitoring, Sci. Data, 12, 1715, https://doi.org/10.1038/s41597-025-06097-z, 2025.
Pan, Y., Birdsey, R. A., Phillips, O. L., Houghton, R. A., Fang, J., Kauppi, P. E., Keith, H., Kurz, W. A., Ito, A., Lewis, S. L., Nabuurs, G.-J., Shvidenko, A., Hashimoto, S., Lerink, B., Schepaschenko, D., Castanho, A., and Murdiyarso, D.: The Enduring World Forest Carbon Sink, Nature, 631, 563–569, https://doi.org/10.1038/s41586-024-07602-x, 2024.
Parente, L., Sloat, L., Mesquita, V., Consoli, D., Stanimirova, R., Hengl, T., Bonannella, C., Teles, N., Wheeler, I., Hunter, M., Ehrmann, S., Ferreira, L., Mattos, A. P., Oliveira, B., Meyer, C., Şahin, M., Witjes, M., Fritz, S., Malek, Z., and Stolle, F.: Annual 30-m Maps of Global Grassland Class and Extent (2000–2022) Based on Spatiotemporal Machine Learning, Scientific Data, 11, 1303, https://doi.org/10.1038/s41597-024-04139-6, 2024.
Pauls, J., Zimmer, M., Kelly, U. M., Schwartz, M., Saatchi, S., Ciais, P., Pokutta. S., Brandt, M., and Gieseke, F.: Estimating Canopy Height at Scale, arXiv, https://doi.org/10.48550/arxiv.2406.01076, 2024.
Pekel, J. F., Cottam, A., Gorelick, N., and Belward, A. S.: High-Resolution Mapping of Global Surface Water and Its Long-Term Changes, Nature, 540, 418–422, https://doi.org/10.1038/nature20584, 2016.
Pendrill, F., Gardner, T. A., Meyfroidt, P., Persson, U. M., Adams, J., Azevedo, T., Bastos Lima, M. G., Baumann, M., Curtis, P. G., De Sy, V., Garrett, R., Godar, J., Goldman, E. D., Hansen, M. C., Heilmayr, R., Herold, M., Kuemmerle, T., Lathuillière, M. J., Ribeiro, V., Tyukavina, A., Weisse, M. J., and Wes, C.: Disentangling the Numbers behind Agriculture-Driven Tropical Deforestation, Science, 377, eabm9267, https://doi.org/10.1126/science.abm9267, 2022.
Pesaresi, M. and Politis, P.: GHS-BUILT-C R2023A – GHS Settlement Characteristics, Derived from Sentinel2 Composite (2018) and Other GHS R2023A Data, May, https://doi.org/10.2905/3C60DDF6-0586-4190-854B-F6AA0EDC2A30, 2023.
Potapov, P., Li, X., Hernandez-Serna, A., Tyukavina, A., Hansen, M. C., Kommareddy, A., Pickens, A., Turubanova, S., Tang, H., Silva, C. E., Armston, J., Dubayah, R., Blair, J. B., and Hofton, M.: Mapping Global Forest Canopy Height through Integration of GEDI and Landsat Data, Remote Sensing of Environment, 253, 112165, https://doi.org/10.1016/j.rse.2020.112165, 2021.
Potapov, P., Turubanova, S., Hansen, M. C., Tyukavina, A., Zalles, V., Khan, A., Song, X. P., Pickens, A., Shen, Q., and Cortez, J.: Global Maps of Cropland Extent and Change Show Accelerated Cropland Expansion in the Twenty-First Century, Nature Food, 3, 19–28, https://doi.org/10.1038/s43016-021-00429-z, 2022.
Reiche, J., Mullissa, A., Slagter, B., Gou, Y., Tsendbazar, N.-E., Odongo-Braun, C., Vollrath, A., Weisse, M. J., Stolle, F., Pickens, A., Donchyts, G., Clinton, N., Gorelick, N., and Herold, M.: Forest Disturbance Alerts for the Congo Basin Using Sentinel-1, Environmental Research Letters, 16, 024005, https://doi.org/10.1088/1748-9326/abd0a8, 2021.
Renier, C., Vandromme, M., Meyfroidt, P., Ribeiro, V., Kalischek, N., and Ermgassen, E.: Transparency, Traceability and Deforestation in the Ivorian Cocoa Supply Chain, Environmental Research Letters, 18, 024030, https://doi.org/10.1088/1748-9326/acad8e, 2023.
Richter, J., Goldman, E., Harris, N., Gibbs, D., Rose, M., Peyer, S., Richardson, S., and Velappan, H.: Spatial Database of Planted Trees (SDPT Version 2.0), June, https://www.wri.org/research/spatial-database-planted-trees-sdpt-version-2 (last access: 4 February 2026), 2024.
Schepaschenko, D., See, L., Lesiv, M., McCallum, I., Fritz, S., Salk, C., Moltchanova, E., Perger, C., Shchepashchenko, M., Shvidenko, A., Kovalevskyi, S., Gilitukha, D., Albrecht, F., Kraxner, F., Bun, A., Maksyutov, S., Sokolov, A., Dürauer, M., Obersteiner, M., Karminov, V., and Ontikov, P.: Development of a global hybrid forest mask through the synergy of remote sensing, crowdsourcing and FAO statistics, Remote Sensing of Environment, 162, 208–220, https://doi.org/10.1016/j.rse.2015.02.011, 2015.
Schiavina, M., Melchiorri, M., and Pesaresi, M.: GHS-SMOD R2023A – GHS Settlement Layers, Application of the Degree of Urbanisation Methodology (Stage I) to GHS-POP R2023A and GHS-BUILT-S R2023A, Multitemporal (1975–2030), May, https://doi.org/10.2905/A0DF7A6F-49DE-46EA-9BDE-563437A6E2BA, 2023.
Shapiro, A., d'Annunzio, R., Desclée, B., Jungers, Q., Koy Kondjo, H., Mbulito Iyanga, J., Gangyo, F. I., Nana, T., Obame, C. V., Milandou, C., Rambaud, P., Sonwa, D. J., Mertens, B., Tchana, E., Khasa, D., Bourgoin, C., Ouissika, C. B., and Kipute, D. D.: Small Scale Agriculture Continues to Drive Deforestation and Degradation in Fragmented Forests in the Congo Basin (2015–2020), Land Use Policy, 134, 106922, https://doi.org/10.1016/j.landusepol.2023.106922, 2023.
Simonetti, D., Marelli, A., and Eva, H. D.: IMPACT: Portable GIS toolbox image processing and land cover mapping, Luxembourg, Publications Office of the European Union, EUR 27358 EN, ISBN 978-92-79-50115-9, https://publications.jrc.ec.europa.eu/repository/handle/JRC96789 (last access: 4 February 2026), 2015.
Simonetti, D., Degreve, L., Bourgoin, C., Achard, F., and Colditz, R.: Geospatial Analysis Tools supporting the Risk Assessment of the Regulation on deforestation-free supply chains, Publications Office of the European Union, Luxembourg, JRC141229, https://doi.org/10.2760/5075197, 2025.
Sims, M. J., Stanimirova, R., Raichuk, A., Neumann, M., Richter, J., Follett, F., MacCarthy, J., Lister, K., Randle, C., Sloat, L., Esipova, E., Jupiter, J., Stanton, C., Morris, D., Melhart Slay, C., Purves, D., and Harris, N.: Global Drivers of Forest Loss at 1 Km Resolution, Environmental Research Letters, https://doi.org/10.1088/1748-9326/add606, 2025.
Slagter, B., Reiche, J., Marcos, D., Mullissa, A., Lossou, E., Peña-Claros, M., and Herold, M.: Monitoring Direct Drivers of Small-Scale Tropical Forest Disturbance in near Real-Time with Sentinel-1 and -2 Data, Remote Sensing of Environment, 295, 113655, https://doi.org/10.1016/j.rse.2023.113655, 2023.
Song, X.-P., Hansen, M. C., Potapov, P., Adusei, B., Pickering, J., Adami, M., Lima, A., Zalles, V., Stehman, S. V., Di Bella, C. M., Conde, M. C., Copati, E. J., Fernandes, L. B., Hernandez-Serna, A., Jantz, S. M., Pickens, A. H., Turubanova, S., and Tyukavina, A.: Massive Soybean Expansion in South America since 2000 and Implications for Conservation, Nature Sustainability, 4, 784–792, https://doi.org/10.1038/s41893-021-00729-z, 2021.
Stehman, S. V.: Estimating Area from an Accuracy Assessment Error Matrix, Remote Sensing of Environment, 132, 202–211, https://doi.org/10.1016/j.rse.2013.01.016, 2013.
Stehman, S. V.: Estimating Area and Map Accuracy for Stratified Random Sampling When the Strata Are Different from the Map Classes, International Journal of Remote Sensing, 35, 4923–4939, https://doi.org/10.1080/01431161.2014.930207, 2014.
Strahler, A. H., Boschetti, L., Foody, G. M., Friedl, M. A., Hansen, M. C., Herold, M., Mayaux, P., Morisette, J. T., Stehman, S. V., and Woodcock C. E.: Global Land Cover Validation: Recommendations for Evaluation and Accuracy Assessment of Global Land Cover Maps, Report of Institute of Environmental Sustainability, Joint Research Centre, European Commission, Ispra, Italy, https://op.europa.eu/en/publication-detail/-/publication/52730469-6bc9-47a9-b486-5e2662629976 (last access: 4 February 2026), 2006.
Tang, F. H. M., Nguyen, T. H., Conchedda, G., Casse, L., Tubiello, F. N., and Maggi, F.: CROPGRIDS: A Global Geo-Referenced Dataset of 173 Crops, Scientific Data, 11, 413, https://doi.org/10.1038/s41597-024-03247-7, 2024.
Thenkabail, P. S., Teluguntla, P. G., Xiong, J., Oliphant, A., Congalton, R. G., Ozdogan, M., Gumma, M. K., Tilton, J. C., Giri, C., Milesi, C., Phalke, A., Massey, R., Yadav, K., Sankey, T., Zhong, Y., Aneece, I., and Foley, D.: Global Cropland-Extent Product at 30-m Resolution (GCEP30) Derived from Landsat Satellite Time-Series Data for the Year 2015 Using Multiple Machine-Learning Algorithms on Google Earth Engine Cloud, 1868, Professional Paper, U.S. Geological Survey, https://doi.org/10.3133/pp1868, 2021.
Tiemann, A. and Ring, I.: Towards Ecosystem Service Assessment: Developing Biophysical Indicators for Forest Ecosystem Services, Ecological Indicators, 137, 108704, https://doi.org/10.1016/j.ecolind.2022.108704, 2022.
Tolan, J., Yang, H.-I., Nosarzewski, B., Couairon, G., Vo, H. V., Brandt, J., Spore, J., Majumdar, S., Haziza, D., Vamaraju, J., Moutakanni, T., Bojanowski, P., Johns, T., White, B., Tiecke, T., and Couprie, C.: Very High Resolution Canopy Height Maps from RGB Imagery Using Self-Supervised Vision Transformer and Convolutional Decoder Trained on Aerial Lidar, Remote Sensing of Environment, 300, 113888, https://doi.org/10.1016/j.rse.2023.113888, 2024.
Tsendbazar, N., Herold, M., Li, L., Tarko, A., de Bruin, S., Masiliunas, D., Lesiv, M., Fritz, S., Buchhorn, M., Smets, B., Van De Kerchove, R., and Duerauer, M.: Towards Operational Validation of Annual Global Land Cover Maps, Remote Sensing of Environment, 266, 112686, https://doi.org/10.1016/j.rse.2021.112686, 2021.
Tsendbazar, N.-E., Herold, M., de Bruin, S., Lesiv, M., Fritz, S., Van De Kerchove, R., Buchhorn, M., Duerauer, M., Szantoi, Z., and Pekel, J.-F.: Developing and Applying a Multi-Purpose Land Cover Validation Dataset for Africa, Remote Sensing of Environment, 219, 298–309, https://doi.org/10.1016/j.rse.2018.10.025, 2018.
Tsendbazar, N. E., Tarko, A., Linlin, L., Herold, M., Lesiv, M., Fritz, S., and Maus, V.: Copernicus Global Land Service: Land Cover 100m: Version 3 Globe 2015–2019: Validation Report, Zenodo, https://doi.org/10.5281/zenodo.3938974, 2020.
Tyukavina, A., Potapov, P., Hansen, M. C., Pickens, A. H., Stehman, S. V., Turubanova, S., Parker, D., Zalles, V., Lima, A., Kommareddy, I., Song, X.-P., Wang, L., and Harris, N.: Global Trends of Forest Loss Due to Fire From 2001 to 2019, Frontiers in Remote Sensing, https://doi.org/10.3389/frsen.2022.825190, 2022.
Tyukavina, A., Stehman, S. V., Foody, G. M., Bontemps, S., See, L., Olofsson, P., Tsendbazar, N. E., Radoux, J., Komarova, A., Serre, B. M., Song, X. P., d'Andrimont, R., Koren, G., Potapov. P., Bullock, E. L., Campbell, P., de Bruin, S., Defourny, P., Friedl, M. A., Fritz, S., Hansen, M. C., Herold, M., Lamarche, C., Lesiv, M., Mané, L., Meroni, M., Nickeson, J. E., Pelletier, F., Pickens, A., Reiche, J., Schepaschenko, D., Tarrio, K., Verhegghen, A., Woodcock, C., and Xiao, X.: Land Cover and Change Map Accuracy Assessment and Area Estimation Good Practices Protocol. Version 0.1, in: GoodPractices for Satellite Derived Land Product Validation, (p. 187): Land Product Validation Subgroup(WGCV/CEOS), edited by: Tyukavina, A., Stehman, S. V., Foody, G., Bontemps, S., Komarova, A., Tsendbazar, N. E., and Nickeson, J., WGCV/CEOS, https://doi.org/10.5067/doc/ceoswgcv/lpv/lc.001, 2025.
Vancutsem, C., Achard, F., Pekel, J.-F., Vieilledent, G., Carboni, S., Simonetti, D., Gallego, J., Aragão, L. E. O. C., and Nasi, R.: Long-Term (1990–2019) Monitoring of Forest Cover Changes in the Humid Tropics, Science Advances, 7, eabe1603, https://doi.org/10.1126/sciadv.abe1603, 2021.
van Noordwijk, M., Dewi, S., Minang, P. A., Harrison, R. D., Leimona, B., Ekadinata, A., Burgers, P., Slingerland, M., Sassen, M., Watson, C., and Sayer, J.: Beyond imperfect maps: Evidence for EUDR-compliant agroforestry, People and Nature, 7, 1713–1723, https://doi.org/10.1002/pan3.70088, 2025.
Van Tricht, K., Degerickx, J., Gilliams, S., Zanaga, D., Battude, M., Grosu, A., Brombacher, J., Lesiv, M., Bayas, J. C. L., Karanam, S., Fritz, S., Becker-Reshef, I., Franch, B., Mollà-Bononad, B., Boogaard, H., Pratihast, A. K., Koetz, B., and Szantoi, Z.: WorldCereal: a dynamic open-source system for global-scale, seasonal, and reproducible crop and irrigation mapping, Earth Syst. Sci. Data, 15, 5491–5515, https://doi.org/10.5194/essd-15-5491-2023, 2023.
Verhegghen, A., Kuzelova, K., Syrris, V., Eva, H., and Achard, F.: Mapping Canopy Cover in African Dry Forests from the Combined Use of Sentinel-1 and Sentinel-2 Data: Application to Tanzania for the Year 2018, Remote Sensing, 14, 1522, https://doi.org/10.3390/rs14061522, 2022.
Verhegghen, A., Orlowski, K., Dontenville, A., Reboud, V., Riano, C., Njeugeut Mbiafeu, A. C., Kouamé Koffi, G.-B., Tillie, P., Rembold, F., and Achard, F.: Use of National versus Global Land Use Maps to Assess Deforestation Risk in the Context of the EU Regulation on Deforestation-Free Products – Case Study from Côte d'Ivoire, Publications Office of the European Union, https://doi.org/10.2760/7042220, 2024.
Vogt, P., Riitters, K., Barredo, J. I., Costanza, J., Eckhardt, B., and Schleeweis, K.: Improving Forest Connectivity Assessments Using Tree Cover Density Maps, Ecological Indicators, 159, 111695, https://doi.org/10.1016/j.ecolind.2024.111695, 2024.
Wang, Y., Hollingsworth, P. M., Zhai, D., West, C. D., Green, J. M. H., Chen, H., Hurni, K., Su, Y., Warren-Thomas, E., Xu, J., and Ahrends, A.: High-Resolution Maps Show That Rubber Causes Substantial Deforestation, Nature, 623, 340–346, https://doi.org/10.1038/s41586-023-06642-z, 2023.
Watson, J. E. M., Evans, T., Venter, O., Williams, B., Tulloch, A., Stewart, C., Thompson, I., Ray, J. C., Murray, K., Salazar, A., McAlpine, C., Potapov, P., Walston, J., Robinson, J. G., Painter, M., Wilkie, D., Filardi, C., Laurance, W. F., Houghton, R. A., Maxwell, S., Grantham, H., Samper, C., Wang, S., Laestadius, L., Runting, R. K., Silva-Chávez, G. A., Ervin, J., and Lindenmayer, D.: The Exceptional Value of Intact Forest Ecosystems, Nature Ecology & Evolution, 2, 599–610, https://doi.org/10.1038/s41559-018-0490-x, 2018.
West, C., Rabeschini, G., Singh, C., Kastner, T., Lima, M. B., Dermawan, A., Croft, S., and Persson, U. M.: The Global Deforestation Footprint of Agriculture and Forestry, Nature Reviews Earth & Environment, 6, 325–341, https://doi.org/10.1038/s43017-025-00660-3, 2025.
Xu, P., Tsendbazar, N.-E., Herold, M., de Bruin, S., Koopmans, M., Birch, T., Carter, S., Fritz, S., Lesiv, M., Mazur, E., Pickens, A., Potapov, P., Stolle, F., Tyukavina, A., Van De Kerchove, R., and Zanaga, D.: Comparative Validation of Recent 10 M-Resolution Global Land Cover Maps, Remote Sensing of Environment, 311, 114316, https://doi.org/10.1016/j.rse.2024.114316, 2024.
Xu, Y., Ciais, P., Santoro, M., Bourgoin, C., Ritter, F., Pellissier-Tanon, A., Feng, Y., Zhou, C., He, G., Heinrich, V., Besnard, S., Robinson, N., Cook-Patton, S. C., Chave, J., Aragao, L. E. O. C., Ometto, J. P., Bowring, S. P. K., Fayad, I., Zhu, L., Su, Y., Wigneron, J.-P., and Li, W.: Small persistent humid forest clearings drive tropical forest biomass losses, Nature, 649, 375–380, https://doi.org/10.1038/s41586-025-09870-7, 2026.
Zanaga, D., Van De Kerchove, R., De Keersmaecker, W., Souverijns, N., Brockmann, C., Quast, R., Wevers, J., Grosu, A., Paccini, A., Vergnaud, S., Cartus, O., Santoro, M., Fritz, S., Georgieva, I., Lesiv, M., Carter, S., Herold, M., Li, L., Tsendbazar, N.-E., Ramoino, F., and Arino, O.: ESA WorldCover 10 m 2020 V100, Zenodo, https://doi.org/10.5281/zenodo.5571936, 2021.
Zanaga, D., Van De Kerchove, R., Daems, D., De Keersmaecker, W., Brockmann, C., Kirches, G., Wevers, J., Cartus, O., Santoro, M., Fritz, S., Lesiv, M., Herold, M., Tsendbazar, N.-E., Xu, P., Ramoino, F., and Arino, O.: ESA WorldCover 10 m 2021 V200, Zenodo, https://doi.org/10.5281/zenodo.7254221, 2022.