the Creative Commons Attribution 4.0 License.
the Creative Commons Attribution 4.0 License.
 | 10 Feb 2026
Quantifying the spatial-seasonal patterns of land–atmosphere water, heat and CO2 flux exchange over the Tibetan Plateau from an observational perspective
Binbin Wang
Zeyong Hu
Xuan Li
Weiqiang Ma
Xuelong Chen
Cunbo Han
Zhipeng Xie
Yuyang Wang
Maoshan Li
Bin Ma
Xingdong Shi
Zhengling Cai
Land-atmosphere (LA) interactions, through the turbulent exchange of water, heat and CO2 fluxes, strongly influence regional micro-climates, water cycles, energy budgets, and ecosystem dynamics. The Tibetan Plateau (TP), characterized by its vast extent, high elevation, strong solar radiation and extreme weather variability, remains underexplored due to the scarcity of LA observation sites, particularly in its western and northern regions. This study introduces a newly established research and observation platform, comprising 16 planetary boundary layer towers that span diverse landscapes and dynamic meteorological conditions. Across these sites, mean annual air temperature, wind speed, and liquid precipitation range from −3.5 to 18.5 °C, 0.6 to 5.6 m s−1, and 43 to 2164 mm, respectively. Elevation exhibits significant correlations with all meteorological variables, highlighting the pronounced spatial heterogeneity of land–atmosphere coupling across the region. The turbulent fluxes of water and heat exhibit distinct seasonal patterns, with maximum sensible heat flux (SH) in April–May and latent heat flux (LE) in July–August. Most stations act as carbon sinks, with net ecosystem exchange (NEE; the net CO2 exchange between the ecosystem and the atmosphere, where negative values indicate net ecosystem CO2 uptake) ranging from −3.2 to −174.3 , except the Medog station, which behaves as a carbon source likely linked to vegetation disturbance and human activity. LE is significantly correlated with SH, NEE and ecosystem respiration, revealing a strong coupling among water, heat and carbon fluxes. This high-resolution, quality-controlled dataset provides critical in situ observations for studying water–heat–carbon coupling, validating models and satellite algorithms, and improving understanding of climate-ecosystem interactions over the TP. The whole datasets are freely available at the National Tibetan Plateau Data Center (https://doi.org/10.11888/Atmos.tpdc.302428; Wang and Ma, 2025).
- Article
(4526 KB) - Full-text XML
-
Supplement
(2120 KB) - BibTeX
- EndNote


Land-atmosphere (LA) interactions, which govern the flux exchanges of energy, water, and CO2 between the Earth's surface and the atmosphere, are pivotal in shaping regional water cycles, climate dynamics, and ecosystem changes (Gentine et al., 2019; Ma et al., 2023; Santanello et al., 2018; Seo and Ha, 2022; Zhang et al., 2024). Thermal contrasts between distinct landforms – such as land vs. water, mountain vs. valley, and ocean vs. land – drive regional circulations like lake-land and mountain-valley breezes, as well as large-scale atmospheric motions, including monsoons (Gerken et al., 2014; Wu and Zhang, 1998; Wu et al., 2023). These LA interactions modulate a wide range of processes, including the dispersion of air pollutants, the transport of atmospheric moisture, the redistribution of clouds and precipitation, and the regulation of ecosystem carbon balance (Bei et al., 2018; Friedlingstein et al., 2022; Suni et al., 2015; Zhu et al., 2017). For instance, enhanced coupling between soil moisture and land surface temperature can intensify droughts and heatwaves in northern East Asia (Seo and Ha, 2022), where soil moisture deficits reduce evapotranspiration (ET), amplifying heatwave conditions, particularly in areas with sparse vegetation. Nonlinear feedbacks between ET and cloud formation remain poorly constrained in transitional zones between energy- and water-limited regimes (Zhang et al., 2024). Under global warming, LA interactions governing permafrost thaw, vegetation productivity, and ecosystem respiration play an increasingly important role in determining regional and global carbon budgets, especially over the data scarce regions (Turetsky et al., 2020; Wang et al., 2023b; Wei et al., 2021). Quantifying these coupled fluxes through in situ observations is thus essential for understanding Earth system responses to climate change.
Understanding LA interactions through coordinated, multidisciplinary, and multi-scale observations is crucial for addressing global challenges such as water resource management, land-use planning, climate change, and ecosystem preservation. In this context, key global initiatives – such as the First International Satellite Land Surface Climatology Project Field Experiment (United States) (Sellers et al., 1992), the Hydrologic Atmospheric Pilot Experiment (France, Niger) (André et al., 1986; Goutorbe et al., 1997), the Northern Hemisphere Climate Processes Land Surface Experiment (Sweden) (Halldin et al., 1999), the Boreal Ecosystem–Atmosphere Study (Canada) (Sellers et al., 1995), the Inner Mongolia Semiarid Grassland Soil–Vegetation–Atmosphere Interaction and the Heihe River Basin Field Experiment (China) (Liu et al., 2018; Lü et al., 1997) – have provided foundational insights into LA interactions and have advanced parameterizations for climate models. Tibetan Plateau (TP), one of the world's most climate-sensitive and data-scarce region, plays a particularly critical role in the climate and ecology dynamics. TP exerts remarkable influence on atmospheric processes, generating thermal disturbances that affect circulation patterns, weather, and climate not only in China and East Asia but also globally (Wu and Zhang, 1998; Ye and Wu, 1998). For example, mesoscale system vortices and shear lines created in the TP's atmospheric boundary layer can lead to extreme weather events, such as heavy rain and storms, impacting both the plateau and surrounding regions (Li et al., 2020; Xu and Chen, 2006). Thus, LA coupling and dynamics are important for the formation and development of weather systems. Over the past few decades, large-scale field activities and long-term observational experiments – such as Qinghai-Xizang Plateau Meteorology Experiment (QXPMEX), the Tibetan Plateau Atmospheric Scientific Experiment II and III (TIPEX-II, TIPEX-III), the Sino Japanese inter governmental cooperation project (JICA), the Global Energy and Water Cycle Experiment Asian Monsoon Experiment on the Tibetan Plateau (GAME/Tibet), the Coordinated Enhanced Observing Period (CEOP) Asia-Australia Monsoon Project on the Tibetan Plateau (CAMP/Tibet), etc. – have greatly enhanced our understanding of land surface processes in the TP (Huang et al., 2023; Ma et al., 2023), and these efforts have also helped refine climate model parameterization, improving our ability to predict TP's climatic effects. However, the stations for measuring heat, water and CO2 fluxes are concentrated mostly in the east and still rarely distributed over the vast northern and western regions, hindering our understanding on its spatial distribution and total amounts of heat, water and CO2 flux. Given the growing challenges posed by global climate change, accurately measuring and modeling LA interaction processes is more critical than ever, and such efforts are essential for predicting climate extremes, managing water resources, and supporting sustainable ecology (Suni et al., 2015).
Although several LA interaction studies have analyzed seasonal variations in turbulent fluxes and their controlling factors (Ma et al., 2005, 2018, 2023; Wang and Ma, 2011; Yang et al., 2008), the lack of spatially distributed eddy-covariance (EC) sites has resulted in large uncertainties in flux estimates and interannual variability, especially over underrepresented ecosystem types over the western and northern TP. Previous modeling and remote-sensing efforts have improved regional ET estimates, yet still rely on limited ground validation measurements (Ma and Zhang, 2022; Yuan et al., 2024). For example, the water-carbon coupled biophysical model (Ma and Zhang, 2022) and an improved ET model (Yuan et al., 2021) are validated with EC measurements, both yielding annual ET value of approximately 350 mm yr−1. However, factors influencing the inter-annual variations in ET exhibit large biases and uncertainties, especially for data-scarce western and northern regions. As for carbon function, TP contains extensive permafrost and a variety of landscapes, including alpine meadows, alpine steppes, alpine shrubs, alpine wetlands, forests, and alpine deserts, which have a substantial impact on the carbon sink/source function of the region, and shows important ecological and environmental consequences. Recent studies indicate that most alpine meadows on the TP function as carbon sinks, with values ranging from −430 to −12.5 , and some alpine steppe areas act as weak carbon sources (Wang et al., 2023a; Wei et al., 2021). Specifically, alpine grasslands exhibit a weaker carbon sink function, with values ranging from −206.9 to −17.1 whilst shrub lands show even lower carbon sink values, ranging from −89.5 to −40.7 (Wei et al., 2021). Marshes display considerable variability in carbon fluxes, with values ranging from −187 ± 29 in Shenzha to −478 in Haibei (Qi et al., 2021; Zhao et al., 2005). Therefore, by synthesizing EC and climate data from multiple sites across the TP, we can clearly understand the spatial and temporal variations of water, heat, CO2 fluxes and identify the mechanisms that control them.
To address these knowledge gaps, this study introduces a comprehensive multi-site observation network for monitoring LA exchanges of water, heat, and CO2 fluxes across the TP (Fig. 1 and Table 1). The dataset encompasses 16 stations strategically distributed along major hydrothermal and ecological gradients, including alpine meadow, steppe, shrubland, and forest ecosystems. These standardized, long-term EC observations provide unprecedented spatial coverage, particularly over the data-scarce western and northern TP. The network offers a unique opportunity to investigate (1) What are the characteristics of land–atmosphere water, heat, and CO2 fluxes across different landscapes of the TP? (2) What are the spatial and temporal distributions of water, heat, and CO2 fluxes, and what factors influence these variations? This paper introduces the design and implementation of the observation platform, instrument configuration, and standardized data processing methods, followed by an analysis of the spatial–temporal variations of meteorological conditions, energy components, and CO2 fluxes. Speficically, Sect. 3.1 describes the spatial–temporal patterns of atmospheric meteorological variables such as air temperature, humidity and wind speed. Section 3.2 focuses on liquid precipitation and soil water content, which jointly reflect regional water availability. Section 3.3 examines the energy flux components (sensible and latent heat fluxes, etc.), highlighting differences between wet and dry conditions and Sect. 3.4 analyzes the seasonal variations of carbon fluxes (net ecosystem exchange (NEE), gross primary productivity (GPP) and ecosystem respiration (Re)). By making this dataset publicly available, we aim to fill a critical gap in global flux observations and provide a foundation for advancing land–atmosphere interaction research, model evaluation, and climate prediction over high-elevation ecosystems of the TP.

Figure 1The locations and photos of 16 LA interaction stations composing the comprehensive observation and research platform over the TP. (All the photos have been taken by the authors.)
Table 1Overview of instruments configuration and settings at 16 stations, including observation variables, instrument sensors, observational heights, latitude (lat), longitude (lon), altitude (alt) and landscape at each station.
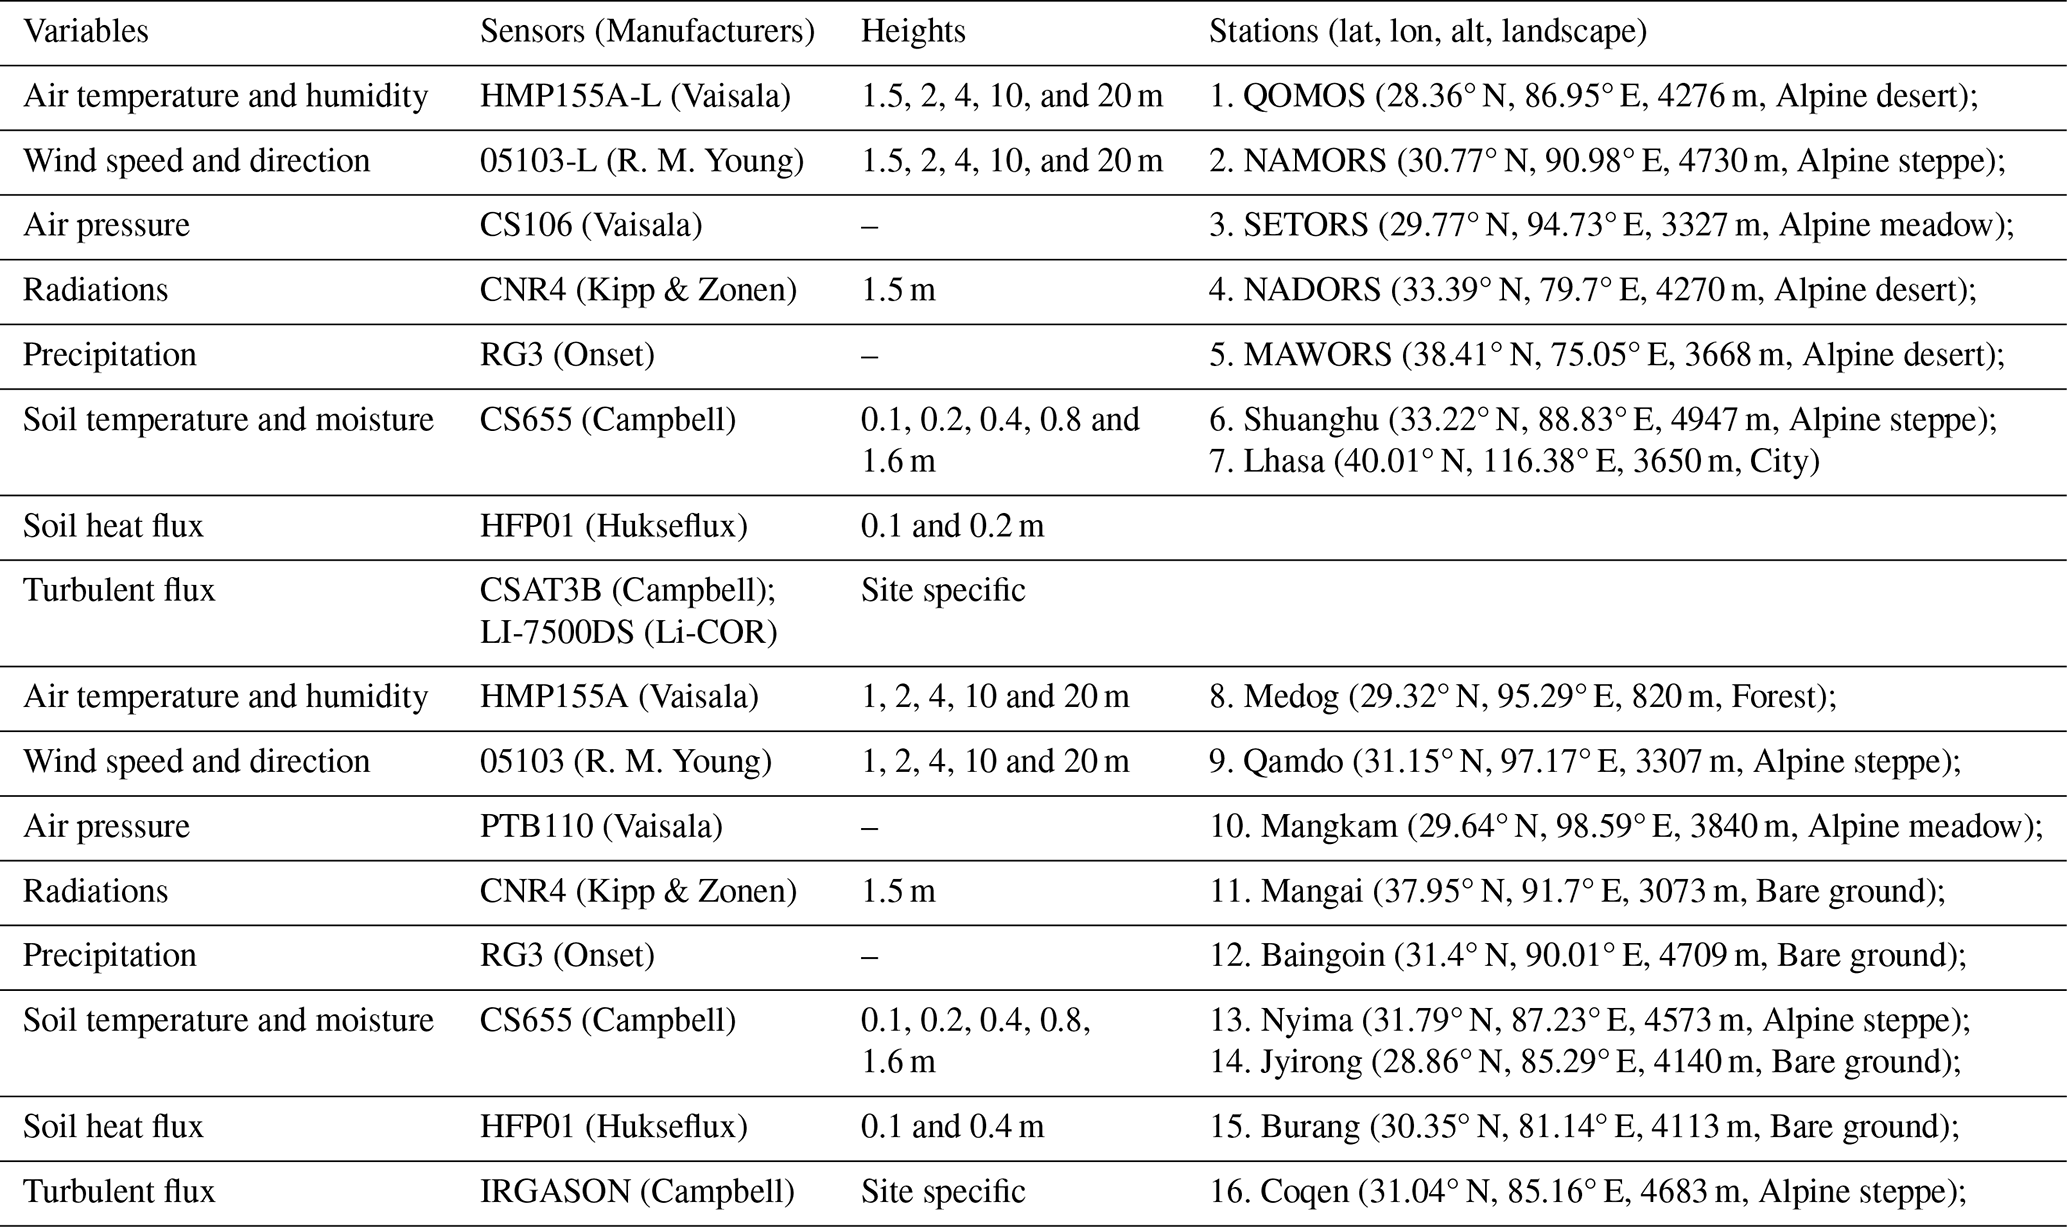
Notes: the heights of turbulent flux measurements from station number 1 to number 16 are 3.0, 3.77, 3.13, 3.7, 3, 3.2, 5, 5.5, 5.5, 3.5, 3.5, 5.5, 3.8, 3.5, 3.5 and 40 m respectively. In Lhasa station, the heights of atmosphere variables at 5 layers are 2, 4, 8, 16, 32 m.
2.1 Introduction of observation platform and instruments configuration
Long-term and quasi-continuous EC networks have been established worldwide across diverse ecosystems, including AmeriFlux and Fluxnet-Canada in North America, EuroFlux and CarboEurope in Europe, AsiaFlux and ChinaFlux in Asia, and OzFlux in Australia (Baldocchi, 2014; Yu et al., 2024). These networks provide critical ground-based measurements for understanding LA energy and material exchanges. Given the TP's vast area (approximately 2.6 million km2) and extreme environmental conditions – such as high solar radiation, large diurnal temperature variations, and limited precipitation – such EC observations are especially valuable. In this context, the Institute of Tibetan Plateau Research, Chinese Academy of Sciences, established six comprehensive and long-term LA interaction stations in remote and data-scarce regions of TP gradually since 2004 (Ma et al., 2008), including QOMOS (the Qomolangma Atmospheric and Environmental Observation and Research Station, CAS), NAMORS (the Nam Co Monitoring and Research Station for Multisphere Interactions, CAS), SETORS (the Southeast Tibet Observation and Research Station for the Alpine Environment, CAS), NADORS (the Ngari Desert Observation and Research Station, CAS), MAWORS (the Muztagh Ata Westerly Observation and Research Station, CAS), and Shuanghu. Since 2019, the 6 stations were upgraded with new sonic anemometer and gas analyzer sensors gradually (CSAT3 and LI7500DS), enhancing the measurement capabilities. The instrumentation and long-term data at 5 stations covering 2006–2021 can be found in Ma et al. (2020) and Ma et al. (2024).
Furthermore, the Second Tibetan Plateau Expedition and Research Program (STEP) in 2019 has expanded the network, adding 10 additional LA interaction stations, including Medog, Qamdo, Mangkam, Mangai, Baingoin, Nyima, Jyirong, Burang, Coqen, Lhasa, especially in the remote western and northern regions. The integrated EC devices (IRGASON, Campbell; CSAT3 & LI7500RS in Lhasa), capable of measuring high-frequency (10 Hz) quantities of sonic temperature, water, CO2, and three-dimensional winds, have been used. This expansion resulted in the creation of the Third Pole Environment Integrated Three-dimensional Observation and Research Platform (TPEITORP, observation platform for short hereafter) for measuring water, heat, and CO2 fluxes over the TP (Ma et al., 2023). All stations are equipped with 20 m planetary boundary layer (PBL) towers (40 m at Lhasa) that continuously measure a comprehensive set of meteorological and flux variables. These include air pressure, liquid precipitation, infrared land surface temperature, four-component radiation, soil temperature and moisture at multiple depths, air temperature and humidity at five vertical levels, wind speed and direction at five levels, as well as turbulent fluxes of water, heat, and CO2. Turbulent fluxes were measured using an EC system installed on each tower, with sensor height and orientation optimized according to prevailing wind directions and local surface roughness conditions. The details of the instrument configuration, station locations, and photographs are provided in Table 1 and Fig. 1, respectively. In-situ measurements from these stations, with updated systems, were utilized to analyze the seasonal and diurnal variations of water, heat, and CO2 fluxes, as well as the associated energy budget and carbon source–sink dynamics across contrasting ecosystems and climates. A detailed illustration of the observational environments at 16 stations are as follows.
QOMOS station is located in Rongbuk Valley, north of Mt. Everest, with a flat observation field dominated by barren land and sparse vegetation. NAMORS station, on the southeast bank of the third largest lake (Nam Co) in TP, is covered by alpine meadow. Both QOMOS and NAMORS have in situ EC and PBL tower systems that have been in operation since 2005, with sensors upgraded in 2019. SETORS station, located in a mountain valley in the southeast TP, is covered with dense vegetation (50–60 cm high). The EC and PBL systems were first installed in 2007 and fully upgraded in 2020. NADORS station, in grassland near Ritu County and Bangong Co, has had an EC system and an automatic weather station (AWS) since 2008, with a new 20 m PBL tower and a new EC system installed in 2020. MAWORS station, located near Mustag Mountain and Karakori Lake in Xinjiang, is influenced by westerly winds. The station has been equipped with an EC system since 2010, and both EC and PBL systems were updated in October 2020. Shuanghu station, located 3 km north of Shuanghu County, has been operational since 2012, with a typical alpine grassland surface. The original EC system is still in use, with new EC and PBL systems added in 2021.
The stations of Medog, Qamdo, Mangkam, Mangai, Baingoin, Nyima, Jyirong, Burang, Coqen and Lhasa were gradually established till 2021 with support from STEP program. Medog, Qamdo, and Mangkam stations are located in the southeastern TP. Medog is located at the southern foot of the eastern Himalayas, near the Yarlung Zangbo River, with a steep terrain surrounded by subtropical evergreen broadleaf forest (i.e. banana trees) and crops (i.e., peanuts). Qamdo is situated in the Changdu Meteorological Bureau's observation field, covered by grass at the top of hilly Changdu City. Mangkam is located at the Mangkang County Meteorological Bureau's external observation field, with a surface covered by 10 cm grass. Mangai station is in the northern part of the TP, with a Gobi desert landscape. The PBL tower and EC system were mounted on the Mangai Meteorological Bureau's external observation field. Baingoin, Nyima, and Coqen stations are located in the west-central TP, each with PBL and EC systems installed at their respective County Meteorological Bureau's observation fields. The land surfaces are bare ground, alpine meadow and alpine meadow, respectively. Jyirong and Burang, located north of the Himalayas, are covered by sparse vegetation and bare land, respectively. Lhasa station, constructed in 2020 and having a 40 m PBL tower, is located in the field observation base of ITPCAS, with roads and low-level buildings surrounded.
These stations are distributed across various climatic and environmental regions, covering landscapes such as alpine desert, alpine steppe, alpine meadow, bare ground and city. Some stations, including Mangkam, Baingoin, Qamdo and Lhasa are situated in or adjacent to cities, thus they can be influenced by nearby human activities to some extent. The land surface properties (e.g., land cover, terrain, soil texture) and local climate vary markedly across stations, providing valuable data for generalizing LA interaction schemes across diverse environments and climates over the TP. These differences highlight the complexity of coupled LA interactions, the challenges in obtaining necessary data for model development, and the need for a comprehensive understanding of how land surface processes affect atmospheric conditions and climate predictability. After the construction of the observation platform in 2021, the instruments calibration and maintenance have been carried out twice a year, with field work distance of more than 5000 km and duration of more than 1 month each time. Our efforts to maintain this observation platform aim to bridge the observational gaps in data-scarce regions and to support research on land surface processes, water and energy cycles, and environmental effects across the TP.
2.2 Methods for data processing and analyzing
To study the spatial-temporal variations of meteorological variables and turbulent fluxes of water, heat and CO2 at these stations and to analyze the influencing factors over the different climatic and environmental conditions, 15 stations have been chosen in this study with an exception of Lhasa, which only captured the measurements during the daytime because of the power malfunction at night. We selected field measurements of more than 2 years, mostly covering the period of May 2021 to July 2023. The proportions of data coverage for meteorological variables and turbulent flux are close to 94 % and 77 %, respectively, with the least data integrity percentage of approximately 50 % in Mangai station. Details of data coverage at each station can be found in Table S1 in the Supplement. After accounting for data losses due to instrument failure, power interruptions, and occasional human operational errors, precipitation records from July 2021 to June 2022 were used in this study. Precipitation data gaps occurred at three stations – QOMS (20 %, 1 February–14 February, 14 May–1 June 2022), NAMORS (22 %, 1 January–21 March 2022), and SETORS (6 %, 8 February–12 February, 27 March–12 April 2022) – with the missing periods distributed intermittently throughout the observation year. These data gaps were primarily caused by technical or operational issues. As the rain gauge (RG3, Onset) measures only liquid precipitation during warm seasons and does not record solid precipitation in cold months, the missing data, mostly during winter and pre-monsoon periods, do not affect the conclusions regarding the spatial and temporal variations of liquid precipitation.
Currently, meteorological variables were processed following standardized protocols. Abnormal values – defined as physically implausible measurements such as downward shortwave radiation greater than 1360 W m−2 or less than 0 W m−2, or variables showing unrealistic diurnal or seasonal patterns caused by sensor or power malfunctions – were flagged and removed after visual inspection and consistency checks. For turbulent heat flux, two types of open-path EC systems were used across the stations: CSAT3B and LI-7500DS (stations 1–7) and IRGASON (stations 8–16). These high frequency data were processed using standard EddyPro software, which includes standard procedures of spike removal, buoyancy flux conversion to sensible heat, double rotation, as well as ultrasonic virtual temperature correction and density correction (Webb-Pearman-Leuning correction) (Massman and Lee, 2002; Mauder and Foken, 2006; Twine et al., 2000). Quality flags are applied to the flux estimates, considering steady state test and integral turbulence characteristics test (Mauder et al., 2013). NEE represents the net vertical CO2 flux between the ecosystem and the atmosphere and is directly measured by the EC system. The two main components of the carbon cycle, GPP and Re, are then estimated from the measured NEE using the standard flux partitioning procedures implemented in the REddyProc package (Wutzler et al., 2018), where a temperature response function for NEE fluxes is used to represent Re, with GPP derived as the difference between Re and NEE. Nighttime NEE data with low friction velocity were filtered to avoid biases, and gaps were filled using the available meteorological data. Specifically, the friction velocity threshold was estimated using the bootstrapping approach implemented in REddyProc, following the standard procedure described by Wutzler et al. (2018). Flux gap-filling was performed using the marginal distribution sampling method within REddyProc, which estimates missing values based on relationships with radiation, air temperature, and vapor pressure deficit within a 7–14 d moving window. Quality control procedures included removing data points affected by sensor malfunction, spikes, or physically implausible fluxes, and applying the flagging schemes of Mauder et al. (2013). All low-quality or filtered data were excluded prior to gap-filling and flux partitioning to ensure data integrity.
Diurnal and seasonal variations of meteorological and turbulent flux variables were analyzed after filtering out low-quality and spurious data. To reduce the influence of data gaps and enhance comparability among sites, monthly averaged diurnal cycles of meteorological variables and turbulent fluxes were used to examine their spatial and temporal patterns across stations. The total annual values for ET, NEE, GPP and Re were obtained by summing the monthly values. During data quality screening, three stations (QOMOS, NAMORS, and Baingoin) were excluded from the NEE flux synthesis because their NEE diurnal cycles exhibited physically inconsistent behavior. Specifically, QOMOS and NAMORS showed inverted daytime-nighttime variations, while Baingoin displayed abnormally nighttime CO2 emissions, probably influenced by nearby biomass burning. Only the remaining 12 stations with reliable CO2 flux data were retained for spatial and temporal analyses. The energy budget ratio (EBR) and Bowen ratio (Bo) at each station were estimated to evaluate energy conditions and energy consumption. EBR () compares the cumulative sum of available energy inputs to the cumulative sum of turbulent energy outputs over an entire year. Available energy inputs include net radiation (Rn, W m−2) and ground heat flux (G, W m−2) while turbulent energy outputs include latent heat flux (LE, W m−2) and sensible heat flux (SH, W m−2). Net radiation can be measured by four components radiation sensors and is expressed as the difference between downward and upward shortwave (Rs↓ and Rs↑, W m−2) and longwave radiation (Rl↓ and Rl↑), specifically: . Bowen ratio indicates the relative proportions of energy consumption between SH and LE. Typically, Bo is high under dry conditions and low under wet conditions.
3.1 The spatial-temporal variations of atmospheric meteorological variables
The 15 stations are distributed across diverse environments and climates, resulting in considerable variations in the seasonal patterns of air temperature (Ta), air humidity (Q), wind speed (U20 m) and land surface temperature (Ts) (Fig. 2 and Table 2). The details of seasonal variations of the monthly average and annual mean of air temperature, wind speed and absolute humidity at the 15 stations can be found in Tables S2–S4. The annual average Ta, Ts, Q and U20 m span at ranges of −3.5–18.5 °C, −3.5–21.6 °C, 1.88–14.1 g m−3 and 0.6–5.6 m s−1, respectively. The annual average Ta shows strong positive correlations (r) with annual average Ts (r=0.99, p<0.01) and downward long-wave radiation (Rl↓, r=0.84, p<0.01), and a notable negative correlation with downward short-wave radiation (Rs↓, , p<0.01) (Fig. S1 in the Supplement). The high correlation with Ts indicates that strong LA coupling governs the spatial distribution of Ta, while the negative correlation with Rs↓ reflects the impact of cloud cover, which reduces Rs↓ but increases Ta. Additionally, the annual average Ta exhibits a significant negative correlation with elevation (, p<0.01). The highest annual average Ta (18.5 °C) occurs at Medog station (820 m a.s.l.), while the lowest (−3.5 °C) is observed at Shuanghu station (4947 m a.s.l.). Stations such as Qamdo (3307 m a.s.l.), SETORS (3327 m a.s.l.), Mangkam (3840 m a.s.l.), and Mangai (3073 m a.s.l.) have annual average values ranging from 5.2 to 8.6 °C, whereas stations above 4000 m have annual averages from −3.5 to 3.9 °C. Seasonal variations in Ta can also be influenced by climatic and environmental conditions. For example, despite similar elevations (around 3300 m a.s.l.) and low wind speeds (approximately 1.8 m s−1), Qamdo shows larger annual value and amplitude in Ta than that in SETORS, and it may be attributed to the former's lower moisture condition as well as the strong “urban heat island” effect. Qamdo, having lower annual precipitation value, is located at a mountaintop grass land observation field in the city center, thus, relatively weak evaporated cooling and intense human activities and infrastructure may contribute to Qamdo's elevated Ta. Similarly, in Baingoin and NAMORS, despite their proximity and similar elevations, NAMORS experiences higher Ta from October to February and lower temperatures from March to August. Such variations are likely influenced by the large lake (Nam Co), which has a cooling effect in summer and a warming effect in winter.

Figure 2The seasonal variations of meteorological variables, including (a) air temperature (Ta), (b) air humidity (Q); (c) land surface temperature (Ts); (d) wind speed at 20 m height (U20 m).
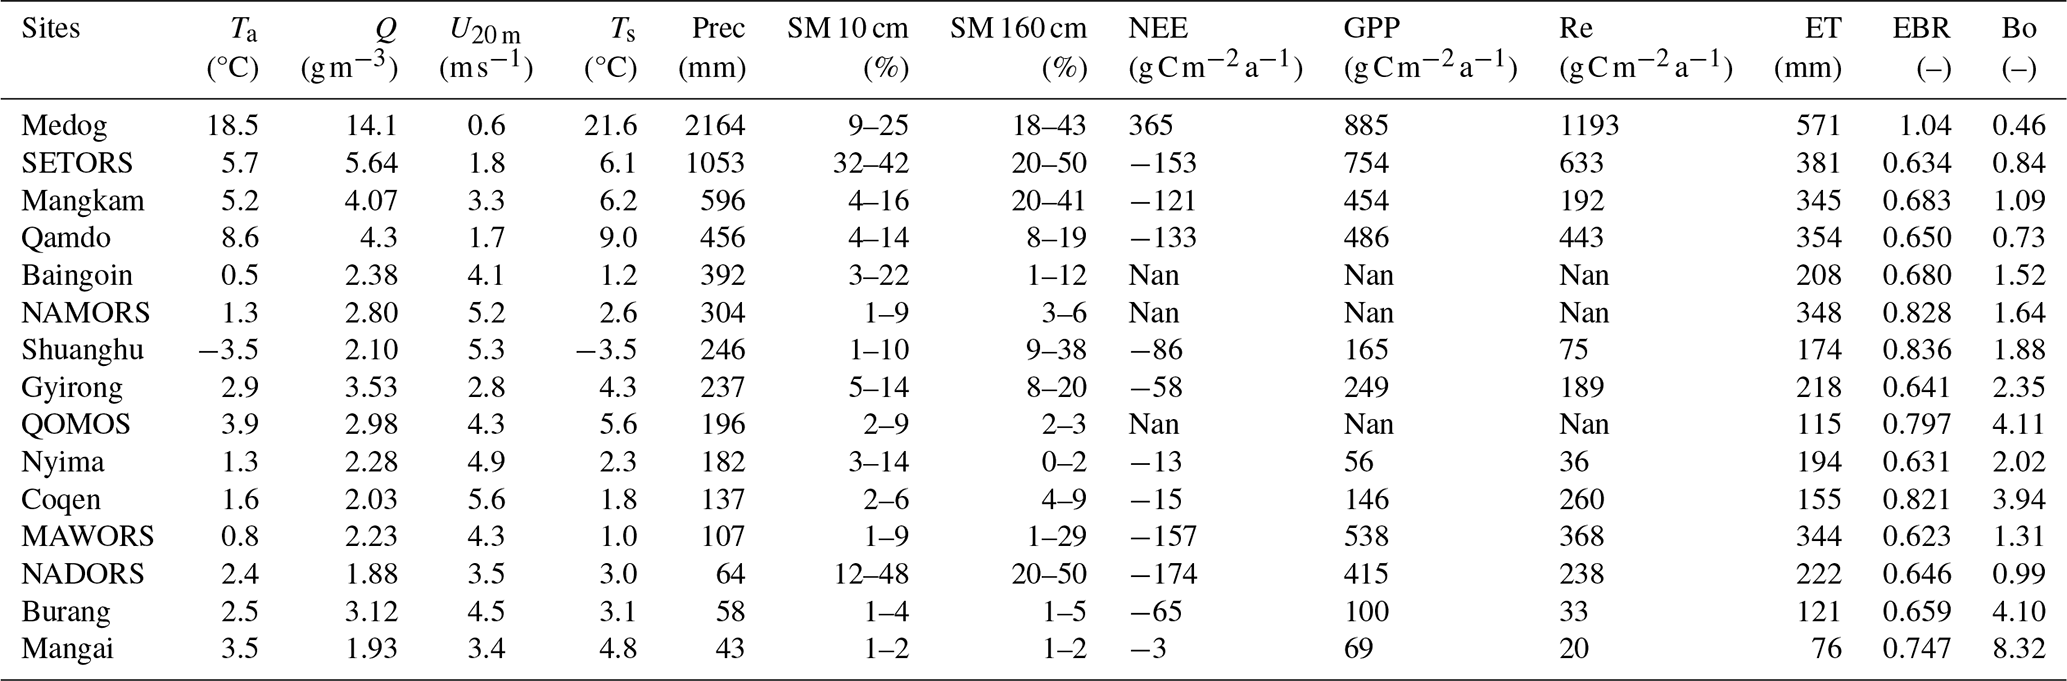
Table 2The annual average meteorological variables, soil water contents (SM 10 cm and SM 160 cm indicate soil moisture at 10 cm and 160 cm, respectively), NEE, GPP, Re, ET, EBR and Bo at 15 stations.
Both air humidity (Q) and wind speed at a 20 m height (U20 m) at 15 stations show similar seasonal variations (Fig. 2b and d). Generally, the seasonal patterns of Q and U20 m are influenced by the interaction of monsoon and westerly systems. Seasonally, the summer monsoon system leads to the lower values in U20 m and higher values in Q, while high values in U20 m and low values in Q during winter are coincident with the dominating westerly system. Spatially, Q decreases from southeast to northwest across the TP. Medog station, located in a subtropical forest climate, exhibits the highest annual average Q of 14.1 g m−3. The higher group of annual average Q values are found at SETORS (5.61 g m−3), Qamdo (4.28 g m−3), and Mangkam (4.12 g m−3), while the rest of the stations range from 1.74 to 3.67 g m−3. Further, both the annual averages of Q and U20 m correlate with elevation, showing negative and positive correlations of −0.88 (p<0.01) and 0.83 (p<0.01), respectively (Fig. S1). U20 m is the lowest in Medog, Qamdo, and SETORS, where wind speeds are generally under 2 m s−1, primarily because of their locations in the southeast mountainous regions. Conversely, stations at higher elevations with more homogeneous landscapes, such as Nyima, Coqen, and Shuanghu, experience the highest wind speed.
Overall, the 15 stations reveal distinct spatial and seasonal variability in meteorological conditions across the TP, driven primarily by elevation and large-scale circulation systems. The combined effects of topography, monsoon and westerly influences, and local factors such as urbanization and lake regulation shape the observed gradients in temperature, humidity, and wind speed.
3.2 The spatial-temporal variations of liquid precipitation and soil water content
The wet-dry condition at each station is mostly correlated with liquid precipitation and soil water content (Table 2). The highest annual precipitation occurs in the southeastern TP, at stations like Medog, SETORS, Mangkam, and Qamdo, where the monsoon system dominates. The monsoon system can bring moist air into the plateau, resulting in annual precipitation values of 2164 mm in Medog, 1053 mm in SETORS, 596 mm in Mangkam, and 456 mm in Qamdo. In contrast, stations with low annual precipitation, such as Mangai, Burang, NADORS, and MAWORS, are located in the western and northern parts of the TP, where mid-latitude westerlies prevail, with annual precipitation below 120 mm. The rest seven stations in the central and western TP, where both westerly and monsoon systems interact, experience annual precipitation ranging from 120 to 400 mm. Specifically, Baingoin, NAMORS, and Shuanghu, located in the central TP, receive annual precipitation of between 200 and 400 mm, while Nyima, Coqen, Gyirong, and QOMOS receive 100 to 200 mm yr−1. This pattern of high in the southeast and low in the northwest aligns with the Global Precipitation Measurement (GPM) product (Li et al., 2021a). The spatial distribution of soil water content at depths of 10 and 160 cm generally mirrors the precipitation pattern, but they can be also influenced by soil properties and local conditions. For example, NADORS, situated near Bangong Co, exhibits the highest soil water content at 10 cm depth. At 160 cm depth, stations like Shuanghu, NADORS, MAWORS, and Gyirong show soil water content up to 0.20, indicating pronounced groundwater contribution. In contrast, Mangai, Burang, Coqen, and NAMORS have the lowest soil water contents.
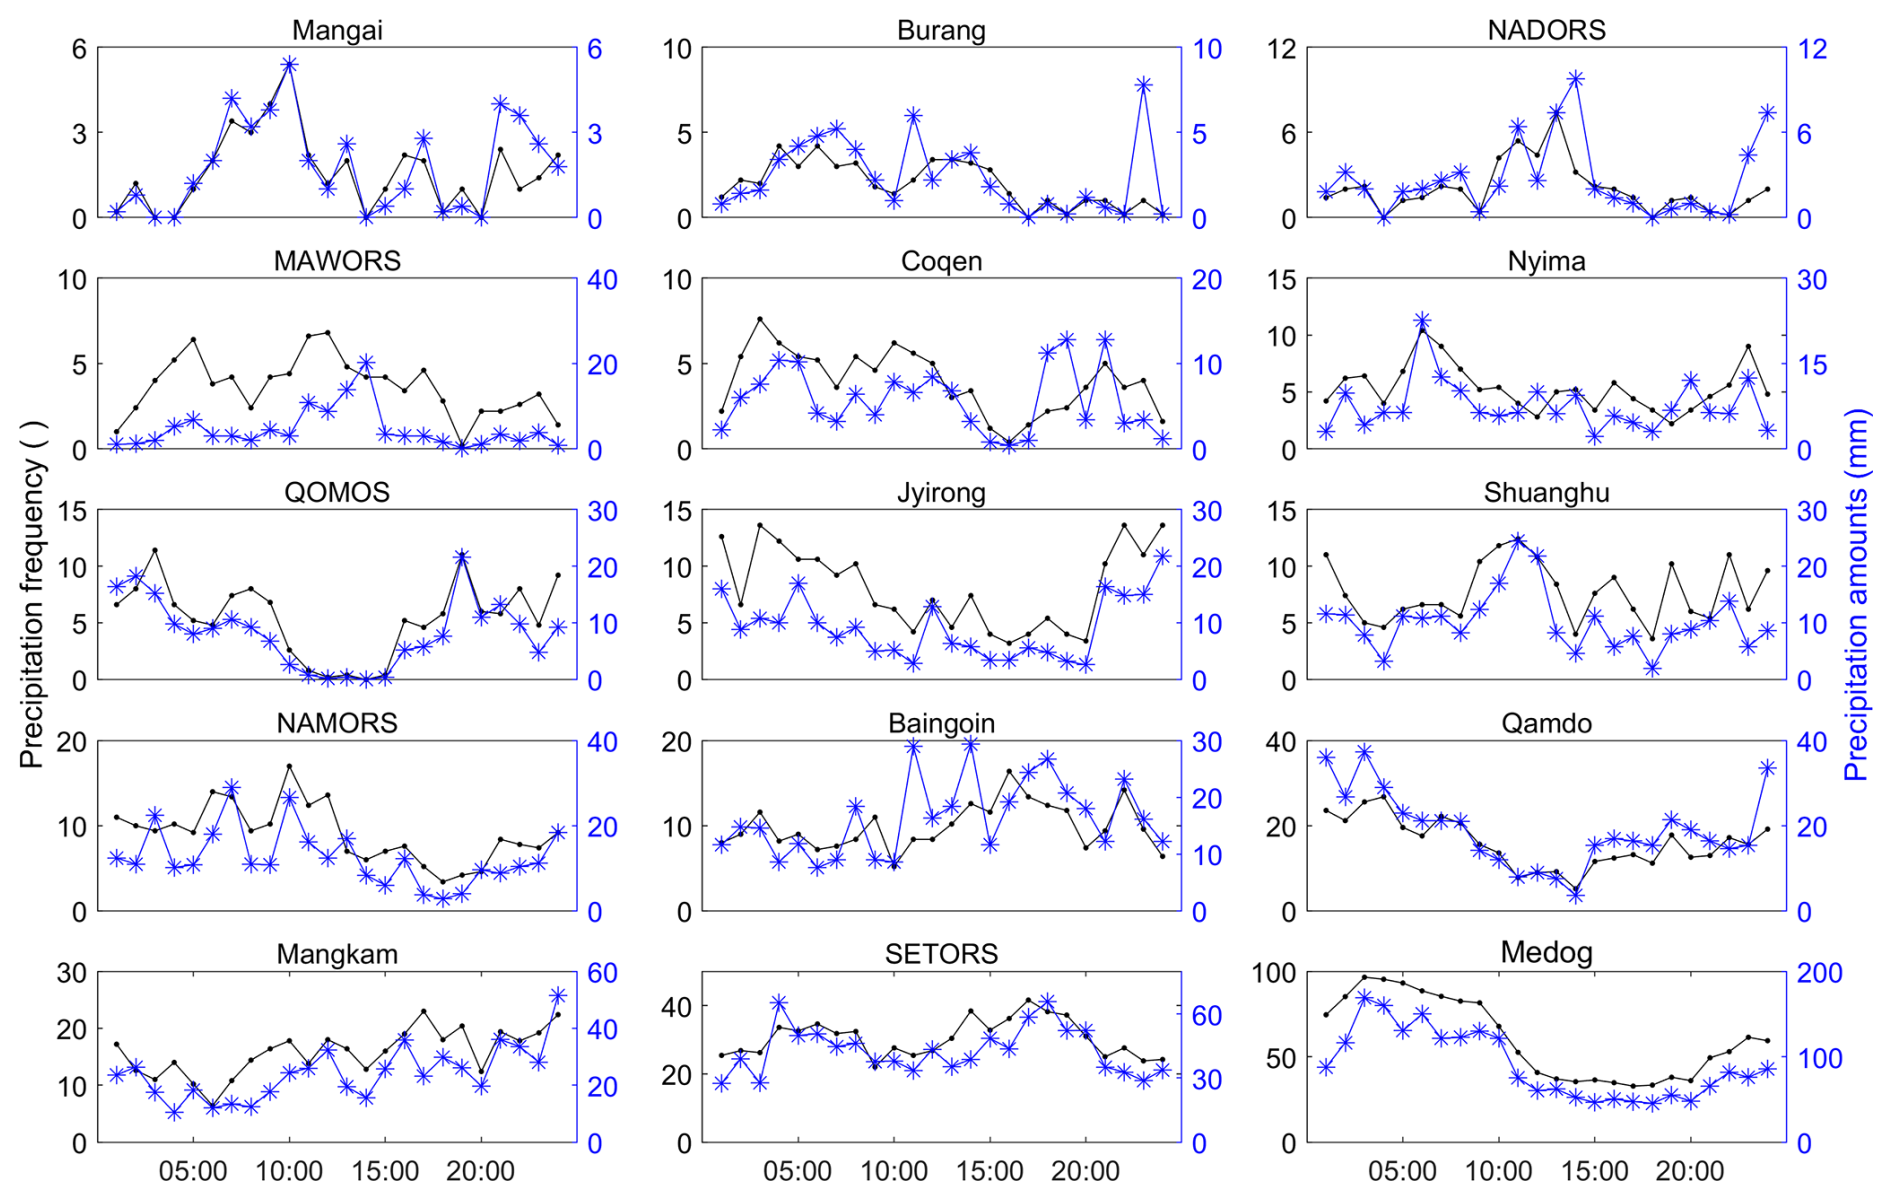
Figure 3The diurnal variations of liquid precipitation amounts and frequency at 15 stations. Liquid precipitation frequency indicates the total times of liquid precipitation annually.
Seasonally, liquid precipitation over the TP is primarily concentrated during the summer monsoon seasons, with peaks in July and August (Fig. S3), consistent with findings from Yang et al. (2023) in central TP. Chen et al. (2023) observed that monthly precipitation in the Yarlung Tsangbo Grand Canyon exhibits two peaks, one in April and the other in August, which is also the case for SETORS and Medog. Diurnally, Li et al. (2021b) noted that summer precipitation over the TP often occurs in the afternoon and evening. However, the diurnal patterns vary markedly across the 15 stations (Fig. 3). Precipitation frequency and amounts followed similar diurnal variations, with notable exceptions at Baingoin and MAWORS, where precipitation frequency peaked between 06:00 and 11:00 BJT (Beijing Time, i.e., China Standard Time (UTC+08:00), but the highest rainfall amounts occurred at 14:00 BJT. At westerly-dominated stations in the northern TP like Mangai, NADORS, MAWORS, and Shuanghu, precipitation peaks during the day and is minimal at night, though the timing of these peaks varies. In contrast, stations in mountainous regions – Medog, Mangkam, Qamdo, Nyima, and Gyirong – experience peak precipitation mostly at night, similar to findings in Chen et al. (2023) for the Yarlung Zangbo Grand Canyon. SETORS, QOMOS, and Coqen exhibit bimodal precipitation patterns, with peaks at night and in the late afternoon. Burang and NAMORS show higher precipitation in the first half of the day, with lower amounts later, and such patterns are probably related with the lake breeze circulation. Generally, daytime rainfall is probably driven by up-slope flows due to surface heating, while the monsoon nocturnal low-level jet may contribute to nighttime rainfall. Further, the local circulations of lake-land breeze and mountain-valley breeze can also modulate the water circulations and impact on the diurnal variation of precipitation.
Overall, precipitation and soil moisture across the TP show a clear southeast–northwest gradient, decreasing from humid monsoon regions to arid westerly-dominated areas. Seasonal and diurnal variations reflect the combined influence of the summer monsoon, local topography, and mesoscale circulations such as mountain–valley and lake–land breezes. These spatial and temporal patterns highlight strong hydroclimatic heterogeneity and its control on regional LA coupling.
3.3 The spatial-temporal variations of energy flux
Net radiation (Rn) provides the energy source for LA energy and material exchange, and is mainly divided into three components: ground heat flux (G), SH, and LE. Rn generally shows positive values in its seasonal variations, indicating that the ground surface acts as a heat source relative to the overlying atmosphere. Rn peaks in June or July and reaches its lowest in December or January. SETORS and Gyirong have monthly Rn values of greater than 90 W m2, while Baingoin and Mangai have values of below 70 W m2. The other stations show values of between 70 and 90 W m2, which are similar to those reported in previous studies, 4 stations over the TP and 4 stations in the lower reaches of the Yangtze River region (Yao et al., 2024). Details for the seasonal variation of monthly net radiation and monthly ground heat flux and their annual means at the 15 stations can be found in Tables S5 and S6. Further, heat storage occurs mainly from March to August, peaking around June, while heat release is most remarkable from October to February, with the largest release in December. The annual average of monthly G ranges from −0.01 W m2 at Qamdo to 2.39 W m2 at NADORS. The close-to-zero G values suggest minimal impact of ground heat storage on the energy budget at an annual scale, while the dominating positive values suggest a warming trend in the ground, aligning with global warming and the rise in land surface temperature (Duan and Xiao, 2015; Oku et al., 2006; Zhang et al., 2023).
Turbulent heat fluxes, including SH and LE, exhibit clear diurnal and seasonal variations (Fig. 4), consistent with previous studies on the TP (Ma et al., 2005; Zhong et al., 2019a). In addition, the seasonal evolution of monthly averaged diurnal SH and LE can be found in Figs. S4 and S5. SH peaks during the pre-monsoon months of April and May, and is lowest in the cold months of December and January. Stations with sufficient water availability, such as Medog, SETORS, Mangkam, Qamdo, Baingoin, MAWORS, and NADORS, have total annual SH values ranging from 269 to 356 W m−2. The first five stations receive high precipitation, while the latter two have substantial soil moisture supply. Other stations have total annual SH fluxes exceeding 400 W m−2, with QOMOS and Coqen reporting the highest annual values of 582 and 626 W m−2, respectively. LE peaks during the monsoon seasons (July to August) and is not apparent throughout the cold months. Specifically, the total annual LE is only 61.3 W m−2 at the extremely dry Mangai station, while Medog records monthly LE values all exceeding 29 W m−2. Spatially, LE is showing decreasing pattern from the southeast wet regions to the northwest dry regions. As shown in Table 1, the Bo reflects the energy distribution between SH and LE. Medog, SETORS, and Qamdo in the southeast have Bo values of less than 1, indicating dominant heat consumption through the LE, while Mangai, Burang, and QOMOS in the northern and western regions have Bo ratios greater than 4, suggesting the dominant role of SH.
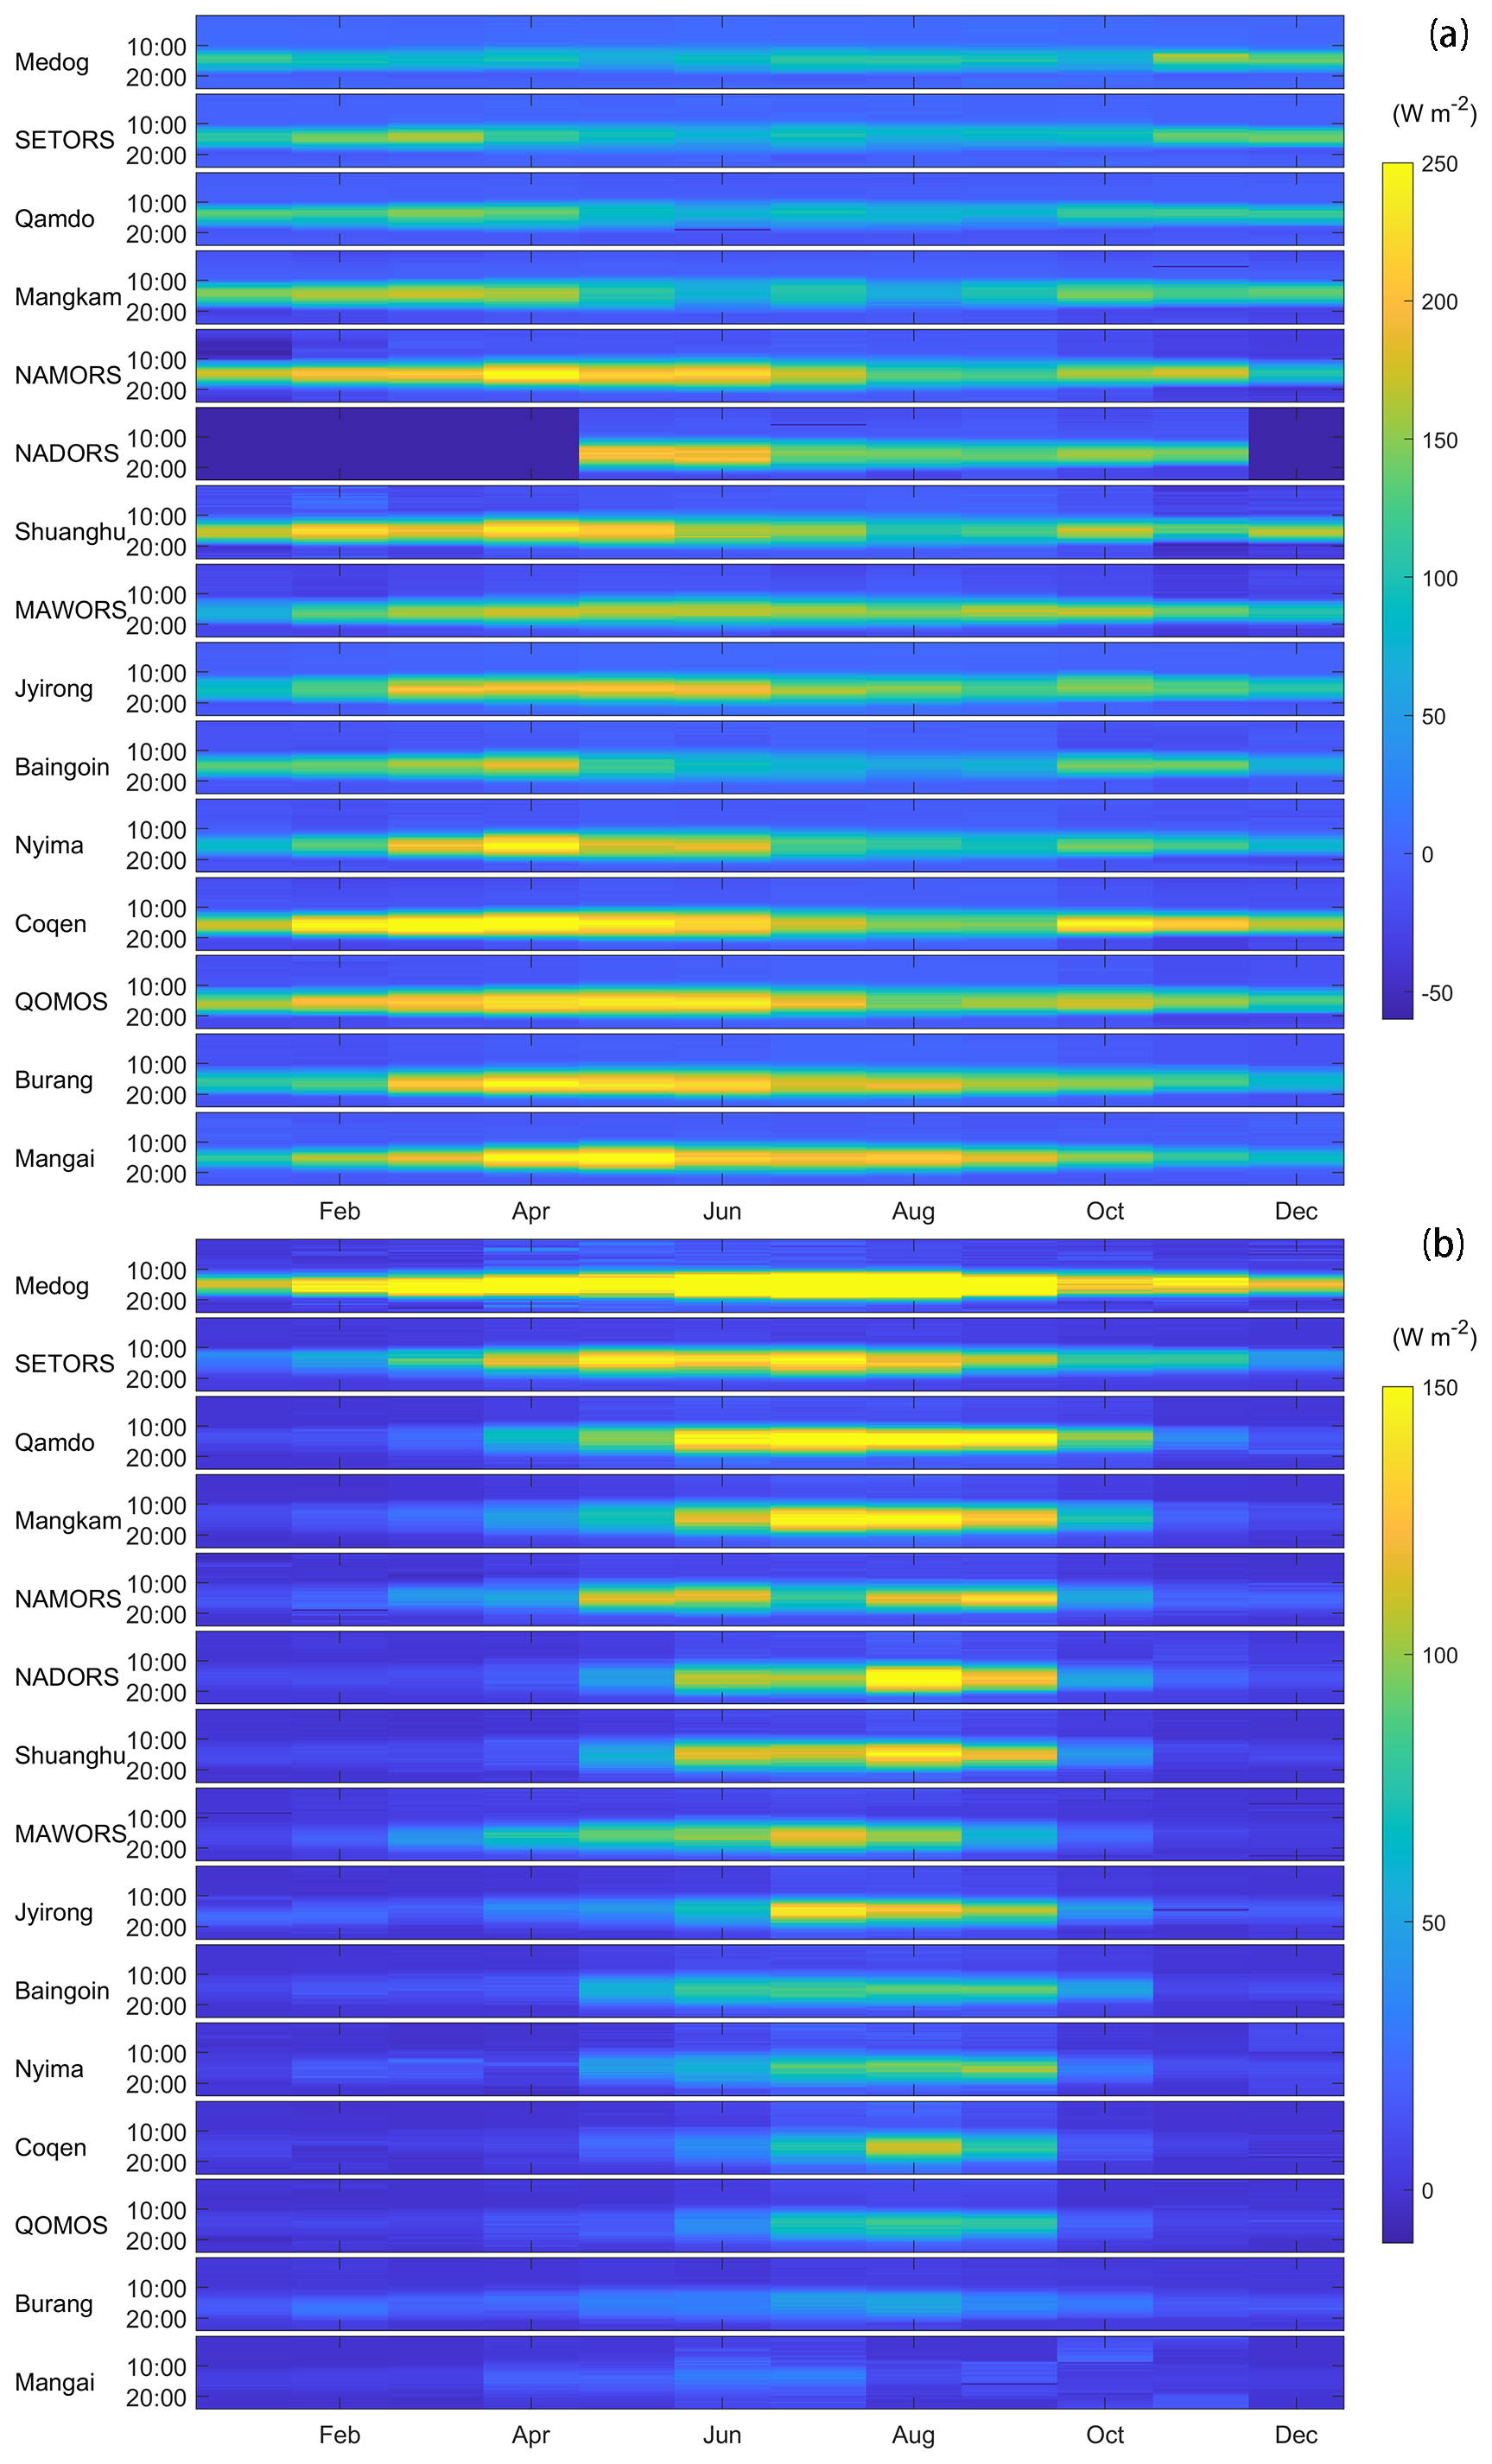
Figure 4The heat maps for averaged diurnal and seasonal variations of sensible heat flux (a) and latent heat flux (b) at 15 stations.
The EBR is the ratio of turbulent energy fluxes (SH+LE) to available energy (Rn−G). The average EBR across the 15 stations is approximately 0.73, ranging from 0.62 to 1.04, with 11 stations between 0.6 and 0.8, while Medog exceeds 1 (Table 2). These values are consistent with results from global eddy flux sites (Wilson et al., 2002). Imperfect energy balance closure can arise from several factors (Foken, 2008; Mauder et al., 2020), including footprint mismatch, instrumental biases, unaccounted energy storage, flux losses at different frequencies, and neglected advection. The influence of these factors likely varies among sites according to their surface heterogeneity and terrain complexity. A detailed site-level attribution of EBR differences requires further analysis and will be addressed in future work.
Following the LA interaction theories, SH (LE) are primarily influenced by land–atmosphere temperature gradients () or water vapor deficit (, where es and ea are the saturation vapor pressure and the actual vapor pressure respectively), wind speed (U), soil moisture at 10 and 80 cm, land surface temperature (Ts) and net radiation (Rn), etc. (Wang et al., 2017). The correlation coefficients between SH (LE) and the related variables can be found in Table S7, and the dominating factors for LA turbulent flux are pronouncedly different under dry and wet stations, where energy-related variables are most important in water-sufficient conditions, while water-related variables show dominant role in water-shortage conditions. For example, wet stations such as Medog, SETORS, Mangkam, and Qamdo, which receive substantial precipitation and maintain high soil moisture, exhibit stronger correlations of LE with Rn and Ts than with soil moisture. In contrast, dry stations such as QOMOS, Nyima, Coqen, and Burang, characterized by low precipitation and limited soil moisture, show higher correlations of LE with soil moisture at 10 cm than with other variables. Mangai, an extremely dry station with annual precipitation value of only 43.2 mm and very low soil moisture conditions (0.01–0.02), has the smallest annual ET value and no obvious correlations with all the variables. In NADORS, the annual ET has a value of 222.4 mm, significantly higher than the annual precipitation amount of 64 mm, and the volumetric water content at 80 cm can reach up to 0.3, suggesting a substantial impact of groundwater supply. Thus, soil moisture and Rn have comparable high correlation coefficients in NADORS.
The correlation coefficients between SH (LE) and related environment variables under conditions of all stations, wet stations (Medog, SETORS, Mangkam, and Qamdo) and dry stations (QOMOS, Nyima, Coqen, Burang) are grouped in Fig. 5. For all stations included, SH variations are primarily driven by ΔT, followed by Rn and Ts, with correlation coefficients of 0.57, 0.55 and 0.34, respectively (Fig. 5a). Further, SH has a positive correlation with wind speed and a negative correlation with soil moisture. The correlation coefficients show large diversity under dry and wet conditions, with generally lower values in wet stations than those in dry stations. For example, the averaged correlation coefficients between SH and ΔT/Rn/Ts under dry stations are 0.63/0.65/0.44 while those values (0.32/0.40/0.13) are much smaller under wet conditions. Wind speed has weaker correlation with SH. but in MAWORS and Medog, the correlation coefficients could approach to 0.5. In NAMORS, there is a negative correlation between wind speed and SH. These phenomenons may be related with the local circulations of mountain-valley and lake-land breezes, which may lead to synchronized and opposite variations in such conditions.
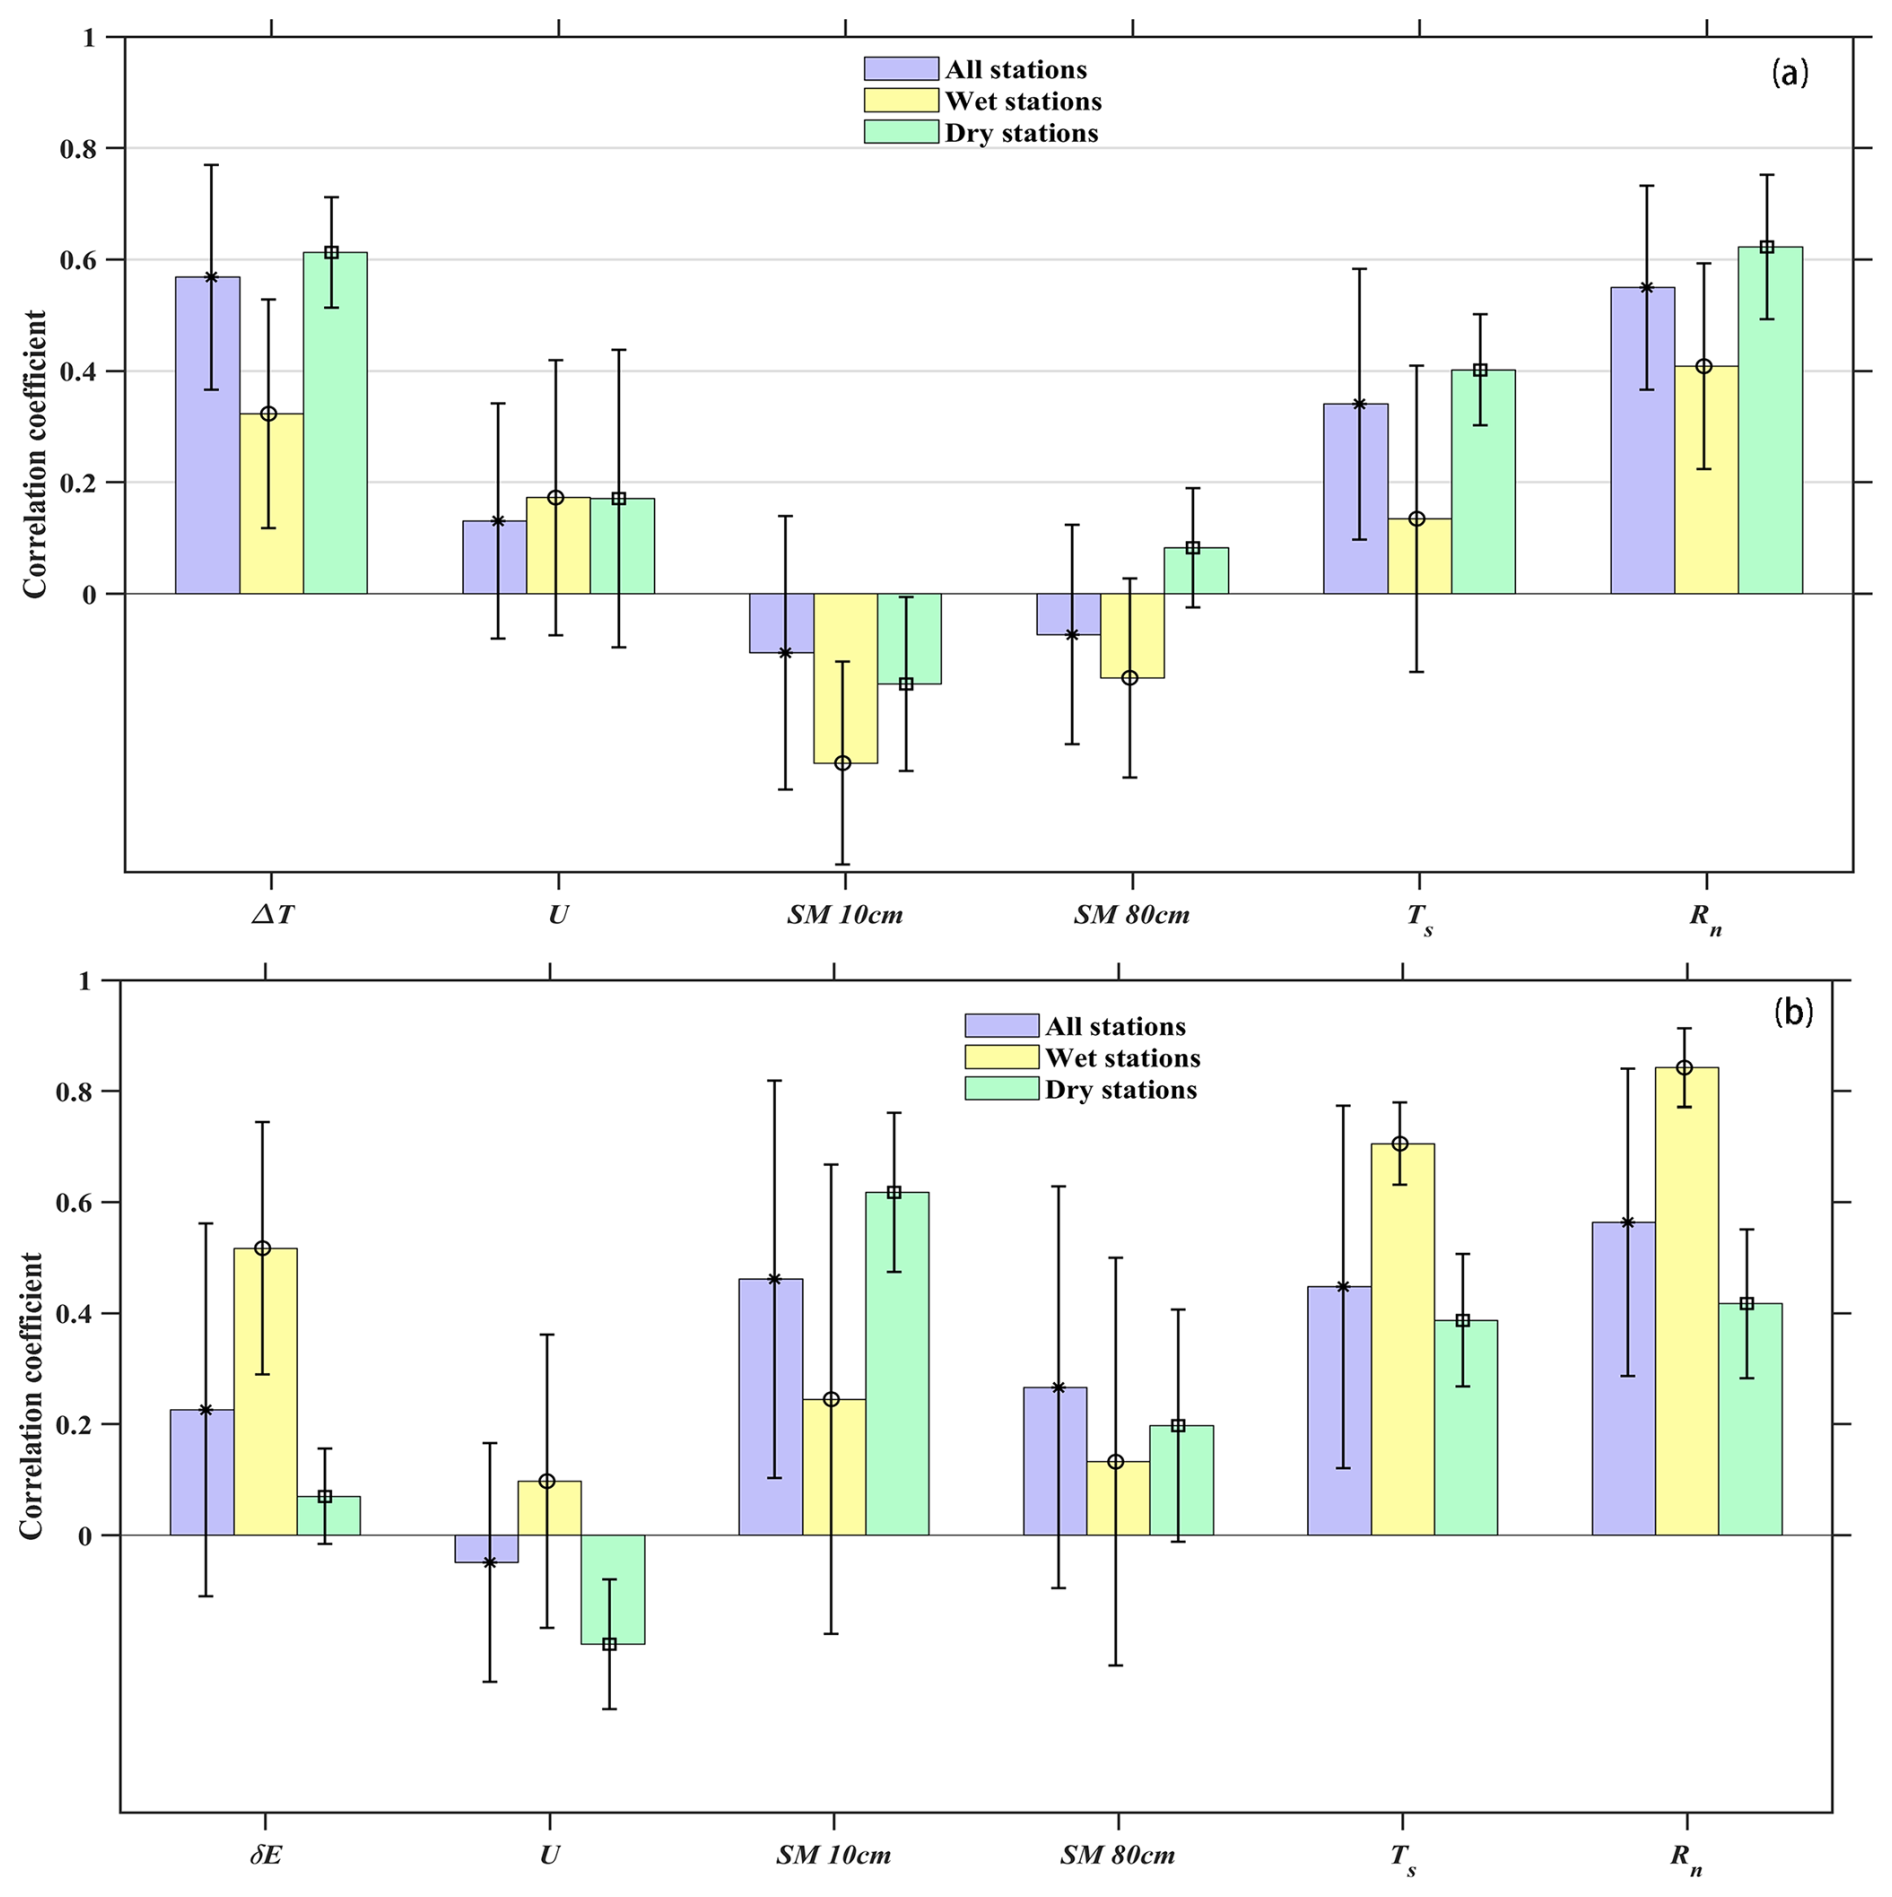
Figure 5The correlation coefficients between sensible heat flux (a), latent heat flux (b) and related environmental variables at a temporal resolution of hourly under conditions of all stations, wet stations and dry stations, respectively. The statistical significance of the correlation coefficients for each station is provided in Table S7.
The correlations between LE and environmental variables are more complex (Table S7 and Fig. 5b). The three paramount factors are Rn, Ts and soil moisture at 10 cm, with correlation coefficients of 0.56, 0.46, 0.45, respectively. For wet stations, the most important variables are energy related variables (Rn and Ts). Stations such as Medog, Mangkam, SETORS, Qamdo, Gyirong, and NADORS follow this pattern, with the first four stations influenced by high precipitation and the latter two by soil water content. ΔE represents the difference between the actual and saturation vapor pressure, indicating the atmospheric moisture deficit. The saturation vapor pressure increases exponentially with temperature – by about 6 %–7 % per °C – so warmer air can hold substantially more water vapor than cooler air. Thus, ΔE shows remarkable high correlations at Medog and SETORS. At stations like Burang, Nyima, MAWORS, and Coqen, the most influential variable is soil moisture, followed by Rn and Ts. Thus, both energy and water availability play dominant roles. At extremely dry station of Mangai, most of the monthly LE values are close to zero, and none of the variations show obvious correlations with LE. For QOMOS, the largest correlation with LE is seen with soil moisture at 10 cm, suggesting that water availability plays a more critical role in ET than energy availability in this region.
In a brief summary, turbulent fluxes of SH and LE display clear spatial and seasonal patterns, with the Bowen ratio reflecting this energy partitioning. Correlation analyses reveal that SH is primarily driven by temperature gradients, whereas LE is controlled by energy-related factors in wet regions and by soil moisture availability in dry regions, highlighting the contrasting mechanisms of LA coupling across the TP.
3.4 The seasonal variations of NEE, GPP and Re
The seasonal variations of daily NEE, GPP, and Res averaged over the observational period show remarkable differences across sites, and the sites with relatively good vegetation coverage follow a single-peak distribution pattern, i.e. SETORS, Qamdo, Mangkam, etc., but the other sites, including Burang, Nyima, Coqen, Mangai, show weak or nearly non seasonal variations (Fig. 6 and Table 2). The carbon absorption and release are determined by vegetation photosynthesis process and ecosystem respiration. The seasonal variation of carbon fluxes follow the vegetation growth, with highest values during the summer peak growing seasons. For example, stations with substantial vegetation growth, such as SETORS, Qamdo, Mangkam, NADORS, and MAWORS, exhibit higher peaks and fluctuations in NEE, GPP, and Re. The first three stations benefit from high precipitation, while the latter two stations receive considerable shallow soil water supply from surrounding lakes or glaciers. These five stations exhibit strong carbon sink capacities, with NEE values all smaller than −120 g C m−2 during the growing season. Specifically, NADORS shows the largest NEE value of −174 g C m−2 from May to October, while SETORS has the highest daily NEE values, exceeding 6 . Similarly, GPP and Re values at the 5 stations all exceed 400 and 190 g C m−2, with SETORS having the highest GPP and Re values of 754 and 633 g C m−2, respectively, due to its favorable temperature and water conditions for vegetation growth. In water-limited regions like Mangai and Nyima, carbon fluxes fluctuations are minimal. Daily NEE values remain below 0.5 , even during the growing season. The total annual NEE values are −3.2 and −12.8 g C m−2 in Mangai and Nyima, respectively. GPP and Re values are also low, with annual totals below 70 g C m−2 for GPP and 40 g C m−2 for Re. The smallest annual GPP value is 56 g C m−2 at Nyima, and the smallest annual Re value is 20 g C m−2 at Mangai. Although annual NEE values at SETORS and MAWORS are relatively similar, SETORS has much larger GPP and Re values because of the efficient water supply and warm climate. In contrast, (Wang et al., 2021) reported NADORS with average GPP value of 1.60 and average Re value of 0.71 during growing season of 2014–2015, while these values (2.93 for GPP and 1.35 for Re) are much larger during growing season of 2021–2022 in our estimation. In addition, the maximum net carbon uptake has a value of −2.1 in MAWORS during 2015–2016 (Wang et al., 2021), however, the largest NEE exchange value is −2.6 in our measurements. Thus, it may indicate the improvement of vegetation status in the two western stations during the past 10 years (Zhong et al., 2019b).
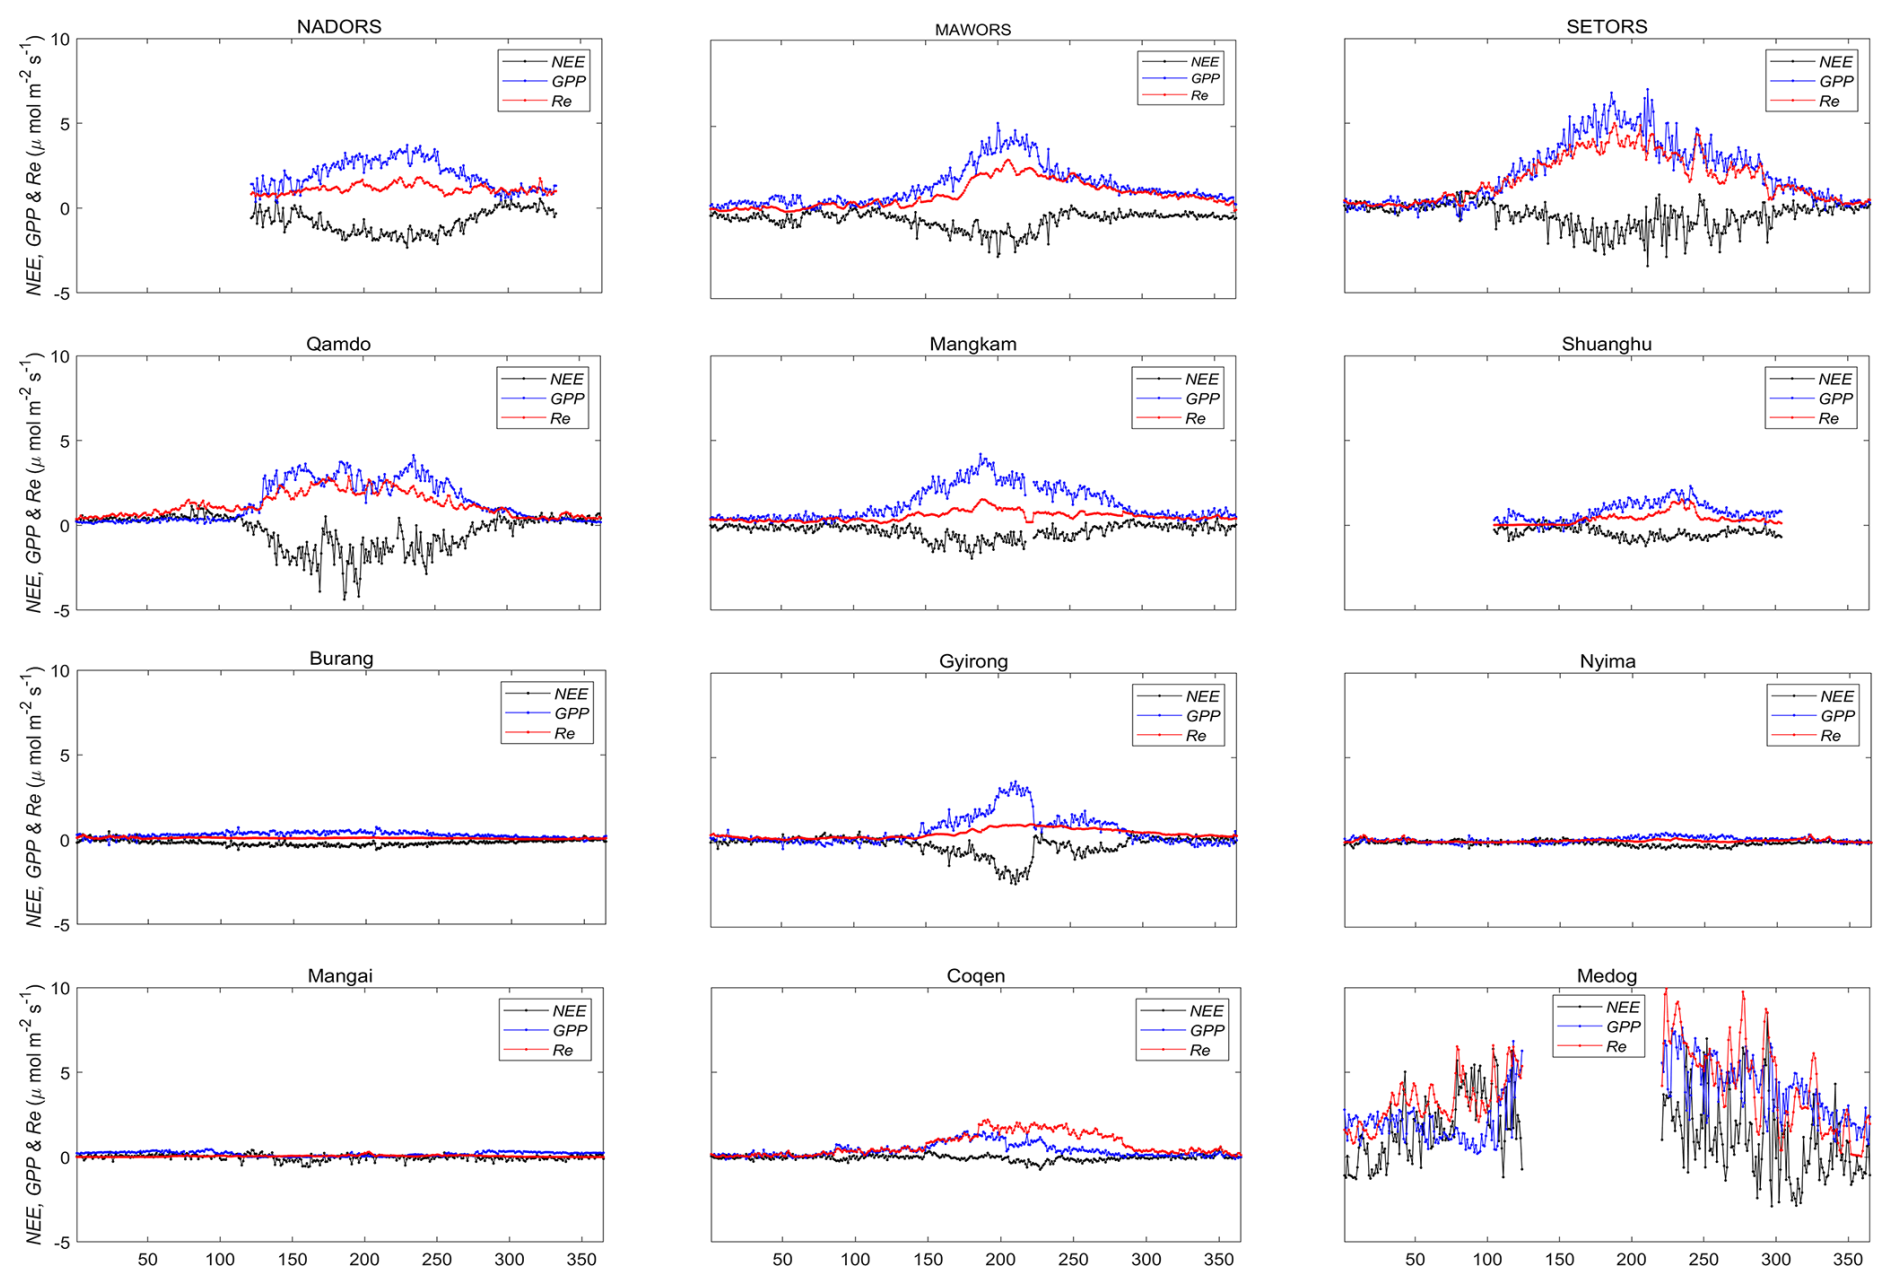
Figure 6The seasonal variations in NEE, GPP, Re across different sites. The negative NEE values indicated a net uptake of CO2. The black, blue and red lines stand for daily NEE, GPP and Re, respectively.
The annual NEE values are negative at 11 out of 12 stations, with exceptions at Medog (Table 1). The annual NEE values at the stations of Qamdo, SETORS, Mangkam, MAWORS and NADORS all smaller than −120 g C, coincident with stations with higher ET annual values, suggesting the significance of water-carbon coupling in land–atmosphere interaction process. At stations of Shuanghu, Burang, Jyirong, the annual NEE values are between −50 and −100 g C and the rest stations of Nyima and Mangai have annual NEE values of close to carbon neutral. At Medog, despite substantial carbon absorption during the daytime, remarkable carbon release at night caused by soil respiration leads to large carbon release. Mangai, with sparse vegetation, functions nearly as carbon neutral. An obvious drastic variation of NEE values during August at Gyirong station can be found and it corresponds to a soil drought event caused by water deficit. The water deficit event results in decrease in NEE and LE and obvious increase in Ts and SH. Notably, carbon absorption primarily occurs during summer growing seasons of May to September and function as carbon neutral during winter seasons. The spatial distribution of annual NEE values generally follow the distribution of water conditions, where sufficient water can promote vegetation growth, allowing photosynthesis to absorb more CO2 than respiration releases (Wang et al., 2021, 2023).
Global forests have been widely recognized as carbon sinks (Hubau et al., 2020; Pan et al., 2024). Medog station, located in the Yarlung Zangbo River valley, is surrounded by subtropical forests and has an annual NEE value of 365 g C, indicating that the land cover acts as an obvious carbon source. Studies have indicated that tropical forests can become carbon sources due to factors such as deforestation, soil respiration exceeding photosynthesis, lingering droughts, and extreme warming (Gatti et al., 2021; Mills et al., 2023; Xie et al., 2016). During a severe drought in the summer of 2013 in a subtropical forest in China, the ecosystem switched to a net carbon source by late August (Xie et al., 2016). Mills et al. (2023) reported that tropical forests, following deforestation and degradation, can shift from carbon sinks to carbon sources. Similarly, the Medog station, located in a hot and humid region with complex terrain, has experienced recent site disturbance associated with station construction in the southern area, leading to partial vegetation removal and soil exposure. These disturbances likely enhanced soil and microbial respiration, resulting in net carbon release. Moreover, topographic shading caused by surrounding steep terrain reduces solar radiation exposure, thereby constraining photosynthesis (Wang et al., 2021, 2023). The pronounced seasonal variation in GPP at this site (Fig. 6) is mainly driven by monsoonal climatic conditions – GPP peaks during the warm and moist summer months when radiation and temperature are favorable but declines markedly during the cooler and cloudier pre- and post-monsoon periods (Fig. S6). Although NEE values can be obviously negative during the daytime due to photosynthesis, obvious and long-lasting ecosystem respiration at night leads to a net carbon release (Fig. S6).
Across the TP, carbon fluxes exhibit clear spatial and seasonal variability linked to vegetation cover and water availability. Stations with abundant precipitation or shallow groundwater act as strong carbon sinks, e.g. SETORS, NADORS, while arid sites such as Mangai and Nyima remain nearly carbon neutral. In contrast, the Medog station functions as a carbon source, likely due to vegetation disturbance, soil respiration, and complex topographic and climatic conditions that limit photosynthetic uptake.
The hourly dataset including air temperature, air humidity, wind speed, land surface temperature, soil moisture, downward shortwave radiation, downward longwave radiation, upward shortwave radiation, upward longwave radiation, sensible heat flux, latent heat flux, Net ecosystem change can be downloaded freely in the Tibetan Plateau Data Center. The DOI of the dataset is https://doi.org/10.11888/Atmos.tpdc.302428. The data can be referenced by Wang and Ma (2025). The web link is https://data.tpdc.ac.cn/en/disallow/e8032ff8-2437-4363-876f-2af4e4558a4d (last access: 8 February 2026). New collected data will be properly processed and added to this web link in the Tibetan Plateau Data Center.
The establishment of a comprehensive observation and research platform marks a remarkable advancement in understanding land–atmosphere water, heat and CO2 flux across diverse stations. The platform features standardized configurations at each station, including an EC system, a 20 m PBL tower measuring wind, temperature, and humidity across five layers, soil moisture and temperature probes at five depths, energy budget probes for radiation components and soil heat flux, a thermal infrared temperature probe, a barometer, and a rain gauge. It covers a range of landscapes such as alpine steppe, alpine meadow, grassland, bare ground, forest, and desert. The observation platform aims to provide long-term, standardized, high-quality data on land–atmosphere interaction processes over the TP, with a particular focus on the data-scarce regions of the western TP. The extensive hydrometeorological dataset offers initial insights into the spatial and temporal variations of meteorological conditions, liquid precipitation, and turbulent fluxes. Diurnal precipitation patterns reveal three types: peak at night, peak during the day, and bimodal peaks. While liquid precipitation can distinguish between water-limited and energy-limited regions, soil moisture – both from surface and deeper layers – also plays a key role in ET, as seen in stations like NADORS and Shuanghu. NEE fluxes are near zero at bare ground stations, show notable carbon release in forested areas under construction, and function as carbon sinks in most alpine meadows and alpine steppe sites. This platform is critical for supporting scientific research and sustainable development. However, challenges remain in capturing data from remote and heterogeneous regions, as well as limitations in current technologies. Scaling flux towers for global models remains difficult, highlighting the need for robust interpolation and validation techniques. Additionally, further investigation is required to understand the impacts of land-use changes, such as deforestation and reforestation, on turbulent heat fluxes and their feedback to the climate system.
The supplement related to this article is available online at https://doi.org/10.5194/essd-18-1147-2026-supplement.
BW and YM jointly led the writing of this article and were responsible for the establishment and maintenance of the experimental sites and instrumentation. BW took the lead in dataset consolidation, processed the data into the standardized format described in this study, and drafted the manuscript in collaboration with all co-authors. ZH, XL, WM, XC, CH, ZX, YW, ML, BM, XS, WL, and ZC contributed to the maintenance of the observation systems, data analysis, and provided critical feedback and revisions to the manuscript.
The contact author has declared that none of the authors has any competing interests.
Publisher's note: Copernicus Publications remains neutral with regard to jurisdictional claims made in the text, published maps, institutional affiliations, or any other geographical representation in this paper. The authors bear the ultimate responsibility for providing appropriate place names. Views expressed in the text are those of the authors and do not necessarily reflect the views of the publisher.
This research was jointly funded by the National Key Research and Development Program of China (2023YFF0805300), the National Natural Science Foundation of China (grant nos. U2442213 and 42230610), the Youth Innovation Promotion Association of the Chinese Academy of Sciences (grant no. 2022069), the Second Tibetan Plateau Scientific Expedition and Research Program (grant no. 2019QZKK0103).
This research has been supported by the National Key Research and Development Program of China (grant no. 2023YFF0805300), the National Natural Science Foundation of China (grant nos. U2442213 and 42230610), and the Youth Innovation Promotion Association of the Chinese Academy of Sciences (grant no. 2022069).
This paper was edited by Graciela Raga and reviewed by two anonymous referees.
André, J. C., Goutorbe, J. P., and Perrier, A.: HAPEX – MOBILHY: A Hydrologic Atmospheric Experiment the Study of Water Budget and Evaporation Flux at the Climatic Scale, Bulletin of the American Meteorological Society, 67, 138–144, https://doi.org/10.1175/1520-0477-67.2.138, 1986.
Baldocchi, D.: Measuring fluxes of trace gases and energy between ecosystems and the atmosphere – the state and future of the eddy covariance method, Global Change Biology, 20, 3600–3609, https://doi.org/10.1111/gcb.12649, 2014.
Bei, N., Zhao, L., Wu, J., Li, X., Feng, T., and Li, G.: Impacts of sea-land and mountain-valley circulations on the air pollution in Beijing-Tianjin-Hebei (BTH): A case study, Environmental Pollution, 234, 429–438, https://doi.org/10.1016/j.envpol.2017.11.066, 2018.
Chen, X., Cao, D., Liu, Y., Xu, X., and Ma, Y.: An observational view of rainfall characteristics and evaluation of ERA5 diurnal cycle in the Yarlung Tsangbo Grand Canyon, China, Quarterly Journal of the Royal Meteorological Society, 149, 1459–1472, https://doi.org/10.1002/qj.4468, 2023.
Duan, A. and Xiao, Z.: Does the climate warming hiatus exist over the Tibetan Plateau?, Scientific Reports, 5, 13711, https://doi.org/10.1038/srep13711, 2015.
Foken, T.: The energy balance closure problem: An overview, Ecological Applications, 18, 1351–1367, https://doi.org/10.1890/06-0922.1, 2008.
Friedlingstein, P., O'Sullivan, M., Jones, M. W., Andrew, R. M., Gregor, L., Hauck, J., Le Quéré, C., Luijkx, I. T., Olsen, A., Peters, G. P., Peters, W., Pongratz, J., Schwingshackl, C., Sitch, S., Canadell, J. G., Ciais, P., Jackson, R. B., Alin, S. R., Alkama, R., Arneth, A., Arora, V. K., Bates, N. R., Becker, M., Bellouin, N., Bittig, H. C., Bopp, L., Chevallier, F., Chini, L. P., Cronin, M., Evans, W., Falk, S., Feely, R. A., Gasser, T., Gehlen, M., Gkritzalis, T., Gloege, L., Grassi, G., Gruber, N., Gürses, Ö., Harris, I., Hefner, M., Houghton, R. A., Hurtt, G. C., Iida, Y., Ilyina, T., Jain, A. K., Jersild, A., Kadono, K., Kato, E., Kennedy, D., Klein Goldewijk, K., Knauer, J., Korsbakken, J. I., Landschützer, P., Lefèvre, N., Lindsay, K., Liu, J., Liu, Z., Marland, G., Mayot, N., McGrath, M. J., Metzl, N., Monacci, N. M., Munro, D. R., Nakaoka, S.-I., Niwa, Y., O'Brien, K., Ono, T., Palmer, P. I., Pan, N., Pierrot, D., Pocock, K., Poulter, B., Resplandy, L., Robertson, E., Rödenbeck, C., Rodriguez, C., Rosan, T. M., Schwinger, J., Séférian, R., Shutler, J. D., Skjelvan, I., Steinhoff, T., Sun, Q., Sutton, A. J., Sweeney, C., Takao, S., Tanhua, T., Tans, P. P., Tian, X., Tian, H., Tilbrook, B., Tsujino, H., Tubiello, F., van der Werf, G. R., Walker, A. P., Wanninkhof, R., Whitehead, C., Willstrand Wranne, A., Wright, R., Yuan, W., Yue, C., Yue, X., Zaehle, S., Zeng, J., and Zheng, B.: Global Carbon Budget 2022, Earth Syst. Sci. Data, 14, 4811–4900, https://doi.org/10.5194/essd-14-4811-2022, 2022.
Gatti, L. V., Basso, L. S., Miller, J. B., Gloor, M., Gatti Domingues, L., Cassol, H. L. G., Tejada, G., Aragão, L. E. O. C., Nobre, C., Peters, W., Marani, L., Arai, E., Sanches, A. H., Corrêa, S. M., Anderson, L., von Randow, C., Correia, C. S. C., Crispim, S. P., and Neves, R. A. L.: Amazonia as a carbon source linked to deforestation and climate change, Nature, 595, 388–393, https://doi.org/10.1038/s41586-021-03629-6, 2021.
Gentine, P., Massmann, A., Lintner, B. R., Hamed Alemohammad, S., Fu, R., Green, J. K., Kennedy, D., and Vilà-Guerau de Arellano, J.: Land–atmosphere interactions in the tropics – a review, Hydrol. Earth Syst. Sci., 23, 4171–4197, https://doi.org/10.5194/hess-23-4171-2019, 2019.
Gerken, T., Biermann, T., Babel, W., Herzog, M., Ma, Y., Foken, T., and Graf, H. F.: A modelling investigation into lake-breeze development and convection triggering in the Nam Co Lake basin, Tibetan Plateau, Theoretical and Applied Climatology, 117, 149–167, https://doi.org/10.1007/s00704-013-0987-9, 2014.
Goutorbe, J. P., Lebel, T., Dolman, A. J., Gash, J. H. C., Kabat, P., Kerr, Y. H., Monteny, B., Prince, S. D., Stricker, J. N. M., Tinga, A., and Wallace, J. S.: An overview of HAPEX-Sahel: a study in climate and desertification, Journal of Hydrology, 188–189, 4–17, https://doi.org/10.1016/S0022-1694(96)03308-2, 1997.
Halldin, S., Gryning, S. E., Gottschalk, L., Jochum, A., Lundin, L. C., and Van de Griend, A. A.: Energy, water and carbon exchange in a boreal forest landscape – NOPEX experiences, Agricultural and Forest Meteorology, 98–99, 5–29, https://doi.org/10.1016/S0168-1923(99)00148-3, 1999.
Huang, J., Zhou, X., Wu, G., Xu, X., Zhao, Q., Liu, Y., Duan, A., Xie, Y., Ma, Y., Zhao, P., Yang, S., Yang, K., Yang, H., Bian, J., Fu, Y., Ge, J., Liu, Y., Wu, Q., Yu, H., Wang, B., Bao, Q., and Qie, K.: Global Climate Impacts of Land-Surface and Atmospheric Processes Over the Tibetan Plateau, Reviews of Geophysics, 61, e2022RG000771, https://doi.org/10.1029/2022RG000771, 2023.
Hubau, W., Lewis, S. L., Phillips, O. L., Affum-Baffoe, K., Beeckman, H., Cuní-Sanchez, A., Daniels, A. K., Ewango, C. E. N., Fauset, S., Mukinzi, J. M., Sheil, D., Sonké, B., Sullivan, M. J. P., Sunderland, T. C. H., Taedoumg, H., Thomas, S. C., White, L. J. T., Abernethy, K. A., Adu-Bredu, S., Amani, C. A., Baker, T. R., Banin, L. F., Baya, F., Begne, S. K., Bennett, A. C., Benedet, F., Bitariho, R., Bocko, Y. E., Boeckx, P., Boundja, P., Brienen, R. J. W., Brncic, T., Chezeaux, E., Chuyong, G. B., Clark, C. J., Collins, M., Comiskey, J. A., Coomes, D. A., Dargie, G. C., de Haulleville, T., Djuikouo Kamdem, M. N., Doucet, J. L., Esquivel-Muelbert, A., Feldpausch, T. R., Fofanah, A., Foli, E. G., Gilpin, M., Gloor, E., Gonmadje, C., Gourlet-Fleury, S., Hall, J. S., Hamilton, A. C., Harris, D. J., Hart, T. B., Hockemba, M. B. N., Hladik, A., Ifo, S. A., Jeffery, K. J., Jucker, T., Yakusu, E. K., Kearsley, E., Kenfack, D., Koch, A., Leal, M. E., Levesley, A., Lindsell, J. A., Lisingo, J., Lopez-Gonzalez, G., Lovett, J. C., Makana, J. R., Malhi, Y., Marshall, A. R., Martin, J., Martin, E. H., Mbayu, F. M., Medjibe, V. P., Mihindou, V., Mitchard, E. T. A., Moore, S., Munishi, P. K. T., Bengone, N. N., Ojo, L., Ondo, F. E., Peh, K. S. H., Pickavance, G. C., Poulsen, A. D., Poulsen, J. R., Qie, L., Reitsma, J., Rovero, F., Swaine, M. D., Talbot, J., Taplin, J., Taylor, D. M., Thomas, D. W., Toirambe, B., Mukendi, J. T., Tuagben, D., Umunay, P. M., van der Heijden, G. M. F., Verbeeck, H., Vleminckx, J., Willcock, S., Wöll, H., Woods, J. T., and Zemagho, L.: Asynchronous carbon sink saturation in African and Amazonian tropical forests, Nature, 579, 80–87, https://doi.org/10.1038/s41586-020-2035-0, 2020.
Li, G., Yu, Z., Wang, W., Ju, Q., and Chen, X.: Analysis of the spatial Distribution of precipitation and topography with GPM data in the Tibetan Plateau, Atmospheric Research, 247, 105259, https://doi.org/10.1016/j.atmosres.2020.105259, 2021a.
Li, L., Zhang, R., Wu, P., Wen, M., and Duan, J.: Roles of Tibetan Plateau vortices in the heavy rainfall over southwestern China in early July 2018, Atmospheric Research, 245, 105059, https://doi.org/10.1016/j.atmosres.2020.105059, 2020.
Li, P., Furtado, K., Zhou, T., Chen, H., and Li, J.: Convection-permitting modelling improves simulated precipitation over the central and eastern Tibetan Plateau, Quarterly Journal of the Royal Meteorological Society, 147, 341–362, https://doi.org/10.1002/qj.3921, 2021b.
Liu, S., Li, X., Xu, Z., Che, T., Xiao, Q., Ma, M., Liu, Q., Jin, R., Guo, J., Wang, L., Wang, W., Qi, Y., Li, H., Xu, T., Ran, Y., Hu, X., Shi, S., Zhu, Z., Tan, J., Zhang, Y., and Ren, Z.: The Heihe Integrated Observatory Network: A Basin-Scale Land Surface Processes Observatory in China, Vadose Zone Journal, 17, 180072, https://doi.org/10.2136/vzj2018.04.0072, 2018.
Lü, D., Chen, Z., Wang, G., Chen, J., Ji, J., Li, Y., and Chen, H.: Inner Mongolia Semi-Arid Grassland Soil-Vegetation-Atmosphere Interaction, Climatic and Environmental Research, 2, 199–209, https://doi.org/10.3878/j.issn.1006-9585.1997.03.01, 1997.
Ma, N. and Zhang, Y.: Increasing Tibetan Plateau terrestrial evapotranspiration primarily driven by precipitation, Agricultural and Forest Meteorology, 317, 108887, https://doi.org/10.1016/j.agrformet.2022.108887, 2022.
Ma, Y., Fan, S., Ishikawa, H., Tsukamoto, O., Yao, T., Koike, T., Zuo, H., Hu, Z., and Su, Z.: Diurnal and inter-monthly variation of land surface heat fluxes over the central Tibetan Plateau area, Theoretical and Applied Climatology, 80, 259–273, https://doi.org/10.1007/s00704-004-0104-1, 2005.
Ma, Y., Kang, S., Zhu, L., Xu, B., Tian, L., and Yao, T.: Tibetan observation and research platform: Atmosphere-Land Interaction over a Heterogeneous Landscape, Bulletin of the American Meteorological Society, 89, 1487–1492, 2008.
Ma, Y., Wang, Y., and Han, C.: Regionalization of land surface heat fluxes over the heterogeneous landscape: from the Tibetan Plateau to the Third Pole region, International Journal of Remote Sensing, 39, 5872–5890, https://doi.org/10.1080/01431161.2018.1508923, 2018.
Ma, Y., Hu, Z., Xie, Z., Ma, W., Wang, B., Chen, X., Li, M., Zhong, L., Sun, F., Gu, L., Han, C., Zhang, L., Liu, X., Ding, Z., Sun, G., Wang, S., Wang, Y., and Wang, Z.: A long-term (2005–2016) dataset of hourly integrated land–atmosphere interaction observations on the Tibetan Plateau, Earth Syst. Sci. Data, 12, 2937–2957, https://doi.org/10.5194/essd-12-2937-2020, 2020.
Ma, Y., Yao, T., Zhong, L., Wang, B., Xu, X., Hu, Z., Ma, W., Sun, F., Han, C., Li, M., Chen, X., Wang, J., Li, Y., Gu, L., Xie, Z., Liu, L., Sun, G., Wang, S., Zhou, D., Zuo, H., and Wang, Z.: Comprehensive study of energy and water exchange over the Tibetan Plateau: A review and perspective: From GAME/Tibet and CAMP/Tibet to TORP, TPEORP, and TPEITORP, Earth-Science Reviews, 237, 104312, https://doi.org/10.1016/j.earscirev.2023.104312, 2023.
Ma, Y., Xie, Z., Chen, Y., Liu, S., Che, T., Xu, Z., Shang, L., He, X., Meng, X., Ma, W., Xu, B., Zhao, H., Wang, J., Wu, G., and Li, X.: Dataset of spatially extensive long-term quality-assured land–atmosphere interactions over the Tibetan Plateau, Earth Syst. Sci. Data, 16, 3017–3043, https://doi.org/10.5194/essd-16-3017-2024, 2024.
Massman, W. J. and Lee, X.: Eddy covariance flux corrections and uncertainties in long-term studies of carbon and energy exchanges, Agricultural and Forest Meteorology, 113, 121–144, https://doi.org/10.1016/S0168-1923(02)00105-3, 2002.
Mauder, M. and Foken, T.: Impact of post-field data processing on eddy covariance flux estimates and energy balance closure, Meteorologische Zeitschrift, 15, 597–609, https://doi.org/10.1127/0941-2948/2006/0167, 2006.
Mauder, M., Cuntz, M., Drüe, C., Graf, A., Rebmann, C., Schmid, H. P., Schmidt, M., and Steinbrecher, R.: A strategy for quality and uncertainty assessment of long-term eddy-covariance measurements, Agricultural and Forest Meteorology, 169, 122–135, https://doi.org/10.1016/j.agrformet.2012.09.006, 2013.
Mauder, M., Foken, T., and Cuxart, J.: Surface-Energy-Balance Closure over Land: A Review, Boundary-Layer Meteorology, 177, 395–426, https://doi.org/10.1007/s10546-020-00529-6, 2020.
Mills, M. B., Malhi, Y., Ewers, R. M., Kho, L. K., Teh, Y. A., Both, S., Burslem, D. F. R. P., Majalap, N., Nilus, R., Huasco, W. H., Cruz, R., Pillco, M. M., Turner, E. C., Reynolds, G., and Riutta, T.: Tropical forests post-logging are a persistent net carbon source to the atmosphere, Proceedings of the National Academy of Sciences, 120, e2214462120, https://doi.org/10.1073/pnas.2214462120, 2023.
Oku, Y., Ishikawa, H., Haginoya, S., and Ma, Y.: Recent Trends in Land Surface Temperature on the Tibetan Plateau, Journal of Climate, 19, 2995–3003, https://doi.org/10.1175/JCLI3811.1, 2006.
Pan, Y., Birdsey, R. A., Phillips, O. L., Houghton, R. A., Fang, J., Kauppi, P. E., Keith, H., Kurz, W. A., Ito, A., Lewis, S. L., Nabuurs, G. J., Shvidenko, A., Hashimoto, S., Lerink, B., Schepaschenko, D., Castanho, A., and Murdiyarso, D.: The enduring world forest carbon sink, Nature, 631, 563–569, https://doi.org/10.1038/s41586-024-07602-x, 2024.
Qi, Y., Wei, D., Zhao, H., and Wang, X.: Carbon Sink of a Very High Marshland on the Tibetan Plateau, Journal of Geophysical Research: Biogeosciences, 126, e2020JG006235, https://doi.org/10.1029/2020JG006235, 2021.
Santanello Jr., J. A., Dirmeyer, P. A., Ferguson, C. R., Findell, K. L., Tawfik, A. B., Berg, A., Ek, M., Gentine, P., Guillod, B. P., van Heerwaarden, C., Roundy, J., and Wulfmeyer, V.: Land–Atmosphere Interactions: The LoCo Perspective, Bulletin of the American Meteorological Society, 99, 1253–1272, https://doi.org/10.1175/BAMS-D-17-0001.1, 2018.
Sellers, P., Hall, F., Margolis, H., Kelly, B., Baldocchi, D., den Hartog, G., Cihlar, J., Ryan, M. G., Goodison, B., Crill, P., Ranson, K. J., Lettenmaier, D., and Wickland, D. E.: The Boreal Ecosystem–Atmosphere Study (BOREAS): An Overview and Early Results from the 1994 Field Year, Bulletin of the American Meteorological Society, 76, 1549–1577, https://doi.org/10.1175/1520-0477(1995)076<1549:TBESAO>2.0.CO;2, 1995.
Sellers, P. J., Hall, F. G., Asrar, G., Strebel, D. E., and Murphy, R. E.: An overview of the First International Satellite Land Surface Climatology Project (ISLSCP) Field Experiment (FIFE), Journal of Geophysical Research: Atmospheres, 97, 18345–18371, https://doi.org/10.1029/92JD02111, 1992.
Seo, Y.-W. and Ha, K.-J.: Changes in land–atmosphere coupling increase compound drought and heatwaves over northern East Asia, npj Climate and Atmospheric Science, 5, 100, https://doi.org/10.1038/s41612-022-00325-8, 2022.
Suni, T., Guenther, A., Hansson, H. C., Kulmala, M., Andreae, M. O., Arneth, A., Artaxo, P., Blyth, E., Brus, M., Ganzeveld, L., Kabat, P., de Noblet-Ducoudré, N., Reichstein, M., Reissell, A., Rosenfeld, D., and Seneviratne, S.: The significance of land–atmosphere interactions in the Earth system – iLEAPS achievements and perspectives, Anthropocene, 12, 69–84, https://doi.org/10.1016/j.ancene.2015.12.001, 2015.
Turetsky, M. R., Abbott, B. W., Jones, M. C., Anthony, K. W., Olefeldt, D., Schuur, E. A. G., Grosse, G., Kuhry, P., Hugelius, G., Koven, C., Lawrence, D. M., Gibson, C., Sannel, A. B. K., and McGuire, A. D.: Carbon release through abrupt permafrost thaw, Nature Geoscience, 13, 138–143, https://doi.org/10.1038/s41561-019-0526-0, 2020.
Twine, T. E., Kustas, W. P., Norman, J. M., Cook, D. R., Houser, P. R., Meyers, T. P., Prueger, J. H., Starks, P. J., and Wesely, M. L.: Correcting eddy-covariance flux underestimates over a grassland, Agricultural and Forest Meteorology, 103, 279–300, https://doi.org/10.1016/S0168-1923(00)00123-4, 2000.
Wang, B. and Ma, Y.: Meteorological variables and eddy fluxes at 15 land–atmosphere interaction stations over the Tibetan Plateau (May 2021 to July 2023), National Tibetan Plateau/Third Pole Environment Data Center [data set], https://doi.org/10.11888/Atmos.tpdc.302428, 2025.
Wang, B., Ma, Y., Ma, W., and Su, Z.: Physical controls on half-hourly, daily, and monthly turbulent flux and energy budget over a high-altitude small lake on the Tibetan Plateau, Journal of Geophysical Research: Atmospheres, 122, 2289–2303, https://doi.org/10.1002/2016JD026109, 2017.
Wang, S. and Ma, Y.: Characteristics of Land-Atmosphere Interaction Parameters over the Tibetan Plateau, Journal of Hydrometeorology, 12, 702–708, https://doi.org/10.1175/2010JHM1275.1, 2011.
Wang, Y., Xiao, J., Ma, Y., Luo, Y., Hu, Z., Li, F., Li, Y., Gu, L., Li, Z., and Yuan, L.: Carbon fluxes and environmental controls across different alpine grassland types on the Tibetan Plateau, Agricultural and Forest Meteorology, 311, 108694, https://doi.org/10.1016/j.agrformet.2021.108694, 2021.
Wang, Y., Xiao, J., Ma, Y., Ding, J., Chen, X., Ding, Z., and Luo, Y.: Persistent and enhanced carbon sequestration capacity of alpine grasslands on Earth's Third Pole, Science Advances, 9, https://doi.org/10.1126/sciadv.ade6875, 2023.
Wei, D., Qi, Y., Ma, Y., Wang, X., Ma, W., Gao, T., Huang, L., Zhao, H., Zhang, J., and Wang, X.: Plant uptake of CO2 outpaces losses from permafrost and plant respiration on the Tibetan Plateau, Proceedings of the National Academy of Sciences, 118, e2015283118, https://doi.org/10.1073/pnas.2015283118, 2021.
Wilson, K., Goldstein, A., Falge, E., Aubinet, M., Baldocchi, D., Berbigier, P., Bernhofer, C., Ceulemans, R., Dolman, H., Field, C., Grelle, A., Ibrom, A., Law, B. E., Kowalski, A., Meyers, T., Moncrieff, J., Monson, R., Oechel, W., Tenhunen, J., Valentini, R., and Verma, S.: Energy balance closure at FLUXNET sites, Agricultural and Forest Meteorology, 113, 223–243, https://doi.org/10.1016/S0168-1923(02)00109-0, 2002.
Wu, G. and Zhang, Y.: Tibetan Plateau Forcing and the Timing of the Monsoon Onset over South Asia and the South China Sea, Monthly Weather Review, 126, 913–927, https://doi.org/10.1175/1520-0493(1998)126<0913:TPFATT>2.0.CO;2, 1998.
Wu, G., Zhou, X., Xu, X., Huang, J., Duan, A., Yang, S., Hu, W., Ma, Y., Liu, Y., Bian, J., Fu, Y., Yang, H., Zhao, P., Zhong, L., and Ma, W.: An Integrated Research Plan for the Tibetan Plateau Land–Air Coupled System and Its Impacts on the Global Climate, Bulletin of the American Meteorological Society, 104, E158–E177, https://doi.org/10.1175/BAMS-D-21-0293.1, 2023.
Wutzler, T., Lucas-Moffat, A., Migliavacca, M., Knauer, J., Sickel, K., Šigut, L., Menzer, O., and Reichstein, M.: Basic and extensible post-processing of eddy covariance flux data with REddyProc, Biogeosciences, 15, 5015–5030, https://doi.org/10.5194/bg-15-5015-2018, 2018.
Xie, Z., Wang, L., Jia, B., and Yuan, X.: Measuring and modeling the impact of a severe drought on terrestrial ecosystem CO2 and water fluxes in a subtropical forest, Journal of Geophysical Research: Biogeosciences, 121, 2576–2587, https://doi.org/10.1002/2016JG003437, 2016.
Xu, X. and Chen, L.: Advances of the Study on Tibetan Plateau Experiment of Atmospheric Sciences, Journal of Applied Meteorological Science, 17, 756–772, https://doi.org/10.11898/1001-7313.20060613, 2006.
Yang, K., Koike, T., Ishikawa, H., Kim, J., Li, X., Liu, H., Liu, S., Ma, Y., and Wang, J.: Turbulent Flux Transfer over Bare-Soil Surfaces: Characteristics and Parameterization, Journal of Applied Meteorology and Climatology, 47, 276–290, https://doi.org/10.1175/2007JAMC1547.1, 2008.
Yang, K., Chen, Y., Lazhu, Zhan, C., Ling, X., Zhou, X., Jiang, Y., Yao, X., Lu, H., Ma, X., Ouyang, L., Pan, W., Ren, Y., Shao, C., Tian, J., Wang, Y., Yang, H., Yue, S., Zhang, K., Zhao, D., Zhao, L., Zhou, J., and Zou, M.: Cross-sectional rainfall observation on the central-western Tibetan Plateau in the warm season: System design and preliminary results, Science China Earth Sciences, 66, 1015–1030, https://doi.org/10.1007/s11430-022-1081-4, 2023.
Yao, N., Ma, Y., Wang, B., Zou, J., Sun, J., and Xie, Z.: A comparative study of the land–atmosphere energy and water exchanges over the Tibetan Plateau and the Yangtze River Region, Atmospheric and Oceanic Science Letters, 17, 100447, https://doi.org/10.1016/j.aosl.2023.100447, 2024.
Ye, D. and Wu, G.: The role of the heat source of the Tibetan Plateau in the general circulation, Meteorology and Atmospheric Physics, 67, 181–198, https://doi.org/10.1007/BF01277509, 1998.
Yu, G., Chen, Z., and Wang, Y.: Carbon, water and energy fluxes of terrestrial ecosystems in China, Agricultural and Forest Meteorology, 346, 109890, https://doi.org/10.1016/j.agrformet.2024.109890, 2024.
Yuan, L., Ma, Y., Chen, X., Wang, Y., and Li, Z.: An Enhanced MOD16 Evapotranspiration Model for the Tibetan Plateau During the Unfrozen Season, Journal of Geophysical Research: Atmospheres, 126, https://doi.org/10.1029/2020JD032787, 2021.
Yuan, L., Chen, X., Ma, Y., Han, C., Wang, B., and Ma, W.: Long-term monthly 0.05° terrestrial evapotranspiration dataset (1982–2018) for the Tibetan Plateau, Earth Syst. Sci. Data, 16, 775–801, https://doi.org/10.5194/essd-16-775-2024, 2024.
Zhang, C., Qin, D.-H., and Zhai, P.-M.: Amplification of warming on the Tibetan Plateau, Advances in Climate Change Research, 14, 493–501, https://doi.org/10.1016/j.accre.2023.07.004, 2023.
Zhang, Y., Wagner, N., Goergen, K., and Kollet, S.: Summer evapotranspiration-cloud feedbacks in land–atmosphere interactions over Europe, Climate Dynamics, 62, 10767–10783, https://doi.org/10.1007/s00382-024-07475-w, 2024.
Zhao, L., Li, Y., Zhao, X., Xu, S., Tang, Y., Yu, G., Gu, S., Du, M., and Wang, Q.: Comparative study of the net exchange of CO2 in 3 types of vegetation ecosystems on the Qinghai-Tibetan Plateau, Chinese Science Bulletin, 50, 1767–1774, https://doi.org/10.1360/04wd0316, 2005.
Zhong, L., Ma, Y., Hu, Z., Fu, Y., Hu, Y., Wang, X., Cheng, M., and Ge, N.: Estimation of hourly land surface heat fluxes over the Tibetan Plateau by the combined use of geostationary and polar-orbiting satellites, Atmos. Chem. Phys., 19, 5529–5541, https://doi.org/10.5194/acp-19-5529-2019, 2019.
Zhu, L., Meng, Z., Zhang, F., and Markowski, P. M.: The influence of sea- and land-breeze circulations on the diurnal variability in precipitation over a tropical island, Atmos. Chem. Phys., 17, 13213–13232, https://doi.org/10.5194/acp-17-13213-2017, 2017.