the Creative Commons Attribution 4.0 License.
the Creative Commons Attribution 4.0 License.
High-resolution mapping of global winter-triticeae crops using a sample-free identification method
Yangyang Fu
Xiuzhi Chen
Chaoqing Song
Xiaojuan Huang
Jie Dong
Qiongyan Peng
Wenping Yuan
Winter-triticeae crops, such as winter wheat, winter barley, winter rye and triticale, are important in human diets and are planted worldwide, and thus accurate spatial distribution information on winter-triticeae crops is crucial for monitoring crop production and food security. However, there is still a lack of global high-resolution maps of winter-triticeae crops because of the reliance of existing crop mapping methods on training samples, which limits their application at the global scale. In this study, we propose a new method based on the Winter-Triticeae Crops Index (WTCI) for global winter-triticeae crop mapping. This is a new sample-free method for identifying winter-triticeae crops based on differences in their normalized difference vegetation index (NDVI) characteristics from the heading to harvesting stages and those of other types of vegetation. We considered state (or province) or country to be an identification unit and employed the WTCI to produce the first global 30 m resolution distribution maps of winter-triticeae crops from 2017 to 2022 using Landsat and Sentinel images. Validation using field survey samples and visual interpretation samples from Google Earth images indicated that the method exhibited satisfying performance and stable spatiotemporal transferability, with producer's accuracy, user's accuracy and overall accuracy values of 81.12 %, 87.85 % and 87.7 %, respectively. Moreover, compared with the Cropland Data Layer (CDL) and EuroCrops datasets, the overall accuracy and F1 score in most regions of the United States and Europe were more than 80 % and 75 %, respectively. The identified area of winter-triticeae crops was consistent with the agricultural statistical area in almost all the investigated countries or regions, and the correlation coefficient (R2) between the identified area and the statistical area was over 0.6, while the relative mean absolute error (RMAE) was less than 30 % in all 6 years. Overall, this study provides a reliable and automatic identification method for winter-triticeae crops without any training samples. The high-resolution distribution maps of global winter-triticeae crops are expected to support multiple agricultural applications. The distribution maps can be obtained at https://doi.org/10.57760/sciencedb.12361 (Fu et al., 2023a).
- Article
(12335 KB) - Full-text XML
-
Supplement
(1486 KB) - BibTeX
- EndNote
Crop mapping can provide detailed locations and can be used to analyze the spatiotemporal dynamics of crops (Skakun et al., 2017). As one of the most important types of grain in the world, the planting area and production of winter-triticeae crops (such as winter wheat, winter barley, winter rye and triticale) in 2020 accounted for approximately 30 % and 41 % of global grain area and production, respectively (https://www.fao.org/faostat/en/#data, last access: 16 June 2023), playing a crucial role in global food production and trade. Closely monitoring the spatial distribution of winter-triticeae crops is therefore beneficial for evaluating yield, optimizing land use and assessing food security (Fu et al., 2021; Nelson and Burchfield, 2021; Wardlow et al., 2007).
Previous studies have mainly focused on mapping winter-triticeae crop distributions in limited regions rather than at the global scale (Gella et al., 2021; Zhang et al., 2019a). Few studies have attempted to produce global triticeae crop maps (You et al., 2014), but efforts have been limited to coarse resolutions. For example, Monfreda et al. (2008) combined census statistics with global cropland data (Ramankutty et al., 2008) to generate a global distribution map of crops (including barley, rye, triticale and wheat) for the year 2000, with a spatial resolution of 10 km. A recent study produced crop harvested area data for 26 crops (including barley and wheat) worldwide at 5 min resolution based on a crop production system (irrigated and rainfed) (Grogan et al., 2022). The coarse spatial resolution of these datasets greatly limits their applications (Luo et al., 2022). The WorldCereal project funded by the European Space Agency (ESA) has released a global crop map with a spatial resolution of 10 m for 2021, addressing the limitations of spatial resolution in global-scale crop mapping (Van Tricht et al., 2023). However, this product is currently only available for 1 year, which will affect the demand for continuous years. At present, the available long-term and high-spatial-resolution distribution maps of winter-triticeae crops are mainly at small or national scales (Dong et al., 2020; Huang et al., 2022; He et al., 2019; Zhang et al., 2019c), with the most well-known being the Cropland Data Layer (CDL) product in the United States, which is updated annually and has an accuracy of greater than 90 % for winter-triticeae crops (Boryan et al., 2011). However, in most countries where winter-triticeae crops are planted widely, such maps are still in short supply. Therefore, it is necessary to produce distribution maps of winter-triticeae crops with high spatial resolution and continuous years for these countries.
The greatest challenge in global crop mapping is the need for substantial field samples for algorithm training. Several methods have been proposed to address this problem when there are only a few or even no ground samples in the target year. Some studies developed a cross-regional classifier transfer method (Macdonald and Hall, 1980; Xu et al., 2020). For example, Ge et al. (2021) combined Landsat images with the CDL production of Arkansas to train a classifier and then assessed the spatial transferability of the classifier in California, USA, and Liaoning, China. Other studies proposed a temporal transfer method to alleviate the limitation of insufficient ground samples, i.e., training a classifier based on historical crop samples and then applying it to a target year (Cai et al., 2018; Konduri et al., 2020; Yaramasu et al., 2020). For example, a previous study used the normalized difference vegetation index (NDVI) features extracted from 2013 crop samples to establish a classification rule and then transferred this rule to identify the crop types for 2011–2013 (Liu et al., 2016). Nevertheless, the accuracy of these methods is relatively low due to the fact that the trained classifier focuses on a specific region and year while neglecting the differences in crop phenology in different regions and across years (Zhang et al., 2019b).
This study aims to develop a new sample-free method, i.e., the Winter-Triticeae Crops Index (WTCI), to identify global winter-triticeae crops based on Landsat 7, Landsat 8, Sentinel-1 and Sentinel-2 satellite data. The main goals are (1) to assess the accuracy and spatiotemporal transferability of the new method using field survey samples and visual interpretation samples from high-resolution images in Google Earth, the CDL dataset, the EuroCrops dataset and agricultural statistical data and (2) to produce 30 m spatial resolution distribution maps of winter-triticeae crops in 66 countries worldwide from 2017 to 2022 to fill such product gaps, providing a database for yield estimation and crop management.
2.1 Study area
The study area covers 66 countries, including 36 European countries, 15 Asian countries, 8 African countries, 2 North American countries, 4 South American countries and 1 country in Oceania (Fig. 1). The harvested area of global triticeae crops (including spring and winter varieties) was 278.87 ×10⁶ ha in 2020 (https://www.fao.org/faostat/en/#data, last access: 16 June 2023), with winter-triticeae crops accounting for about 75 % (i.e., 209.15 ×10⁶ ha) of the global triticeae crops' harvested area (Zhao et al., 2018). According to the statistics of the winter-triticeae crop area provided on the official websites of various countries (Table S1 in the Supplement), the total harvested area of winter-triticeae crops in our study area in 2020 was 207.45 ×10⁶ ha, occupying 99.19 % of the global winter-triticeae crops' harvested area. The study area features an intricate interweaving of plains and mountains, resulting in a complex and varied agricultural landscape and different tillage systems. In addition, the study area has a diverse climate dominated by temperate and subtropical conditions. Winter-triticeae crops are usually sown in the fall of the previous year and harvested in the summer of the following year.
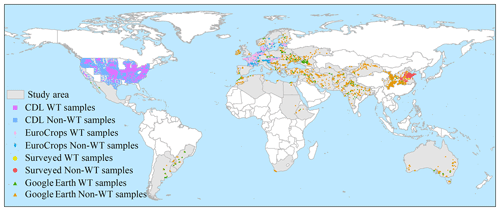
Figure 1Distribution of the study area and the validation samples. The study area is the region covered in grey. The legend indicates the winter-triticeae (WT) crop samples and the non-winter-triticeae (non-WT) crop samples from the Cropland Data Layer (CDL) dataset of the United States, the EuroCrops dataset of Europe, the field survey in China and the visual interpretation base in Google Earth images.
2.2 Data
The data used in this study included (1) reflectance data from Landsat 7, Landsat 8 and Sentinel-2, (2) synthetic aperture radar (SAR) data from Sentinel-1, (3) field survey samples, visual interpretation samples and the CDL and EuroCrops datasets and (4) agricultural statistical data. Reflectance data and SAR data were used to generate winter-triticeae crop maps, field survey samples, visual interpretation samples and the CDL and EuroCrops datasets, and agricultural statistical data were used to assess the performance of the proposed method.
2.2.1 Satellite data
In this study, we used all available Landsat 7 Collection 2 data (USGS Landsat 7 Level 2, Collection 2, Tier 1), Landsat 8 Collection 2 data (USGS Landsat 8 Level 2, Collection 2, Tier 1) and Sentinel-2 data (Harmonized Sentinel-2 MSI: MultiSpectral Instrument, Level-2A) on the Google Earth Engine (GEE) platform to obtain the NDVI from 2016 to 2022, all of which were surface reflectance (SR) products that had undergone atmospheric correction. The SR products of Landsat 7 and Landsat 8 have a spatial resolution of 30 m and a temporal resolution of 16 d. The spatial and temporal resolutions of Sentinel-2 are 10 m and 5 d, respectively. We chose the Landsat 7 satellite to obtain more available data, although there was a malfunction in its scan line corrector. To ensure the data quantity and quality, we first removed the pixels with clouds. The quality band BQA was used to remove pixels with clouds from Landsat 7 and Landsat 8, and the quality band QA60 was used to remove pixels from Sentinel-2 that were contaminated by clouds. Then, based on the nearest-neighbor method, we resampled the NDVI of Sentinel-2 to 30 m to keep the same spatial resolution as the Landsat data. Furthermore, we obtained the NDVI of all the cloud-free pixels and chose the maximum values of monthly composites with 30 m spatial resolution, which has proven effective for mapping crops and displaying crop growing stages (Huang et al., 2022). Finally, we used linear interpolation and the Savitzky–Golay filter method (Chen et al., 2004) to fill in the missing values and smoothen the NDVI series to reduce the contamination from cloud, rain and snow (Zheng et al., 2022). The above processes were run on the GEE platform.
The VH (vertical transmit and horizontal receive) band with 10 m spatial resolution from the SAR of Sentinel-1 was employed to distinguish winter-triticeae crops from other winter crops (e.g., winter rapeseed) (Dong et al., 2020). The data provided on the GEE platform have undergone thermal noise removal, radiometric calibration and terrain correction. We applied a refined Lee filter (Abramov et al., 2017) to alleviate the impact of speckle noise caused by the interferences between adjacent backscatter returns, and finally we obtained the monthly maximum composite values of VH from 2016 to 2022 and resampled them to 30 m using the nearest-neighbor method to retain the consistency with the NDVI. These operations were also run on the GEE platform.
2.2.2 Validation samples
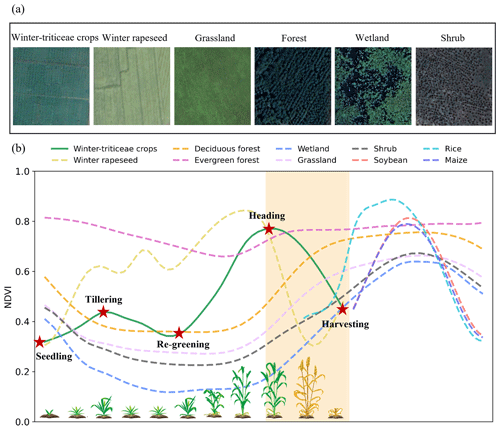
The validation samples were obtained from (1) field surveys, (2) Google Earth images, (3) the CDL dataset and (4) the EuroCrops dataset. We conducted field surveys in Hebei, Henan, Shandong, Anhui and Jiangsu provinces in China in 2019 and 2020. The survey routes were preplanned based on prior knowledge of the spatial distribution of winter-triticeae crops and transportation accessibility. In the fieldwork, we only selected large winter-triticeae crop fields with an area greater than 900 m2, and we used GPS (G120, UniStrong, Beijing, China) (Fu et al., 2023b) to mark the locations inside the fields. For non-winter-triticeae crop samples, we randomly selected large areas of non-winter-triticeae crop fields, forests and grasslands around the preplanned routes and also used GPS to mark their locations. Finally, we processed these samples using ArcMap10.2 to maintain the same spatial projection as the identification map in China, resulting in a total of 3054 winter-triticeae crop samples and 4088 non-winter-triticeae crop samples. For other provinces in China and other countries (except for the USA), we relied on high-resolution images from Google Earth from 2019 to 2020 for visual interpretation, which is a compensatory and effective method when ground truth samples cannot be obtained (Huang et al., 2022; Zheng et al., 2022). We first chose regions with available images during the growing season of winter-triticeae crops (Sect. 2.3.3) and selected samples from these regions based on the texture features and colors. Winter-triticeae crops have deeper colors or stronger textures than winter rapeseed and grassland, and their roughness is lower than that of forest, which can be used to distinguish winter-triticeae crops from other land cover types (Fig. 3a). The images of wetland and shrub show obvious differences from those of winter-triticeae crops. Wetlands have dual characteristics of water and vegetation and do not have regular texture features. Shrubs have lower vegetation coverage and higher graininess. These features make them easy to distinguish from winter-triticeae crops (Fig. 3a). Crops with different growing seasons (such as maize, rice or soybean) will not affect the visual interpretation. To ensure the accuracy of the samples, we then validated the selected samples on the GEE platform by checking whether the NDVI temporal features of these samples matched the characteristics of winter-triticeae crops, and finally we obtained 7029 winter-triticeae crop samples and 8897 non-winter-triticeae crop samples (Fig. 1).
In addition, we used the CDL and EuroCrops datasets to further evaluate the performance of the WTCI method. The CDL product released annually has high accuracy when capturing the crop distribution in the USA and has been used widely as a base map for crop dynamic monitoring and production estimation (Wang et al., 2019; Xu et al., 2023). We thus treated CDL labels as the ground truth to validate the accuracy of our identification map in the USA. Specifically, we first used ArcMap10.2 to randomly select samples from pixels labeled with winter-triticeae crops, including winter wheat, double-crop winter wheat/soybeans, winter wheat/corn, winter wheat/sorghum and winter wheat/cotton. Non-winter-triticeae crop samples were randomly generated in the remaining pixels, including other crop pixels in cultivated and non-cultivated land pixels. Then we converted these samples into the same spatial projection as the identification map in the USA. We finally obtained 7500 winter-triticeae crop samples and 12 500 non-winter-triticeae crop samples in 2020 (Fig. 1). The EuroCrops dataset, supported by the German Space Agency at the DLR on behalf of the Federal Ministry for Economic Affairs and Climate Action (BMWK), combines all publicly available self-declared crop reporting datasets from countries of the European Union. Importantly, this dataset utilizes a new version of Hierarchical Crop and Agriculture Taxonomy (HCAT) to provide a unified hierarchical representation scheme for all crops within the European Union (Schneider et al., 2023a). We collected 10 countries (Austria, Belgium, Germany, Denmark, Estonia, France, the Netherlands, Slovakia, Slovenia and Sweden) with winter-triticeae crops clearly labeled in the EuroCrops dataset, including winter spelt, winter barley, winter durum hard wheat, winter common soft wheat, winter triticale, winter rye and winter oats (https://doi.org/10.5281/zenodo.10118572, Schneider et al., 2023b), and these data cover the period from 2018 to 2021. We converted the polygon file into a point file using ArcMap10.2, randomly extracted winter-triticeae crop samples from the point file labeled with winter-triticeae crops in each country and selected non-winter-triticeae crop samples from other land cover types, such as forest, grassland or other crops. We then transformed the spatial projection of these samples to be consistent with the European identification map and ultimately obtained 2000 winter-triticeae crop samples and 3000 non-winter-triticeae crop samples to assess the result of the WTCI method in Europe (Fig. 1).
2.2.3 Agricultural statistical data
To evaluate the rationality of the spatial distribution of winter-triticeae crop maps produced by the WTCI method, we thus collected the agricultural statistical data of winter-triticeae crops from 2017 to 2022 through the official websites of all the countries (Table S1) to compare their consistency with the identified area. Overall, we obtained the total statistical area data of winter-triticeae crops in each country and the statistical area data at the state, provincial, municipal or county level in 34 countries.
2.3 Method
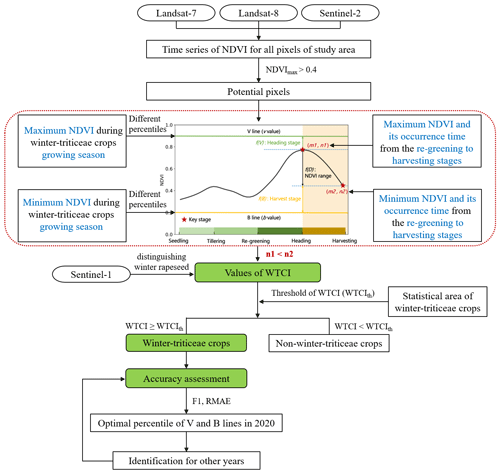
The workflow for identifying winter-triticeae crops (Fig. 2) mainly includes four steps after preprocessing satellite data: (1) selecting pixels with a maximum NDVI value greater than 0.4 during the winter-triticeae crop growing season as potential pixels, (2) developing the WTCI based on the unique characteristics of the NDVI time series of winter-triticeae crops compared with other land cover types, (3) calculating the WTCI values of potential pixels to quantify their similarity to winter-triticeae crops and using their thresholds to obtain the distribution maps of winter-triticeae crops and (4) evaluating the performance of the WTCI method based on validation data.
2.3.1 Time series characteristics of the NDVI for different land cover types
The design of the WTCI is based on the analysis of the NDVI time series for different land cover types. Specifically, we first selected the NDVI time series of each pixel during the growing season (i.e., fall to the summer of the following year) of winter-triticeae crops. Some regional- and global-scale studies have reported that a NDVI greater than 0.4 usually indicates vegetation cover (Ma et al., 2022; Peng et al., 2019; Xu et al., 2023; Yang et al., 2024a, b). Therefore, pixels with a maximum NDVI of greater than 0.4 during the selected growing period were retained as potential pixels. After applying these steps, the main remaining land cover types in the potential pixels were forest, grassland, cultivated land, wetland and shrub.
There are significant differences in the temporal variations of the NDVI between winter-triticeae crops and natural vegetation types (i.e., deciduous forest, evergreen forest, shrub and grassland) as well as wetland during the growing season of winter-triticeae crops (Fig. 3b). Specifically, in the period from the seedling to tillering stages, winter-triticeae crops are in a state of slow growth, with their NDVI increasing gradually. In contrast, natural vegetation types are in the deciduous stage and exhibit a continuous decrease in the NDVI during this period, with wetland also exhibiting similar characteristics (Fig. 3b). From the re-greening to heading stages, the NDVI of winter-triticeae crops rapidly increases and reaches its maximum value, while the increase in the NDVI of natural vegetation types and wetland tends to lag behind that of winter-triticeae crops (Fig. 3b). Furthermore, the NDVI of winter-triticeae crops shows a downward trend and reaches its lowest value during the harvesting stage. However, the NDVI values of natural vegetation and wetland rapidly increase at this time (Fig. 3b). Additionally, except for winter rapeseed, there are significant differences in the growing season of maize, rice and soybean compared to that of winter-triticeae crops. Therefore, these crops will not interfere with the identification of winter-triticeae crops, even if they have similarities to winter-triticeae crops in the NDVI time series characteristics.
Based on the above analysis, there are two periods that can be used to distinguish between winter-triticeae crops and other land cover types, i.e., the seedling to tillering stages and the heading to harvesting stages (Fig. 3b), during which the NDVIs of winter-triticeae crops and other land cover types showed opposite temporal variations. Compared with the period from seedling to tillering, the NDVI characteristics of winter-triticeae crops from the heading to harvesting stages are more stable and more significantly different from those of other land cover types. A previous study on the relatively weak growth and not obvious increase in the NDVI of winter-triticeae crops from the seedling to tillering stages (Wang et al., 2015) further supports our finding. Therefore, this study used the NDVI time series characteristics of winter-triticeae crops from the heading to harvesting stages to design the WTCI.
2.3.2 Development of the winter-triticeae crop index
Based on the comparison of the NDVI time series characteristics of winter-triticeae crops with other land cover types, the unique characteristics of winter-triticeae crops during the growing season can be summarized as (1) the NDVI of winter-triticeae crop peaks at the heading stage close to the maximum value of natural vegetation during its growing season and (2) winter-triticeae crops with low NDVI values during the harvesting stage, when the surface tends to be close to bare land after crop removal. By contrast, the NDVI of natural vegetation approaches its peak in a year. To quantify the above characteristics, this study set an upper boundary to denote vegetation (V line) and a lower boundary to indicate bare land (B line) (Fig. 4). Then, three indicators, i.e., f(D), f(V) and f(B), were constructed to represent the unique NDVI characteristics of winter-triticeae crops from the heading to harvesting stages (Fig. 4), and their integration (i.e., the WTCI) were employed to determine whether the potential pixel is a winter-triticeae crop:
where n1 and n2 represent the times when the maximum and minimum NDVIs appear (Fig. 4). It should be noted that Eq. (1) was only used to identify the winter-triticeae crops when n1<n2. That is, the maximum NDVI should appear before the minimum NDVI.
Specifically, f(D), f(V) and f(B) were designed as follows:
where v and b represent the NDVI corresponding to the V and B lines, respectively. m1 and m2 represent the maximum and minimum NDVIs of the potential pixels from the heading to harvesting stages (Fig. 4), respectively. f(D) quantifies the proximity of the range of NDVI variation between the potential pixels and that of winter-triticeae crops. Given a pixel with D (i.e., m1−m2) closer to the value of v−b, the higher the value of f(D), the higher the likelihood that it will represent a winter-triticeae crop. f(V) quantifies the proximity of the maximum NDVI (m1) of the potential pixels to that of vegetation. The pixels closer to the V line in the n1 period (i.e., m1 approaches v) are more likely to be winter-triticeae crops. Additionally, f(B) quantifies the proximity of the minimum NDVI (m2) of the potential pixels to that of bare land. Pixels closer to the B line in the n2 period (i.e., m2 approaches b) have a greater likelihood of being winter-triticeae crops. The algorithms of f(D), f(V) and f(B) reported by Xu et al. (2023) were used in this study.
Winter-triticeae crops should simultaneously have all three of the above characteristics, which means that the WTCI should be designed to integrate these three indicators. The values of f(D), f(V) and f(B) range from 0 to 1. Therefore, the WTCI varies between 0 and 1, and pixels with a higher WTCI have a greater probability of being winter-triticeae crops. In addition, this study uses the agricultural statistical area of winter-triticeae crops to determine the threshold of the WTCI. The potential pixels (N) with high WTCI values are considered winter-triticeae crops in a given identification unit, and the total area of all the N potential pixels should be equal to the agricultural statistical area of the identification unit.
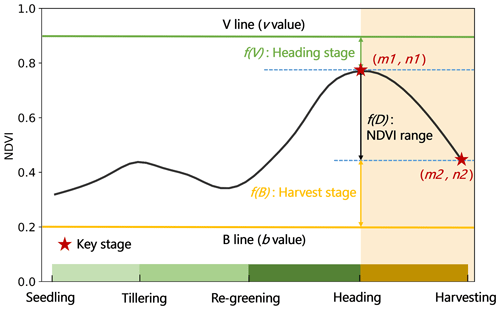
Figure 4Characteristics of the NDVI time series for designing the Winter-Triticeae Crops Index. The black solid line represents the NDVI time series of winter-triticeae crops. The green and orange solid lines represent the V line and the B line, respectively. The red five-pointed stars indicate the heading and harvesting stages of winter-triticeae crops. m1 and n1 represent the maximum value of the NDVI and the time when the maximum value occurs during the study period. m2 and n2 represent the minimum value of the NDVI and the time when the minimum value occurs during the study period.
2.3.3 WTCI-based winter-triticeae crop identification
In this study, we considered each state (or province) to be an identification unit in China, Brazil, India, Australia and the USA, and the threshold of the WTCI was determined based on the statistical area at the state (or provincial) scale. For the remaining countries, we treated each one as an identification unit, and the threshold of the WTCI was calculated by relying on the statistical area at the national scale. The annual statistical area was used to determine the threshold of the WTCI for each identification unit in the current year. Furthermore, given the diversity and complexity of the land cover types and agricultural planting structures in the study area, we used different percentile combinations of the V and B lines. Specifically, this study referred to crop calendar data provided by the United States Department of Agriculture (USDA) (https://ipad.fas.usda.gov/ogamaps/cropcalendar.aspx, last access: 10 January 2023) to determine the growing seasons of winter-triticeae crops in each country. Then, we extracted the maximum and minimum NDVIs of all potential pixels in each identification unit during the growing season of winter-triticeae crops. We further obtained different percentiles (5 %, 20 %, 40 %, 60 %, 80 % and 95 %) of the maximum and minimum NDVIs for each identification unit, corresponding to v and b in Eqs. (2), (3) and (4). In addition, m1 and m2 were automatically searched in the NDVI curve between the re-greening and harvesting stages of winter-triticeae crops. In this study, the re-greening stage was based on the start time of spring in the Northern Hemisphere (March) and Southern Hemisphere (September) (Ren et al., 2019), and the harvesting stage referred to the crop calendar provided by the USDA. We first determined the m1 and n1 of each potential pixel, and then we looked for m2 in the period after n1 and further calculated the WTCI. Pixels that do not meet this condition (i.e., n1<n2) are identified as non-winter-triticeae crops. In addition, we determined the optimal combination of V and B lines in each identification unit according to the identification accuracy at the pixel scale (F1 score) and the relative mean absolute error (RMAE) between the identified and agricultural statistical areas. For countries lacking agricultural statistical data, the optimal combination was decided solely based on the F1 score. Based on the optimal combination of the V and B lines of each identification unit in 2020, winter-triticeae crops from 2017 to 2019 and from 2021 to 2022 were identified to evaluate the temporal transferability of the WTCI.
The identification of winter-triticeae crops in the study area may be affected by winter rapeseed and garlic, as these crops have similar growing season and spectral characteristics to winter-triticeae crops (Fu et al., 2023b; Tian et al., 2021). Winter rapeseed is mainly distributed in China, India and parts of Europe. The planting area of winter rapeseed in some states (or provinces) of China and India is equivalent to or even higher than that of winter-triticeae crops, while the planting area in countries such as France, Germany, Poland, Britain, Hungary and Ukraine accounts for 17 %–32 % of the planting area of winter-triticeae crops. Winter garlic is mainly distributed in some provinces of China, Spain and Ukraine. However, the planting area of winter garlic is very small compared to that of winter-triticeae crops and winter rapeseed. For example, the planting area of winter garlic in China, the largest planting country, only accounted for about 2 % of the winter crops (https://data.stats.gov.cn, last access: 3 January 2023). Therefore, this study only distinguished between winter rapeseed and winter-triticeae crops (Fig. S1 in the Supplement). The NDVI time series of winter rapeseed shows a downward trend from the heading to harvest stages of winter-triticeae crops, which resembles that of winter-triticeae crops (Fig. 3b). Tao et al. (2023) also demonstrated that winter rapeseed and winter-triticeae crops have similar NDVI characteristics, making it difficult to distinguish them based on optical images only (Veloso et al., 2017). Fortunately, previous studies have indicated that the VH band can effectively eliminate the interference from winter rapeseed in the identification of winter-triticeae crops in China and Europe (Dong et al., 2020; Huang et al., 2022). Therefore, we distinguished winter rapeseed and winter-triticeae crops based on the methods of these studies. Specifically, the VH threshold set by Dong et al. (2020), which was obtained by comparing winter-triticeae crops and winter rapeseed field samples, was employed in this study. In regions of India where winter rapeseed is planted, we calculated the VH values from Sentinel-1 images in March considering the lower latitudes and earlier harvest periods of these regions. In other Asian regions where winter rapeseed is grown, this study obtained VH values for April. It identified those pixels with VH values greater than −15.5 in March or April as non-winter-triticeae crops. Similarly, in some European countries, we calculated VH values for May and considered pixels with VH values greater than −15.5 to be non-winter-triticeae crops (Huang et al., 2022).
2.4 Accuracy assessment
This study evaluated accuracy at both the pixel and regional scales. The producer's accuracy (PA), user's accuracy (UA), overall accuracy (OA) and F1 score (Congalton, 1991; Hripcsak and Rothschild, 2005; Lin et al., 2022) were employed to validate the identification accuracy at the pixel scale. At the regional scale, we obtained the identified areas of winter-triticeae crops based on the total pixel area of winter-triticeae crops on the identification maps. In China, Brazil, India, Australia and the USA, we used the statistical area at low-level administration, such as the municipal or county scale, to validate the accuracy of an identified area at the state (or provincial) scale. For other countries, the statistical areas of all the states, provinces, municipalities or counties included in each country were used to evaluate accuracy at the national scale. The correlation coefficient (R2) and the RMAE were used to examine the consistency between the identified area and the statistical area (Shen et al., 2023; Zheng et al., 2022).
3.1 The spatial transferability of the WTCI method
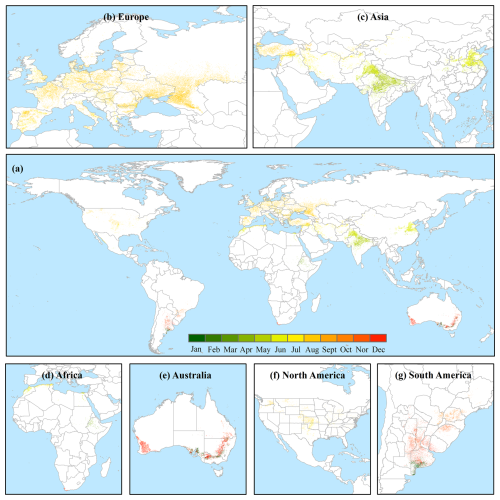
The spatial distribution map of winter-triticeae crops in 66 countries in 2020 was first produced based on the WTCI method (Fig. 5), which effectively presented the distribution of winter-triticeae crops in the study area. Specifically, the winter-triticeae crops were mainly distributed in most European countries and Asian plains (Fig. 5b and c). To display the detailed information of the map of winter-triticeae crops, we selected 12 typical areas in different countries to focus on and compared them with high-resolution images from Google Earth (Fig. 6). In general, despite some noise, the identification map clearly displays the fields planted with winter-triticeae crops and effectively distinguishes roads and rivers between the fields. In addition, we compared the spatial distribution map of winter-triticeae crops in this study with some existing products in Europe (Huang et al., 2022) and China (Dong et al., 2020) that also have a spatial resolution of 30 m. The spatial distribution of winter-triticeae crop fields on the maps produced in this study was similar to that of other studies, and the maps generated using the WTCI method had less noise and clearer boundaries of roads and rivers (Fig. S3).
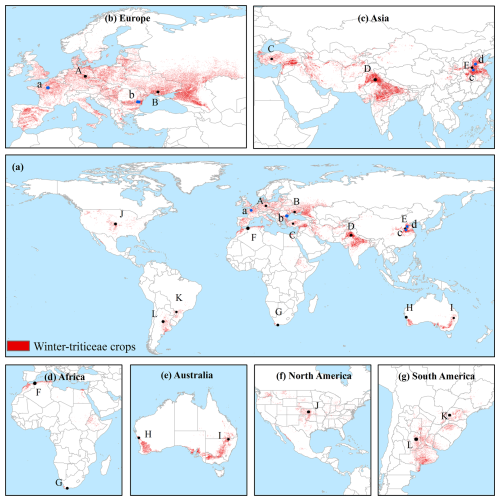
Figure 5Spatial distribution of winter-triticeae crops in the study area in 2020. Panel (a) shows the distribution of winter-triticeae crops in 66 countries. Panels (b)–(g) show zoomed-in maps of Europe, Asia, Africa, Australia, North America and South America, respectively.
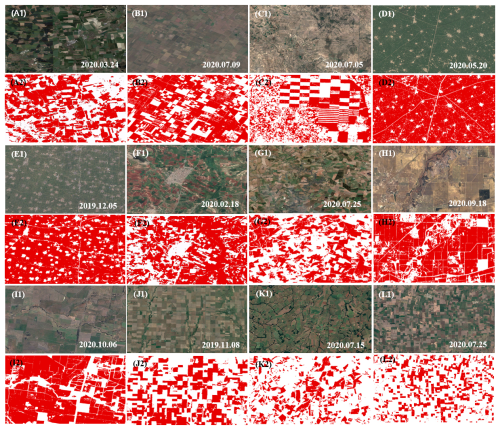
Figure 6Comparison between the identification maps of winter-triticeae crops and high-resolution images from © Google Earth in the study area. (A1)–(L1) represent the high-resolution images from © Google Earth of the different regions. (A2)–(L2) represent the zoomed-in maps of areas A–L in Fig. 5.
Based on the field survey samples and visual interpretation samples, the OA, PA and UA of the winter-triticeae crop identification maps in 65 countries (except for the USA) were 87.7 %, 81.12 % and 87.85 %, respectively, and the F1 score was 84.04 % (Fig. 7). The PA and UA varied between 52 % and 97.73 % and between 63.64 % and 97.83 % over the various countries, and the OA and F1 ranged from 70.86 % to 96.05 % and from 65.63 % to 96.09 %, respectively. At the state (provincial) scale, the variation ranges of the OA and F1 score in China were 77.68 %–95.9 % and 71.79 %–94.47 %, respectively (Fig. 8a). In Brazil, the OA and F1 score were in the ranges 76.99 %–94.74 % and 78.26 %–96.24 % (Fig. 8b). The OA in India was between 67.53 % and 92.07 %, and the F1 score was between 65.24 % and 92.05 % (Fig. 8c). The OA and F1 score in Australia lay in the ranges 79.21 %–91.67 % and 69.23 %–91 % (Fig. 8d). In general, the F1 score in most of the identification units was greater than 75 %, indicating that the WTCI method shows satisfactory accuracy in identifying winter-triticeae crops. The regions with F1 scores of less than 75 % were mainly small winter-triticeae crop-planting areas with complex winter crop types, such as Croatia (HRV), Albania (ALB), Sichuan (SC) in China and Bihar (BR) in India. By contrast, the identification accuracy of regions with larger planting areas of winter-triticeae crops was significantly higher than that of regions with smaller planting areas.
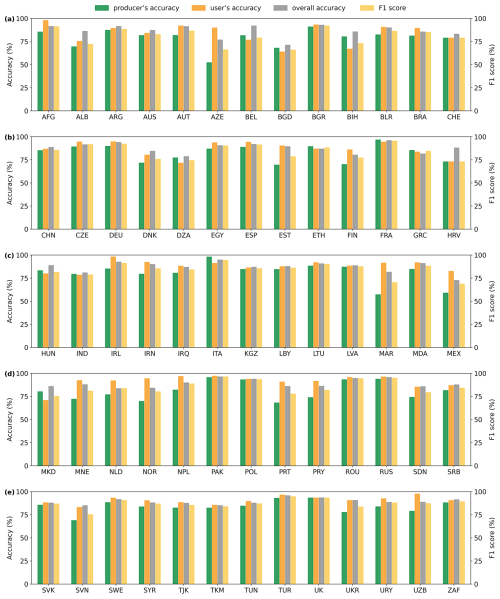
Figure 7The producer's accuracy (PA), user's accuracy (UA), overall accuracy (OA) and F1 score of the identification maps of winter-triticeae crops at the national scale in 2020. The abbreviations of the countries are shown in Table S2.
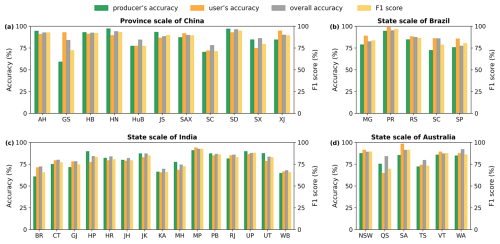
Figure 8The PA, UA, OA and F1 score of the identification maps of winter-triticeae crops at the state (provincial) scale in 2020. Panels (a)–(d) represent the identification accuracy at the state (provincial) scale in China, Brazil, India and Australia, respectively. The abbreviations of the states (provinces) are shown in Table S3.
In addition, compared to the agricultural statistical area in different administrative units in 2020, the WTCI method can effectively estimate the areas of winter-triticeae crops. At the national scale, the R2 between the identified and statistical areas of winter-triticeae crops ranged from 0.62 to 1, with an RMAE of 8.47 % to 38.51 % (Fig. 9a and b). At the state (provincial) scale, the R2 and RMAE between the identified and statistical areas in China were between 0.75 and 0.99 and between 12.64 % and 45.1 %, respectively (Fig. 10a1 and 10a2). In Brazil, the R2 was in the range of 0.84–0.91, with RMAEs of 36.04 % to 48.02 % (Fig. 10b1 and 10b2). The R2 and RMAE of 15 states in India ranged from 0.58 to 0.98 and from 6.12 % to 47.61 %, respectively (Fig. 10c1 and 10c2). The R2 and RMAE in Australia varied from 0.79 to 0.98 and from 23.61 % to 38.43 %, respectively (Fig. 10d1 and 10d2). Overall, all of these results demonstrate that the WTCI method exhibits reliable spatial applicability when identifying winter-triticeae crops.
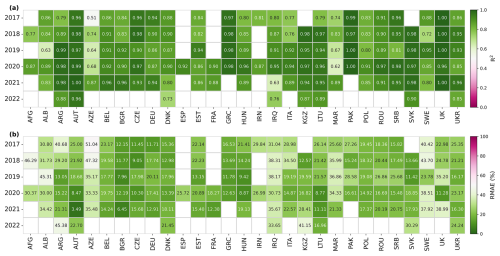
Figure 9Comparison between the identified and statistical areas of winter-triticeae crops at the national scale from 2017 to 2022. Panels (a) and (b) show the correlation coefficient and RMAE between the identified and statistical areas, respectively.
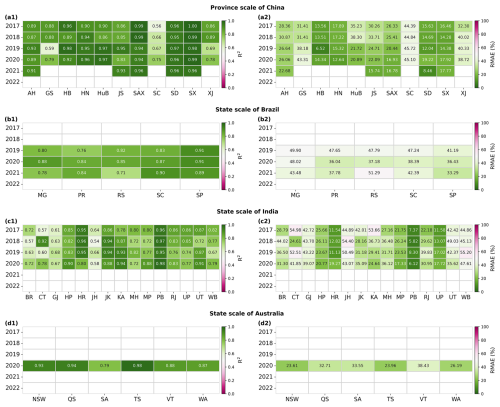
Figure 10Comparison between the identified and statistical areas of winter-triticeae crops at the state (provincial) scale from 2017 to 2022. Panels (a1)–(d1) represent the correlation coefficient at the state (provincial) scale in China, Brazil, India and Australia, respectively. Panels (a2)–(d2) represent the RMAEs at the state (provincial) scale in China, Brazil, India and Australia, respectively.
3.2 The temporal transferability of the WTCI method
The comparison between the identified and statistical areas of the winter-triticeae crops indicates that the WTCI method can be applied effectively to other years. At the national scale, the R2 between the identified and statistical areas of winter-triticeae crops in all the years was between 0.51 and 1, and the RMAE was between 3.49 % and 51.04 % (Fig. 9a and b). At the state (provincial) scale, the R2 and RMAE ranged from 0.56 to 0.99 and from 6.52 % to 45.72 % in China (Fig. 10a1 and 10a2). In Brazil, the ranges of these two metrics were 0.71–0.91 and 33.29 %–51.29 %, respectively (Fig. 10b1 and 10b2). In India, they varied from 0.54 to 0.97 and from 5.82 % to 55.2 %, respectively (Fig. 10c1 and 10c2). The R2 in most of the identification units was more than 0.6, and the RMAE was less than 30 %. These results illustrate that there is good consistency between the identified and statistical areas of winter-triticeae crops, confirming the stable temporal transferability of the proposed method.
3.3 The performance of the WTCI method validated using the CDL and EuroCrops datasets
The distribution map of winter-triticeae crops exhibited high consistency with the CDL and EuroCrops datasets. In 2020, the OA and F1 score in the USA were 86.84 % and 82.09 %, respectively, and the PA and UA were 76.96 % and 88.13 %, respectively (Fig. 11 and Table S4). The performance of the WTCI method varied by state. For all states planting winter-triticeae crops, the OA varied from 70.42 % to 94.24 % and the F1 score ranged from 66.67 % to 91.01 % (Fig. 11a–c and Table S4). In major planting states such as Kansas, Oklahoma and Texas, the planting area of winter-triticeae crops accounted for approximately 50 % of the total area of winter-triticeae crops in the USA, with an OA and F1 score of more than 92 % and 85 %, respectively (Fig. 11 and Table S4). The area identified by the WTCI method also exhibited good consistency with the US official statistical data. At the national scale, the R2 and RMAE were 0.89 and 28.9 %, respectively (Fig. 12a). At the state scale, the R2 varied between 0.52 and 0.96 and the RMAE was in the range 9.01 %–57.84 % (Fig. 12b–w). Among the 10 European countries from the EuroCrops dataset, the OA, F1 score, PA and UA ranged from 71.22 % to 94.79 %, 67.67 % to 90.14 %, 63.68 % to 84.77 % and 71.43 % to 96.24 %, with mean values of 83.88 %, 78.87 %, 73.18 % and 86 % (Fig. 11d and Table S5), respectively. In general, the OA and F1 score in most of the regions of the USA and Europe were higher than 80 % and 75 %, implying that the WTCI method exhibited satisfactory performance compared to the CDL and EuroCrops datasets. Additionally, we presented spatial details of the identification map produced by the WTCI method in the USA and Europe. The results indicate that the identification map can effectively capture the field distribution of winter-triticeae crops in the CDL and EuroCrops datasets (Fig. 13).
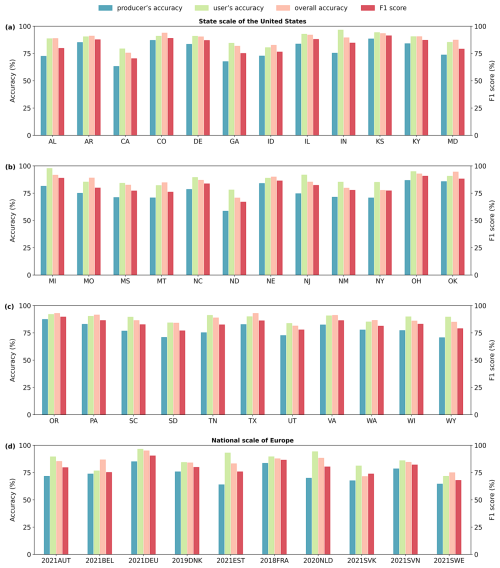
Figure 11The PA, UA, OA and F1 score of the identification maps of winter-triticeae crops in the USA and Europe. The abbreviations of the counties and states are shown in Tables S2 and S3. 2018FRA indicates the identification accuracy of the country (France) in 2018.
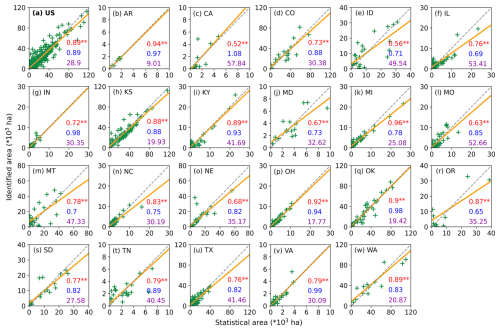
Figure 12Comparison between the identified and statistical areas of winter-triticeae crops in 2020 in the USA. Panel (a) shows the results between the identified and statistical areas at the national scale. Panels (b)–(w) show the results between the identified and statistical areas for each state. The green symbols represent the counties of each state. The yellow solid lines are the regression lines, and the grey short-dashed lines are the 1:1 lines. The red, blue and purple numbers represent the R2, slope and RMAE values between the identified and statistical areas, respectively.
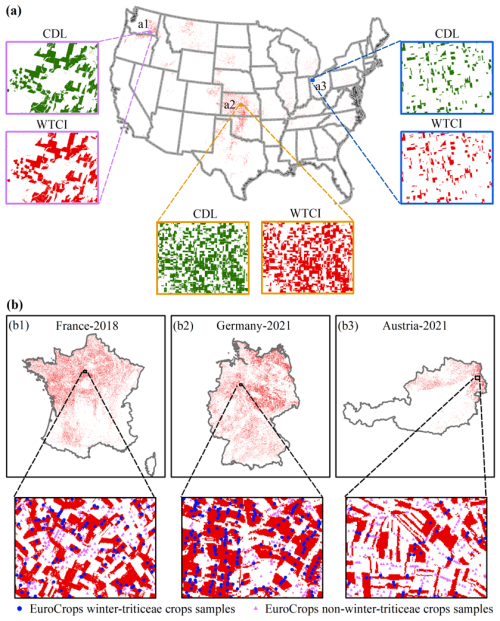
Figure 13Comparison of the identification maps of winter-triticeae crops with the CDL and EuroCrops datasets. Panel (a) shows the comparison results between the identification maps and the CDL dataset in the USA. Panel (b) shows the comparison results between the identification maps and the EuroCrops samples in Europe.
3.4 Harvest times of the global winter-triticeae crops
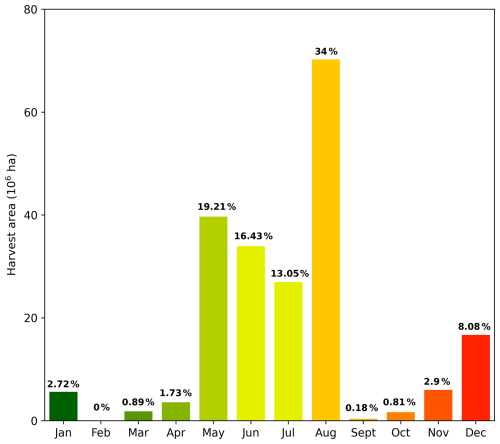
We finally calculated the harvest times of winter-triticeae crops in the study area in 2020 based on the time when the minimum NDVI occurred during the harvesting stage. Overall, the harvest times of winter-triticeae crops are delayed with increasing latitude (Fig. 14). In the Northern Hemisphere, winter-triticeae crops in eastern and southern Asia were harvested in May and June (Fig. 14c), and the harvested area accounted for about 35.64 % of the total harvested area in the study area (Fig. 15). The harvest times in central Asia, Europe, northern Africa and North America were concentrated between July and August (Fig. 14b, c, d and f), and the proportion of the harvested area to the total area was around 47.05 % (Fig. 15). The regions with harvest times in September were mainly distributed in high-latitude areas of Russia (Fig. 14b). In the Southern Hemisphere, the harvest time of winter-triticeae crops was mainly from November to January of the following year (Fig. 14e and g), with the harvested area accounting for 13.7 % of the total harvested area (Fig. 15). These areas with harvest times occurring from November to January were mainly located in high-latitude regions of Australia and South America (Fig. 14e and g), and the harvest times in October only occurred in some areas of low-latitude regions of South America (Fig. 14g).
Winter-triticeae crops are among the most important grain crops in the world. Therefore, the ability to efficiently capture distribution information about these crops is critical for monitoring crop growth and drafting grain subsidy policies (Liu et al., 2018). To the best of our knowledge, there is currently a lack of a global distribution map for winter-triticeae crops at high resolution. Although there have been previous studies focusing on global triticeae crop mapping (Monfreda et al., 2008; Portmann et al., 2010; You et al., 2014), they resulted in maps for single or discontinuous years and with coarse spatial resolution, which may include large amounts of mixed pixels and have limited applications. For example, Luo et al. (2022) used inflection- and threshold-based methods to produce the global wheat map at a spatial resolution of 4 km, but the accuracy was low due to mixed pixel problems in medium and small fields of South America. The available high-resolution maps of winter-triticeae crops with wide coverage can display more accurate information on planting locations, such as the CDL in the USA, winter wheat maps in China (Dong et al., 2020) and winter cereal maps in Europe (Huang et al., 2022), but they are not currently available globally. In this study, we produced the first distribution maps of winter-triticeae crops with 30 m spatial resolution for 66 countries from 2017 to 2022 (2020 for the USA) based on the new WTCI method, filling the gap in the lack of global continuous years and high-resolution winter-triticeae crop maps.
In addition, the method proposed in this study has the following advantages. First, f(V) and f(B) were incorporated into the WTCI to alleviate errors and uncertainties in determining crop types based on partial features only. Most previous studies only considered the differences between the maximum and minimum values of vegetation indices at key crop phenological stages (Atzberger and Rembold, 2013; Chu et al., 2016; Manfron et al., 2017; Qiu et al., 2017). For example, Qu et al. (2021) set rules to determine the maximum and minimum NDVIs before and after the overwintering stage and designed the winter wheat index (WWI) using the product of the differences between the maximum and minimum NDVIs. However, in some regions, the maximum NDVI values are not easy to determine before overwintering, due to either the crop varieties or the climate, resulting in very small differences between the maximum and minimum NDVIs before overwintering, which increases omission errors. Similar to this study, Xu et al. (2023) developed a spectral index for rice identification based on SAR data and tested the differences using partial features and three features. The results showed that considering three features simultaneously could better distinguish between rice, other crops and other land cover types, thus achieving the highest accuracy.
Second, all parameters of the WTCI are determined automatically. For example, based on the NDVI of each identification unit, the V and B lines are generated automatically to adapt to the differences in climate and land cover types between different regions, making the WTCI method more stable. This study selected two representative regions to test the sensitivity of the identification accuracy to different percentile combinations of the V line (v) and the B line (b) (Fig. 16). The results demonstrate that the identification accuracy is insensitive to the percentiles of the V (v) and B (b) lines, where winter-triticeae crops are the dominant crops (Fig. 16a). However, where winter-triticeae crops are not dominant, the identification accuracy is sensitive to the percentiles of the V (v) and B (b) lines (Fig. 16b). Overall, we achieved promising results in each identification unit, indicating that the WTCI method can be applied flexibly to different regions. Users can choose the appropriate percentile based on the local situation. Besides, the maximum and minimum NDVI values are automatically searched between the re-greening and harvesting stages of winter-triticeae crops, avoiding the limitations caused by the use of a large number of constraints (Bazzi et al., 2019; Cai et al., 2019). Manfron et al. (2017) set multiple conditions based on expert knowledge to search for NDVI characteristics of key phenological stages when identifying winter wheat. Although high identification accuracy was achieved in the study area, the application of the method was limited due to the proposed conditions in specific areas.
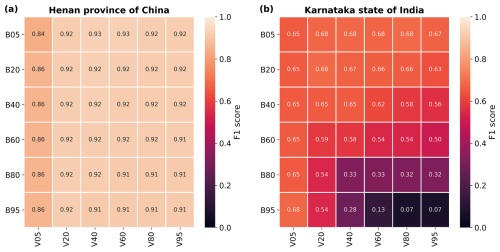
Figure 16Identification accuracy under different percentile combinations of the V line (v) and B line (b). V05 and B05 represent the 5th percentiles of the V and B lines, respectively.
Finally, the WTCI method is not limited by samples and has high transferability in time and space, making it suitable for mapping winter-triticeae crops in large regions. Supervised classification algorithms can extract information features from training samples and achieve high identification accuracy in specific years or regions (Brown and Pervez, 2014; Yin et al., 2020). However, the accuracy is often affected by insufficient training samples (Petitjean et al., 2012) or classification rules and regional limitations of parameters (Zhong et al., 2014) when the trained model is transferred to other years or regions, which makes it difficult to apply them on a large scale. The WTCI method does not require training samples and has achieved accurate results in most of the countries, with OA values of 88.35 % and 88.97 % in China and Europe, respectively, which are comparable to the results of previous studies (Dong et al., 2020; Huang et al., 2022). Moreover, the satisfactory performance in capturing the field distribution of winter-triticeae crops in the CDL and EuroCrops datasets supports the reliability and applicability of the WTCI method.
Despite the advantages, our study also suffers from some uncertainties. First, the commission error is higher in regions where winter-triticeae crops are not the dominant crops, such as SC in China, West Bengal (WB), BR, Karnataka (KA) and a few countries in the Mediterranean Sea region, indicating that there non-winter-triticeae crops are misclassified as winter-triticeae crops. One potential reason is the quantity and quality of the satellite data. Although we used synthesized images from the Landsat and Sentinel products to increase the amount of effective data and used linear interpolation and the Savitzky–Golay filter to further improve the data quality, there are still differences in the quantity and quality of the satellite data in the study areas. A previous study highlighted that the availability of effective data greatly affected the crop identification accuracy (Dong et al., 2015). Second, due to the scan line corrector failure of the Landsat 7 sensor, the striping issues and reduced data availability may also impact the accuracy of the NDVI time series (Ju and Roy, 2008), resulting in errors in the identification results. In our study, there were some striping issues in the distribution maps of winter-triticeae crops in a few regions (Fig. S4a), which may lead to errors in winter-triticeae crop identification and differences in identification results between different years (Fig. S4). Additionally, the wavelength difference between the Sentinel-2 and Landsat sensors may affect the quality of the synthesized NDVI. It is still a challenge to completely eliminate the impact of this difference (He et al., 2018). Besides, this study ignored the internal differences between winter wheat, winter barley, winter rye and triticale due to their similar NDVI time series and phenological characteristics (Huang et al., 2022; Xu et al., 2017), which may affect their identification accuracy. We referred to previous studies (Dong et al., 2020; Huang et al., 2022) on winter crop mapping and only distinguished winter rapeseed to reduce its impact on the identification of winter-triticeae crops. Other winter crops with smaller planting areas that have not been discovered or overlooked may also interfere with the identification and lead to errors in the identification map. In the future, identifying useful bands or vegetation indexes that eliminate interferences from other land covers, further subdividing each winter-triticeae crop and increasing the availability and quality of satellite data will further promote the performance of the WTCI method.
The 30 m resolution distribution maps of winter-triticeae crops in 66 countries worldwide from 2017 to 2022 (2020 for the USA) are available at https://doi.org/10.57760/sciencedb.12361 (Fu et al., 2023a). The product is provided in GeoTIFF format with pixel values of 1 for winter-triticeae crops and 0 for other land covers.
This study proposed a new sample-free method (WTCI) for mapping winter-triticeae crops and examined its performance in 66 countries worldwide. The new method exhibits high accuracy and strong spatiotemporal transferability by verifying with field survey samples and visual interpretation samples from Google Earth images, the CDL and EuroCrops datasets and agricultural statistical data. Overall, the OA and F1 score were more than 80 % and 75 % in most of the identification units. The R2 between the identified and statistical areas in most of the regions was greater than 0.6 in all of the years, and the RMAE was less than 30 %. These satisfactory results indicate that the WTCI method can be used for long-term and large-scale crop mapping. At the same time, the first 30 m spatial resolution distribution maps of winter-triticeae crops from 2017 to 2022 produced by the WTCI method fill in the current product gaps, which can also serve harvest area monitoring, yield estimation and agricultural management.
The supplement related to this article is available online at: https://doi.org/10.5194/essd-17-95-2025-supplement.
WY and YF designed the research and developed the method. YF, XH, JD and QP carried out the investigation. YF wrote the manuscript. WY, XC and CS revised the manuscript.
The contact author has declared that none of the authors has any competing interests.
Publisher’s note: Copernicus Publications remains neutral with regard to jurisdictional claims made in the text, published maps, institutional affiliations, or any other geographical representation in this paper. While Copernicus Publications makes every effort to include appropriate place names, the final responsibility lies with the authors.
The authors would like to thank the editors and reviewers for their constructive comments on the paper.
This work was supported by the National Natural Science Foundation of China (grant no. 42401424), the Open Research Program of the International Research Center of Big Data for Sustainable Development Goals (grant no. CBAS2023ORP02) and the Joint Funds of the Zhejiang Provincial Natural Science Foundation of China (grant no. LZJWY24E090004).
This paper was edited by Nophea Sasaki and reviewed by Kristof van Tricht and five anonymous referees.
Abramov, S., Rubel, O., Lukin, V., Kozhemiakin, R., Kussul, N., Shelestov, A., and Lavreniuk, M.: Speckle reducing for Sentinel-1 SAR data, IEEE Int. Geosci. Remote Sens. Symp. (IGARSS), 2353–2356, https://doi.org/10.1109/IGARSS.2017.8127463, 2017.
Atzberger, C. and Rembold, F.: Mapping the spatial distribution of winter crops at sub–pixel level using AVHRR NDVI time series and neural nets, Remote Sens., 5, 1335–1354, https://doi.org/10.3390/rs5031335, 2013.
Bazzi, H., Baghdadi, N., El Hajj, M., Zribi, M., Minh, D. H., Ndikumana, E., Courault, D., and Belhouchette, H.: Mapping paddy rice using Sentinel-1 SAR time series in Camargue, France, Remote Sens., 11, 887, https://doi.org/10.3390/rs11070887, 2019.
Boryan, C., Yang, Z. W., Mueller, R., and Craig, M.: Monitoring US agriculture: the US Department of Agriculture, National Agricultural Statistics Service, Cropland Data Layer Program, Geocarto Int., 26, 341–358, https://doi.org/10.1080/10106049.2011.562309, 2011.
Brown, J. F. and Pervez, M. S.: Merging remote sensing data and national agricultural statistics to model change in irrigated agriculture, Agr. Syst., 127, 28–40, https://doi.org/10.1016/j.agsy.2014.01.004, 2014.
Cai, Y. P., Guan, K. Y., Peng, J., Wang, S. W., Seifert, C., Wardlow, B., and Li, Z.: A high-performance and in-season classification system of field-level crop types using timeseries Landsat data and a machine learning approach, Remote Sens. Environ., 210, 35–47, https://doi.org/10.1016/j.rse.2018.02.045, 2018.
Cai, Y. T., Lin, H., and Zhang, M.: Mapping paddy rice by the object-based random forest method using time series Sentinel-1/Sentinel-2 data, Adv. Space Res., 64, 2233–2244, https://doi.org/10.1016/j.asr.2019.08.042, 2019.
Chen, J., Jonsson, P., Tamura, M., Gu, Z. H., Matsushita, B., and Eklundh, L.: A simple method for reconstructing a high-quality NDVI time-series data set based on the Savitzky-Golay filter, Remote Sens. Environ., 91, 332–344, https://doi.org/10.1016/j.rse.2004.03.014, 2004.
Chu, L., Liu, Q. S., Huang, C., and Liu, G. H.: Monitoring of winter wheat distribution and phenological phases based on MODIS time-series: A case study in the Yellow River Delta, China, J. Integr. Agric., 15, 60345–60347, https://doi.org/10.1016/S2095-3119(15)61319-3, 2016.
Congalton, R. G.: A review of assessing the accuracy of classifications of remotely sensed data, Remote Sens. Environ., 37, 35–46, https://doi.org/10.1016/0034-4257(91)90048-B, 1991.
Dong, J., Fu, Y., Wang, J., Tian, H., Fu, S., Niu, Z., Han, W., Zheng, Y., Huang, J., and Yuan, W.: Early-season mapping of winter wheat in China based on Landsat and Sentinel images, Earth Syst. Sci. Data, 12, 3081–3095, https://doi.org/10.5194/essd-12-3081-2020, 2020.
Dong, J. W., Xiao, X. M., Kou, W. L., Qin, Y. W., Zhang, G. L., Li, L., Jin, C., Zhou, Y. T., Wang, J., Biradar, C., Liu, J. Y., and Moore, B.: Tracking the dynamics of paddy rice planting area in 1986–2010 through time series Landsat images and phenology-based algorithms, Remote Sens. Environ., 160, 99–113, https://doi.org/10.1016/j.rse.2015.01.004, 2015.
Fu, Y. Y., Huang, J. X., Shen, Y. J., Liu, S. M., Huang, Y., Dong, J., Han, W., Ye, T., Zhao, W. Z., and Yuan, W. P.: A satellite-based method for national winter wheat yield estimating in China, Remote Sens., 13, 4680, https://doi.org/10.3390/rs13224680, 2021.
Fu, Y. Y., Chen, X. Z., Song, C. Q., Huang, X. J., Dong, J., Peng, Q. Y., and Yuan, W. P.: Global 30-m resolution distribution maps of winter-triticeae crops from 2017 to 2022, Science Data Bank [data set], https://doi.org/10.57760/sciencedb.12361, 2023a.
Fu, Y. Y., Shen, R. Q., Song, C. Q., Dong, J., Han, W., Ye, T., and Yuan, W. P.: Exploring the effects of training samples on the accuracy of crop mapping with machine learning algorithm, Sci. Remote Sens., 7, 100081, https://doi.org/10.1016/j.srs.2023.100081, 2023b.
Ge, S., Zhang, J. S., Pan, Y. Z., Yang, Z., and Zhu, S.: Transferable deep learning model based on the phenological matching principle for mapping crop extent, Int. J. Appl. Earth Obs., 102, 102451, https://doi.org/10.1016/j.jag.2021.102451, 2021.
Gella, G. W., Bijker, W., and Belgiu, M.: Mapping crop types in complex farming areas using SAR imagery with dynamic time warping, ISPRS J. Photogramm., 175, 171–183, https://doi.org/10.1016/j.isprsjprs.2021.03.004, 2021.
Grogan, D., Frolking, S., Wisser, D., Prusevich, A., and Glidden, S.: Global gridded crop harvested area, production, yield, and monthly physical area data circa 2015, Sci. Data, 9, 15, https://doi.org/10.1038/s41597-021-01115-2, 2022.
He, M., Kimball, J. S., Maneta, M. P., Maxwell, B. D., Moreno, A., Beguería, S., and Wu, X.: Regional crop gross primary productivity and yield estimation using fused landsat-MODIS data, Remote Sens., 10, 372, https://doi.org/10.3390/rs10030372, 2018.
He, Y. H. Z., Wang, C. L., Chen, F., Jia, H. C., Liang, D., and Yang, A. Q.: Feature Comparison and Optimization for 30-M Winter Wheat Mapping Based on Landsat-8 and Sentinel-2 Data Using Random Forest Algorithm, Remote Sens., 11, 535, https://doi.org/10.3390/rs11050535, 2019.
Hripcsak, G. and Rothschild, A. S.: Agreement, the F-measure, and reliability ininformation retrieval, J. Am. Med. Inform. Assoc., 12, 296–298, https://doi.org/10.1197/jamia.M1733, 2005.
Huang, X. J., Fu, Y. Y., Wang, J. J., Dong, J., Zheng, Y., Pan, B. H., Skakun, S., and Yuan, W. P.: High–resolution mapping of winter cereals in Europe by time series Landsat and Sentinel images for 2016–2020, Remote Sens., 14, 2120, https://doi.org/10.3390/rs14092120, 2022.
Ju, J. C. and Roy, D. P.: The availability of cloud-free Landsat ETM+ data over the conterminous United States and globally, Remote Sens. Environ., 112, 1196–1211, https://doi.org/10.1016/j.rse.2007.08.011, 2008.
Konduri, V. S., Kumar, J., Hargrove, W. W., Hoffman, F. M., and Ganguly, A. R.: Mapping crops within the growing season across the United States, Remote Sens. Environ., 251, 112048, https://doi.org/10.1016/j.rse.2020.112048, 2020.
Lin, C. X., Zhong, L. H., Song, X. P., Dong, J. W., Lobell, D. B., and Jin, Z. N.: Early- and in-season crop type mapping without current-year ground truth: Generating labels from historical information via a topology-based approach, Remote Sens. Environ., 274, 112994, https://doi.org/10.1016/j.rse.2022.112994, 2022.
Liu, J. G., Huffman, T., Shang, J. L., Qian, B. D., Dong, T. F., and Zhang, Y. S.: Identifying major crop types in Eastern Canada using a FUZZY decision tree classifier and phenological indicators derived from time series MODIS data, Can. J. Rem. Sens., 42, 259–273, https://doi.org/10.1080/07038992.2016.1171133, 2016.
Liu, W., Dong, J., Xiang, K. L., Wang, S., Han, W., and Yuan, W. P.: A sub-pixel method for estimating planting fraction of paddy rice in Northeast China, Remote Sens. Environ., 205, 305–314, https://doi.org/10.1016/j.rse.2017.12.001, 2018.
Luo, Y. C., Zhang, Z., Cao, J., Zhang, L. L., Zhang, J., Han, J. C., Zhuang, H. M., Cheng, F., and Tao, F. L.: Accurately mapping global wheat production system using deep learning algorithms, Int. J. Appl. Earth Obs., 110, 102823, https://doi.org/10.1016/j.jag.2022.102823, 2022.
Ma, Z., Dong, C., Lin, K., Yan, Y., Luo, J., Jiang, D., and Chen, X.: A Global 250-m Downscaled NDVI Product from 1982 to 2018, Remote Sens., 14, 3639, https://doi.org/10.3390/rs14153639, 2022.
Macdonald, R. B. and Hall, F. G.: Global crop forecasting, Science, 208, 670–679, https://doi.org/10.1126/science.208.4445.670,1980.
Manfron, G., Delmotte, S., Busetto, L., Hossard, L., Ranghetti, L., Brivio, P. A., and Boschetti, M.: Estimating inter–annual variability in winter wheat sowing dates from satellite time series in Camargue, France, Int. J. Appl. Earth Obs., 57, 190–201, https://doi.org/10.1016/j.jag.2017.01.001, 2017.
Monfreda, C., Ramankutty, N., and Foley, J. A.: Farming the planet: 2. Geographic distribution of crop areas, yields, physiological types, and net primary production in the year 2000, Global Biogeochem. Cy., 22, GB1022, https://doi.org/10.1029/2007GB002947, 2008.
Nelson, K. S. and Burchfield, E. K.: Landscape complexity and US crop production, Nat. Food., 2, 330–338, https://doi.org/10.1038/s43016-021-00281-1, 2021.
Peng, W., Kuang, T. S., and Tao, S.: Quantifying influences of natural factors on vegetation NDVI changes based on geographical detector in Sichuan, western China, J. Clean. Prod., 233, 353–367, https://doi.org/10.1016/j.jclepro.2019.05.355, 2019.
Petitjean, F., Inglada, J., and Gançarski, P.: Satellite image time series analysis under time warping, IEEE T. Geosci. Remote, 50, 3081–3095, https://doi.org/10.1109/TGRS.2011.2179050, 2012.
Portmann, F. T., Siebert, S., and Döll, P.: Mirca2000 global monthly irrigated and rainfed crop areas around the year 2000: a new high-resolution data set for agricultural and hydrological modeling, Global Biogeochem. Cy., 24, GB1011, https://doi.org/10.1029/2008GB003435, 2010.
Qiu, B. W., Luo, Y. H., Tang, Z. G., Chen, C. C., Lu, D. F., Huang, H. Y., Chen, Y. Z., Chen, N., and Xu, W. M.: Winter wheat mapping combining variations before and after estimated heading dates, ISPRS J. Photogramm., 123, 35–46, https://doi.org/10.1016/j.isprsjprs.2016.09.016, 2017.
Qu, C., Li, P. J., and Zhang, C. M.: A spectral index for winter wheat mapping using multi–temporal Landsat NDVI data of key growth stages, ISPRS J. Photogramm., 17, 431–447, https://doi.org/10.1016/j.isprsjprs.2021.03.015, 2021.
Ramankutty, Evan, A. T., Monfreda, C., and Foley, J. A.: Farming the planet: 1. Geographic distribution of global agricultural lands in the year 2000, Global Biogeochem. Cy., 22, GB1003, https://doi.org/10.1029/2007GB002952, 2008.
Ren, S. L., Qin, Q. M., and Ren, H. Z.: Contrasting wheat phenological responses to climate change in global scale, Sci. Total Environ., 665, 620–631, https://doi.org/10.1016/j.scitotenv.2019.01.394, 2019.
Schneider, M., Schelte, T., Schmitz, F., and Körner, M.: EuroCrops: The Largest Harmonized Open Crop Dataset Across the European Union, Sci. Data., 10, 612, https://doi.org/10.1038/s41597-023-02517-0, 2023a.
Schneider, M., Chan, A., and Körner, M.: EuroCrops, Zenodo [data set], https://doi.org/10.5281/zenodo.10118572, 2023b.
Shen, R., Pan, B., Peng, Q., Dong, J., Chen, X., Zhang, X., Ye, T., Huang, J., and Yuan, W.: High-resolution distribution maps of single-season rice in China from 2017 to 2022, Earth Syst. Sci. Data, 15, 3203–3222, https://doi.org/10.5194/essd-15-3203-2023, 2023.
Skakun, S., Franch, B., Vermote, E., Roger, J. C., Becker-Reshef, I., Justice, C., and Kussul, N.: Early season large-area winter crop mapping using MODIS NDVI data, growing degree days information and a Gaussian mixture model, Remote Sens. Environ., 195, 244–258, https://doi.org/10.1016/j.rse.2017.04.026, 2017.
Tao, J. B., Zhang, X. Y., Wu, Q. F., and Wang, Y.: Mapping winter rapeseed in South China using Sentinel-2 data based on a novel separability index, J Integr Agric., 22, 1645-1657, https://doi.org/10.1016/j.jia.2022.10.008, 2023.
Tian, H. F., Wang, Y. J., Chen, T., Zhang, L. J., and Qin, Y. C.: Early-Season Mapping of Winter Crops Using Sentinel-2 Optical Imagery, Remote Sens., 13, 3822, https://doi.org/10.3390/rs13193822, 2021.
Van Tricht, K., Degerickx, J., Gilliams, S., Zanaga, D., Battude, M., Grosu, A., Brombacher, J., Lesiv, M., Bayas, J. C. L., Karanam, S., Fritz, S., Becker-Reshef, I., Franch, B., Mollà-Bononad, B., Boogaard, H., Pratihast, A. K., Koetz, B., and Szantoi, Z.: WorldCereal: a dynamic open-source system for global-scale, seasonal, and reproducible crop and irrigation mapping, Earth Syst. Sci. Data, 15, 5491–5515, https://doi.org/10.5194/essd-15-5491-2023, 2023.
Veloso, A., Mermoz, S., Bouvet, A., Le Toan, T., Planells, M., Dejoux, J. F., and Ceschia, E.: Understanding the temporal behavior of crops using Sentinel-1 and Sentinel-2-like data for agricultural applications, Remote Sens. Environ., 199, 415–426, https://doi.org/10.1016/j.rse.2017.07.015, 2017.
Wang, S., Azzari, G., and Lobell, D. B.: Crop type mapping without field-level labels: Random forest transfer and unsupervised clustering techniques, Remote Sens. Environ., 222, 303–317, https://doi.org/10.1016/j.rse.2018.12.026, 2019.
Wang, X., Li, X. B., Tan, M. H., and Xin, L. J.: Remote sensing monitoring of changes in winter wheat area in North China Plain from 2001 to 2011, T. CSAE, 31, 190–199, https://doi.org/10.3969/j.issn.1002-6819.2015.08.028, 2015.
Wardlow, B. D., Egbert, S. L., and Kastens, J. H.: Analysis of time–series MODIS 250 m vegetation index data for crop classification in the US Central Great Plains, Remote Sens. Environ., 108, 290–310, https://doi.org/10.1016/j.rse.2006.11.021, 2007.
Xu, J. F., Zhu, Y., Zhong, R. H., Lin, Z. X., Xu, J. L., Jiang, H., Huang, J. F., Li, H. F., and Lin, T.: DeepCropMapping: a multi-temporal deep learning approach with improved spatial generalizability for dynamic corn and soybean mapping, Remote Sens. Environ., 247, 111946, https://doi.org/10.1016/j.rse.2020.111946, 2020.
Xu, S., Zhu, X. L., Chen, J., Zhu, X. L., Duan, M. J., Qiu, B. W., Wang, L. M., Tan, X. Y., Xu, Y. N., and Cao, R. C.: A robust index to extract paddy fields in cloudy regions from SAR time series, Remote Sens. Environ., 285, 113374, https://doi.org/10.1016/j.rse.2022.113374, 2023.
Xu, X. M., Conrad, C., and Doktor, D.: Optimising phenological metrics extraction for different crop types in Germany using the moderate resolution imaging Spectrometer (MODIS), Remote Sens., 9, 254, https://doi.org/10.3390/rs9030254, 2017.
Yang, J. Y., Wu, T. X., Sun, X. Y., Liu, K., Farhan, M., Zhao, X., Gao, Q. S., Yang, Y. Y., Shao, Y. H., and Wang, S. D.: Global 24 solar terms phenological MODIS normalized difference vegetation index dataset in 2001–2022, Geosci. Data J., 11, 936–947, https://doi.org/10.1002/gdj3.268, 2024a.
Yang, J., Yan, D. M., Yu, Z. L., Wu, Z. N., Wang, H. L., Liu, W. M., Liu, S. M., and Yuan, Z.: NDVI variations of different terrestrial ecosystems and their response to major driving factors on two side regions of the Hu-Line, Ecol. Indic., 159, 111667, https://doi.org/10.1016/j.ecolind.2024.111667, 2024b.
Yaramasu, R., Bandaru, V., and Pnvr, K.: Pre-season crop type mapping using deep neural networks, Comput. Electron. Agric., 176, 105664, https://doi.org/10.1016/j.compag.2020.105664, 2020.
Yin, L. K., You, N. S., Zhang, G. L., Huang, J. X., and Dong, J. W.: Optimizing Feature Selection of Individual Crop Types for Improved Crop Mapping, Remote Sens., 12, 162, https://doi.org/10.3390/rs12010162, 2020.
You, L. Z., Wood, S., Wood-Sichra, U., and Wu, W. B.: Generating global crop distribution maps: from census to grid, Agric. Syst., 127, 53–60, https://doi.org/10.1016/j.agsy.2014.01.002, 2014.
Zhang, D. Y., Fang, S. M., She, B., Zhang, H. H., Jin, N., Xia, H. M., Yang, Y. Y., and Ding, Y.: Winter Wheat Mapping Based on Sentinel-2 Data in Heterogeneous Planting Conditions, Remote Sens., 11, 2647, https://doi.org/10.3390/rs11222647, 2019a.
Zhang, H. Y., Du, H. Y., Zhang, C. K., and Zhang, L. P.: An automated early-season method to map winter wheat using time-series Sentinel-2 data: A case study of Shandong, China, Comput Electron Agric., 182, 105962, https://doi.org/10.1016/j.compag.2020.105962, 2021.
Zhang, L., Liu, Z., Liu, D. Y., Xiong, Q., Yang, N., Ren, T. W., Zhang, C., Zhang, X. D., and Li, S. M.: Crop mapping based on historical samples and new training samples generation in Heilongjiang Province, China, Sustain., 11, 5052, https://doi.org/10.3390/su11185052, 2019b.
Zhang, X. W., Liu, J. F., Qin, Z. Y., and Qin, F.: Winter wheat identification by integrating spectral and temporal information derived from multi-resolution remote sensing data, J. Integr. Agric., 18, 2628–2643, https://doi.org/10.1016/S2095-3119(19)62615-8, 2019c.
Zhao, G. C., Chang, X. H., Wang, D. M., Tao, Z. Q., Wang, Y. J., Yang, Y. S., and Zhu, Y. J.: General Situation and Development of Wheat Production, Crops., 4, 1–7, https://doi.org/10.16035/j.issn.1001-7283.2018.04.001, 2018.
Zheng, Y., dos Santos Luciano, A. C., Dong, J., and Yuan, W. P.: High-resolution map of sugarcane cultivation in Brazil using a phenology-based method, Earth Syst. Sci. Data., 14, 2065–2080, https://doi.org/10.5194/essd-14-2065-2022, 2022.
Zhong, L., Gong, P., and Biging, G. S.: Efficient corn and soybean mapping with temporal extendability: A multi-year experiment using Landsat imagery, Remote Sens. Environ., 140, 113, https://doi.org/10.1016/j.rse.2013.08.023, 2014.


