the Creative Commons Attribution 4.0 License.
the Creative Commons Attribution 4.0 License.
 | 13 Mar 2025
Multi-year observations of near-bed hydrodynamics and suspended sediment at the core of the estuarine turbidity maximum of the Changjiang Estuary
Zaiyang Zhou
Dirk Sebastiaan van Maren
Hualong Luan
Wenyun Guo
Jianfei Ma
Yingjia Tao
Peng Xu
Fuhai Dao
Wanlun Yang
Keteng Ke
Shenyang Shi
Jingting Zhang
Yu Kuai
Cheng Li
Jinghua Gu
Pingxing Ding
A comprehensive multi-year field campaign, the North Passage Channel Measurements (NP-ChaM), was designed and executed to enhance our understanding of the hydrodynamics and sediment dynamics in the North Passage, the primary navigation channel of the Changjiang Estuary, China. The NP-ChaM campaign comprised eight observational sites and spanned 50 d, distributed over 4 years, including two dry seasons and two wet seasons. A series of tripod systems, equipped with multiple instruments, were deployed on the seabed to monitor near-bed physical processes reliably.
The resulting dataset comprises the following: (i) fluid motions, encompassing pressure, flow velocity and direction (at the bottom and throughout the entire water column), and wave patterns; (ii) near-bed environmental conditions, including temperature, salinity, and turbidity (at the bottom and across a near-bed 1-meter range); (iii) supplementary meteorological data sourced from credible providers; and (iv) preliminary results from post-processing, showcasing the practical application of the data, such as lateral flows and turbulent kinetic energy characterizations.
This dataset is especially valuable due to its extensive temporal and spatial coverage, as well as the high concentrations characterizing many of the observations (from several grams per liter to tens of grams per liter). Conducted annually from 2015 to 2018, the NP-ChaM campaign facilitated detailed observations of seasonal variations in environmental conditions and associated physical processes. The eight observational sites, positioned on either side of the deep channel, enable quantifications of channel–shoal exchanges, along-channel flow dynamics, and saltwater intrusion. This dataset is suitable for advancing our understanding of along-channel and cross-channel dynamics in a channel–shoal system and for calibrating numerical models. The dataset has undergone rigorous quality control to ensure reliability and accuracy. The NP-ChaM dataset is publicly available at https://doi.org/10.4121/6d4fcaff-6a30-4990-881a-a5ac8ebb1ca6 (Zhou and Ge, 2024).
- Article
(15782 KB) - Full-text XML
- BibTeX
- EndNote


Decline in the fluvial sediment supply has been reported across major river systems and estuaries worldwide (Besset et al., 2019; Syvitski et al., 2009). One primary reason for this decline is the construction of reservoirs in upstream areas. Consequently, the reduction in sediment load can lead to a possible decrease in suspended sediment concentration (SSC), potentially affecting the morphodynamics of estuaries and coasts. However, sediment dynamics are influenced by sediment availability and redistribution by hydrodynamic processes, both of which are increasingly affected by human interventions. As a result, a reduction in background SSC may coincide with a local increase in SSC levels (e.g., in the estuarine turbidity maximum – ETM), complicating the understanding of mechanisms driving sediment dynamics.
ETMs occur in many estuarine or riverine systems all over the world, including the Changjiang Estuary (Wu et al., 2012), the Hudson River estuary (Ralston et al., 2012), the Delaware Estuary (McSweeney et al., 2016), the Scheldt River (van Maren et al., 2011), and the Rotterdam Waterway (de Nijs and Pietrzak, 2012). ETMs form as a result of sediment transport. The near-bed, landward estuarine circulation associated with the salt wedge and the seaward mean river flow influences residual transport as well as the settling of sediment. Other mechanisms, such as stratification asymmetry (Geyer, 1993), transitions in bathymetry (Fugate et al., 2007; Kim and Voulgaris, 2008; Nichols, 1972), and various tidal pumping mechanisms (Du et al., 2022; Geyer and Ralston, 2011; Jiang et al., 2013; Okubo, 1973), also have impacts on sediment and ETM dynamics. On the other hand, sediment dynamics can also provide feedbacks to hydrodynamics. For instance, sediment-induced stratification will suppress turbulent mixing and influence tidal propagation by altering bottom drag. Therefore, locations of ETMs usually have active and complex fluid and sediment dynamics and are hotspots in estuary research. Additionally, human interventions including reclamation, channel deepening, and engineering structures significantly affect turbidity levels and the ETMs. For example, reclamations can influence the accommodation space for suspended fine sediments and therefore reduce system resilience to engineering works such as channel deepening (Winterwerp et al., 2013). The Changjiang Estuary (CE), as an example, has been extensively investigated in terms of the causality between the turbidity transition and engineering interventions.
The CE, positioned in the southeastern China, functions as a critical gateway to the East China Sea (Fig. 1). It supports the economic vitality of its adjacent Yangtze River Delta Economic Zone, thus rendering the navigability of its waterway imperative for regional development. Its navigability is guaranteed by maintaining the depth of the North Passage (NP) as a principal outlet. The Deepwater Navigation Channel (DNC) project, initiated in 1998, has been pivotal in increasing the throughput capacity of vessels navigating through the CE. Recent years have witnessed annual dredging volumes approximately between 40 and 60×106 m3, a reduction from the peak volumes of 70×106 m3 observed shortly after the DNC's completion, yet still surpassing the expectations of about 30×106 m3 projected post-completion (Jiang et al., 2013; Liu et al., 2011). In spite of the important economic and ecological functions of the North Passage, the sediment dynamics within the passage are still poorly understood. For instance, despite its potential important contribution to channel siltation, it remains unclear whether high-concentration, sediment-density-driven currents may flow from groyne-protected shallow shoals into deeper channels, potentially serving as a primary depositional source. Rigorous testing and validation of such a hypothesis necessitate extensive near-bed empirical observations and robust data aggregation.
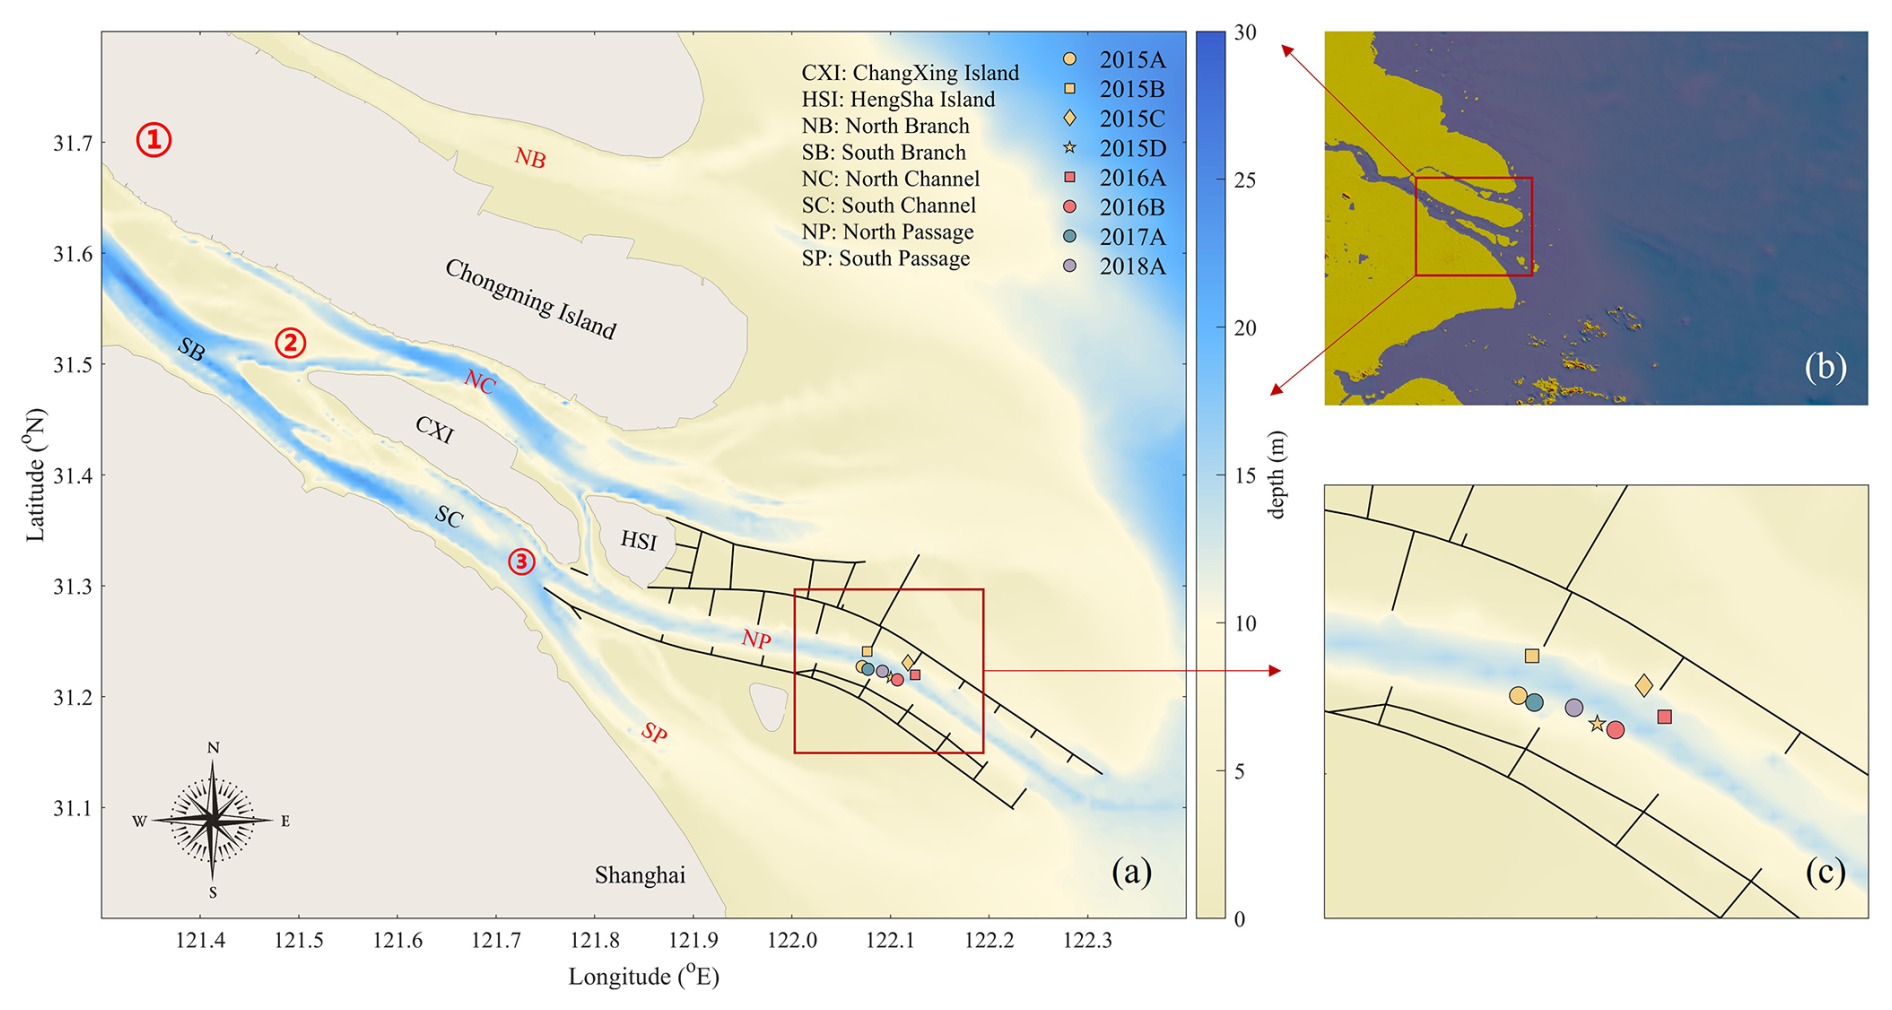
Figure 1Location of all observational sites (eight in total) during the NP-ChaM campaign. Panel (a) displays a detailed map along with the bathymetry of the Changjiang Estuary. Black lines represent hard engineering structures of the Deep Navigation Channel project, i.e., dikes and groynes. Red numbers and abbreviations are bifurcations and outlets of the estuary. Panel (b) is a zoomed-out map of the East China Sea. Panel (c) is a zoomed-in map of the North Passage including detailed observational sites. Note the quadrangles (rectangle and diamond) represent the sites to the north side of the deep channel.
Given its centrality within the ETM and substantial socio-economic implications, the NP has attracted significant interest from both the academic and management sectors. Extensive field investigations utilizing various methodologies have been conducted (Ge et al., 2018; Lin et al., 2021; Liu et al., 2011; Song et al., 2013). However, these studies, often constrained by their spatial and temporal extent, do not fully cover the dynamics of the ETM in the CE. Although some of these studies have published their datasets, conducting integrated and comparative analyses based on these datasets is difficult due to the diverse objectives, instrumental configurations, and measurement quality of different field campaigns. The NP-ChaM campaign, conducted from 2015 to 2018, was thus formulated to establish a comprehensive dataset of near-bed physical processes in the NP, spanning both dry and wet seasons and encompassing varying tidal conditions. The outcomes and prospects of this dataset are manifold: it enhances the continuity of observational data, advances our understanding of hydrodynamics and sediment dynamics within both the NP and the broader ETM of the CE (e.g., Ge et al., 2018; Zhou et al., 2021), and provides data for improving numerical models or developing AI-based predictive tools in future work tasked with resolving near-bed high-SSC suspension dynamics.
This paper delineates the data collection methodologies implemented during the NP-ChaM campaign and the quality of the resulting dataset and provides an initial analysis of the resulting dataset. Section 2 describes the study area and the observational sites utilized. The design of the observation campaign is explained in Sect. 3. Section 4 introduces the technical approaches including the frame structure, instrumentation setup, and data processing techniques. Results from the observational campaign are detailed in Sect. 5. Information pertaining to data accessibility and the concluding insights are presented in Sects. 6 and 7, respectively.
The Changjiang Estuary has three levels of bifurcations and four outlets (Wang et al., 2015) connecting the Changjiang River to the East China Sea (Fig. 1). Three bifurcations, marked by numbered circles in Fig. 1, divide the estuary into (1) the North Branch and the South Branch, (2) the North Channel and the South Channel (which bifurcate from the South Branch), and (3) the North Passage and the South Passage (which bifurcate from the South Channel). The North Branch accounts for only about 5 % of the Changjiang River discharge, with most of the river flow being conveyed through the South Branch. The North Passage serves as the primary navigation channel that supports the shipping requirements of Shanghai and its surrounding regions. This mesotidal system is characterized by semidiurnal tides with a mean tidal range of about 2.7 m.
The Changjiang River is a major source of freshwater for the inner shelf of the East China Sea (Fig. 1). Despite the impact of upstream dams and reservoirs, such as the Three Gorges Dam (Guo et al., 2018; Yang et al., 2011), the annual sediment load remains approximately 100–300 Mt (Luan et al., 2016). The highest concentrations occur in the ETM, in the NP, strongly influencing sediment siltation. Previous studies show that the mean floc diameters measured in the North Passage of the Changjiang Estuary ranged from 14 to 95 mm (Guo et al., 2017). The dominant sediment type is clayey silt, which is primarily deposited in the lower reaches of the ETM Zone of the CE and on the outer estuary (Liu et al., 2010). To enhance the navigability of the NP, the DNC project was implemented in the period 1998–2010 (Luan et al., 2018), including 2 long dikes and 19 perpendicular groynes to regulate flow dynamics, reduce sediment deposition, and maintain a channel water depth of 12.5 m. Besides these structural measures, regular dredging operations are also performed. These engineering solutions, both hard and soft, have transformed the NP into a channel–shoal system where lateral sediment exchange is an important feature. Additionally, three reservoirs (Dongfengxiasha, Chenhang, Qingcaosha) storing freshwater in the CE frequently suffer from saltwater intrusion, threatening the freshwater availability to the city of Shanghai. To thoroughly examine the hydrodynamics, salinity, and sediment dynamics in the NP, the NP-ChaM campaign was strategically planned and executed.
The NP-ChaM campaign is designed to improve the understanding of hydrodynamics and sediment dynamics in the NP. The principles guiding the measurement design have been organized into three categories, considering both spatial and temporal scales. We will initially discuss these considerations (Sect. 3.1–3.3) and subsequently introduce the observation program (Sect. 3.4).
3.1 To unravel the relationship between salt and sediment dynamics
Saltwater intrusion presents a critical challenge affecting the freshwater resources of the densely populated and economically important CE Delta. This saltwater intrusion is influenced by interactions between sediment dynamics and saltwater salinity stratification (Becker et al., 2018; van Maanen and Sottolichio, 2018; Zhu et al., 2013). Specifically, saltwater intrusion facilitates the landward migration of fluid mud, altering sediment transport mechanisms (Ge et al., 2020), while elevated sediment concentrations can dampen turbulence, subsequently affecting hydraulic drag and tidal dynamics (Zhu et al., 2023). In the NP, observations frequently reveal the presence of a salt wedge and concentrated benthic suspension (CBS; Chen et al., 2019; Ge et al., 2018; Pu et al., 2015; Xue et al., 2009), underscoring the significance of their synergistic impacts on regional hydrodynamics, as both can influence the stratification and mixing conditions.
For the NP system, saltwater intrusion is notably more severe during dry seasons due to lower river outflow, and conversely, it is exacerbated by tropical storms during wet seasons. The intrusion predominantly occurs in the lower water column, where higher concentrations of suspended sediments are also observed, making the analysis of bottom salinity and SSC crucial for unraveling the roles of salt and sediment dynamics. Additionally, the vertical processes occurring near the benthic layer, including stratification and mixing, sediment deposition, and erosion, play critical roles in influencing sediment characteristics and behaviors. Consequently, monitoring efforts should concentrate on the bottom layers to capture these key processes effectively.
3.2 To capture lateral flows and sediment exchange in the NP
Lateral flows and lateral transport of suspended sediment are important processes in the NP (Chen and de Swart, 2018; Zhou et al., 2021; Zhu et al., 2018). The primary drivers of these lateral flows and material transport include channel bathymetry (Valle-Levinson et al., 2000), curvature (Kranenburg et al., 2019; Pein et al., 2018), differential advection (MacCready and Geyer, 2010), barotropic and baroclinic gradients (Lerczak and Rockwell Geyer, 2004), and Coriolis effects (Cossu and Wells, 2010). Beyond these extensively studied natural mechanisms, human interventions (particularly through engineering projects) also significantly modulate lateral processes. For instance, the exchange dynamics between groyne fields and the main channel (Ten Brinke et al., 2004; McCoy et al., 2007; Uijttewaal, 2005; Uijttewaal et al., 2001) have been investigated, utilizing laboratory or numerical simulations with only a limited number based on in situ observations. A limitation of laboratory experiments is related to scaling (especially in combination with salinity stratification), while both laboratory and numerical approaches only limitedly account for the combined impacts of engineering structures and estuarine environmental conditions. The lack of detailed field observations therefore limits our understanding of lateral processes in estuarine systems.
Previous observations have revealed, for instance, that dikes and groynes influence the salinity distribution in shallow shoals, creating lateral density gradients and consequently driving characteristic lateral flow patterns during low-water-slack periods (Zhou et al., 2019). Thus, in situ observations provide deeper insights into phenomena and mechanisms that may be overlooked when using scales that do not capture real-world conditions. Strategically positioned measurement stations spanning both shoals and the deeper channel are essential to effectively monitor lateral flows and sediment transport in complex channel–shoal systems (Geyer et al., 2020), such as the NP.
3.3 To cover seasonal and spring–neap variations in near-bed processes
The seasonal discharge variability of the Changjiang River is pronounced. During the wet season, measurements at the Datong station (the most downstream river gauging station) indicate river discharges exceeding 90 000 m3 s−1. Concurrently, the delta region frequently faces typhoons and tropical storms. Conversely, in the dry season, the discharge may be lower than 10 000 m3 s−1, and storms are more common, promoting enhanced saline intrusion events. Such seasonal variations in river discharge and weather conditions exert significant influence on hydrodynamics and sediment dynamics.
Tidal conditions also drive physical processes in the system; therefore, observations need to monitor spring–neap variations. To comprehensively understand these dynamics, observations should span both the wet and dry seasons, capturing the transition from spring to neap tides. The NP is characterized by a semi-diurnal tide, with each spring–neap cycle spanning approximately 14 d. Therefore, each monitoring campaign aimed at covering 14 d of data as far as possible.
3.4 General introduction to the measurement campaign
Given the relevant spatial and temporal scales, the measurement campaign should: (1) prioritize the bottom layer and the vertical structure of the water column near the seabed; (2) encompass both the northern and southern flanks of the deep channel to comprehensively document the exchange of water and sediments between the channel and adjacent shoals; and (3) include multiple observational periods across both dry and wet seasons, with each measurement lasting about 14 d.
In compliance with these criteria, tripod frames are employed to monitor near-bed physical processes and key variables, including flow velocity and direction, salinity, and SSC. The frames are battery-powered and can continuously work for more than 10 d. A detailed description of the tripod frames and the instruments equipped on them is provided in Sect. 4. As part of the NP-ChaM campaign, four measurement efforts comprising eight stations were implemented between 2015 and 2018 (Fig. 1). The stations are strategically positioned around the middle of the NP, with five situated between the southern shoal and the deep channel and the remaining three between the northern shoal and the deep channel.
4.1 Tripod frames and instruments
The tripod frames used in the NP-ChaM campaign are designed to detect near-bed physical processes. Each is equipped with eight instruments (Fig. 2), including an upward-looking acoustic Doppler current profiler (ADCP; RD Instruments); a downward-looking ADCP; an acoustic Doppler velocimeter (ADV; Nortek AS); a point current meter (ALEC, JFE Advantech Co., Ltd.); a tide and wave logger (RBR, RBR Ltd.); an optical backscatter sensor (OBS-3A, D&A Instrument Co.); a high-resolution Argus Surface Meter-IV (ASM; ARGUS environment Instruments); and a conductivity, temperature, and pressure recorder (CTD; Sea-Bird Electronics, Inc.).
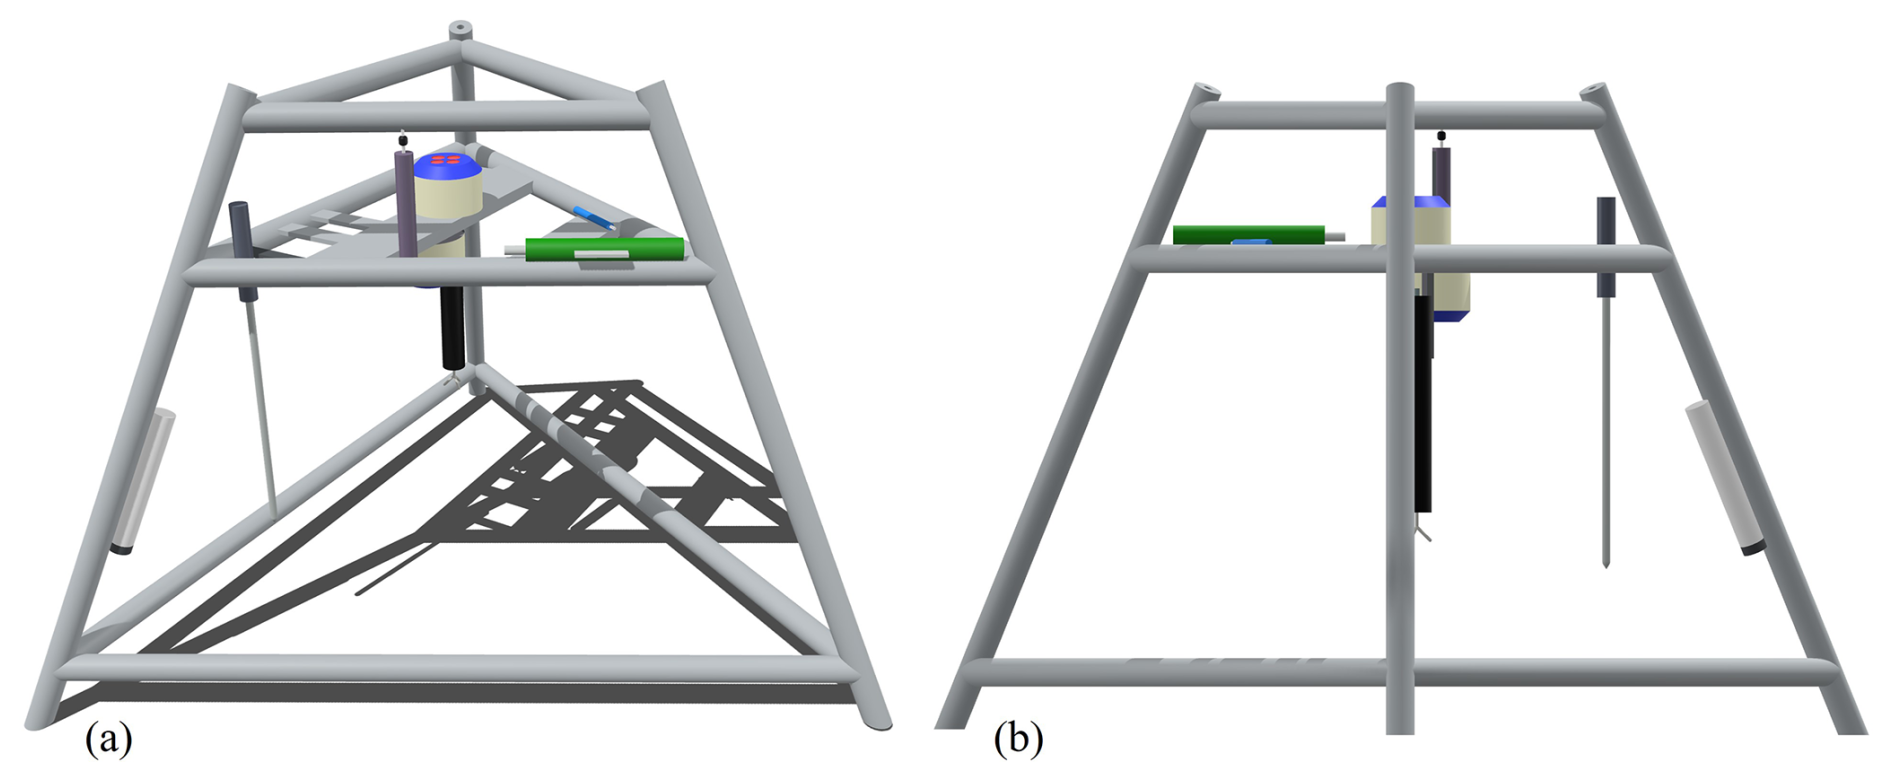
The upward-looking ADCP (ADCP-up, 600 kHz) was used to measure the velocity profile of the upper water column, providing information on the general hydrodynamics, especially the tidal currents. It was mounted 1.2 m above the seabed (abbreviated as m a.s.b.) and configured to measure a vertical bin size of 0.5 m. The ADCP-down used high frequency (1200 kHz) to capture the high vertical resolution (cell size of 0.1 m) of the velocity profile. It was mounted at 1.0 m a.s.b. and, accounting for the blanking range, could observe velocities from 0.2 to 0.7 m a.s.b.
The ADV was mounted at 0.4 m a.s.b. to measure fluid motions with a sampling frequency of 16 Hz. It sampled during the initial 70 s of every 10 min interval, capturing velocity data at approximately 0.25 m a.s.b. With the high-frequency information of flow velocities, the turbulent kinetic energy can be calculated. Both the ADCP and the ADV collected data in ENU (east–north–up) coordinate systems. The ALEC also measured point current velocities, and it was placed at 1.4 m a.s.b. to compensate for the missing data due to the blind area between the ADCP-up and the ADCP-down. The RBR was deployed at 1.0 m a.s.b. to record wave conditions.
Salinity, temperature, and turbidity were measured by the OBS-3A mounted at 0.4 m a.s.b. (2015, 2018) or 0.9 m a.s.b. (2016, 2017). In addition, water level elevation was also detected by the pressure sensor of OBS-3A. The ASM also measured a vertical turbidity profile ranging from 0.05 to 1.0 m a.s.b. and at a vertical resolution of 0.01 m. Both the OBS-3A and the ASM need to be calibrated (see Sect. 4.3) to convert the turbidity data into SSC. In addition, the CTD was intermittently deployed (2016, 2018) to measure water levels, salinity, and temperature as a comparative data source alongside the OBS-3A. Detailed configurations of these instruments are summarized in Table 1.
Table 1Instruments mounted on the tripod and their sampling configurations.
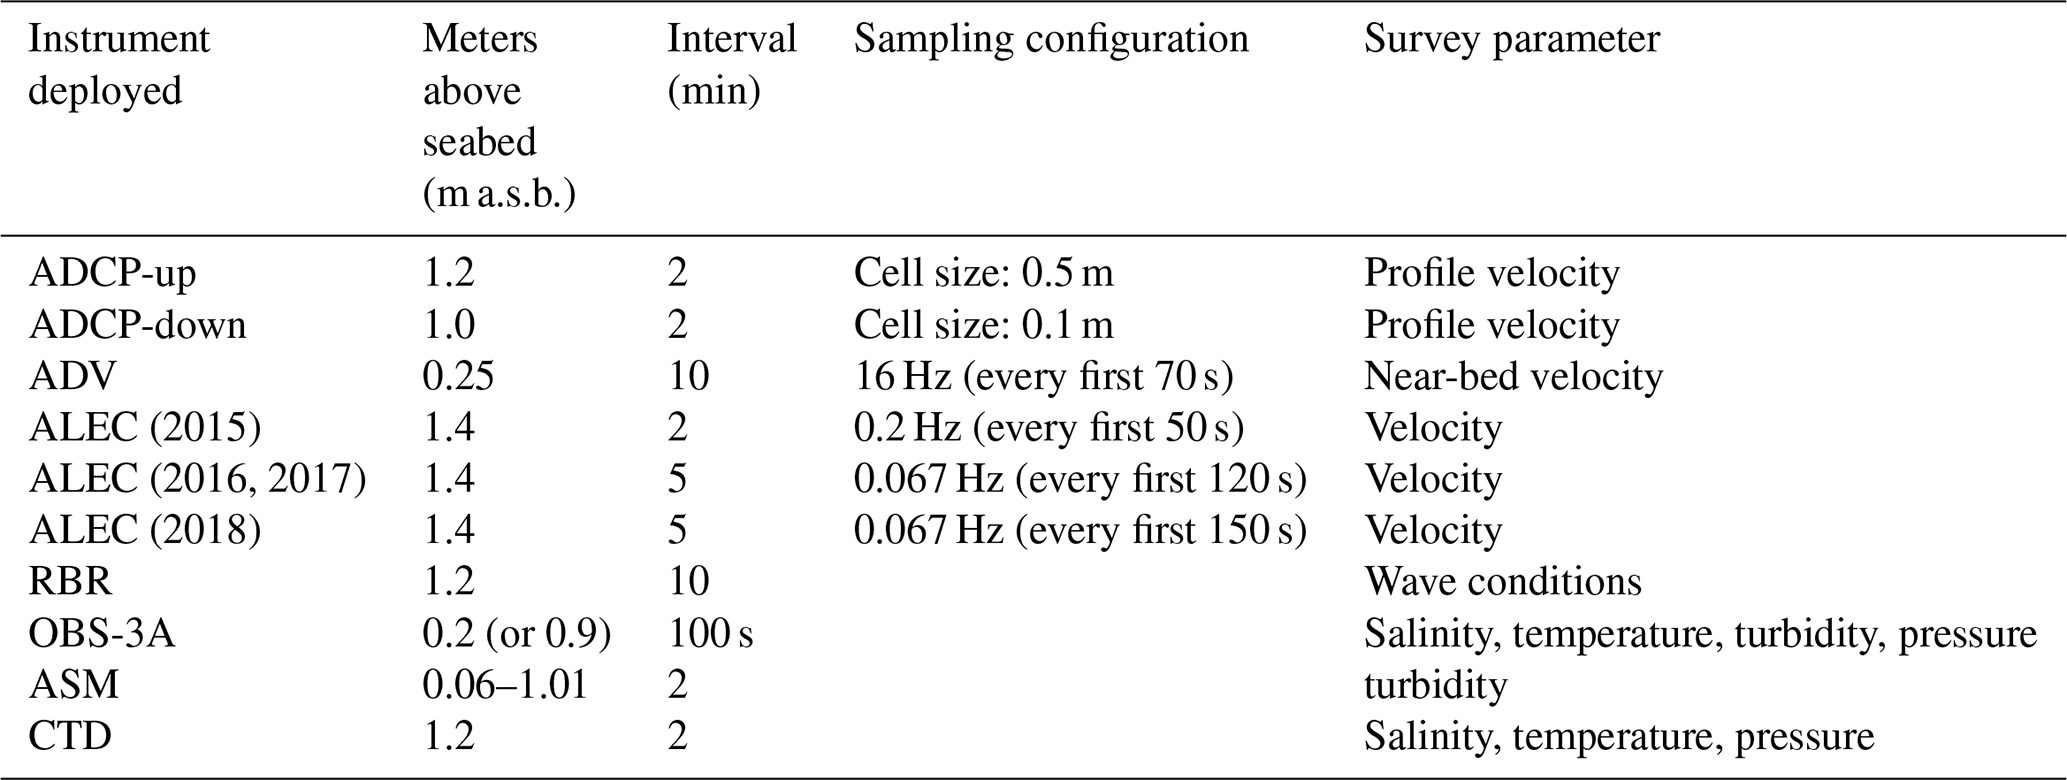
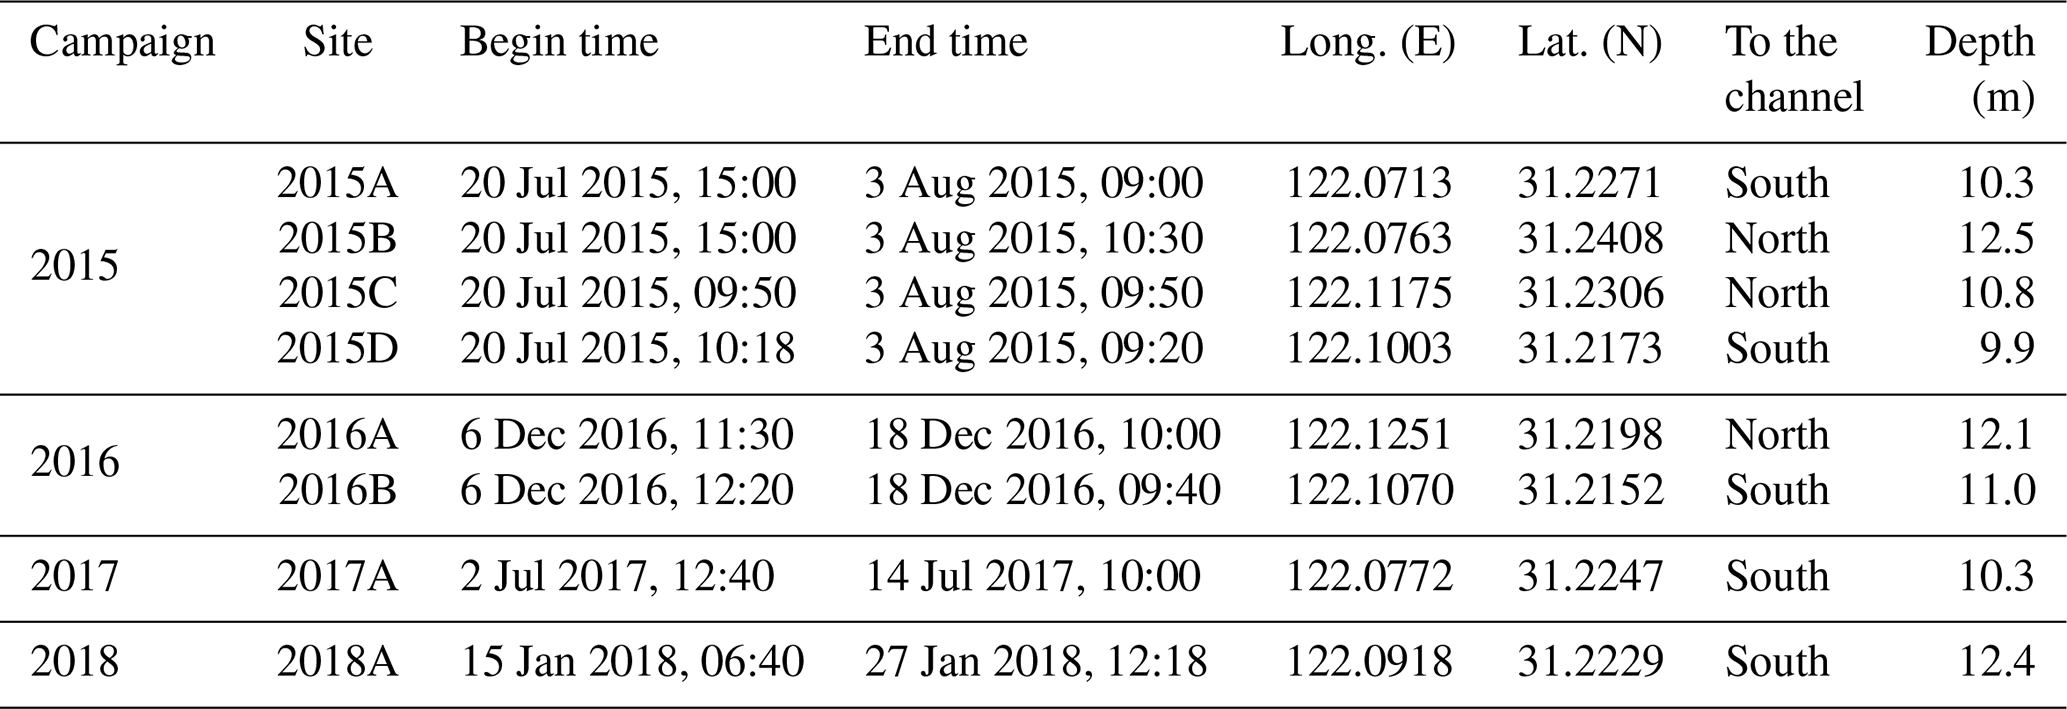
Table 2The measurement periods and positions of each frame measurement campaign. The relative positions of the frames to the deep channel are listed in the last column.
4.2 Deployments
The NP-ChaM campaign had four distinct observational periods: the first in July 2015 (a summer period characterized by high river discharge), which included four sites, denoted as 2015A–2015D; the second in December 2016 (a winter period marked by low river discharge), which comprised two sites, labeled 2016A and 2016B; the third in July 2017 (summer), which featured a single site identified as 2017A; and the fourth in January 2018 (winter), which included one site designated as 2018A. Collectively, the NP-ChaM campaign spanned 4 years and encompassed eight distinct sites. The mean water depth at these observational sites was approximately 12 m. Sites 2015B, 2015C, and 2016A were situated between the deep channel and the northern shoal, whereas the remaining five sites were located between the deep channel and the southern shoal. Detailed deployment information is compiled in Table 2.
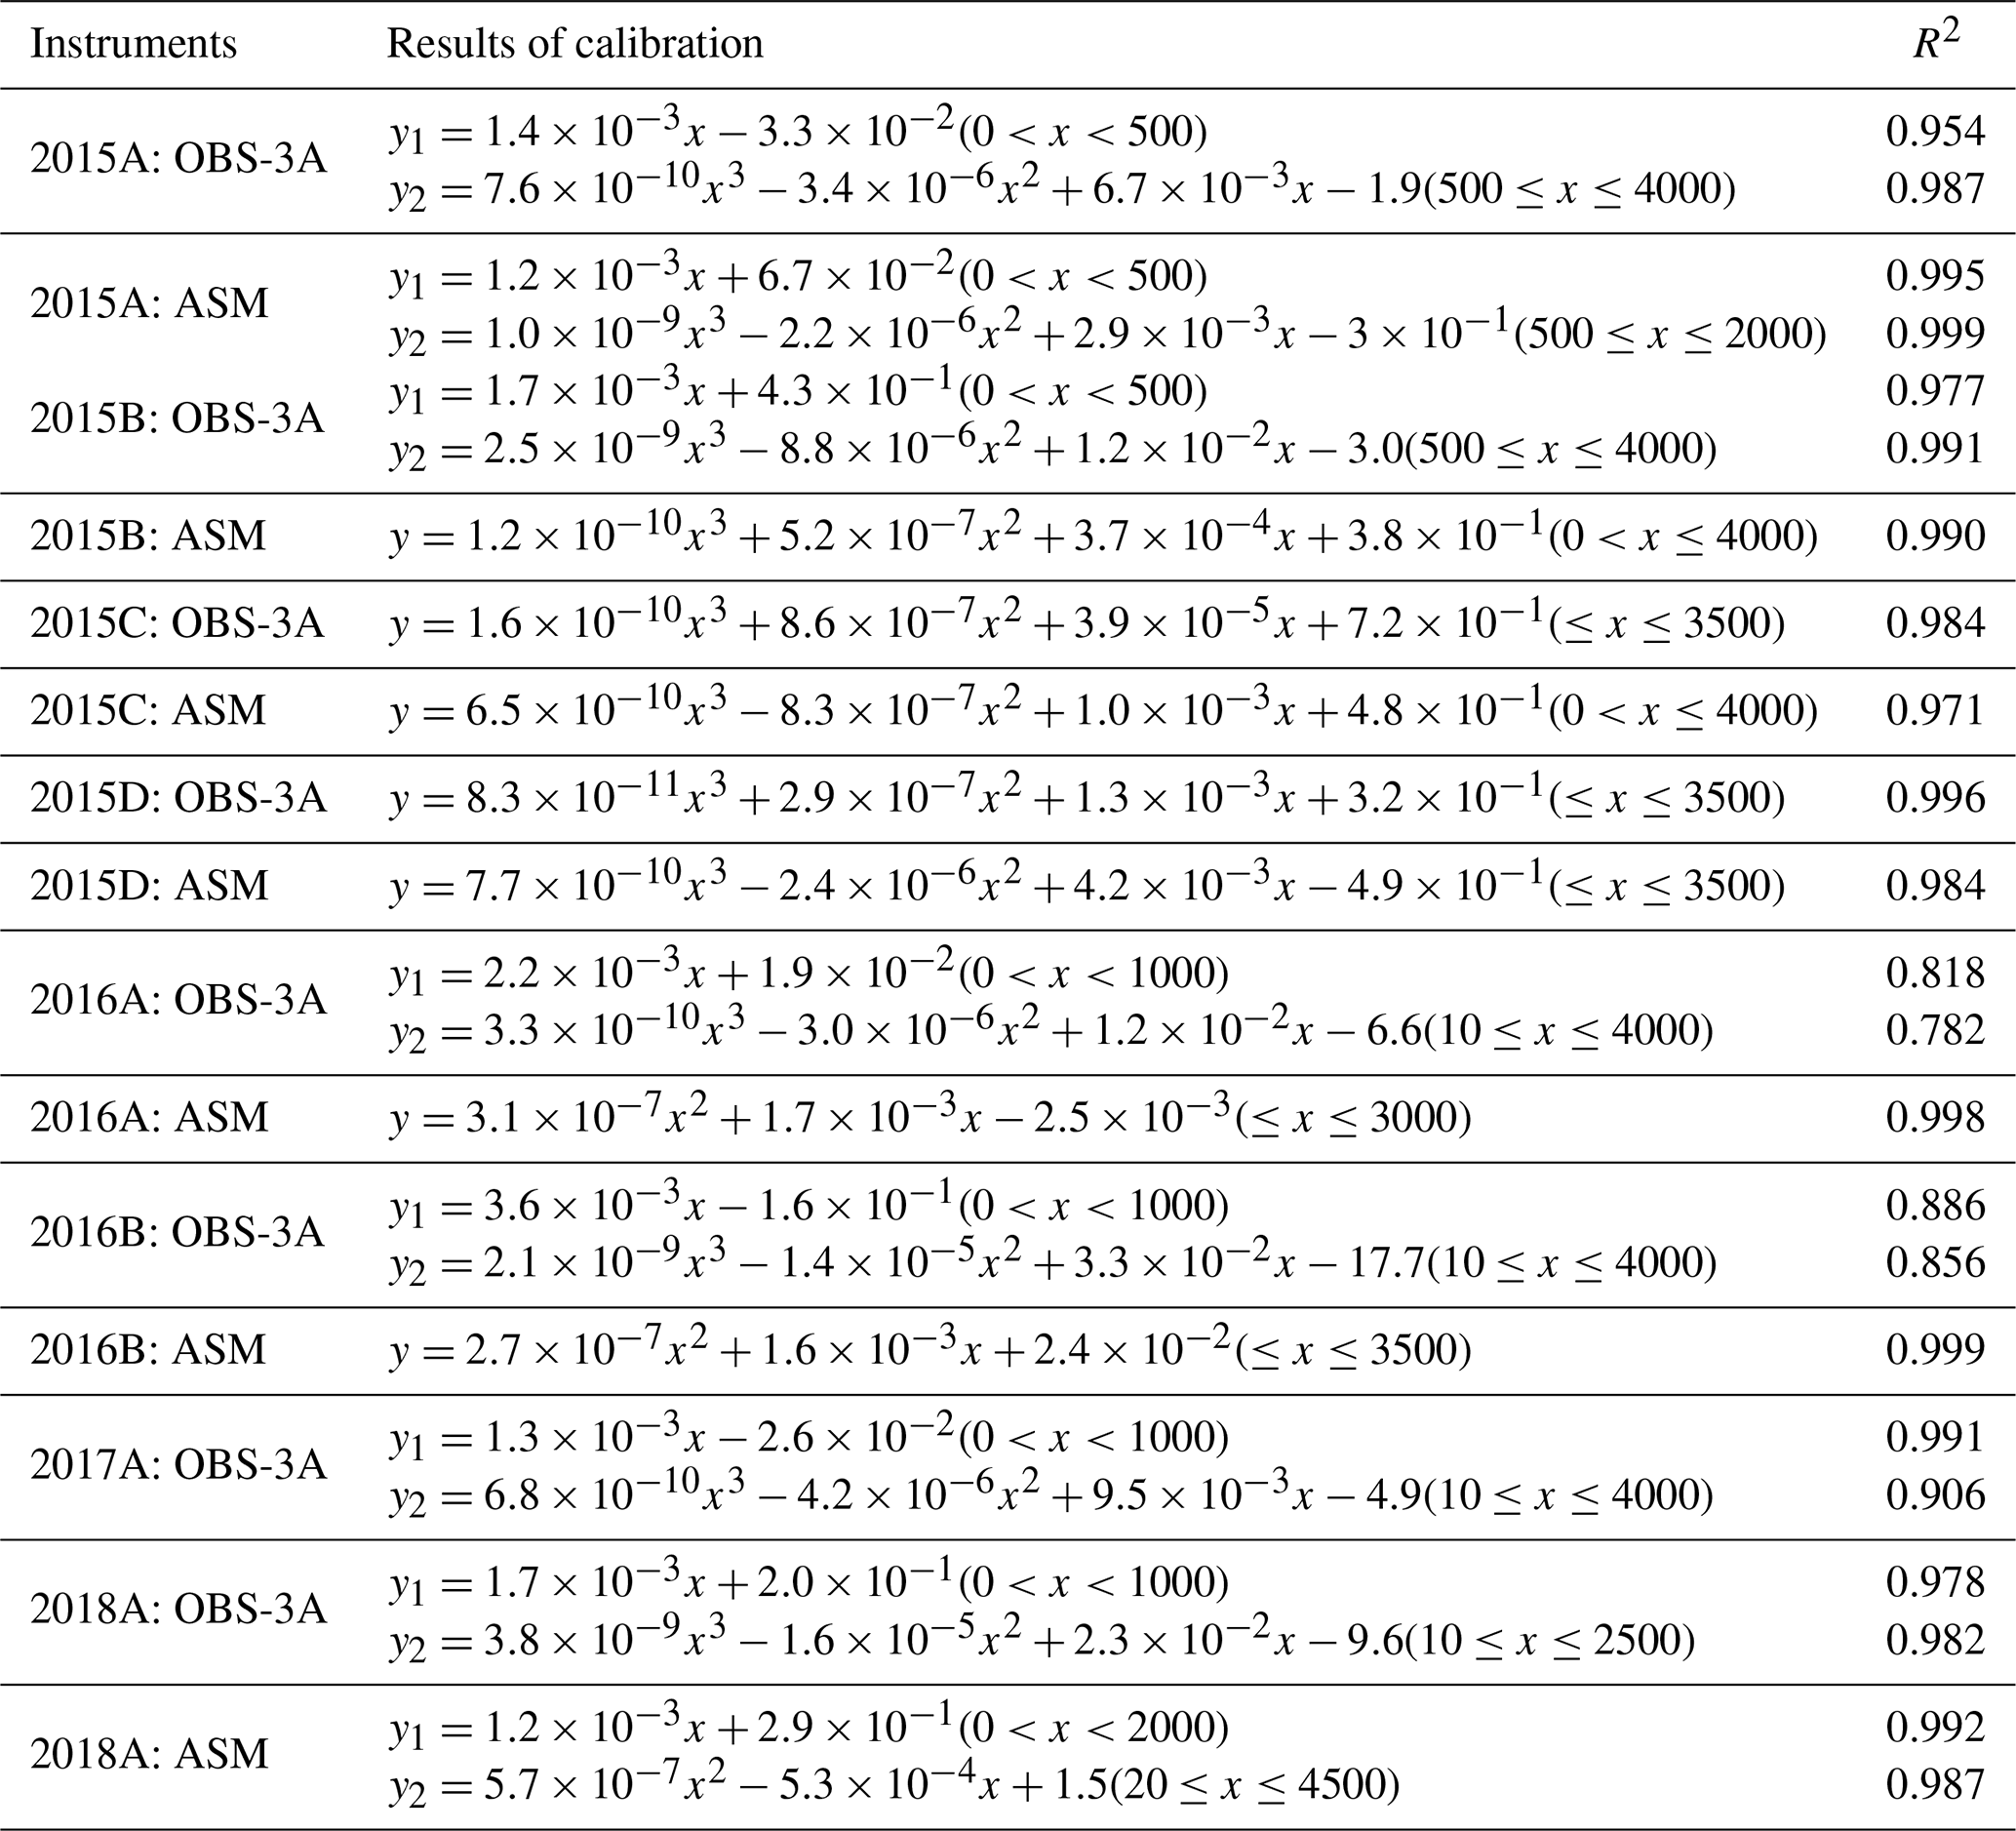
Table 3Regression between optically sensed turbidity and suspended sediment concentration. The variables of x and y represent the optical turbidity and corresponding sediment concentration.
4.3 Data processing
The dataset underwent verification and initial processing following its acquisition. Preliminary data processing included the following steps:
-
Examine all data for outliers, replace the noise with NaN (not a number) using the MATLAB filloutliers function, and clean the ADV data according to beam correlations as well as a 0.5–3 Hz bandpass filter (Kularatne and Pattiaratchi, 2008).
-
Corroborate identical variables recorded by different instruments, such as water level measurements from OBS-3A, RBR, and CTD and salinity values from OBS-3A and CTD.
-
Standardize output into a more accessible format. Detailed processing for each instrument and measured parameter was conducted based on the specific objectives of data utilization. Given that the dataset spans various periods and consists of diverse physical measurements, the overarching intent is to minimally process the raw data to preserve its utility for diverse analytical approaches, primarily focusing on quality assurance.
During each observation, sediment examples on the seabed were taken by the ship-installed mud collector to calibrate the turbidity sensor of the OBS-3A. In our laboratory, the sediment examples were added into a rotating water tank to create gradually increased SSC. Then the regression relationship between the output turbidity signal (nautical turbidity units, NTU) and the known SSC in the water tank could be obtained. The regression equations are provided in Table 3, and the calibration curves are presented in Fig. 3. The ASM was calibrated together with the OBS-3A. Caution should be taken, as it is assumed that the suspended sediment was uniformly distributed in the water tank due to continuous rotation. Based on this assumption, we calibrated the ASM optical sensors simultaneously using the same corresponding suspended sediment concentration. It should be noted that errors may exist due to this assumption; however, it was the optimal choice given the available equipment. These regression functions were subsequently used to transfer the NP-ChaM measured turbidity (NTU) into SSC.
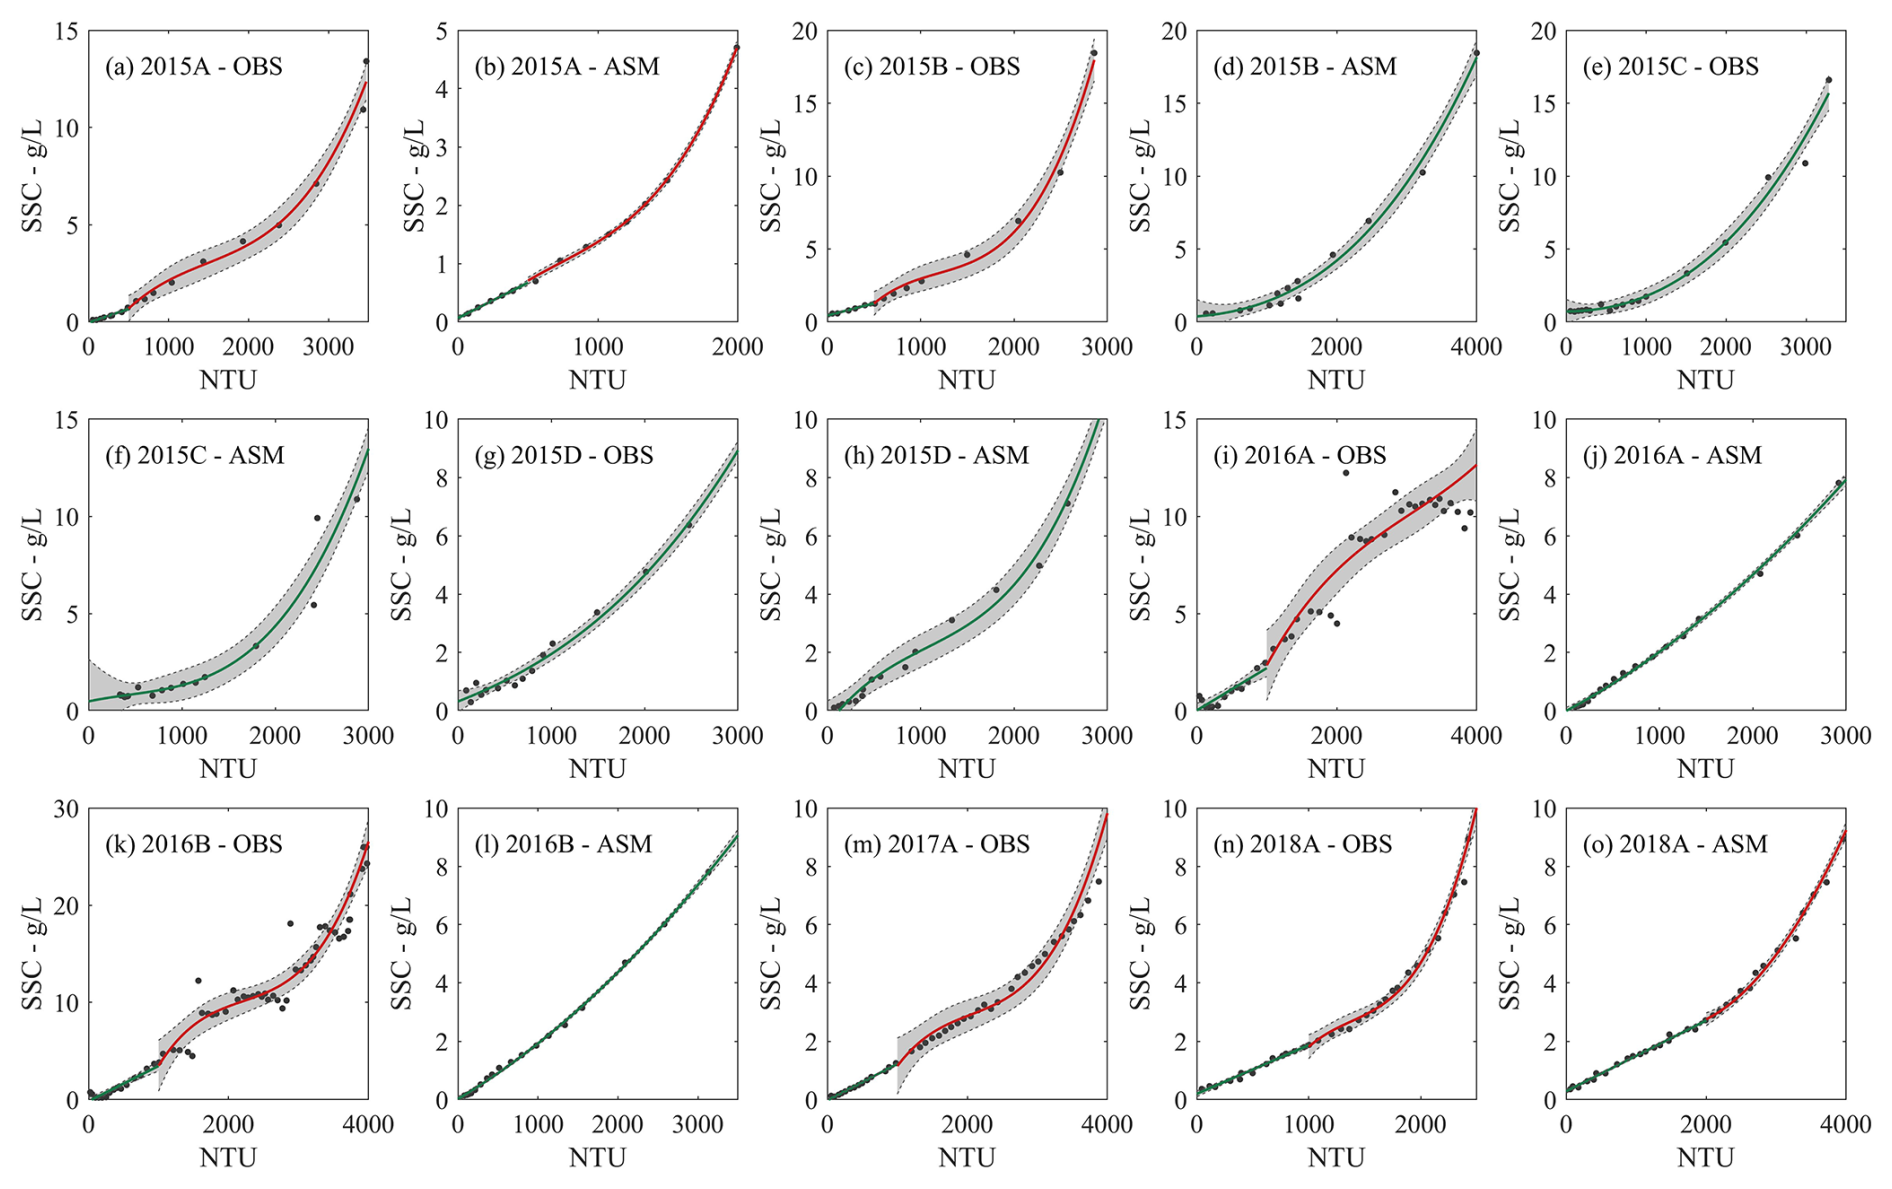
Figure 3Calibration of optical sensors from OBS-3As and ASMs. The grey shadows indicate 95 % prediction intervals.
5.1 Data collection
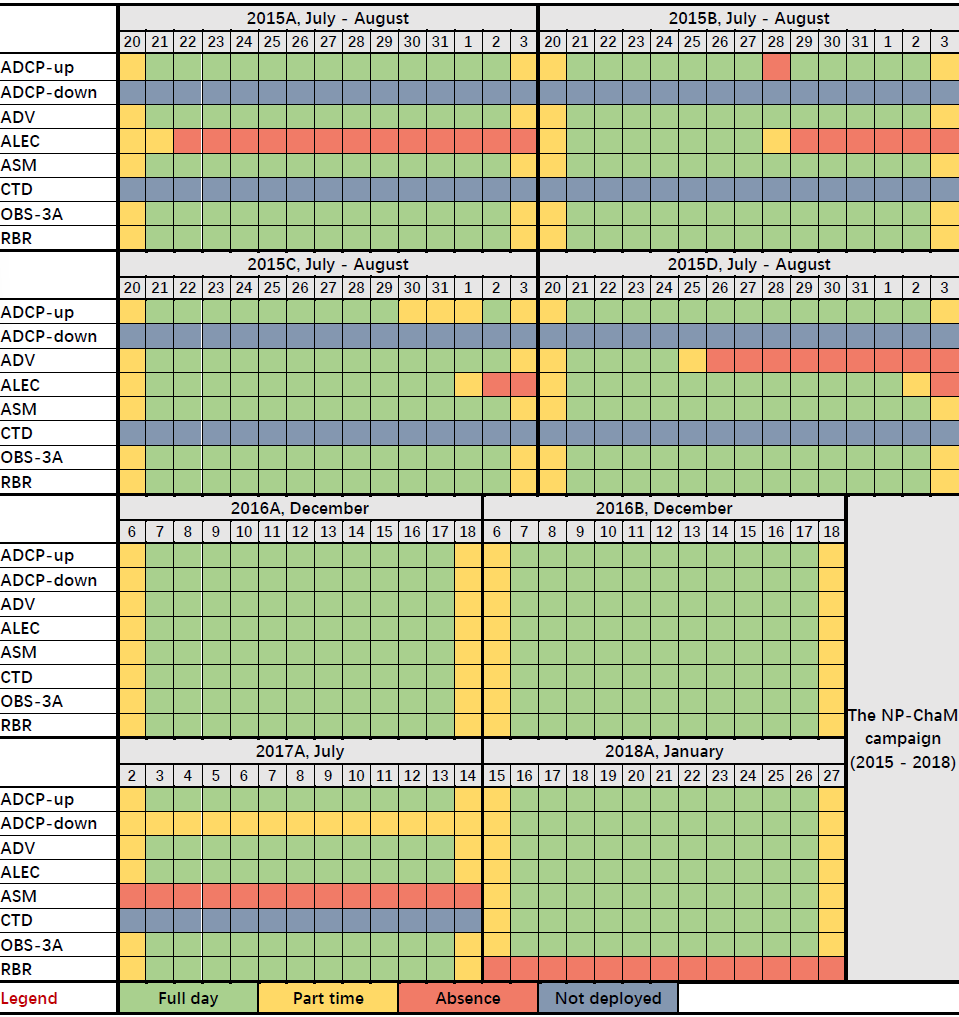
The majority of instruments mounted on the frames functioned well. However, operational interruptions occasionally arose for various reasons, with battery issues stemming from installation errors or accidental collisions being notably frequent. In the NP-ChaM campaign, for instance, the ADV used in the 2015D measurements ceased functioning from the seventh day onward, and the ASM in 2017A, and the RBR in 2018A failed to collect the anticipated data. Therefore, these instruments were excluded from the analysis presented in this paper and from the corresponding published dataset.
The working status of all instruments is depicted in Table 4, using four colors to signify different conditions. Yellow represents instances where data acquisition occurred only during part of the day, typically at the onset and conclusion of each campaign. In addition, for ADCP-up in 2015C, data were incomplete from 30 July to 1 August.
Table 4Summary of working status and data acquisition of all instruments during the NP-ChaM campaign.
The forthcoming sections will present key findings from these observations as well as environmental factors such as wind and river discharge. Details on wave conditions are provided in Sect. 5.3. Flow velocity point and profile measurements as well as lateral flows are presented in Sect. 5.4. The turbulent kinetic energy (TKE), important for understanding stratification and mixing processes, is examined in Sect. 5.5. Temperature and salinity observations are provided in Sect. 5.6, and SSC observations are detailed in Sect. 5.7.
5.2 Wind and river discharge
Figure 4 illustrates the overarching environmental conditions, including wind speed and direction, as well as river discharge. Wind data were sourced from the European Centre for Medium-Range Weather Forecasts (ECMWF) at a nearby location (31.25° N, 122° E). River discharge measurements were collected at the upstream Datong gauge station. The measurements during 2015 and 2017 were carried out in summer (wet season), while those in 2016 and 2018 were conducted in winter (dry season). Summer conditions (Fig. 4a, b, e, and f) were characterized by southerly winds and a relatively high discharge (average values of 45 131 m3 s−1 in 2015 and 67 214 m3 s−1 in 2017). The wind direction was more variable and stronger during both winter campaigns (Fig. 4c and g), while the average river discharge was 17 079 m3 s−1 in 2016 and 15 036 m3 s−1 in 2018 (Fig. 4d and h).
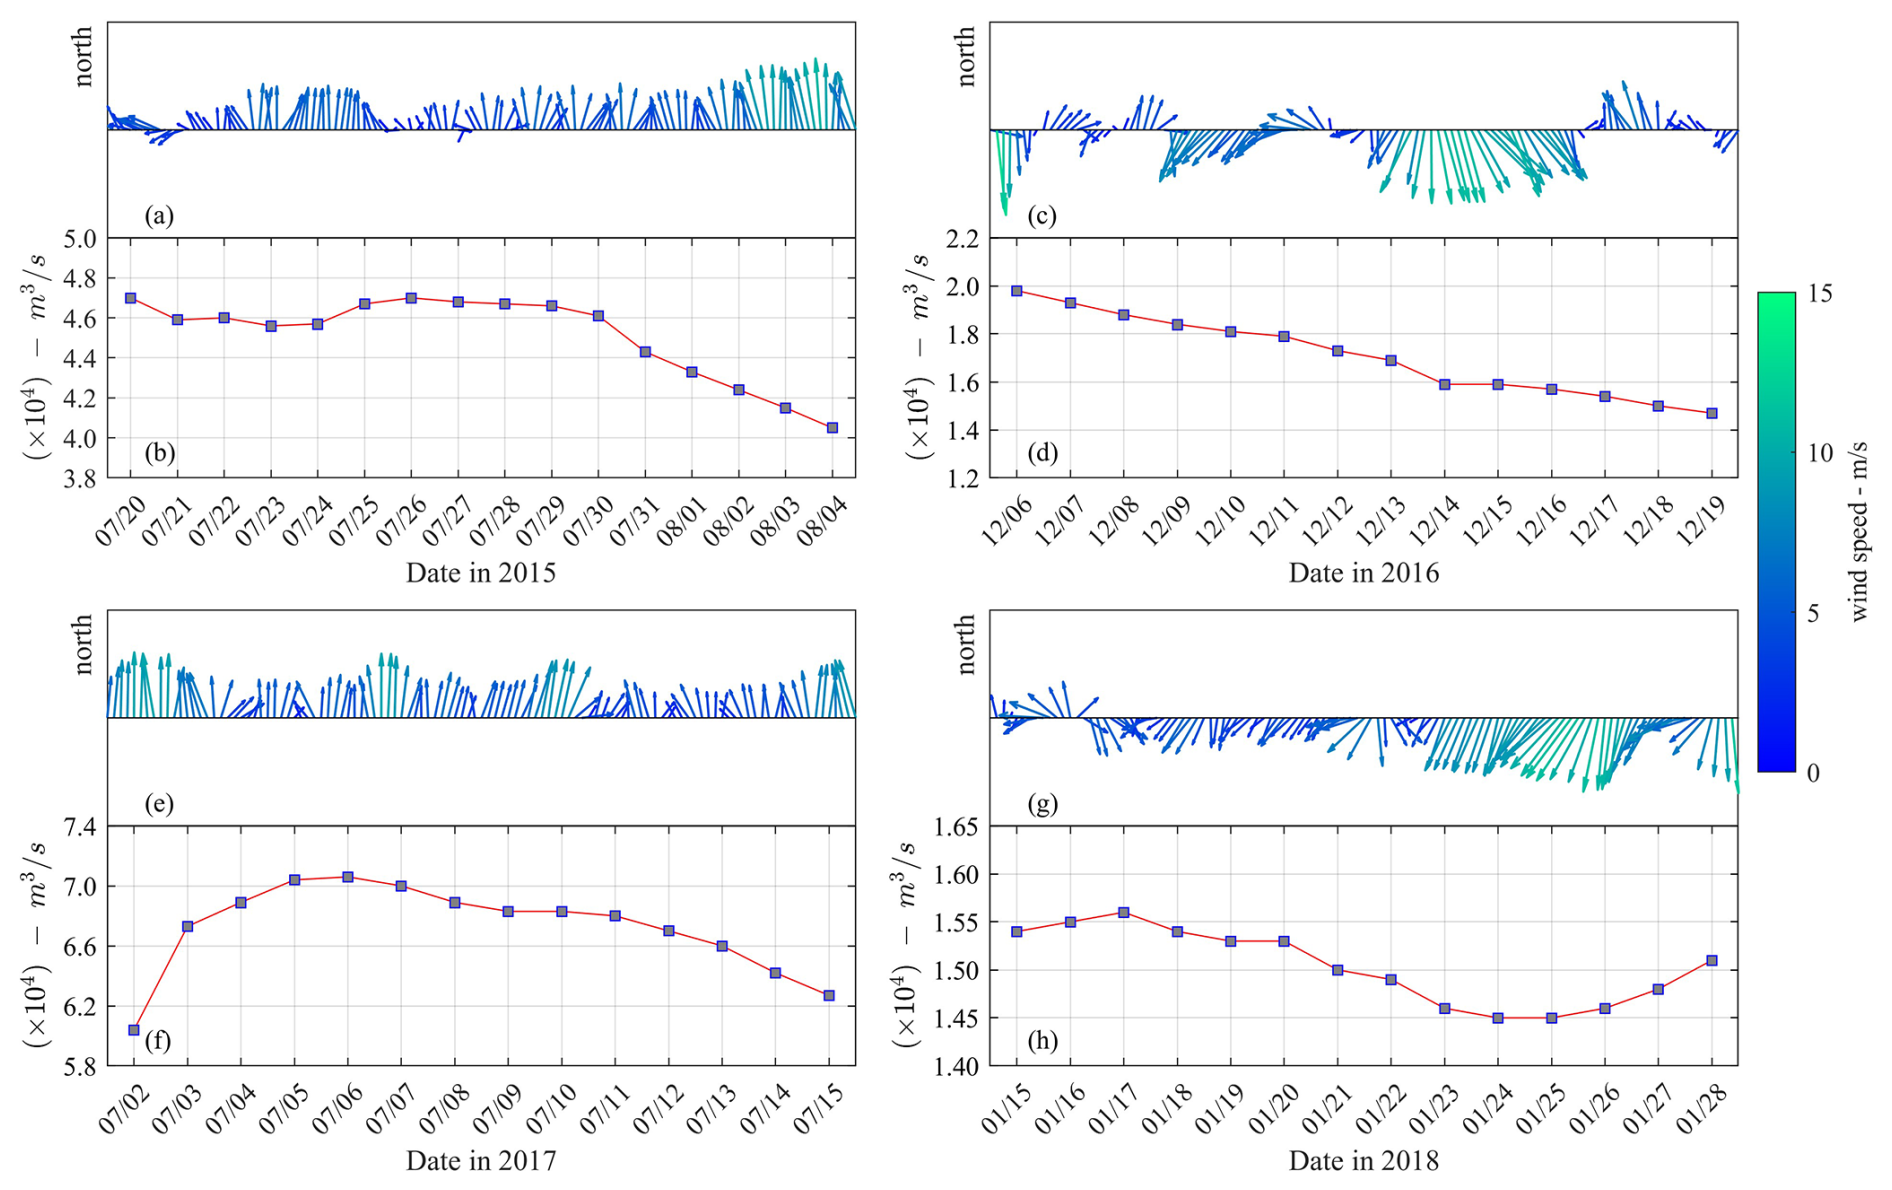
Figure 4(a, c, e, g) Wind information at 31.25° N, 122° E and (b, d, f, h) river discharge recorded at Datong station during each measurement campaign. The color bar indicates the magnitude of wind vectors.
5.3 Waves
In campaigns of 2015 and 2017, the prevailing south winds in summer contributed to relatively calm weather periods, and the significant wave heights (Hs) recorded by RBRs were relatively low (Fig. 5a and c). During 2015A–2015D campaigns, the maximum values of Hs were 0.22, 0.42, 0.52, and 0.32 m, respectively. Similarly, during the campaign in 2017, the maximum Hs was 0.29 m.
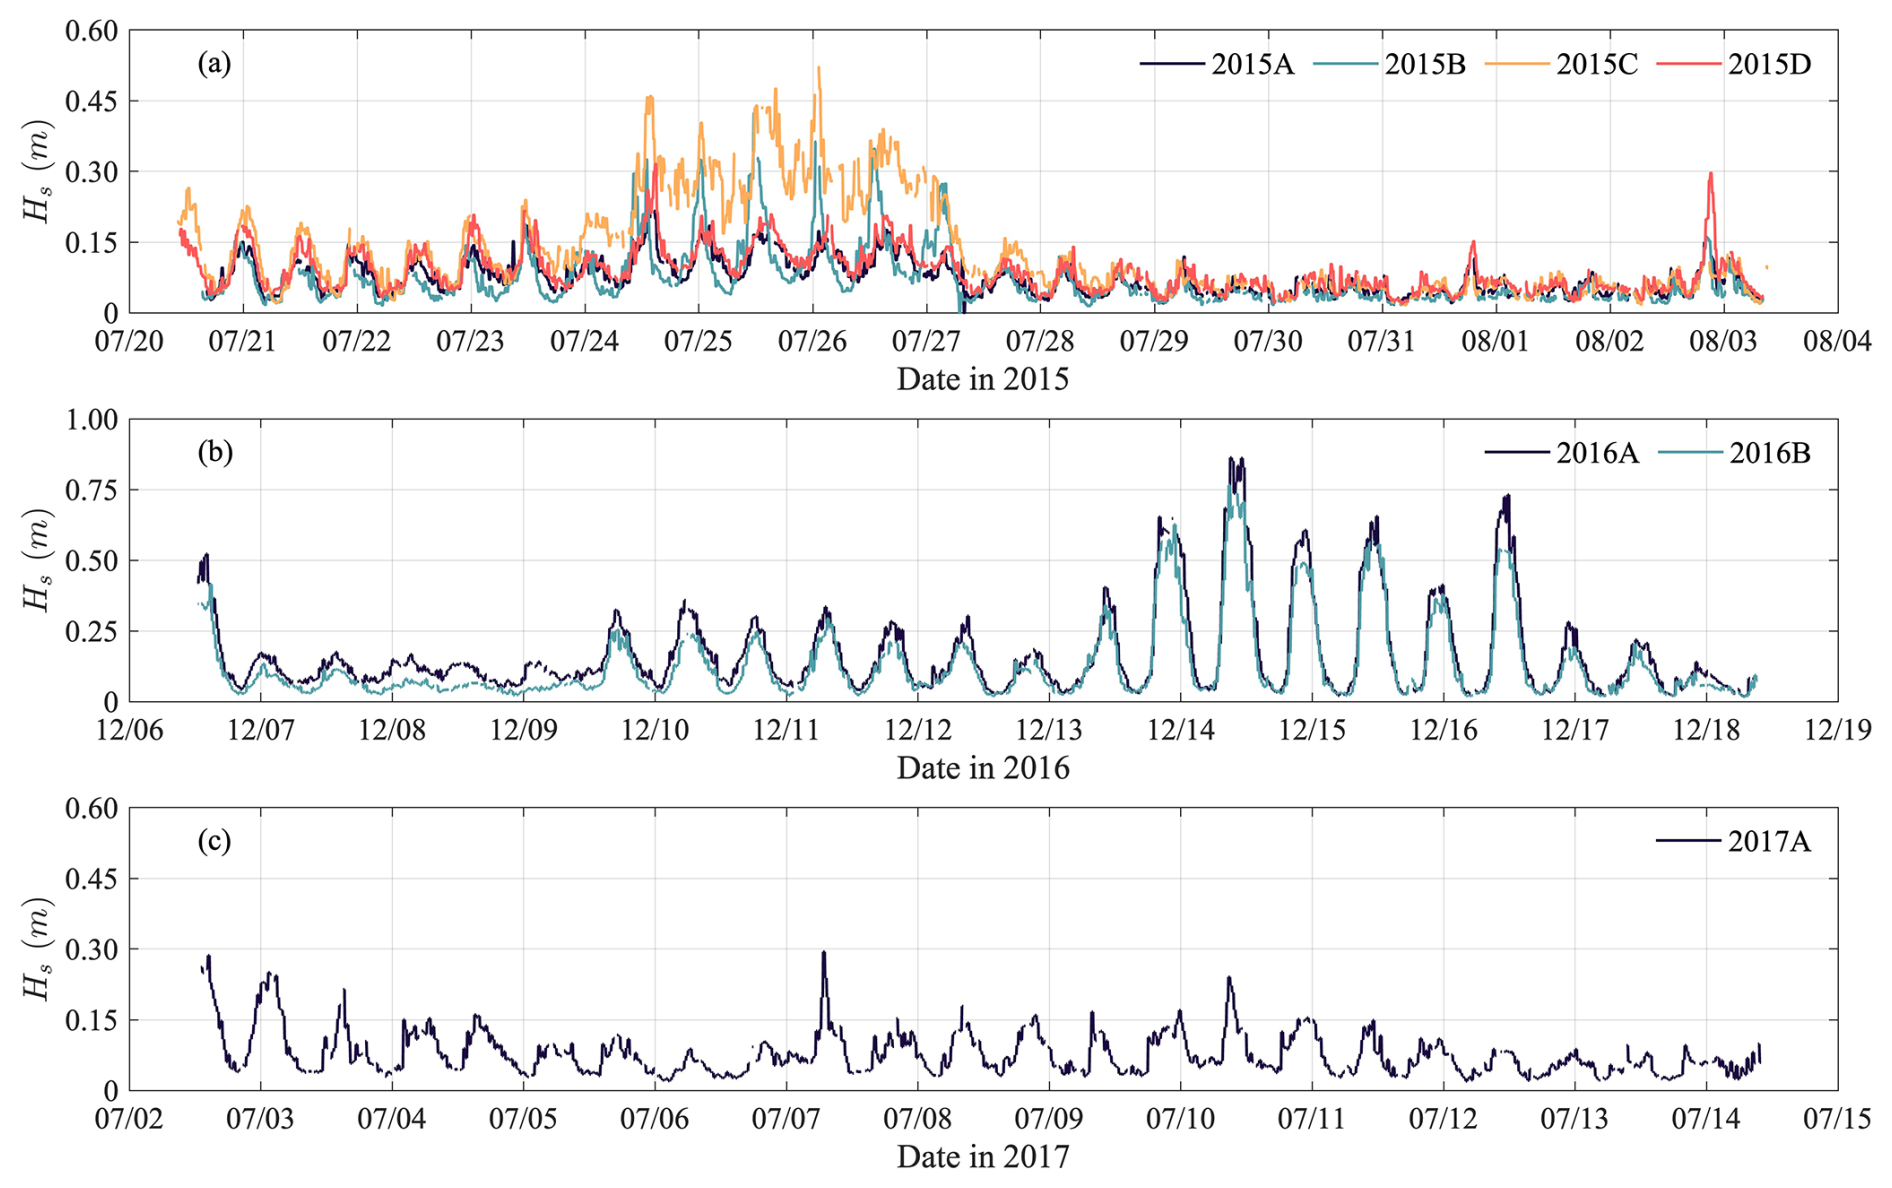
However, during the deployment period in 2016, when a winter storm passed through the NP, a pronounced north wind resulted in significant increase in Hs during 13 to 17 December, as shown in Fig. 5b. The maximum values of Hs were 0.86 and 0.77 m in campaigns 2016A and 2016B, respectively. The RBR did not function well during the 2018A measurements.
5.4 Tidal levels
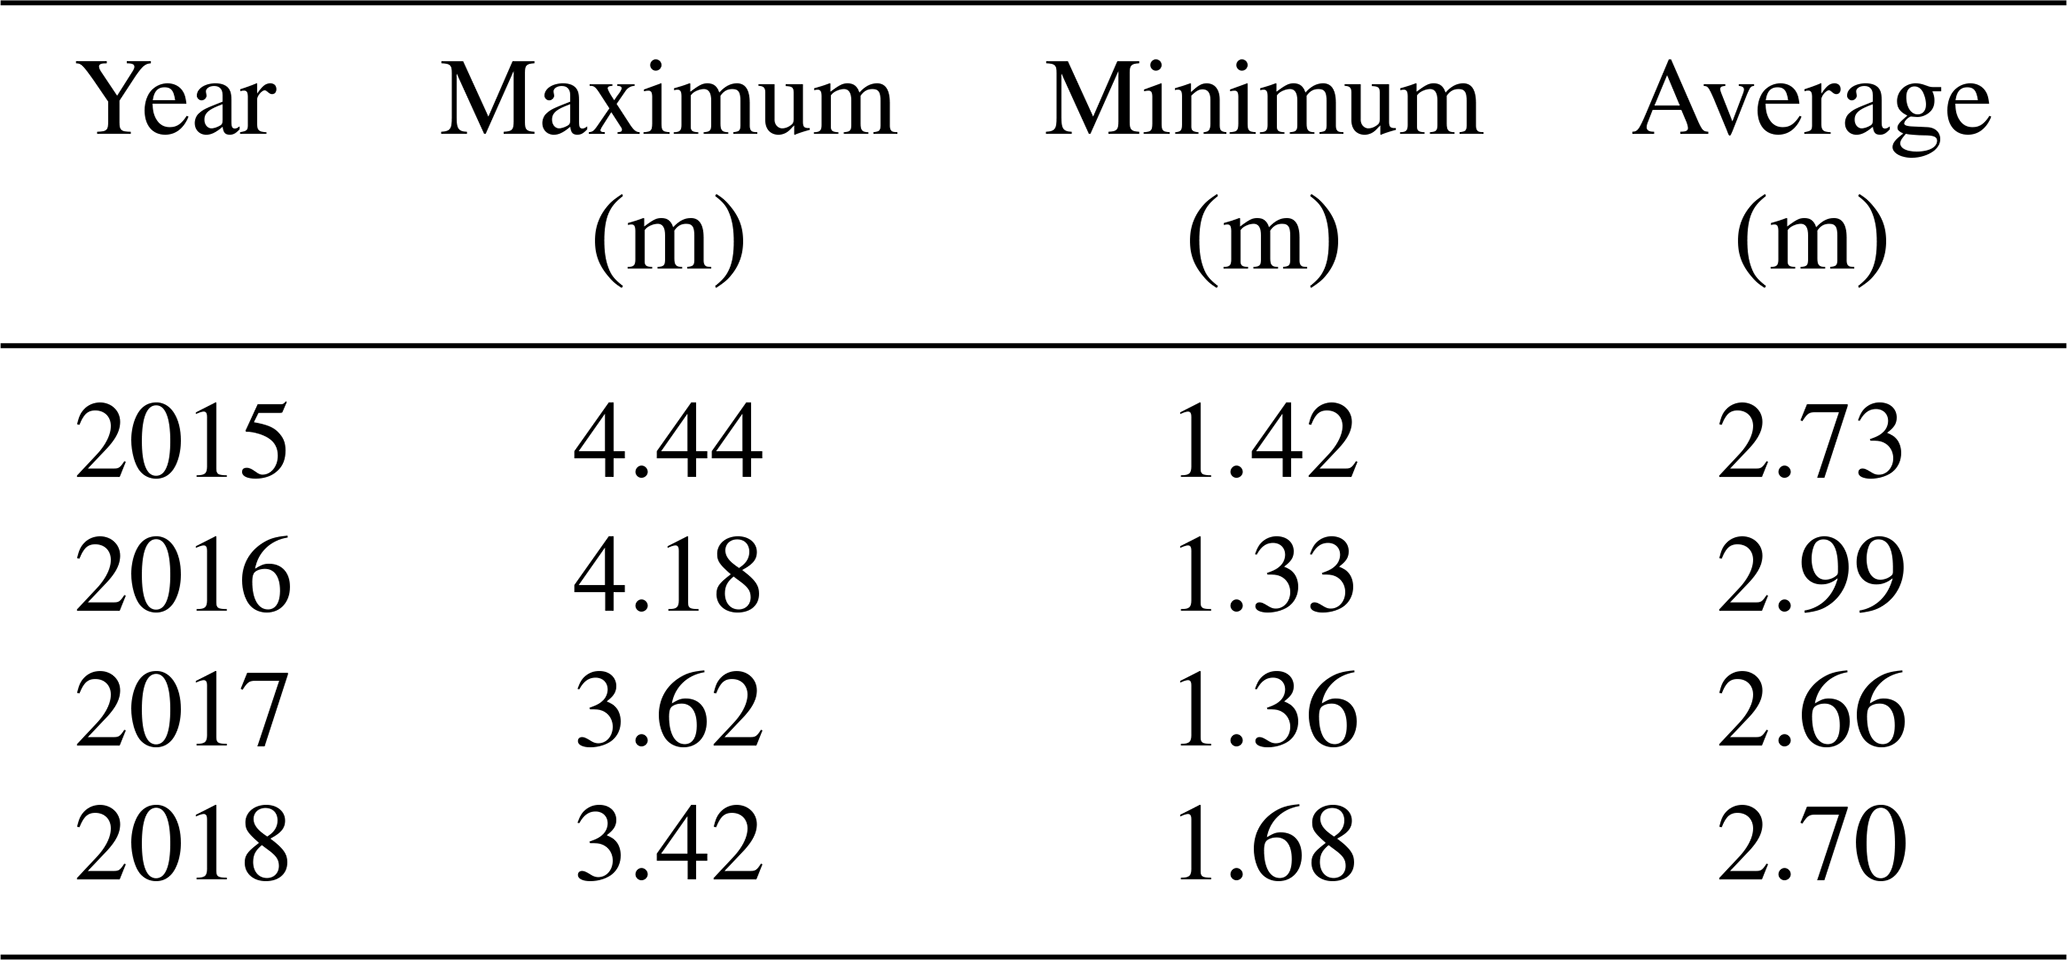
The measurements of NP-ChaM lasted for at least 11 d to capture both neap and spring tides. The water depths shown in this paper were measured using an OBS-3A. By subtracting the average value from the water depth, tidal levels were obtained (Fig. 6). The neap and spring tides are indicated by purple and yellow shading, respectively. The tidal ranges measured during these observations are summarized in Table 5. For comparison, the mean and maximum tidal ranges recorded at Zhongjun gauging station (in the South Passage) are approximately 2.7 and 4.6 m, respectively (Yun, 2004).
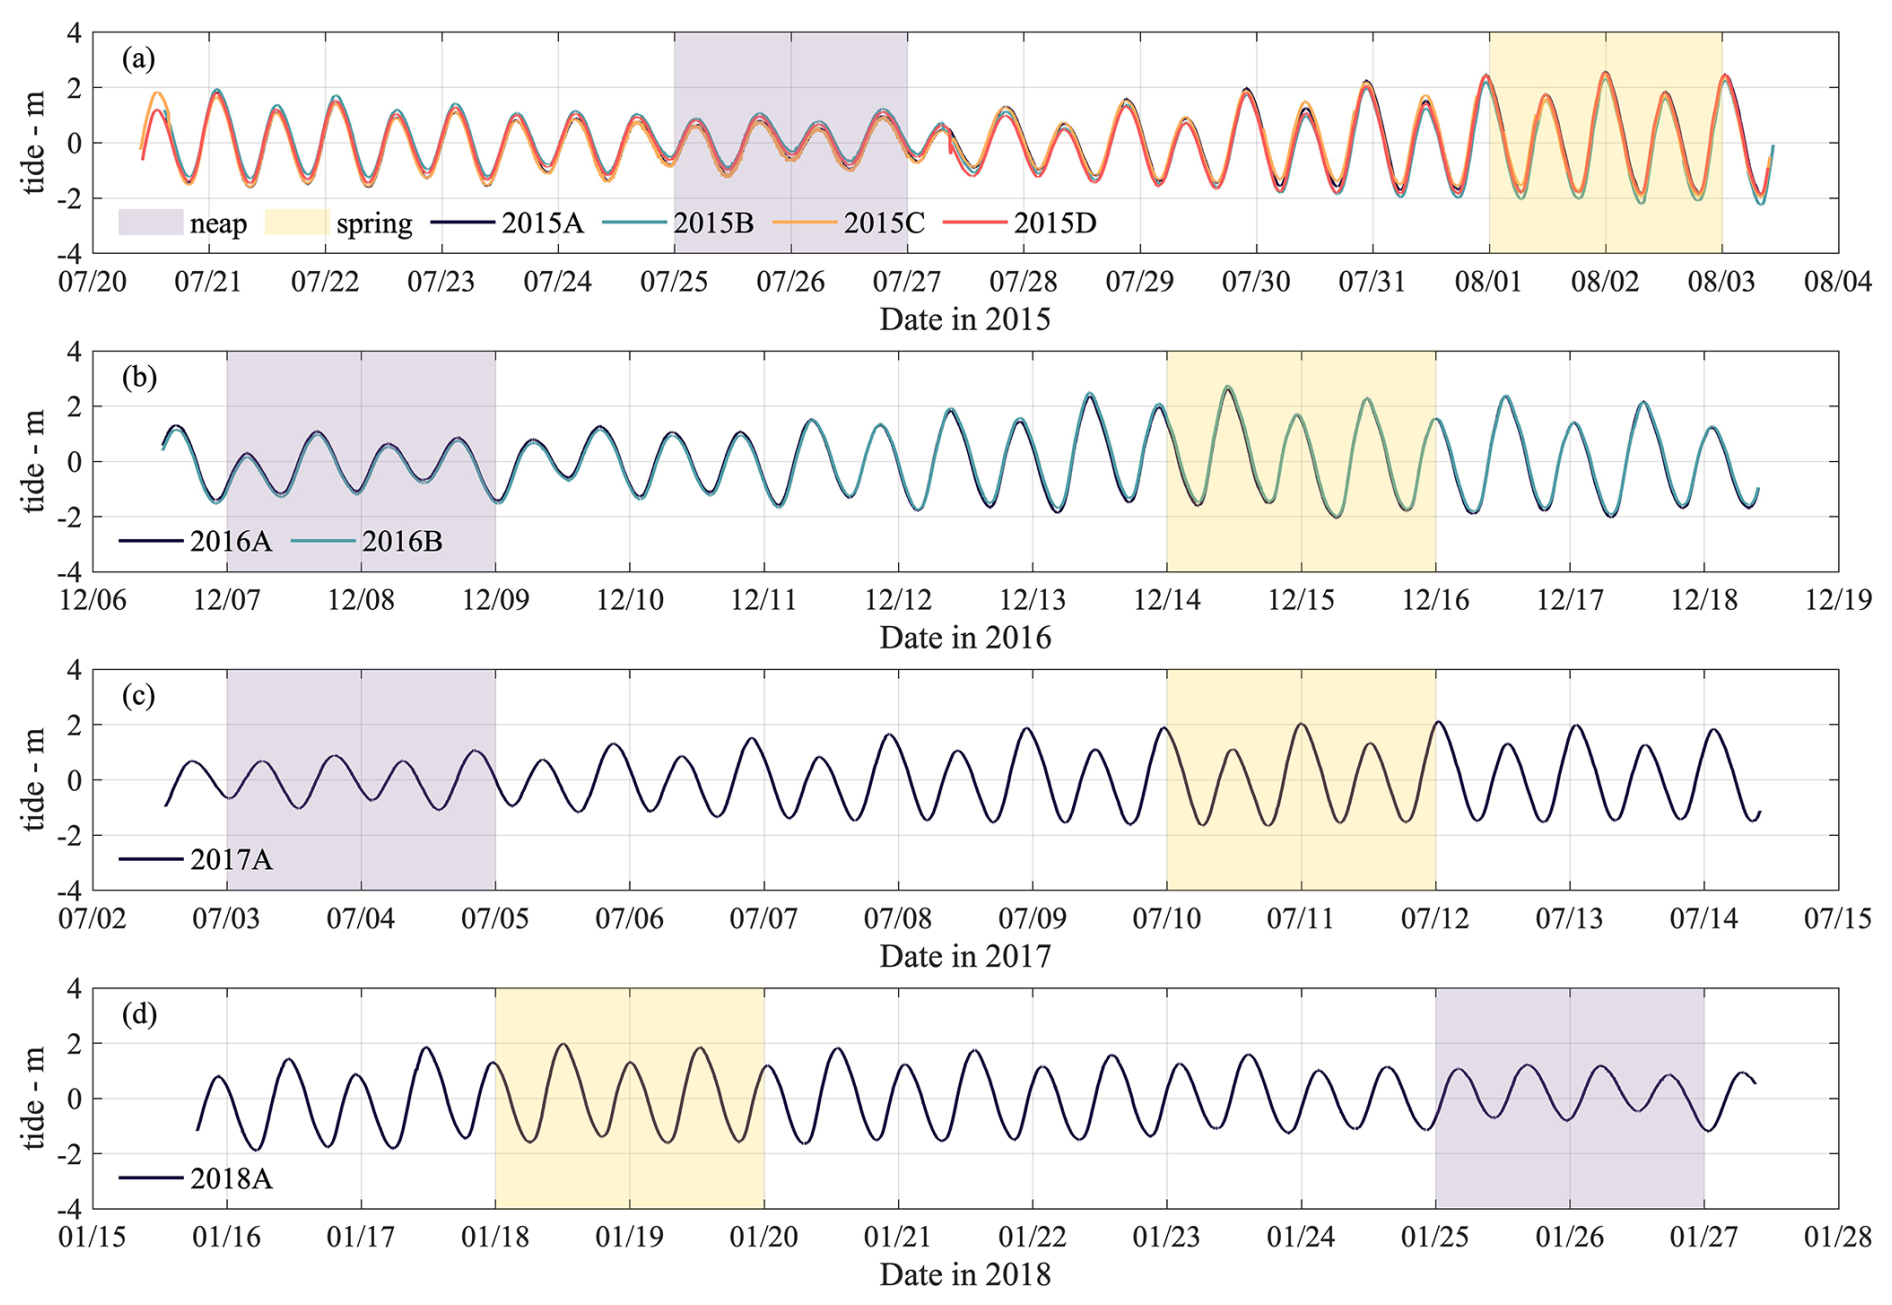
Figure 6Tidal levels measured by OBS-3A in (a) July 2015, (b) December 2016, (c) July 2017, and (d) January 2018.
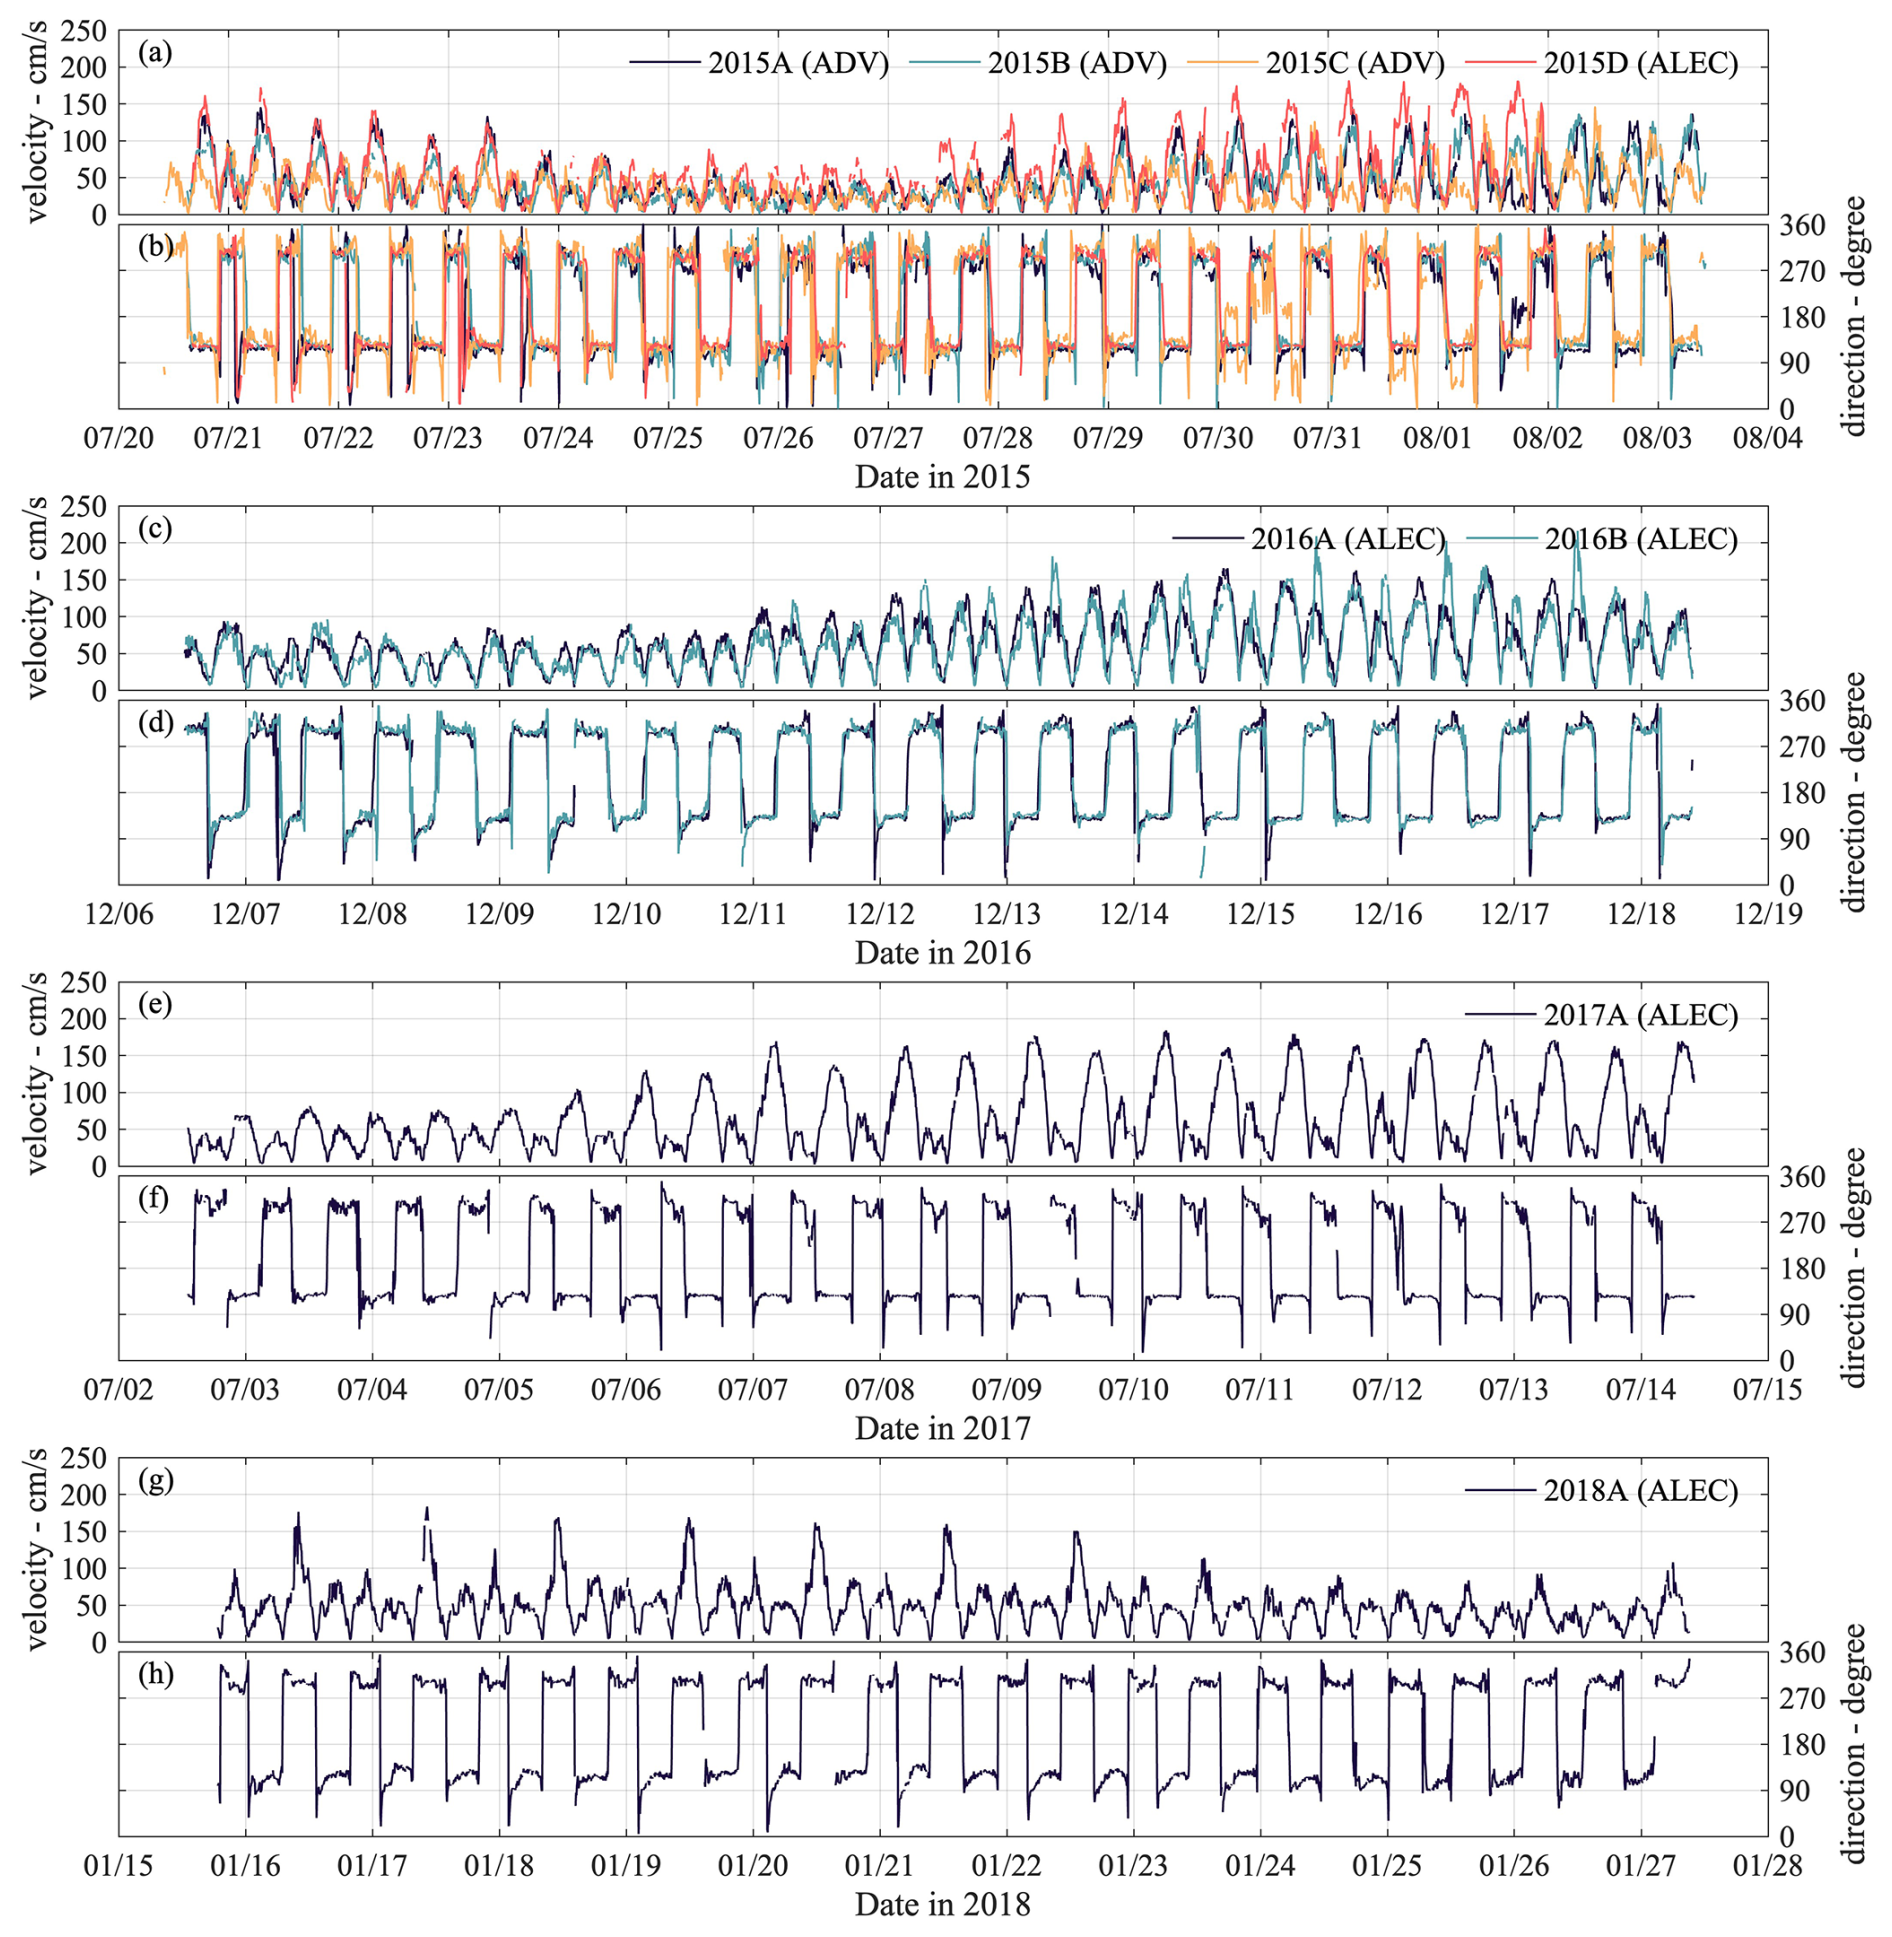
Figure 7Near-bed flow velocity and direction in (a) 2015A–2015D, (b) 2016A–2016B, (c) 2017A, and (d) 2018A. Ebb flows have a direction of 90–150° and flood flows of 270– 330°. Note that the 2015 and 2017 measurements were conducted during the wet season, while the 2016 and 2018 measurements were conducted during the dry season.
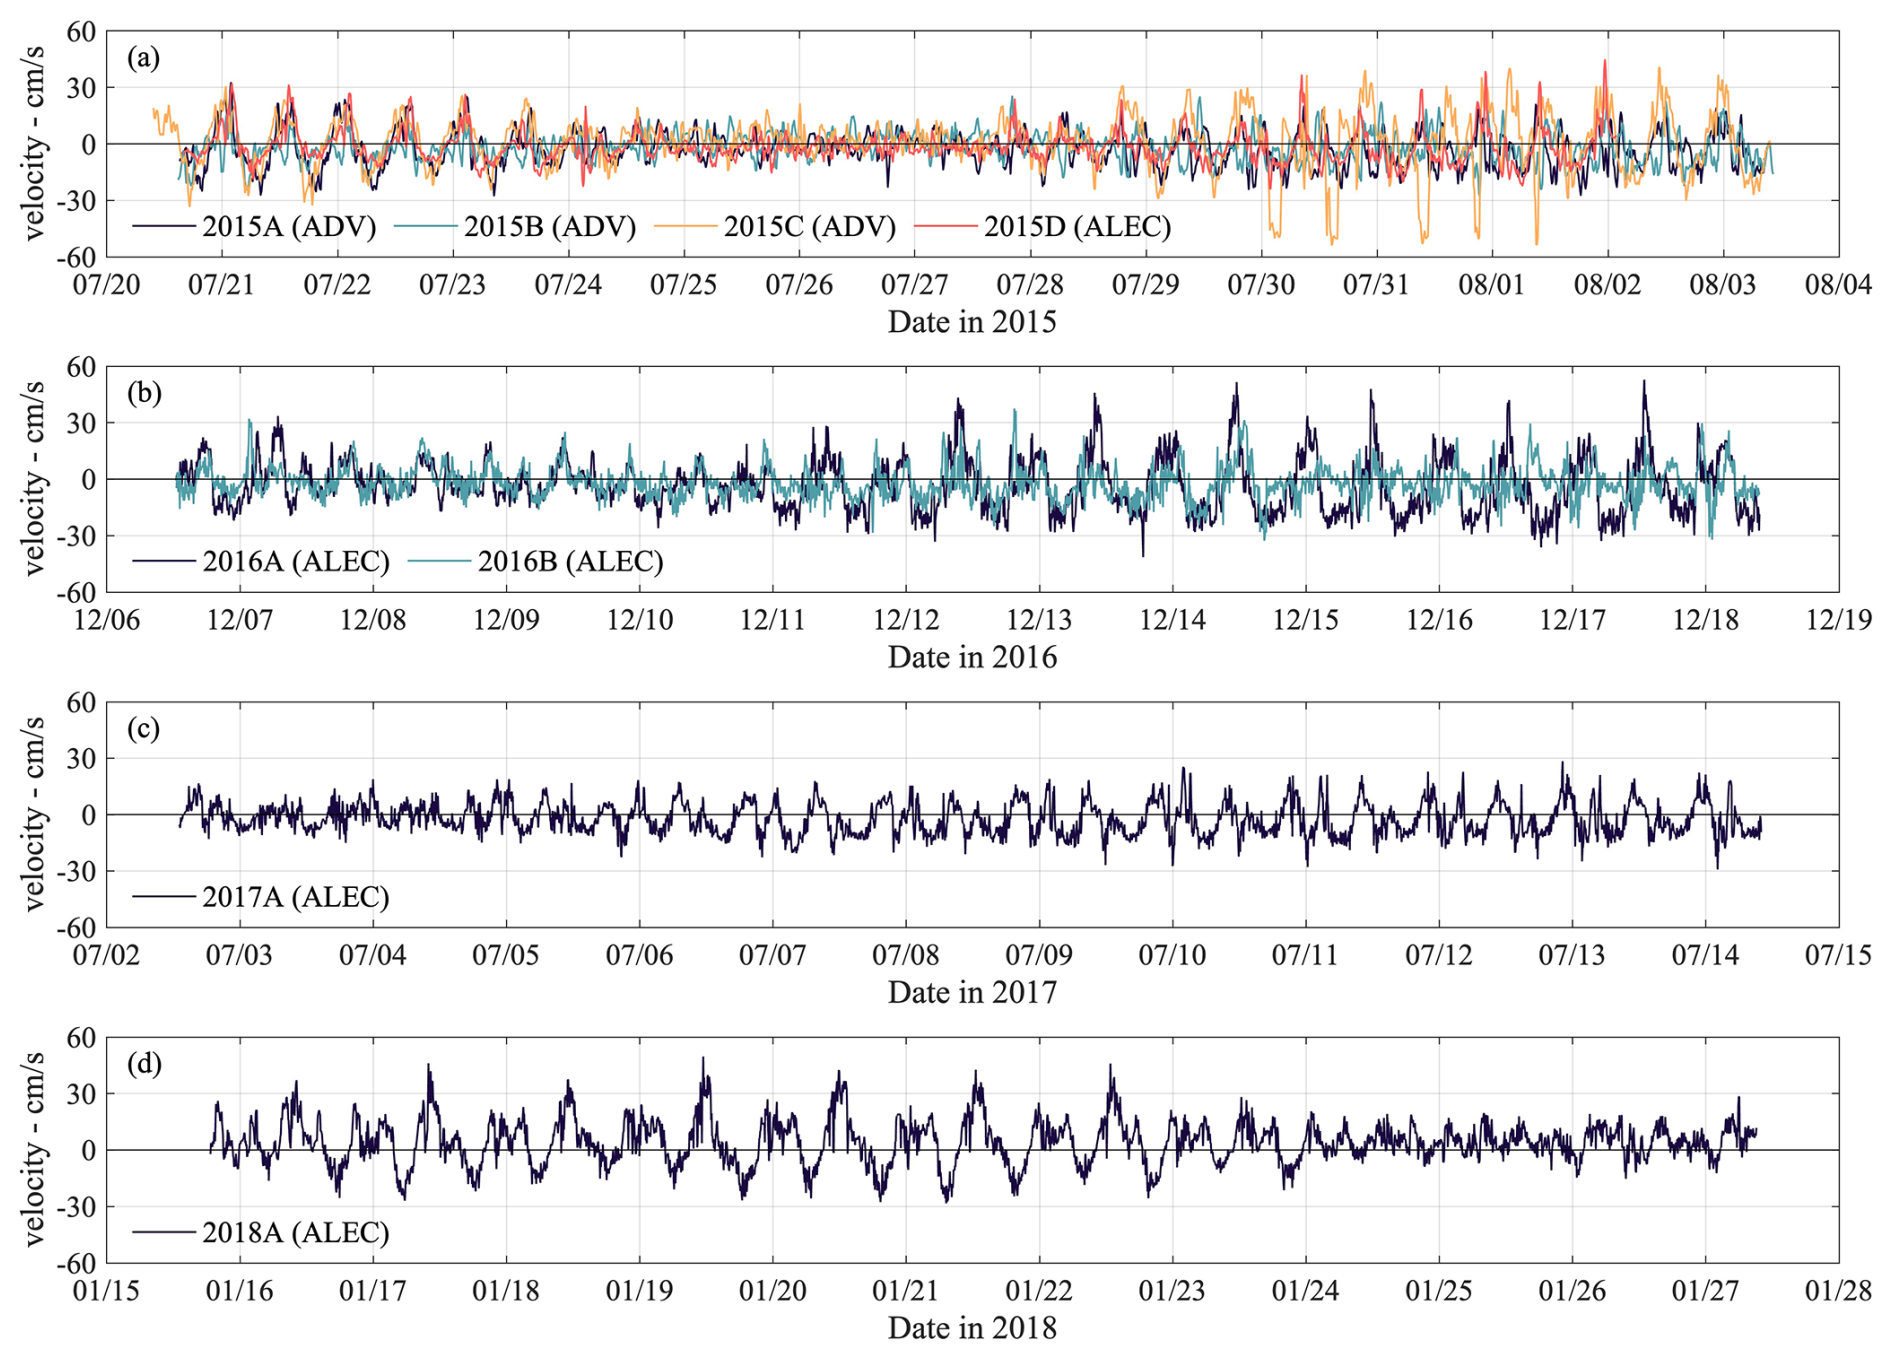
Figure 8Lateral flows detected in measurements of (a) 2015, (b) 2016, (c) 2017, and (d) 2018. The positive value indicates the direction towards the north shoal.
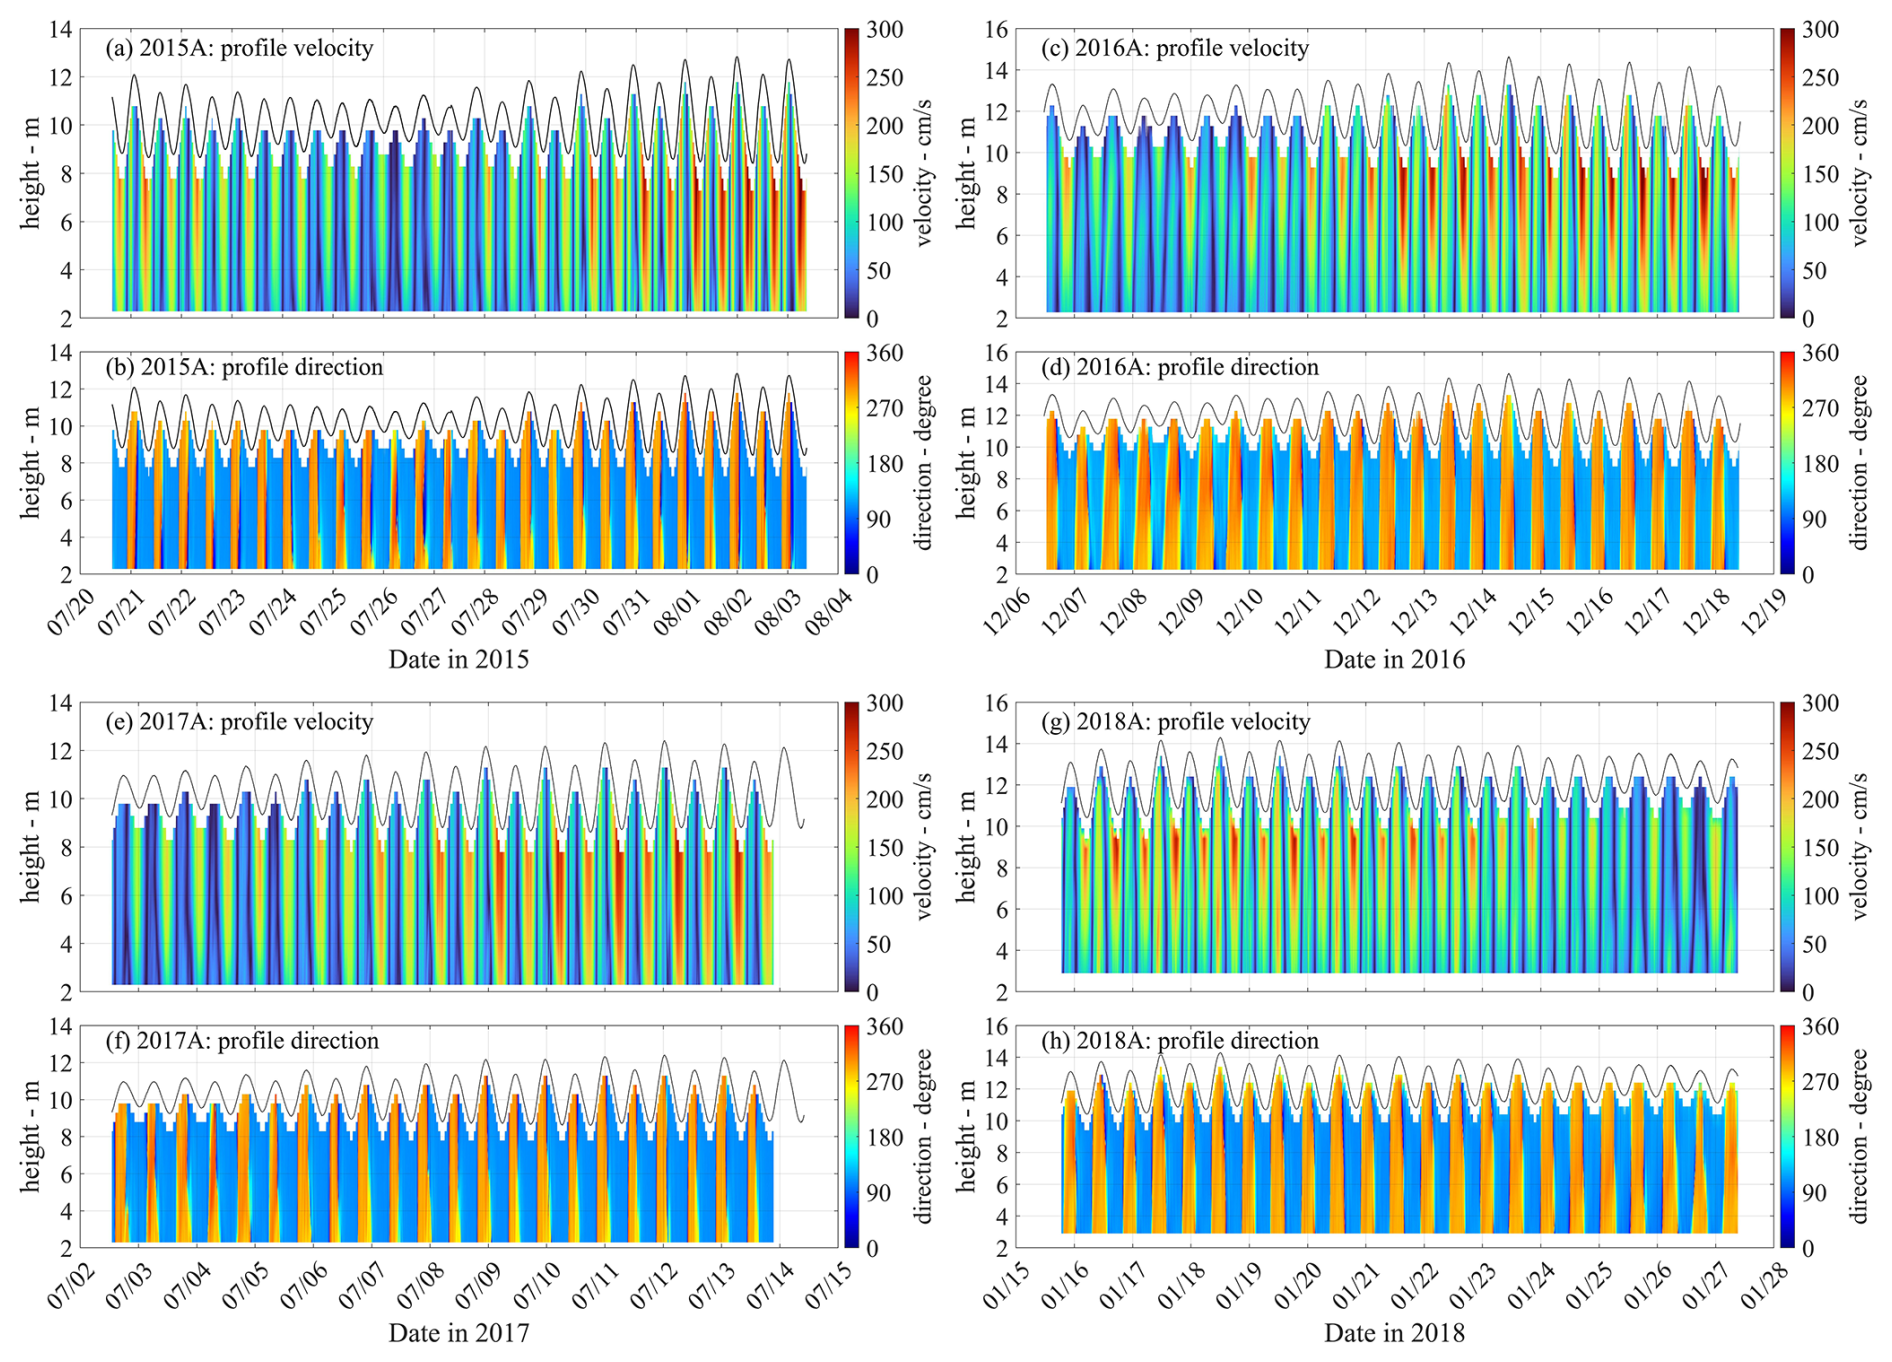
Figure 9Time series of vertical profiles of flow velocity (a, c, e, g) and direction (b, d, f, h) in campaigns of (a, b) 2015, (c, d) 2016, (e, f) 2017, and (g, h) 2018.
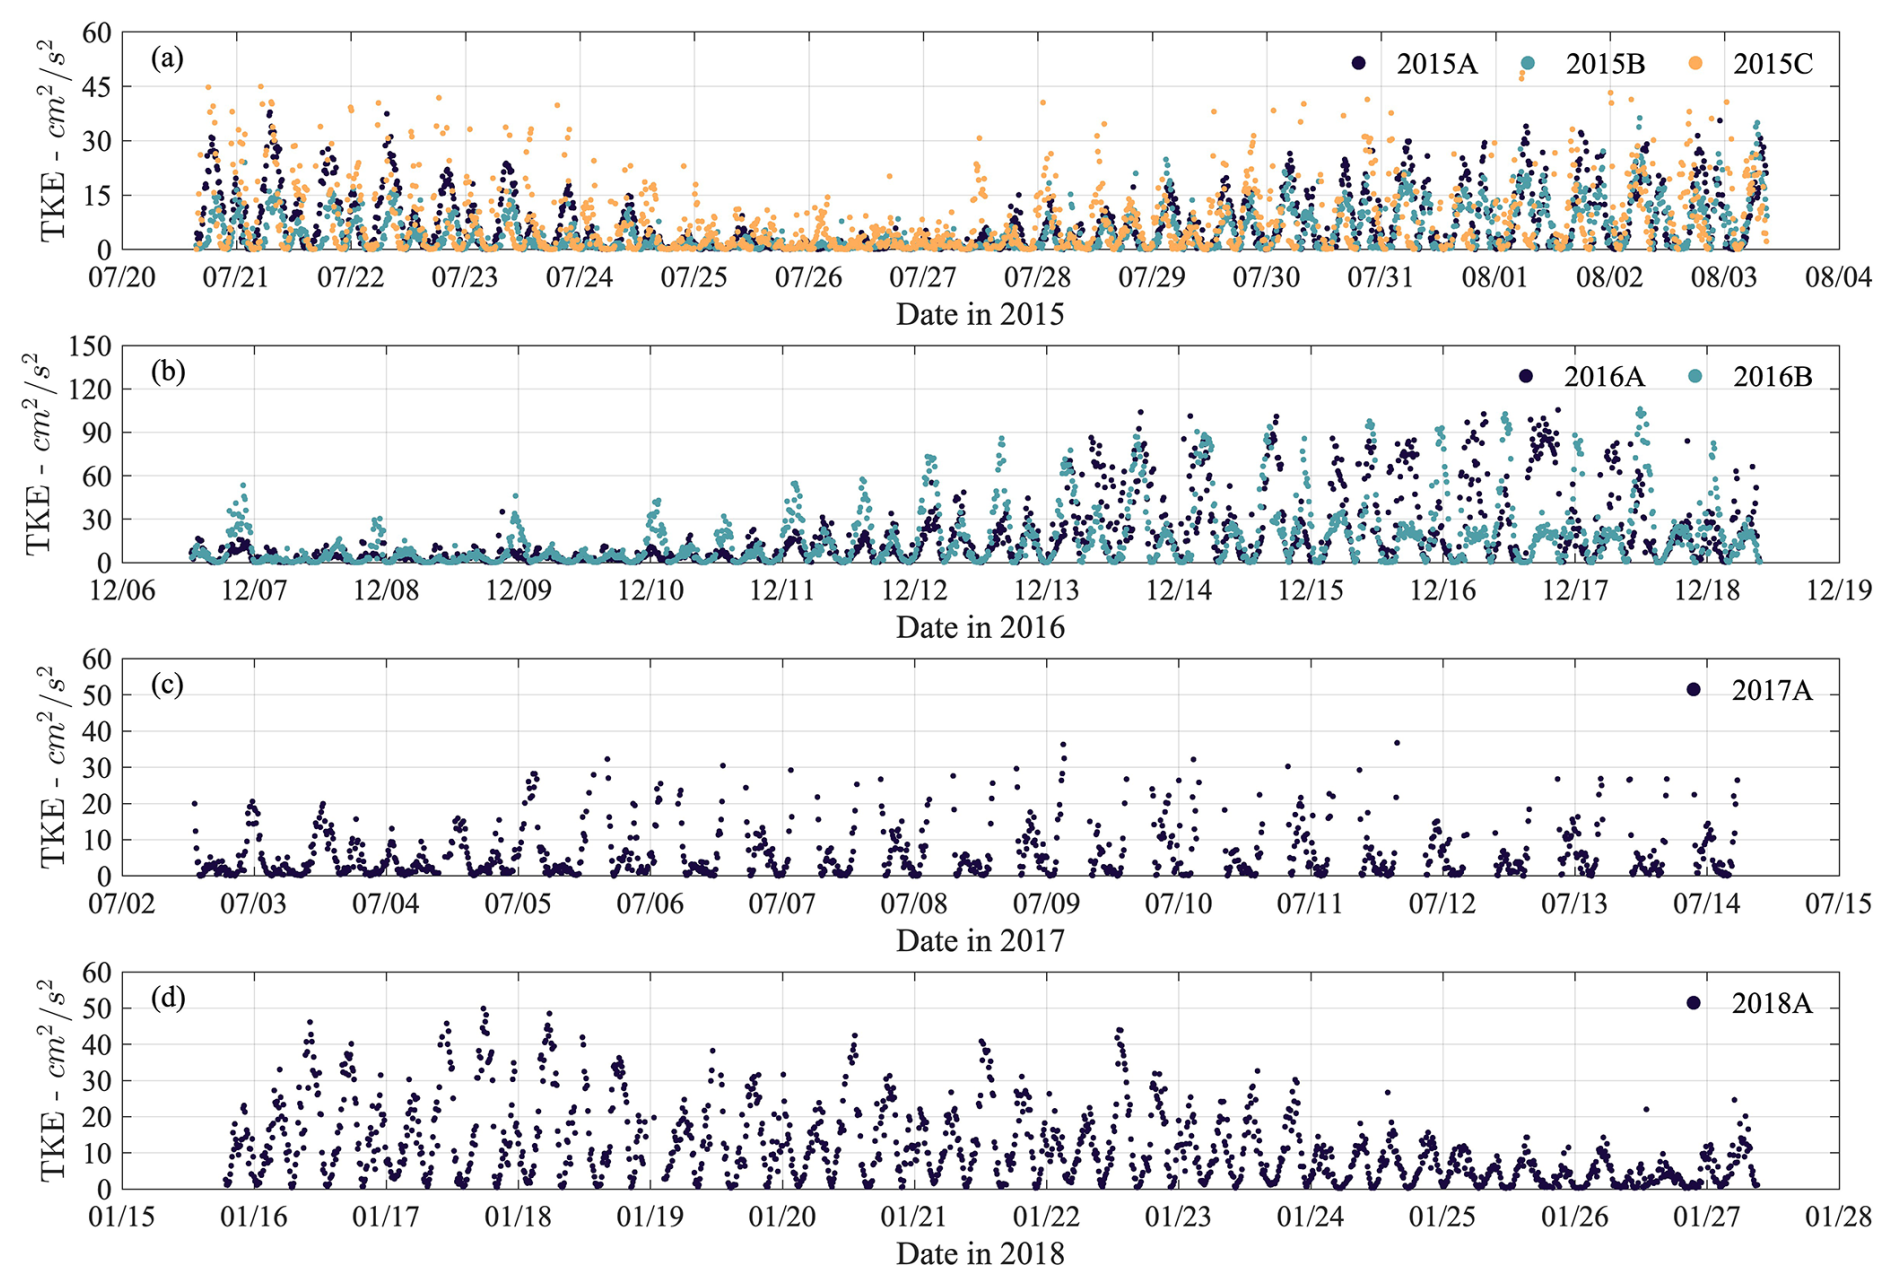
Table 5Statistics of the tidal range measured by OBS-3A in the NP-ChaM campaign.
5.5 Flow velocity and direction
Near-bed flow velocity and direction were measured using multiple instruments. Although some instruments were not operational for parts of their deployment (see Table 4), the combination of different instruments provided a relatively complete dataset. Point velocity and direction detected by ALECs and ADVs are shown in Fig. 7.
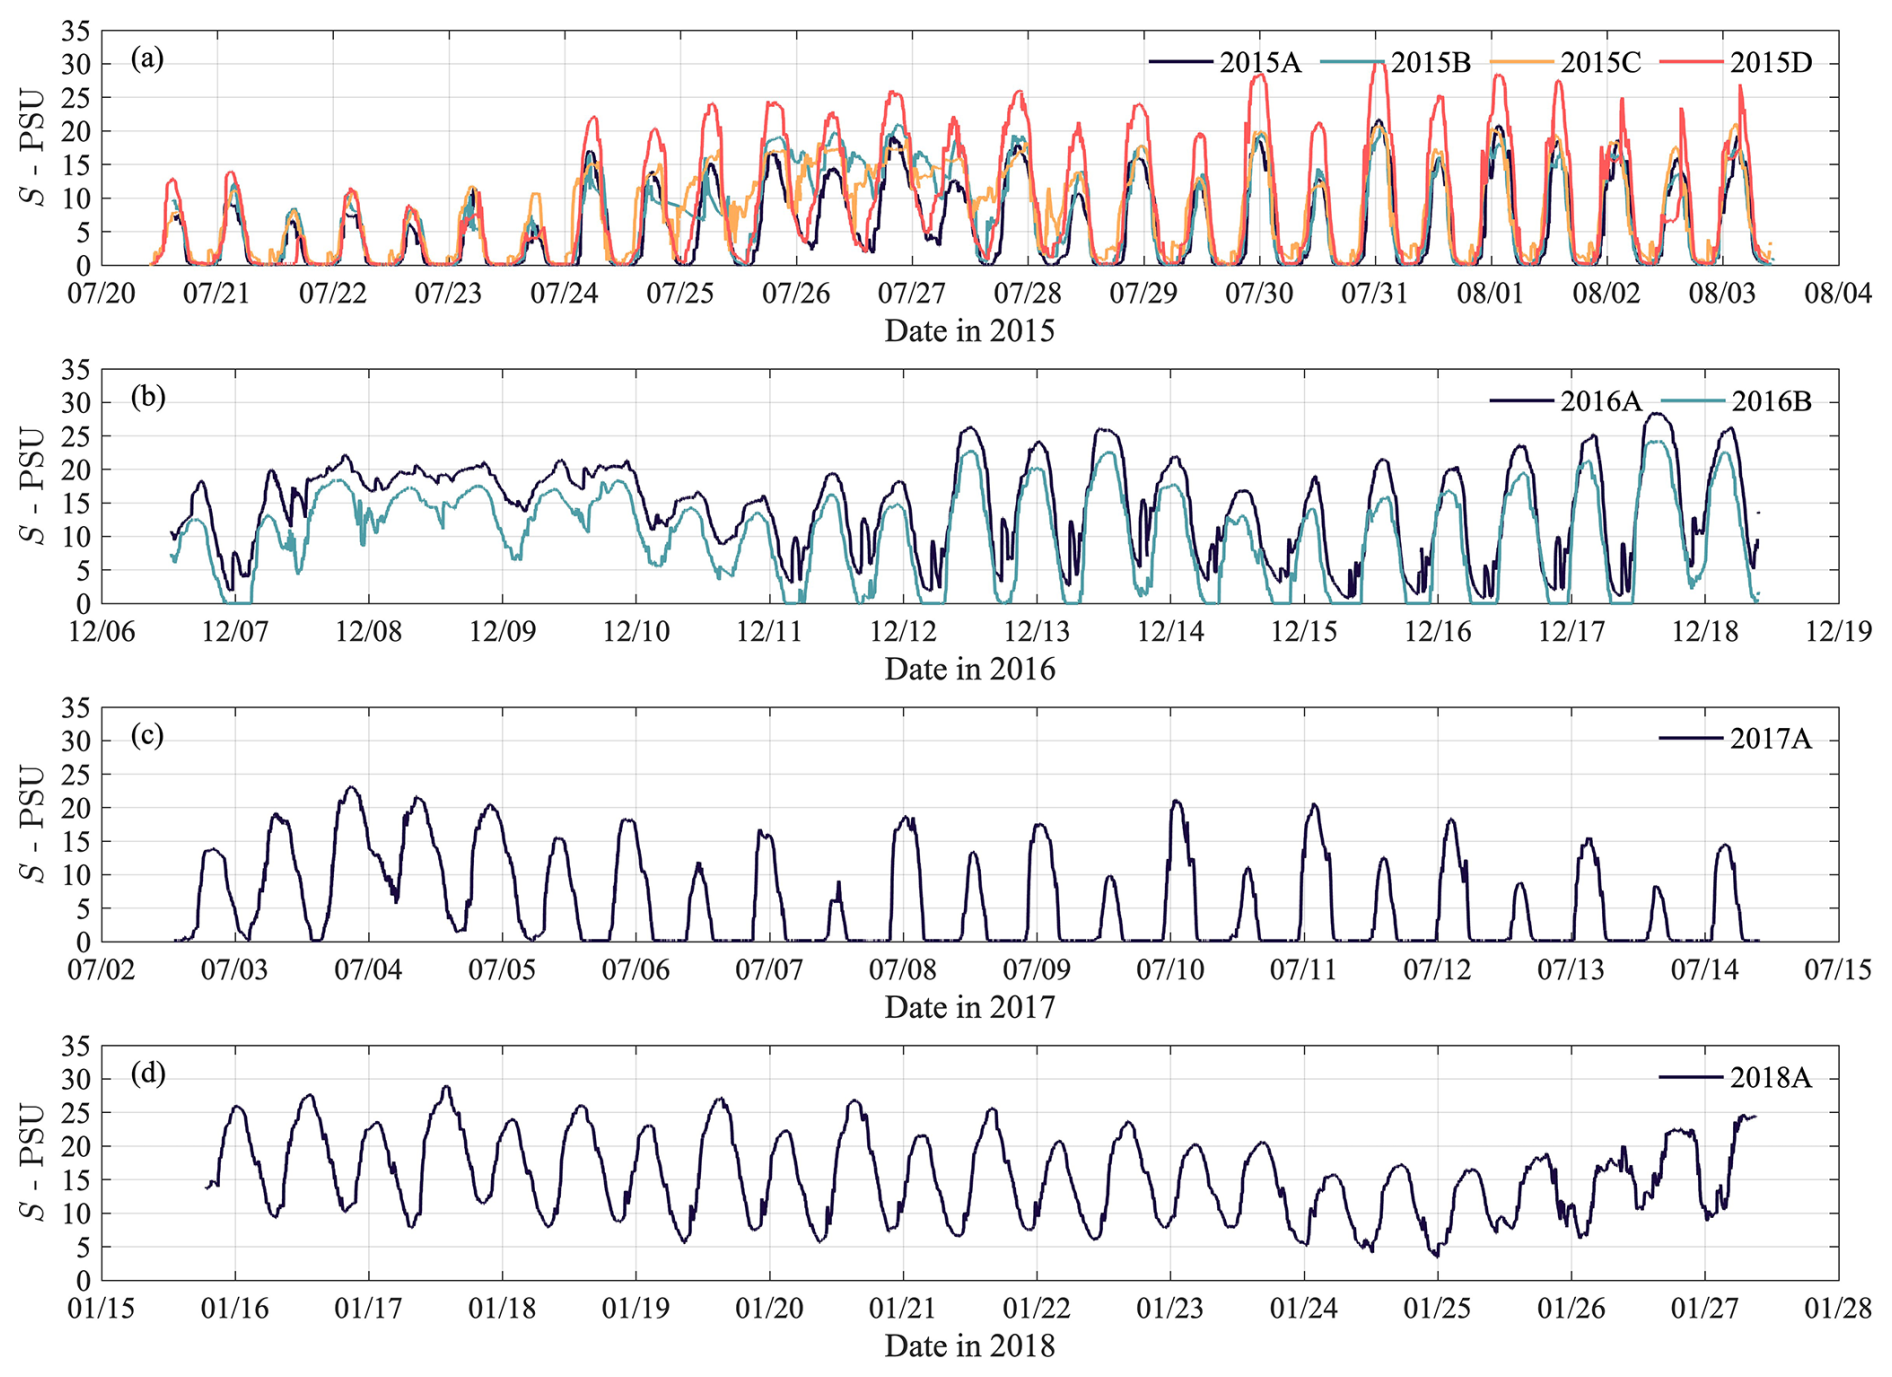
Figure 11Time series of salinity measured by OBS-3A in (a) 2015, (b) 2016, (c) 2017, and (d) 2018.
Our observations not only reveal clear seasonal variations in current velocities but also provide new insights into the pattern transition between ebb and flood dynamics. The NP is an ebb-dominant channel (Wu et al., 2009), supported by the measurements in 2015 and 2017 in which the river discharge contributed to a clear ebb dominance. For example, between 21 and 24 July 2015 and after 5 July 2017 (Fig. 7a, b, e, and f), the maximum ebb current velocity was about 2 to 3 times the maximum flood current velocity. However, during the dry seasons of 2016 and 2018, the maximum velocities of ebb and flood currents were more balanced (Fig. 7c and d). Moreover, during the spring and the following intermediate tidal conditions (16–23 January 2018), a reverse pattern occurred, where the maximum flood current velocities were higher than those of the ebb currents. This could be a result of the extremely low river discharge strengthening saltwater intrusion, which requires further analysis.
The examination of lateral exchanges between the bathymetrically distinct deep channel and adjacent shallow shoals constituted a key aspect of the field campaign, and therefore the observed flow velocity is converted to a lateral and longitudinal flow component. We decomposed the current velocities of Fig. 7 into components parallel and perpendicular to the ebb current – the latter directing positively towards the north shoal (Fig. 8). Observations revealed that during all measurement periods, lateral flows within the study area could exceed 30 cm s−1. Although lateral flow velocities are weaker than along-channel velocities, they have a relatively large impact because lateral gradients in key constituents such as salinity and sediment are large (Chant, 2010; Geyer et al., 2020; Zhou et al., 2019). The dataset assembled from the NP-ChaM campaign not only includes multiple years of data but also encompasses diverse locations in the NP (for detailed locations, see Table 2). Therefore, this dataset contributes to our understanding of lateral flows and sediment transport in the highly engineered NP.
The vertical velocity profiles measured by ADCPs (Fig. 9) reveal clear variations in the flow structure. These variations include a pronounced spring–neap tidal cycle, strong vertical gradients in flow velocity and direction, and the presence of lateral flows (flow direction ∼ 180° in Fig. 9b, d, f, and h).
5.6 Turbulent kinetic energy
To explore the turbulence suppression near the bed, the TKE was estimated based on the data obtained by high-frequency ADVs. The instantaneous velocities u, v, and w in x (west–east), y (south–north), and z (vertical) directions were used to calculate the fluctuating components u′, v′, and w′ by subtracting the average velocity during each measurement burst. Then, the TKE was calculated using the variances of three components, , , and (Stapleton and Huntley, 1995) as TKE = . The TKE was positively correlated to flow velocities and typically ranged between 0–60 cm2 s−2 (Fig. 10a, c, and d). However, during the measurements in 2016, the TKE was much higher (up to 100 cm2 s−2) from 13 to 17 December. This peak corresponded with a storm (wind speed > 10 m s−1, Hs up to 0.8 m) coinciding with spring tides, generating strong velocity shear and turbulent mixing under the condition of strong wind and tidal forcing.
5.7 Salinity
During campaigns 2015A–2015D, the salinity was relatively low (<15 PSU) before 24 July (Fig. 11a), reflecting continuous high river discharge (more than 1 month with river discharge > 50 000 m3 s−1, Fig. 4) until 15 July. After 15 July, the river discharge gradually declined to 40 000 m3 s−1 (see also Fig. 4), explaining the increase in salinity after 24 July. Note that the river discharge in this paper as well as the dataset is from Datong gauging station, which is about 600 km upstream to the measurement sites. Therefore, there was a temporal gap between the river discharge and the response of salinity variation due to the traveling distance.
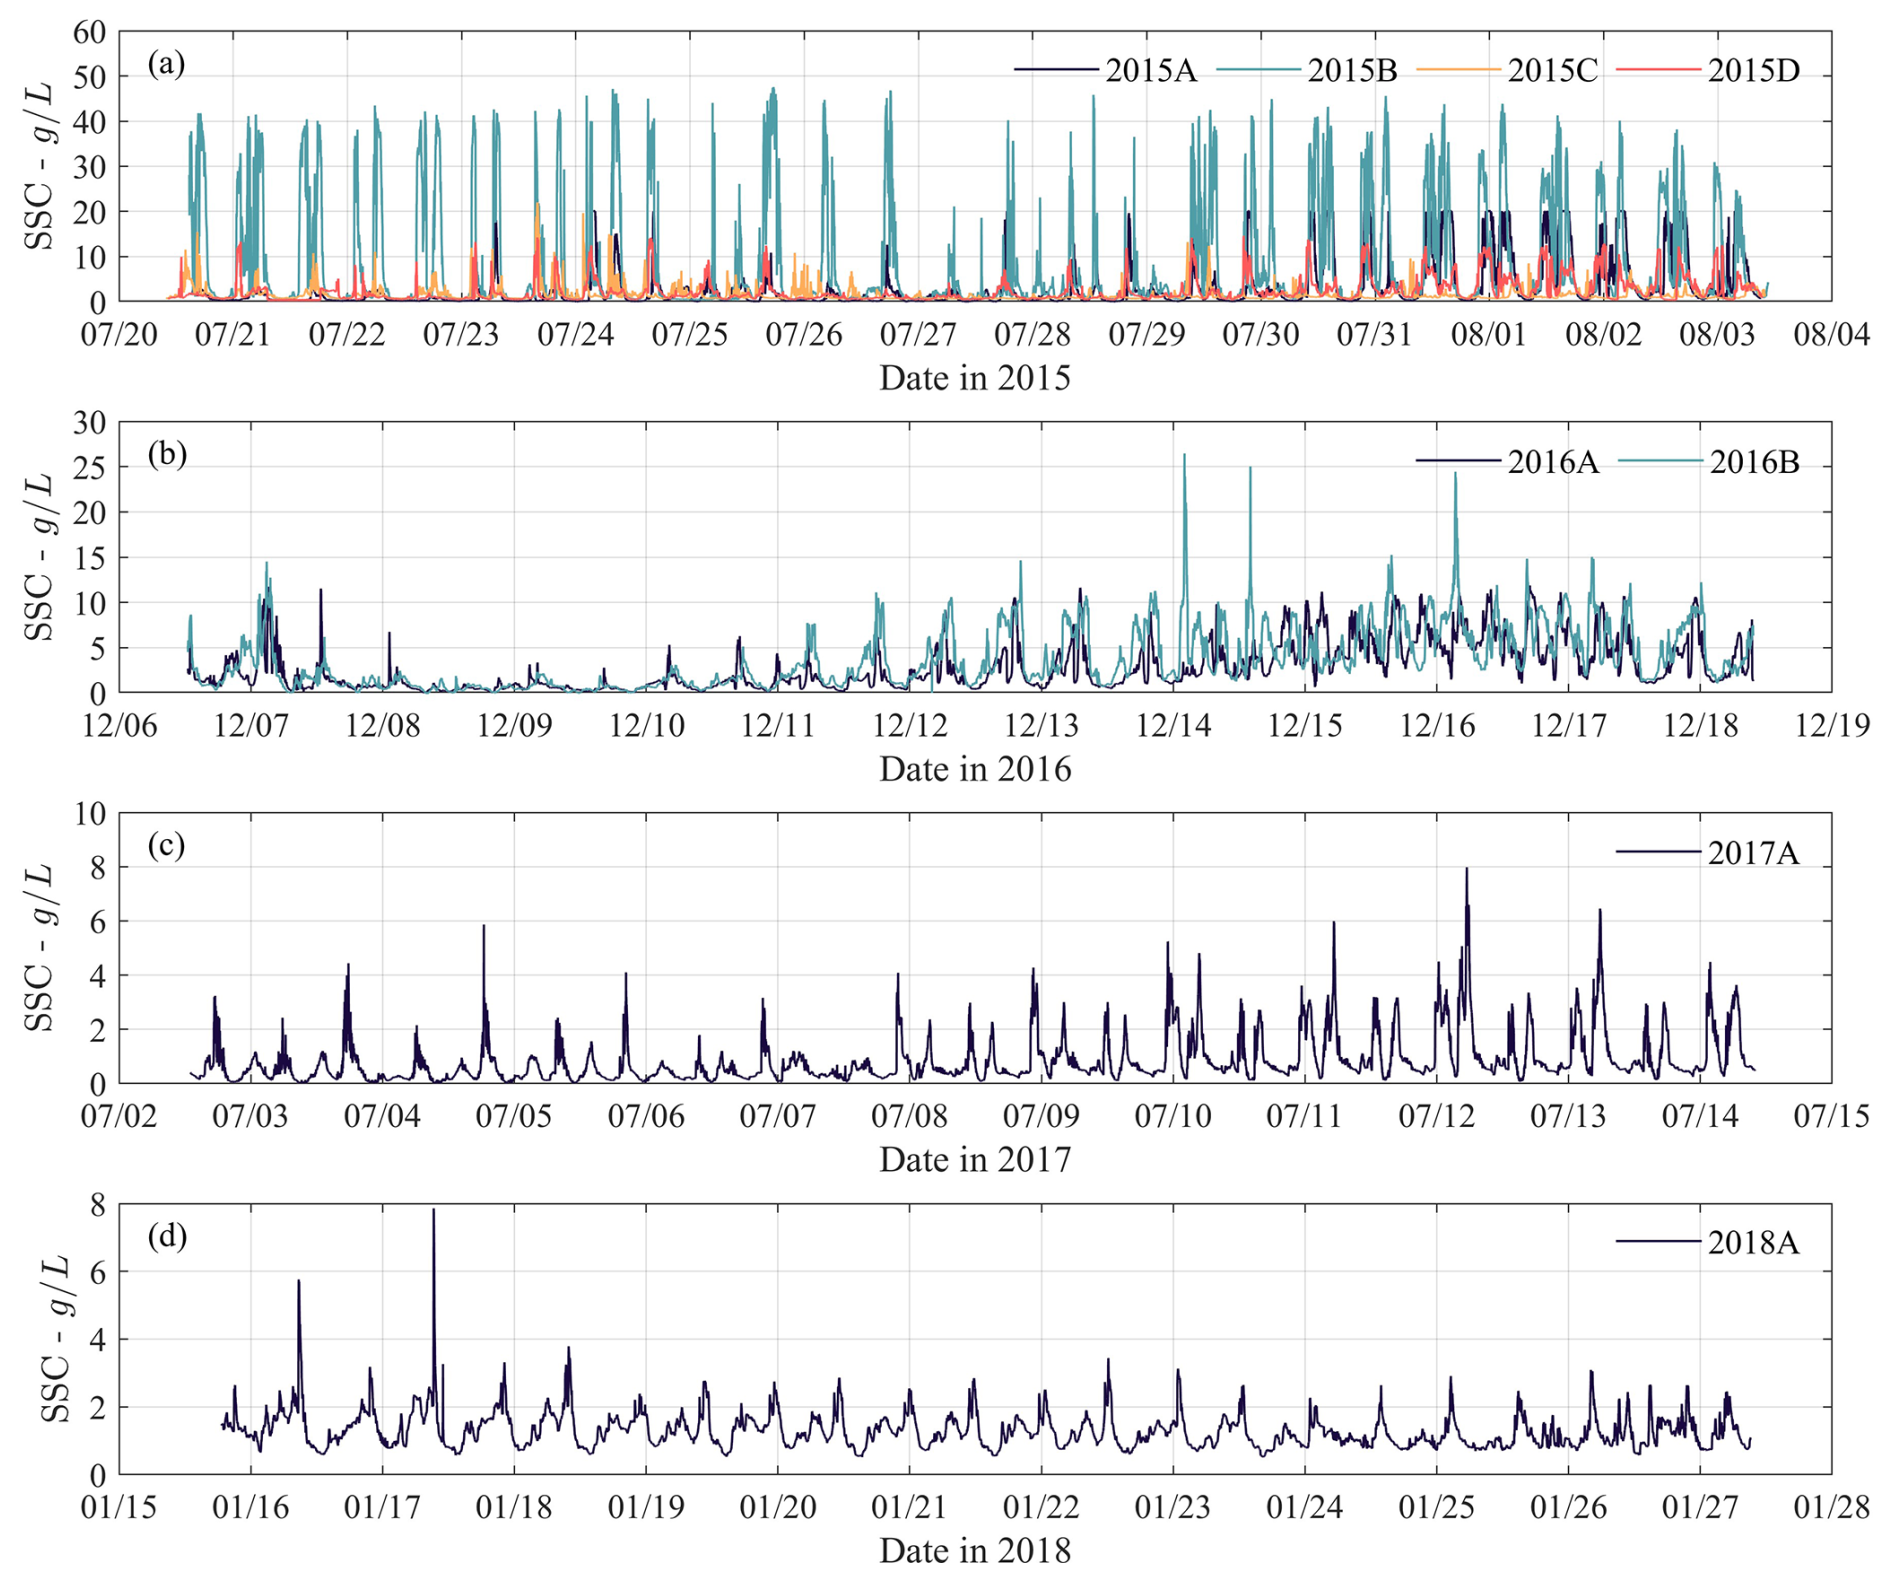
Figure 12Time series of SSC measured by OBS-3A in (a) 2015, (b) 2016, (c) 2017, and (d) 2018.
Another application of the salinity data is related to saltwater intrusion, which frequently affects freshwater supply for the CE. Although saltwater intrusion has been intensively studied (Cai et al., 2015; Wu et al., 2010; Zhu et al., 2013, 2023), direct capture of the intrusion events due to different environmental factors is of significant value to further investigate the relevant dynamics. In this dataset, two types of saltwater intrusion were captured. During the measurements in 2015 and 2016, saltwater intrusion occurred as the minimum salinity (25–28 July, Fig. 11a; 7–10 December, Fig. 11b) was always much higher than zero during the neap tide, indicating no freshwater could be collected at these sites. Salt intrusion quickly disappeared after the neap tide during these observations. However, in 2018, a saltwater intrusion lasted for the whole observational period (Fig. 11d) despite environmental conditions including wind and river discharge being similar in 2018 compared to 2016. The dataset presented here provides an important source of information to further study saltwater intrusion mechanisms in the NP.
5.8 Suspended sediment
Extremely high SSC and typical CBSs were found during the measurement periods, especially in 2015 and 2016 as the SSC was up to tens of grams per liter (Fig. 12a and b). During measurements in 2017 and 2018, the SSC showed clear tidal variation with four peaks within a day, corresponding to two tidal cycles of the semidiurnal tides (Fig. 12c and d). The high SSC detected by in situ measurements is strong evidence that demonstrates the NP has abundant sediment and the sediment transport and behavior are important processes. The data can be further used to calculate sediment transport flux and analyze sediment dynamics in the NP.
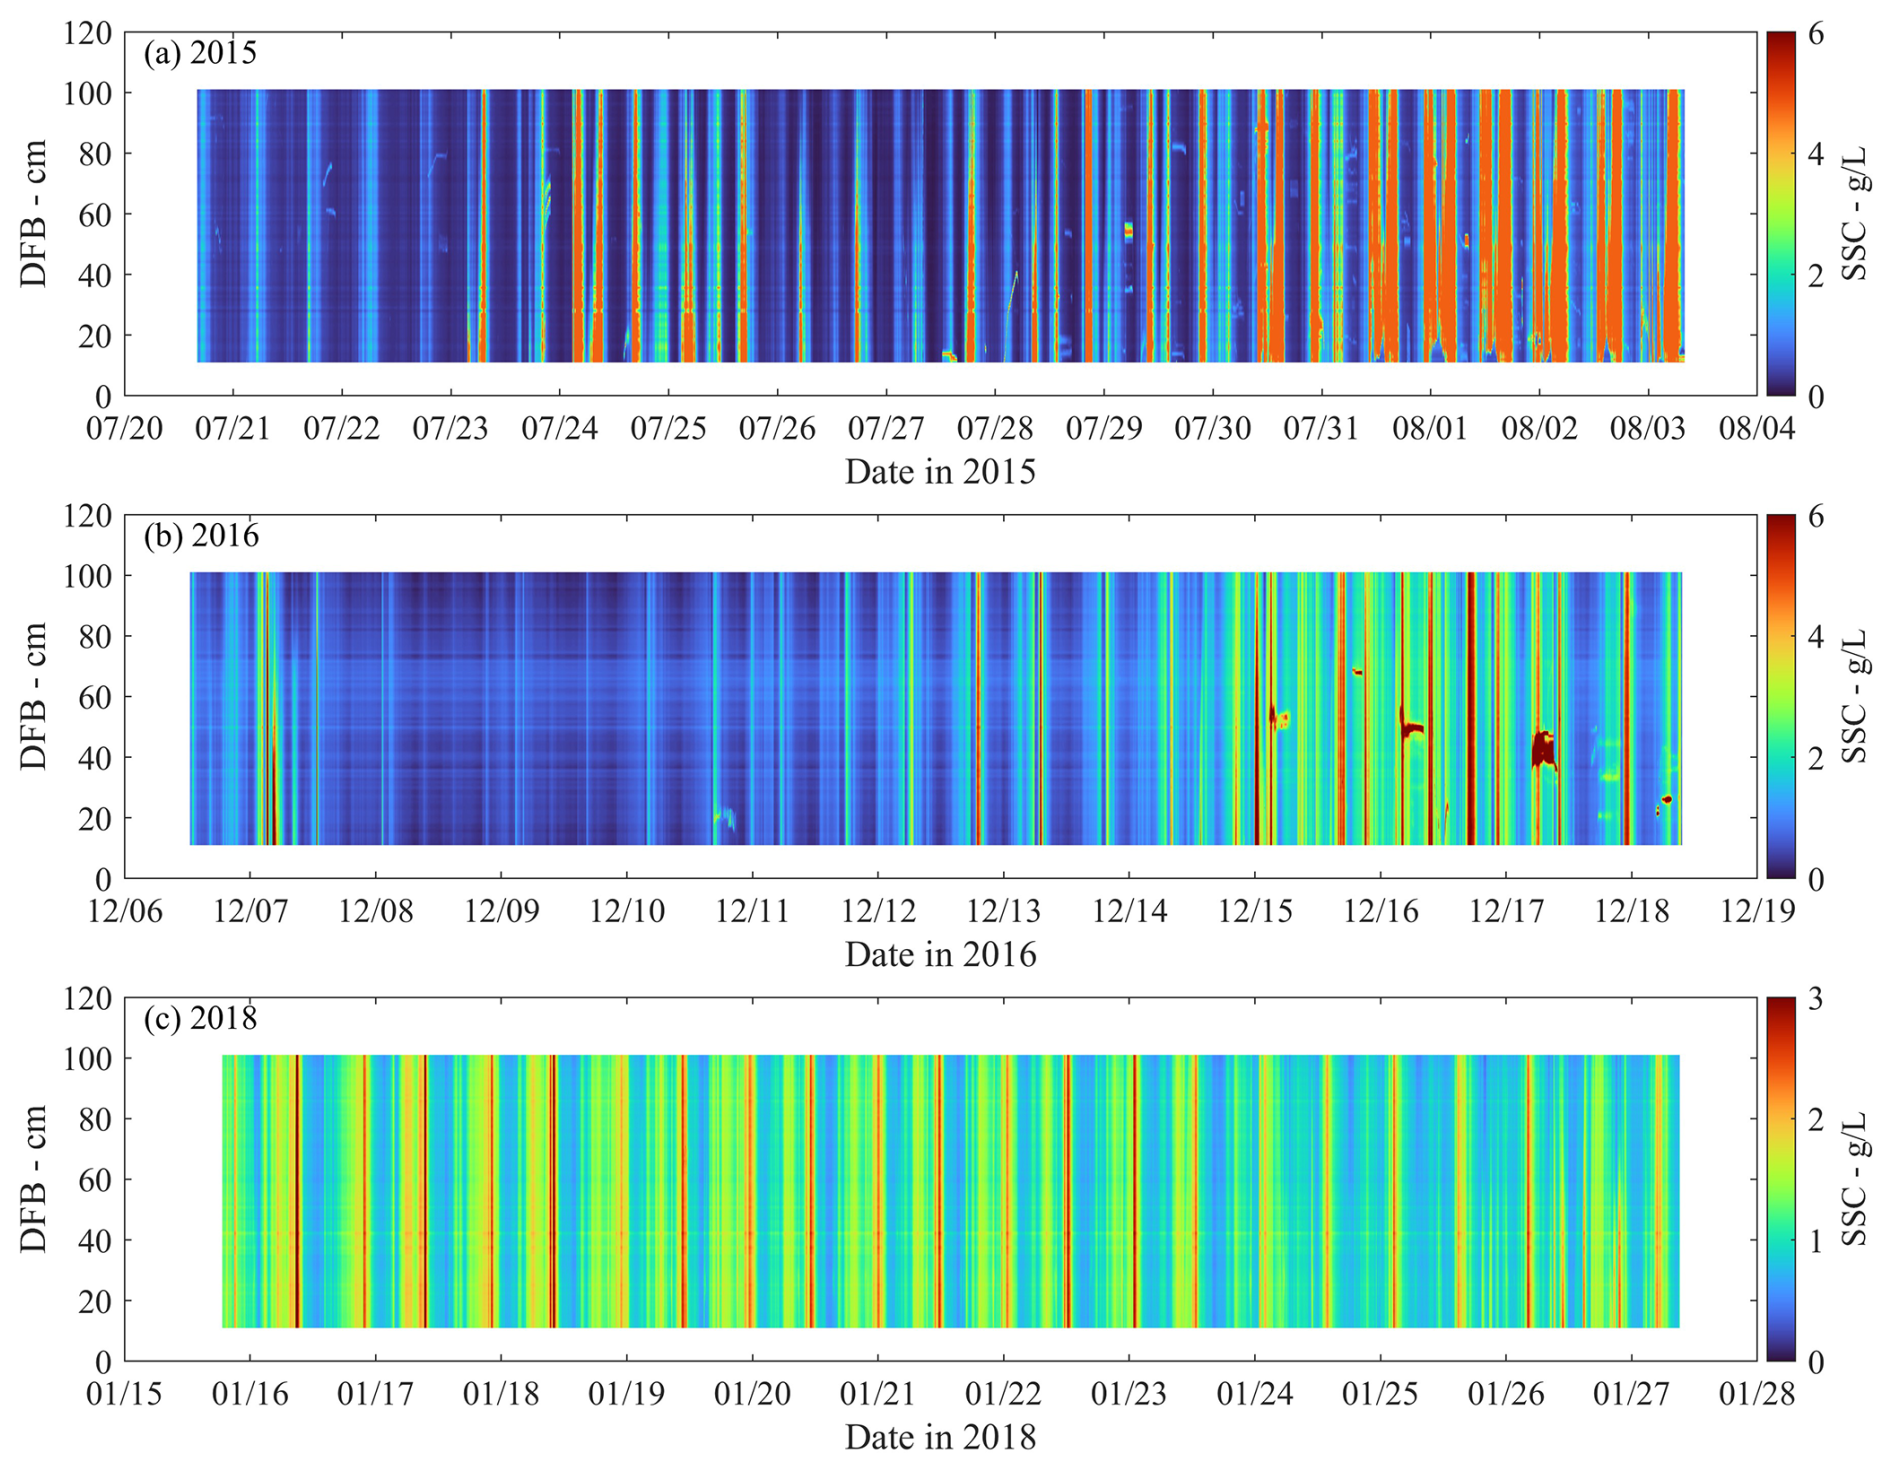
Figure 13The near-bed profile of SSC (about 0.05–1 m) measured in (a) 2015, (b) 2016, and (c) 2018.
More detailed information on near-bed SSC was recorded by the ASM in 2015, 2016, and 2018 (the ASM malfunctioned in the 2017). The ASM data reveal the vertical variation in SSC, for example very high SSC below 60 cm on 7 December 2016 (Fig. 13b). The SSC profile collected from the ASM can be further used to explore the dynamics of highly concentrated near-bed suspensions in a very dynamic environment, data of which are quite limitedly available.
All data presented in this article have been uploaded to the repository of 4TU.ResearchData: https://doi.org/10.4121/6d4fcaff-6a30-4990-881a-a5ac8ebb1ca6 (Zhou and Ge, 2024). The published data have undergone quality control, and the output intervals have been maintained according to the instrumental sampling configuration. The output intervals are 2 min for the ADCP-up, ADCP-down, ALEC (in 2015), ASM, CTD, and OBS-3A; 5 min for the ALEC (in 2016, 2017, and 2018) and RBR; and 10 min for TKE data from the ADV (burst-averaged), while for velocity data from the ADV, the output data record the entire high-frequency flow velocity.
All data are freely available to users and organized in an easy-to-read and easy-to-use way. Users should be able to apply the data based on this description paper and the detailed “Readme.dat” file included in the dataset.
From 2015 to 2018, eight sets of tripod frame measurements were conducted to obtain near-bed environmental conditions, constituting the NP-ChaM campaign in the North Passage of the Changjiang Estuary. The observational period included both wet and dry seasons, with each measurement lasting for more than 12 d, thereby capturing a complete neap–spring transition. The measurement sites were concentrated in the middle of the NP, on both sides of the deep channel. The temporal and spatial coverage of this data extended beyond that of other published datasets, making the unique NP-ChaM dataset particularly valuable for thorough investigations of hydrodynamics and sediment dynamics in the NP. This paper presents some preliminary results from the dataset, which can be further explored in different aspects.
Firstly, the formation mechanisms of CBSs in the CE can be further explored based on this dataset. The NP, which is at the core of the ETM of CE, confronts significant sediment deposition challenges. The CBS found in the NP contains abundant sediment that may contribute to the deposition problem in the deep channel. Although the DNC project has improved navigability in the NP, it has also increased the complexity of environmental conditions. Both natural mechanisms and human interventions should be considered to understand the formation, transport, and breakdown of CBSs. Early steps have been taken by, e.g., Ge et al. (2018) and Lin et al. (2021). Our dataset, which records high SSC and CBSs alongside other physical processes measured by multiple instruments, provides comprehensive information on sediment behaviors.
Secondly, lateral sediment exchange between the deep channel and the shallow shoals in the NP warrants further investigation. It has been presumed that lateral flows and sediment transport in the NP contribute to sediment deposition in the deep channel. Our dataset contains detailed information on flows and suspended sediment, enabling the quantification of transport flux under various conditions. Although more complex observations are necessary to verify this hypothesis, such as measuring bedload movement, our dataset reveals significant processes of channel–shoal exchange (Zhou et al., 2019, 2021).
In addition to its scientific values, the dataset also technically supports the improvement of numerical models. It is well suited for validating wave flow–sediment coupled models. Furthermore, the combination of in situ observations and well-validated models represents a common but powerful methodology for addressing the scientific questions mentioned above. Ultimately, we expect this dataset to contribute to a better understanding of system dynamics and effective strategies for maintaining the deep channel.
ZZ organized and conducted the field observations, processed ADV and OBS data, analyzed data, and wrote the manuscript. JG initiated the field campaign, assisted during the field observations, and edited the manuscript. DSvM contributed to data visualization, formal analysis, and manuscript review. HL, WG, JM, YT, PX, FD, WY, KK, SSh, and JZ conducted field observations and participated in data processing. HL, WG, and JM analyzed ADCP data. YT and PX analyzed CTD and RBR data. FD, WY, and KK analyzed ASM and ALEC data. SSh, JZ, and JM contributed to the calibration of OBS and ASM. YK participated in formal analysis of the data and reviewed the manuscript. CL and JG provided technical support regarding instrument configurations and data processing methods. PD conceptualized the field campaign and reviewed the manuscript. All co-authors contributed to the manuscript.
The contact author has declared that none of the authors has any competing interests.
Publisher's note: Copernicus Publications remains neutral with regard to jurisdictional claims made in the text, published maps, institutional affiliations, or any other geographical representation in this paper. While Copernicus Publications makes every effort to include appropriate place names, the final responsibility lies with the authors.
The authors are very grateful to the crews of the State Key Laboratory of Estuarine and Coastal Research (SKLEC). We greatly appreciate the free access to the European Centre for Medium-Range Weather Forecasts (ECMWF).
This research has been supported by the National Natural Science Foundation of China (grant nos. 42406161, 42476160, and 41776104) and the National Key Research and Development Program of China (grant no. 2022YFE0117500).
This paper was edited by Sabine Schmidt and reviewed by two anonymous referees.
Becker, M., Maushake, C., and Winter, C.: Observations of Mud-Induced Periodic Stratification in a Hyperturbid Estuary, Geophys. Res. Lett., 45, 5461–5469, https://doi.org/10.1029/2018GL077966, 2018.
Besset, M., Anthony, E. J., and Bouchette, F.: Multi-decadal variations in delta shorelines and their relationship to river sediment supply: An assessment and review, Earth-Sci. Rev., 193, 199–219, https://doi.org/10.1016/j.earscirev.2019.04.018, 2019.
Cai, H., Savenije, H. H. G., Zuo, S., Jiang, C., and Chua, V. P.: A predictive model for salt intrusion in estuaries applied to the Yangtze estuary, J. Hydrol., 529, 1336–1349, https://doi.org/10.1016/j.jhydrol.2015.08.050, 2015.
Chant, R. J.: Estuarine secondary circulation, in: Contemporary Issues in Estuarine Physics, edited by: Valle-Levinson, A., Cambridge University Press, Cambridge, 100–124, https://doi.org/10.1017/CBO9780511676567.006, 2010.
Chen, Q., Zhu, J., Lyu, H., Pan, S., and Chen, S.: Estuarine, Coastal and Shelf Science Impacts of topography change on saltwater intrusion over the past decade in the Changjiang Estuary, Estuar. Coast. Shelf Sci., 231, 106469, https://doi.org/10.1016/j.ecss.2019.106469, 2019.
Chen, W. and de Swart, H. E.: Longitudinal variation in lateral trapping of fine sediment in tidal estuaries: observations and a 3D exploratory model, Ocean Dynam., 68, 309–326, https://doi.org/10.1007/s10236-018-1134-z, 2018.
Cossu, R. and Wells, M. G.: Coriolis forces influence the secondary circulation of gravity currents flowing in large-scale sinuous submarine channel systems, Geophys. Res. Lett., 37, L17603, https://doi.org/10.1029/2010GL044296, 2010.
de Nijs, M. A. J. and Pietrzak, J. D.: Saltwater intrusion and ETM dynamics in a tidally-energetic stratified estuary, Ocean Model., 49–50, 60–85, https://doi.org/10.1016/j.ocemod.2012.03.004, 2012.
Du, Z., Yu, Q., Peng, Y., Wang, L., Lin, H., Wang, Y., and Gao, S.: The Formation of Coastal Turbidity Maximum by Tidal Pumping in Well-Mixed Inner Shelves, J. Geophys. Res.-Oceans, 127, 1–29, https://doi.org/10.1029/2022JC018478, 2022.
Fugate, D. C., Friedrichs, C. T., and Sanford, L. P.: Lateral dynamics and associated transport of sediment in the upper reaches of a partially mixed estuary, Chesapeake Bay, USA, Cont. Shelf Res., 27, 679–698, https://doi.org/10.1016/j.csr.2006.11.012, 2007.
Ge, J., Zhou, Z., Yang, W., Ding, P., Chen, C., Wang, Z. B., and Gu, J.: Formation of Concentrated Benthic Suspension in a Time-Dependent Salt Wedge Estuary, J. Geophys. Res.-Oceans, 123, 8581–8607, https://doi.org/10.1029/2018JC013876, 2018.
Ge, J., Chen, C., Wang, Z. B., Ke, K., Yi, J., and Ding, P.: Dynamic Response of the Fluid Mud to a Tropical Storm, J. Geophys. Res.-Oceans, 125, 1–27, https://doi.org/10.1029/2019JC015419, 2020.
Geyer, W. R.: The Importance of Suppression of Turbulence by Stratification on the Estuarine Turbidity Maximum, Estuaries, 16, 113, https://doi.org/10.2307/1352769, 1993.
Geyer, W. R. and Ralston, D. K.: The Dynamics of Strongly Stratified Estuaries, in: Treatise on Estuarine and Coastal Science, vol. 2, Elsevier, 37–51, https://doi.org/10.1016/B978-0-12-374711-2.00206-0, 2011.
Geyer, W. R., Ralston, D. K., and Chen, J. L.: Mechanisms of Exchange Flow in an Estuary With a Narrow, Deep Channel and Wide, Shallow Shoals, J. Geophys. Res.-Oceans, 125, 1–25, https://doi.org/10.1029/2020JC016092, 2020.
Guo, C., He, Q., Guo, L., and Winterwerp, J. C.: A study of in-situ sediment flocculation in the turbidity maxima of the Yangtze Estuary, Estuar. Coast. Shelf Sci., 191, 1–9, https://doi.org/10.1016/j.ecss.2017.04.001, 2017.
Guo, L., Su, N., Zhu, C., and He, Q.: How have the river discharges and sediment loads changed in the Changjiang River basin downstream of the Three Gorges Dam?, J. Hydrol., 560, 259–274, https://doi.org/10.1016/j.jhydrol.2018.03.035, 2018.
Jiang, C., De Swart, H. E., Li, J., and Liu, G.: Mechanisms of along-channel sediment transport in the North Passage of the Yangtze Estuary and their response to large-scale interventions Topical Collection on the 11th International Conference on Cohesive Sediment Transport, Ocean Dynam., 63, 283–305, https://doi.org/10.1007/s10236-013-0594-4, 2013.
Kim, Y. H. and Voulgaris, G.: Lateral circulation and suspended sediment transport in a curved estuarine channel: Winyah Bay, SC, USA, J. Geophys. Res.-Oceans, 113, 1–15, https://doi.org/10.1029/2007JC004509, 2008.
Kranenburg, W. M., Geyer, W. R., Garcia, A. M. P., and Ralston, D. K.: Reversed Lateral Circulation in a Sharp Estuarine Bend with Weak Stratification, J. Phys. Oceanogr., 49, 1619–1637, https://doi.org/10.1175/JPO-D-18-0175.1, 2019.
Kularatne, S. and Pattiaratchi, C.: Turbulent kinetic energy and sediment resuspension due to wave groups, Cont. Shelf Res., 28, 726–736, https://doi.org/10.1016/j.csr.2007.12.007, 2008.
Lerczak, J. A. and Rockwell Geyer, W.: Modeling the Lateral Circulation in Straight, Stratified Estuaries, J. Phys. Oceanogr., 34, 1410–1428, https://doi.org/10.1175/1520-0485(2004)034<1410:MTLCIS>2.0.CO;2, 2004.
Lin, J., van Prooijen, B. C., Guo, L., Zhu, C., He, Q., and Wang, Z. B.: Regime shifts in the Changjiang (Yangtze River) Estuary: The role of concentrated benthic suspensions, Mar. Geol., 433, 106403, https://doi.org/10.1016/j.margeo.2020.106403, 2021.
Liu, G., Zhu, J., Wang, Y., Wu, H., and Wu, J.: Tripod measured residual currents and sediment flux: Impacts on the silting of the Deepwater Navigation Channel in the Changjiang Estuary, Estuar. Coast. Shelf Sci., 93, 192–201, https://doi.org/10.1016/j.ecss.2010.08.008, 2011.
Liu, H., He, Q., Wang, Z., Weltje, G. J., and Zhang, J.: Dynamics and spatial variability of near-bottom sediment exchange in the Yangtze Estuary, China, Estuar. Coast. Shelf Sci., 86, 322–330, https://doi.org/10.1016/j.ecss.2009.04.020, 2010.
Luan, H. L., Ding, P. X., Wang, Z. B., Ge, J. Z., and Yang, S. L.: Decadal morphological evolution of the Yangtze Estuary in response to river input changes and estuarine engineering projects, Geomorphology, 265, 12–23, https://doi.org/10.1016/j.geomorph.2016.04.022, 2016.
Luan, H. L., Ding, P. X., Wang, Z. B., Yang, S. L., and Lu, J. Y.: Morphodynamic impacts of large-scale engineering projects in the Yangtze River delta, Coast. Eng., 141, 1–11, https://doi.org/10.1016/j.coastaleng.2018.08.013, 2018.
MacCready, P. and Geyer, W. R.: Advances in Estuarine Physics, Ann. Rev. Mar. Sci., 2, 35–58, https://doi.org/10.1146/annurev-marine-120308-081015, 2010.
McCoy, A., Constantinescu, G., and Weber, L.: A numerical investigation of coherent structures and mass exchange processes in channel flow with two lateral submerged groynes, Water Resour. Res., 43, 1–26, https://doi.org/10.1029/2006WR005267, 2007.
McSweeney, J. M., Chant, R. J., and Sommerfield, C. K.: Lateral variability of sediment transport in the Delaware Estuary, J. Geophys. Res.-Oceans, 121, 725–744, https://doi.org/10.1002/2015JC010974, 2016.
Nichols, M. M.: Sediments of the James River estuary, Virginia, in: Environmental Framework of Coastal Plain Estuaries, edited by: Nelson, B. W., Geological Society of America, ISBN 9780813711331, https://doi.org/10.1130/MEM133, 1972.
Okubo, A.: Effect of shoreline irregularities on streamwise dispersion in estuaries and other embayments, Neth. J. Sea Res., 6, 213–224, https://doi.org/10.1016/0077-7579(73)90014-8, 1973.
Pein, J., Valle-Levinson, A., and Stanev, E. V.: Secondary Circulation Asymmetry in a Meandering, Partially Stratified Estuary, J. Geophys. Res.-Oceans, 123, 1670–1683, https://doi.org/10.1002/2016JC012623, 2018.
Pu, X., Shi, J. Z., Hu, G. D., and Xiong, L. B.: Circulation and mixing along the North Passage in the Changjiang River estuary, China, J. Mar. Syst., 148, 213–235, https://doi.org/10.1016/j.jmarsys.2015.03.009, 2015.
Ralston, D. K., Geyer, W. R., and Warner, J. C.: Bathymetric controls on sediment transport in the Hudson River estuary: Lateral asymmetry and frontal trapping, J. Geophys. Res.-Oceans, 117, C10013, https://doi.org/10.1029/2012JC008124, 2012.
Song, D., Wang, X. H., Cao, Z., and Guan, W.: Suspended sediment transport in the Deepwater Navigation Channel, Yangtze River Estuary, China, in the dry season 2009: 1. Observations over spring and neap tidal cycles, J. Geophys. Res.-Oceans, 118, 5555–5567, https://doi.org/10.1002/jgrc.20410, 2013.
Stapleton, K. R. and Huntley, D. A.: Seabed stress determinations using the inertial dissipation method and the turbulent kinetic energy method, Earth Surf. Proc. Land., 20, 807–815, 1995.
Syvitski, J. P. M., Kettner, A. J., Overeem, I., Hutton, E. W. H., Hannon, M. T., Brakenridge, G. R., Day, J., Vörösmarty, C., Saito, Y., Giosan, L., and Nicholls, R. J.: Sinking deltas due to human activities, Nat. Geosci., 2, 681–686, https://doi.org/10.1038/ngeo629, 2009.
Ten Brinke, W. B. M., Schulze, F. H., and van Der Veer, P.: Sand exchange between groyne-field beaches and the navigation channel of the Dutch Rhine: the impact of navigation versus river flow, River Res. Appl., 20, 899–928, https://doi.org/10.1002/rra.809, 2004.
Uijttewaal, W. S. J.: Effects of Groyne Layout on the Flow in Groyne Fields: Laboratory Experiments, J. Hydraul. Eng., 131, 782–791, https://doi.org/10.1061/(ASCE)0733-9429(2005)131:9(782), 2005.
Uijttewaal, W. S. J., Lehmann, D., and van Mazijk, A.: Exchange Processes between a River and Its Groyne Fields: Model Experiments, J. Hydraul. Eng., 127, 928–936, https://doi.org/10.1061/(ASCE)0733-9429(2001)127:11(928), 2001.
Valle-Levinson, A., Wong, K.-C., and Lwiza, K. M. M.: Fortnightly variability in the transverse dynamics of a coastal plain estuary, J. Geophys. Res.-Oceans, 105, 3413–3424, https://doi.org/10.1029/1999JC900307, 2000.
van Maanen, B. and Sottolichio, A.: Hydro- and sediment dynamics in the Gironde estuary (France): Sensitivity to seasonal variations in river inflow and sea level rise, Cont. Shelf Res., 165, 37–50, https://doi.org/10.1016/j.csr.2018.06.001, 2018.
van Maren, D. S., Winterwerp, J. C., Decrop, B., Wang, Z. B., and Vanlede, J.: Predicting the effect of a Current Deflecting Wall on harbour siltation, Cont. Shelf Res., 31, S182–S198, https://doi.org/10.1016/j.csr.2010.12.005, 2011.
Wang, Z. B., Van Maren, D. S., Ding, P. X., Yang, S. L., Van Prooijen, B. C., De Vet, P. L. M., Winterwerp, J. C., De Vriend, H. J., Stive, M. J. F., and He, Q.: Human impacts on morphodynamic thresholds in estuarine systems, Cont. Shelf Res., 111, 174–183, https://doi.org/10.1016/j.csr.2015.08.009, 2015.
Winterwerp, J. C., Wang, Z. B., Van Braeckel, A., Van Holland, G., and Kösters, F.: Man-induced regime shifts in small estuaries – II: A comparison of rivers, Ocean Dynam., 63, 1293–1306, https://doi.org/10.1007/s10236-013-0663-8, 2013.
Wu, H., Zhu, J., and Ho Choi, B.: Links between saltwater intrusion and subtidal circulation in the Changjiang Estuary: A model-guided study, Cont. Shelf Res., 30, 1891–1905, https://doi.org/10.1016/j.csr.2010.09.001, 2010.
Wu, J., Wang, Y., and Cheng, H.: Bedforms and bed material transport pathways in the Changjiang (Yangtze) Estuary, Geomorphology, 104, 175–184, https://doi.org/10.1016/j.geomorph.2008.08.011, 2009.
Wu, J., Liu, J. T., and Wang, X.: Sediment trapping of turbidity maxima in the Changjiang Estuary, Mar. Geol., 303–306, 14–25, https://doi.org/10.1016/j.margeo.2012.02.011, 2012.
Xue, P., Chen, C., Ding, P., Beardsley, R. C., Lin, H., Ge, J., and Kong, Y.: Saltwater intrusion into the Changjiang River: A model-guided mechanism study, J. Geophys. Res.-Oceans, 114, 1–15, https://doi.org/10.1029/2008JC004831, 2009.
Yang, S. L., Milliman, J. D., Li, P., and Xu, K.: 50,000 dams later: Erosion of the Yangtze River and its delta, Global Planet. Change, 75, 14–20, https://doi.org/10.1016/j.gloplacha.2010.09.006, 2011.
Yun, C. X.: Recent evolution of the Yangtze estuary and its mechanisms, China Ocean Press, Beijing, China, ISBN 9787502762193, 2004.
Zhou, Z. and Ge, J.: Dataset of North Passage Channel Measurements (NP-ChaM), 4TU.Research.Data [data set], https://doi.org/10.4121/6d4fcaff-6a30-4990-881a-a5ac8ebb1ca6, 2024.
Zhou, Z., Ge, J., Wang, Z. B., Maren, D. S., Ma, J., and Ding, P.: Study of Lateral Flow in a Stratified Tidal Channel-Shoal System: The Importance of Intratidal Salinity Variation, J. Geophys. Res.-Oceans, 124, 6702–6719, https://doi.org/10.1029/2019JC015307, 2019.
Zhou, Z., Ge, J., van Maren, D. S., Wang, Z. B., Kuai, Y., and Ding, P.: Study of Sediment Transport in a Tidal Channel-Shoal System: Lateral Effects and Slack-Water Dynamics, J. Geophys. Res.-Oceans, 126, e2020JC016334, https://doi.org/10.1029/2020JC016334, 2021.
Zhu, C., van Maren, D. S., Guo, L., He, Q., and Wang, Z. B.: Impact of Reduced Fluvial Sediment Supply on Saltwater Intrusion in the Yangtze Estuary, Earth's Future, 11, 1–19, https://doi.org/10.1029/2022EF003274, 2023.
Zhu, J., Gu, Y., and Wu, H.: Determination of the period not suitable for taking demestic water supply to the Qingcaosha Reservoir near Changjiang River estuary, Oceanol. Limnol. Sin. Yang Yu Hu Chao, 44, 1138–1145, 2013.
Zhu, L., He, Q., and Shen, J.: Modeling lateral circulation and its influence on the along-channel flow in a branched estuary, Ocean Dynam., 68, 177–191, https://doi.org/10.1007/s10236-017-1114-8, 2018.