the Creative Commons Attribution 4.0 License.
the Creative Commons Attribution 4.0 License.
 | 12 Dec 2025
Spatial patterns of sandy beaches in China and risk analysis of human infrastructure squeeze based on multi-source data and ensemble learning
Jie Meng
Duanyang Xu
Zexing Tao
Quansheng Ge
Sandy beaches provide essential ecological and economic services, but their functions are increasingly threatened by human activities. Analyzing the spatial distribution of China's sandy beaches and the impacts of human activities offers valuable insights for coastal resource management and ecological protection. However, remote sensing technologies face challenges such as limited data sources and tidal influences, which affect recognition accuracy. Therefore, integrating multi-source remote sensing data and reducing the impact of tidal fluctuations to improve recognition accuracy remains a key challenge. This study proposes an innovative approach utilizing multi-source data and an ensemble learning model to identify sandy beaches in China (2016–2024). By integrating Sentinel-1/2 satellite data, terrain data, and nighttime light data, along with spectral, index, terrain, texture, and polarization features, sandy beaches were identified across multiple years, and the results were consolidated into a unique dataset to analyze spatial patterns and risks from human infrastructure squeeze. (1) High-precision classification identified 3347 sandy beaches in China, covering a total area of 320.50 km2. Guangdong had the largest number, area, and perimeter, while Hebei had the widest sandy beaches. (2) In Fujian, Guangdong, and Taiwan, the identified sandy beaches covered 54.57, 78.88, and 46.60 km2, with perimeters of 1435.89, 2849.39, and 1324.98 km, and widths of 54.91, 38.92, and 57.17 m, respectively. These results were significantly better than those from published datasets. (3) From 1990 to 2024, the area at risk from human infrastructure squeeze increased from 134.39 to 181.42 km2, a rise of 47.03 km2, with the most significant increase occurring between 1995 and 2000. Guangdong and Fujian showed growth rates of 0.38 and 0.32 km2 yr−1, respectively. This study provides an up-to-date dataset on China's sandy beaches. It assesses their spatial patterns and human impact risks, contributing to research and policy for the sustainable development of coastal zones (https://doi.org/10.5281/zenodo.15307240, Meng et al., 2025).
- Article
(14928 KB) - Full-text XML
-
Supplement
(752 KB) - BibTeX
- EndNote


As transitional zones between land and sea, sandy beaches play a critical ecological role, providing essential habitats for various flora and fauna and offering crucial ecosystem services such as climate regulation, wave attenuation, and storm surge protection (Temmerman et al., 2013; Lansu et al., 2024; Mentaschi et al., 2018). Moreover, sandy beaches support a wide range of economic activities including tourism, fisheries, marine resource development, and land use, thereby holding considerable economic value (Mejjad et al., 2022; Brščić and Šugar, 2020; Ranasinghe, 2016). However, with the development of coastal areas, sandy beach ecosystems are increasingly threatened by human activities. Urban expansion, pollution, and tourism-related disturbances have transformed many natural sandy beaches into residential, commercial, or industrial land, leading to habitat degradation and the loss of ecological functions (Lu et al., 2018b; Barbier et al., 2011). Therefore, accurate identification and mapping of sandy beach areas are essential for ecological conservation, resource management, and sustainable coastal development.
Efficient and precise identification of sandy beach areas is a core component of sandy beach research (Ponte et al., 2016). Traditional field-based surveys, while offering high accuracy, are often constrained by high labor costs, low efficiency, and environmental limitations (Rodríguez-Padilla et al., 2024; Valderrama-Landeros et al., 2022; Bai et al., 2021; Blenkinsopp et al., 2021). In contrast, remote sensing technologies based on satellites, and aerial platforms – including unmanned aerial vehicles (UAVs), with their high temporal resolution and broad spatial coverage, enable effective data acquisition across different regions and climatic conditions and thus have become the primary method for large-area sandy beach identification (Xu et al., 2024; Sun et al., 2024; Salameh et al., 2019; Nativí-Merchán et al., 2021; Splinter et al., 2018). Current remote sensing-based sandy beach identification methods are generally categorized into visual interpretation and automated classification (Sekovski et al., 2014; Toure et al., 2019). While visual interpretation relies heavily on expert experience and high-quality imagery, it is susceptible to tidal variations and subjectivity, making it unsuitable for large-area or long-term monitoring. Automated classification methods, on the other hand, extract features such as spectral and texture information to achieve more consistent and efficient identification, gradually becoming the mainstream approach in remote sensing-based sandy beach studies. These methods are particularly suited for large-area monitoring, providing efficient and accurate results over extensive areas (Masria, 2024; Yasir et al., 2020; Wei et al., 2021).
Currently, remote sensing-based automated sandy beach recognition methods encompass a variety of techniques, including threshold segmentation, machine learning methods, and deep learning methods (Sekar et al., 2022; Vicens-Miquel et al., 2022; Rabehi et al., 2023). Threshold segmentation divides the image into sandy beach and non-sandy beach areas by analyzing pixel value thresholds of remote sensing images. This method is simple and efficient, but the segmentation performance is often poor in complex backgrounds or areas with subtle grayscale differences (Bao et al., 2018). Machine learning and deep learning methods are similar in principle, as both build classification models through training datasets, enabling them to handle complex images and exhibit strong pattern recognition capabilities. Machine learning methods typically require integrating multiple features from remote sensing images, such as spectral, spatial, and texture information, while deep learning methods automatically extract features and perform classification using multi-layer neural networks, capable of handling large-scale and complex datasets. For example, an exploratory survey and monitoring of sandy beaches was carried out by comparing Sentinel-2 and Landsat images, using random forests and various spectral indices (Latella et al., 2021), while a binary image segmentation method based on the U-Net model in convolutional neural networks was applied to accurately delineate the sandy beach outline of the southeastern coast of Australia (Yong et al., 2024). Despite significant progress in improving recognition accuracy and spatial scalability, machine learning and deep learning methods still face several challenges under complex conditions and tidal interference. Specifically, due to the single spectral feature of optical imagery, the recognition accuracy of machine learning methods still needs improvement in certain situations, particularly in areas where feature boundaries are unclear or the background is complex. For deep learning methods, the influence of tidal variations remains a significant challenge. To overcome the impact of tidal variations on sandy beach extraction from remote sensing images, multi-year data needs to be introduced, which requires a large amount of labeled data for training. However, high-quality labeled data are often difficult to obtain, and the training process is time-consuming, increasing computational resource consumption. Moreover, during the training of multi-layer neural networks, overfitting may also become an issue (Zhu et al., 2023; Chen et al., 2022; Zhou et al., 2023b; Wang et al., 2024b).
The coastal regions of China are among the most economically developed and dynamic areas in the country, encompassing several key economic belts and contributing to over 57 % of the national gross income (Tian et al., 2016; Wang et al., 2024; Feng et al., 2025). These areas not only have a solid industrial foundation, vibrant trade, and advanced service sectors but also serve as the core engines of national economic growth. However, despite the rapid economic development in these regions, there is a lack of nationwide dynamic monitoring tools for sandy beaches, and the risks posed by human infrastructure squeeze – particularly due to urban development and coastal expansion – are not well understood. Past research has mainly relied on single optical imagery data and has not fully considered the use of multi-year data to address tidal changes, which limits the comprehensive understanding and monitoring of coastal beach changes. To address these challenges, this study is divided into two main components: (1) This study proposes a novel method for sandy beach identification using multi-source remote sensing and ensemble learning. Sentinel-1/2 imagery, nighttime light, and terrain data are integrated to extract spectral, index, terrain, polarization, and texture features. A stacking ensemble framework enhances classification accuracy and robustness. Multi-year sandy beach data extracted using ensemble learning from 2016 to 2024 are merged to construct an annual representative sandy beach dataset, reducing tidal fluctuation impacts and supporting precise mapping and monitoring; (2) Based on human infrastructure data, buffer zones are created and combined with this dataset to identify areas at risk of encroachment. Spatial analysis evaluates anthropogenic pressure on beaches across regions. The results offer a scientific basis for delineating ecological red lines and inform strategies for beach conservation and coastal zone management.
2.1 Study area
To identify sandy beaches along China's coast from 2016 to 2024, this study adopts the 2024 coastline of China as the baseline. A buffer zone extending 10 km inland and 20 km offshore is applied to ensure the integrity of the sandy beach area (Li and Niu, 2022). The study area spans from 107°54′ to 124°21′ E longitude and from 17°58′ to 41°8′ N latitude, encompassing 14 regions (Liaoning, Hebei, Shandong, Jiangsu, Zhejiang, Fujian, Guangdong, Hainan, Taiwan, Guangxi, Tianjin, Shanghai, Hong Kong, and Macao) (Fig. 1). For statistical convenience, the coastal regions of Hong Kong and Macao are included within the Guangdong coastal region.
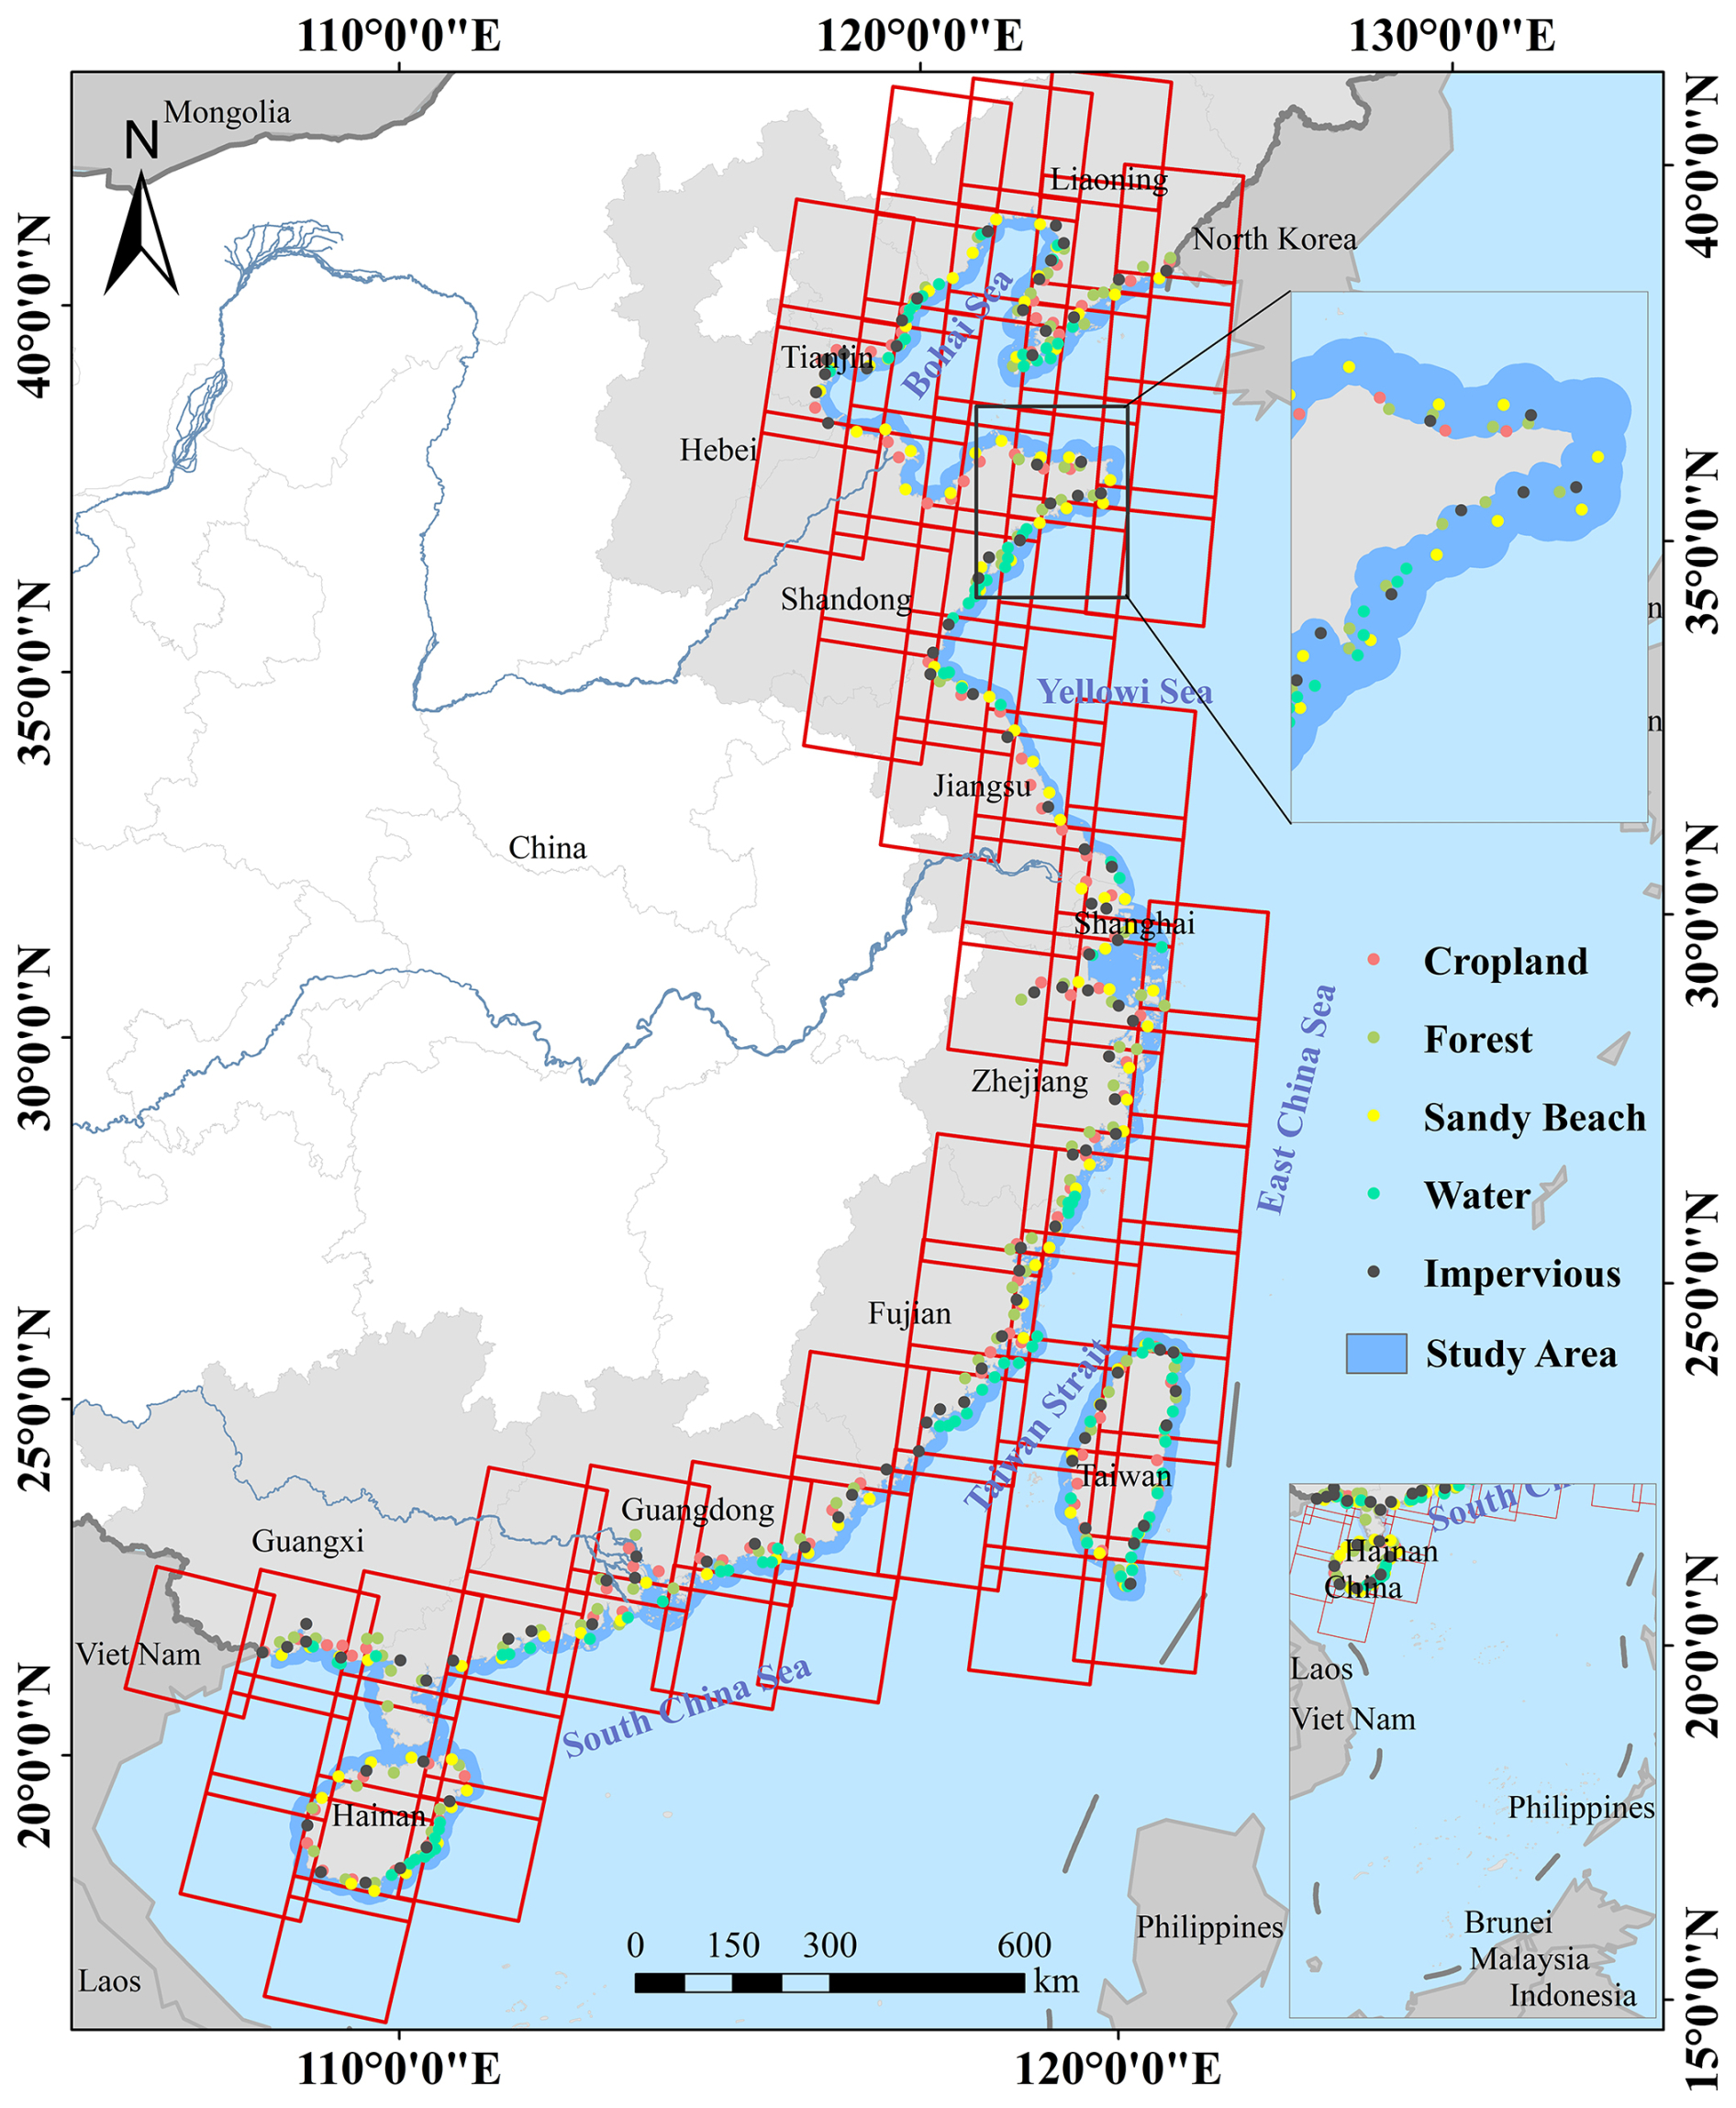
Figure 1Location of China's coastal zone and distribution of partial typical land feature points for results verification.
2.2 Remote sensing data
This study used Sentinel-1, Sentinel-2, and Google Earth imagery, with data collected from 1 January 2016 to 31 December 2024. The Sentinel-1 images are Level-1 Ground Range Detected (GRD) products, acquired in Interferometric Wide (IW) mode, including dual-polarization VV (vertical transmit, vertical receive) and VH (vertical transmit, horizontal receive) data (Tian et al., 2022). A total of 23 859 Sentinel-1A images were selected, and annual mean composites were generated for each polarization channel (Figs. 2a and S1 in the Supplement). For Sentinel-2, five spectral bands were used: four visible and near-infrared bands (Bands 2, 3, 4, and 8) with a resolution of 10 m, and one shortwave infrared band (Band 11) with a resolution of 20 m. A total of 80 759 L2A and L1C images were selected, with cloud cover below 10 % (Figs. 2b and S1) (Li et al., 2022). After atmospheric correction, the QA60 quality band was applied to remove clouds and cloud shadows. Since atmospheric correction is not essential for applications not involving complex spectral analysis, L1C images were used for years lacking L2A data (Wang et al., 2023). Finally, cloud-free median composites were generated and resampled to a 10 m resolution. Google Earth imagery was sourced from the “Google Earth Engine” plugin and online map services on the QGIS platform, with a spatial resolution of 1 to 5 m, enabling clear visualization of beach areas with high geographical accuracy and temporal consistency.
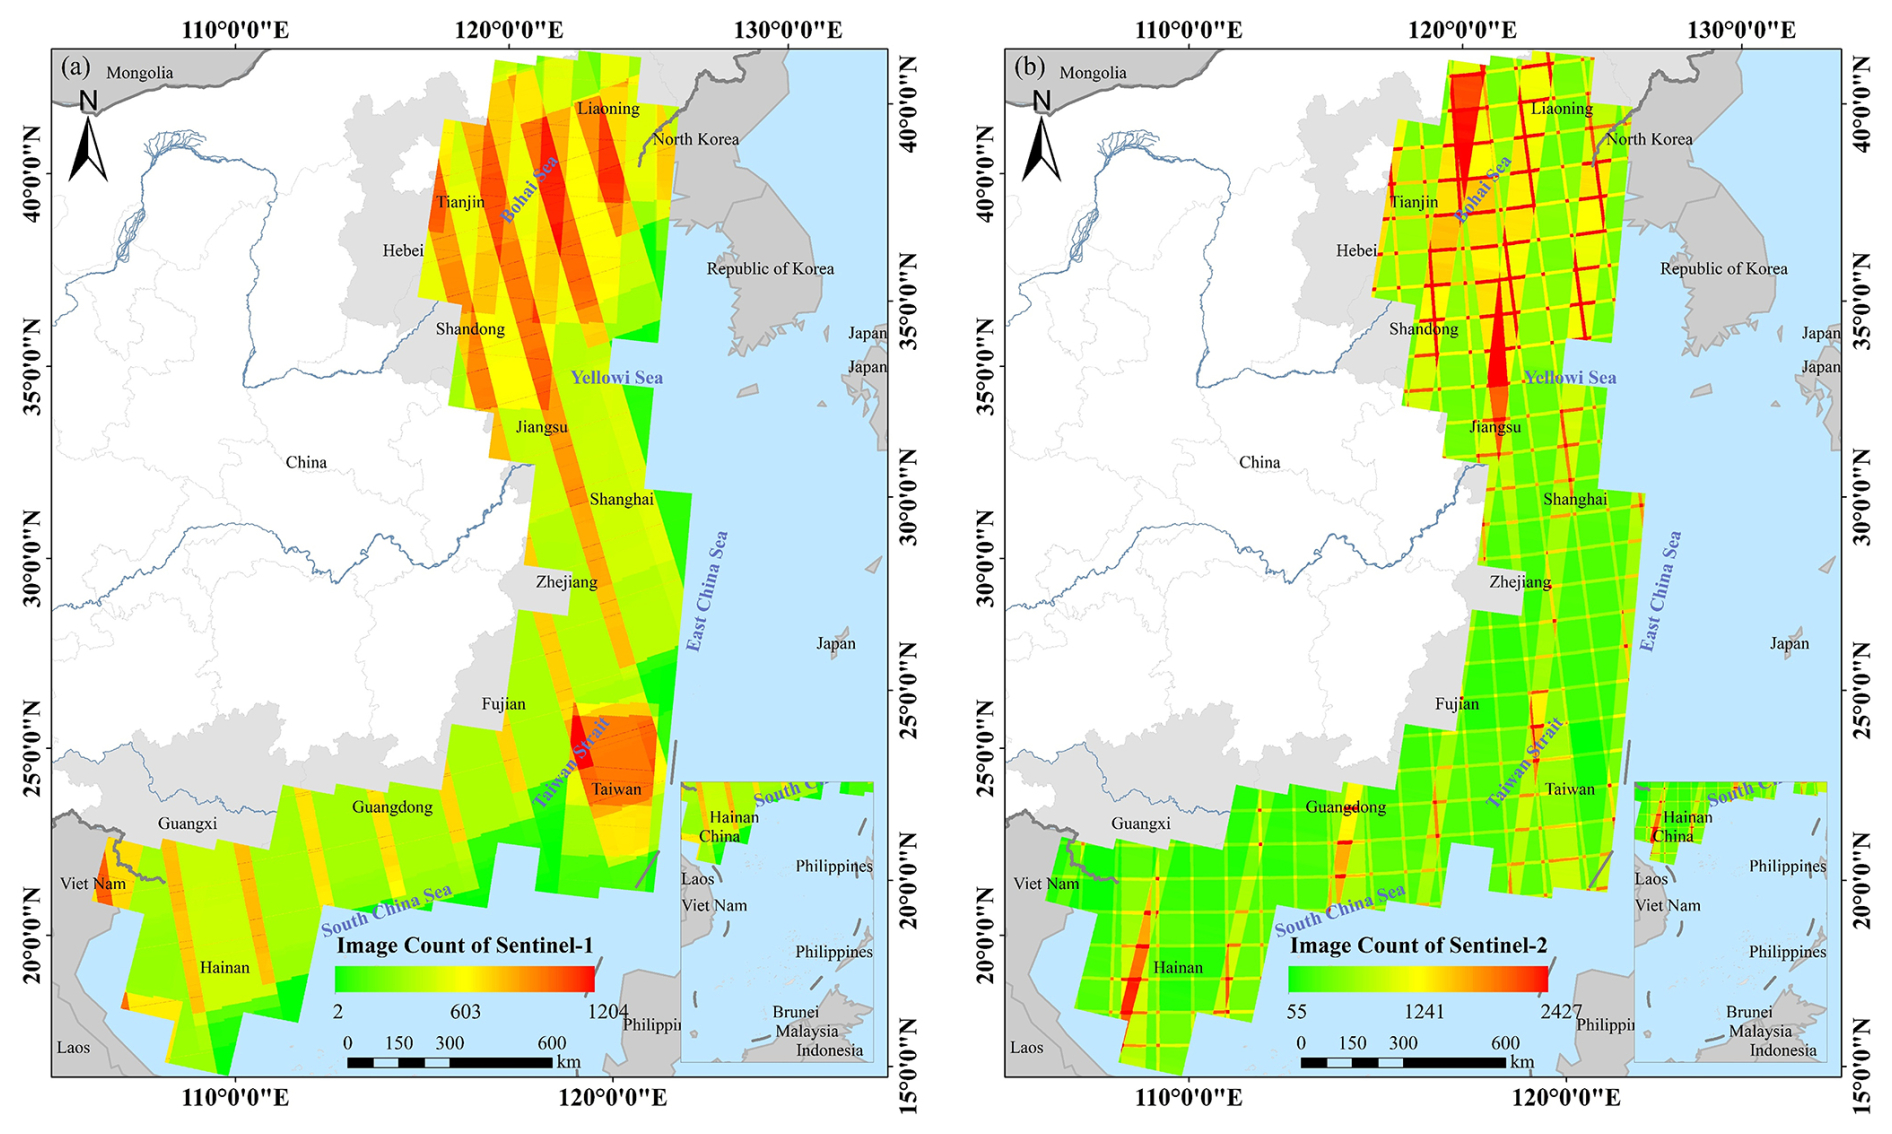
Figure 2Spatial distribution of Sentinel-1 and Sentinel-2 images used in this study from 2016 to 2024: (a) Image Count of Sentinel-1, (b) Image Count of Sentinel-2.
2.3 Other data
The NASADEM dataset, provided by NASA and based on C-band radar with a 30 m resolution, accurately reflects global elevation. This study used the 2000 NASADEM data, resampled to 10 m, as terrain data for the period from 2016 to 2024. VIIRS nighttime light data (VNTL), provided by NOAA and NASA with a 500 m resolution, were used to represent global nighttime illumination. The data from 2016 to 2024 were selected, resampled to 10 m, clipped to [0,63] to remove outliers, normalized, and then used as the nighttime light dataset for this study. The land cover data selected for this study is the Landsat-derived annual China Land Cover Dataset (CLCD) from 1990 to 2024, with a resolution of 30 m, used to study changes in the area of human infrastructure squeeze risk (Yang and Huang, 2021). The per capita GDP, resident population, built-up area, and road area of the study area from 1990 to 2024 were obtained from the National Bureau of Statistics and local statistical bureaus (https://www.stats.gov.cn/, last access: 15 November 2025). In addition, data from 1990, 2000, 2010, and 2020 were extracted for Jinjiang, Licheng, and Fengze Districts of Quanzhou City to assess human infrastructure squeeze risk. GDP and population density data were obtained from the China GDP and Population Spatial Distribution Kilometer Grid Datasets (Xu, 2017a; Xu, 2017b). Built-up area data were sourced from the GHS-BUILT-H R2023A dataset published by the European Commission Joint Research Centre in 2022–2024 (Pesaresi and Politis, 2023). Road network data were derived from the national basic geographic information data (https://www.webmap.cn/, last access: 8 April 2025) and Harvard University (Baum-Snow et al., 2017). If data for a specific year were unavailable, the data from the nearest available year were used instead.
2.4 Published datasets
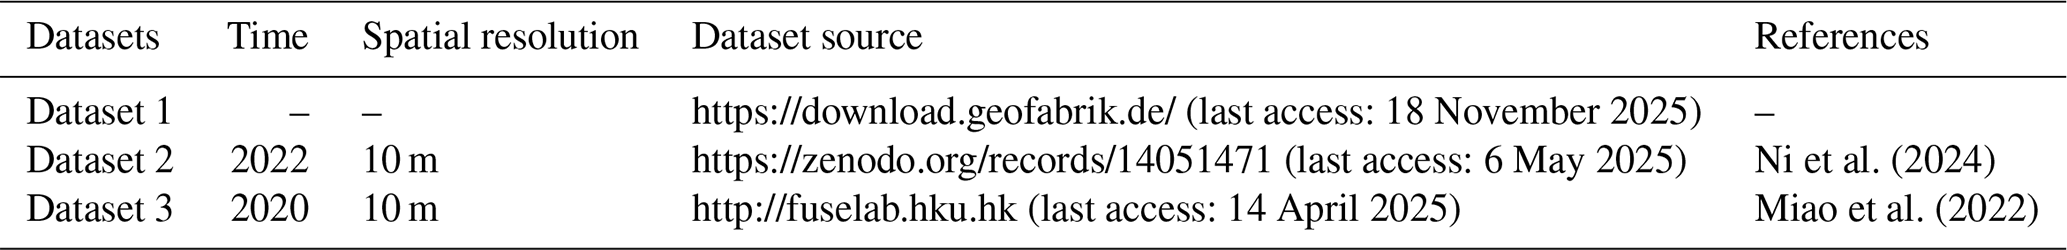
In this study, we used three datasets to evaluate our identified sandy beach dataset (Table 1): (1) The China sandy beach dataset, data directly obtained from the OpenStreetMap (OSM) database; (2) The 2022 China 10 m sandy beach dataset was identified using a support vector machine method based on Sentinel-2 imagery (Ni et al., 2024); (3) The 2020 China coastal land use dataset at 10 m resolution was identified using an object-oriented classification method based on Sentinel-2 imagery (Miao et al., 2022).
Table 1Datasets used to evaluate the accuracy of sandy beach classification.
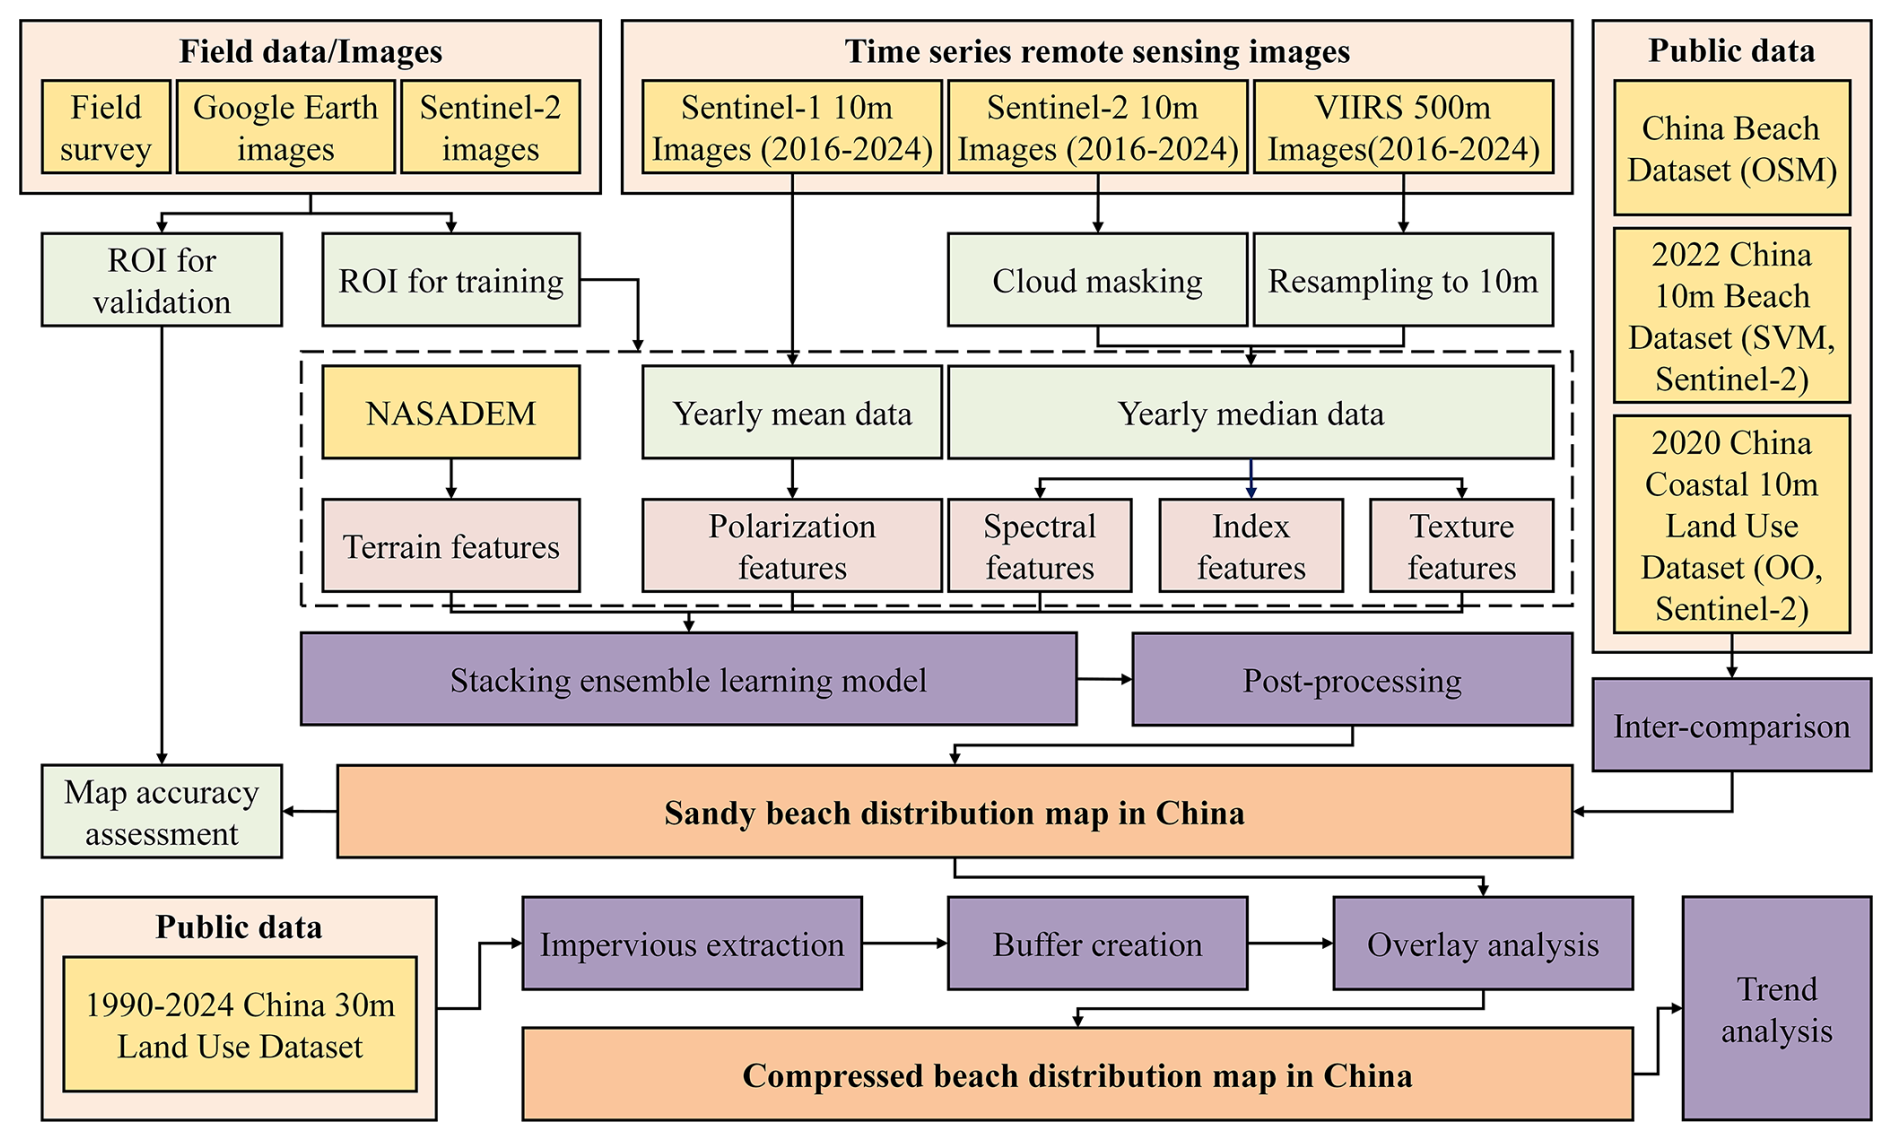
To accurately monitor the current status of sandy beaches in China, this study integrates multi-source data from 2016 to 2024, including Sentinel-1/2 imagery, terrain data, and nighttime light data. By processing these multi-source datasets, spectral, index, terrain, texture, and polarization features were extracted to construct a multi-source, multi-feature, and multi-model framework based on a stacking ensemble learning approach, aiming to delineate the spatial distribution of sandy beaches in China. On this basis, 100 m buffer zones were established based on impervious surface data from 1990 to 2024 and combined with the sandy beach dataset for overlay analysis to identify areas at risk of human infrastructure squeeze and to analyze their spatiotemporal dynamics. The technical framework of the study is illustrated (Fig. 3).
3.1 Sample generation via visual interpretation
The main land cover types in the non-beach areas of the study area include farmland, forest, water, and impervious, which are defined based on typical coastal land cover characteristics in China (Yang et al., 2021). In the sample library, these non-sandy beach types, in addition to the sandy beach samples, play an important role. Therefore, we define the land use types in the study area as sandy beaches and non-sandy beaches, with non-sandy beach types including farmland, forest, water, and impervious. Based on field surveys, we conducted annual visual interpretation using Google Earth and Sentinel-2 imagery to label samples from 2016 to 2024. Through this approach, a candidate sample library was built, containing 341 057 samples, with 249 098 for model training and 91 959 for testing (Figs. 4 and S2 in the Supplement). The samples were randomly divided into training and testing sets at an approximate 7:3 ratio, while ensuring consistent sample proportions across the 12 regions of the study area and maintaining balanced ratios of sandy beach and non-sandy beach samples within each region. This partitioning strategy effectively avoided regional bias and ensured the reliability and representativeness of the model evaluation.
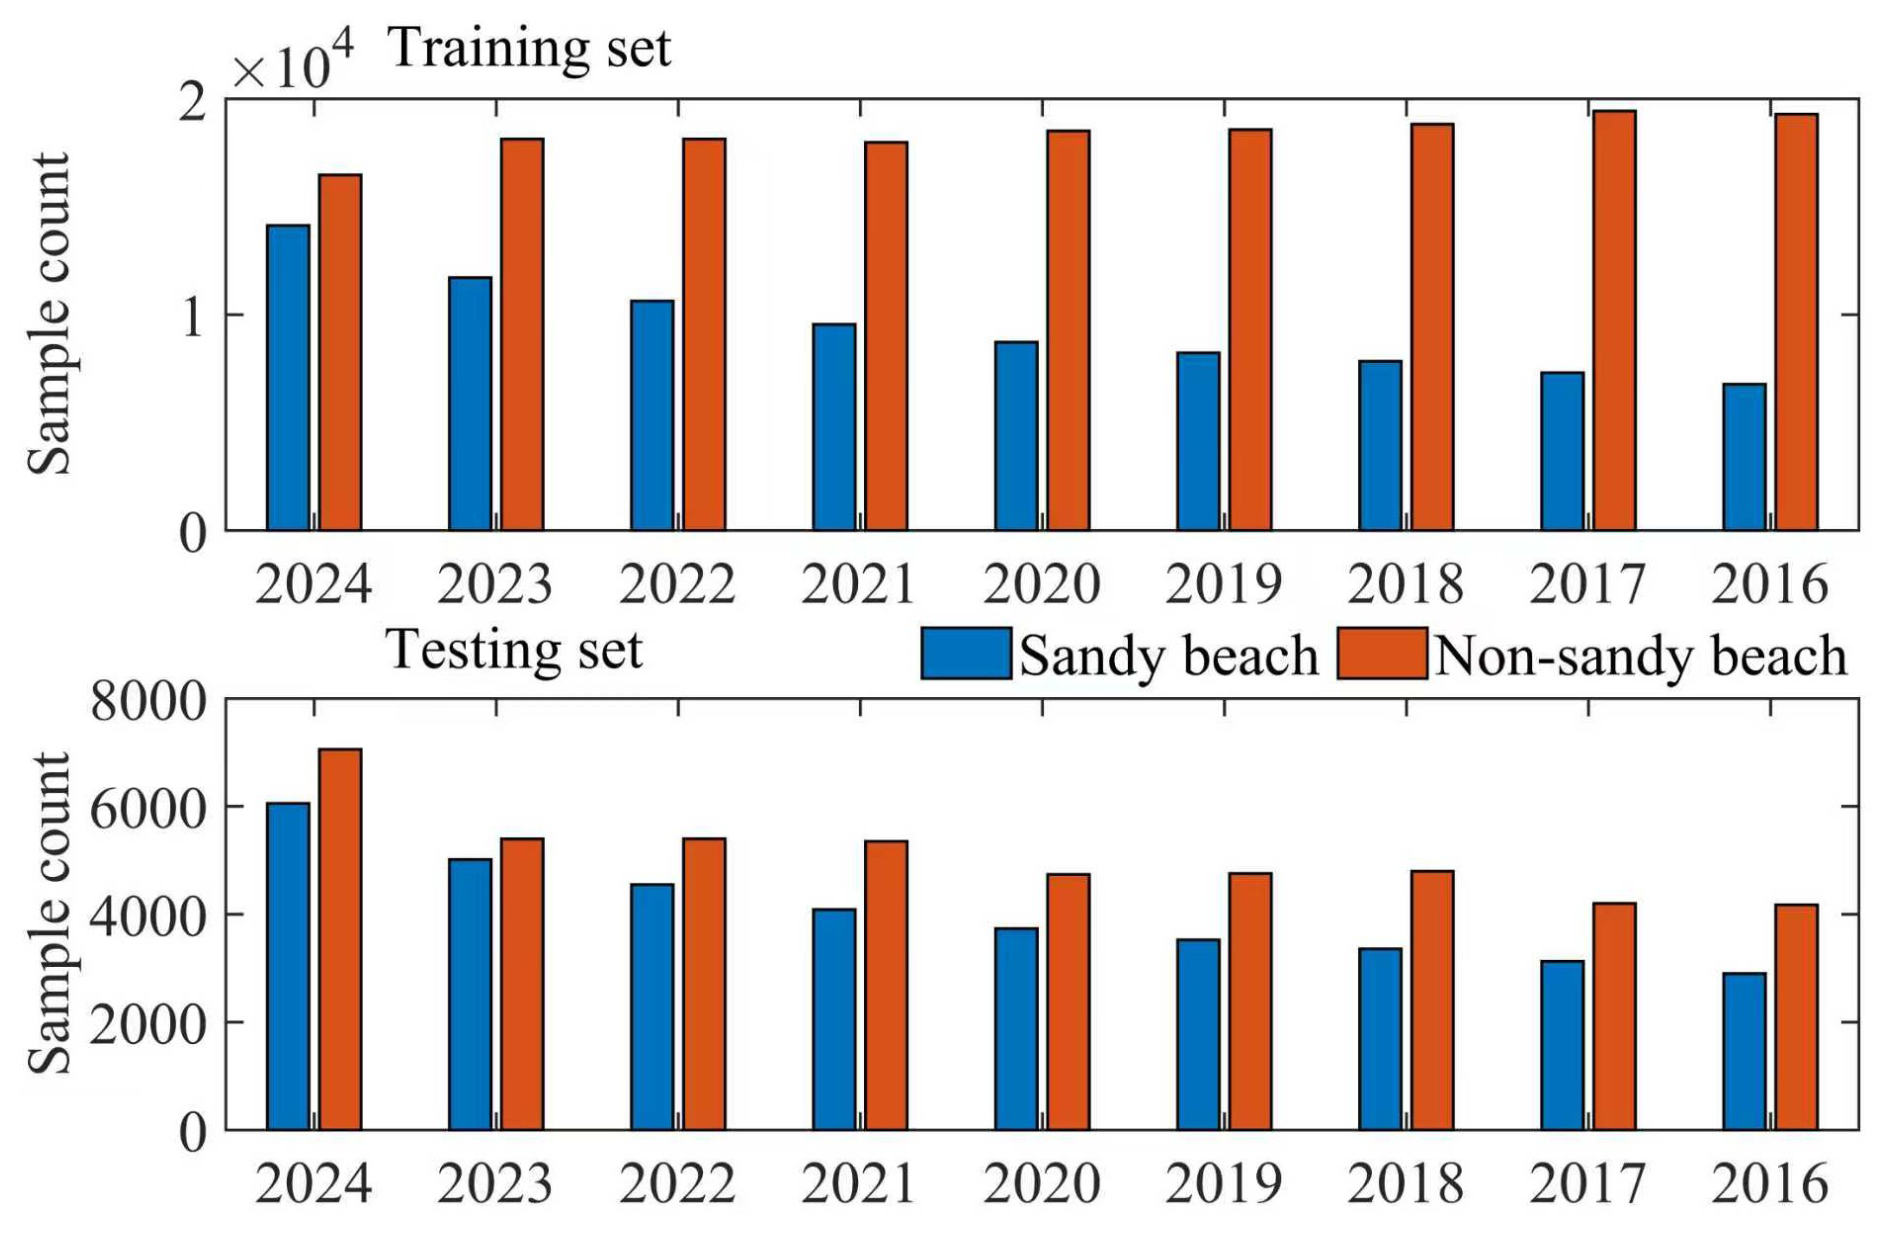
Figure 4Annual counts of sandy beach and non-sandy beach samples in the training and testing sets.
3.2 Constructing sandy beach classification input features using multi-source data
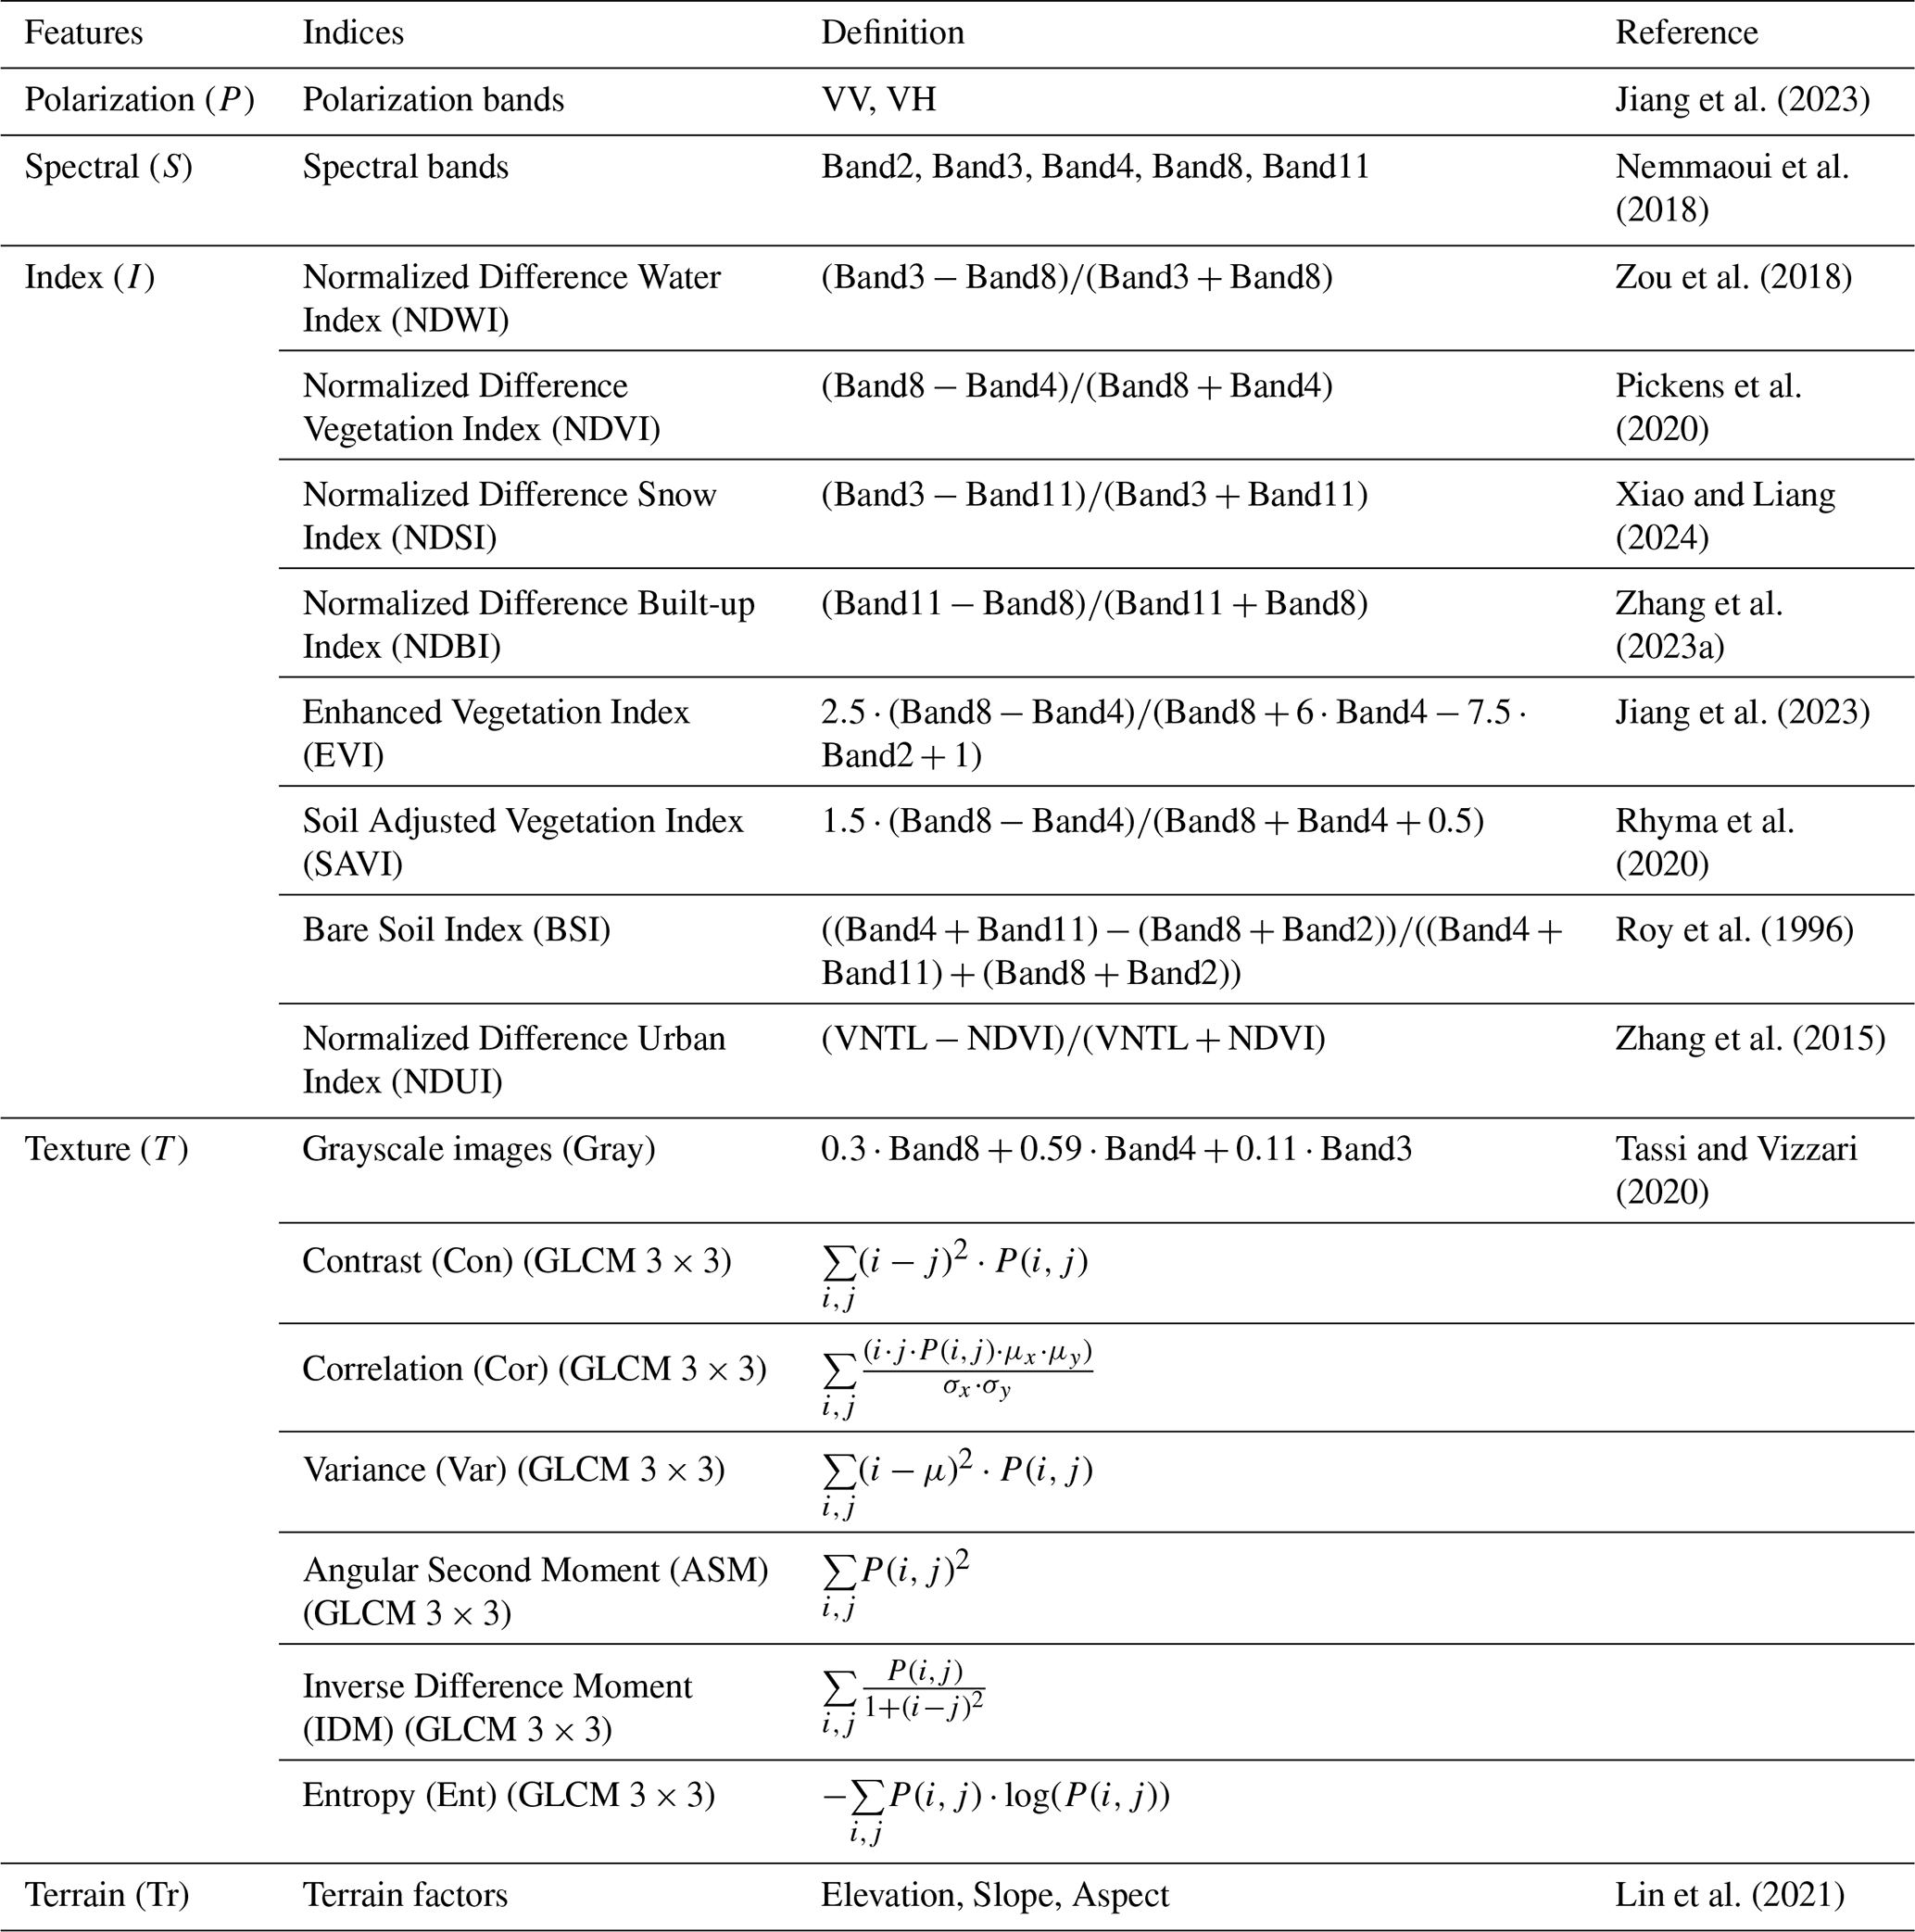
This study selected 24 indicators from five dimensions – spectral, index, terrain, polarization, and texture – as input features for the ensemble learning model (Table 2). First, the VV and VH polarization modes were selected as polarization features. Next, five bands – Band 2, Band 3, Band 4, Band 8, and Band 11 – were chosen as spectral features, while eight indices – NDWI, NDVI, NDSI, NDBI, EVI, SAVI, BSI, and NDUI – were treated as index features. Then, grayscale images were generated using Band 3, Band 4, and Band 8, and six texture metrics – contrast, correlation, variance, angular second moment, inverse difference moment, and entropy – were derived from the grayscale images as texture features. Finally, elevation, slope, and aspect were selected as terrain features.
3.3 Sandy beach classification using an ensemble learning model
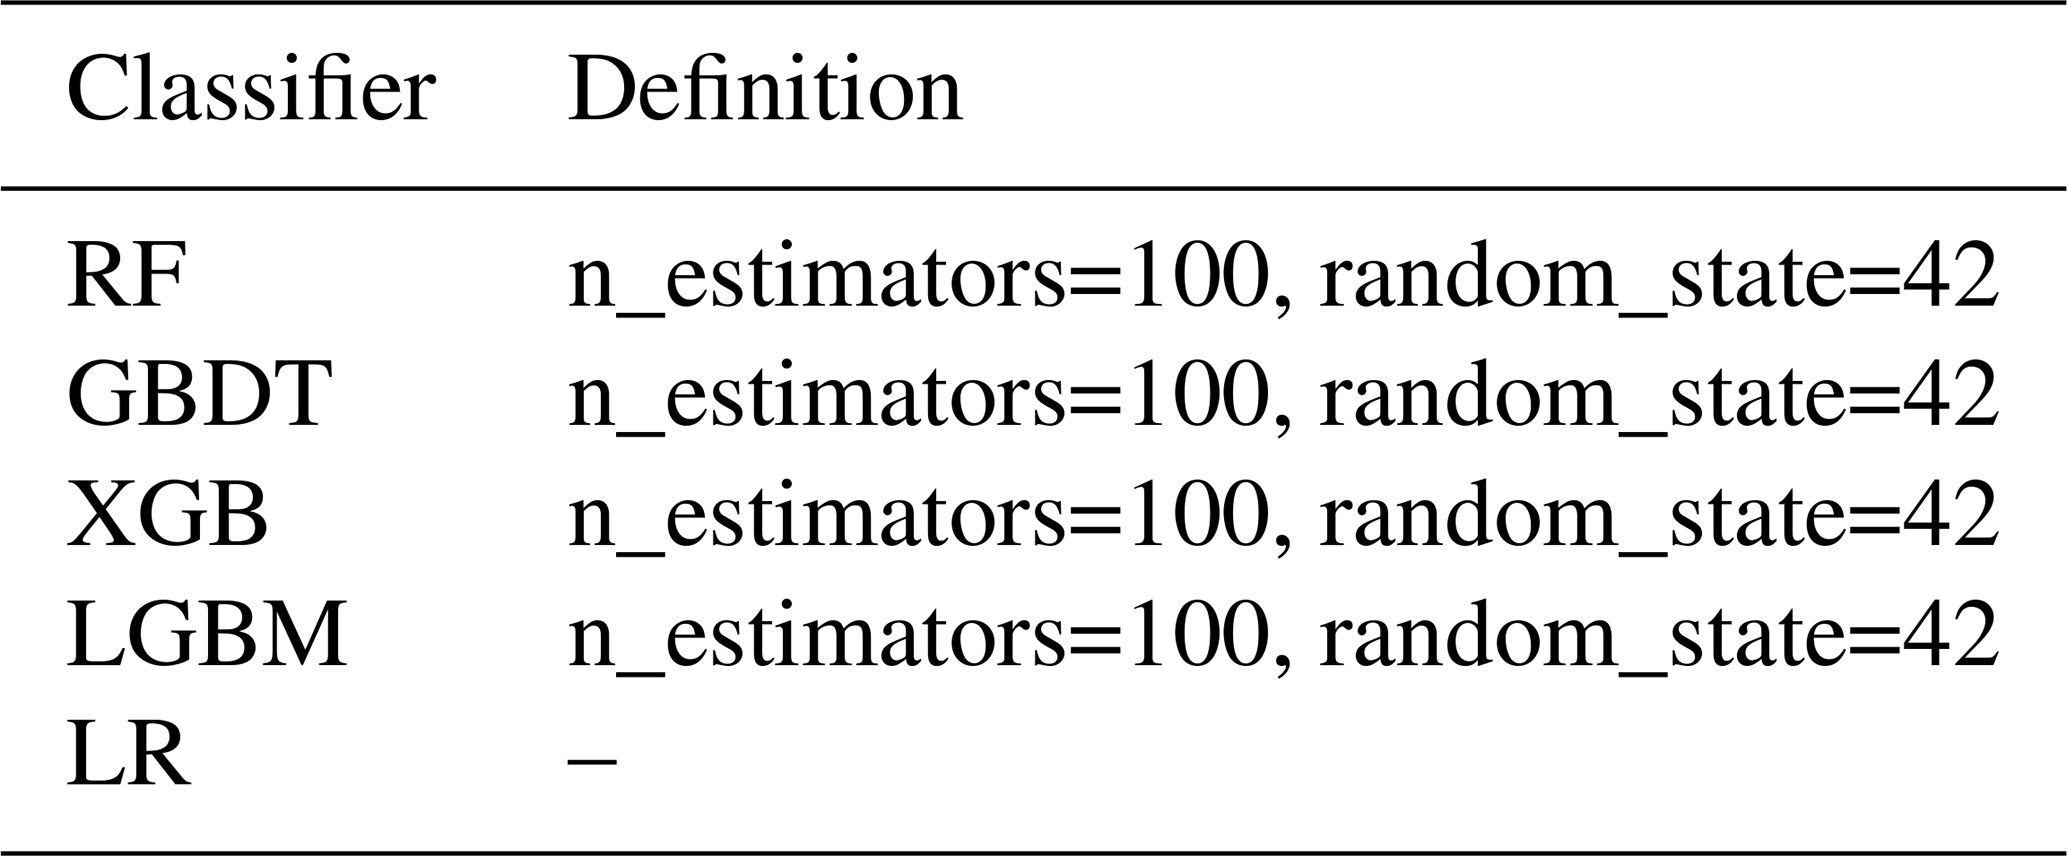
Stacking is a powerful ensemble learning method that uses predictions from multiple base learners as inputs to a meta-learner for final prediction. It combines the strengths of different models to overcome individual limitations, enhancing accuracy, stability, and generalization (Chen et al., 2024). In this study, Random Forest (RF), Gradient Boosting Decision Tree (GBDT), eXtreme Gradient Boosting (XGB), and Light Gradient Boosting Machine (LGBM) were selected as base learners. Their output classification probabilities were used as input features for the meta-learner, which adopted Logistic Regression (LR) to integrate probabilities, calculate distances to target classes, and produce final results (Table 3). For performance comparison, Support Vector Machine (SVM), K-Nearest Neighbor (KNN), RF, Classification and Regression Tree (CART), and Convolutional Neural Network (CNN) models were also employed as benchmark models.
3.4 Model results processing and analysis
3.4.1 Post-processing
Pixel-based classification algorithms inevitably produce salt-and-pepper noise because sandy beaches share similar spectral characteristics with certain areas, such as buildings and bare land, making them difficult to distinguish (Mattson et al., 2024). To reduce noise and remove isolated areas, we applied spatial filtering and connectivity analysis. A 100 m coastal buffer based on administrative boundaries was used to clip and filter non-sandy beach areas. Based on sandy beach patches, holes smaller than 2000 m2 (20 pixels) were filled, and sandy beach patches smaller than 1000 m2 (10 pixels) were removed. Finally, the sandy beach boundaries were refined through a thorough review and manual interpretation based on visual assessment.
3.4.2 Accuracy assessment
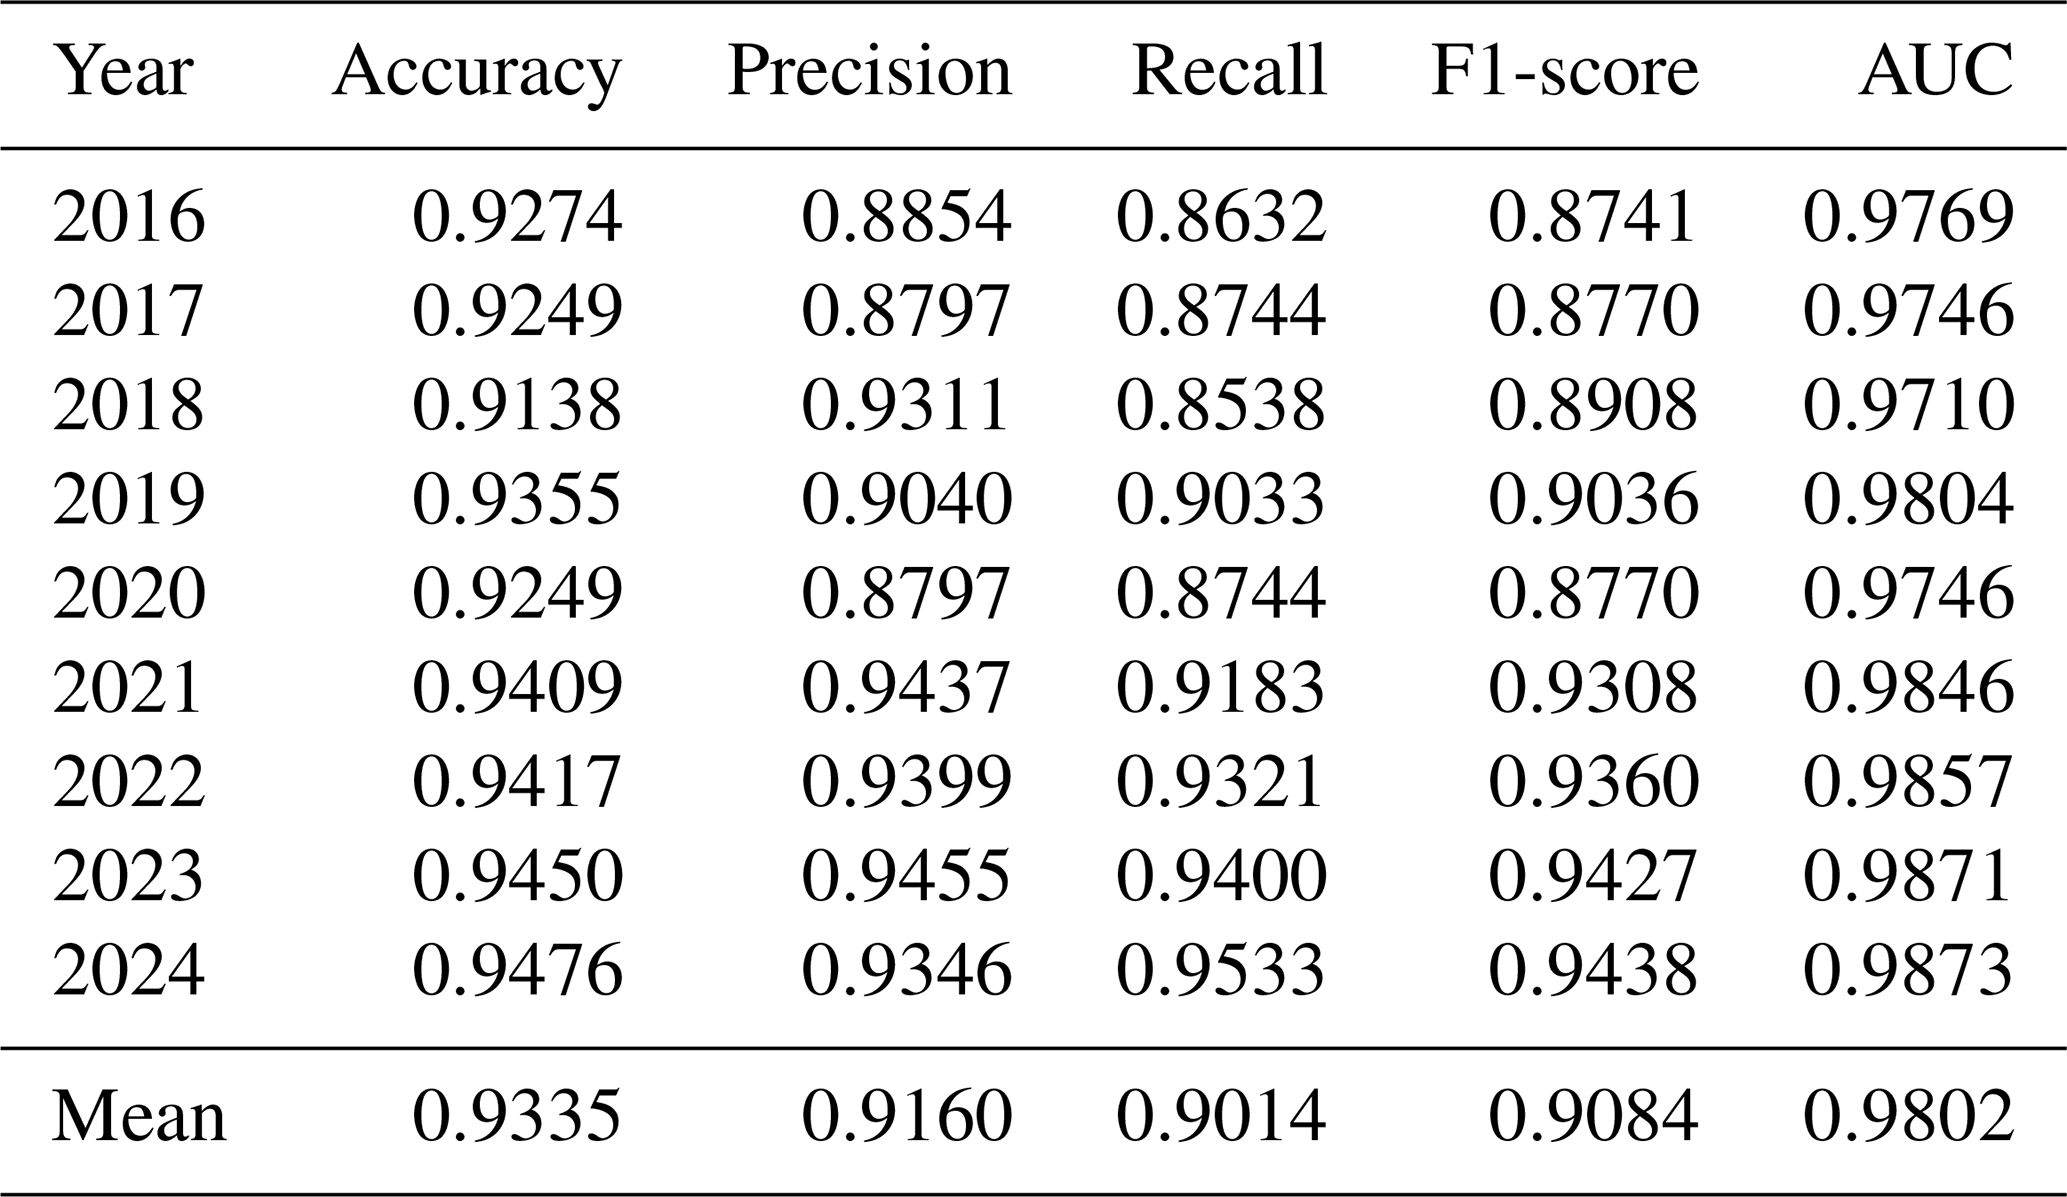
This study assessed the accuracy of sandy beach classification results using 91 959 test samples from 2016 to 2024, calculating Accuracy, Precision, Recall, sandy beach F1-score, and Area Under the Curve (AUC) through the confusion matrix (Table 4). These metrics were chosen to comprehensively evaluate different types of classification errors and overall model performance. Accuracy measures the proportion of correctly classified samples, reflecting overall correctness. Precision indicates the reliability of positive predictions, highlighting false positives, while Recall reflects the model's ability to detect all positive samples, highlighting false negatives. The F1-score balances Precision and Recall, providing a single metric when both false positives and false negatives are important. AUC evaluates the model's discrimination ability across different thresholds, indicating stability and robustness.
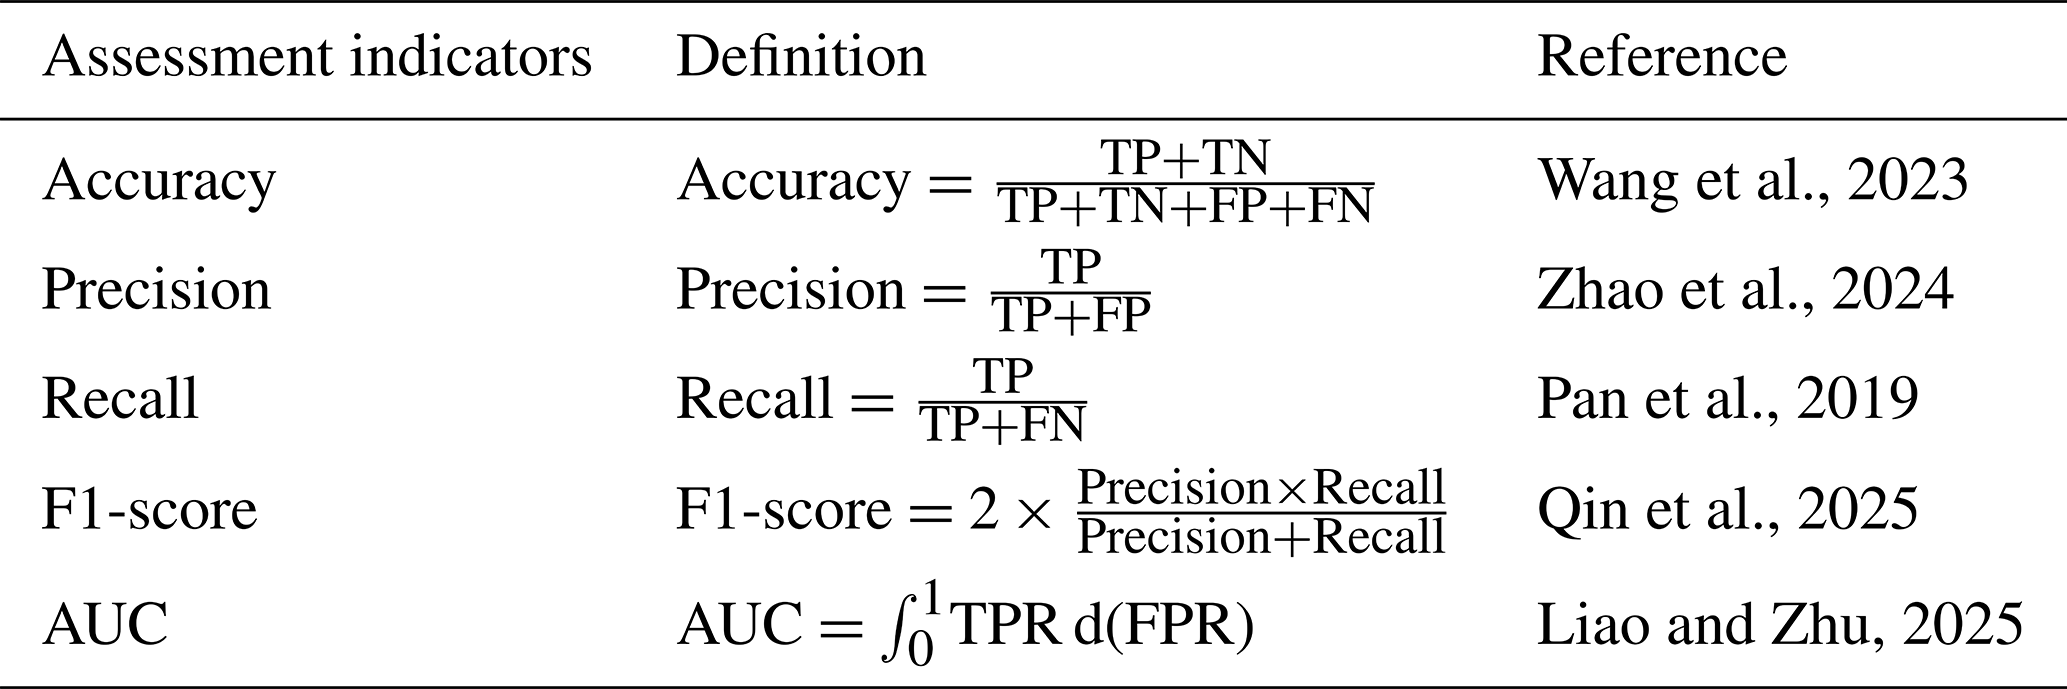
TP (True Positive) refers to the number of samples that are actually positive and correctly classified by the model, while TN (True Negative) refers to the number of samples that are actually negative and correctly classified. FP (False Positive) represents the number of samples that are actually negative but incorrectly classified as positive, and FN (False Negative) represents the number of samples that are actually positive but incorrectly classified as negative. TPR (True Positive Rate, or Recall) measures the model's ability to identify positive samples and is calculated as whereas FPR (False Positive Rate) measures the proportion of negative samples incorrectly classified as positive, calculated as .
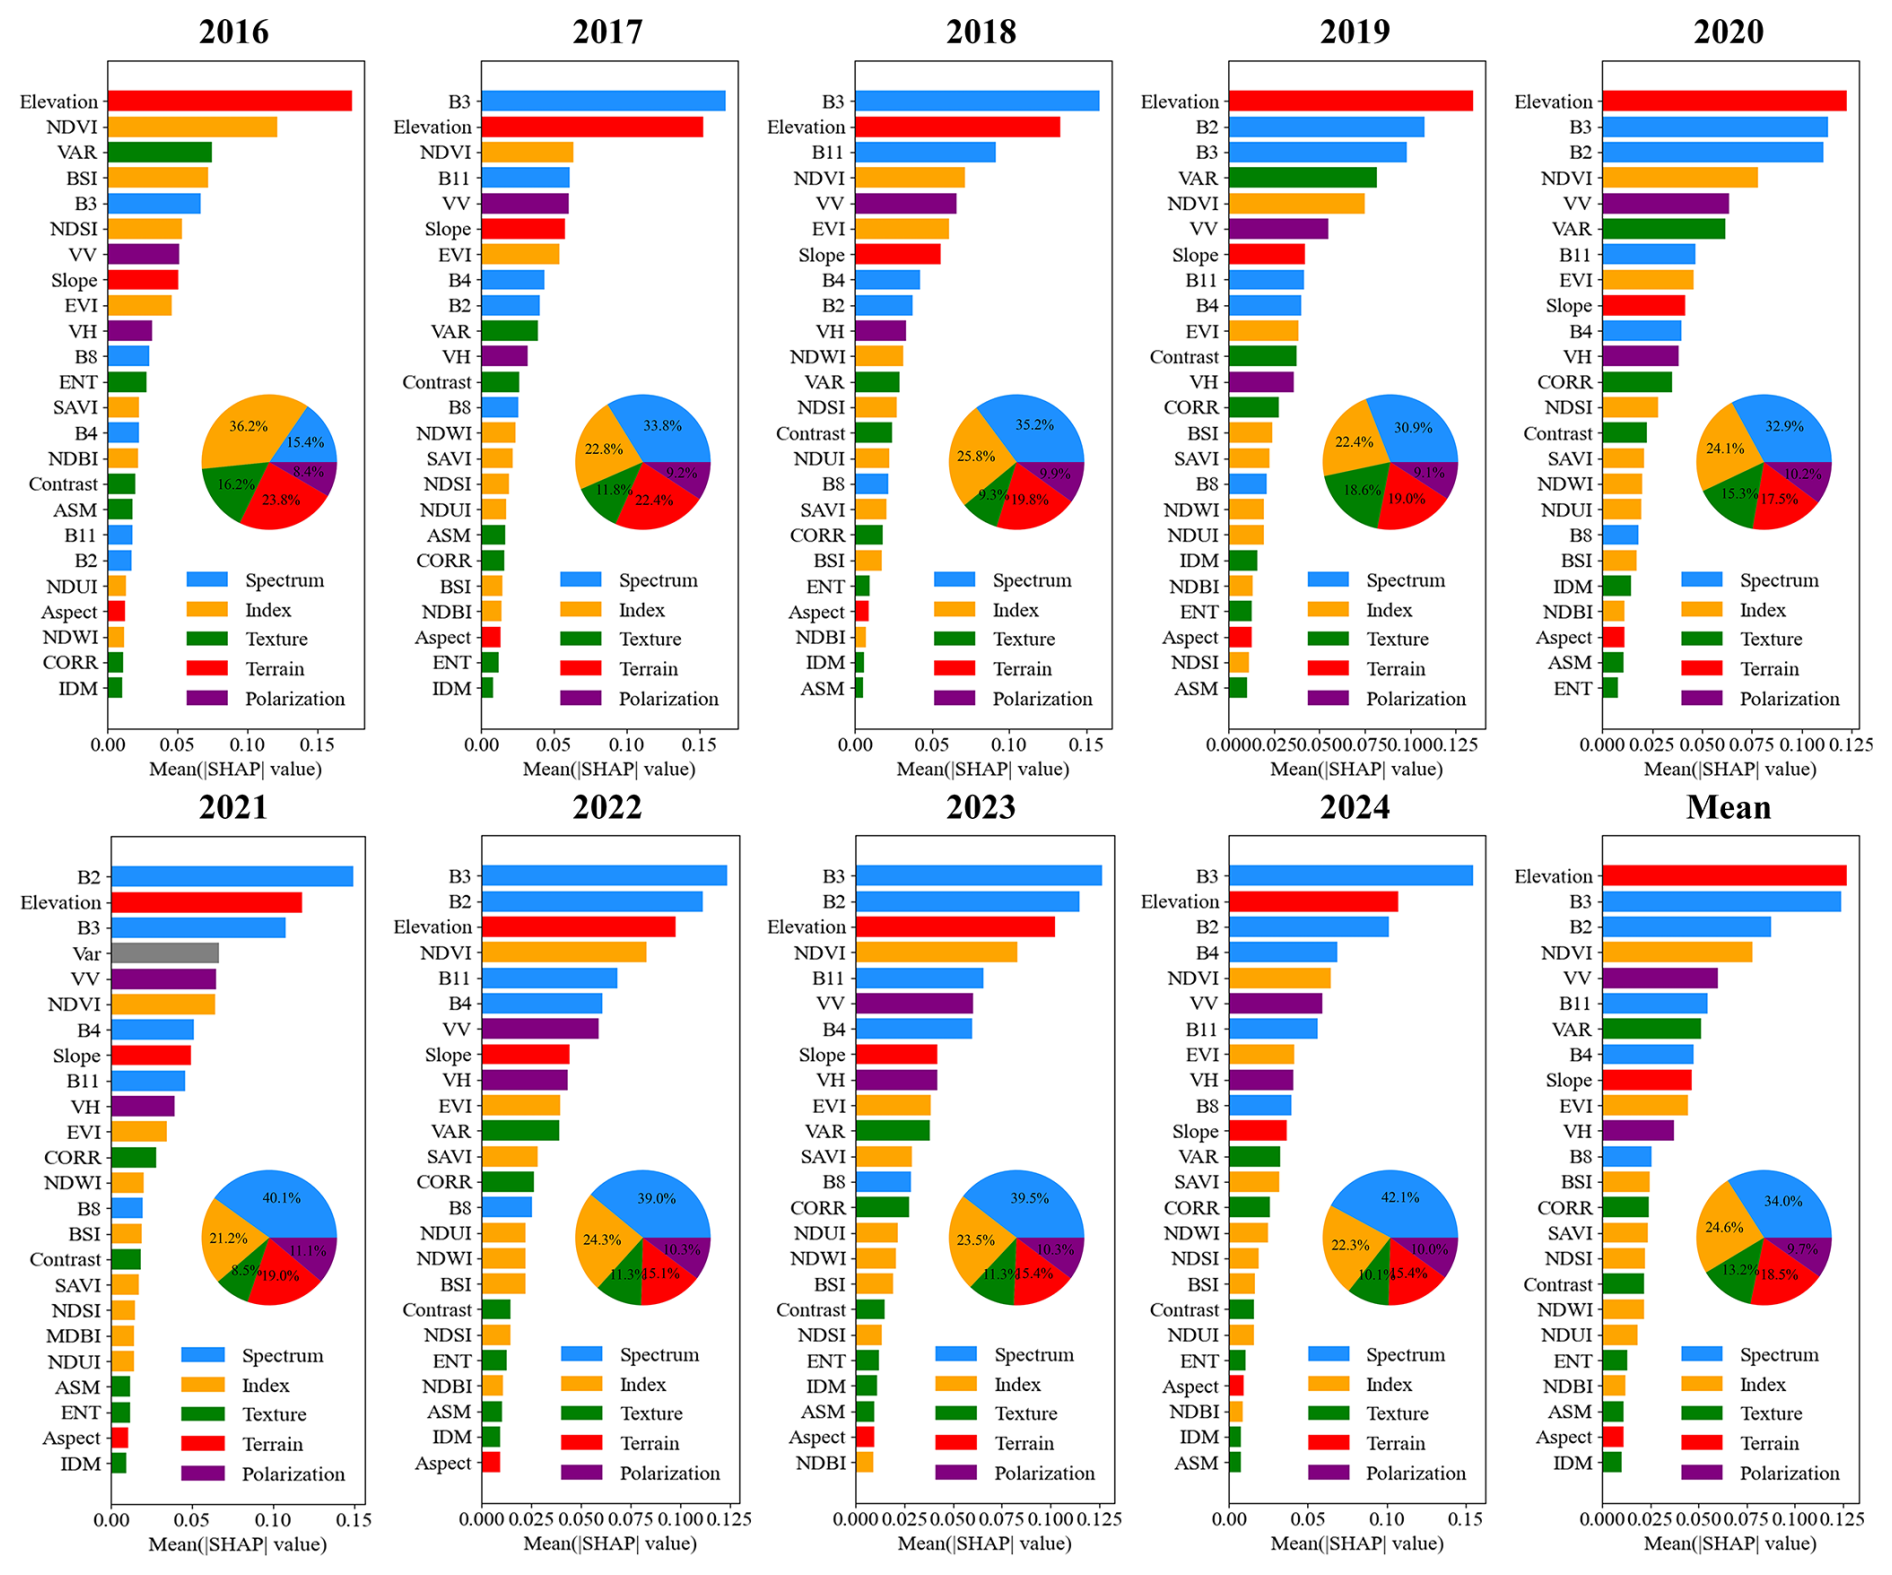
3.4.3 Analysis of model variable importance
SHAP (Shapley Additive exPlanations) values are a model interpretation method based on cooperative game theory, used to quantify the contribution of each feature to the model's prediction. They calculate the marginal contribution of each feature across all possible feature combinations and take the average, thereby fairly attributing the “responsibility” for the prediction. This approach can explain the prediction behavior for individual samples or the entire model. In this study, SHAP values were used to interpret the contributions of a stacked ensemble model. Specifically, SHAP values were first calculated for each base learner (RF, GBDT, XGB, LGBM), then these values were normalized and weighted according to the coefficients of the meta-learner (LR) to obtain the contribution of each base learner to the final ensemble prediction. Finally, the weighted SHAP values of all base learners were summed to derive the SHAP values for the entire stacked ensemble model, thereby quantifying the influence of each base model on the final prediction and providing a measure of interpretability for the ensemble learning.
3.4.4 Analysis of human infrastructure squeeze risk trends
Approximately 33 % of global sandy beaches have less than 100 m of infrastructure-free buffer space, and in this study, human infrastructure squeeze risk is defined as the risk that occurs when human infrastructure (such as buildings, roads, ports, etc.) is located within 100 m of a sandy beach area. This threshold was chosen because infrastructure within this range can significantly impact the sandy beach area, leading to changes in its size or degradation of the ecosystem (Lansu et al., 2024). Therefore, this study established a 100 m buffer zone around the Chinese land use dataset and conducted an overlay analysis using the obtained sandy beach data. The analysis generated annual human infrastructure squeeze risk areas to evaluate the squeeze effects of infrastructure on sandy beaches from 1990 to 2024. To further quantify the spatiotemporal changes in human infrastructure squeeze risk areas across regions, the study applied the Sen's slope method to calculate trend values (Zhang et al., 2023b; Qiao and Xia, 2025). By applying this method, the study quantified the annual change rate and long-term trend of the risk zones across different regions from 1990 to 2024.
4.1 Accuracy Assessment and Mapping of Chinese Sandy Beaches
The ensemble learning algorithm's performance was evaluated using key metrics such as Accuracy, Precision, Recall, sandy beach F1-score, and AUC, with the results presented in Table 5. From 2016 to 2024, all classification results had values above 0.85 for these metrics, with the best results in 2024, confirming the algorithm's stability, reliability, and accuracy in sandy beach classification.
Based on the maximum-extent composite of sandy beach recognition results over 8 years, the spatial distribution of the number, length, width, and area of sandy beaches in China is shown in Fig. 5. Nationwide, a total of 3347 sandy beaches were identified, with a total length of 10 343.57 km, an average width of 46.42 m, and a total area of approximately 320.50 km2 (Fig. 5).
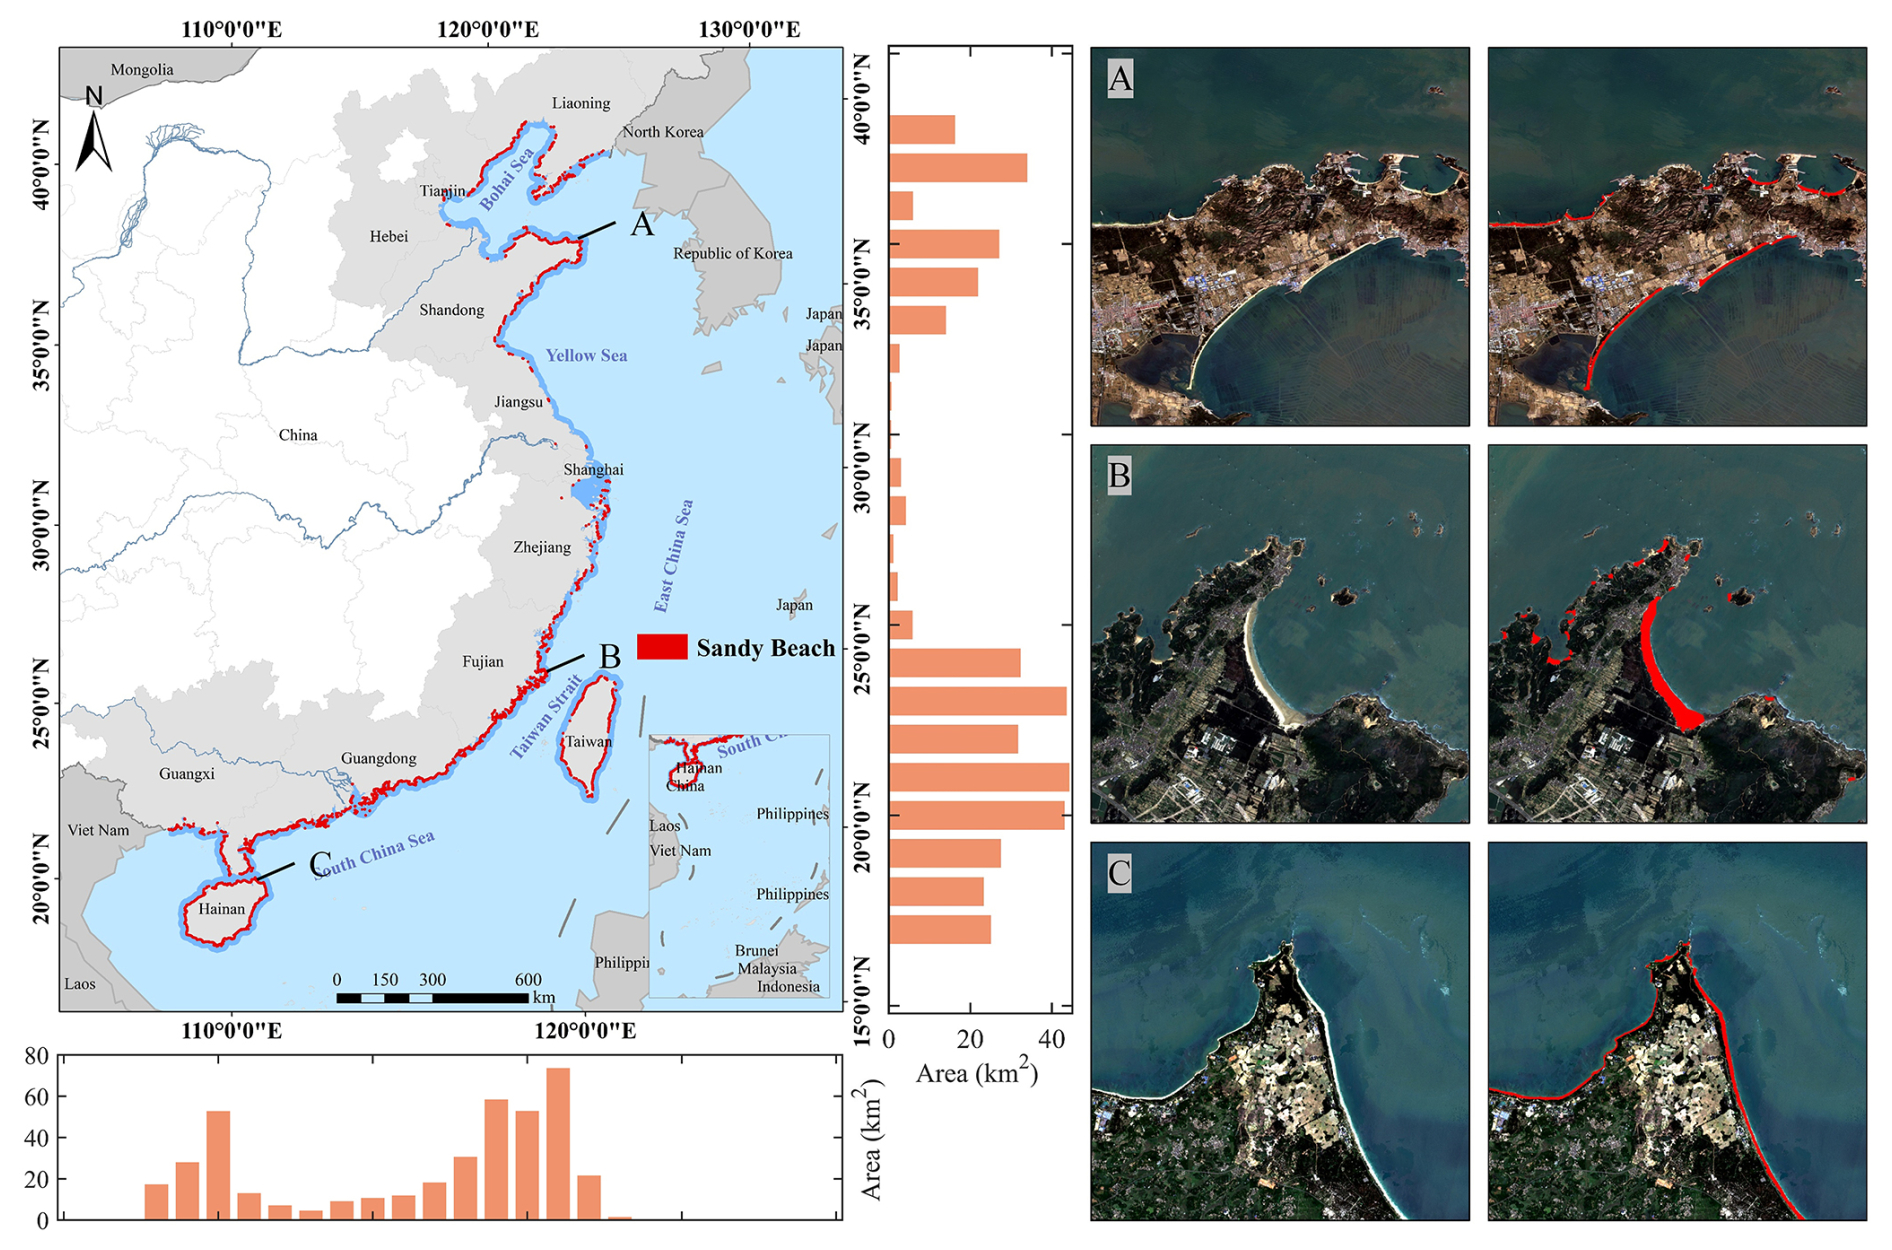
Figure 5Distribution of sandy beaches in China and the morphology of typical coastal areas. The maps/aerial images shown are Sentinel-2 imagery obtained from the public GEE platform (© Google Earth Engine).
From a provincial perspective, Guangdong hosts the largest number of sandy beaches, with 1096 sandy beaches, and also ranks first in both total length (2849.39 km) and total area (78.88 km2). In terms of sandy beach width, Hebei has the widest sandy beaches, with an average width of 68.77 m. Other regions, such as Fujian (sandy beach area 54.57 km2, total length 1435.89 km, width 54.91 m) and Hainan (sandy beach area 51.65 km2, total length 1977.96 km, width 41.02 m), also show significant sandy beach resources. This highlights the notable spatial differences in coastal sandy beach resources across China. The results indicate that coastal sandy beach resources in China exhibit significant uneven distribution, with considerable differences in the number, shape, and scale of sandy beaches across different regions (Fig. 6).
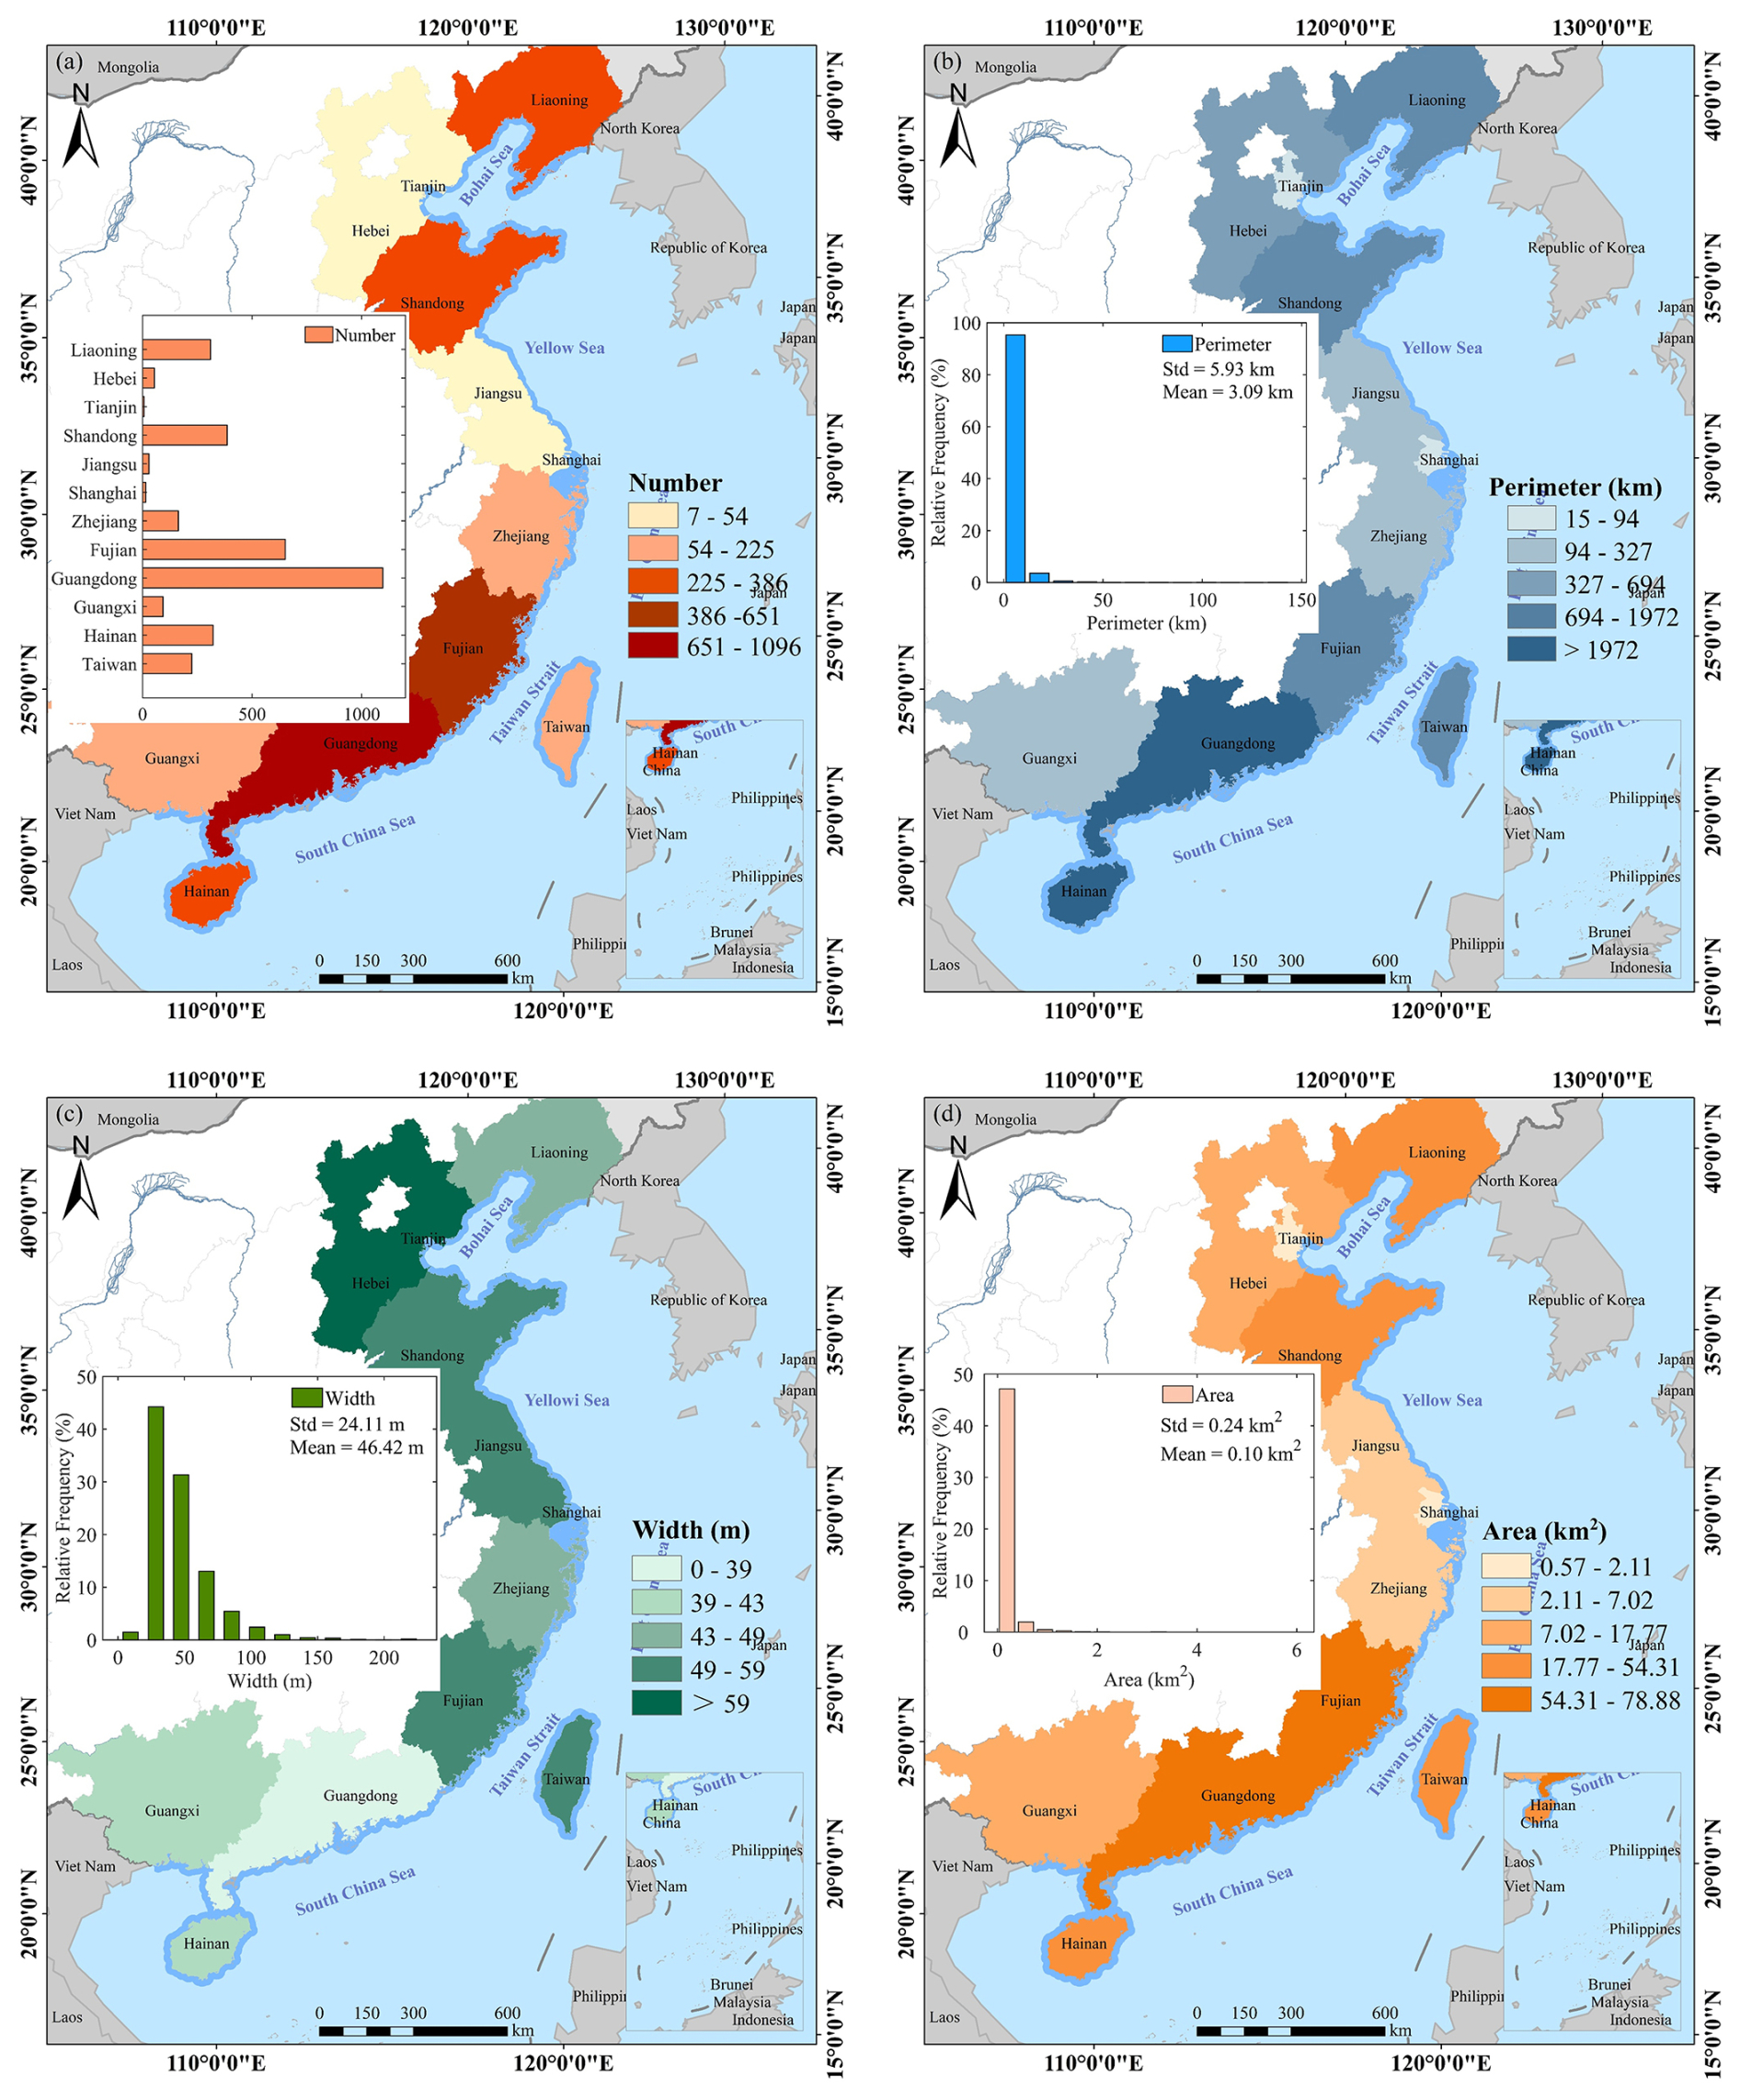
Figure 6Spatial distribution of sandy beaches in China: (a) sandy beach numbers, (b) sandy beach length, (c) sandy beach width, and (d) sandy beach area. The histograms in panels (b), (c), and (d) are based on the results of each individual beach rather than regional statistics.
4.2 Feature Importance Analysis, Model Evaluation, and Dataset Comparison
We evaluated the importance of model variables for the years 2016–2024 (Fig. 7). Based on the average importance ranking from 2016 to 2024, the top five features were . When classified by feature category, the highest average importance was found in spectral features (0.3403), followed by index features (0.2458), topographic features (0.1847), texture features (0.1317), and polarization features (0.0975). The most important feature in each category was as follows: Elevation for topographic features, B3 for spectral features, NDVI for index features, VV for polarization features, and VAR for texture features.
We evaluated the performance of our model and several other machine learning algorithms (SVM, KNN, RF, CART, and CNN) using Accuracy, Precision, Recall, F1-score, and AUC on the validation set (Table 6). Our model outperformed all others, achieving the highest accuracy (0.9335), precision (0.9160), and AUC (0.9802). It showed significantly better classification performance, especially in reducing misclassification. In comparison, the RF model had good precision but lower recall and accuracy, while KNN performed the worst across all metrics. To further assess the accuracy and reliability of the dataset, this study compared three published datasets in selected areas of Fujian, Shandong, and Guangdong (Fig. 8). Dataset 1, directly obtained from the OpenStreetMap (OSM) database, is highly subjective and tends to misclassify non-beach areas as sandy beaches, while also missing some actual sandy beach areas. Dataset 2, constructed using a support vector machine on Sentinel-2 imagery, has high consistency with our dataset, but still misses some sandy beach areas. Dataset 3, created using an object-oriented approach, demonstrates high accuracy for other land cover types but faces significant misclassification issues with bare land and urban areas. The results show that our dataset provides higher accuracy in sandy beach classification, significantly reducing misclassification.
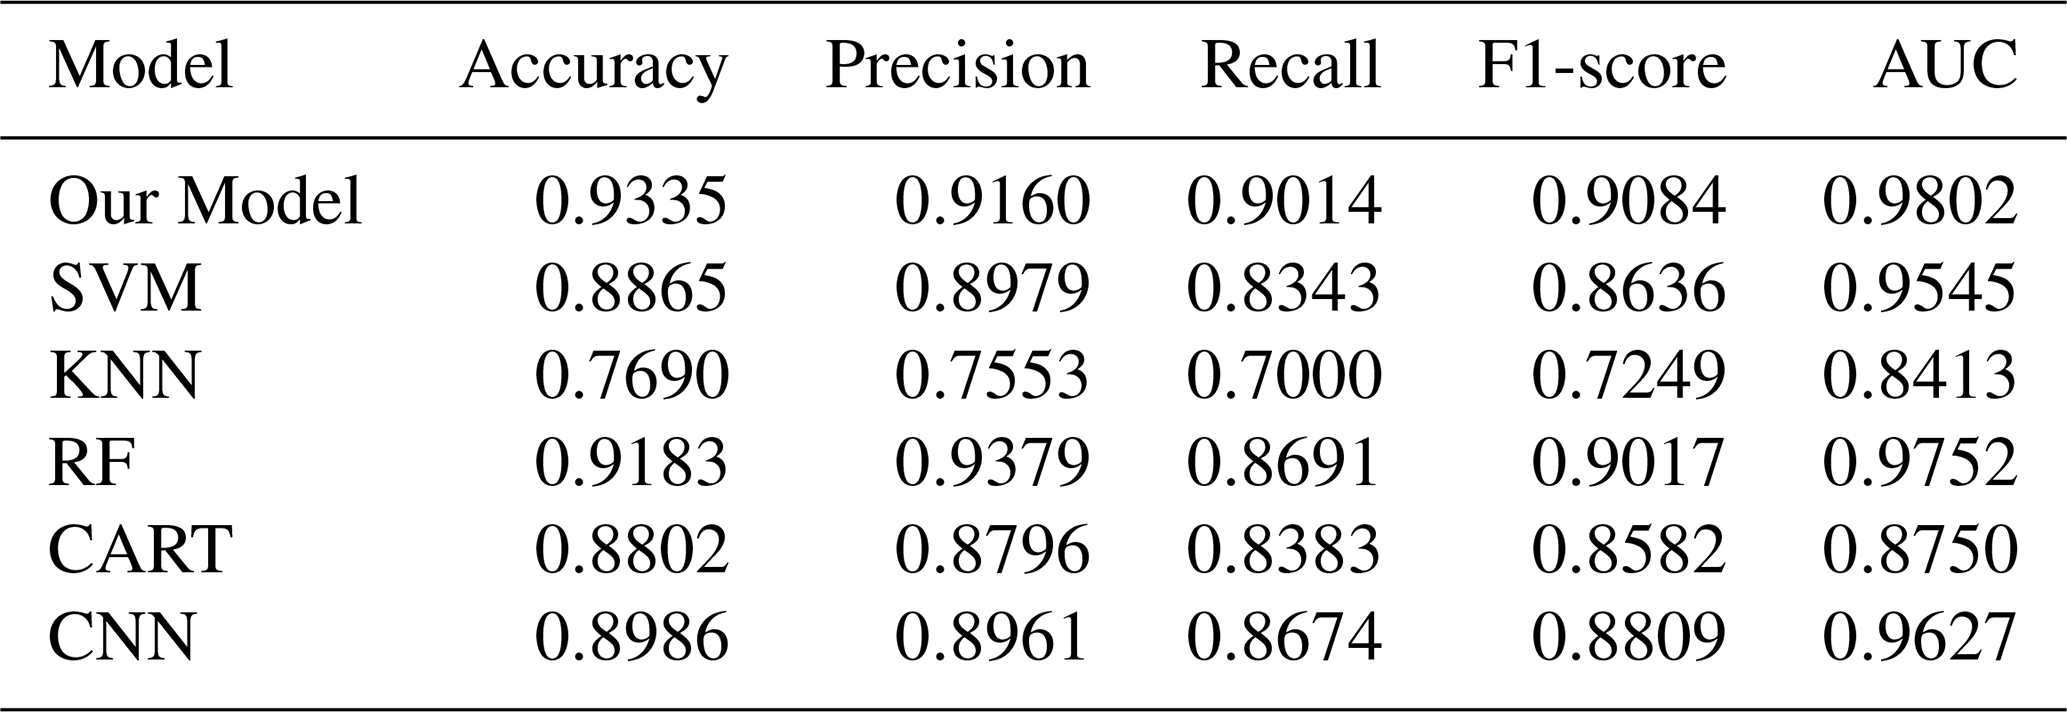
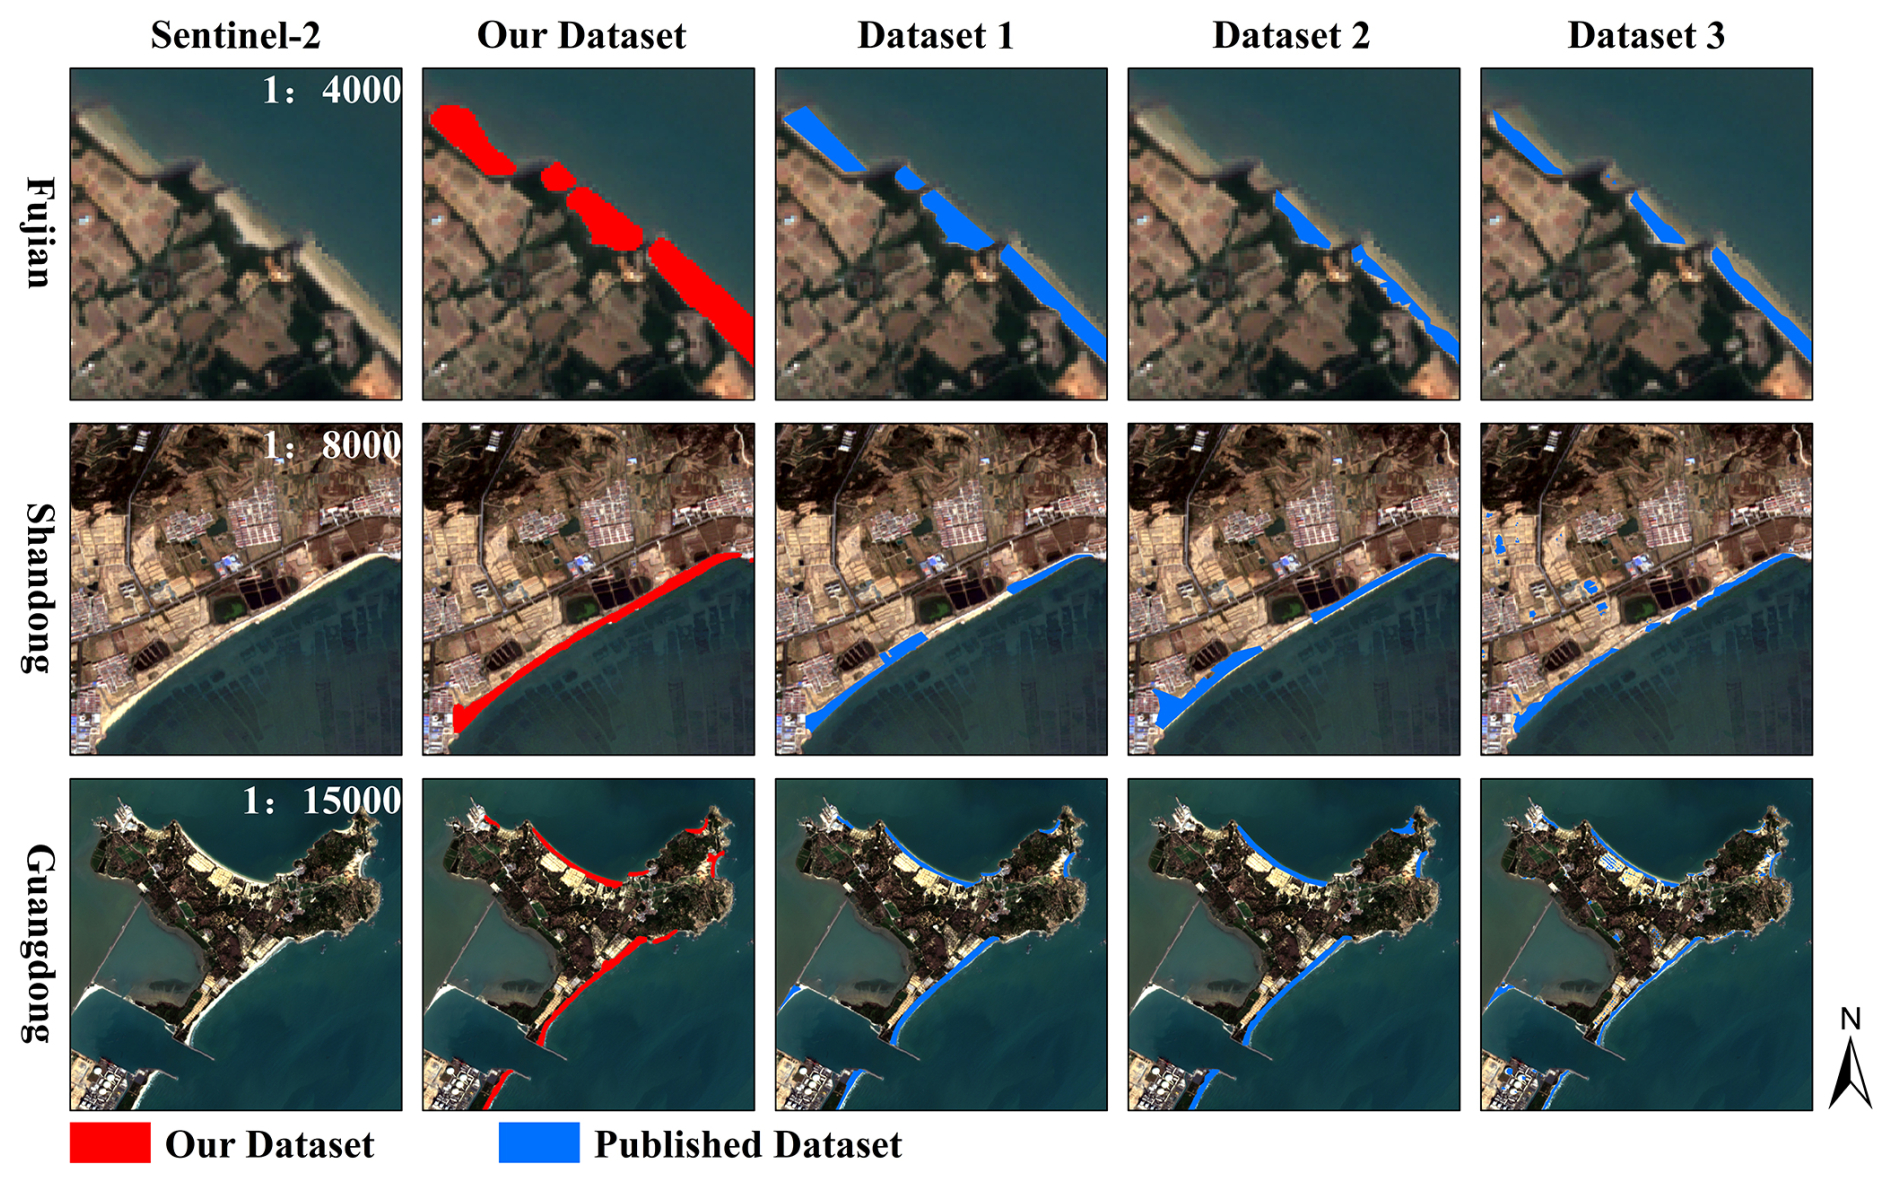
Figure 8Comparative analysis of sandy beaches identified in this study and three published datasets. The maps/aerial images shown are Sentinel-2 imagery obtained from the public GEE platform (© Google Earth Engine).
According to the comparison results, our dataset shows significant advantages over published datasets 1, 2, and 3 in several key metrics, particularly in terms of sandy beach area, perimeter, width, and number (Fig. 9). Overall, our dataset provides a certain supplementary advantage in sandy beach area coverage, with larger areas in all regions: Fujian (54.57 km2), Guangdong (78.88 km2), and Taiwan (46.60 km2), significantly surpassing published datasets 1 (30.35, 20.59, and 19.07 km2) and 2 (29.17, 58.35, and 25.51 km2). Regarding perimeter, our dataset closely matches actual sandy beach boundaries as shown in Figs. 8 and 9: Fujian (1435.89 km), Guangdong (2849.39 km), and Taiwan (1324.98 km), compared to published datasets 1 (581.95, 826.40 and 509.22 km) and 2 (756.92, 1856.62, and 906.63 km). In terms of width, our dataset also outperforms published datasets 1 (52.21, 20.94 and 48.42 m) and 2 (45.18, 32.58 and 27.56 m), with values of 54.91 m in Fujian, 38.92 m in Guangdong, and 57.17 m in Taiwan. The number of identified sandy beaches in our dataset is higher than in published datasets 1 and 2, further highlighting the reduced misclassification and noise in our results (Fig. 9). Moreover, as shown in Figs. 8 and 9, published dataset 3 has far higher area, perimeter, width, and number values than the other three datasets and the actual values, leading to many non-sandy beaches being incorrectly identified as sandy beaches.
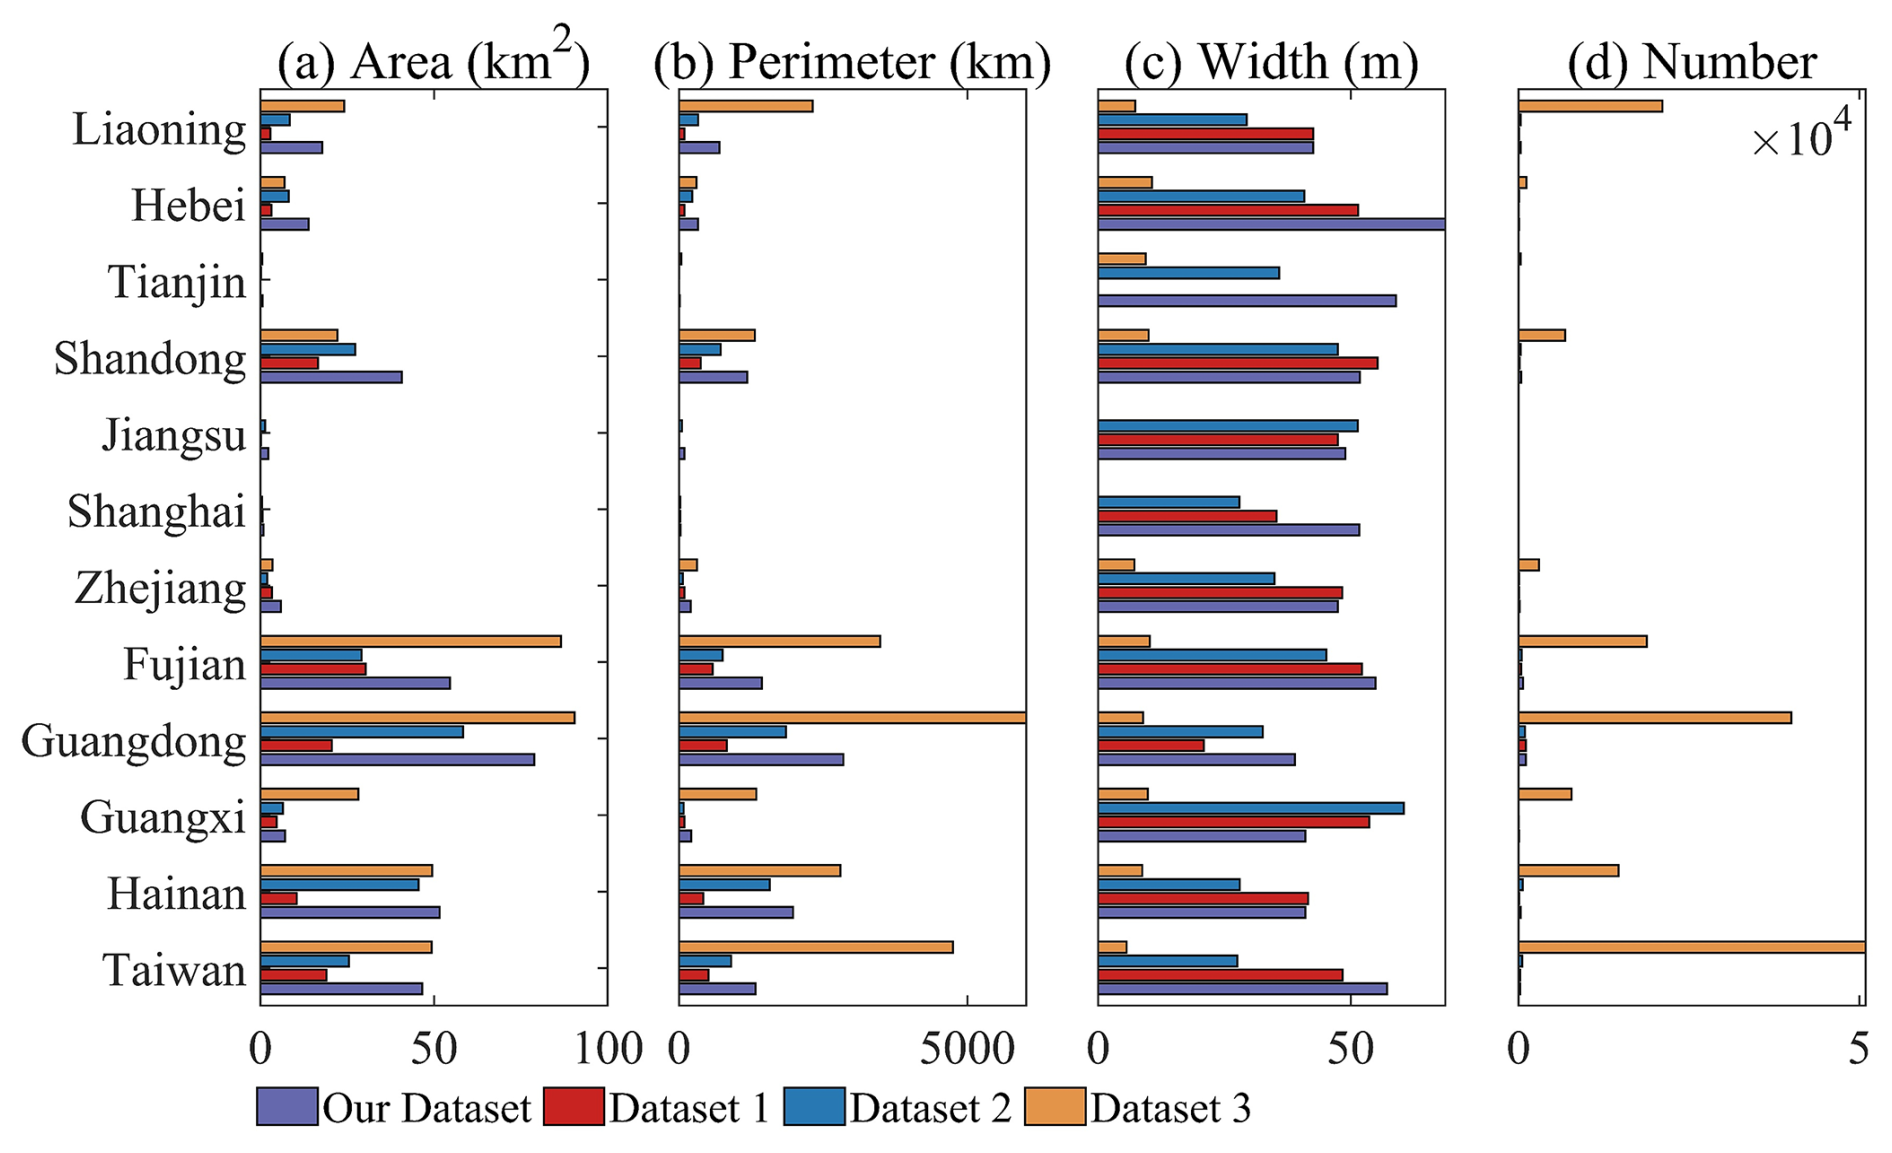
Figure 9Provincial statistical comparison of sandy beaches in this study and three published datasets (regions sorted from south to north): (a) Length comparison, (b) Width comparison, (c) Area comparison, (d) Number comparison.
4.3 Spatial-temporal changes in human infrastructure squeeze risk
We calculated and analyzed the temporal changes in the risk areas affected by human infrastructure squeeze in the study area (Fig. 10). From 1990 to 2024, the risk area increased annually due to human infrastructure development (e.g., ports, dams, and coastal development). The area rose from 134.39 km2 in 1990 to 181.42 km2 in 2024, a total increase of about 47.03 km2. The most significant increases occurred between 1995–2000, with a nationwide increase of approximately 19.34 km2 in human infrastructure squeeze risk areas during this period. However, the growth rate has slowed in recent years, with only a 0.80 km2 increase from 2020 to 2024, indicating stabilization due to enhanced regulation or resource saturation.
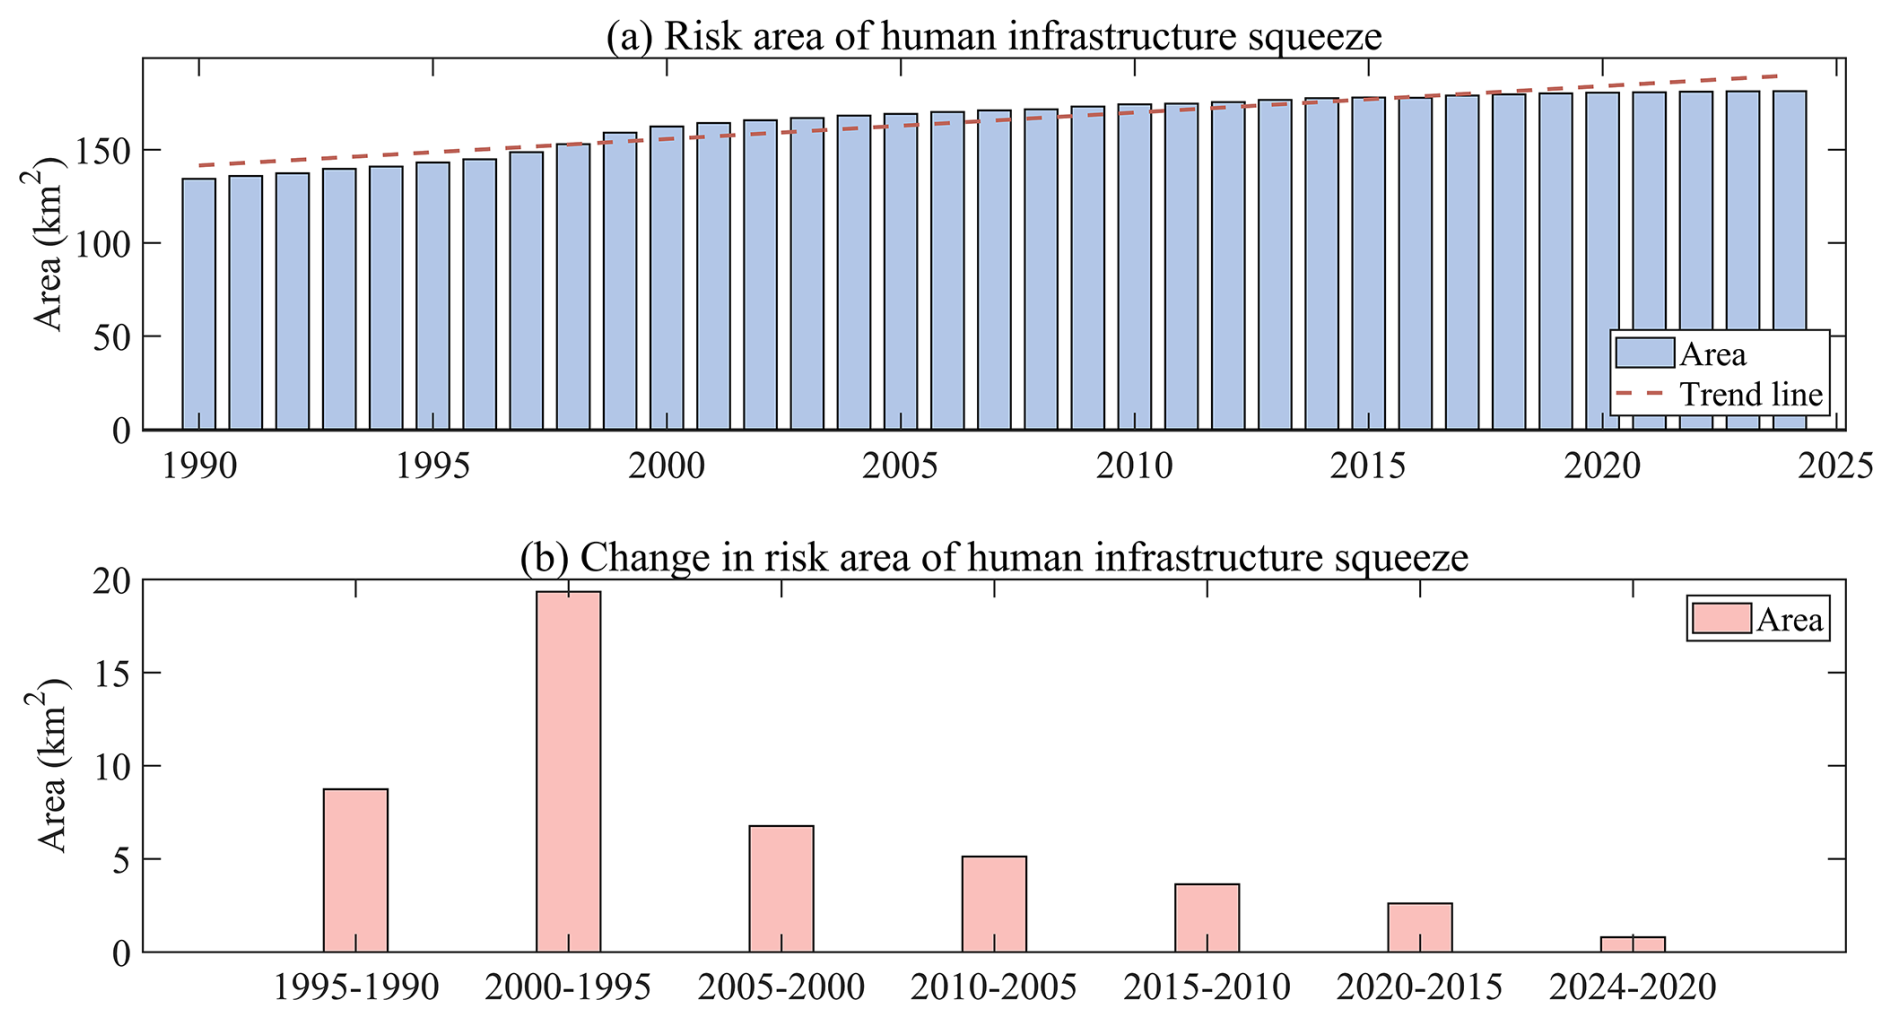
Figure 10Interannual changes in human infrastructure squeeze on sandy beaches: (a) Risk area of human infrastructure squeeze from 1990 to 2024, (b) Changes in risk area of human infrastructure squeeze from 1990 to 2024.
We conducted a systematic assessment and comparative analysis of the current human infrastructure squeeze risk area in coastal regions of China in 2024, as well as its trend from 1990 to 2024 (Figs. 11 and S3 in the Supplement). In 2024, the distribution of human infrastructure squeeze risk areas showed significant regional differences. The top three regions with the largest risk areas were Guangdong (37.62 km2), Shandong (33.02 km2), Taiwan (32.52 km2), and Fujian (32.13 km2), all exceeding 30 km2, accounting for a significant proportion of the national coastal squeeze risk area. These regions are densely populated, economically developed, and have high coastal development density, making them typical areas of coastal urbanization and industrial concentration. Hainan (16.42 km2) and Liaoning (14.18 km2) also showed high-risk areas, reflecting ongoing interference with natural sandy beaches due to port development and coastal infrastructure. In contrast, Tianjin (0.40 km2), Shanghai (0.40 km2), and Jiangsu (1.23 km2) had smaller risk areas, likely due to limited sandy beach resources. The trend analysis from 1990 to 2024 revealed significant growth rates in Guangdong (0.38 km2 yr−1) and Fujian (0.32 km2 yr−1), indicating rapid and substantial sandy beach squeeze risks.
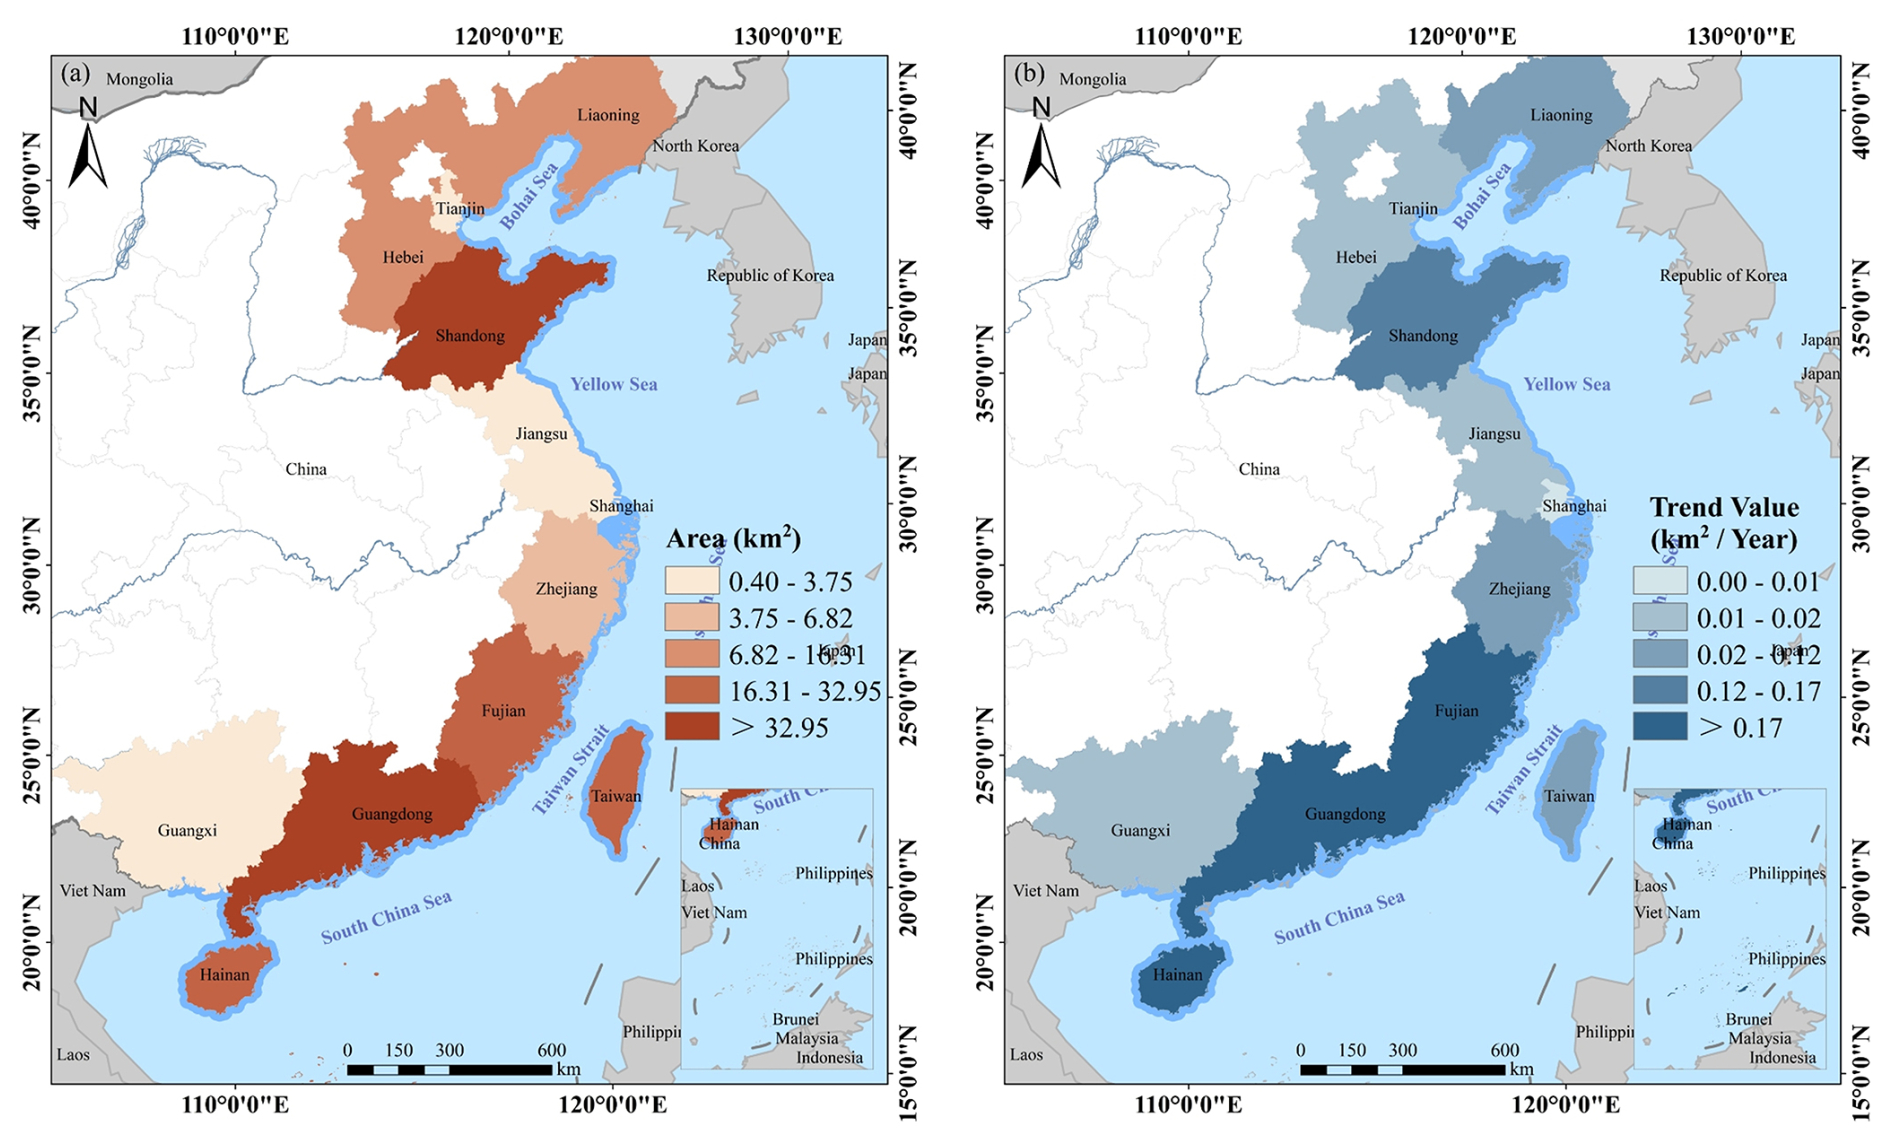
Figure 11Spatial changes of human infrastructure squeeze risk area: (a) current risk area, (b) changes in the risk area from 1990 to 2024.
5.1 Selection and combination of input features
The influence of different input features and their combinations on recognition accuracy was analyzed (Table 7), taking 2024 as an example. Results show that spectral (S) features outperforms other single features, achieving the highest accuracy (Accuracy: 0.8976, F1-score: 0.8907). Index (I) features perform slightly worse, while terrain (T), texture (Tr), and polarization (P) features alone yield relatively low accuracies. Multi-feature fusion substantially improves model performance, with combinations involving spectral features showing the greatest gains. Among them, the “” combination achieves high accuracy (Accuracy: 0.9455, F1-score: 0.9416), while the five-feature combination (“”) delivers the best overall results (Accuracy: 0.9476, F1-score: 0.9438, AUC: 0.9873). We compared the values of sandy beach and non-sandy beach areas for polarization features (VV), texture features (Correlation), and terrain features (Elevation) to explore the factors contributing to improved model accuracy (Fig. 12). In terms of polarization features (VV), the polarization reflectance of sandy beach areas is lower, while non-sandy beach areas, such as water bodies and buildings, show higher reflectance (Novelli et al., 2016). This may be due to the different scattering characteristics of sand compared to other surfaces, such as water, which is smooth and reflects stronger signals (Lu et al., 2018a). This contrast might be influenced by factors like data source and acquisition angle and requires further investigation. For texture features (Correlation), sandy beach areas exhibit consistent textures due to uniform sand grain arrangements, while non-sandy beach areas show more complex textures influenced by diverse land cover (Hasituya et al., 2016). In regions with complex land cover, texture differences may diminish, affecting recognition accuracy. Regarding terrain features (Elevation), sandy beaches are typically flat and near sea level, while non-sandy beaches exhibit more significant elevation differences (Li et al., 2023). In regions with minimal terrain variation, terrain features may have a weaker influence (Wang et al., 2024a).
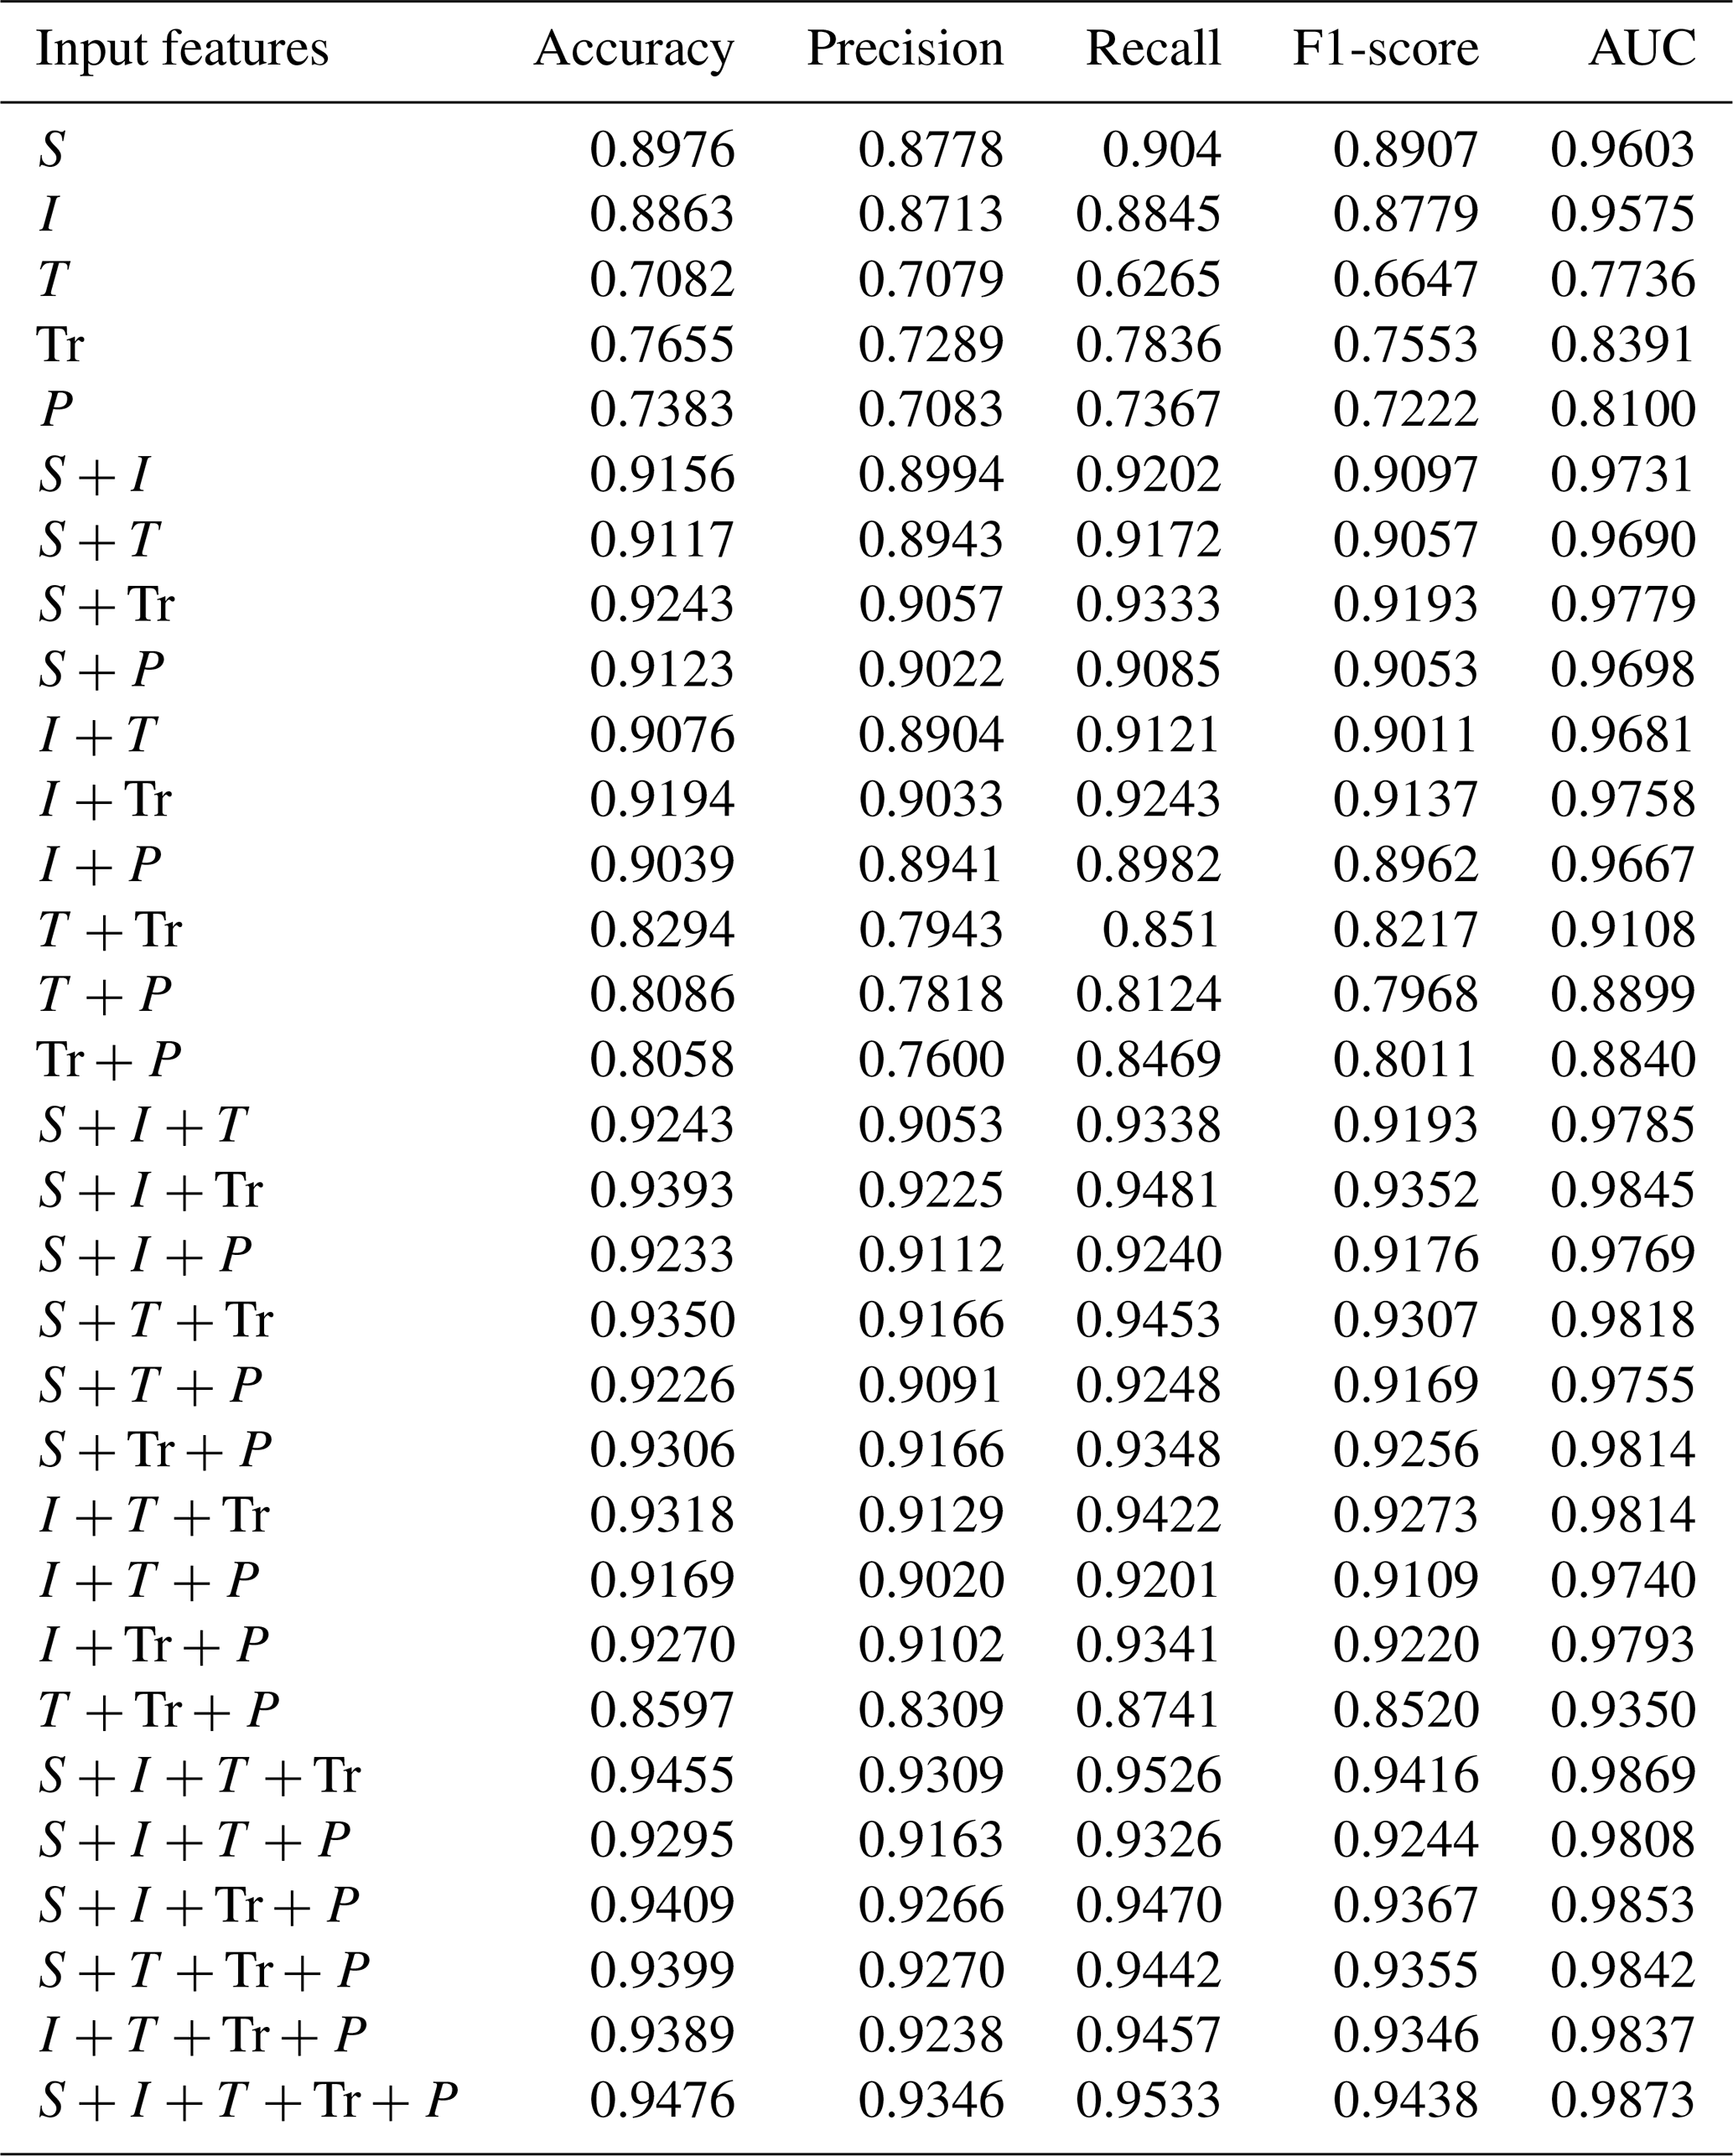
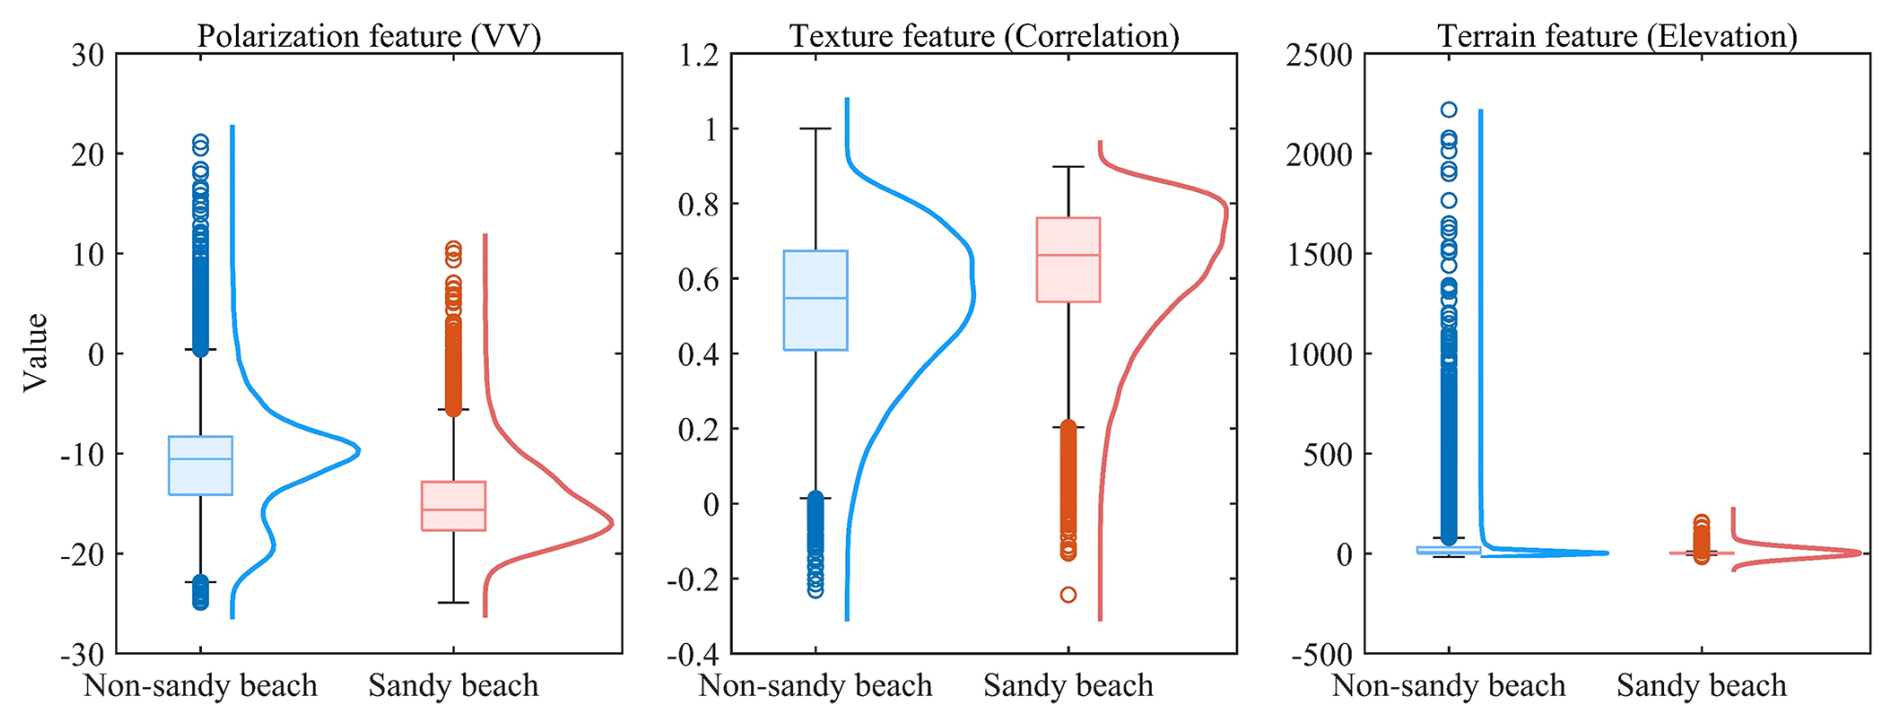
Figure 12Comparison of polarization, texture, and terrain features between sandy beaches and non-sandy beaches.
5.2 Effectiveness and robustness of ensemble learning
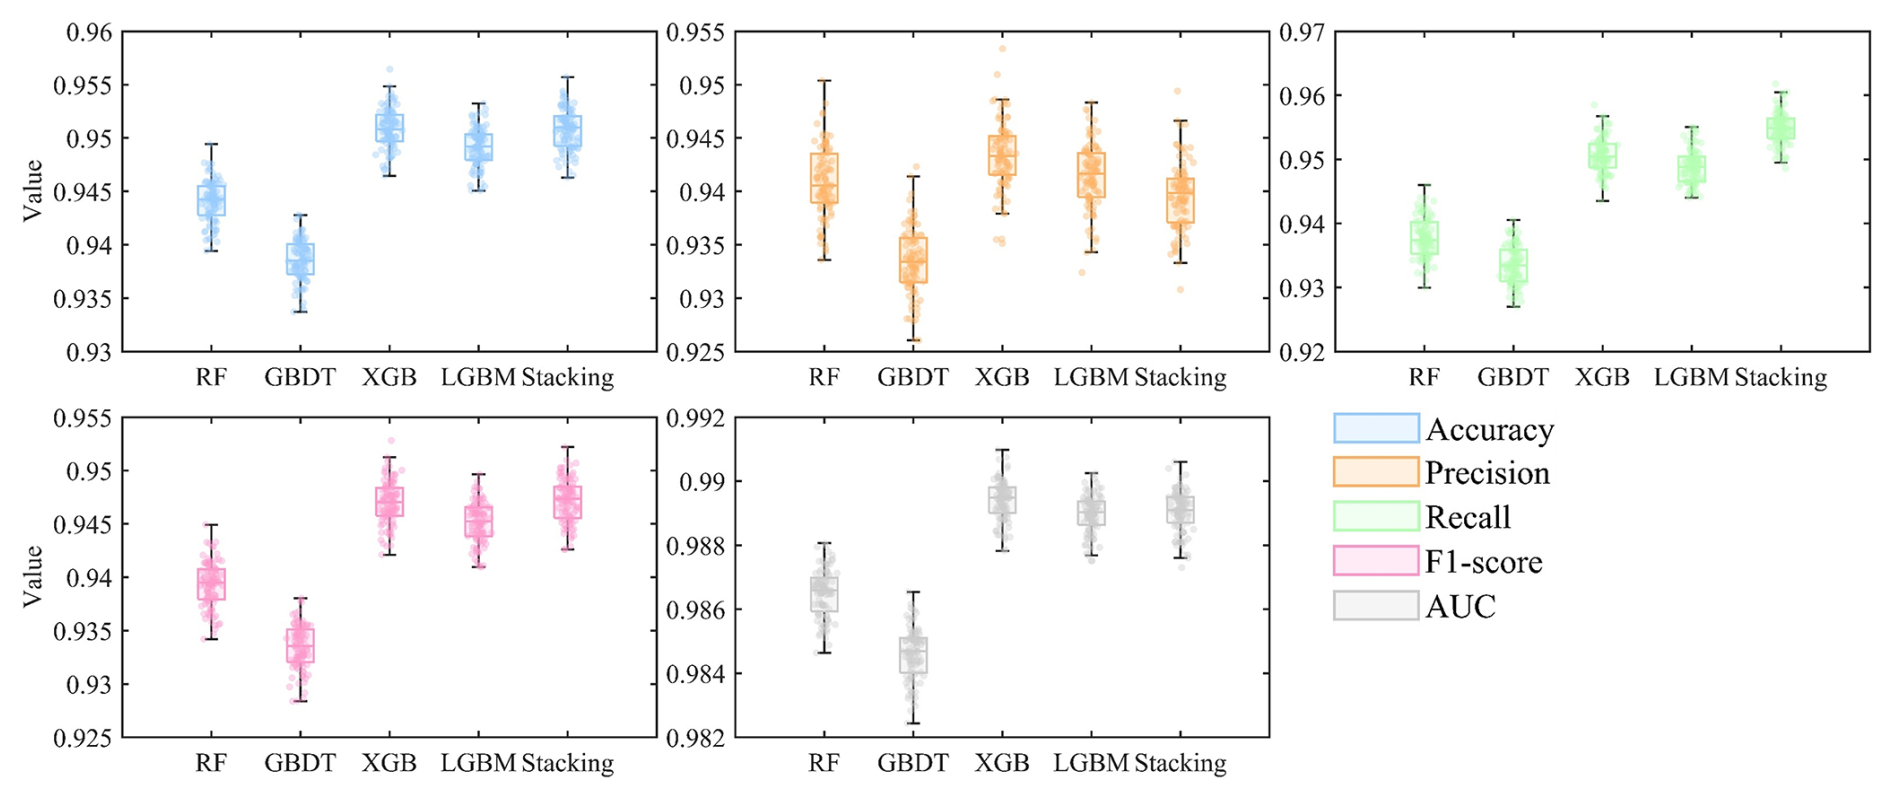
In this study, the Stacking model integrates four base classifiers – RF, GBDT, XGB, and LGBM – effectively combining their strengths in feature extraction and classification. This ensemble approach enhances the model's adaptability and generalization, improving its robustness in complex sandy beach area recognition tasks (Chen et al., 2021; Chrysafis et al., 2017). Each base model has its advantages: RF effectively handles high-dimensional features well and reduces overfitting, GBDT has strong nonlinear fitting capability, XGB achieves a good balance between optimization efficiency and accuracy, while LGBM performs with higher training speed and precision under large-scale and high-dimensional data conditions (Tian et al., 2025a; Mugunthan et al., 2023). By integrating these models, Stacking adapts better to challenges such as varying lighting, tidal conditions, and complex terrain, thus reducing misclassification. Although XGB demonstrates a slight advantage in Accuracy (0.9508), Precision (0.9433), and AUC (0.9894), and LGBM also shows certain strengths in Accuracy (0.9491), Precision (0.9414), and AUC (0.9890), the Stacking model outperforms all base learners in Recall (0.9549) and F1-score (0.9472), while exhibiting comparable performance to the base learners across the remaining metrics (Fig. 13), highlighting its robustness and reliability in overall performance. This demonstrates its stable performance under different data distributions. Overall, Stacking not only ensures competitive accuracy but also offers robust generalization for remote sensing tasks like sandy beaches change monitoring.
5.3 Factors shaping the spatial pattern of China's sandy beaches
This study produced a 10 m resolution sandy beach dataset for China's coastal regions. The spatial distribution of sandy beaches shows a clear pattern: more in the north and the south, and fewer in the central coast. This pattern is shaped by a combination of geological structures, marine dynamics, climate conditions, and river sediment input (Tian et al., 2025b; Ma et al., 2024; Wang and Wu, 2010). The northern coast features flat terrain and large rivers like the Yellow River and Liao River, which deliver abundant sediment, supporting sandy beach formation (Zhang et al., 2022). In the south, strong marine forces and tropical climates allow rivers to carry large amounts of sediment to the coast, where wide sandy beaches form under suitable conditions (Zhou et al., 2023a; Mentaschi et al., 2018). In contrast, the central coast is dominated by bedrock and muddy coastlines. Major rivers such as the Yangtze mainly contribute to tidal flats and muddy shores rather than typical sandy beaches (Kuai et al., 2021; Liu et al., 2020). Overall, the distribution of sandy beaches in China is shaped by sediment supply, coastal type, and hydrodynamic conditions, with more beaches in the north and south, and fewer along the central coast.
5.4 Exploration of the factors affecting the change in human infrastructure squeeze risk area
Based on the 1990–2024 Sen's slope trend analysis, several patterns emerge when analyzing the relationship between human infrastructure squeeze risk areas and related factors across regions (Fig. 14). Economically developed regions like Shanghai, Jiangsu, and Tianjin show slower growth in squeeze risk areas. This can be attributed to their smaller sandy beach areas, which limit the available space for human activities, and their higher per capita GDP, which is associated with more efficient urban planning and infrastructure development, leading to slower increases in squeeze risk. In contrast, regions with larger sandy beach areas, such as Guangdong, Shandong, Fujian, Taiwan, and Hainan, show faster growth in squeeze risk, as more space for development leads to higher risk over time. Additionally, regions with larger resident population, like Guangdong, Shandong, and Hebei, experience a positive correlation between population growth and squeeze risk. As the resident population increases, urbanization accelerates, putting more pressure on infrastructure and increasing the squeeze risk. Both built-up area and road area are positively correlated with squeeze risk, as their expansion reflects urban growth, intensifying competition for space.
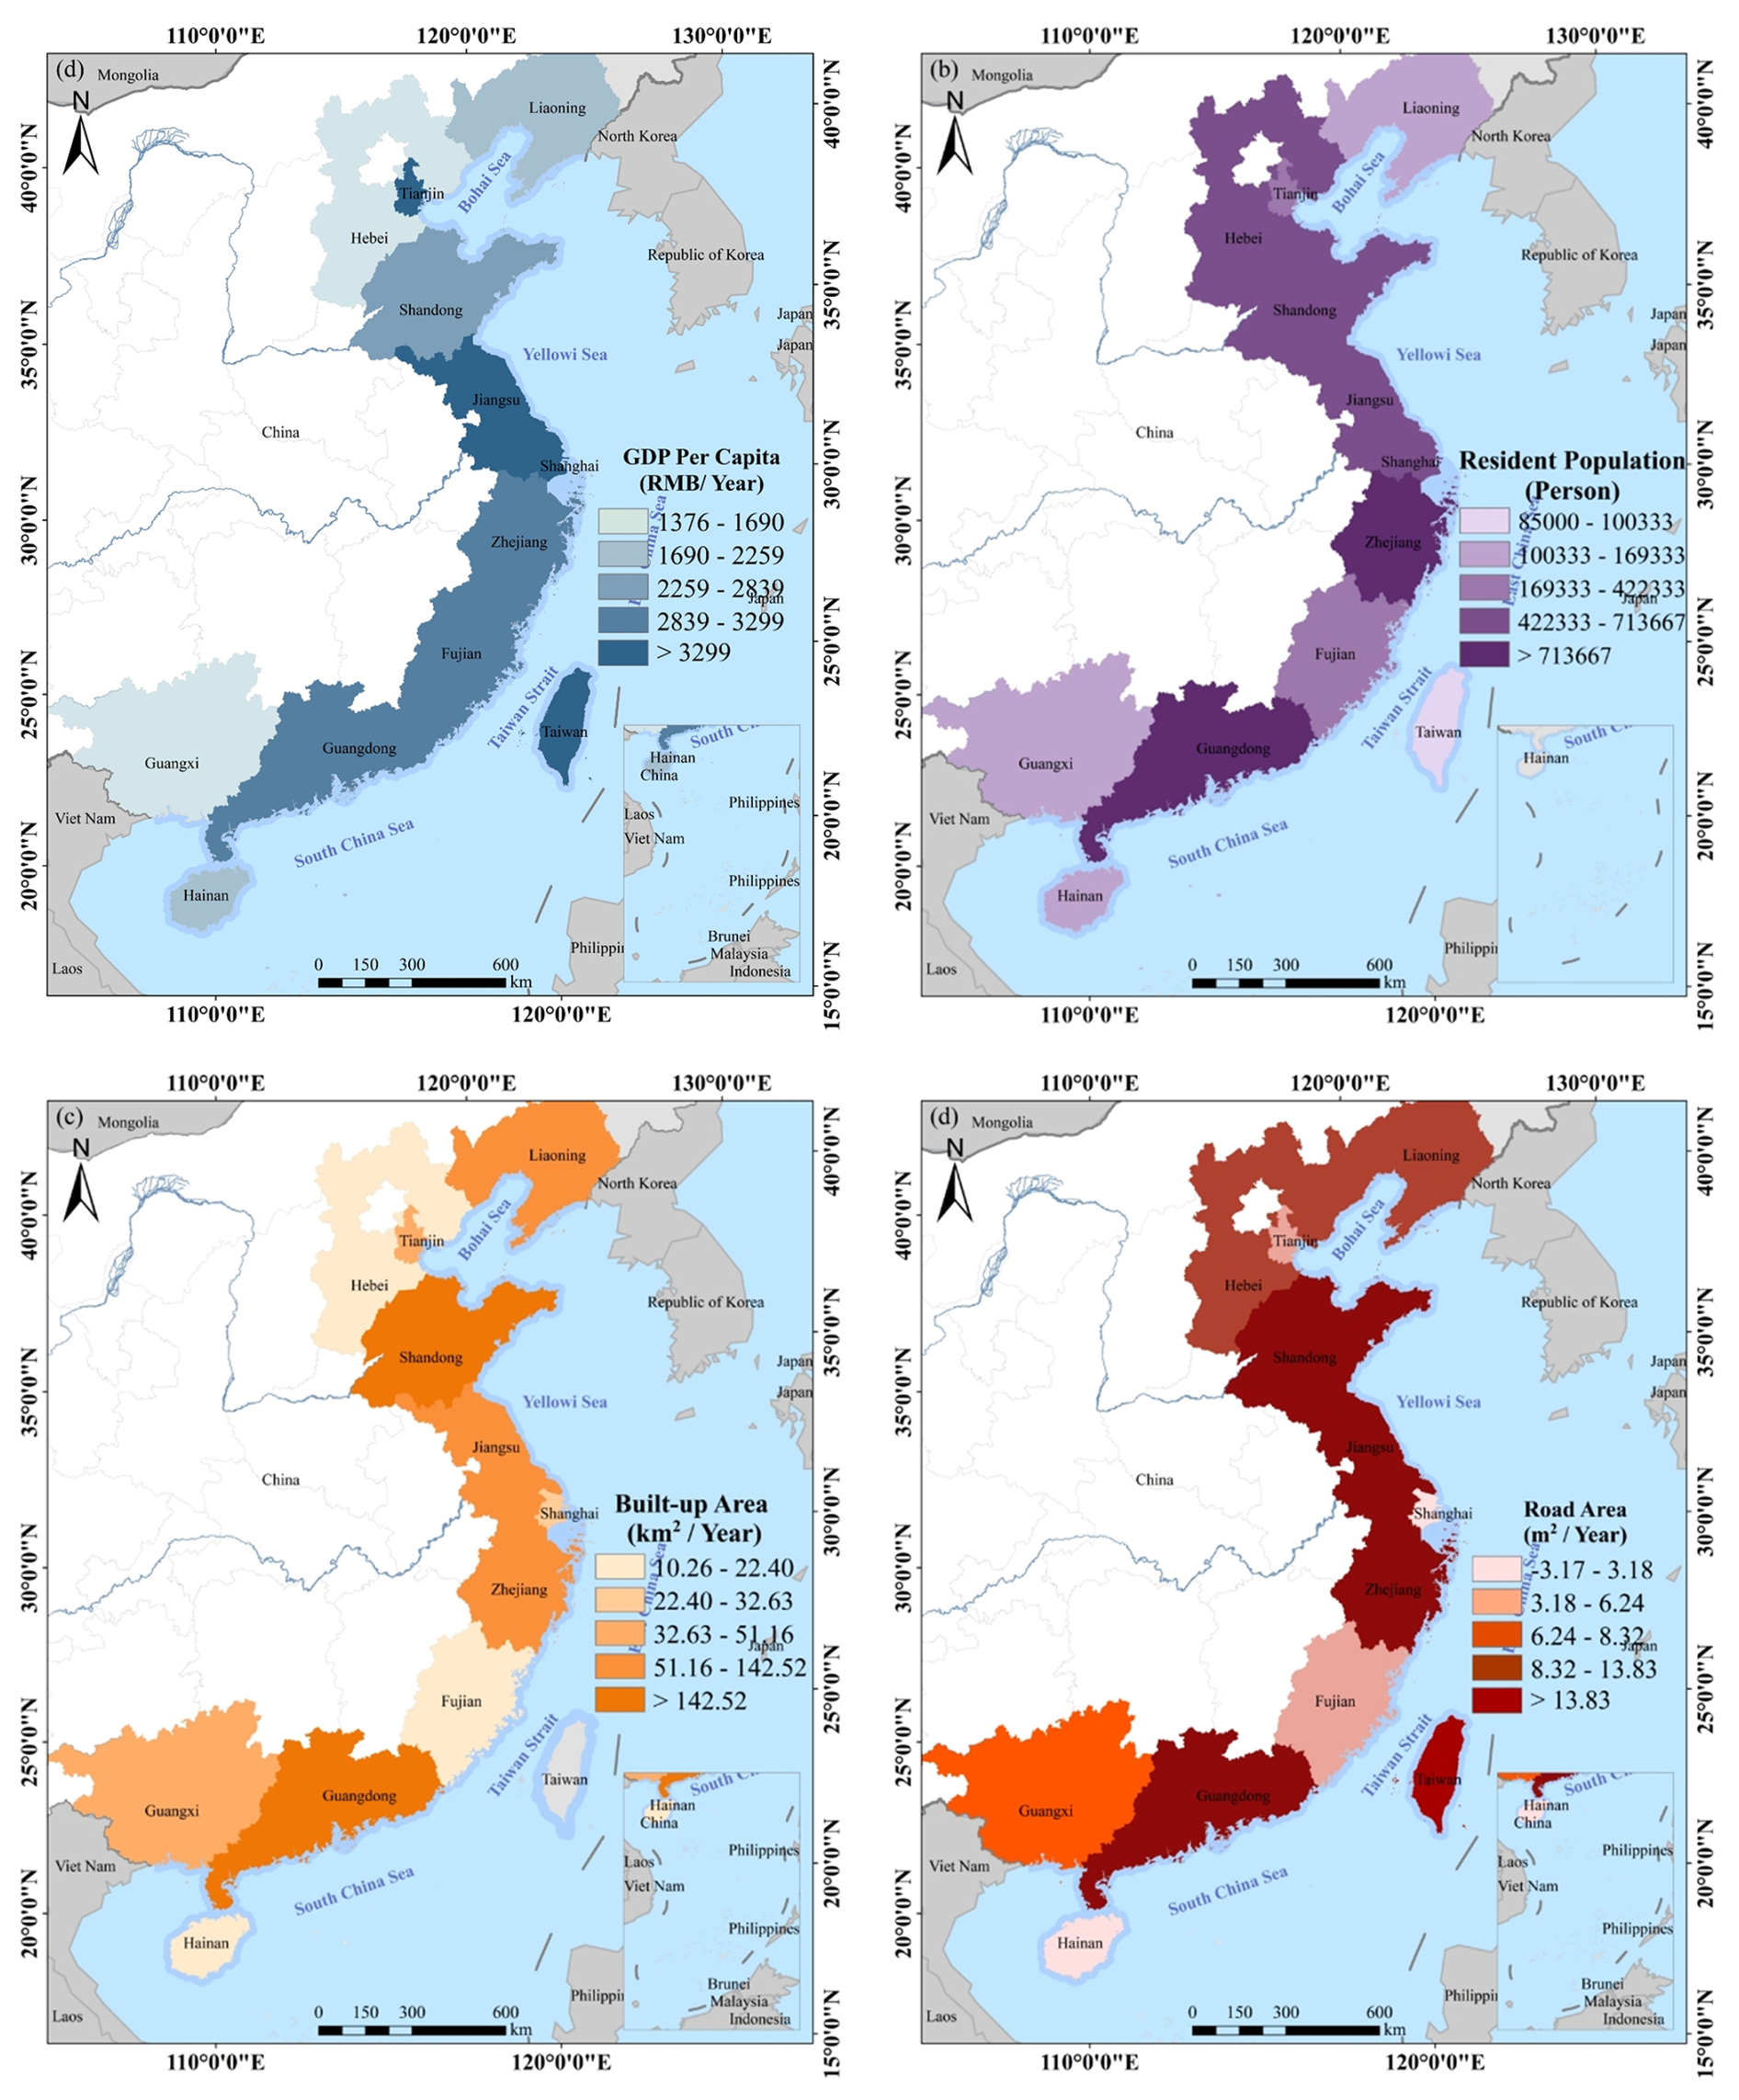
Figure 14Spatial changes of various factors from 1990 to 2024: (a) per capita GDP change, (b) resident population change, (c) built-up area change, (d) road area change.
We conducted a comprehensive analysis of the 1990, 2000, 2010, and 2020 data for the typical areas of human infrastructure squeeze risk in Jinjiang District, Quanzhou District, and Fengze District of Quanzhou, as detailed in the Supplement (Fig. S4). The analysis focused on the changes in indicators such as GDP, population density, built-up area, and road length. The results show that all these indicators have significantly increased over the past few decades, which is closely related to the risk of human infrastructure squeeze on sandy beaches. Specifically, with the growth of GDP, the expansion of economic activities has led to a continuous concentration of population in these areas, increasing the potential pressure on sandy beaches and the surrounding ecosystem. The expansion of built-up areas reflects the progress of urbanization, which, especially in vulnerable ecological regions such as sandy beaches, is often accompanied by a squeeze on natural resources. Although the increase in road length has promoted economic development, it has also intensified the risk of the squeeze on coastlines and surrounding sandy beaches.
5.5 Limitations of the proposed method and dataset
This study combines stacking ensemble learning models with remote sensing imagery to create a 10 m resolution sandy beach dataset, integrating multi-dimensional features such as spectral, terrain, polarization, and texture features. However, the study has some areas for improvement: (1) The sandy beach area is significantly affected by tidal changes, and the remote sensing images acquired at different tidal levels may exhibit considerable spatial differences. The current study has not fully addressed the issue of tidal phase matching. Future research should combine tidal prediction models or measured tidal data to select multi-temporal remote sensing images that are consistent with the target tidal phase, reducing the impact of tidal variations on beach extraction and improving the spatiotemporal accuracy of sandy beach extraction. (2) This study has preliminarily applied the Stacking ensemble learning method; however, there is still room for optimization in model selection, fusion strategy, and feature contribution evaluation. Future research can further optimize the base model structure, explore the synergistic effects between different models, and incorporate feature importance analysis to enhance the stability and classification accuracy of the ensemble model. (3) Currently, the assessment of human infrastructure squeeze risk in this study primarily relies on impervious surface expansion and buffer zone analysis. However, with relatively low spatial and temporal resolution, it is difficult to accurately depict the dynamic process of human infrastructure squeeze on sandy beaches. Future research should introduce higher spatial and temporal resolution data (e.g., high-frequency remote sensing monitoring, annual building change data, etc.) to enable continuous dynamic monitoring and analysis of the human infrastructure squeeze process.
The dataset on the distribution of sandy beaches in China and the distribution of human infrastructure squeeze risk is available at: https://doi.org/10.5281/zenodo.15307240 (Meng et al., 2025).
This study used ensemble learning algorithms to identify sandy beach areas between 2016 and 2024 and validated the superiority of the method through various classification metrics. The results demonstrate that the method exhibits high stability and accuracy in the beach classification task, effectively distinguishing sandy beaches from other land types. Additionally, there are significant regional differences, with some regions having abundant sandy beach resources while others have relatively fewer sandy beach areas, indicating an uneven distribution of resources. By comparing with several published datasets, the proposed dataset in this study showed higher accuracy and reliability, especially in some typical coastal areas, ensuring precise classification of sandy beaches. This provides more accurate data support for sandy beach resource management and ecological protection, particularly in the context of increasingly scarce beach resources.
In addition to identifying sandy beach resources, this study also focused on the risk of infrastructure squeeze on sandy beach resources along China's coast. The study found that as infrastructure projects such as port construction and seawall building continue to advance, coastal areas are facing the gradual squeeze of their sandy beaches. Although the rate of expansion in some regions has slowed, the pressure from infrastructure development on beach resources continues to persist. The impact of infrastructure squeeze varies between regions, with some regions facing more severe challenges, while others experience relatively minor changes in sandy beach resources. These findings provide important theoretical support for future sandy beach resource management and protection, highlighting the balance between infrastructure development and ecological preservation. This is particularly important in the context of rapid urbanization and economic development. Achieving sustainable sandy beach resource protection will be a crucial focus for future coastal region policy planning.
The supplement related to this article is available online at https://doi.org/10.5194/essd-17-7147-2025-supplement.
JM conceived the study, drafted the original manuscript, contributed to methodology development and visualization, refined the methods, and reviewed and edited the manuscript. DX contributed to manuscript writing, conducted formal analysis, secured project funding, and participated in manuscript review and editing. ZT performed software analysis and formal analysis and contributed to visualization and validation. QG contributed to writing and editing, validation, and funding acquisition, and provided supervision and essential resources.
The contact author has declared that none of the authors has any competing interests.
Publisher's note: Copernicus Publications remains neutral with regard to jurisdictional claims made in the text, published maps, institutional affiliations, or any other geographical representation in this paper. While Copernicus Publications makes every effort to include appropriate place names, the final responsibility lies with the authors. Views expressed in the text are those of the authors and do not necessarily reflect the views of the publisher.
We are grateful to the editors and anonymous reviewers for their constructive suggestions.
This research has been supported by the National Key R&D Program of China (grant no. 2024YFF1308105).
This paper was edited by François G. Schmitt and reviewed by two anonymous referees.
Bai, Z., Ye, Y., Zhou, L., Li, Z., and Yin, G.: Robust registration of aerial images and LiDAR data using spatial constraints and Gabor structural features, ISPRS J. Photogramm. Remote Sens., 181, 129–147, https://doi.org/10.1016/j.isprsjprs.2021.09.010, 2021.
Bao, Z., Sha, J., Li, X., Hanchiso, T., and Shifaw, E.: Monitoring of beach litter by automatic interpretation of unmanned aerial vehicle images using the segmentation threshold method, Mar. Pollut. Bull., 137, 388–398, https://doi.org/10.1016/j.marpolbul.2018.08.009, 2018.
Barbier, E. B., Hacker, S. D., Kennedy, C., Koch, E. W., Stier, A. C., and Silliman, B. R.: The value of estuarine and coastal ecosystem services, Ecol. Monogr., 81, 169–193, https://doi.org/10.1890/10-1510.1, 2011.
Baum-Snow, N., Brandt, L., Henderson, J. V., Turner, M. A., and Zhang, Q.: Roads, Railroads, and Decentralization of Chinese Cities, Rev. Econ. Stat., 99, 435–448, https://doi.org/10.1162/REST_a_00660, 2017.
Blenkinsopp, C. E., Bayle, P. M., Conley, D. C., Masselink, G., Gulson, E., Kelly, I., Almar, R., Turner, I. L., Baldock, T. E., Beuzen, T., McCall, R. T., Rijper, H., Reniers, A., Troch, P., Gallach-Sanchez, D., Hunter, A. J., Bryan, O., Hennessey, G., Ganderton, P., Tissier, M., Kudella, M., and Schimmels, S.: High-resolution, large-scale laboratory measurements of a sandy beach and dynamic cobble berm revetment, Sci. Data, 8, 22, https://doi.org/10.1038/s41597-021-00805-1, 2021.
Brščić, K. and Šugar, T.: Users' perceptions and satisfaction as indicators for sustainable beach management, Tour. Hosp. Manag., 26, 33–48, https://doi.org/10.20867/thm.26.1.3, 2020.
Chen, B., Tu, Y., Song, Y., Theobald, D. M., Zhang, T., Ren, Z., Li, X., Yang, J., Wang, J., Wang, X., Gong, P., Bai, Y., and Xu, B.: Mapping essential urban land use categories with open big data: Results for five metropolitan areas in the United States of America, ISPRS J. Photogramm. Remote Sens., 178, 203–218, https://doi.org/10.1016/j.isprsjprs.2021.06.010, 2021.
Chen, C., Liang, J., Xie, F., Hu, Z., Sun, W., Yang, G., Yu, J., Chen, L., Wang, L., Wang L., Chen, H., He, X., and Zhang, Z.: Temporal and spatial variation of coastline using remote sensing images for Zhoushan archipelago, China, Int. J. Appl. Earth Obs. Geoinf., 107, 102711, https://doi.org/10.1016/j.jag.2022.102711, 2022.
Chen, Y., Xu, C., Ge, Y., Zhang, X., and Zhou, Y.: A 100 m gridded population dataset of China's seventh census using ensemble learning and big geospatial data, Earth Syst. Sci. Data, 16, 3705–3718, https://doi.org/10.5194/essd-16-3705-2024, 2024.
Chrysafis, I., Mallinis, G., Gitas, I., and Tsakiri-Strati, M.: Estimating Mediterranean forest parameters using multi seasonal Landsat 8 OLI imagery and an ensemble learning method, Remote Sens. Environ., 199, 154–166, https://doi.org/10.1016/j.rse.2017.07.018, 2017.
Feng, J., Kong, L., Li, H., Cannon, N., Chang, X., and Ma, L.: Evaluation of the sustainable development capacity of bay cities in China in the context of Blue Bay Remediation Action, Sustainability, 17, 3036, https://doi.org/10.3390/su17073036, 2025.
Hasituya, Chen, Z., Wang, L., Wu, W., Jiang, Z., and Li, H.: Monitoring plastic-mulched farmland by Landsat-8 OLI imagery using spectral and textural features, Remote Sens., 8, 353, https://doi.org/10.3390/rs8040353, 2016.
Jiang, W., Tian, B., Duan, Y., Chen, C., and Hu, Y.: Rapid mapping and spatial analysis on the distribution of photovoltaic power stations with Sentinel-1&2 images in Chinese coastal provinces, Int. J. Appl. Earth Obs. Geoinf., 118, 103280, https://doi.org/10.1016/j.jag.2023.103280, 2023.
Kuai, Y., Tao, J., Zhou, Z., Aarninkhof, S., and Wang, Z. B.: Sediment characteristics and intertidal beach slopes along the Jiangsu coast, China, J. Mar. Sci. Eng., 9, 347, https://doi.org/10.3390/jmse9030347, 2021.
Lansu, E. M., Reijers, V. C., Hofer, S., Luijendijk, A., Rietkerk, M., Wassen, M. J., Lammerts, E. J., and van der Heide, T.: A global analysis of how human infrastructure squeezes sandy coasts, Nat. Commun., 15, 432, https://doi.org/10.1038/s41467-023-44659-0, 2024.
Latella, M., Luijendijk, A., Moreno-Rodenas, A. M., and Camporeale, C.: Satellite image processing for the coarse-scale investigation of sandy coastal areas, Remote Sens., 13, 4613, https://doi.org/10.3390/rs13224613, 2021.
Li, J., Wang, H., Wang, J., Zhang, J., Lan, Y., and Deng, Y.: Combining multi-source data and feature optimization for plastic-covered greenhouse extraction and mapping using the Google Earth Engine: A case in Central Yunnan Province, China, Remote Sens., 15, 3287, https://doi.org/10.3390/rs15133287, 2023.
Li, Y. and Niu, Z.: Systematic method for mapping fine-resolution water cover types in China based on time series Sentinel-1 and 2 images, Int. J. Appl. Earth Obs. Geoinf., 106, 102656, https://doi.org/10.1016/j.jag.2021.102656, 2022.
Liao, L. and Zhu, X.: Predicting wildfire risk in southwestern Saudi Arabia using machine learning and geospatial analysis, Remote Sens., 17, 3516, https://doi.org/10.3390/rs17213516, 2025.
Lin, J., Jin, X., Ren, J., Liu, J., Liang, X., and Zhou, Y.: Rapid mapping of large-scale greenhouse based on integrated learning algorithm and Google Earth Engine, Remote Sens., 13, 1245, https://doi.org/10.3390/rs13071245, 2021.
Liu, G., Cai, F., Qi, H., Liu, J., Lei, G., Zhu, J., Cao, H., Zheng, J., Zhao, S., and Yu, F.: A summary of beach nourishment in China: The past decade of practices, Shore Beach, 88, 65–73, https://doi.org/10.34237/1008836, 2020.
Lu, L., Tao, Y., and Di, L.: Object-based plastic-mulched landcover extraction using integrated Sentinel-1 and Sentinel-2 data, Remote Sens., 10, 1820, https://doi.org/10.3390/rs10111820, 2018a.
Lu, Y., Yuan, J., Lu, X., Su, C., Zhang, Y., Wang, C., Cao, X., Li, Q., Su, J., Ittekkot, V., Garbutt, R. A., Bush, S., Fletcher, S., Wagey, T., Kachur, A., and Sweijd, N.: Major threats of pollution and climate change to global coastal ecosystems and enhanced management for sustainability, Environ. Pollut., 239, 670–680, https://doi.org/10.1016/j.envpol.2018.04.016, 2018b.
Ma, F., Lü, P., Cao, M., Yu, J., and Xia, Z.: Morphological and sedimentary characteristics of raked linear dunes in the southeastern Taklimakan Desert, China, Aeolian Res., 67–69, 100923, https://doi.org/10.1016/j.aeolia.2024.100923, 2024.
Masria, A.: Bridging coastal challenges: The role of remote sensing and future research, Reg. Stud. Mar. Sci., 73, 103502, https://doi.org/10.1016/j.rsma.2024.103502, 2024.
Mattson, M., Sousa, D., Quandt, A., Ganster, P., and Biggs, T.: Mapping multi-decadal wetland loss: Comparative analysis of linear and nonlinear spatiotemporal characterization, Remote Sens. Environ., 302, 113969, https://doi.org/10.1016/j.rse.2023.113969, 2024.
Mejjad, N., Rossi, A., and Pavel, A. B.: The coastal tourism industry in the Mediterranean: A critical review of the socio-economic and environmental pressures & impacts, Tour. Manag. Perspect., 44, 101007, https://doi.org/10.1016/j.tmp.2022.101007, 2022.
Meng, J., Xu, D. Y., Tao, Z. X., and Ge, Q. S.: Spatial Patterns of Sandy Beaches in China and Risk Analysis of Human Infrastructure Squeeze Based on Multi-Source Data and Ensemble Learning, Zenodo [data set], https://doi.org/10.5281/zenodo.15307240, 2025.
Mentaschi, L., Vousdoukas, M. I., Pekel, J. F., Voukouvalas, E., and Feyen, L.: Global long-term observations of coastal erosion and accretion, Sci. Rep., 8, 12876, https://doi.org/10.1038/s41598-018-30904-w, 2018.
Miao, L., Chen, B., Webster, C., Gong, P., and Xu, B.: The land-sea interface mapping: China's coastal land covers at 10 m for 2020, Sci. Bull., 67, 1750–1754, https://doi.org/10.1016/j.scib.2022.07.012, 2022.
Mugunthan, J. S., Duguay, C. R., and Zakharova, E.: Machine learning based classification of lake ice and open water from Sentinel-3 SAR altimetry waveforms, Remote Sens. Environ., 299, 113891, https://doi.org/10.1016/j.rse.2023.113891, 2023.
Nativí-Merchán, S., Caiza-Quinga, R., Saltos-Andrade, I., Martillo-Bustamante, C., Andrade-García, G., Quiñonez, M., Cervantes, E., and Cedeño, J.: Coastal erosion assessment using remote sensing and computational numerical model. Case of study: Libertador Bolivar, Ecuador, Ocean Coast. Manag., 214, 105894, https://doi.org/10.1016/j.ocecoaman.2021.105894, 2021.
Nemmaoui, A., Aguilar, M. A., Aguilar, F. J., Novelli, A., and García Lorca, A.: Greenhouse crop identification from multi-temporal multi-sensor satellite imagery using object-based approach: A case study from Almería (Spain), Remote Sens., 10, 1751, https://doi.org/10.3390/rs10111751, 2018.
Ni, M., Xu, N., Ou, Y., Yao, J., Li, Z., Mo, F., Huang, C., Xin, H., and Xu, H.: The first 10 m China's national-scale sandy beach map in 2022 derived from Sentinel-2 imagery, Int. J. Digit. Earth, 17, 2425163, https://doi.org/10.1080/17538947.2024.2425163, 2024.
Novelli, A., Aguilar, M. A., Nemmaoui, A., Aguilar, F. J., and Tarantino, E.: Performance evaluation of object based greenhouse detection from Sentinel-2 MSI and Landsat 8 OLI data: A case study from Almería (Spain), Int. J. Appl. Earth Obs. Geoinf., 52, 403–411, https://doi.org/10.1016/j.jag.2016.07.011, 2016.
Pan, X., Yang, F., Gao, L., Chen, Z., Zhang, B., Fan, H., and Ren, J.: Building extraction from high-resolution aerial imagery using a generative adversarial network with spatial and channel attention mechanisms, Remote Sens., 11, 917, https://doi.org/10.3390/rs11080917, 2019.
Pesaresi, M. and Politis, P.: GHS-BUILT-H R2023A – GHS Building Height, Derived from AW3D30, SRTM30, and Sentinel-2 Composite (2018), Eur. Comm., Joint Res. Cent. [data set], https://doi.org/10.2905/85005901-3A49-48DD-9D19-6261354F56FE, 2023.
Pickens, A. H., Hansen, M. C., Hancher, M., Stehman, S. V., Tyukavina, A., Potapov, P., Marroquin, B., and Sherani, Z.: Mapping and sampling to characterize global inland water dynamics from 1999 to 2018 with full Landsat time-series, Remote Sens. Environ., 243, 111792, https://doi.org/10.1016/j.rse.2020.111792, 2020.
Ponte Lira, C., Nobre Silva, A., Taborda, R., and Freire de Andrade, C.: Coastline evolution of Portuguese low-lying sandy coast in the last 50 years: an integrated approach, Earth Syst. Sci. Data, 8, 265–278, https://doi.org/10.5194/essd-8-265-2016, 2016.
Qiao, L. and Xia, H.: The impact of drought time scales and characteristics on gross primary productivity in China from 2001 to 2020, Geo-spat. Inf. Sci., 28, 284–302, https://doi.org/10.1080/10095020.2024.2315279, 2024.
Qin, G., Wang, S., Wang, F., Wang, Z., Li, S., Gu, X., Hu, K., and Liu, L.: Emergency-oriented fine change detection of flood-damaged farmland from medium-resolution remote sensing images, Int. J. Appl. Earth Obs. Geoinf., 138, 104442, https://doi.org/10.1016/j.jag.2025.104442, 2025.
Rabehi, W., Amin Larabi, M. E., Benabbou, O., Kreri, S., and Dellani, H.: Sandy beach mapping using a deep learning approach: potential method for automated monitoring of Algerian coastal erosion, J. Coast. Res., 39, 949–959, https://doi.org/10.2112/JCOASTRES-D-22-00110.1, 2023.
Ranasinghe, R.: Assessing climate change impacts on open sandy coasts: a review, Earth-Sci. Rev., 160, 320–332, https://doi.org/10.1016/j.earscirev.2016.07.011, 2016.
Rhyma, P. P., Norizah, K., Hamdan, O., Faridah-Hanum, I., and Zulfa, A. W.: Integration of normalized difference vegetation index and soil-adjusted vegetation index for mangrove vegetation delineation, Remote Sens. Appl. Soc. Environ., 17, 100280, https://doi.org/10.1016/j.rsase.2019.100280, 2020.
Rodríguez-Padilla, I., Mariño-Tapia, I., and Ruiz de Alegría-Arzaburu, A.: Daily timescale analysis of sediment transport and topographic changes on a mesotidal sandy beach under low to moderate wave conditions, Mar. Geol., 474, 107323, https://doi.org/10.1016/j.margeo.2024.107323, 2024.
Roy, P. S., Sharma, K. P., and Jain, A.: Stratification of density in dry deciduous forest using satellite remote sensing digital data – an approach based on spectral indices, J. Biosci., 21, 723–734, https://doi.org/10.1007/bf02703148, 1996.
Salameh, E., Frappart, F., Almar, R., Baptista, P., Heygster, G., Lubac, B., Raucoules, D., Almeida, L. P., Bergsma, E. W. J., Capo, S., De Michele, M., Idier, D., Li, Z., Marieu, V., Poupardin, A., Silva, P. A., Turki, I., and Laignel, B.: Monitoring beach topography and nearshore bathymetry using spaceborne remote sensing: a review, Remote Sens., 11, 2212, https://doi.org/10.3390/rs11192212, 2019.
Sekar, C. S., Kankara, R. S., and Kalaivanan, P.: Pixel-based classification techniques for automated shoreline extraction on open sandy coast using different optical satellite images, Arab. J. Geosci., 15, 939, https://doi.org/10.1007/s12517-022-10239-7, 2022.
Sekovski, I., Stecchi, F., Mancini, F., and Del Rio, L.: Image classification methods applied to shoreline extraction on very high-resolution multispectral imagery, Int. J. Remote Sens., 35, 3556–3578, https://doi.org/10.1080/01431161.2014.907939, 2014.
Splinter, K. D., Harley, M. D., and Turner, I. L.: Remote sensing is changing our view of the coast: insights from 40 years of monitoring at Narrabeen-Collaroy, Australia, Remote Sens., 10, 1744, https://doi.org/10.3390/rs10111744, 2018.
Sun, S., Xue, Q., Xing, X., Zhao, H., and Zhang, F.: Remote sensing image interpretation for coastal zones: a review, Remote Sens., 16, 4701, https://doi.org/10.3390/rs16244701, 2024.
Tassi, A. and Vizzari, M.: Object-oriented LULC classification in Google Earth Engine combining SNIC, GLCM, and machine learning algorithms, Remote Sens., 12, 3776, https://doi.org/10.3390/rs12223776, 2020.
Temmerman, S., Meire, P., Bouma, T. J., Herman, P. M., Ysebaert, T., and De Vriend, H. J.: Ecosystem-based coastal defence in the face of global change, Nature, 504, 79–83, https://doi.org/10.1038/nature12859, 2013.
Tian, B., Wu, W., Yang, Z., and Zhou, Y.: Drivers, trends, and potential impacts of long-term coastal reclamation in China from 1985 to 2010, Estuar. Coast. Shelf Sci., 170, 83–90, https://doi.org/10.1016/j.ecss.2016.01.006, 2016.
Tian, P., Liu, Y., Li, J., Pu, R., Cao, L., Zhang, H., Ai, S. S., and Yang, Y.: Mapping coastal aquaculture ponds of China using Sentinel SAR images in 2020 and Google Earth Engine, Remote Sens., 14, 5372, https://doi.org/10.3390/rs14215372, 2022.
Tian, S., Sha, A., Luo, Y., Ke, Y., Spencer, R., Hu, X., Ning, M., Zhao, Y., Deng, R., Gao, Y., Liu, Y., and Li, D.: A novel framework for river organic carbon retrieval through satellite data and machine learning, ISPRS J. Photogramm. Remote Sens., 221, 109–123, https://doi.org/10.1016/j.isprsjprs.2025.01.028, 2025a.
Tian, W., Dong, Y., Fu, S., Zhang, S., Huang, D., and Yang, L.: Surfzone–beach–dune interactions on the Chinese coasts, Mar. Geol., 481, 107480, https://doi.org/10.1016/j.margeo.2025.107480, 2025b.
Toure, S., Diop, O., Kpalma, K., and Maiga, A. S.: Shoreline detection using optical remote sensing: a review, ISPRS Int. J. Geo-Inf., 8, 75, https://doi.org/10.3390/ijgi8020075, 2019.
Valderrama-Landeros, L., Flores-Verdugo, F., and Flores-de-Santiago, F.: Assessing the coastal vulnerability by combining field surveys and the analytical potential of CoastSat in a highly impacted tourist destination, Geographies, 2, 642–656, https://doi.org/10.3390/geographies2040039, 2022.
Vicens-Miquel, M., Medrano, F. A., Tissot, P. E., Kamangir, H., Starek, M. J., and Colburn, K.: A deep learning based method to delineate the wet/dry shoreline and compute its elevation using high-resolution UAS imagery, Remote Sens., 14, 5990, https://doi.org/10.3390/rs14235990, 2022.
Wang, M., Mao, D., and Xiao, X.: Interannual changes of coastal aquaculture ponds in China at 10 m spatial resolution during 2016–2021, Remote Sens. Environ., 284, 113347, https://doi.org/10.1016/j.rse.2022.113347, 2023.
Wang, W. and Wu, Z.: Coastal dune rock development and Holocene climate changes in South China, J. Geogr. Sci., 20, 469–480, https://doi.org/10.1007/s11442-010-0469-2, 2010.
Wang, X., Zhou, M., and Xia, Y.: Evolution of China's coastal economy since the Belt and Road Initiative based on nighttime light imagery, Sustainability, 16, 1255, https://doi.org/10.3390/su16031255, 2024a.
Wang, Z., Fang, Z., and Chang, J.: A two-step approach to extracting sandy beaches through integrating spatial semantic information from open-source geospatial datasets, Trans. GIS, 28, 2379–2396, https://doi.org/10.1111/tgis.13231, 2024b.
Wei, X., Zheng, W., and Xi, C.: Shoreline extraction in SAR image based on advanced geometric active contour model, Remote Sens., 13, 642, https://doi.org/10.3390/rs13040642, 2021.
Xiao, X. and Liang, S.: Assessment of snow cover mapping algorithms from Landsat surface reflectance data and application to automated snowline delineation, Remote Sens. Environ., 307, 114163, https://doi.org/10.1016/j.rse.2024.114163, 2024.
Xu, N., Wang, L., and Xu, H.: Deriving accurate intertidal topography for sandy beaches using ICESat-2 data and Sentinel-2 imagery, J. Remote Sens., 4, 0305, https://doi.org/10.34133/remotesensing.0305, 2024.
Xu, X.: China GDP spatial distribution kilometer grid dataset, Resour. Environ. Sci. Data Center [data set], https://doi.org/10.12078/2017121102, 2017a.
Xu, X.: China population spatial distribution kilometer grid dataset, Resour. Environ. Sci. Data Center [data set], https://doi.org/10.12078/2017121101, 2017b.
Yang, J. and Huang, X.: The 30 m annual land cover dataset and its dynamics in China from 1990 to 2019, Earth Syst. Sci. Data, 13, 3907–3925, https://doi.org/10.5194/essd-13-3907-2021, 2021.
Yasir, M., Sheng, H., and Fan, H.: Automatic coastline extraction and changes analysis using remote sensing and GIS technology, IEEE Access, 8, 180156–180170, https://doi.org/10.1109/ACCESS.2020.3027881, 2020.
Yong, S. Y., O'Grady, J., and Gregory, R.: Regional-scale image segmentation of sandy beaches in southeastern Australia, Remote Sens., 16, 3534, https://doi.org/10.3390/rs16183534, 2024.
Zhang, Q., Li, B., and Thau, D.: Building a better urban picture: Combining day and night remote sensing imagery, Remote Sens., 7, 11887–11913, https://doi.org/10.3390/rs70911887, 2015.
Zhang, L., Li, G., and Liu, S.: Spatiotemporal variations and driving factors of coastline in the Bohai Sea, J. Ocean Univ. China, 21, 1517–1528, https://doi.org/10.1007/s11802-022-5114-z, 2022.
Zhang, H., Tian, P., and Zhong, J.: Mapping photovoltaic panels in coastal China using Sentinel-1 and Sentinel-2 images and Google Earth Engine, Remote Sens., 15, 3712, https://doi.org/10.3390/rs15153712, 2023a.
Zhang, L., Fang, C., and Zhao, R.: Spatial-temporal evolution and driving force analysis of eco-quality in urban agglomerations in China, Sci. Total Environ., 866, 161465, https://doi.org/10.1016/j.scitotenv.2023.161465, 2023b.
Zhao, Z., Chen, Y., Li, K., Ji, W., and Sun, H.: Extracting photovoltaic panels from heterogeneous remote sensing images with spatial and spectral differences, IEEE J. Sel. Top. Appl. Earth Obs. Remote Sens., 17, 5553–5564, https://doi.org/10.1109/JSTARS.2024.3369660, 2024.
Zhou, L., Yang, Y., and Li, G.: OSL dating of coastal dunes on the southeastern coast of Hainan Island, China, Front. Mar. Sci., 10, 1165551, https://doi.org/10.3389/fmars.2023.1165551, 2023a.
Zhou, Y., Feng, X., and Liu, M.: Influence of beach erosion during wave action in designed artificial sandy beach using XBeach model: Profiles and shoreline, J. Mar. Sci. Eng., 11, 984, https://doi.org/10.3390/jmse11050984, 2023b.
Zhu, Y., Li, Z., and Zhao, Z.: Spatio-temporal changes of coastline in Jiaozhou Bay from 1987 to 2022 based on optical and SAR data, Front. Mar. Sci., 10, 1233410, https://doi.org/10.3389/fmars.2023.1233410, 2023.
Zou, Z., Xiao, X., and Dong, J.: Divergent trends of open-surface water body area in the contiguous United States from 1984 to 2016, Proc. Natl. Acad. Sci. U. S. A., 115, 3810–3815, https://doi.org/10.1073/pnas.1719275115, 2018.