the Creative Commons Attribution 4.0 License.
the Creative Commons Attribution 4.0 License.
 | 10 Dec 2025
Using new geospatial data and 2020 fossil fuel methane emissions for the Global Fuel Exploitation Inventory (GFEI) v3
Elfie Roy
Daniel J. Jacob
Melissa P. Sulprizio
Ryan D. Tate
Daniel H. Cusworth
The Global Fuel Exploitation Inventory (GFEI) is a global 0.1° × 0.1° resolution gridded inventory of methane emissions from oil, gas, and coal exploitation. Here, we present GFEI v3 with updated national emissions to 2020 using reports submitted to the United Nations Framework Convention on Climate Change (UNFCCC), leading to new global emissions of 23, 20, and 31 Tg a−1 for oil, gas, and coal, respectively. We also use new geospatial information from the Oil and Gas Infrastructure Mapping database (OGIM v1) for spatial distribution of global oil-gas methane emissions. We use coal mine locations from the Global Energy Monitor's Global Coal Mine Tracker (GCMT), combined with our own estimates for mine-level methane emissions, to distribute national emissions between coal mine locations. Our mine-level methane emission estimates use country specific emission factors for top producing countries supplemented with modeled emission factors based on coal mine depth and grade. We see the greatest change in the spatial distribution of emissions in GFEI v3 compared to v2 in China due to the use of GCMT for coal mine locations. Large point source plumes (super-emitters) observed by the NASA EMIT instrument are co-located with infrastructure identified in GFEI v3, but the magnitude of the measured emissions is poorly correlated with the gridded emissions in GFEI. This may reflect missing or misrepresented sources in GFEI v3 but also the sporadic nature of the super-emitter measurements used here. By aligning GFEI v3 with national UNFCCC reports and using state-of-the-science geospatial information, the inventory can be confronted with satellite observations of atmospheric methane through inverse modeling to evaluate and improve the UNFCCC reports. We plan to continue updating GFEI to align with reported national emissions and new geospatial information, including assessment of GFEI spatial accuracy through comparison to super-emitter detections. GFEI v3 emission grids by sector and subsector are available at https://doi.org/10.7910/DVN/HH4EUM (Scarpelli et al., 2024).
- Article
(3719 KB) - Full-text XML
-
Supplement
(2063 KB) - BibTeX
- EndNote


It has been widely recognized that there is an urgent need to reduce methane emissions for short-term climate benefits, often with focus on fossil fuel exploitation given its large contribution to emissions and mitigation potential. Methane emission reductions in the oil and gas sector have the greatest potential for zero net-cost or even revenue increases (UNEP and CCAC, 2021). Many top oil- and gas-producing nations have committed to reducing methane emissions, including recent announcements at COP28 from Turkmenistan, Angola, and Kazakhstan to sign on to the Global Methane Pledge (GMP). Similarly, half of the methane emissions from coal operations can be abated using existing technologies (IEA, 2023), and China, the largest emitter of methane from coal, recently released a Methane Emission Control Action Plan (2023) that includes strategies for reducing methane emissions from coal production, including plans to increase the utilization of coal mine gas.
Though the GMP sets a collective target of reducing global anthropogenic methane emissions by 30 % below 2020 levels by 2030, participating countries also commit to domestic action to fulfill the GMP. These include the setting of standards for emissions reductions in key sectors, including oil-gas and waste, and moving towards the highest quality of reporting methodologies for their national greenhouse gas emission inventories (GMP, 2023). China also recognized the need to improve reporting and monitoring of methane in its Methane Emission Control Action Plan (2023), including improvement of methane emission factors.
National inventories estimate emissions by bottom-up methods for individual sectors, and they can be used to establish mitigation goals and track emissions reduction progress. The IPCC has established guidelines for the bottom-up methodology used to create and review the inventories, specifying different tiers of reporting that range in data quality and the level of uncertainty. For example, the highest Tier 3 methods require direct emissions measurements whereas the lowest Tier 1 methods may rely on default emission factors with country-specific activity data (IPCC, 2006, Vol. 2, Chap. 4; IPCC, 2019, Vol. 2, Chap. 4). Countries submit their national inventories through the United Nations Framework Convention on Climate Change (UNFCCC) as Annex I or non-Annex I countries. Annex I countries must submit detailed subsector emission estimates (subsectors include oil refining, oil production, gas production, etc.) for each year up to 2 years prior to submission and often use higher Tier methods for high-emitting sectors. Non-Annex I countries may or may not choose to include sectoral and temporal information and often use Tier 1 methods. They also may not report annually. The Paris Agreement establishes new reporting requirements that supersede the UNFCCC starting in December 2024, including a requirement for all countries to submit national inventories with sectoral information every two years as part of the biennial transparency report (BTR; Article 13.7a, Paris Agreement, 2015). Annex I countries required to report annually under the UNFCCC will continue to do so in years when a BTR is not due (FAQ, 2024).
Satellite observations of atmospheric methane have emerged as important tools to evaluate national bottom-up inventories worldwide, using gridded versions of these inventories as prior estimates in inverse analyses to relate the observed atmospheric concentration gradients to emissions (Jacob et al., 2016, 2022). These inverse analyses often find large (more than a factor of 5) disagreements with UNFCCC reported emissions for the oil and gas sector (e.g., Tibrewal et al., 2024; Shen et al., 2023; Worden et al., 2022; Deng et al., 2022; Scarpelli et al., 2022a). The potential for large biases in reported emissions may hinder our ability to track progress towards mitigation goals, so inverse analyses that can identify and correct these biases have been recognized by the IPCC as a useful tool for verification of national greenhouse gas inventories (IPCC, 2019, Vol. 1, Chap. 6). But they require bottom-up information on the spatial distribution of emissions, and errors in this distribution can propagate to errors in the inversion results or their sectoral attribution (e.g., Yu et al., 2021; Tibrewal et al., 2024), and this sector attribution is key for guiding mitigation action.
The Global Fuel Exploitation Inventory (GFEI) provides a spatially explicit version of the UNFCCC reported emissions. GFEI combines the oil, gas, and coal exploitation emissions reported in national inventories with geospatial information on infrastructure, gridded at 0.1° × 0.1° resolution and provided as separate files for each sector and subsector (Scarpelli et al., 2020a). GFEI v2 includes emissions from 2010-2019 based on national inventories reported to the UNFCCC as of 2021 (Scarpelli et al., 2022a). Infrastructure data in GFEI v2 is for 2019 and includes well data from Enverus, midstream infrastructure from the Global Oil & Gas Infrastructure (GOGI) database (Sabbatino et al., 2017), and coal mine locations from EDGAR v6 (2024). GFEI v2 also incorporates national gridded inventories, when available by desired subsector, including for the US, Mexico, Canada, and China (coal only). Because GFEI has a basis in the UNFCCC reported emissions, inverse analyses that use GFEI as a prior estimate can relate emissions corrections back to potential improvements in national inventories (e.g., Shen et al., 2023; Scarpelli et al., 2022a). The geospatial information in GFEI has also been used to provide context for large point source emission (super-emitter) events observed from point source imaging satellites (e.g., Varon et al., 2019; Sadavarte et al., 2021), though GFEI is meant to reflect average annual emissions rather than any specific snapshot in time.
Here we present GFEI v3 which uses new geospatial information including the Oil and Gas Infrastructure Mapping database (OGIM v1; Omara et al., 2023) for midstream oil-gas infrastructure, updated oil-gas well data, and new coal mine-scale emissions that we generate using a combination of our own mine-scale emission estimates, country-specific emission factors, and mine locations from the Global Coal Mine Tracker (GCMT; Global Energy Monitor, 2023). We update national emissions to 2020 using the UNFCCC reports submitted in 2022. Emission grids are provided for 2010–2020, using the geospatial information for 2020 while updating national emissions for each year.
GFEI is a combination of national methane emission inventories, as reported to the UNFCCC, and geospatial information. National emissions are distributed to a 0.1° × 0.1° resolution grid within each country using the locations of oil, gas, and coal infrastructure. This process is performed for each subsector with subsector emissions allocated to the relevant infrastructure when possible (gas production emissions are distributed to gas wells, gas transmission emissions are distributed to gas pipelines and compressor stations, etc.).
2.1 National emissions
GFEI v3 national emissions are taken from the UNFCCC reports submitted as of September 2022 (UNFCCC, 2022). This includes methane emissions by year and subsector for Annex I countries from 2010 to 2020. Most non-Annex I countries only report total emissions for oil-gas and coal and the average report year for these countries is 2010. Some countries do not submit reports to the UNFCCC, including Iraq and Libya which are the only countries with GFEI emissions greater than 100 Gg a−1 fit this description (see Table S1 in the Supplement). We also consider countries to be non-reporting if (1) they do not separately report oil-gas versus coal emissions (the only country this impacts is Angola and their last report is outdated, for 2005) or (2) they have outdated reports that significantly disagree from IPCC estimates (i.e., if the last reported year is more than a decade old and off by two orders of magnitude; includes the Dominican Republic, Guatemala, Macedonia, Sudan, and the Philippines). More information on reporting data used is included in Table S1.
We generate our own national oil-gas emissions estimates to supplement the UNFCCC data for non-reporting countries. Following Scarpelli et al. (2022a), we estimate emissions for each of these countries using the IPCC Tier 1 methods, with default emission factors (IPCC, 2006, 2019) applied to EIA activity data for 2020 (EIA, 2023). If EIA data is not available for 2020, we scale the most recent year to 2020 using trends in activity for the three most recent years. We use these methods to estimate emissions by subsector (e.g., gas production) and process (venting, flaring, fugitive leakage). The oil subsectors include exploration, production, refining, and transport, and the gas subsectors include exploration, production, processing, transmission, storage, and distribution (Scarpelli et al., 2020a). For coal, we have the Roy (2023) emissions by subsector, including surface mining, underground mining, and post-mining emissions (Roy, 2023), and therefore do not produce IPCC Tier 1 estimates for coal. In the US, we also have coal emissions for abandoned mines from Maasakkers et al. (2023).
Because non-Annex I countries may not report annually or by subsector, we also use the IPCC Tier 1 estimates (by subsector and year) and EIA data to disaggregate oil-gas subsectors and update the year for the UNFCCC emissions, as needed (see Table S1 for information on UNFCCC reporting year). For coal, we use the EIA coal production data to update the year for the UNFCCC coal emissions as needed. For Annex I countries, we use the UNFCCC reported emissions directly in GFEI with the exception that we use the IPCC Tier 1 estimates to separate gas transmission and storage emissions which are reported together and to disaggregate venting and flaring emissions, which are reported as totals for oil and gas, by subsector. Some Annex I countries report emissions for the “Other” subsector category for oil or gas, so we distribute these emissions between the oil or gas subsectors using the relative magnitude of emissions for each subsector. This means that national emissions in GFEI will match UNFCCC reported emissions when the reported emissions are available for 2020 (e.g., for Annex I countries, for non-Annex I countries that report 2020 emissions) whereas GFEI emissions in Table S1 may differ from UNFCCC reported emissions if scaling was needed to update the year to 2020, as described above and in Scarpelli et al. (2022a).
For a subset of high-emitting countries, we use additional sector and subsector information from national reports (National Communications, Biennial Update Reports, and National Inventory Reports), including Nigeria, Venezuela, Indonesia, Mexico, Iran, Malaysia, Uzbekistan, Saudi Arabia, and South Africa. In a change from GFEI v2, we also use UNFCCC-reported emissions for countries that submit reports but do not have data available via the GHG Inventory Data Interface (UNFCCC, 2022), including Oman, Ghana, Pakistan, and Equatorial Guinea. Information on reports used is available in Table S1.
2.2 Spatial allocation of oil-gas emissions
We follow the methods of Scarpelli et al. (2022a) to allocate oil-gas emissions within each country to infrastructure information. For GFEI v3, we use updated versions of the same geospatial data used in GFEI v2 for wells (Enverus, 2023) and population (CIESIN, 2018), while we use new midstream infrastructure data from the Oil and Gas Infrastructure Mapping database (OGIM v1; Omara et al., 2023). We generally use the infrastructure or population density per grid cell to distribute emissions. We use well locations from Enverus (2023) to distribute oil-gas exploration and production emissions and use well locations from Rose (2017) to fill gaps as needed. We allocate midstream emissions (gas transmission and processing, oil refining, etc.) to the corresponding infrastructure locations in OGIM (compressor stations, processing plants, refineries, etc.), and we allocate gas distribution emissions using a population map for 2020 (CIESIN, 2018). To avoid a high bias in our emissions allocation because of missing facilities in OGIM, we estimate the percentage of missing midstream facilities for each country using the volume-per-facility thresholds described by Scarpelli et al. (2020a), and we allocate the same percentage of subsector emissions to oil or gas pipelines in OGIM (e.g., if 20 % of compressor stations are estimated missing for a given country, we allocate 20 % of gas transmission emissions to gas pipelines in that country).
Similarly to GFEI v2, we use previous national gridded inventories to allocate oil-gas emissions within Canada (Scarpelli et al., 2022b) and Mexico (Scarpelli et al., 2020b). In the US, we use the new 2020 emissions as available in the Gridded EPA inventory (GEPA v2; Maasakkers et al., 2023). GEPA emissions from abandoned wells and post-meter gas distribution are included in the gas production and gas distribution subsectors, respectively. As discussed in Scarpelli et al. (2020a), we do not use other national gridded inventories due to their limited temporal (e.g., for Switzerland in Hiller et al., 2014) and sectoral (e.g., for the UK in BEIS, 2024) information. We previously demonstrated good agreement of GFEI with BEIS in the UK (Scarpelli et al., 2020a).
2.3 Spatial allocation of coal emissions
For coal in GFEI v3, we use a new dataset for coal mines from the Global Coal Mine Tracker (GCMT; Global Energy Monitor, 2023). The GCMT provides point locations, mine characterization data (coal production, depth, etc.), and methane emission estimates for major coal mines around the globe. We do not use the GCMT emissions because they do not account for the expected relationship between emissions and mine depth which varies by grade of coal. We use the mine-level data from the GCMT and our own modeled emission factors, based on coal mine depth and grade (Roy, 2023; see Appendix A for more information), to estimate our own mine-level emissions. For the top 11 producing countries, we also use country specific emission factors, when available, based on methane measurements at specific mines or within coal basins in each country, as described further in Roy (2023). This includes the use of the EPA gridded inventory for coal in the US (Maasakkers et al., 2023). In GFEI v2, we used previous national gridded inventories for coal in Canada, Mexico, and China to allocate coal emissions, but we now use our new methodology because the GCMT has sufficient mine coverage in these countries. We distribute the UNFCCC reported emissions for coal mining and post-mining activities using our mine-level emission estimates within each country.
Figure 1 shows global GFEI v3 emissions for 2020 separated by sector. Regions of high emissions are generally associated with oil, gas, or coal production. Global emissions are 23 Tg a−1 for oil, 20 Tg a−1 for gas, and 31 Tg a−1 for coal. In comparison to other global inventories, GFEI v3 (74 Tg a−1) is lower than EDGAR estimated emissions in 2020 (89 Tg a−1; EDGAR, 2024; Crippa et al., 2024) due to a 26 %–30 % higher estimate for oil and coal in EDGAR compared to GFEI. The IEA Global Methane Tracker (GMT; IEA, 2025) has noted that their estimated emissions are 80 % higher than UNFCCC reporting, and we also find that the most recent GMT estimate of 144 Tg a−1 for 2024 emissions is almost double our 2020 GFEI emissions with the IEA indicating that this discrepancy is spread across most high emitting countries and in part due to the uncertainty and lack of up-to-date information in national inventories (IEA, 2025). The higher estimate in the GMT is also partly explained by the inclusion of additional sources like satellite detected emissions, abandoned facilities, and bioenergy, whereas oil, gas, and coal exploitation total 99 Tg a−1 in the GMT estimate, though this is still higher than GFEI and EDGAR.
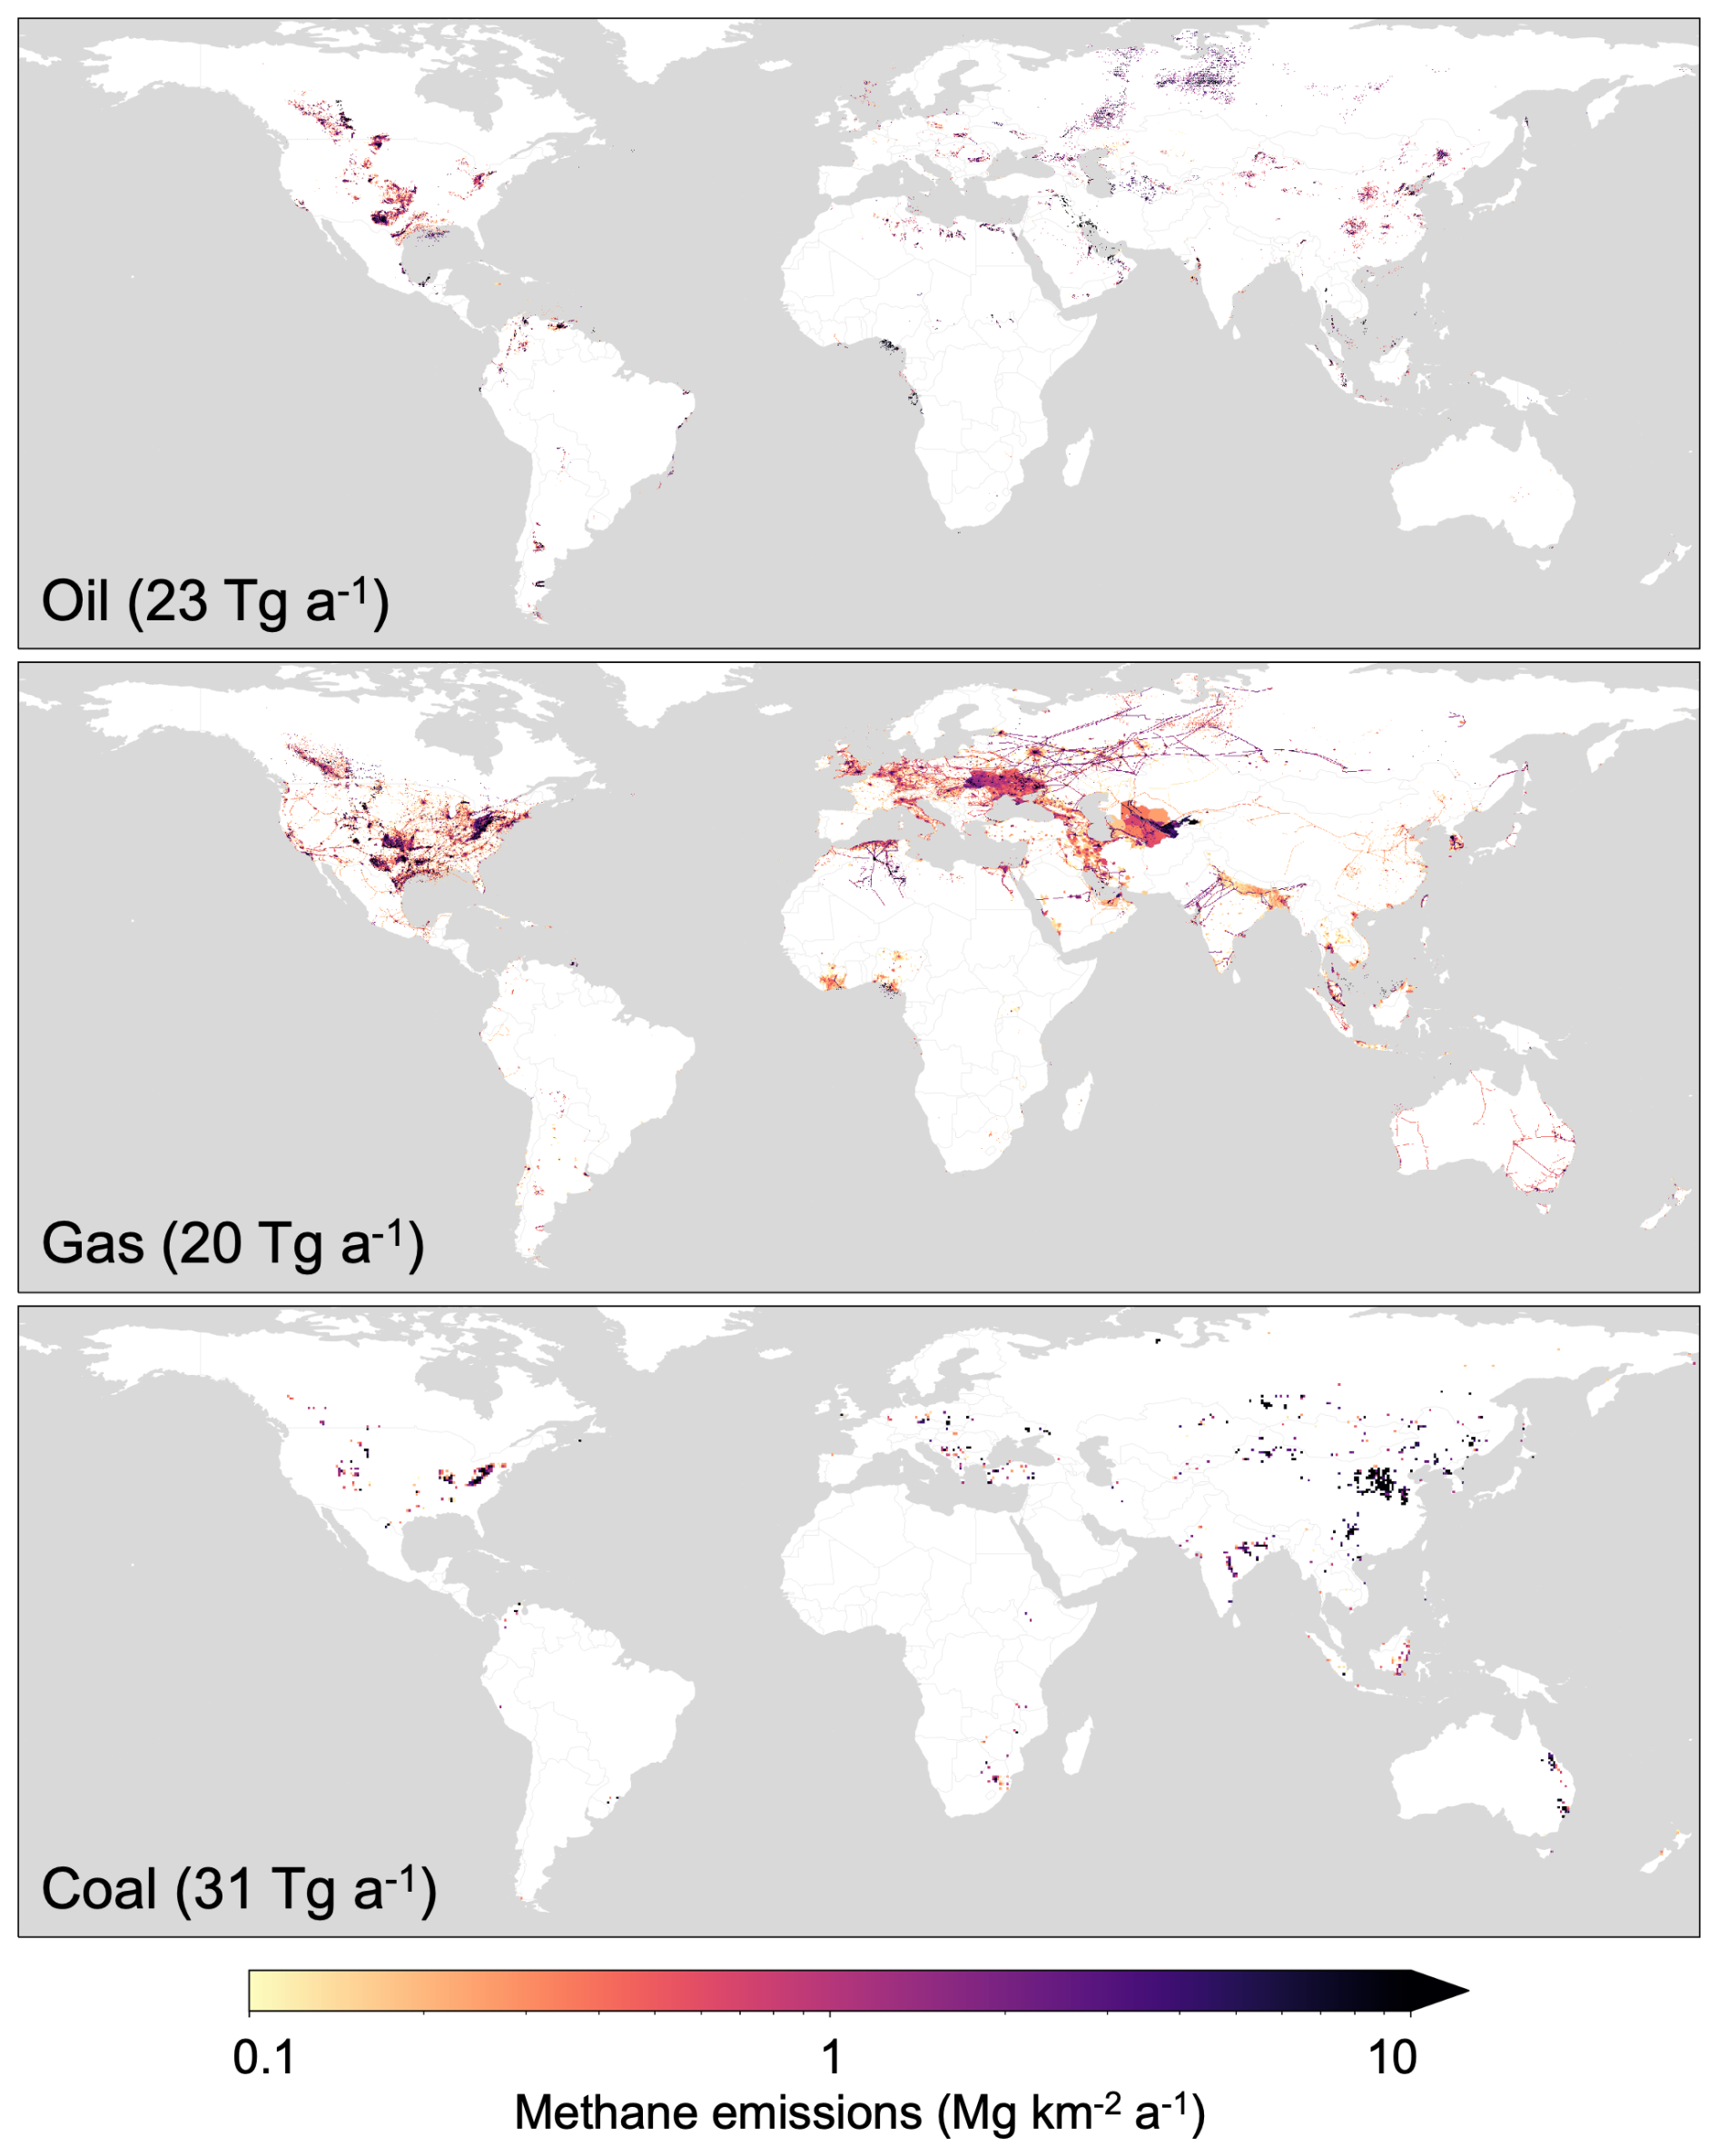
Figure 1GFEI v3 methane emissions from oil, gas, and coal exploitation in 2020. Oil and gas emissions are shown at the native 0.1° × 0.1° resolution whereas coal emissions are shown at 0.5° × 0.5° resolution for visualization. Grid cell emissions below 0.1 Mg km−2 a−1 are not shown. GFEI v3 annual emission totals in 2020 are shown inset for each sector.
Figure 2 shows national emissions by sector for top emitting countries (see Table 1 for emissions from all individual countries emitting more than 10 Gg a−1 from fuel exploitation and accounting collectively for 99.7 % of GFEI emissions). Emissions for most countries are dominated by a single sector, though the US and Russia have large contributions from all sectors. Countries where methane emissions from oil exploitation dominate include Iran and Iraq. China and Poland are coal dominated, and Ukraine and Uzbekistan are gas dominated. When we look at emissions per commodity produced, Côte D'Ivoire stands out as having a high methane emission rate compared to national oil production, whereas the same countries with high coal emissions generally have the highest emissions relative to coal production (see Fig. S1).
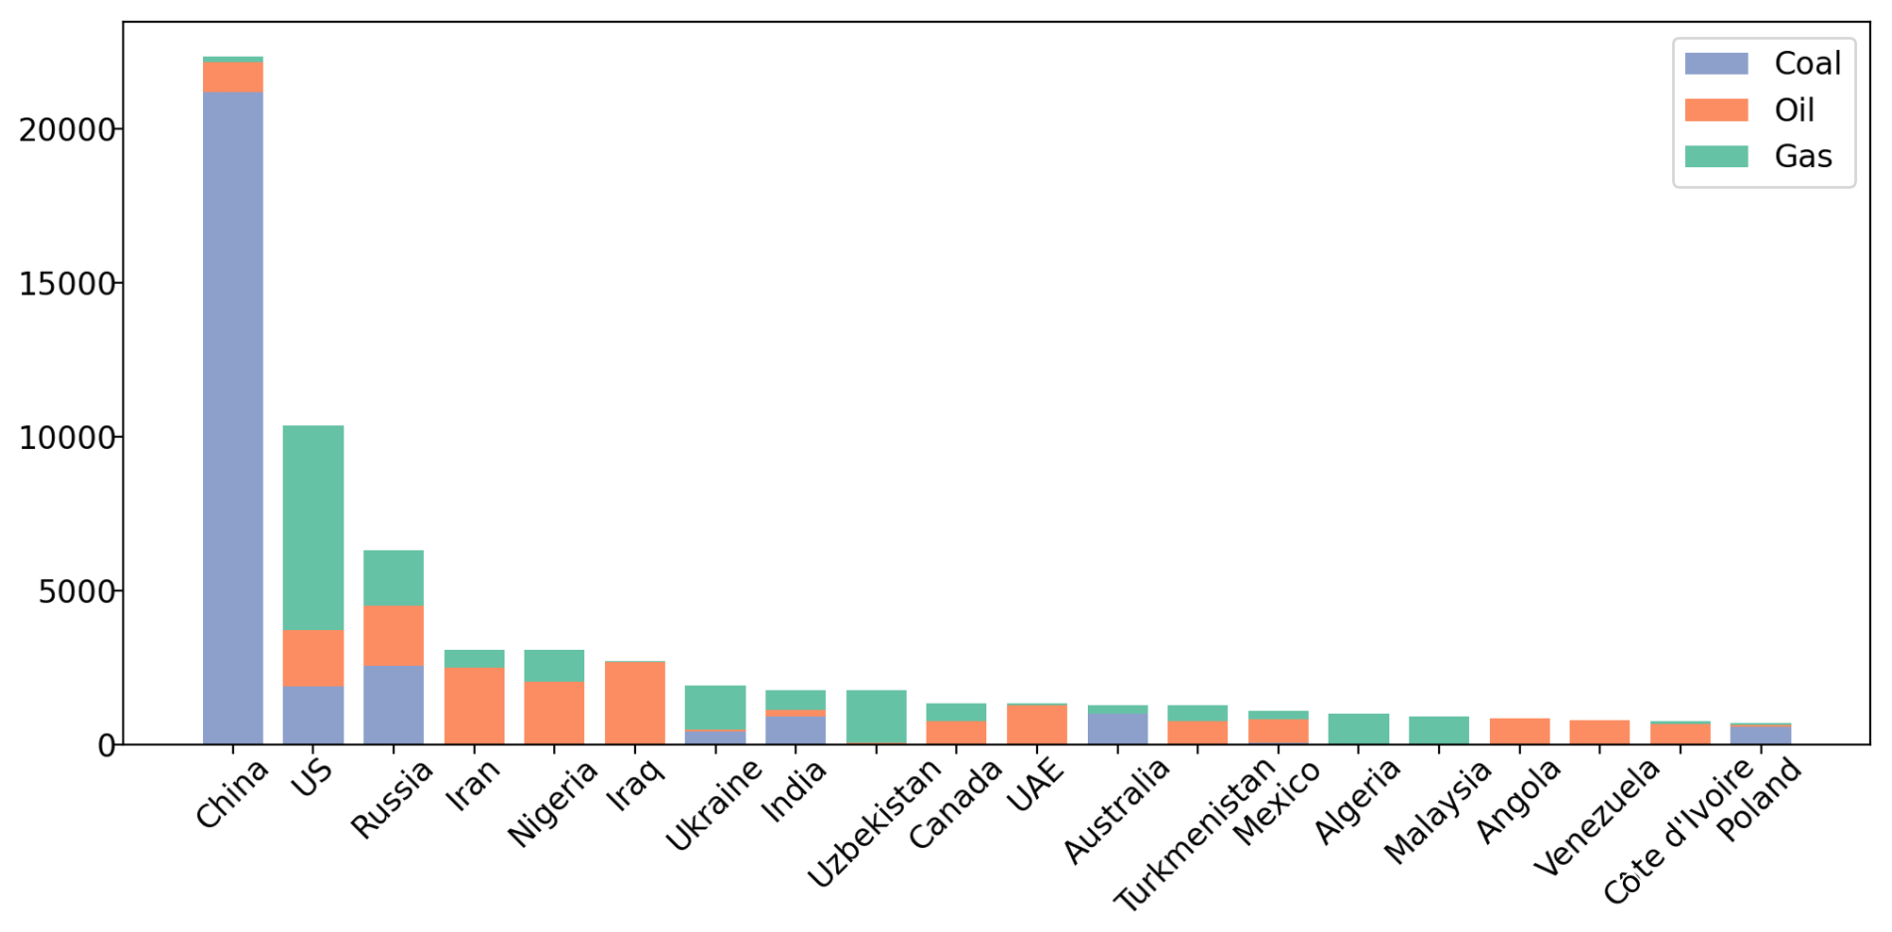
Figure 2National methane emissions in 2020 (Gg a−1) for the highest emitting countries in GFEI v3.
Table 1Country emissions in GFEI v3 for 2020 by sector*.
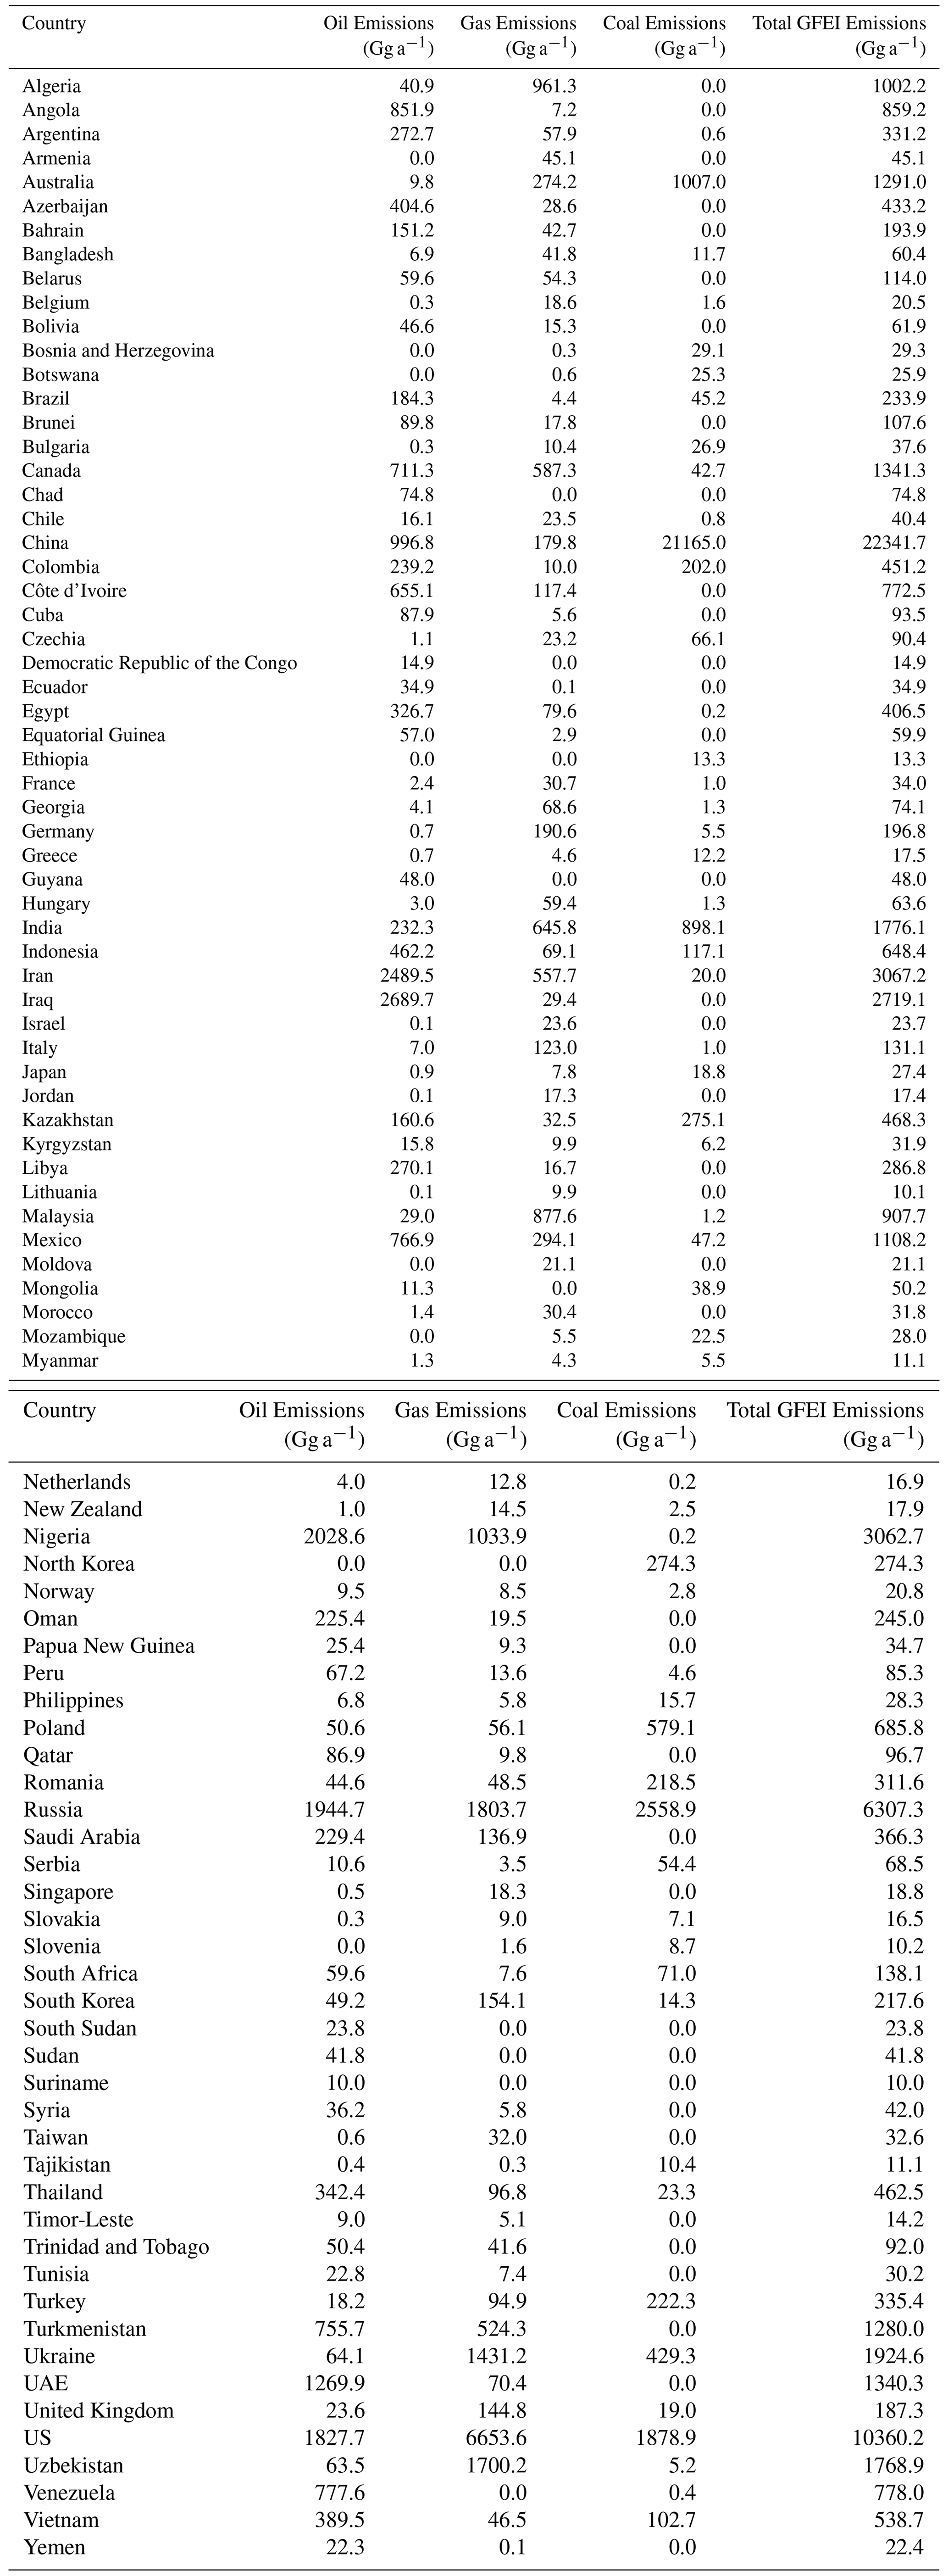
* All countries with national emissions greater than 10.0 Gg a−1 are shown and account for 99.7% of total GFEI emissions. Additional countries are shown in Table S1.
For most top-emitting countries, there are only minor differences between GFEI v3 (2020) and v2 (2019), as shown in Fig. S2. For example, Russia and the US only show a 6 %–12 % change per sector while there is no change (< 1 %) for China's coal emissions. GFEI v3 Coal emissions decrease in the US (12 %) compared to GFEI v2 while we see larger coal emission decreases in Mexico and South Africa (80 %–94 %) due to the use of new reports submitted to the UNFCCC (Government of Mexico, 2022; DFFE, 2021). For South Africa, we did not use submitted reports in GFEI v2 as South Africa data was not available more recently than 1994 via the GHG Data Interface (Scarpelli et al., 2022a), so GFEI v3 emissions are lower than GFEI v2 because we now use the country reported emissions which are lower than default IPCC methods.
GFEI v3 oil emissions decrease in most high-emitting countries (7 %–15 % for US, Russia, Iran, Nigeria, Iraq, and United Arab Emirates) compared to GFEI v2, though Mexico is an exception with national emissions more than doubling. This doubling in Mexico is related to higher venting and flaring emissions, and the increase is partly due to the use of oil and gas venting and flaring emission estimates directly from Mexico's national report (Government of Mexico, 2022) in GFEI v3, whereas in GFEI v2 we disaggregated the venting and flaring emissions using the IPCC methods which allotted a greater fraction of venting and flaring to the gas sector. There are also larger decreases in oil emissions in Venezuela and Libya (40 %–65 %) related to oil production decreases in the EIA data used for GFEI v3 compared to the oil production data used in GFEI v2, and a larger decrease in Oman (64 %) due to the use of a new UNFCCC report (MECA, 2019) compared to GFEI v2. GFEI v3 gas emissions also decrease in most high-emitting countries (7 %–16 % in Uzbekistan, Russia, Malaysia, and Algeria) along with a larger decrease in Saudi Arabia (68 %) compared to GFEI v2.
For all sectors, the combination of small decreases in high-emitting countries and more drastic decreases in mid-level emitting countries results in lower global emissions in GFEI v3 (2020) compared to GFEI v2 (80.4 Tg a−1; 2019) by 2–3 Tg a−1 per sector. This lowering of global emissions does not align with other global inventories (EDGAR, GMT), mentioned previously, that estimate higher fuel exploitation emissions than GFEI v2 and v3. Global inverse modeling studies have also shown higher global oil and gas emissions than GFEI v2 (Shen et al., 2023; Tibrewal et al., 2024), so the general decrease of GFEI v3 compared to v2 does not improve alignment of GFEI with the inverse modeling results. At the country-scale, Shen et al. (2023) found that GFEI v2 underestimated oil and gas emissions in high emitting countries like the US, Russia, Venezuela, and Turkmenistan, so the relatively small changes or large decreases in GFEI v3 compared to v2 are not in line with inversion results. In some cases, the GFEI v3 updates to national emissions related to the use of new information in country reports do align with Shen et al. (2023), like the decrease in South Africa coal emissions and increase in Mexico oil and gas emissions which align.
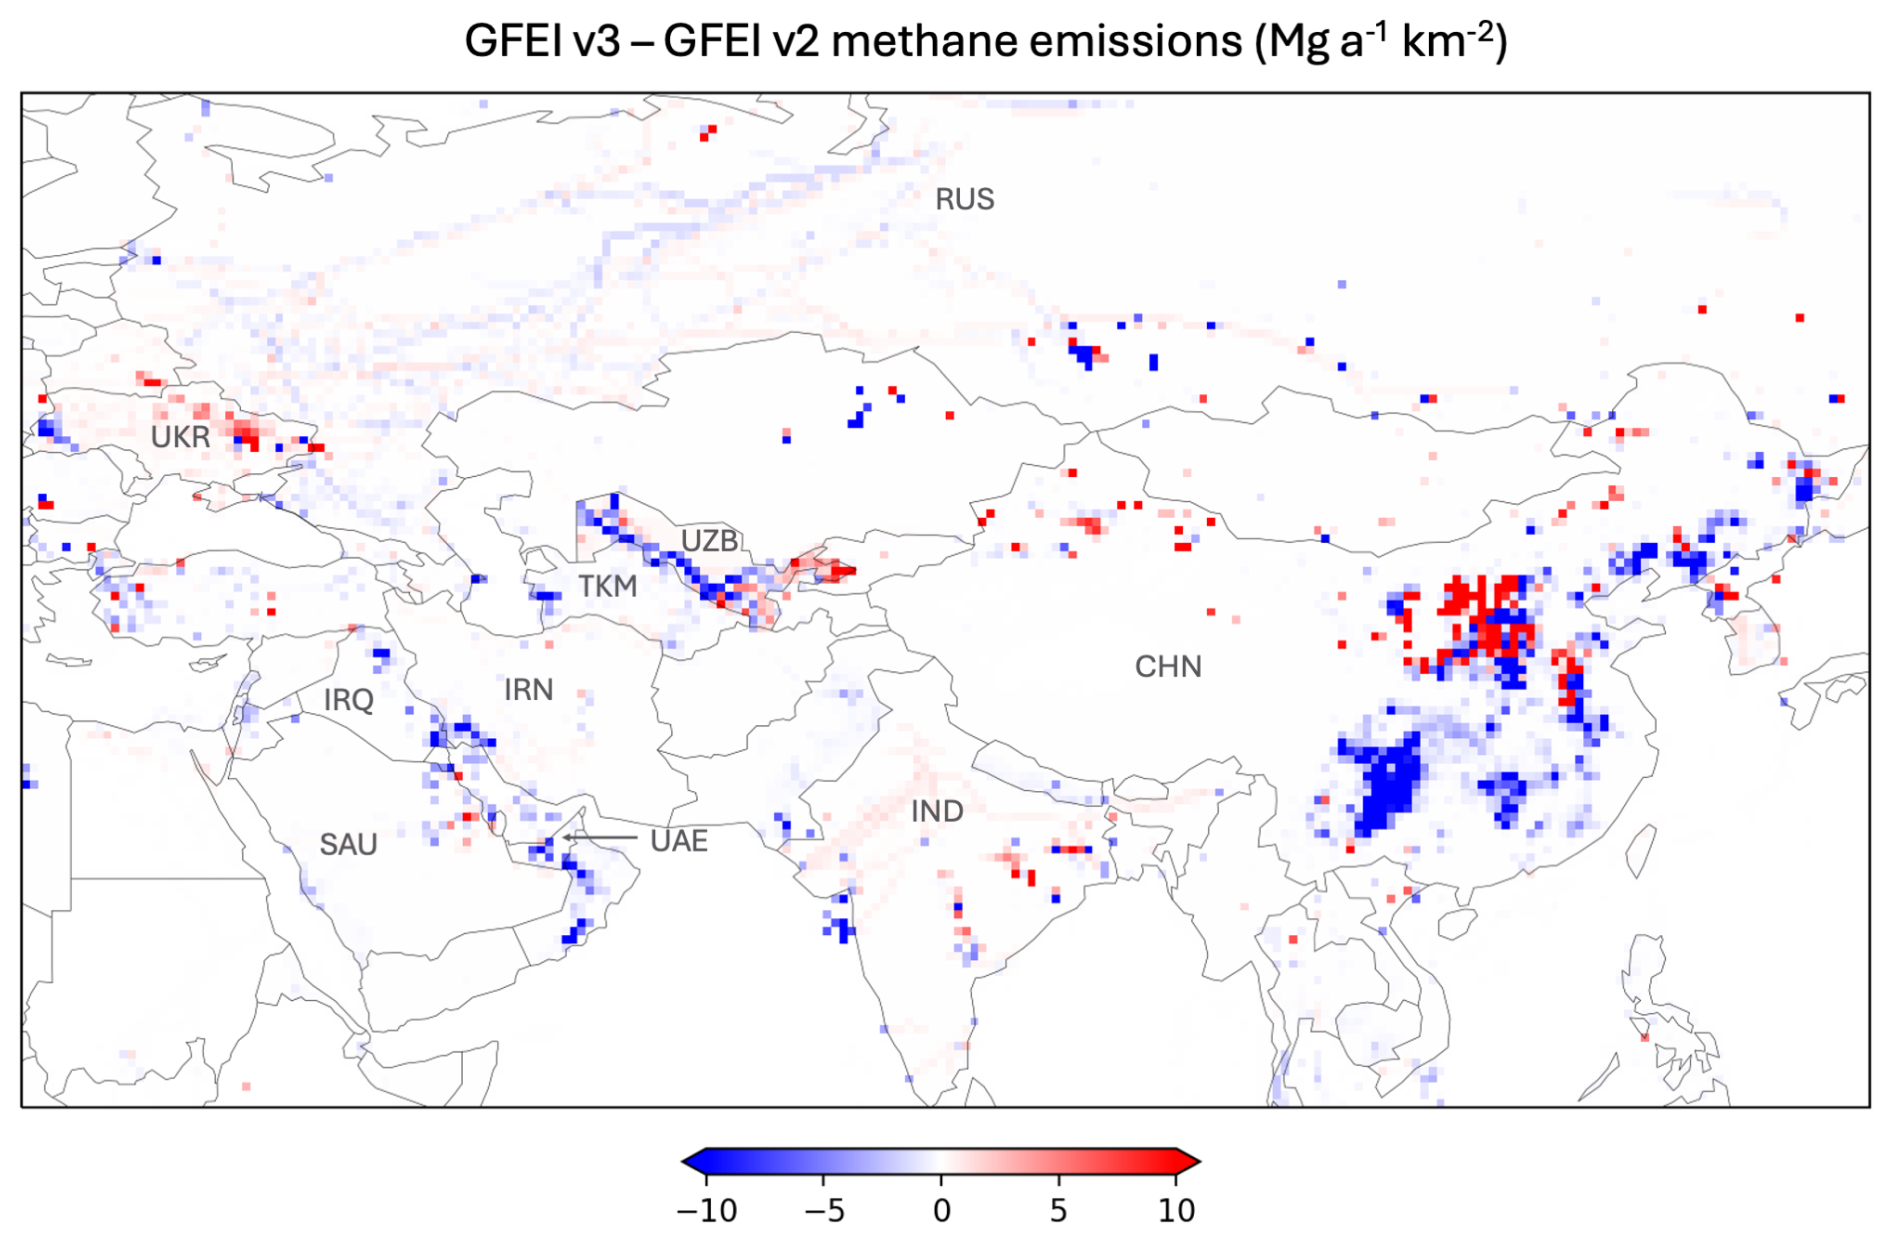
Figure 3Absolute difference in GFEI v3 (2020) and GFEI v2 (2019) gridded emissions (Mg km−2 a−1) for top-emitting countries at 0.5° × 0.5° resolution. We show 10 of the top-emitting countries from Fig. 2, including Russia (RUS), Ukraine (UKR), Uzbekistan (UZB), Turkmenistan (TKM), Iraq (IRQ), Iran (IRN), Saudi Arabia (SAU), the United Arab Emirates (UAE), India (IND), and China (CHN). We coarsen GFEI from native resolution (0.1° × 0.1°) to 0.5° × 0.5° for visualization purposes.
Figure 3 shows the spatial differences between GFEI v3 (2020) and GFEI v2 (2019) emissions for 10 of the top-emitting countries from Fig. 2 in the Asian region accounting for 58 % of global fuel exploitation emissions (see Fig. S2 for this difference globally). We show the GFEI difference at 0.5° × 0.5° resolution for visualization purposes. Changes can be explained both by the update of national emissions and the use of new geospatial data (see Fig. S2 for national and grid level difference maps). Coal emissions in China show a large shift from southern to northern China, reflecting transitions in the coal industry over the past decade that would not be reflected in older mine databases. The largest coal production is now in northern China, with mines that are often deep and of high coal rank conducive to methane emissions (see Appendix). The increase of coal emissions in northeast India is due to spatial differences between GCMT and the EDGAR v6 coal mine distribution that we used in GFEI v2. Despite these spatial changes, China and India do not show significant changes in total GFEI emissions at the national-scale between GFEI v3 and v2, as shown in Fig. S2.
Countries with high oil-gas emissions show a mix of changes. For example, we see a broad decrease in emissions across Iraq and the United Arab Emirates due to decreases in national emissions. For Uzbekistan, Saudi Arabia, and Russia, we see a mix of increases and decreases within each country due to the combination of changes in national emission reports and update to OGIM. For example, in Uzbekistan, an increase in the east and decrease in the west are due to national emission changes for gas distribution and upstream gas, respectively, while isolated increases in west and south-central Uzbekistan are due to spatial differences between the infrastructure in OGIM and the GOGI database used in GFEI v2. Russian emissions decrease overall, but we also see isolated increases in Russia due to new infrastructure locations in OGIM, including pipelines and compressor stations.
Figures 4 and 5 show GFEI v3 emissions compared to a dataset of methane point sources detected by Carbon Mapper (2024) using observations from the NASA EMIT instrument on the international space station (Green et al., 2023; Thorpe et al., 2023). The estimated 90 % probability of detection for EMIT is 1060 kg h−1 for a 3 m s−1 wind speed (Ayasse et al., 2024), and previous studies using EMIT have reported point sources with emission rates as low as 300 kg h−1 (Thorpe et al., 2023). Figure 4 shows oil-gas GFEI emissions (without gas distribution) and oil-gas point sources in Turkmenistan, Uzbekistan, and northern Algeria, while Fig. 5 shows the same for oil-gas and coal in northeast China. Because Carbon Mapper may use GFEI as a guide for prioritizing which EMIT scenes to process, we intentionally chose regions where Carbon Mapper has processed EMIT observations over a majority of the region (Fig. S3). Most detected point sources align with high emissions in GFEI v3. These regions generally have dense infrastructure, like along the Turkmenistan-Uzbekistan border, which, in addition to high national emissions, leads to the high GFEI emissions in these regions. Naus et al. (2023) found a similar overlap of super-emitter detections and GFEI v2 hotspots in northern Algeria using the Sentinel-2 satellite. They find that the density of super-emitter detections varies by region in Algeria with more detections in oil production regions due to unlit flares, and we see a similar pattern in Fig. 4 with more super-emitters in the north-east compared to north-central Algeria.

Figure 4Comparison of the spatial distribution of GFEI v3 emissions to observed oil-gas super-emitters (large point sources) in Turkmenistan/Uzbekistan (left) and Algeria (right) on the GFEI 0.1° × 0.1° grid. The top row shows locations of oil-gas super-emitting events detected by Carbon Mapper (red triangles; 2024) overlaid on GFEI v3 oil-gas gridded emissions (blue), not including gas distribution. The Carbon Mapper data uses observations from the NASA EMIT instrument on the International Space Station. The bottom row shows the geospatial information on oil-gas infrastructure used to distribute GFEI v3 oil-gas emissions, including well data from Enverus in Algeria, well data from Rose (2017) in Turkmenistan/Uzbekistan, and midstream infrastructure in OGIM (refineries in magenta, processing plants in blue, stations in green, and pipelines as grey lines).
For oil-gas in northern China (Fig. 5), most of the detected super-emitters align with GFEI but at low-emission grid cells with low infrastructure density. This overlap of super-emitters with low emission grid cells in GFEI may be due to an underestimate of emissions in these regions in GFEI. The underestimate may be caused by our conservative approach of allocating emissions to pipelines in regions where OGIM is missing data or by outdated well information in Rose (2017), as used for oil-gas wells in China. It is also possible that our use of well density to allocate upstream emissions, rather than other activity metrics like oil and gas production, is leading to a regional underestimate. We note that flaring detections in OGIM, not used in GFEI v3, do show a high density of flare detections in the same region as the Carbon Mapper detected super-emitters.
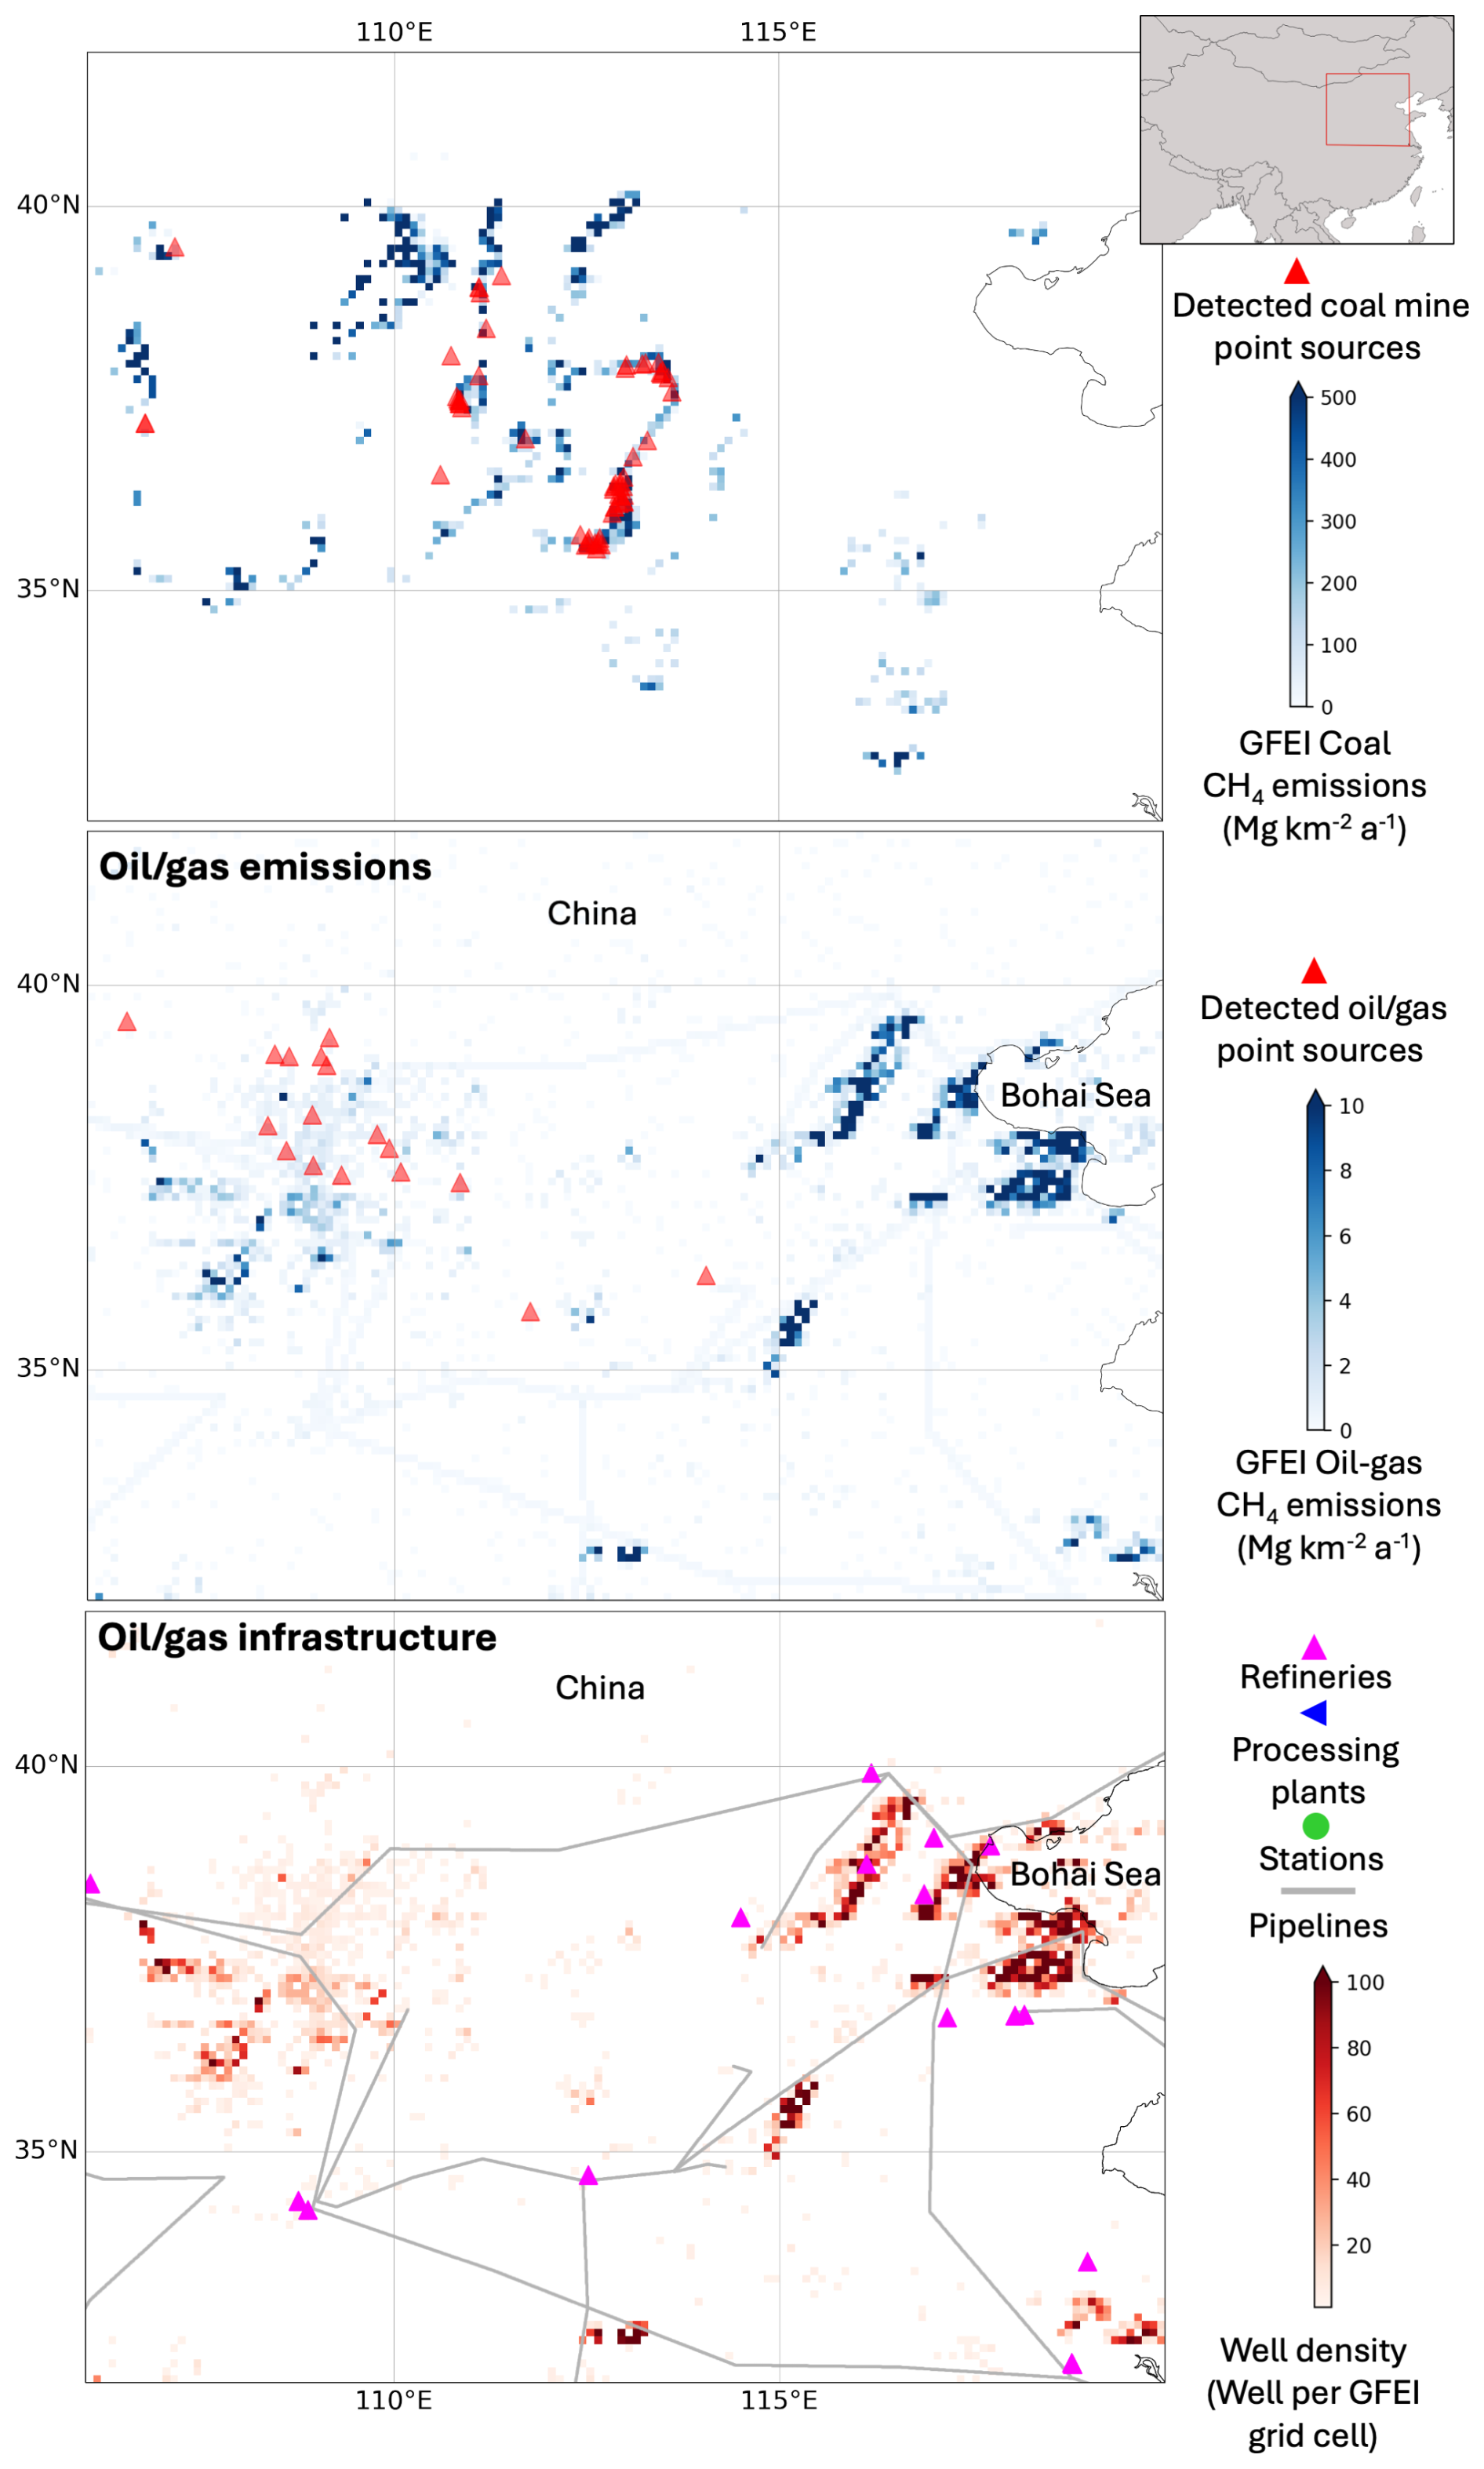
Figure 5Same as Fig. 4 but for coal and oil/gas in Northeast China. Zoomed out map provided inset with red box showing map borders.
Past inverse modeling studies have suggested that underestimates in UNFCCC-reported emissions compared to satellite observations are because the national inventories do not account for super-emitter events (e.g., Deng et al., 2022; Tibrewal et al., 2024). When we compare the UNFCCC emissions as represented in GFEI v3 to the source emission rates produced by Carbon Mapper using EMIT we find that GFEI v3 and EMIT sources are generally not correlated on the 0.1° × 0.1° grid but also show no obvious bias (Fig. S4), indicating the large point sources may be represented in GFEI but not in the correct location. The lack of grid-scale correlation is not surprising given the conservative gridding approach taken for GFEI (using pipelines in place of missing infrastructure), mentioned previously, which may introduce uncertainty, and because GFEI is meant to describe annual average emissions per grid cell, whereas many super-emitters are related to short-duration or extreme events that may occur at differing facilities throughout the year. As more observations of super-emitters are made over time using instruments with higher detection limits, we would expect that average source emission rates, incorporating null detects (i.e., when a source is observed but no emission is detected), may better reflect annual average emissions. For example, we see a slight improvement when comparing GFEI to Carbon Mapper source emission rates using airborne data, mostly in the US, which is not surprising given the use of GEPA in the US (with more accurate geospatial data) and the lower detection limits of aircraft instruments compared to the EMIT instrument. If we assume that the super-emitters dominate emissions within their respective 0.1° × 0.1° grid-cells (compared to sources with emissions too small or diffuse to detect), this implies that the high-density infrastructure regions in GFEI may be capturing the population statistics for super-emitters (Fig. S4), though not their spatial distribution at the native 0.1° × 0.1° resolution. Use of point source observations to quantify time-averaged emissions will require statistical characterization of their transient nature through repeated overpasses (Cusworth et al., 2022), and GFEI can provide a basis for these sampling strategies.
GFEI v3 emission grids are available for oil-gas subsectors and for coal at https://doi.org/10.7910/DVN/HH4EUM (Scarpelli et al., 2024). Emission grids are available for 2020 and for previous years 2010–2019. Uncertainty estimates by subsector are as in Scarpelli et al. (2020a).
We present an updated version of the Global Fuel Exploitation Inventory (GFEI v3) to quantify annual methane emissions from oil, gas, and coal with 0.1° × 0.1° subsector resolution for use in inversions of atmospheric methane observations. GFEI v3 includes new spatial information from OGIM (Omara et al., 2023) for oil-gas infrastructure, GCMT (Global Energy Monitor, 2023) and a new bottom-up inventory method (Appendix A) for coal mines, GEPA v2 (Maasakkers et al., 2023) for US oil-gas and coal infrastructure, and updated national emissions for 2020 as reported to the UNFCCC. For coal, we use a bottom-up model to generate our own mine-specific emissions for each mine in the GCMT, and we use these mine-specific emissions to allocate the national emissions reported to the UNFCCC within each country. For oil-gas, we update oil-gas infrastructure locations to OGIM which includes major changes to the infrastructure in Russia where we now have more compressor station information.
We find significant changes to the spatial allocation of emissions in GFEI v3 compared to v2 in some high-emitting countries, including more regionally localized coal emissions in China and localized increases in Russia and Uzbekistan where new infrastructure information is available via OGIM. As GFEI v3 global emissions decrease compared to GFEI v2, GFEI estimated emissions remain lower than other global inventories (Crippa et al., 2024; IEA, 2025) and inverse modeling results (Shen et al., 2023; Tibrewal et al., 2024).
We find that the spatial distribution of emissions in GFEI v3 aligns well with detected super-emitters using the NASA EMIT instrument. The regions of highest emission in GFEI v3 align with coal super-emitters in China and oil-gas super-emitters in Turkmenistan, Uzbekistan, and Algeria. The detected oil-gas super-emitters in China align with GFEI emissions but not with the highest emission regions, possibly due to missing infrastructure in parts of China.
As countries desire to improve the accuracy of their emission inventories, in line with the Global Methane Pledge, the use of satellite observations to guide and verify improvements in national emission inventories will be a useful tool. This includes the use of inverse modeling to guide national emissions, and the detection of high-emitting point sources to guide facility- and sector-specific emission factor improvements. As a spatial representation of UNFCCC reports, GFEI enables inversions of satellite and other observations of atmospheric methane to evaluate and improve these reports, and it provides a national context for detected super-emitters from point source imaging instruments. In order to assist in linking satellite data to the most recent UNFCCC reporting, GFEI will be updated regularly to include new UNFCCC emissions and made available at https://carbonmapper.org (last access: 21 November 2025), though the spatial distribution will only be updated in response to major updates to geospatial datasets.
We estimate mine-level methane emissions for coal mines in each country to distribute the national UNFCCC emissions on the 0.1° × 0.1° GFEI v3 grid. Complete details are in Roy (2023) and mine-level methane emissions are provided in Table S2. We estimate emissions for each IPCC subsector including surface mining, underground mining, and post-mining emissions. We do not estimate abandoned mine emissions except in the US (described below). We do not extend estimates outside the US for abandoned mines because of the lack of spatial data and flooded status at the global-scale at the time of GFEI v3 creation, as noted by Roy (2023). As mine databases become more complete, we will look to update this feature in future versions of GFEI. To produce our emission estimates, we combine information in the scientific literature with mine-specific data from the Global Energy Monitor's Global Coal Mine Tracker (GCMT) including mine location, mine type (underground or surface), annual production, coal grade (lignite, subbituminous, bituminous, anthracite), and the depth of the mine.
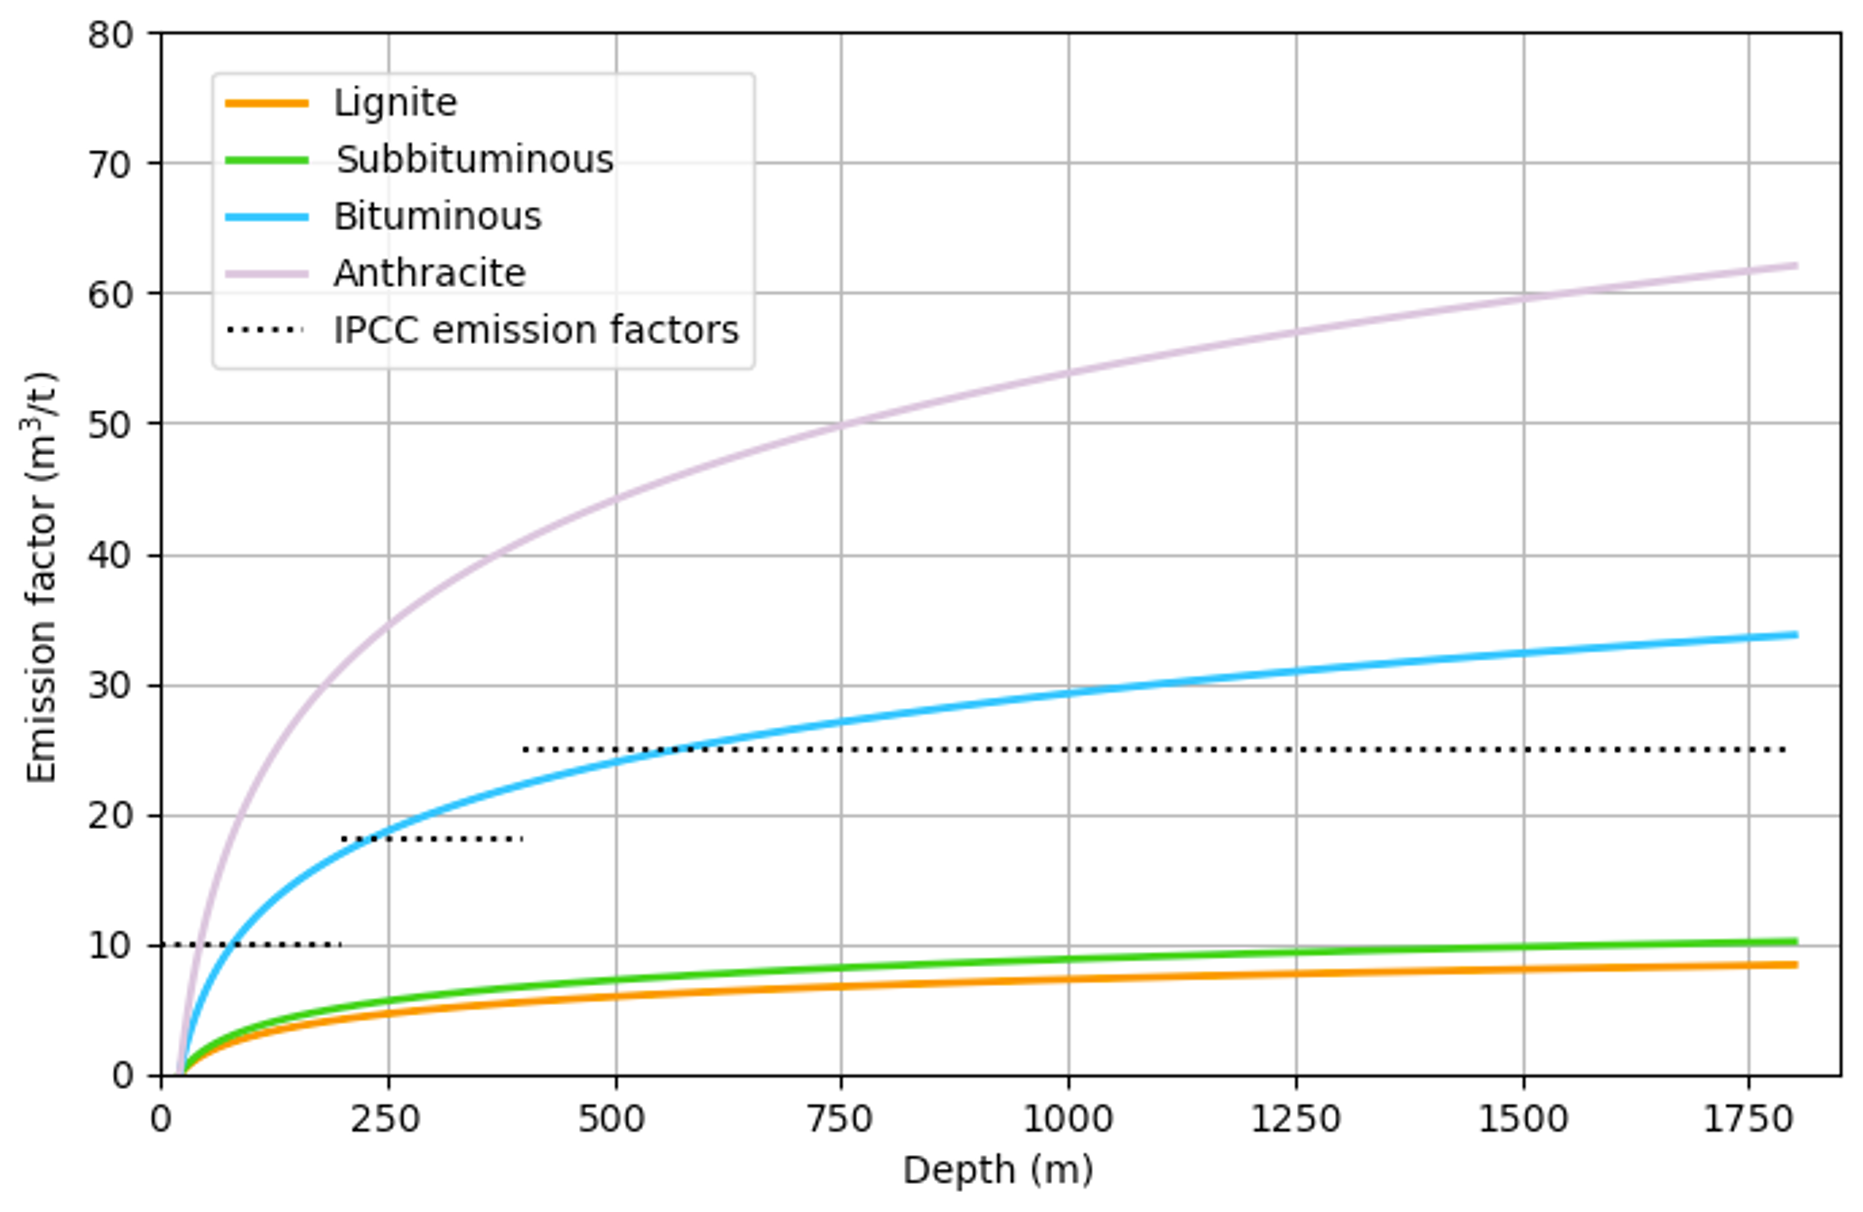
Figure A1Methane emission factors per unit coal production for active underground coal mines as a function of mine depth and for different coal grades. IPCC (2006) emission factors applicable to specific mine depth ranges are shown as horizontal dotted lines (the IPCC does not provide coal grade-specific emission factors). Units for emission factors are m3 methane emitted per ton of coal mined.
To estimate mine-level methane emissions, we combine coal mine emission factors, described below, with mine production data from the GCMT. We estimate emissions at the mine-level for the 2654 operating coal mines in the GCMT (removing shelved, proposed, canceled, and closed mines). The methane emission rate for a given mine is computed by multiplying annual coal production by the emission factor (in units of m3 methane emitted per ton of coal mined) and converting methane volume to mass (0.67 × 10⁻⁶ Gg methane per m3 methane).
We use emission factors specific to each coal subsector. For active surface mining and post-mining emission factors, we use constant values rather than a model, unless we find country-specific emission factors as discussed below. For the active surface mine emission factor, we investigated the range of depths in the GCMT database and find that most surface mines are more than 50 m deep which corresponds to a 2 m3 t−1 emission factor by IPCC (2006) guidelines, so we simply use this value for all surface mines. For post-mining emission factors, we use the average IPCC (2006) emission factor for surface (0.1 m3 t−1) and underground (2.5 m3 t−1) post-mining emissions.
For active underground mining, we develop a model to compute the methane emission factor for each mine based on coal grade mined and mine depth (Fig. A1). Measurements have shown that the in-situ gas content of coal increases logarithmically with mine depth (e.g., Durucan et al., 2022; Kiryaeva, 2012), so we logarithmically interpolate emission factors from the IPCC guidelines for different mine depths. We use the IPCC emission factors for various coal depth ranges: 27 (shallowest) to 200 m, 200 to 400 m, 400 to 1780 m (deepest). The IPCC emission factor is assigned to the median mine depth within the range, and we assign the highest surface mine emission factor (2 m3 t−1) to the shallowest underground mine depths (< 28 m). The resulting logarithmic fit describes the bituminous coal emission factor (EF) as a function of mine depth (d):
We apply scaling factors to Eq. (A1) for other coal grades based on the ratios between emission factors for different coal grades reported in Kholod et al. (2020). The scaling factors are 1.84, 0.30, and 0.25 for the anthracite, subbituminous, and lignite coal, respectively.
For the top 11 coal-producing countries (China, India, Indonesia, the US, Australia, Russia, South Africa, Germany, Poland, Kazakhstan, Turkey, and Ukraine), we use country- or basin-specific emission factors, when available, rather than the methods described above. We first look for emission factors based on measurements at specific mines within the country, and if those are not available, we use measurements for a specific coal basin within the country. The emission factors are based on additional information from national reports, feasibility studies, and research papers. Methane emission reductions from coal mine methane recovery are included for Poland, Kazakhstan, Russia, and China (Roy, 2023), and in the US through the GEPA v2 (Maasakkers et al., 2023).
When available, we also use existing national gridded inventories (Maasakkers et al., 2023; Sheng et al., 2019) or sub-national mine studies (Ju et al., 2016) to estimate mine-specific emission factors. We use the gridded inventories to estimate emission factors and then apply those emission factors to mines in the GCMT rather than using the gridded inventories directly in GFEI v3, because the GCMT database is more complete. For example, Sheng et al. (2019) created a methane emission inventory for coal in China, as used in GFEI v2, but we only use their province-specific emission factors for low and high-methane content mines and apply these to the relevant GCMT mines. We use mine-specific emission factors from Ju et al. (2016) for 9 mines in China rather than the provincial emission factors from Sheng et al. (2019). The US is one exception where we do use the national gridded inventory (Maasakkers et al., 2023) directly in GFEI v3.
The supplement related to this article is available online at https://doi.org/10.5194/essd-17-7019-2025-supplement.
TRS and ER created the inventory and performed the analysis with support from MPS. DJJ conceptualized and secured funding for the project. RDT and DHC provided datasets and feedback on interpretation. TRS prepared the manuscript with contributions from all co-authors.
The contact author has declared that none of the authors has any competing interests.
Publisher’s note: Copernicus Publications remains neutral with regard to jurisdictional claims made in the text, published maps, institutional affiliations, or any other geographical representation in this paper. While Copernicus Publications makes every effort to include appropriate place names, the final responsibility lies with the authors. Views expressed in the text are those of the authors and do not necessarily reflect the views of the publisher.
The authors would like to thank the anonymous reviewers who reviewed a draft version of this manuscript prior to journal submission.
Work at Harvard was supported by the Global Methane Hub and by UNEP's International Methane Emissions Observatory (IMEO).
This paper was edited by Graciela Raga and reviewed by three anonymous referees.
Ayasse, A., Cusworth, D. H., Howell, K., O'Neill, K., Conrad, B. M., Johnson, M. R., Asner, G. P., and Duren, R.: Probability of Detection and Multi-Sensor Persistence of Methane Emissions from Coincident Airborne and Satellite Observations, Environmental Science & Technology, 58, 21536–21544, https://doi.org/10.1021/acs.est.4c06702, 2024.
BEIS: UK National Atmospheric Emissions Inventory, Department for Business, Energy and Industrial Strategy, Crown copyright 2024 under the Open Government Licence (OGL), https://naei.beis.gov.uk/emissionsapp/, last access: 16 April 2024.
Carbon Mapper: Carbon Mapper Data Portal, https://data.carbonmapper.org, last access: 20 May 2024.
Center for International Earth Science Information Network – CIESIN – Columbia University: Gridded Population of the World, Version 4 (GPWv4), Population Count Adjusted to Match 2015 Revision of UN WPP Country Totals, Revision 11, NASA Socioeconomic Data and Applications Center (SEDAC) [data set], https://doi.org/10.7927/H4PN93PB, 2018.
Crippa, M., Guizzardi, D., Pagani, F., Banja, M., Muntean, M., Schaaf, E., Monforti-Ferrario, F., Becker, W., Quadrelli, R., Risquez Martin, A., Taghavi-Moharamli, P., Köykkä, J., Grassi, G., Rossi, S., Melo, J., Oom, D., Branco, A., San-Miguel, J., Manca, G., Pisoni, E., Vignati, E., and Pekar, F.: GHG emissions of all world countries, Publications Office of the European Union, Luxembourg, https://doi.org/10.2760/4002897, 2024.
Cusworth, D. H., Thorpe, A. K., Ayasse, A. K., Stepp, D., Heckler, J., Asner, G. P., Miller, C. E., Yadav, V., Chapman, J. W., Eastwood, M. L.. Green, R. O., Hmiel, B., Lyon, D. R. and R. M. Duren: Strong methane point sources contribute a disproportionate fraction of total emissions across multiple basins in the United States, Proc. Natl. Acad. Sci. U.S.A., 119, 38, e2202338119, https://doi.org/10.1073/pnas.2202338119, 2022.
EDGAR: Greenhouse Gas Emissions: EDGAR v6.0, European Commission, Joint Research Centre (JRC), https://edgar.jrc.ec.europa.eu/dataset_ghg60, last access: 22 May 2024.
EDGAR: Community GHG Database: EDGAR_2024_GHG, European Commission, Joint Research Centre (JRC), https://edgar.jrc.ec.europa.eu/report_2024, last access: 30 May 2025.
Deng, Z., Ciais, P., Tzompa-Sosa, Z. A., Saunois, M., Qiu, C., Tan, C., Sun, T., Ke, P., Cui, Y., Tanaka, K., Lin, X., Thompson, R. L., Tian, H., Yao, Y., Huang, Y., Lauerwald, R., Jain, A. K., Xu, X., Bastos, A., Sitch, S., Palmer, P. I., Lauvaux, T., d'Aspremont, A., Giron, C., Benoit, A., Poulter, B., Chang, J., Petrescu, A. M. R., Davis, S. J., Liu, Z., Grassi, G., Albergel, C., Tubiello, F. N., Perugini, L., Peters, W., and Chevallier, F.: Comparing national greenhouse gas budgets reported in UNFCCC inventories against atmospheric inversions, Earth Syst. Sci. Data, 14, 1639–1675, https://doi.org/10.5194/essd-14-1639-2022, 2022.
DFFE: National GHG Inventory Report: South Africa, 2017, Department of Forestry, Fisheries, and the Environment (DFFE), https://unfccc.int/sites/default/files/resource/South%20Africa%20%20NIR%202017.pdf (last access: 23 October 2023), 2021.
Durucan, S., Korre, A., and Nie, D. Z.: Coal Mine Methane Emissions: Sources, Mitigation, Potential, Monitoring and Emissions Quantification. Imperial College London Consultants, IMEO Commissioned, Report 4, 79 pp., https://www.unep.org/resources/other-evaluation-reportsdocuments/coal-mine-methane-science-studies-road-map (last access: 1 October 2023), 2022.
EIA: U.S. Energy Information Administration: International Energy Statistics, https://www.eia.gov/international/data/world, last access: 1 May 2023.
Enverus: Enverus International, http://drillinginfo.com/, last access: 1 November 2023.
FAQ: Moving Towards the Enhanced Transparency Framework, https://unfccc.int/FAQ-moving-towards-the-ETF#__Reporting-of-Greenhouse-Gas-Inventories-in-the-Enhanced-Transparency-Framework, last access: 16 April 2024.
GMP: Global Methane Pledge, https://www.globalmethanepledge.org/resources/global-methane-pledge, last access: 22 November 2023.
Global Energy Monitor (GEM): Global Coal Mine Tracker (GCMT), https://globalenergymonitor.org/projects/global-coal-mine-tracker/, last access: 1 May 2023.
Government of Mexico: National Inventory of Greenhouse Gase and Compound Emissions, 1990–2019, Secretariat of Environment and Natural Resources and National Institute of Ecology and Climate Change, https://unfccc.int/sites/default/files/resource/InventarioGEI_Mexico_1990_2019.pdf (last access: 18 May 2023), 2022.
Green, R.O., Mahowald, N., Thompson, D.R., Ung, C., Brodrick, P. , Pollock, R., Bennett, M., Lundeen, S., Joyce, M., Olson-Duvall, W., Oaida, B., Bradley, C., Diaz, E., Clark, R., Vannan, S., Swayze, G., Kokaly, R., Ginoux, P., Miller, R., Okin, G., Garcia-Pando, C. P., Ehlmann, B., Kalashnikova, O., Painter, T. H., Realmuto, V., Chadwick, D., Ben-Dor, E., Pearlshtien, D. H., Guanter, L., Phillips, B., Reath, K., Thorpe, A., Shaw, L., Keebler, A., Ochoa, F., Grant, K., Sen, A., Duren, R., Obiso, V., Gonçalves-Ageitos, M., and Y. Huang: Performance and early results from the Earth Surface Mineral Dust Source Investigation (EMIT) imaging spectroscopy mission, IEEE Aerospace Conference, 10 pp., https://doi.org/10.1109/AERO55745.2023.10115851, 2023.
Hiller, R. V., Bretscher, D., DelSontro, T., Diem, T., Eugster, W., Henneberger, R., Hobi, S., Hodson, E., Imer, D., Kreuzer, M., Künzle, T., Merbold, L., Niklaus, P. A., Rihm, B., Schellenberger, A., Schroth, M. H., Schubert, C. J., Siegrist, H., Stieger, J., Buchmann, N., and Brunner, D.: Anthropogenic and natural methane fluxes in Switzerland synthesized within a spatially explicit inventory, Biogeosciences, 11, 1941–1959, https://doi.org/10.5194/bg-11-1941-2014, 2014.
IEA: The Imperative of Cutting Methane from Fossil Fuels, International Energy Agency (IEA) Publications, https://www.globalmethanepledge.org/sites/default/files/documents/2023-11/The%20imperative%20of%20cutting%20methane%20from%20fossil%20fuels.pdf (last access: 30 August 2024), September 2023.
IEA: Global Methane Tracker 2025, IEA, Paris, https://www.iea.org/reports/global-methane-tracker-2025 (last access: 30 May 2025), 2025.
IPCC: 2006 IPCC Guidelines for National Greenhouse Gas Inventories, Prepared by the National Greenhouse Gas Inventories Programme, edited by: Eggleston, H. S., Buendia, L., Miwa, K., Ngara, T., and, Tanabe, K., IGES, Japan, https://www.ipcc-nggip.iges.or.jp/public/2006gl/, (last access: 30 May 2025), 2006.
IPCC: 2019 Refinement to the 2006 IPCC Guidelines for National Greenhouse Gas Inventories, edited by: Calvo Buendia, E., Tanabe, K., Kranjc, A., Baasansuren, J., Fukuda, M., Ngarize, S., Osako, A., Pyrozhenko, Y., Shermanau, P., and Federici, S., IPCC, Switzerland, https://www.ipcc-nggip.iges.or.jp/public/2019rf/index.html (last access: 30 May 2025), 2019.
Jacob, D. J., Turner, A. J., Maasakkers, J. D., Sheng, J., Sun, K., Liu, X., Chance, K., Aben, I., McKeever, J., and Frankenberg, C.: Satellite observations of atmospheric methane and their value for quantifying methane emissions, Atmos. Chem. Phys., 16, 14371–14396, https://doi.org/10.5194/acp-16-14371-2016, 2016.
Jacob, D. J., Varon, D. J., Cusworth, D. H., Dennison, P. E., Frankenberg, C., Gautam, R., Guanter, L., Kelley, J., McKeever, J., Ott, L. E., Poulter, B., Qu, Z., Thorpe, A. K., Worden, J. R., and Duren, R. M.: Quantifying methane emissions from the global scale down to point sources using satellite observations of atmospheric methane, Atmos. Chem. Phys., 22, 9617–9646, https://doi.org/10.5194/acp-22-9617-2022, 2022.
Ju, Y., Sun, Y., Sa, Z., Pan, J., Wang, J., Hou, Q., Li, Q., Yan, Z., and Liu, J.: A new approach to estimate fugitive methane emissions from coal mining in China, Science of the Total Environment, 543, 514–523, https://doi.org/10.1016/j.scitotenv.2015.11.024, 2016.
Kiryaeva, T. A.: Evaluation of methane resources in Kuzbass in the context of new ideas on methane occurrence in coal beds, Journal of Mining Science, 48, 825–831, https://doi.org/10.1134/S1062739148050073, 2012.
Kholod, N., Evans, M., Pilcher, R. C., Roshchanka, V., Ruiz, F., Coté, M., and Collings, R.: Global methane emissions from coal mining to continue growing even with declining coal production, Journal of Cleaner Production, 256, 120489, https://doi.org/10.1016/j.jclepro.2020.120489, 2020.
Maasakkers, J. D., McDuffie, E. E., Sulprizio, M. P., Chen, C., Schultz, M., Brunelle, L., Thrush, R., Steller, J., Sherry, C., Jacob, D. J., Jeong, S., Irving, B., and Weitz, M.: A Gridded Inventory of Annual 2012–2018 U.S. Anthropogenic Methane Emissions, Environmental Science & Technology, 57, 16276–16288, https://doi.org/10.1021/acs.est.3c05138, 2023.
MECA: Second National Communication, Sultanate of Oman, Ministry of Environment and Climate Affairs (MECA), https://unfccc.int/sites/default/files/resource/Oman%202nd%20National%20Communication%20%2817%20November%202019%29%20-%20Final.pdf (last access: 21 November 2025), 2019.
Methane Emission Control Action Plan, Ministry of Ecology and Environment, https://www.mee.gov.cn/xxgk2018/xxgk/xxgk03/202311/t20231107_1055437.html (last access: 1 August 2024), 2023.
Naus, S., Maasakkers, J. D., Gautam, R., Omara, M., Stikker, R., Veenstra, A. K., Nathan, B.,Irakulis-Loitxate, I., Guanter, L., Pandey, S., Girard, M., Lorente, A., Borsdorff, T., and Aben, I.: Environmental Science & Technology, 57, 19545–19556, https://doi.org/10.1021/acs.est.3c04746, 2023.
Omara, M., Gautam, R., O'Brien, M. A., Himmelberger, A., Franco, A., Meisenhelder, K., Hauser, G., Lyon, D. R., Chulakadabba, A., Miller, C. C., Franklin, J., Wofsy, S. C., and Hamburg, S. P.: Developing a spatially explicit global oil and gas infrastructure database for characterizing methane emission sources at high resolution, Earth Syst. Sci. Data, 15, 3761–3790, https://doi.org/10.5194/essd-15-3761-2023, 2023.
Paris Agreement: United Nations Treaty Collection, Chapter XXVII 7.d., https://treaties.un.org/doc/Treaties/2016/02/20160215%2006-03%20PM/Ch_XXVII-7-d.pdf (last access: 30 May 2025), 12 December 2015.
Rose, K. K.: Signatures in the Subsurface – Big & Small Data Approaches for the Spatio-Temporal Analysis of Geologic Properties & Uncertainty Reduction, Oregon State University, PhD thesis, https://ir.library.oregonstate.edu/concern/graduate_thesis_or_dissertations/2j62s975z (last access: 1 January 2022), 2017.
Roy, E.: Building a global bottom-up coal mine methane inventory at facility-scale, ETH Zurich, Master's thesis, https://drive.google.com/file/d/19m67XgwsYyJpCcirYqMG8wyW7KbIxTbS/view?usp=drive_link (last access: 1 March 2023), 2023.
Sabbatino, M., Romeo, L., Baker, V., Bauer, J., Barkhurst, A., Bean, A., DiGiulio, J., Jones, K., Jones, T. J., Justman, D., Miller III, R., Rose, K., and Tong, A.: Global Oil & Gas Features Database, NETL Energy Data Exchange (EDX), https://doi.org/10.18141/1427300, 2017.
Sadavarte, P., Pandey, S., Maasakkers, J. D., Lorente, A., Borsdorff, T., van der Gon, H. D., Houweling, S., and Aben, I.: Methane emissions from superemitting coal mines in Australia quantified using TROPOMI satellite observations, Environmental Science & Technology, 55, 16573–16580, https://doi.org/10.1021/acs.est.1c03976, 2021.
Scarpelli, T. R., Jacob, D. J., Maasakkers, J. D., Sulprizio, M. P., Sheng, J.-X., Rose, K., Romeo, L., Worden, J. R., and Janssens-Maenhout, G.: A global gridded (0.1° × 0.1°) inventory of methane emissions from oil, gas, and coal exploitation based on national reports to the United Nations Framework Convention on Climate Change, Earth Syst. Sci. Data, 12, 563–575, https://doi.org/10.5194/essd-12-563-2020, 2020a.
Scarpelli, T. R., Jacob, D. J., Octaviano Villasana, C. A., Ramírez Hernández, I. F., Cárdenas Moreno, P. R., Cortés Alfaro, E. A., García García, M. Á., and Zavala-Araiza, D.: A gridded inventory of anthropogenic methane emissions from Mexico based on Mexico's national inventory of greenhouse gases and compounds, Environ. Res. Lett., 15, 105015, https://doi.org/10.1088/1748-9326/abb42b, 2020b.
Scarpelli, T. R., Jacob, D. J., Grossman, S., Lu, X., Qu, Z., Sulprizio, M. P., Zhang, Y., Reuland, F., Gordon, D., and Worden, J. R.: Updated Global Fuel Exploitation Inventory (GFEI) for methane emissions from the oil, gas, and coal sectors: evaluation with inversions of atmospheric methane observations, Atmos. Chem. Phys., 22, 3235–3249, https://doi.org/10.5194/acp-22-3235-2022, 2022a.
Scarpelli, T. R., Jacob, D. J., Moran, M., Reuland, F., and Gordon, D.: A gridded inventory of Canada's anthropogenic methane emissions, Environ. Res. Lett., 17, 014007, https://doi.org/10.1088/1748-9326/ac40b1, 2022b.
Scarpelli, T. R., Roy, E., and Jacob, D. J.: Global Fuel Exploitation Inventory (GFEI), Harvard Dataverse [data set], https://doi.org/10.7910/DVN/HH4EUM, 2024.
Shen L., Jacob, D. J., Gautam, R., Omara, M., Scarpelli, T. R., Lorente, A., Zavala-Araiza, D., Lu, X., Chen, Z., and Lin, J.: National quantifications of methane emissions from fuel exploitation using high resolution inversions of satellite observations, Nat. Commun. 14, 4948, https://doi.org/10.1038/s41467-023-40671-6, 2023.
Sheng, J., Song, S., Zhang, Y., Prinn, R. G., and Janssens-Maenhout, G.: Bottom-up estimates of coal mine methane emissions in China: A gridded inventory, emission factors, and trends, Environ. Sci. Tech. Lett., 6, 473–478, https://doi.org/10.1021/acs.estlett.9b00294, 2019.
Thorpe, A. K., Green, R. O., Thompson, D. R., Brodrick, P. G., Chapman, J. W., Elder, C. D., Irakulis-Loitxate, I., Cusworth, D. H., Ayasse, A. K., Duren, R. M., Frankenberg, C., Guanter, L., Worden, J. R., Dennison, P. E., Roberts, D. A., Chadwick, K. D., Eastwood, M. L., Fahlen, J. E., and Miller, C. E.: Attribution of individual methane and carbon dioxide emission sources using EMIT observations from space, Science Advances, 9, 46, https://doi.org/10.1126/sciadv.adh2391, 2023.
Tibrewal, K., Ciais, P., Saunois, M. Martinez, A., Lin, X., Thanwerdas, J., Deng, Z. , Chevallier, F. , Giron, C., Albergel, C., Tanaka, K., Patra, P., Tsuruta, A., Zheng, B., Belikov, D., Niwa, Y. , Janardanan, R. , Maksyutov, S., Segers, A., Tzompa-Sosa, Z. A., Bousquet, P., and Sciare, J.: Assessment of methane emissions from oil, gas and coal sectors across inventories and atmospheric inversions, Commun. Earth Environ., 5, 26, https://doi.org/10.1038/s43247-023-01190-w, 2024.
UNEP and CCAC: Global Methane Assessment: Benefits and Costs of Mitigating Methane Emissions, Nairobi, United Nations Environment Programme (UNEP) and Climate and Clean Air Coalition (CCAC), https://www.ccacoaltion.org/resources/global-methane-assessment-full-report (last access: 30 May 2025), 2021.
UNFCCC: Greenhouse Gas Inventory Data Interface, https://di.unfccc.int/detailed_data_by_party, last access: 1 September 2022.
Varon, D. J., McKeever, J., Jervis, D., Maasakkers, J. D., Pandey, S., Houweling, S., Aben, I., Scarpelli, T., and Jacob, D. J.: Satellite discovery of anomalously large methane point sources from oil/gas production, Geophysical Research Letters, 46, 13507–13516, https://doi.org/10.1029/2019GL083798, 2019.
Worden, J. R., Cusworth, D. H., Qu, Z., Yin, Y., Zhang, Y., Bloom, A. A., Ma, S., Byrne, B. K., Scarpelli, T., Maasakkers, J. D., Crisp, D., Duren, R., and Jacob, D. J.: The 2019 methane budget and uncertainties at 1° resolution and each country through Bayesian integration Of GOSAT total column methane data and a priori inventory estimates, Atmos. Chem. Phys., 22, 6811–6841, https://doi.org/10.5194/acp-22-6811-2022, 2022.
Yu, X., Millet, D. B., and Henze, D. K.: How well can inverse analyses of high-resolution satellite data resolve heterogeneous methane fluxes? Observing system simulation experiments with the GEOS-Chem adjoint model (v35), Geosci. Model Dev., 14, 7775–7793, https://doi.org/10.5194/gmd-14-7775-2021, 2021.